
Abstract
Background
Plasma biomarkers have emerged as promising, less invasive indicators of Alzheimer's disease (AD) pathology. However, biomarkers alone cannot indicate whether actual clinical symptoms are present or progressing. Plasma biomarkers when paired with specific cognitive deficits on brief novel Cognitive Challenge Tests (CCTs), provide excellent sensitivities to underlying AD pathology in preclinical and prodromal stage. There is a lack of data on the extent to which plasma biomarkers and CCTs independently and jointly, predict longitudinal functional decline in the earliest stages of cognitive impairment.
Objective
To evaluate whether plasma biomarkers and CCTs independently and in combination predict baseline and longitudinal changes on the Clinical Dementia Rating scale Sum of Boxes (CDR-SOB) among older adults with cognitive impairment without dementia.
Methods
Older adults aged 54 to 98 years diagnosed with cognitive impairment without dementia (n = 159) at baseline were followed annually for a minimum of 3 visits, mean follow-up was 41.5 months (SD 11.9). CDR-SOB trajectory was estimated using latent growth curve modeling. The associations between plasma biomarkers (p-tau217, GFAP, and NfL) and CCTs with baseline levels and longitudinal change in CDR-SOB were evaluated.
Results
After adjusting for age, sex, education, Hispanic ethnicity, APOE ɛ4, and amyloid positivity, p-tau217 (β=0.70, SE = 0.23, p < 0.01), and NfL (β=0.03, SE = 0.008, p < 0.001) predicted baseline and longitudinal changes in CDR-SOB, respectively. Deficits in CCTs (β=-0.11, SE = 0.03, p < 0.001) contributed independently to predicting the rate of change on CDR-SOB.
Conclusions
Integrating plasma biomarkers with sensitive CCTs enhances diagnostic accuracy, monitoring, and prognosis during pre-dementia stages.
Keywords
Introduction
Cognitive challenge tests (CCTs) are measures designed to elicit subtle cognitive impairments observed in the earliest stages of Alzheimer's disease (AD). 1 An effective CCT has been the Loewenstein-Acevedo Scales for Semantic Interference and Learning (LASSI-L) which uniquely measure deficits in the failure to recover from proactive semantic interference (frPSI) and associated intrusion errors made on semantically competing word lists. These deficits have been early markers of mild cognitive impairment (MCI) in biologically-confirmed Alzheimer's disease (AD) patients.1–3 Further, these measures have demonstrated superior predictive capabilities in these populations compared to traditional list-learning tests, such as the Free and Cued Selective Reminding Test (FCSRT) 4 or the Hopkins Verbal Learning Test, Revised (HVLT-R). 5 ,6 Recent findings have further underscored the importance of semantic intrusion errors on CCTs for detecting biologically confirmed AD in those with early cognitive impairment. These semantic intrusion errors distinguish amyloid positron emission tomography (PET) positive MCI patients from amyloid-negative individuals, suggesting that they represent an early cognitive marker specific to AD. 7 Such deficits have further been associated with structural brain atrophy on MRI, 8 reduced cerebral metabolism on fluorodeoxyglucose (FDG) PET imaging, 4 ,9 increased amyloid burden on PET and blood-based biomarkers of AD and neurodegeneration.10–12 frPSI manifests in two distinct ways: 1) the inability to learn new semantically competing targets despite repeated learning opportunities; and 2) the failure to inhibit semantic interference after repeated learning trials, which result in semantic intrusion errors.. 1 ,13 Importantly, CCT deficits on the LASSI-L have been shown to predict progression from MCI to dementia, while the absence of PSI deficits has been associated with a greater likelihood of reversion to normal cognition. 14
Plasma biomarkers have emerged as promising, less invasive indicators to detect AD pathology. Plasma phosphorylated tau 217 (p-tau217) has demonstrated exceptionally high diagnostic accuracy (88%-92%) for identifying AD pathology in both primary and secondary care settings. 15 ,16 These blood tests are less invasive, more accessible, and significantly more cost-effective than cerebrospinal fluid (CSF) analysis or PET imaging. Recently, new clinical practice guidelines issued at the Alzheimer's Association International Conference support the integration of FDA-cleared blood-based biomarker tests into the diagnostic evaluation of symptomatic individuals in specialty care settings. It is expected that plasma biomarkers will have an increasingly important role in enhancing diagnostic accuracy and guiding care; however, AD pathology may accumulate years before clinical symptoms emerge, and a significant proportion of older adults with AD pathology will not develop cognitive symptoms in their lifetimes. 17 ,18 Thus, relying on biomarker abnormalities alone, without concurrent assessment of cognitive or functional decline, cannot indicate whether actual clinical symptoms are present or progressing.
The Clinical Dementia Rating Scale, sum of boxes (CDR-SOB) is widely recognized as a clinically meaningful outcome in longitudinal AD research, given its strong associations with functional status and clinical progression. 19 ,20 Increasingly, the CDR-SOB has been employed as a primary end point in AD clinical trials.21–23 and as a tool for modeling trajectories of cognitive and functional decline. 19 ,24,25 Zheng and colleagues recently utilized growth curve modeling and demonstrated frPSI predicted slope of CDR-SOB trajectory over 3.7 years in individuals with amnestic MCI, independent of demographics, performance on a widely used memory test, and amyloid PET positivity, underscoring the prognostic value of CCTs. 24
Few studies have examined how plasma biomarkers and CCTs together predict longitudinal functional trajectories and clinical progression in the earliest stages of cognitive decline. Integrating these measures may improve the prediction of functional outcomes and provide clinically meaningful prognoses. Our study aimed to evaluate whether plasma biomarkers and CCTs independently and jointly predict baseline and longitudinal changes in CDR-SOB among individuals with early cognitive impairment.
Methods
Study population
A total of 159 participants from the 1Florida Alzheimer's Disease Research Center (ADRC) provided informed consent to participate in this Institutional Review Board–approved study. Most participants were referred from a specialized memory disorders clinic. Participants underwent comprehensive clinical and neuropsychological evaluations using the standardized National Alzheimer's Coordinating Center (NACC) Uniform Data Set (UDS) assessments 26 as well as CCT. 27 The CCT was not used in the clinical determination of cognitive status to prevent circularity. Trained clinicians interviewed participants and reliable informants using the Clinical Dementia Rating (CDR) to obtain both the Global score 28 and Sum of Boxes. 29 Neuropsychological testing was administered in either English or Spanish by experienced psychometricians, with age, education, and culture/language normative data applied across all measures. Final cognitive diagnoses were established through a consensus process involving a multidisciplinary team of memory disorders specialists.
Participants were required to have a baseline diagnosis evidencing cognitive impairment without dementia, and a minimum of three visits to be included in this longitudinal study. Participants were scheduled for annual follow-ups, but actual return times varied. Visits that occurred within six months of the expected date were considered on schedule. The ADRC annual visits are ongoing. At the time this study was initiated, the dataset was frozen for analysis. At that time, 159 cognitively impaired participants without dementia had completed three study visits, and 101 had completed four visits. There is no statistical difference in age, sex, education, Mini-Mental State Examination (MMSE) and CDR-SOB score between those who finished 3 vs. 4 visits. The average follow-up time was 15.3 months (SD 5.5) from baseline for visit two (n = 159), 30.3 months (SD 8.8) for visit three (n = 159), and 45.5 months (SD 9.8) for visit four (n = 101). Data from the first three or four consecutive annual visits were utilized for this longitudinal analysis. The mean follow-up time from baseline to last the follow-up visit (3rd or 4th visit) was 41.5 months (SD 11.9).
Criteria for cognitive impairment without dementia (n = 159)
Participants were diagnosed with cognitive impairment without dementia using the following criteria: The consensus diagnostic team determined that participants fulfilled Petersen's criteria 30 for MCI that requires subjective cognitive complaints reported by the participant and/or collateral informant; impaired memory and/or other cognitive domain that was 1.5 SD or greater, below the mean, accounting for age, education, and language of testing. Among those with MCI, only 10 out of 109 individuals (9%) had non-amnestic deficits. Neuropsychological tests included both memory [e.g., delayed recall for either the Hopkins Verbal Learning Test, Revised (HVLT-R) 31 or delayed paragraph recall from the NACC UDS)] 32 and non-memory measures [e.g., Category Fluency, 33 Trails A and B, 34 WAIS-IV Block Design subtest]. 35 In addition, a Global CDR of 0.5 was required with no evidence of dementia or Major Neurocognitive Disorder. 36
Alternatively, individuals that did not meet diagnostic thresholds for MCI could have been classified as having early cognitive impairment without dementia 37 if they exhibited a CDR Global score of 0 but evidenced at least one neuropsychological test of memory that was 1.5 SD or greater relative to age and education-related normative data. Individuals with observed clinical deficits identified by an experienced clinician and a CDR Global of 0.5 despite neuropsychological tests not reaching 1.5 SD below expected levels were also classified as early cognitive impairment without dementia. Among those who did not meet established thresholds for an MCI diagnosis, 9 out of 50 (18%) individuals had non-amnestic deficits.
Clinical dementia rating scale–sum of boxes
The CDR-SOB 29 served as the primary outcome measure for tracking cognitive and functional decline in this study. The CDR-SOB provides a global evaluation of cognitive status and incorporates both participant and informant perspectives across six cognitive and functional domains: memory, orientation, judgment/problem solving, community affairs, home and hobbies, and personal care. Ratings were assigned by trained clinicians. Each domain was scored from 0 to 3 (0 = no impairment, 0.5 = questionable, 1 = mild, 2 = moderate, and 3 = severe). Scores from the six domains were summed to generate the CDR-SOB, yielding a total score ranging from 0 to 18, with higher values reflecting greater overall impairment. All CDR raters were blind to neuropsychological test results including CCT performance, amyloid PET status, as well as biomarker results.
Amyloid-β PET imaging and visual ratings of scans
Amyloid β PET imaging was conducted using either Florbetaben or Florbetapir tracers. Scan interpretation was based on visual rating following procedures comparable to those described by Seibyl et al., 38 and was performed by an experienced reader who was blinded to participants’ cognitive and clinical diagnoses. Tracer uptake was evaluated across six cortical regions—orbitofrontal, frontal, parietal, lateral temporal, occipital, and precuneus/posterior cingulate cortex, with ratings incorporating information from both hemispheres. Based on these assessments, scans were classified dichotomously as amyloid-positive (A+) or amyloid-negative (A-). Prior work by Loewenstein and colleagues 7 demonstrated high interrater reliability (98%) for amyloid PET visual ratings between independent evaluators. Scans were generally obtained within several months of the clinical and neuropsychological evaluation.
Plasma biomarkers of AD and neurodegeneration
Blood samples were obtained during baseline visits following standardized 1Florida ADRC protocols compliant with larger consortia (NACC, National Centralized Repository for Alzheimer's Disease and Related Dementias). Blood was centrifuged and aliquots of 500 microliters of plasma were frozen and stored at −80°C. Prior to analysis, the samples were thawed (1 freeze-thaw cycle) at room temperature, vortexed for 30 s, and placed on ice until centrifuging at 10,000 g for 5 min at 4°C. Plasma was measured for p-tau217, glial fibrillary acidic protein (GFAP), and neurofilament light chain (NfL) using the Single molecule array (SIMOA) technology (ALZpath; Quanterix, Billerica, MA). Duplicate samples were analyzed. As a standard practice, only results with coefficients of variation below 20% were included in analysis. 10 ,11
Cognitive challenge tests
The Loewenstein-Acevedo Scales for Semantic Interference and Learning (LASSI-L) is a CCT which employs controlled learning and cued recall in an effort to maximize the storage of a list of to-be-remembered target words belonging to three semantic categories (fruits, clothing and musical instruments). 39 The LASSI-L has been previously validated in English and Spanish. 2 ,40 Participants were asked to remember a list of 15 common words representing three semantically distinct categories. A unique feature of the LASSI-L paradigm is the presentation of a second competing list of to-be-remembered words that were presented in the same manner as the first list. This competing list contains different but semantically related items and is designed to induce proactive semantic interference (PSI). Uniquely, the re-administration and subsequent recall of this second list of words measures the ability to recover from the effects of PSI (frPSI).
For the current study, we focused on subscales of the LASSI-L that measure frPSI (Cued B2), and intrusion errors that occur during Cued B2 recall as these have been shown to be the best predictors of progression to specific clinical endpoints and trajectories of decline. 24 ,41
Statistical analysis
A latent growth curve modeling approach 42 was employed, with CDR-SOB scores at each study visit as the outcome and follow-up time as the independent variable. Key components of the growth trajectory (e.g., intercept and slope) were modeled as latent constructs, with repeated CDR-SOB measurements serving as observed indicators of the underlying latent growth process (Figure 1). To account for variability in the timing of annual follow-up visits across participants, models incorporated individually varying times. Both linear and quadratic growth models were evaluated to determine the trajectory form that best characterized cognitive and functional change among participants with cognitive impairment. Model selection was guided by standard model fit indices and considerations of model parsimony.
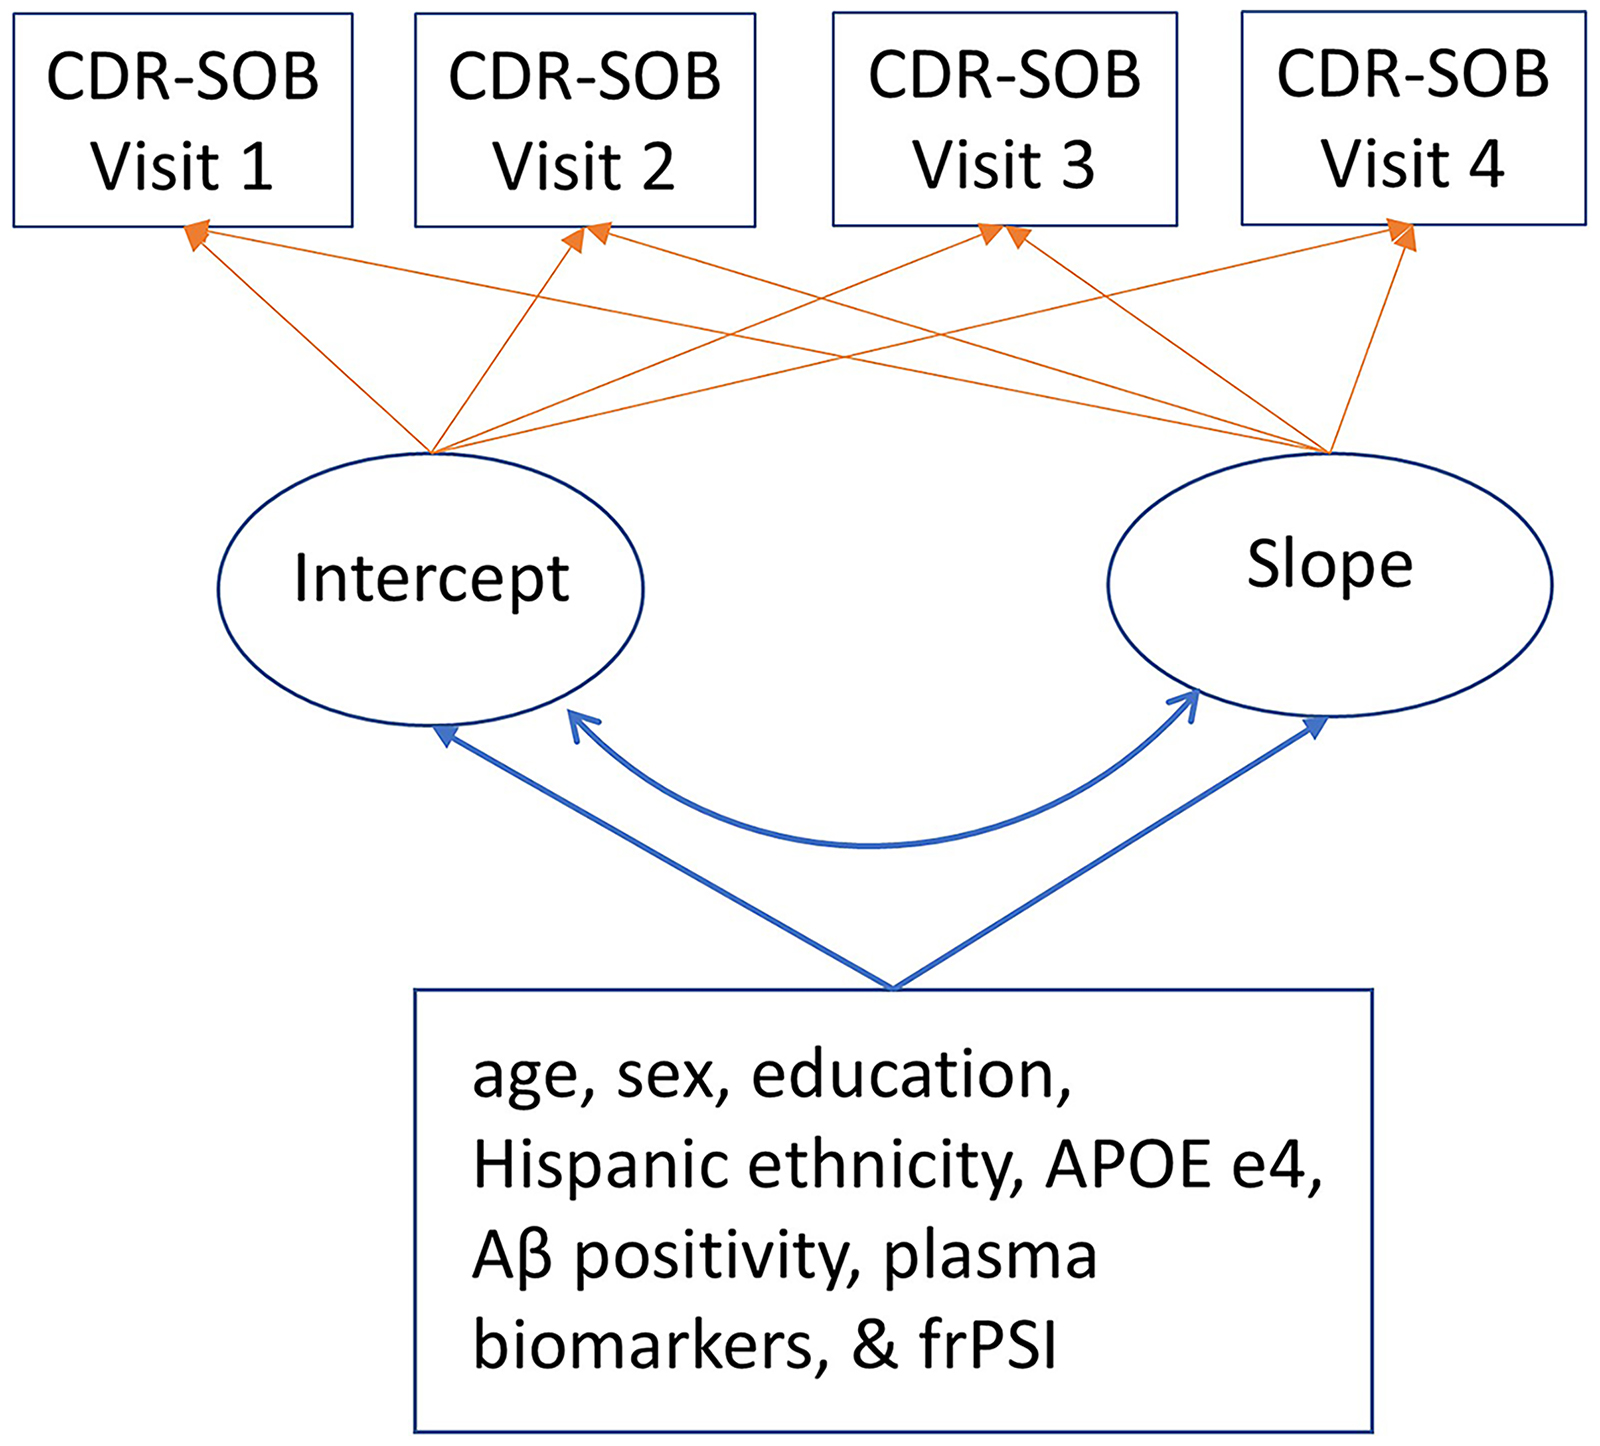
Path diagram of estimated latent growth curve models. Latent growth curve characteristics (i.e., intercept and slope) were estimated as latent variables with CDR-SOB at each visit as the manifest of the underlying growth process. Covariates were predictors of the intercept and slope latent variables.
The latent growth curve model allows for individual variation in trajectories through random effects. 42 The growth curve models estimated: (1) the mean baseline level (intercept); (2) the average rate of change from baseline to the final assessment (slope); (3) individual variability in baseline status (random intercept); and (4) individual variability in rates of change over time (random slope). As is standard practice, the intercept and slope parameters were allowed to correlate in the models.
Associations between plasma biomarkers and CDR-SOB trajectories were assessed with subsequent conditional growth curve models. Models were built in a stepwise manner: Model 1 included each plasma biomarker (p-tau217, GFAP, and NfL) individually. Model 2 added demographic covariates (age, sex, Hispanic ethnicity, and education) and APOE ɛ4. Testing language (Spanish versus English) was not modeled as a separate covariate, as it was highly collinear with Hispanic ethnicity. Model 3 added amyloid PET positivity (available for 91% of participants) to account for underlying AD pathology. Given the intercorrelations among three biomarkers, we considered it important to examine their performance both individually and jointly.
Finally, to assess whether CCT provides incremental predictive value for the trajectory of CDR-SOB beyond plasma AD biomarkers, we compared models with plasma biomarkers alone (model A) to models adding CCT measures of cued B2 intrusion errors (model B1) and cued B2 recall (model B2), respectively. Residual variances 43 for intercept and slope which refer to the unexplained variability in the intercept and slope of CDR-SOB trajectory after accounting for predictors were examined, with smaller values indicating greater explained variance.
All participants with cognitive impairment were included in the analyses with missing data handled using Maximum Likelihood Robust estimation. 44 Analyses were conducted with SAS 9.4 and Mplus 8.8.
Results
This investigation included 159 participants diagnosed with cognitive impairment without dementia at baseline and had at least three annual ADRC evaluations. Mean age at baseline was 72.4 years (range 54–98) and 38% were male (n = 61). Average years of education were 15.6 years (range 4–22). Most participants self-identified as White (96%) and from a Hispanic/Latino background (57%). The average MMSE score was 28.1 (range 20–30). Amyloid PET scan was available for 145 participants (91%), 35% were A + and 65% A- (Table 1).
Baseline demographic characteristics of the study participants.
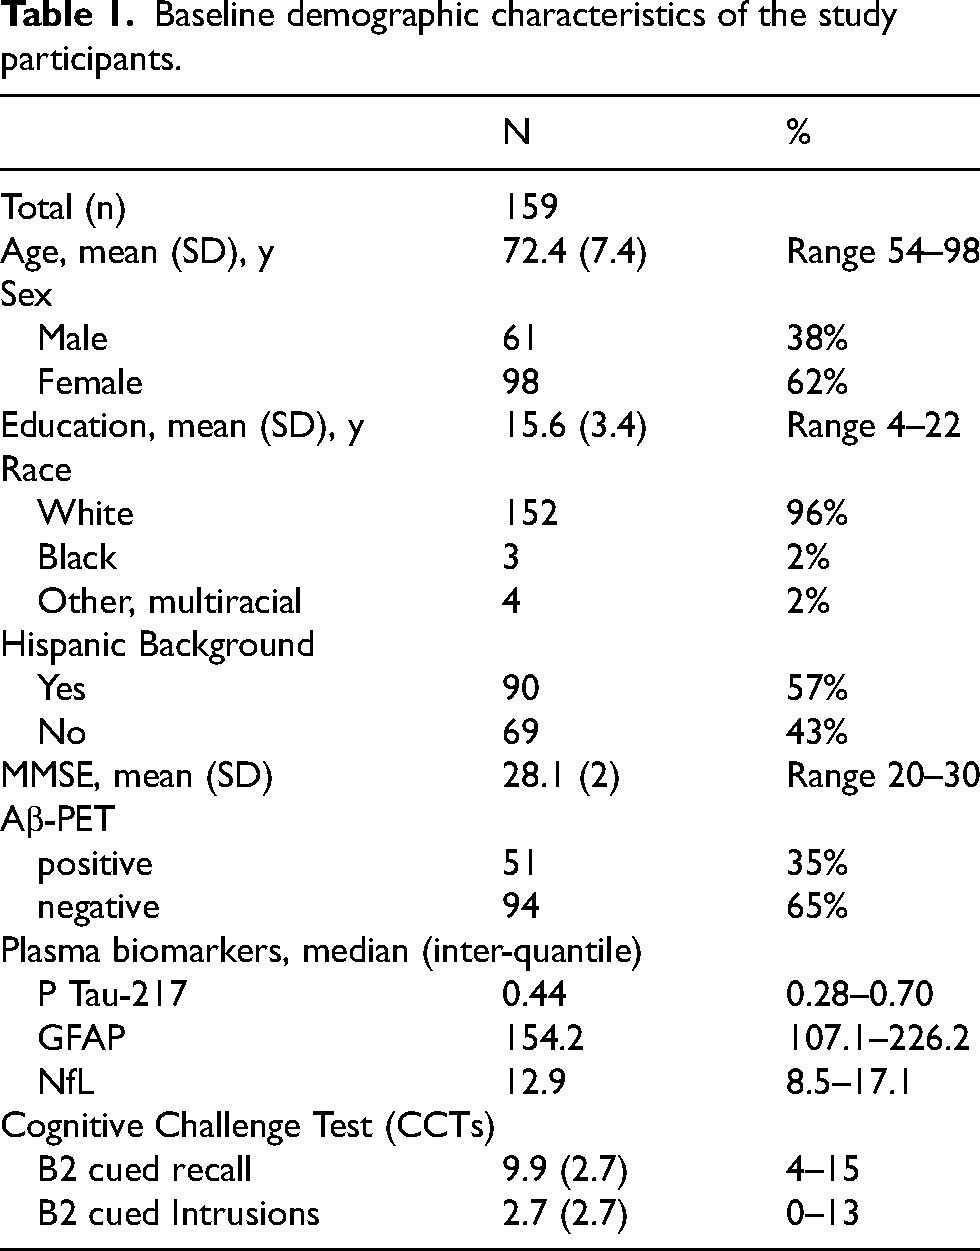
Levels of p-tau217, NfL, and GFAP were right-skewed and are presented as median (interquartile range IQR) in Table 1. The median p-tau217 concentration was 0.44 pg/mL (IQR: 0.28–0.70), median NfL was 12.9 pg/mL (IQR: 8.5 −17.1), and median GFAP was 154.2 pg/mL (IQR: 107.1– 226.2). The levels of plasma GFAP, NfL, and p-tau217 were significantly intercorrelated with strong correlation observed between GFAP and p-tau217 (r = 0.44, p < 0.01), GFAP and NfL (r = 0.36, p < 0.01) and NfL and p-tau 217 (r = 0.54, p < 0.001).
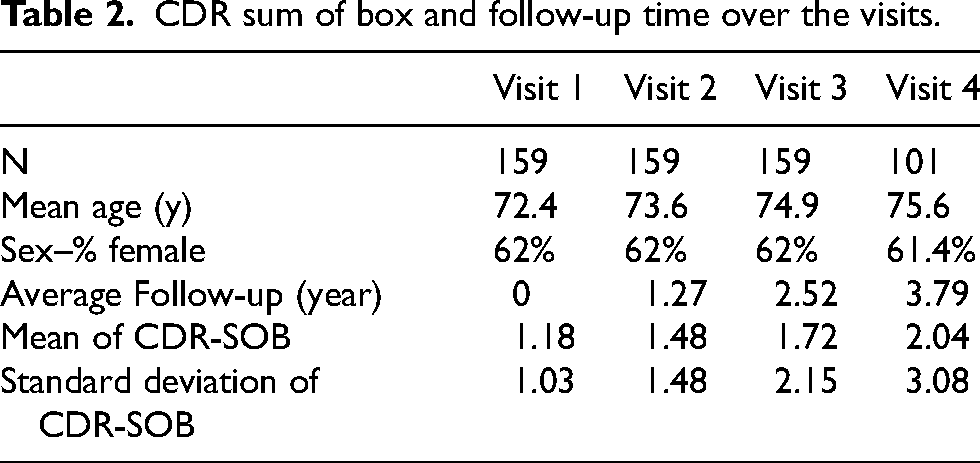
The diagnostic status of participants at annual visit fluctuated over time. During follow-up, 27 participants progressed to dementia, of whom 2 subsequently reverted to MCI. Additionally, 39 participants reverted to cognitively normal status at least once, with 6 later transitioning back to MCI. Overall, the mean CDR-SOB scores, together with the standard deviations, increased progressively across visits, rising from 1.18 (SD 1.03) at the baseline to 1.48 (SD 1.48) at visit two, 1.72 (SD 2.15) at visit three, and 2.04 (SD 3.08) at visit four. These patterns were indicative of a gradual decline in cognition and day to day functioning, along with increased variability overtime (Table 2).
CDR sum of box and follow-up time over the visits.
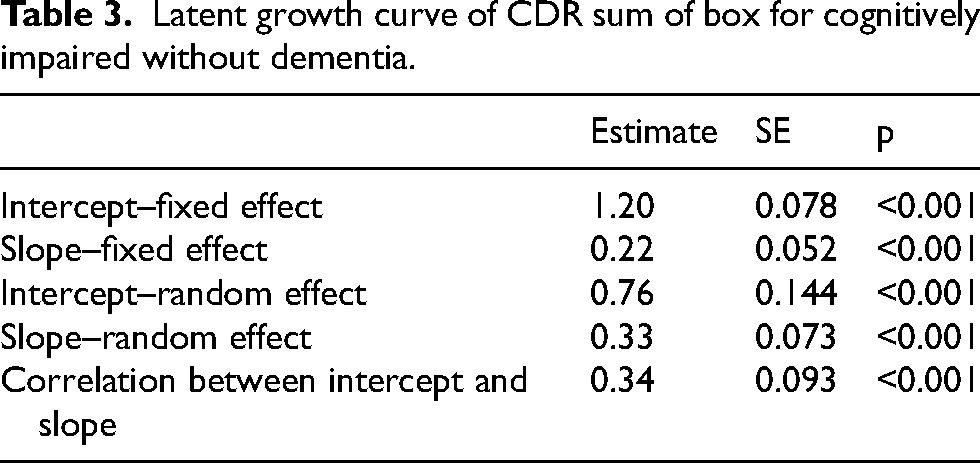
We estimated both the linear and quadratic (non-linear) growth curve models for CDR-SOB. The quadratic term of time was not statistically significant (β=-0.011, se = 0.024, p = 0.6) and was therefore not retained, consistent with the principals of parsimony. Therefore, the growth curve model that best described CDR-SOB trajectory in this study sample was linear and included both the fixed and random effect of intercept and slope of time. The estimated intercept was 1.2 (fixed effect, se 0.078, p < 0.001). The average annual increase in CDR-SOB was 0.22 (slope fixed effect, se 0.052, p < 0.001). The random effects for both the intercept (0.76, se 0.144, p < 0.001) and slope (0.33, se 0.073, p < 0.001) were statistically significant, indicating substantial individual differences in starting levels and rates of cognitive and functional decline in this cohort. The intercept and slope were positively correlated demonstrating worse baseline CDR-SOB value was associated with more rapid cognitive and functional decline over time. (r = 0.34, se = 0.093, p = 0.001) (Table 3).
Latent growth curve of CDR sum of box for cognitively impaired without dementia.
The subsequent conditional growth curve models examining the influence of individual plasma biomarker showed p-tau217, GFAP, and NfL were each individually associated with both the starting value and the rate of worsening in CDR-SOB (all p values < 0.01; Model 1, Table 4). After adjusting for demographic variables such as age, sex, Hispanic ethnicity, education and APOE ɛ4, p-tau217 remained associated with the intercept and slope for CDR-SOB (both p values < 0.01, model 2), while GFAP and NfL were associated with the slope of CDR-SOB only. After adding amyloid PET positivity to the extensive list of covariates, p-tau217 remained associated with the intercept, while NfL predicted the slope of CDR-SOB (model 3, Table 4). P-tau217 consistently predicted baseline CDR-SOB in both the individual biomarker models and the simultaneous three-biomarker model (β=0.72, se = 0.235, p < 0.01), while NfL consistently predicted change in CDR-SOB across both models as well (β=0.22, se = 0.009, p < 0.01) (Model A, Table 5).
Individual plasma biomarkers predict the intercept and slope of CDR sum of box trajectory.
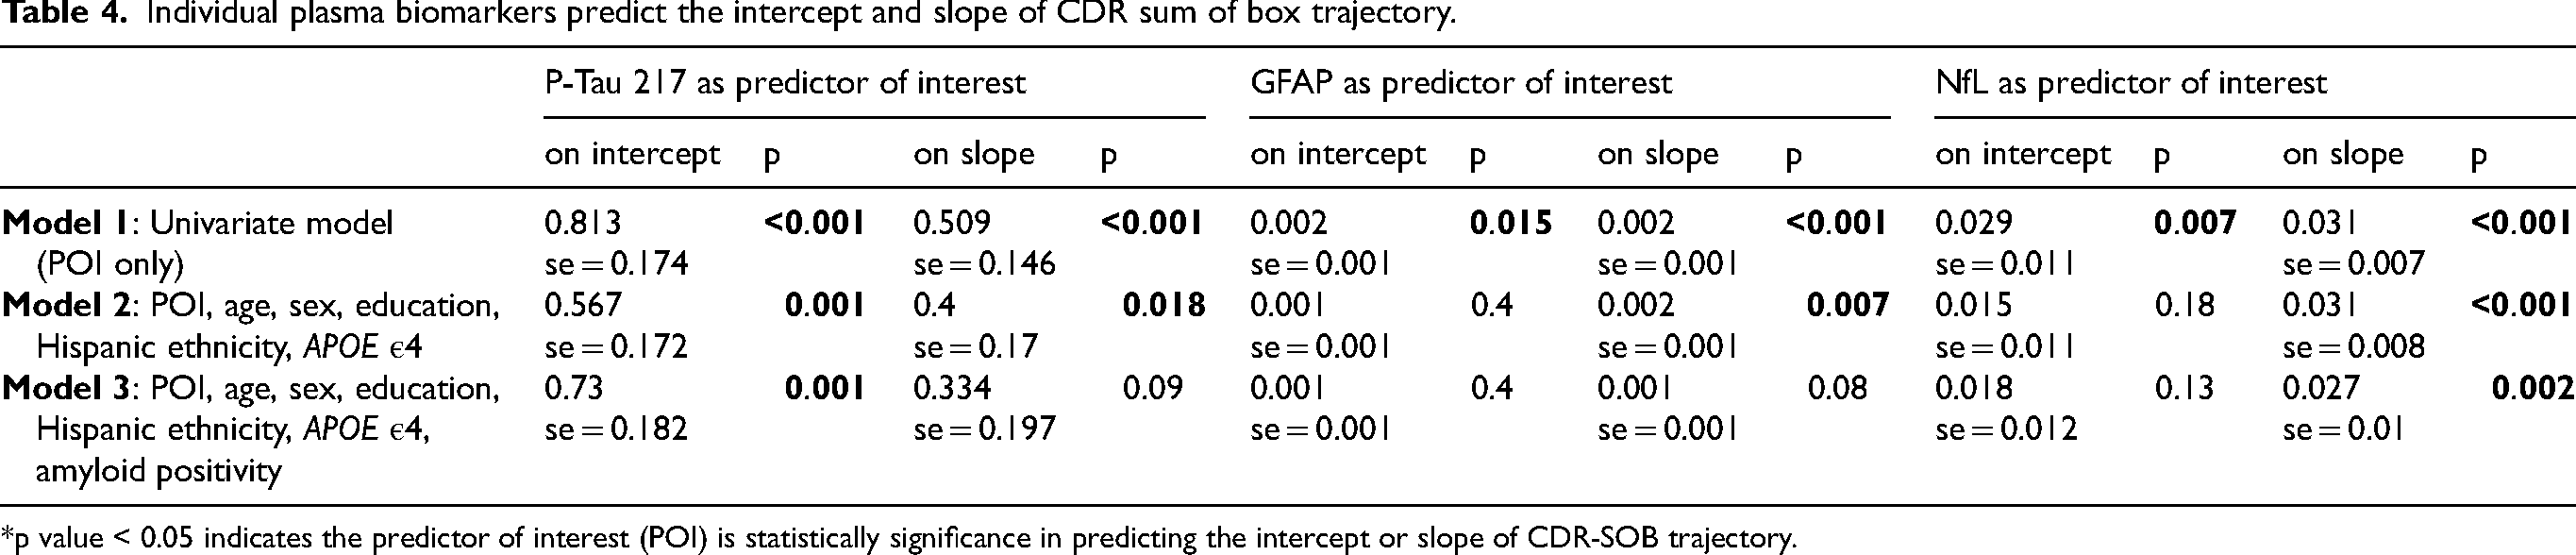
*p value < 0.05 indicates the predictor of interest (POI) is statistically significance in predicting the intercept or slope of CDR-SOB trajectory.
Plasma biomarkers and CCT measure predict intercept and slope of CDR-SOB trajectory.
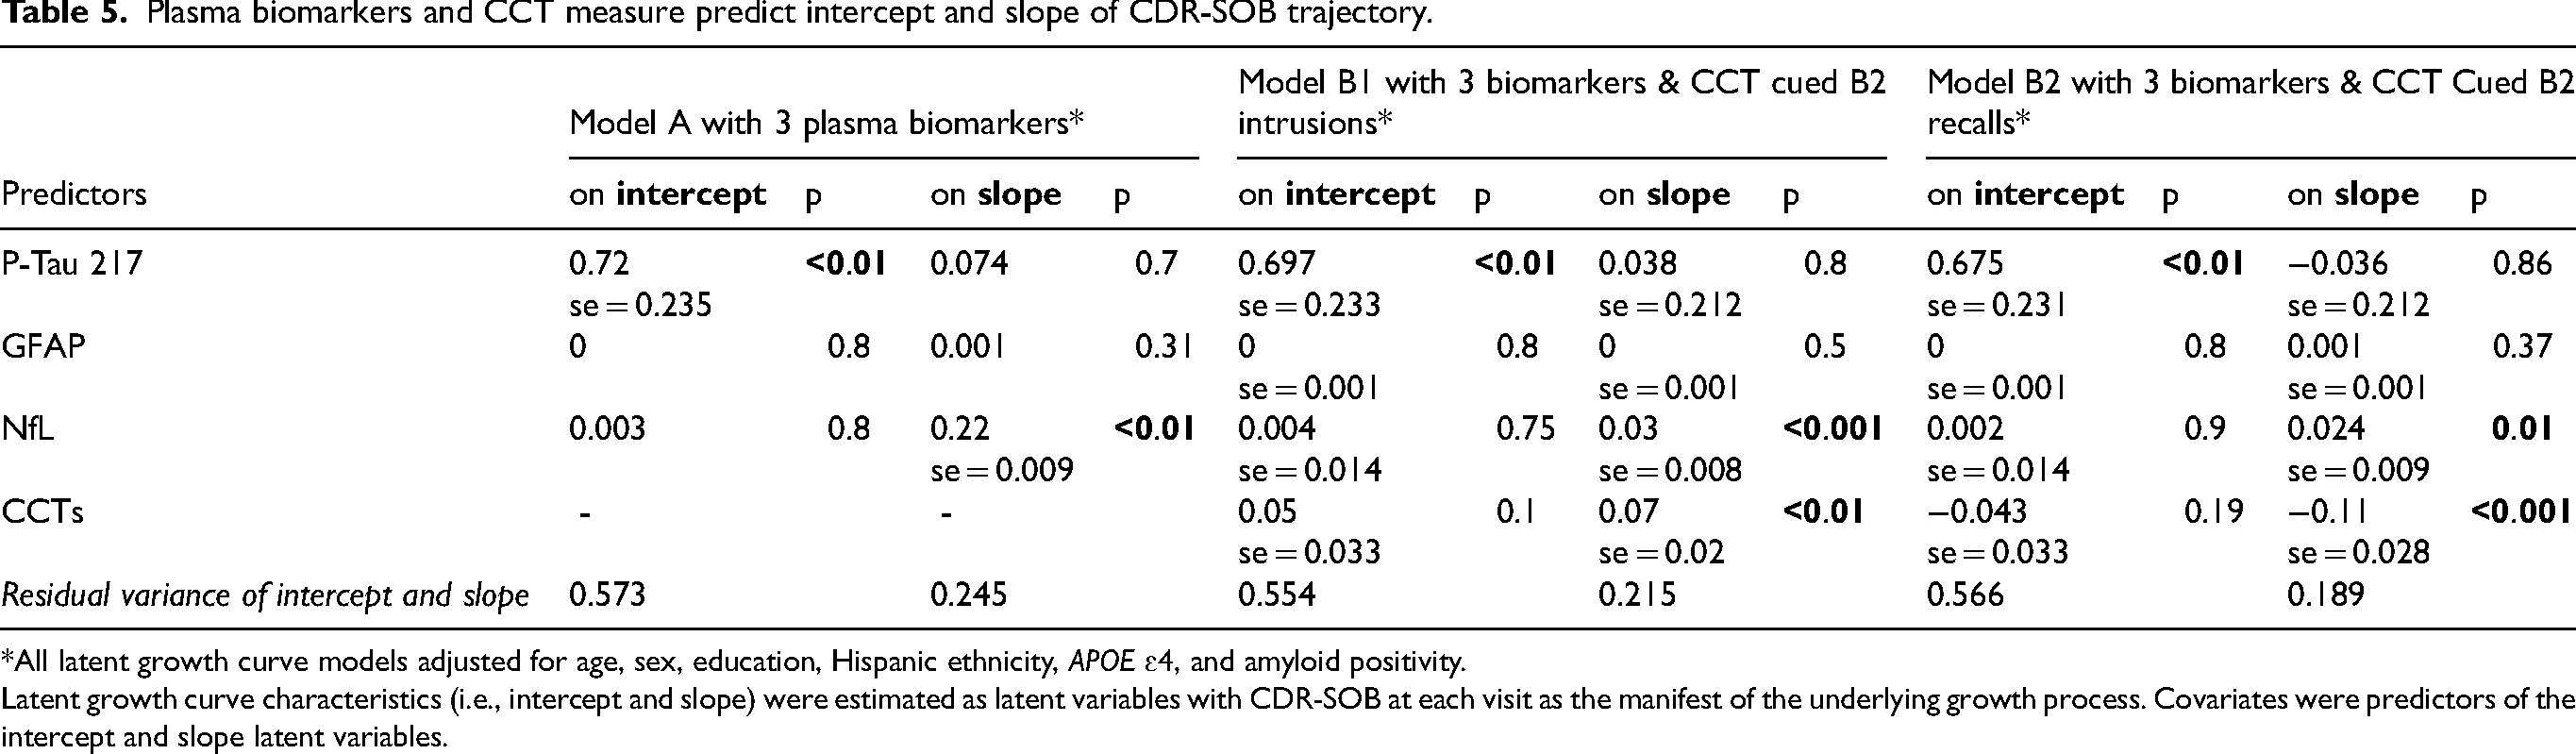
*All latent growth curve models adjusted for age, sex, education, Hispanic ethnicity, APOE ɛ4, and amyloid positivity.
Latent growth curve characteristics (i.e., intercept and slope) were estimated as latent variables with CDR-SOB at each visit as the manifest of the underlying growth process. Covariates were predictors of the intercept and slope latent variables.
In the final comprehensive models including all three plasma biomarkers and CCT measures to evaluate their combined effects, p-tau217 remained associated with baseline CDR-SOB (β=0.70, se = 0.23, p < 0.01), while NfL was associated with the rate of change in CDR-SOB (β=0.03, se = 0.008, p < 0.001). CCT measure of cued B2 intrusion errors (β=0.07, se = 0.02, p < 0.01; model B1) and cued B2 recall performance (β= −0.11, se = 0.028, p < 0.001; model B2) independently predicted the slope of CDR-SOB trajectory after controlled for an extensive set of covariates. (Table 5). The correlation between Cued B2 recall and intrusion errors was −0.45. (p < 0.001). Each model was performed three times for each biomarker, we applied a Bonferroni correction for three comparisons by dividing the α-values by 3, all p-values remain below the adjusted threshold (0.05/3 = 0.017).
To evaluate the added contributions of CCT measures to CDR-SOB trajectory, we compared the residual variance of slope, which reflects the interindividual variability not explained by the predictors. The residual slope variance decreased from 0.245 in the biomarkers only model (model A) to 0.215 with the addition of CCT cued B2 semantic intrusion errors (model B1) and 0.189 with Cued B2 Recall (model B2). These reductions indicate that CCT measures explained an additional 12.2% and 22.8% (= (0.245−0.189)/0.245) of the variance in the rate of functional decline, respectively, relative to the biomarkers alone model. These findings highlight the independent contribution of CCT in predicting functional decline beyond plasma biomarkers and other covariates (Table 5).
Discussion
This investigation provides a timely evaluation of the combined use of plasma biomarkers and sensitive cognitive measures to predict functional and cognitive decline in older adults with cognitive impairment without dementia. Our findings demonstrate that plasma biomarkers including p-tau217, NfL, and GFAP robustly predict both baseline and longitudinal changes in CDR-SOB. Importantly, CCT measures capturing distinct aspects of failure to recover from proactive semantic interference (frPSI) contributed independently to predicting the rate of change in CDR-SOB. The enhanced predictive performance of combining blood-based biomarkers with CCT is reflected in the reduced residual variance of the CDR-SOB trajectory slope. Beyond maintaining statistical significance, the inclusion of CCT measures explained an additional 22.8% of the variance in the rate of functional decline. Collectively, these findings demonstrated that integrating plasma biomarkers with sensitive cognitive challenge measures further enhances diagnostic accuracy, monitoring of disease progression, and prognostic assessment during the pre-dementia stage.
For p-tau217, the estimated coefficient for baseline CDR-SOB was 0.70 per 1 pg/mL increase; across the interquartile range (0.28–0.70 pg/mL), this corresponds to a 0.29-point difference in baseline CDR-SOB. For NfL, the estimated coefficient for rate of change was 0.03 per 1 pg/mL increase; across the interquartile range (8.5–17.1 pg/mL), this corresponds to a 0.26-point difference per year (0.78 over three years). Larger differences in NfL (e.g., 4 pg/mL) may correspond to approximately 1.04-point changes in CDR-SOB per year, approaching clinically meaningful change. 20
This study represents an advancement over earlier longitudinal work through incorporating sensitive plasma biomarkers of AD and neurodegeneration, including older adults with early cognitive impairment, and its focus on a sensitive neuropsychological measure such as CCTs. 24 ,25 Prior findings already demonstrated that CCTs outperform traditional neuropsychological tests in predicting CDR-SOB progression, even after adjusting for demographics and amyloid PET positivity. 24 The inclusion of plasma-based biomarkers is now particularly critical, as these measures have increasingly been shown to be strong predictors of AD pathology (e.g., p-tau217) 15 ,45 as well as neurodegeneration (GFAP, NfL). 46 ,47
This analysis included all individuals with evidence of clinical or cognitive impairment who did not meet clinical consensus criteria for dementia, aligning with ongoing efforts to characterize clinical manifestations in persons with underlying brain pathology who exhibit only minimal symptoms. Such an approach advances the field by enabling the study of earlier disease stages and accompanying cognitive changes with greater precision in a manner that is non-invasive and scalable to detect and monitor underlying pathology of AD and related disorders.
One key finding in this investigation was that elevated p-tau217 was consistently and strongly associated with the baseline CDR-SOB, both when examined as an individual biomarker and when considered simultaneously with the other two biomarkers. Elevated p-tau217 also predicted the rate of progression in functional decline prior to adjustment for amyloid positivity. This finding aligns with prior literature showing a strong correlation between p-tau217 and amyloid PET positivity. 45 In settings where amyloid PET is available, this neuroimaging technique may be sufficient for predictive purpose. However, in general clinical settings where amyloid PET is often not available, p-tau217 may have prognostic value for both baseline function and disease progression. In contrast, NfL independently predicted functional decline in individual biomarker models and the simultaneous model even after extensive covariate adjustment, consistent with meta-analytic evidence and supporting its prognostic value across multiple longitudinal cohorts. 48 ,49 NfL may represent a more robust marker of longitudinal decline. Notably, NfL, a marker of axonal injury and neurodegeneration, is not specific to AD, as elevated levels are also frequently observed in other neurodegenerative conditions including vascular and frontotemporal diseases. 49 ,50 GFAP, an indicator of glial activation and neuroinflammatory response, was a significant predictor in the individual models, however, it was no longer associated with the CDR-SOB trajectory in the comprehensive model including all biomarkers. This attenuation likely reflects shared variance between GFAP, p-tau217 and NfL, given their intercorrelations as reported in the Result section and literature. 51 GFAP may capture variance already accounted for by these biomarkers at this clinical stage. Alternatively, its prognostic contribution may be stage-dependent and more relevant in preclinical populations. 52
In the comprehensive model that adjusted for demographic factors, APOE ɛ4, biomarkers of AD and neurodegeneration, and amyloid PET positivity, the rate of decline on CDR-SOB was most robustly associated to frPSI (one type of CCT deficit) and NfL. An identical pattern of results was observed for intrusion errors made during the trial that taps frPSI (another type of CCT deficit). These findings demonstrated that breakdowns in different aspects of frPSI, whether a result of inability to learn competing semantically similar targets or an inability to inhibit previously learned semantically related material that results in semantic intrusion errors, both reflect mechanisms with independent impact on declining cognition and day-to-day functioning. Reduced recall on the frPSI likely reflects degradation of semantic networks, resulting in an impaired ability to overcome proactive semantic interference effects. Semantic intrusion errors are thought to arise from deficits in executive control, manifesting as difficulty inhibiting non-target responses. 1 ,4,53 In additional analysis, we entered both cued B2 recall and cued B2 intrusion errors simultaneously into the conditional growth curve model. When considered jointly, only cued B2 recall significantly predicted the rate of decline in CDR-SOB. This finding suggests that these two measures may capture overlapping constructs, as is commonly observed in neuropsychological memory assessments. Residual slope variance analyses showed frPSI explained a greater degree of additional variance in the slope of CDR-SOB trajectory beyond plasma biomarkers alone. Regarding mechanistic specificity, prior literature suggests that failure to recover from proactive semantic interference and semantic intrusion errors may reflect distinct underlying cognitive breakdowns. 41 ,53 Moreover, it is well established that direct measures of cognitive performance at baseline are strong predictors of subsequent functional decline. However, despite this significant incremental contribution of CCTs, substantial individual variability in rates of decline remains unexplained. The finding that CCT measures were related to cognitive and functional decline is supported by previous studies using Cox hazards modeling and other longitudinal techniques. 14 ,24,41 The current study is unique in that we employed a panel of powerful plasma biomarkers of AD and neurodegeneration, in a sample of older adults with cognitive impairment without dementia. frPSI is not merely due to a learning deficit but reflects a persistent inability to learn semantically laden material that competes with previously learned information, despite multiple attempts. 1 ,4,53 Our current results add to an ever-expanding body of literature in national and international studies that CCT distinguishes cognitive impairment without dementia from other diagnostic groups. 6 ,54
A strength of the current study is the use of the CDR-SOB, a widely recognized clinically meaningful outcome measure in longitudinal AD studies. 20 ,22,23 Another strength was modeling cognitive and functional decline using latent growth curve modeling, which accounts for individual variation in the trajectory of change, and allows for flexible follow-up time. 42 The residual variance analysis of the growth curve parameters also enables quantification of variance explained. This is important in studying complex diseases such as AD and related disorders because disease progression can be influenced by numerous factors.
One limitation is that our study sample was disproportionately White and 57% Hispanic with a relatively high educational level which may restrict the generalizability of our findings since biomarker performance may differ across race groups. To address this, we are actively expanding the cohort to include a more diverse population (i.e., Black/African Americans) which will enable more robust assessment across understudied groups. Although follow-up rates were high, those who were lost to follow-up, may have different characteristics. Additionally, growth curve analyses require at least three and preferably more time points. Participants who only completed less than two follow up evaluations may have different characteristics. Nevertheless, previous sub-analyses conducted using the 1Florida ADRC cohort of persons with MCI showed that there was no difference in age, sex, education and baseline CDR-SOB between those who had two follow-up visits versus the overall MCI population. 24 Further, cognitively impaired participants who agree to be followed in an ADRC for multiple visits might be a selective sample and not necessarily resemble the general older adult population. Both CCT and to some degree, the CDR-SOB rely on cognitive performance. However, CCT is distinct from CDR-SOB, and it was not used in determining CDR-SOB scores or diagnostic status. The reliability of informant reports may often vary depending on the informant's relationship with the patient, which represents a general limitation of the CDR-SOB. Nonetheless, the CDR-SOB is widely used in the field as an outcome measure for clinical trials and observational studies. In contrast, CCT does not rely on informant input, and its scores are not subject to this limitation. Additionally, our sample comprises a broad range of severity within the cognitive impairment without dementia classification, and this heterogeneity may influence trajectory estimates. Moreover, as 65% of our sample is amyloid-negative, it is difficult to determine whether the predictive model primarily reflects underlying AD pathology or generalizes across etiologies. Of note, our covariate list may not be comprehensive, and other factors that influence biomarker performance and cognitive decline may not have been fully accounted for in our models.
This study contributes to the literature by demonstrating the longitudinal predictive value of CCTs for everyday functional decline in AD and related disorders. The predictive utility of CCTs appears further enhanced when considered alongside plasma-based biomarkers such as NfL and plasma p-tau217. Taken together, in minimally cognitive impaired older adults, the combination of CCTs with neurodegenerative biomarkers may have prognostic value for forecasting cognitive and functional decline. These findings highlight the importance of integrating sensitive cognitive measures with scalable blood-based biomarkers for early detection and disease monitoring. This approach has the potential to optimize diagnostic precision, inform prognostic evaluation, and streamline participant selection and monitoring in therapeutic trials.
Footnotes
Acknowledgements
We are grateful to all 1FLADRC research participants and their families for their invaluable contributions to our research.
Ethical considerations
This study was IRB approved and met all national and international standards for the protection of human subjects.
Consent to participate
All participants provided informed consent to participate in this study.
Consent for publication
Not applicable.
Author contribution(s)
Funding
The authors disclosed receipt of the following financial support for the research, authorship, and/or publication of this article: This research was supported by the National Institute on Aging Grants 1K01AG080120, 5P30 AG066506, 1R01AG077677. Funding sources did not play a role in the conduct of the research or manuscript preparation.
Declaration of conflicting interests
The authors declared the following potential conflicts of interest with respect to the research, authorship, and/or publication of this article: None of the authors have conflicts of interest involving this manuscript, although Drs. Loewenstein and Curiel hold intellectual property rights to the LASSI-L at the University of Miami.
David A. Loewenstein is an Editorial Board Member of this journal but was not involved in the peer-review process of this article nor had access to any information regarding its peer-review.
Data availability statement
De-identified data used in this study are available through the 1Florida Alzheimer's Disease Research Center (1FLADRC), subject to data access procedures and approval.