
Abstract
Background
Multiscale dispersion entropy (MDEnt) is a nonlinear EEG measure that quantifies brain complexity across time scales, reflecting both local and global brain dynamics. Previous research indicates lower complexity at short time scales in Alzheimer's disease (AD) compared to mild cognitive impairment (MCI) and healthy controls (HCs), with MCI also showing lower values than HCs. Major depressive disorder (MDD) has also been preliminarily linked to reduced complexity during acute episodes.
Objective
To assess whether MDEnt at short time scales can distinguish AD from MCI and HCs, and to examine complexity differences across additional groups, remitted MDD (rMDD) and rMDD + MCI, while exploring associations with cognitive performance.
Methods
The study included 316 older adults: 44 HCs, 46 with rMDD, 114 with MCI, 71 with rMDD + MCI, and 41 with AD. Resting-state, eyes-closed EEGs were analyzed using MDEnt at 24 ms (short) and 60 ms (long) time scales. Cognitive function was measured with the Montreal Cognitive Assessment and a composite cognitive score.
Results
Short time scale complexity was lowest in AD, followed by MCI, and highest in HCs; rMDD presence had no impact. Only AD showed reduced complexity at long time scales. Complexity at both time scales was significantly correlated with cognitive performance.
Conclusions
This study highlights the value of MDEnt to assess complexity at short time scale and differentiate individuals with AD, MCI, or HCs. Reduced complexity in these individuals may underlie their cognitive impairment. In contrast, our study suggests that any MDD impact on complexity is likely related to active depressive symptoms.
Keywords
Introduction
The brain is a complex multiscale system,1–3 and entropy—a nonlinear metric—is well-suited to quantifying its spatiotemporal dynamics, revealing underlying neural interactions.2,4–8 EEG complexity reflects the dynamic balance between organized and random patterns across multiple time scales, capturing the adaptive interplay of neuronal circuits underlying both healthy brain function and its pathological alterations. 9 Multiscale sample entropy (MSEnt) is a widely used measure for quantifying the complexity of biomedical data, including EEG, across multiple time scales.9–11 MSEnt at short time scales manifests at high-frequency EEG oscillations and reflects local neuronal population processing. In contrast, MSEnt at long time scales manifests at low-frequency EEG oscillations and reflects broad network processing.7,12,13
MSEnt has been examined in multiple brain disorders,10,11,14 including Alzheimer's disease (AD).9,15–20 In AD, whole-brain complexity is reduced at short time scales (4–24 ms) and elevated at long time scales (>60 ms),9,15–19 This is consistent with AD-associated decreases in relative power within the higher frequency components of EEG (corresponding to short time scales) and increases in relative power within the lower frequency components of EEG (corresponding to long time scales). 21 One study assessed MSEnt in individuals with mild cognitive impairment (MCI), a prodrome of AD. 16 In this study, MSEnt across the whole brain was lower in individuals with MCI at short time scales (between 20 and 30 ms) than in healthy individuals but higher than in individuals with AD. 16 This finding, however, is based on small samples (<30 participants per group).
Multiscale Dispersion Entropy (MDEnt) as a more stable, reliable alternative to MSEnt provides consistent complexity measures across scales and detects subtler physiological differences.9,18,20,22–24 MDEnt is also sensitive to smaller differences among conditions known to alter the complexity of physiological recordings.9,18,20,22–24 In MEG recordings from 36 AD and 26 healthy control (HC) subjects, MDEnt avoided undefined values, revealed significant group differences over more scales, and improved AD–HC classification accuracy. 24 In resting-state EEG (133 young versus 65 older healthy; 29 HC versus 23 frontotemporal dementia (FTD) versus 36 AD), MDEnt outperformed both MSEnt and power spectrum, yielding larger effect sizes (Hedge's g) and higher accuracy for young versus older, HC versus FTD, and FTD versus AD distinctions. 20
Older individuals with active and remitted major depressive disorder (rMDD) are at high risk for AD,25–28 irrespective of whether there is comorbid MCI or not.29,30 No study to date has examined EEG complexity in older adults with MDD. One study examined MSEnt using resting-state eyes-closed EEGs recorded from 22 younger adults with MDD during a major depressive episode and 22 age-matched HCs. It was found that MSEnt was higher in the MDD group than the HC group at time scales of 20 to 32 ms in almost the whole brain. 31
In this context, we investigated MDEnt at short and long time scales and its relationship to cognitive performance in a large and well-characterized sample of older individuals with MCI, AD, or HC. We also explored MDEnt in well-characterized samples of older adults with rMDD with and without MCI, and contrasted these findings with those observed in HC, MCI and AD individuals.
We hypothesized that, at short time scales, temporal-lobe EEG MDEnt would follow HC > MCI > AD and would inversely correlate with cognitive performance across all groups. 17 We focused on the temporal lobes—among the first regions affected in AD/MCI.19,32,33 We also selected the temporal lobes in our exploratory analyses that focus on rMDD. Lastly, in another exploratory analysis, we compared AD, MCI, rMDD and HC participants on MDEnt at a long time scale given the literature on higher MSEnt in AD versus HC participants at long time scales.9,15–19
Thus, in this study we aimed to make several novel contributions to the field: (1) It will represent the first application of MDEnt to differentiate between rMDD, MCI, and comorbid rMDD + MCI in older adults, addressing a critical gap in understanding how depression history affects brain complexity in the context of cognitive impairment; (2) Our comprehensive analysis across multiple time scales (24 ms and 60 ms) will provide insights into both fast local neural dynamics and slower global brain network processes; (3) The large, well-characterized sample will provide robust statistical power to detect group differences and examine the relationships between brain complexity and cognitive performance; and (4) Our findings could have potential clinical implications for early detection and differential diagnosis of cognitive impairment in older adults with and without a history of depression.
Methods
Participants
HC, rMDD, MCI, and rMDD + MCI participants were enrolled in an AD prevention trial called “Prevention of Alzheimer's Dementia with Cognitive Remediation plus transcranial Direct Current Stimulation in Mild Cognitive Impairment and Depression” (PACt-MD across five academic hospitals in Toronto, Canada (ClinicalTrials.gov Identifier: NCT02386670). The trial's design and rationale have been previously published.34,35 All participants provided written consent, which was approved by local Research Ethics Boards and Clinical Trials Ontario. Recruitment methods included physician referrals, local advertisements, and community presentations.
The eligibility criteria for all participants included: (1) no prior diagnosis of schizophrenia, bipolar disorder, or obsessive-compulsive disorder by the Diagnostic and Statistical Manual of Mental Disorders Fifth Edition (DSM-5) 36 ; (2) absence of significant neurological conditions or unstable medical conditions; (3) no DSM-5 diagnosis of alcohol or other substance use disorder in the past 12 months; (4) no use of cognitive enhancers within the 6 weeks before study entry; and (5) a score of 10 or lower on the Montgomery–Asberg Depression Rating Scale (MADRS). 37
The eligibility criteria for participants with rMDD, whether or not they had MCI, included the following: (1) Age 65 or older; (2) A history of meeting the DSM-5 criteria for one or more major depressive episodes, either occurring 2 months to 5 years before the screening date or happening more than 5 years before the screening date, with at least one of these episodes requiring medical attention (e.g., antidepressant treatment or hospitalization); (3) Do not meet the criteria for a current major depressive episode; and (4) No electroconvulsive therapy within 6 months of the baseline cognitive testing. For the MCI group, the criteria were: (1) Age 60 or older; (2) A DSM-5 diagnosis of Mild Neurocognitive Disorder. For the HC group: (1) Age 60 or older; (2) No DSM-5 diagnosis of Mild or Major Neurocognitive Disorder; and (3) No neuropsychological testing conducted in the 12 months before the baseline assessment.
In addition to satisfying the eligibility criteria, each participant underwent a consensus conference involving the clinical psychiatrist responsible for the participant, two principal investigators, the study neuropsychologist, and the research staff responsible for conducting clinical, functional, and cognitive assessments. During this conference, participants were categorized into one of the following four final groups: (1) HC; (2) rMDD without MCI (rMDD); (3) MCI only (MCI); and (4) rMDD with MCI (rMDD + MCI).
The EEG study was an optional component of the primary study. 44 HC, 46 rMDD, 114 MCI, and 71 rMDD + MCI participants completed a baseline resting-state EEG, as outlined in the CONSORT chart (Supplemental Figures 1 and 2).
AD participants were enrolled in two separate intervention studies (ClinicaTtrials.gov ID's: NCT01847586 and NCT02537496). In both studies, all participants provided written informed consent, approved by the Research Ethics Board at the Centre for Addiction and Mental Health. The equipment and EEG protocols utilized for the AD participants were consistent with those employed for HC, rMDD, MCI, and rMDD + MCI participants.
Eligibility criteria for AD participants in both studies included the following: (1) Meeting the National Institute of Neurological and Communicative Disorders and Stroke and the Alzheimer's Disease and Related Disorders Association (NINCDS-ADRDA) core criteria for probable AD in one study and receiving a confirmed diagnosis of probable AD according to the National Institute on Aging – Alzheimer's Association (NIA-AA) Research Framework for Alzheimer's Disease in the other; (2) No current acetylcholinesterase inhibitor use or maintaining a stable dose for at least 3 months; (3) No Axis I diagnosis other than Dementia of the Alzheimer type within the past 12 months; (4) Age criteria differed, with one study requiring participants to be 65 years or older, and the other study requiring a minimum age of 55. Additionally, one study used the Mini-Mental State Examination (MMSE) 38 with a score of 17 or higher as an inclusion criterion. In contrast, the other used the Montreal Cognitive Assessment (MoCA) 39 with a score of 10 or higher (see CONSORT chart, Supplemental Figure 3).
Assessments
Clinical. The diagnoses of HC, rMDD, MCI, and rMDD + MCI were validated using of the Structured Clinical Interview for the Diagnosis and Statistical Manual IV-TR edition (SCID) 40 and DSM-5. 36 Participants in the HC, rMDD, MCI, and rMDD + MCI groups underwent evaluations using the MoCA and MMSE. AD participants were identified based on the NINCDS-ADRDA core criteria for probable AD 41 or the NIA-AA Research Framework. 42
Cognitive. All HC, rMDD, MCI, and rMDD + MCI group participants underwent a comprehensive cognitive assessment. Trained psychometrists conducted these assessments, which were recorded on video and periodically reviewed to ensure a high level of agreement between raters (κ = 0.91). The battery of tests assessed various cognitive domains, including processing speed, working memory, executive function, verbal memory, visual memory, language skills, and visual processing (see Table 1). Z-scores were computed for each test using standardized normative data, and a domain-specific score was derived by averaging the Z-scores within that particular domain. The overall composite score was obtained by averaging all six domains. These cognitive assessments have demonstrated their effectiveness in assessing individuals with neurological and psychiatric disorders in late life and in healthy individuals.34,43–45
Neuropsychological battery and composite cognitive score.
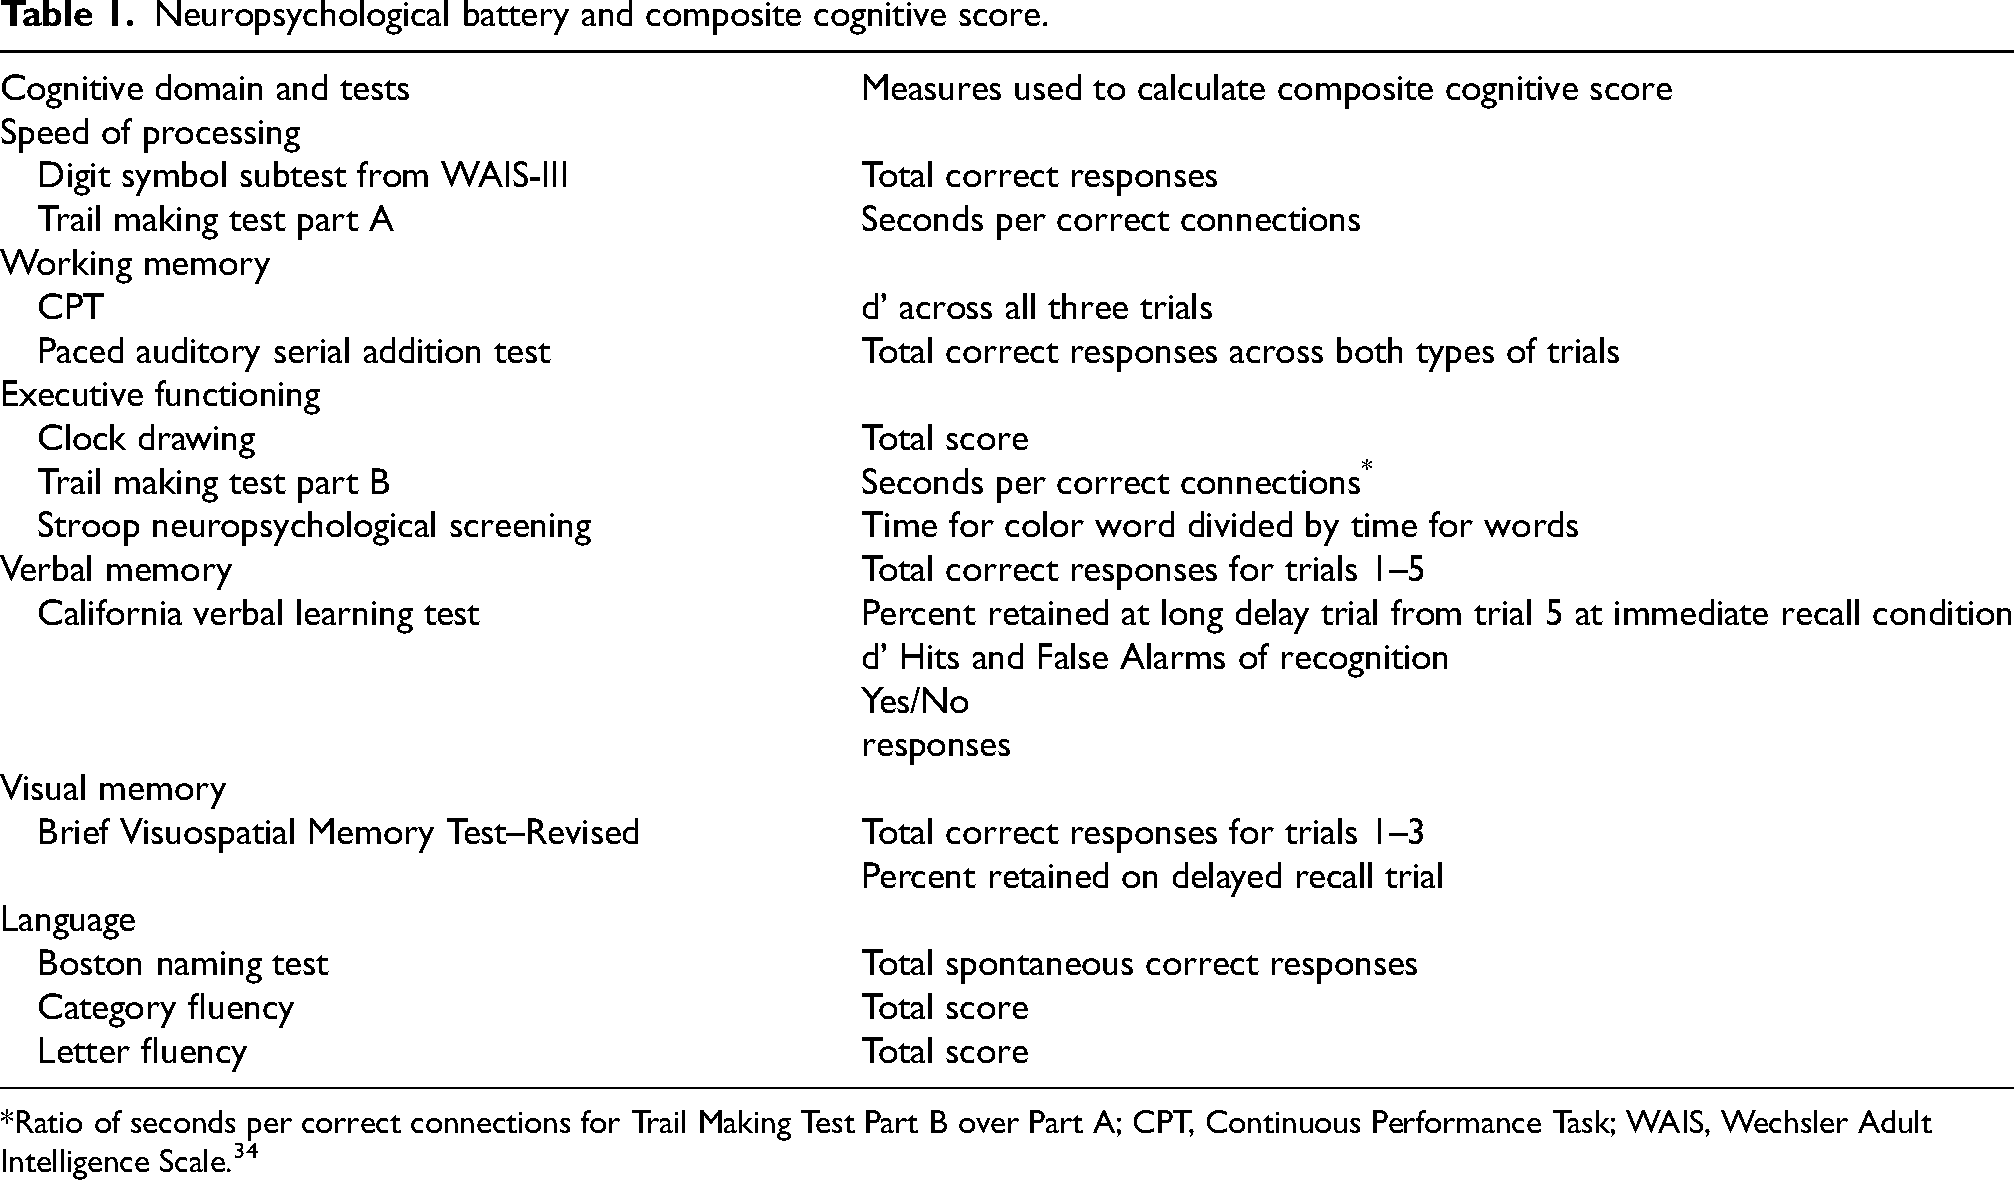
Ratio of seconds per correct connections for Trail Making Test Part B over Part A; CPT, Continuous Performance Task; WAIS, Wechsler Adult Intelligence Scale. 34
The participants with AD were not subjected to the previously mentioned cognitive assessments. Nevertheless, out of the 41 AD participants, 26 had completed the MMSE, and 14 had completed the MoCA assessments. There was one participant for whom neither MMSE nor MoCA scores were available. To address this, for the 26 participants with MMSE data, we computed corresponding MoCA scores using a conversion rubric that had been previously established and published. 46
EEG data collection and processing
EEG recordings were performed using a 64-channel Synamps 2 EEG device and the 10-10 montage system. Electrodes were referenced to CPz. EEG signals were recorded for 10 min at a sampling frequency of 1000 Hz. Participants relaxed seated, with their eyes closed, ensuring minimal head or eye movements and avoiding falling asleep.
The recorded EEG data underwent offline processing using MATLAB R2022b (MathWorks, Natick, MA, USA) and the EEGLAB toolbox (version 2022.0). Initial visual inspection was conducted to exclude segments with prominent delta and theta waves, indicative of sleep patterns, to ensure wakefulness during recording. 47 A band-pass filter of 1–45 Hz (4th order Butterworth filter) was applied during preprocessing to remove DC drift and high-frequency noise while preserving the frequency components relevant to our analysis. This frequency range encompasses the delta through gamma bands while excluding high-frequency muscle artifacts. Subsequently, a careful visual examination was carried out to identify and discard noisy segments and channels affected by various artifacts, such as motion artifacts, eye movements, and blinks. 48 To further reduce noise, the continuous EEG data was divided into 4-s epochs and subjected to independent component analysis (ICA) to remove components related to eye movements and muscle activity. 49 The EEG data was then re-referenced to the common average reference and down-sampled to a sampling frequency of 250 Hz. After preprocessing, at least 6 min of clean EEG data (90 epochs of 4 s each) remained for subsequent analysis. Finally, MDEnt was applied to these cleaned EEG epochs.
MDEnt is based on dispersion entropy (DispEn) and provides insight into the complexity of fluctuations over a range of time scales. 9 DispEn is a metric based on Shannon entropy and dispersion patterns.50,51 DispEn detects changes in amplitude, frequency, bandwidth, noise power, and periodicity of time series.50,51 DispEn and MDEnt have been applied in a variety of settings in biomedical signal analysis and neuroscience, including rsEEG and sleep EEG,52,53 MEG, 24 and cardiac activity, 54 among others.
Formally, MDEnt is computed as follows 9 :
Assume a univariate discrete time series of length 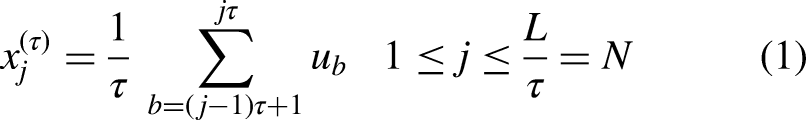
Finally, the DispEn value is calculated for each coarse-grained signal.
The DispEn of the univariate signal of length
1) 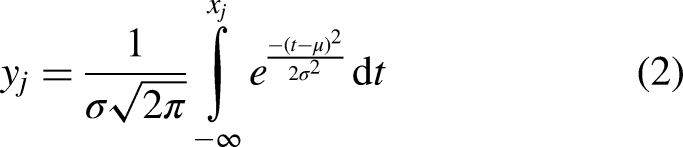
2)
3) For each 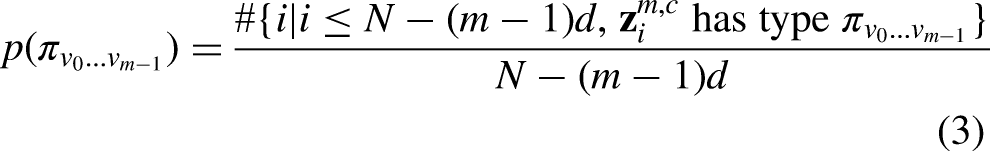
4) Finally, according to the definition of Shannon entropy, the DispEn is defined as follows: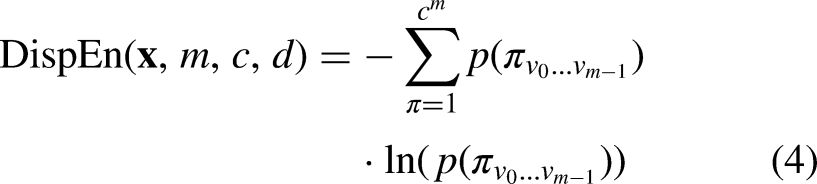
Supplemental Figure 4 illustrates the step-by-step MDEnt calculation process, including the coarse-graining procedure across multiple time scales and the subsequent dispersion entropy computation.
As we analyze the data from scale factor 1–20, we evaluate the complexity at time scale 4 ms to 80 ms. Multiscale entropy techniques at scale factor
Of note, for all analyses we chose a time scale of 24 ms for MDEnt because it is in the middle of the range of scales previously found to differentiate HC from AD participants. 16 It also corresponds to a time scale that is relevant to the findings in MDD as noted above. 31
Statistical analyses
All data were analyzed using the Statistical Program for Social Sciences (SPSS) version 23.0 (SPSS Inc., Chicago, IL, USA). We first displayed graphically MDEnt values averaged across all temporal electrodes for all diagnostic groups and across all time scales. One-way analysis of variance (ANOVA) and χ2 tests were then used to evaluate differences among the groups on demographic, clinical, and cognitive characteristics. Since there were group differences in age and education, these variables were included as covariates in the analyses below.
We then generated MDEnt at scale factors 1–20 (equivalent to time scales 4 to 80 ms) over the temporal region in HC, rMDD, MCI, rMDD + MCI, and AD participants. To test our hypothesis that MDEnt will decrease from HC, to MCI, and then AD, we conducted an ANCOVA with the MDEnt at time scale 24 ms as the dependent variable, group as the independent variable and age and education as the covariates, since both can affect EEG patterns.20,60
The ANCOVA was followed by post-hoc analyses with Bonferroni correction for three comparisons. Then, we explored the effect of rMDD on MDEnt at 24 ms in HC, MCI, AD, rMDD, and rMDD + MCI using also ANCOVA and followed by post-hoc analyses with Bonferroni correction for 10 comparisons.
To explore comparing all groups on MDEnt at a long time scale, we used MDEnt at scale factor 15, corresponding to a time scale of 60 ms (time scale = scale factor/sampling frequency = 15/250 Hz) and conducted similar ANCOVAs and post-hoc analyses as the ones described above.
To assess the relationships between cognition and EEG complexity in HC, MCI, and AD, as well as HC, MCI, AD, rMDD, and rMDD + MCI, we conducted two linear regression models. The first was among HC, MCI and AD participants combined and included MoCA as the dependent variable, MDEnt at 24 ms as the independent variable, and age, education and diagnosis as co-variates. The second was among all groups except the AD group (because we did not have an overall composite score in the AD group) and included the overall composite score as the dependent variable, MDEnt at 24 ms as the independent variable, and age, education and diagnosis as co-variates. We also conducted similar analyses using MDEnt at 60 ms. Finally, alongside all preceding MDEnt analyses, we computed MSEnt using the standard coarse-graining framework of Costa et al.. 10 Using embedding dimension m=1 and tolerance r=0.2 × the standard deviation of the (scale-wise) coarse-grained signal, we evaluated scale factors 1–20 (corresponding to 4–80 ms), and conducted then similar analyses for comparisons with MDEnt.
Results
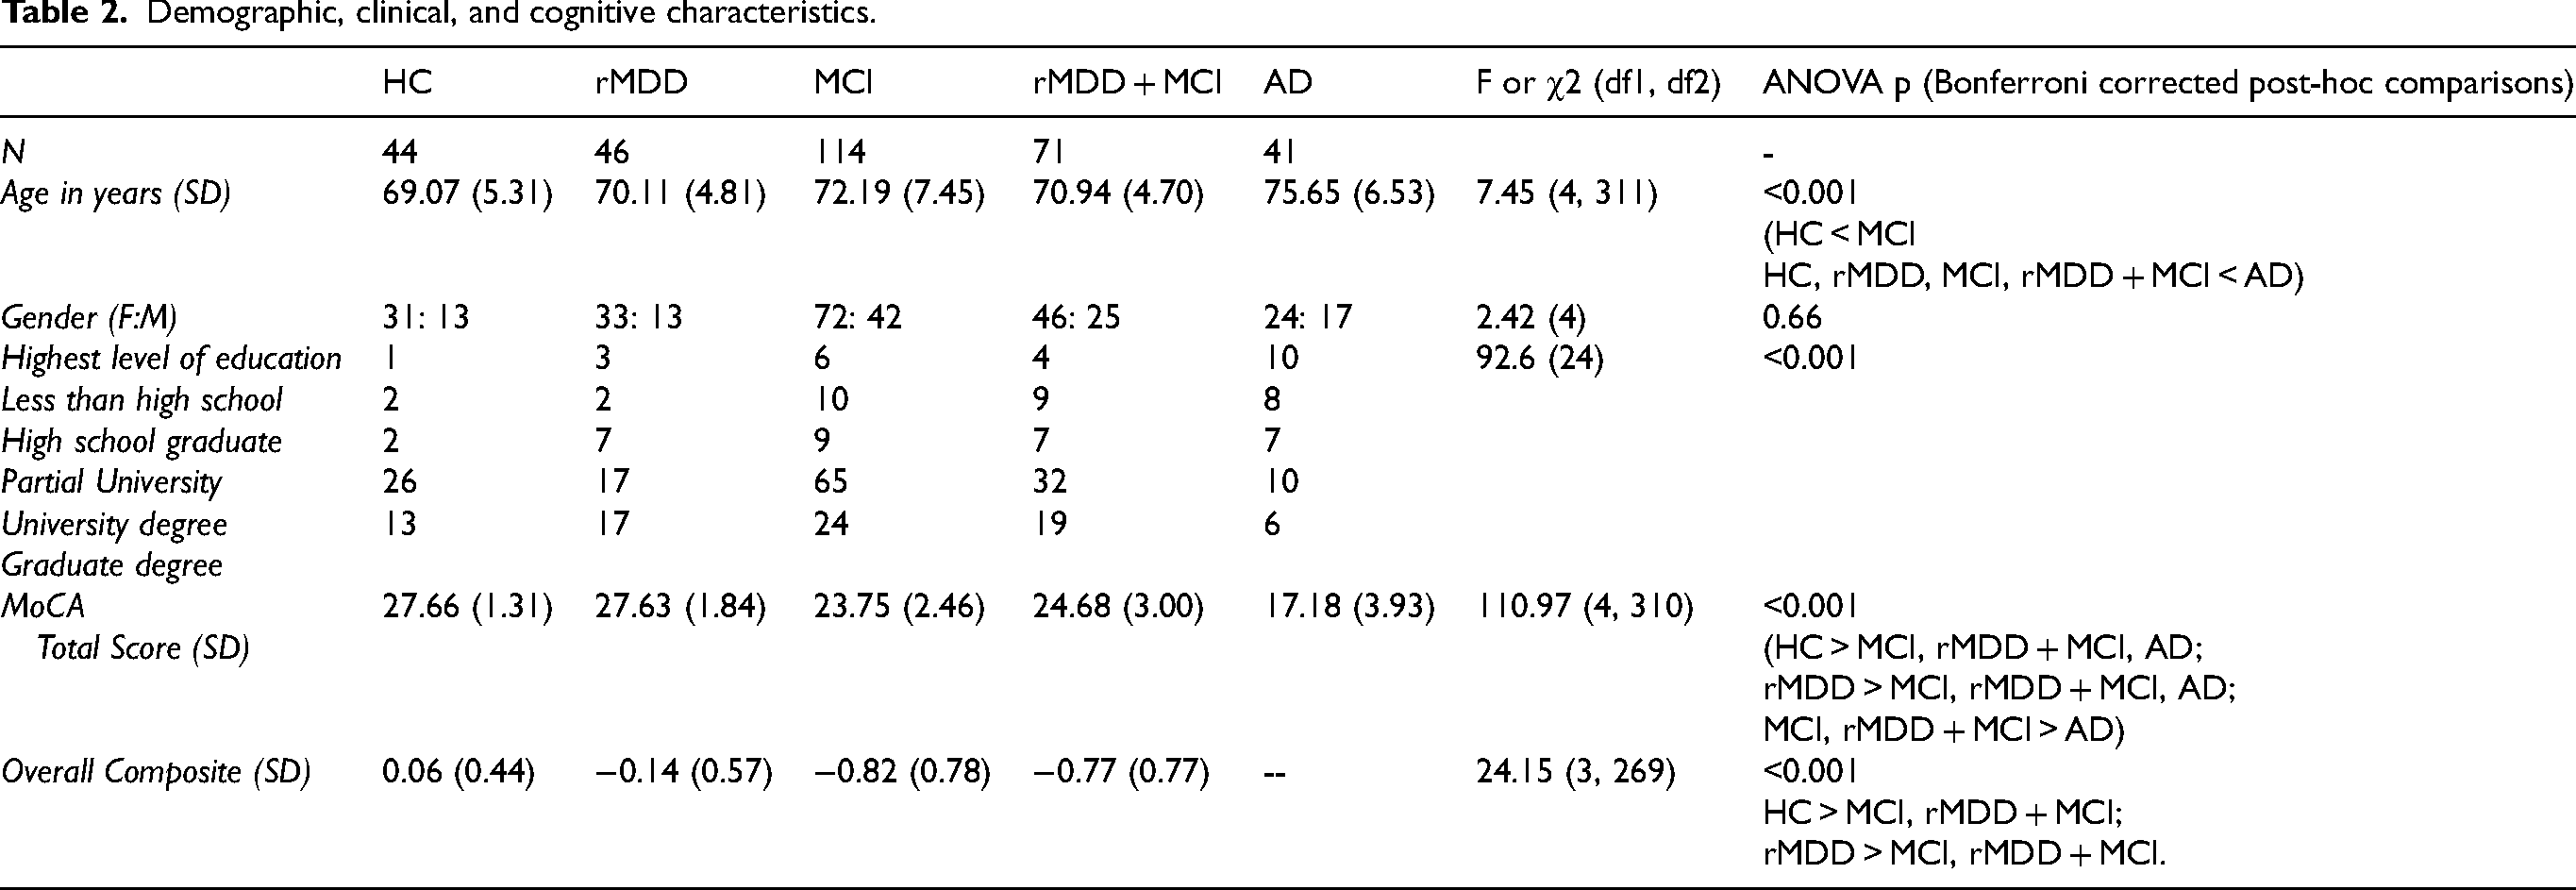
Demographic, clinical, and cognitive characteristics of all participants are presented in Table 2. Of note, the groups differed on age, education, and cognition.
Demographic, clinical, and cognitive characteristics.
MDEnt of the temporal EEG
Figure 1 displays temporal electrodes averaged MDEnt values across a range of time scales for each group. The results show qualitatively a pattern of lower entropy at short time scale factors (1 to 6, corresponding to time scales 4 to 24 ms) and higher entropy at long time scale factors (10 to 20, corresponding to time scales 40 to 80 ms) in AD than in HC, MCI, rMDD, and rMDD + MCI participants.
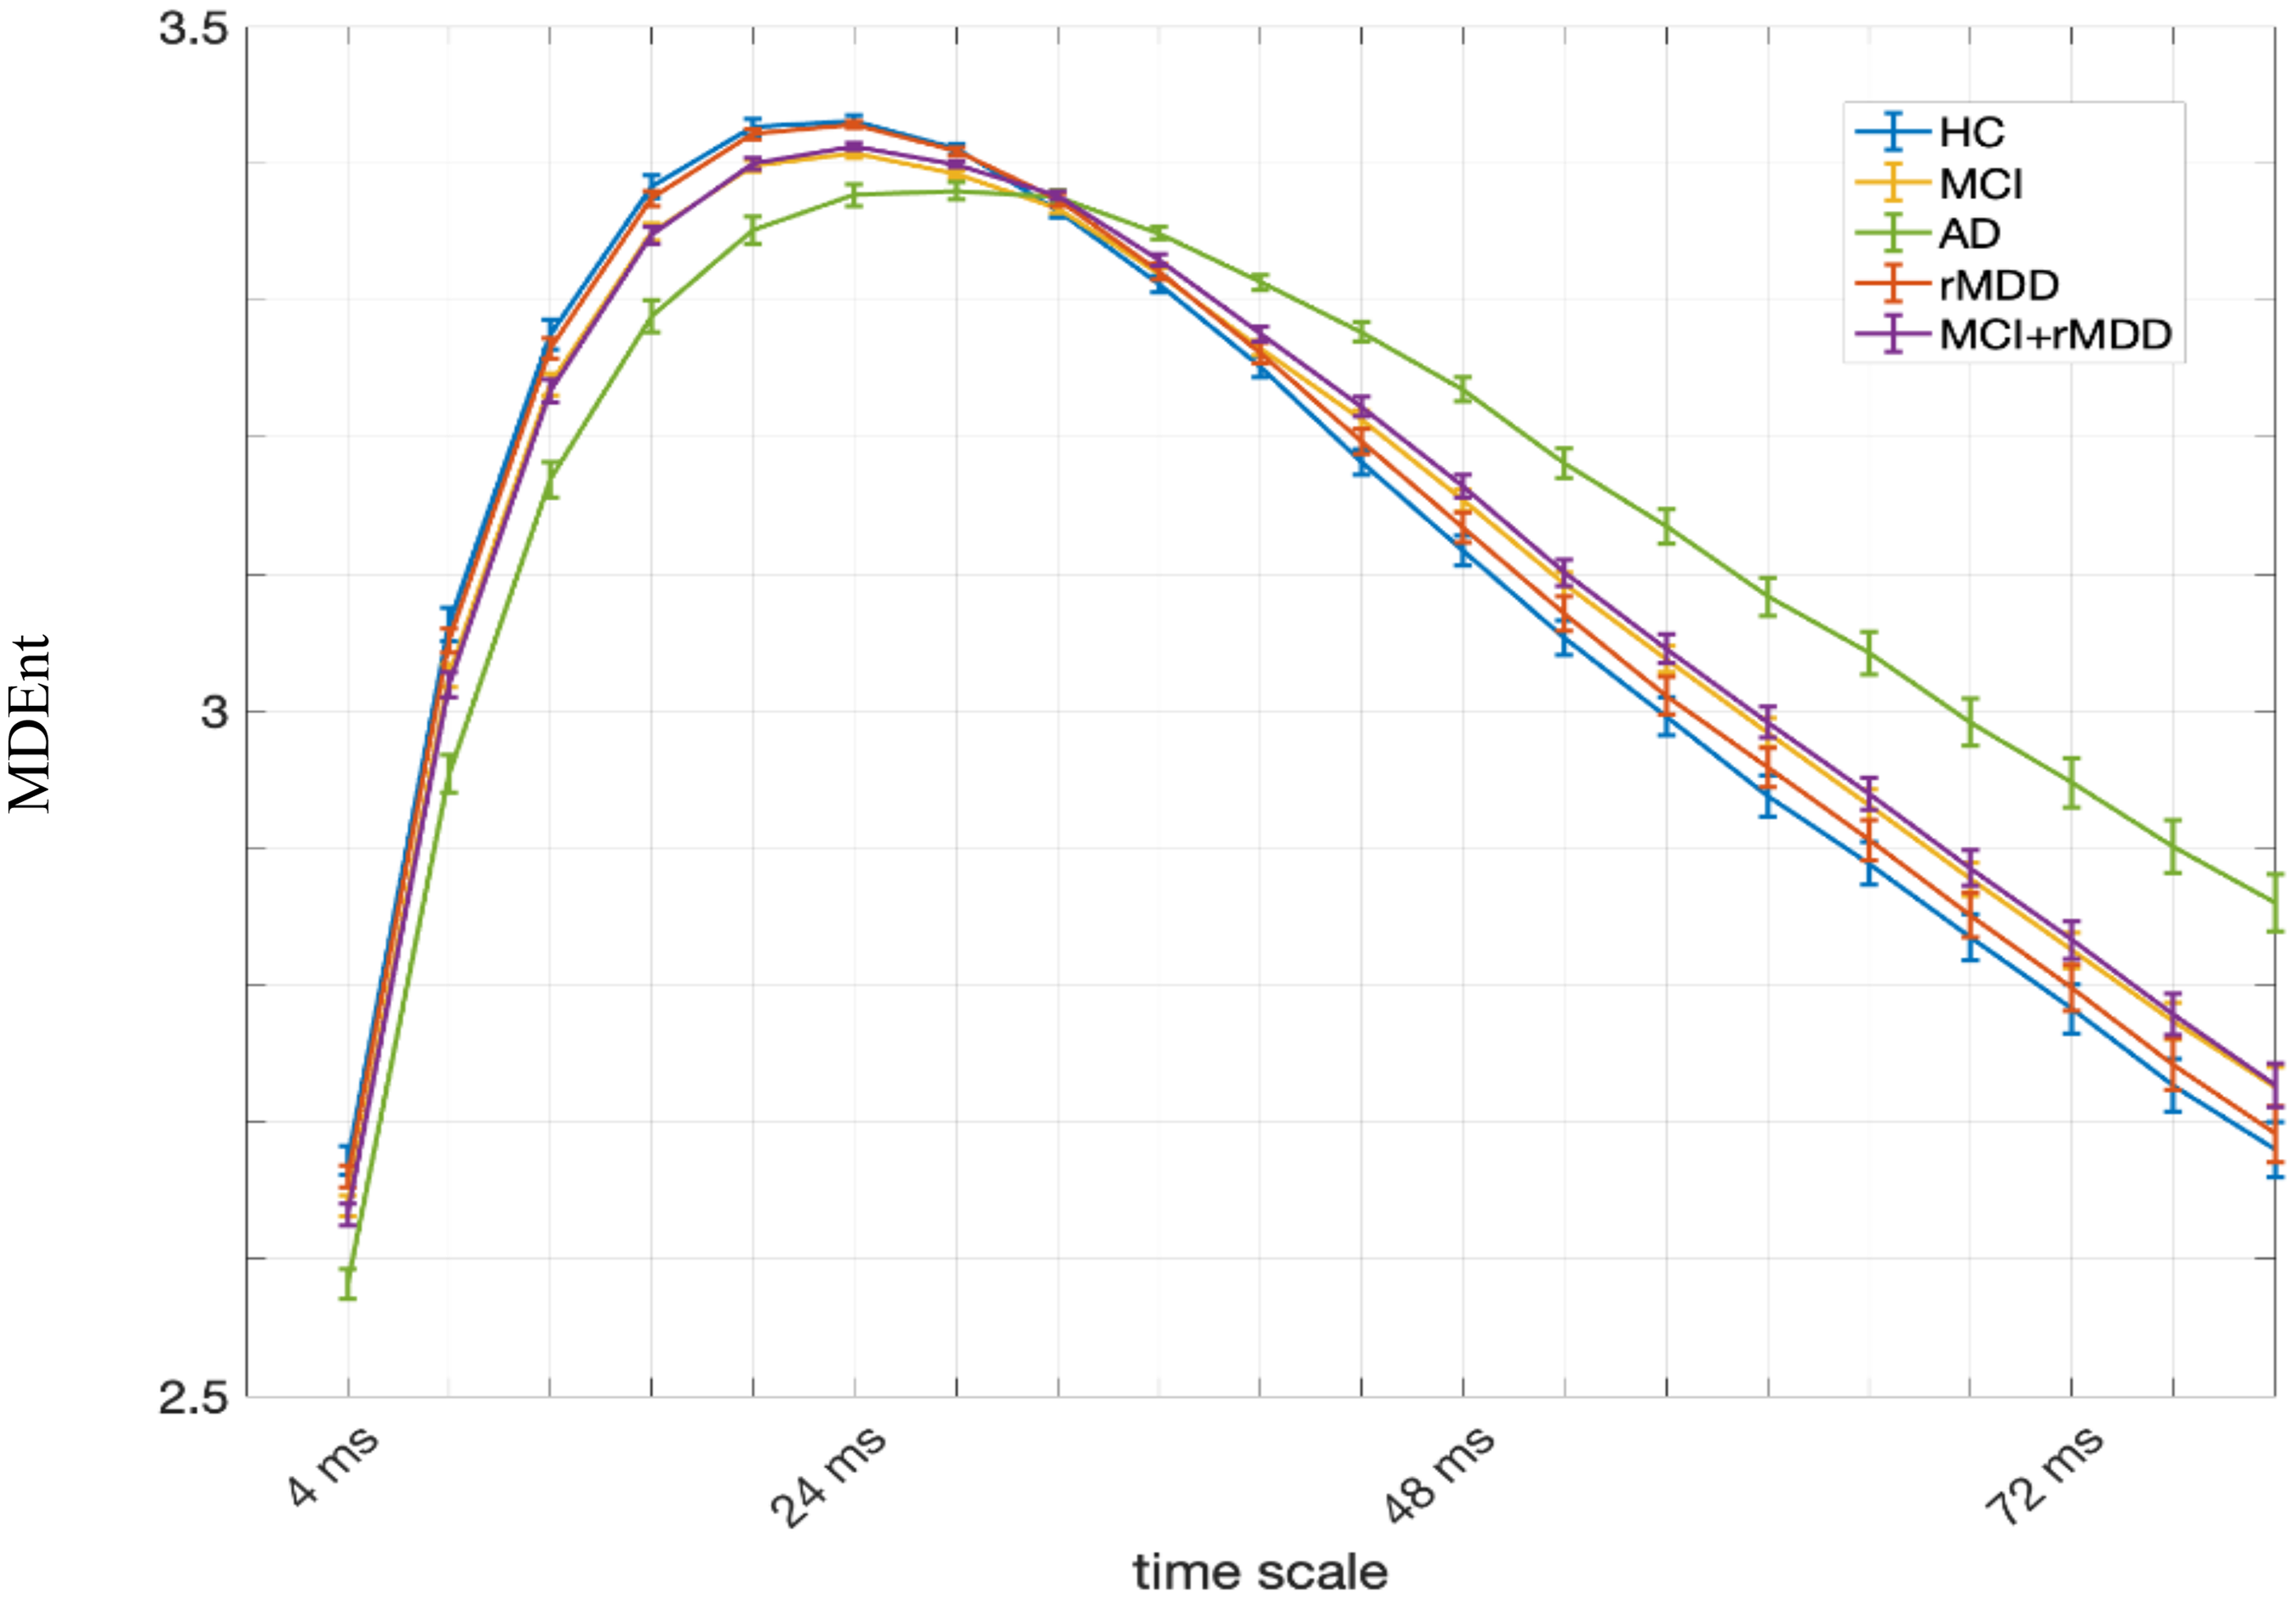
Multiscale dispersion entropy (MDEnt) at time scale 4 ms (scale factor 1) to 80 ms (scale factor 20) for All Groups. At each scale factor, the average and standard error of entropy values for each group are shown. AD: Alzheimer's disease; HC: healthy controls; MCI: mild cognitive impairment; rMDD: remitted major depressive disorder.
MDEnt at time scale 24 ms of the temporal EEG
We next evaluated the group differences in MDEnt in the temporal region at time scale 24 ms (Figure 2) for HC, MCI, and AD participants. ANCOVA showed a significant effect of group (F (2, 194) = 17.83, p < 0.001). Post-hoc Bonferroni corrected comparisons showed that MDEnt, as predicted, is lower in AD versus HC (Mean Difference (SE) = −0.052 (0.009), p < 0.001, Cohen's d = 1.33), AD versus MCI (Mean Difference (SE) = −0.029 (0.007), p < 0.001, Cohen's d = 0.80), and MCI versus HC (Mean Difference (SE) = −0.023 (0.007), p = 0.002, Cohen's d = 0.79).
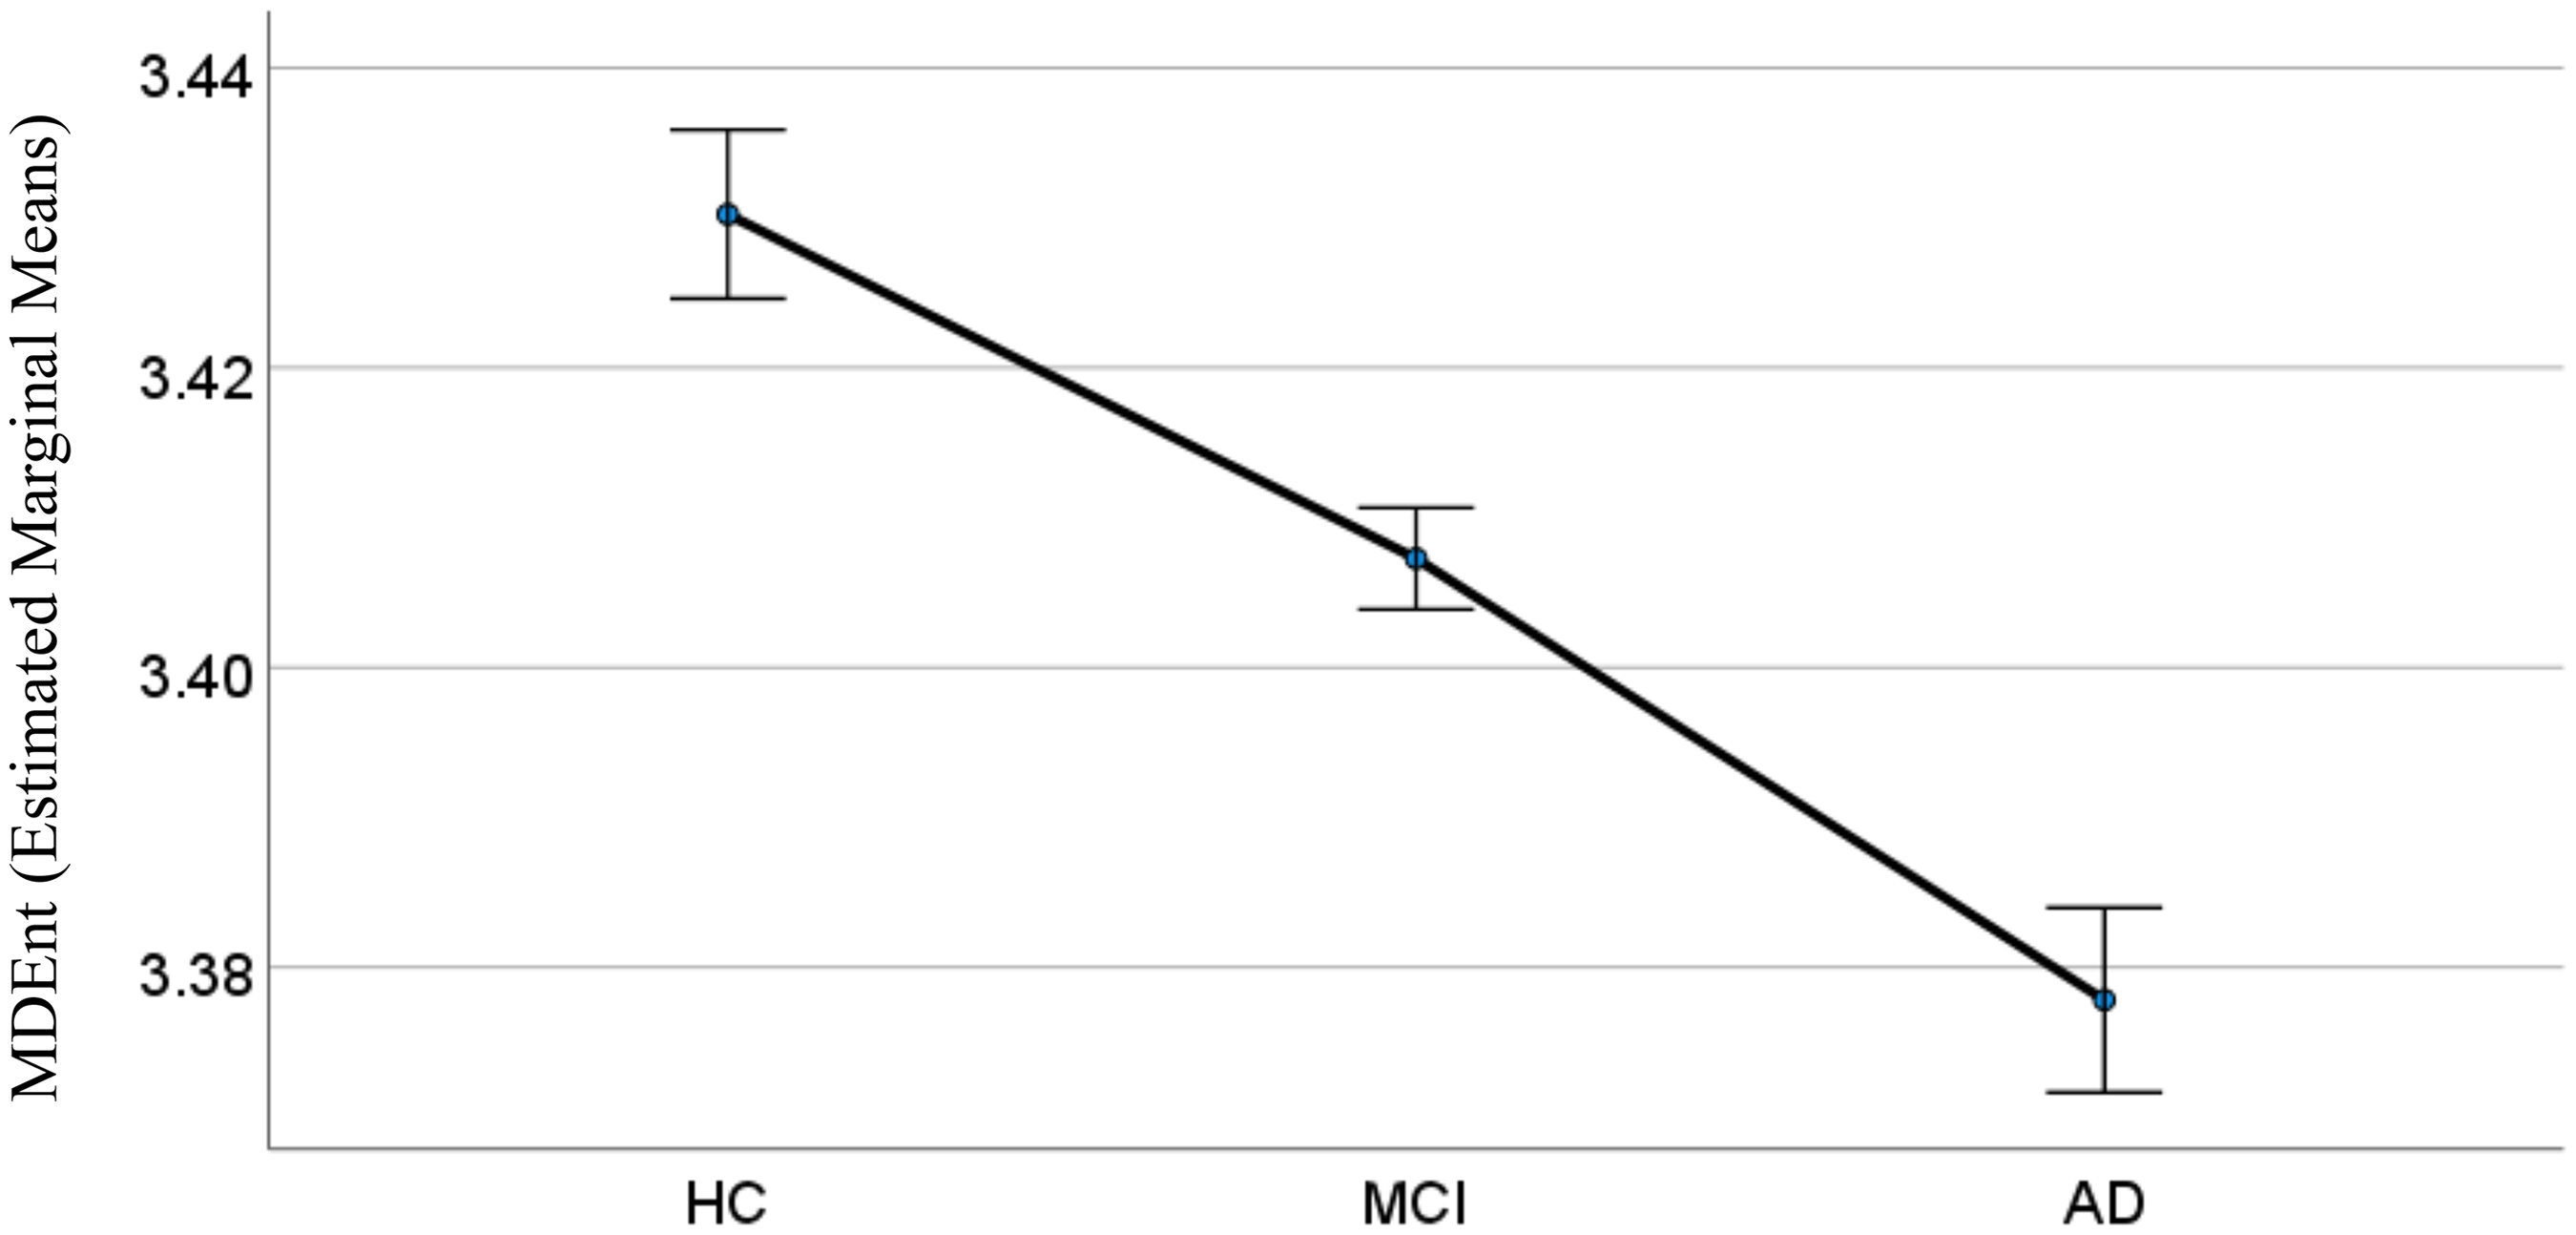
Multiscale dispersion entropy (MDEnt) at 24 ms across healthy control (HC), mild cognitive impairment (MCI), and Alzheimer's disease (AD) groups. This figure illustrates the predicted differences in MDEnt across the three diagnostic groups with covariates appearing in the model set at the following values: Age = 72.22, Education = 5.55; Error bars: ±1 standard error.
We then explored the group differences in MDEnt after adding rMDD and rMDD + MCI to the three other groups (Figure 3). ANCOVA showed a significant effect of group (F (4, 309) = 15.90, p < 0.001). Post-hoc Bonferroni corrected comparisons showed that:
MDEnt in the AD group was lower than in all other groups: AD versus HC (Mean Difference (SE) = -0.052 (0.007), p < 0.001, Cohen's d = 1.35), AD versus rMDD (Mean Difference (SE) = -0.050 (0.007), p < 0.001, Cohen's d = 1.37), AD versus MCI (Mean Difference (SE) = -0.029 (0.007), p < 0.001, Cohen's d = 0.80), and AD versus rMDD + MCI (Mean Difference (SE) = -0.034 (0.007), p < 0.001, Cohen's d = 0.97). MDEnt in the MCI group was lower than in HC (Mean Difference (SE) = -0.023 (0.006), p < 0.001, Cohen's d = 0.79) and rMDD (Mean Difference (SE) = -0.021 (0.001), p = 0.002, Cohen's d = 0.75), but not different than in rMDD + MCI (Mean Difference (SE) = -0.005 (0.000), p = 1.000, Cohen's d = 0.18). MDEnt in the rMDD + MCI was lower than in the HC group (Mean Difference (SE) = -0.018 (0.006), p = 0.032, Cohen's d = 0.75), but not different than in rMDD (Mean Difference (SE) = -0.016 (0.006), p = 0.084, Cohen's d = 0.74). MDEnt in the rMDD group was not different than in the HC group (Mean Difference (SE) = -0.002 (0.007), p = 1.000, Cohen's d = 0.12).
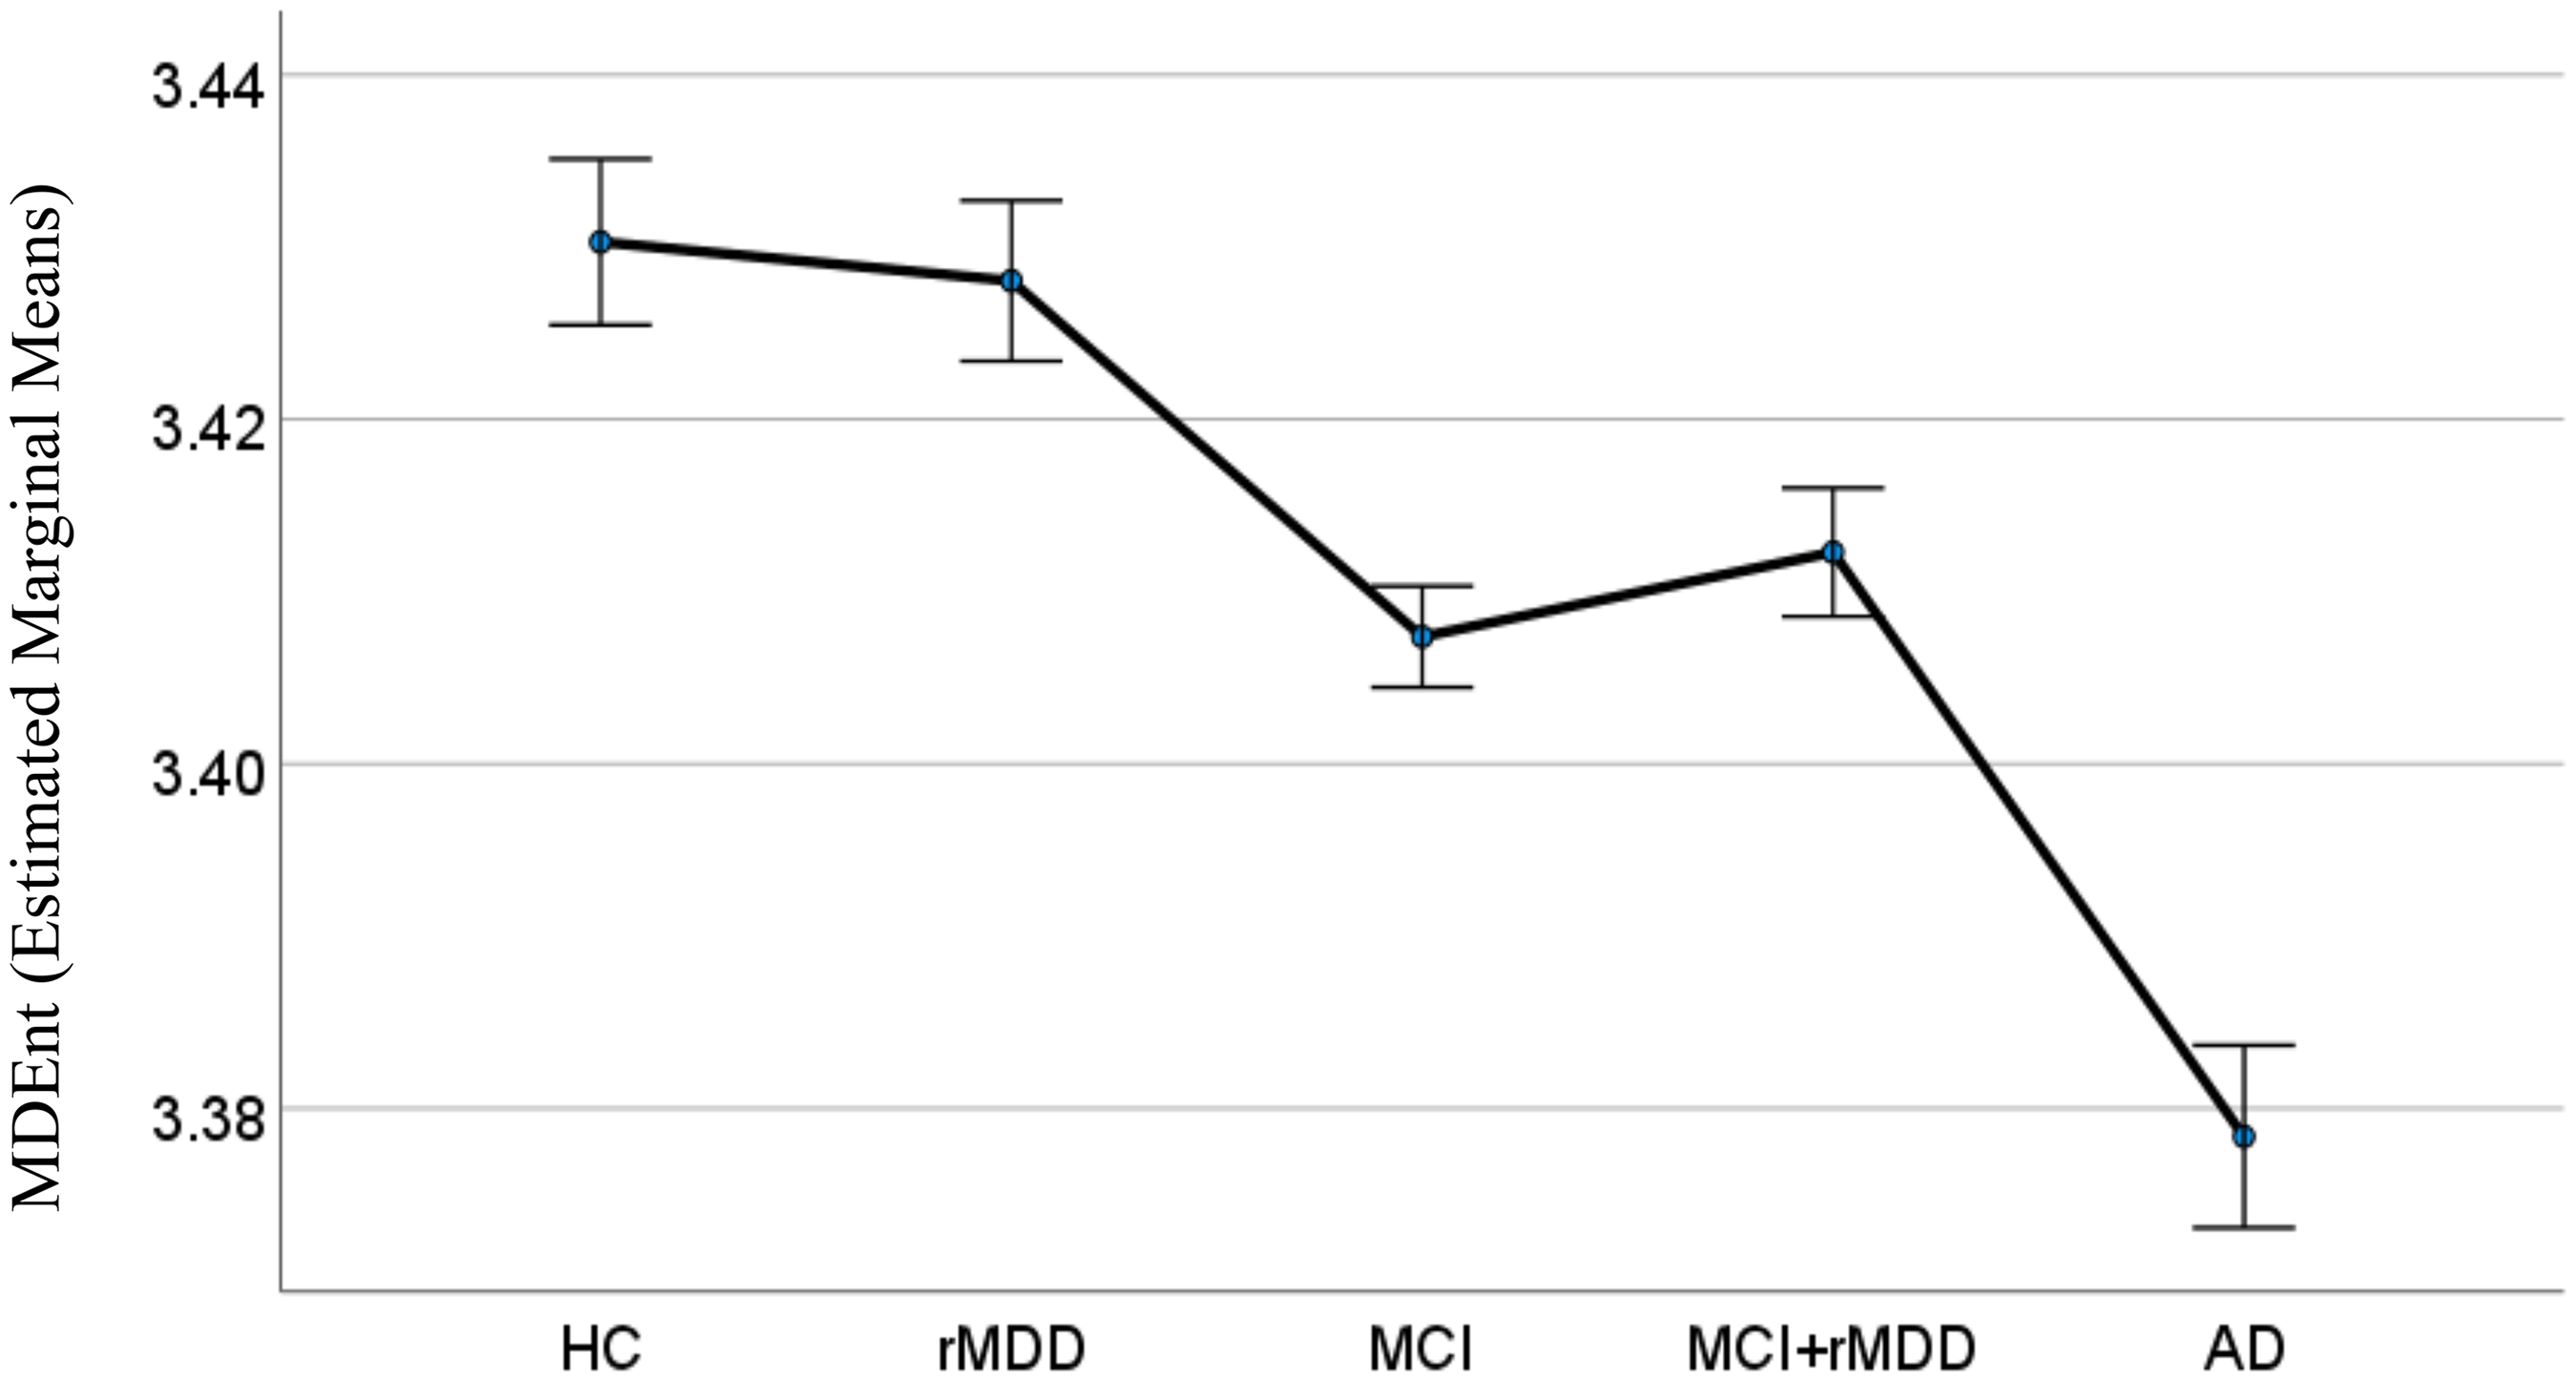
Multiscale dispersion entropy (MDEnt) at 24 ms across healthy control (HC), remitted major depressive disorder (rMDD), mild cognitive impairment (MCI), rMDD+MCI, and Alzheimer's disease (AD) groups. This figure illustrates the lack of impact of having rMDD on entropy. The covariates appearing in the model were set at the following values: Age = 71.62, Education = 5.64; Error bars: ±1 standard error.
MDEnt at time scale 60 ms of the temporal EEG
We then explored the group differences in MDEnt at time scale 60 ms (Figure 4). ANCOVA showed a significant effect of group (F (4, 309) = 8.68, p < 0.001). Post-hoc Bonferroni corrected comparisons showed that:
MDEnt in the AD group was higher than in all other groups: AD versus HC (Mean Difference (SE) = 0.132 (0.024), p < 0.001, Cohen's d = 1.48), AD versus rMDD (Mean Difference (SE) = 0.115 (0.024), p < 0.001, Cohen's d = 1.29), AD versus MCI (Mean Difference (SE) = 0.094 (0.020), p < 0.001, Cohen's d = 0.91), and AD versus rMDD + MCI (Mean Difference (SE) = 0.085 (0.022), p < 0.001, Cohen's d = 0.98). MDEnt in the MCI group was not different than in any other group other than AD: MCI versus HC (Mean Difference (SE) = 0.040 (0.019), p = 0.341, Cohen's d = 0.39), MCI versus rMDD (Mean Difference (SE) = 0.021 (0.018), p = 1.000, Cohen's d = 0.21), MCI versus rMDD + MCI (Mean Difference (SE) = −0.009 (0.016), p = 1.000, Cohen's d = −0.07). MDEnt in the rMDD + MCI group was not different than in any other group other than AD: rMDD + MCI versus HC (Mean Difference (SE) = 0.048 (0.020), p = 0.159, Cohen's d = −0.52), rMDD + MCI versus rMDD (Mean Difference (SE) = 0.030 (0.020), p = 1.000, Cohen's d = 0.32). MDEnt in the rMDD group was not different than in any other group other than AD: rMDD versus HC (Mean Difference (SE) = 0.018 (0.022), p = 1.000, Cohen's d = 0.20).
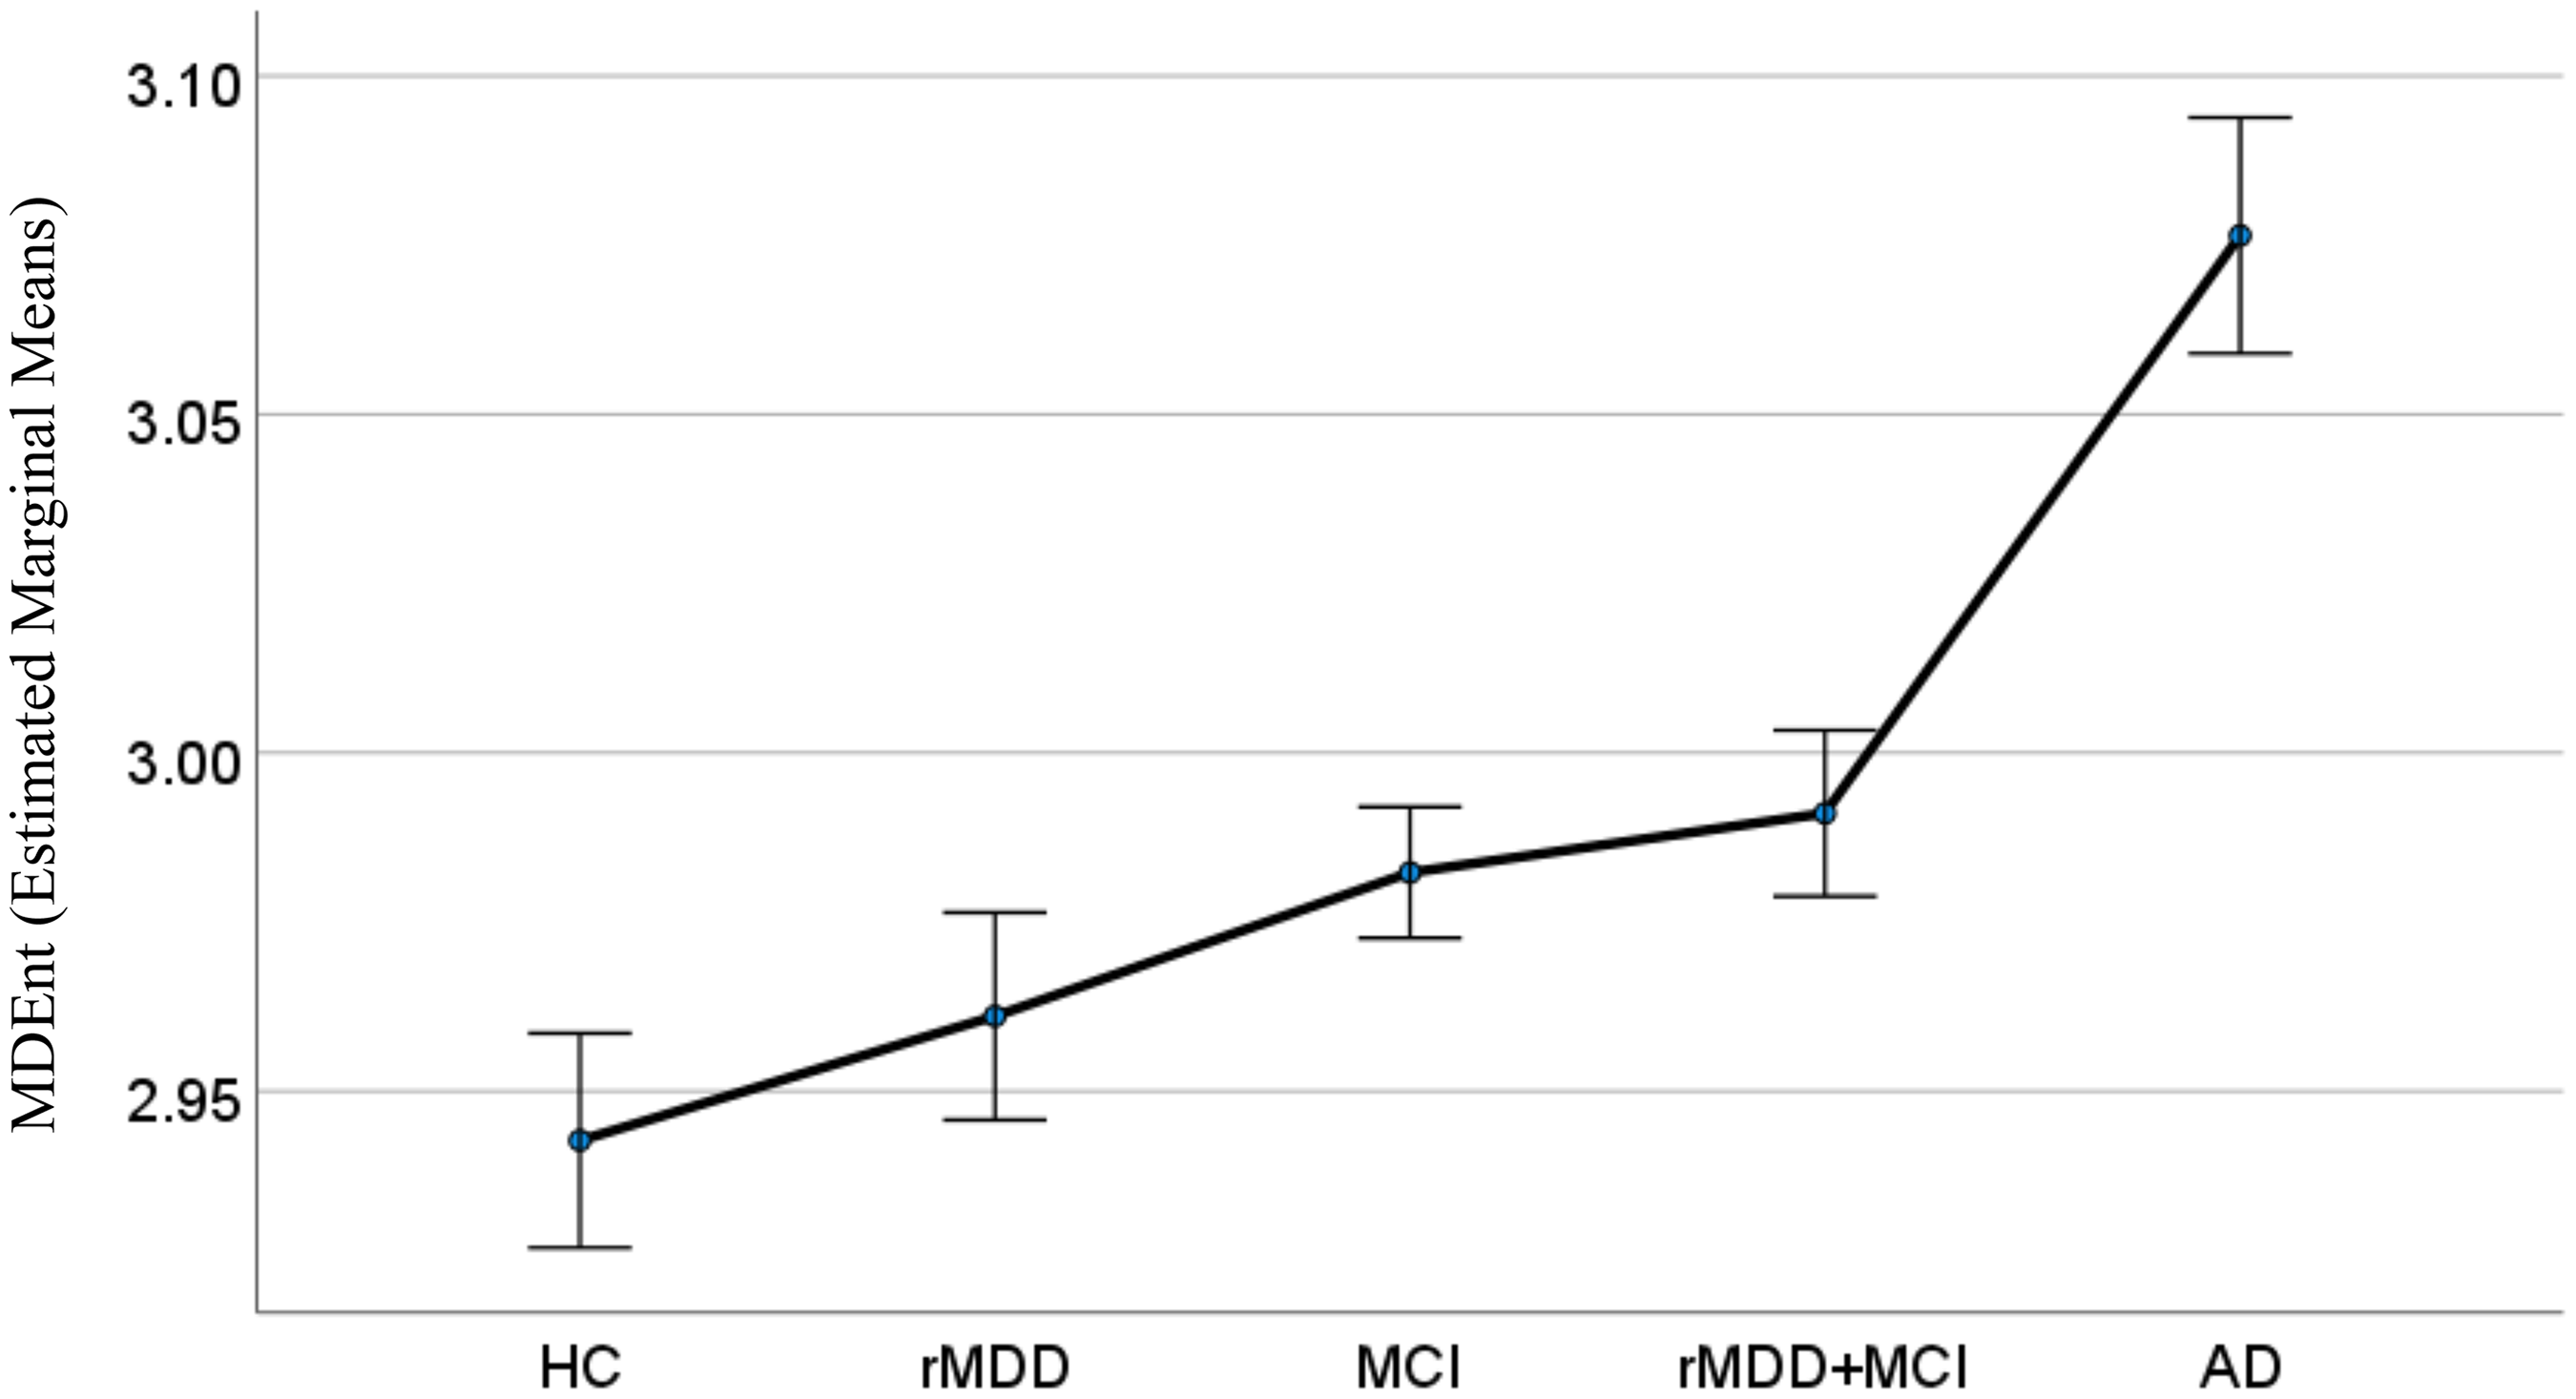
Multiscale dispersion entropy (MDEnt) at 60 ms across healthy control (HC), remitted major depressive disorder (rMDD), mild cognitive impairment (MCI), rMDD+MCI, and Alzheimer's disease (AD) groups. This figure illustrates that only the AD group differs from all other groups on MDEnt at the long time scale. The covariates appearing in the model were set at the following values: Age = 71.62, Education = 5.64; Error bars: ±1 standard error.
Associations between MDEnt at time scale 24 ms and 60 ms, and cognition
Linear regression models showed significant associations between MDEnt and MoCA and overall composite scores as follows (Figure 5):
For HC, MCI, and AD:
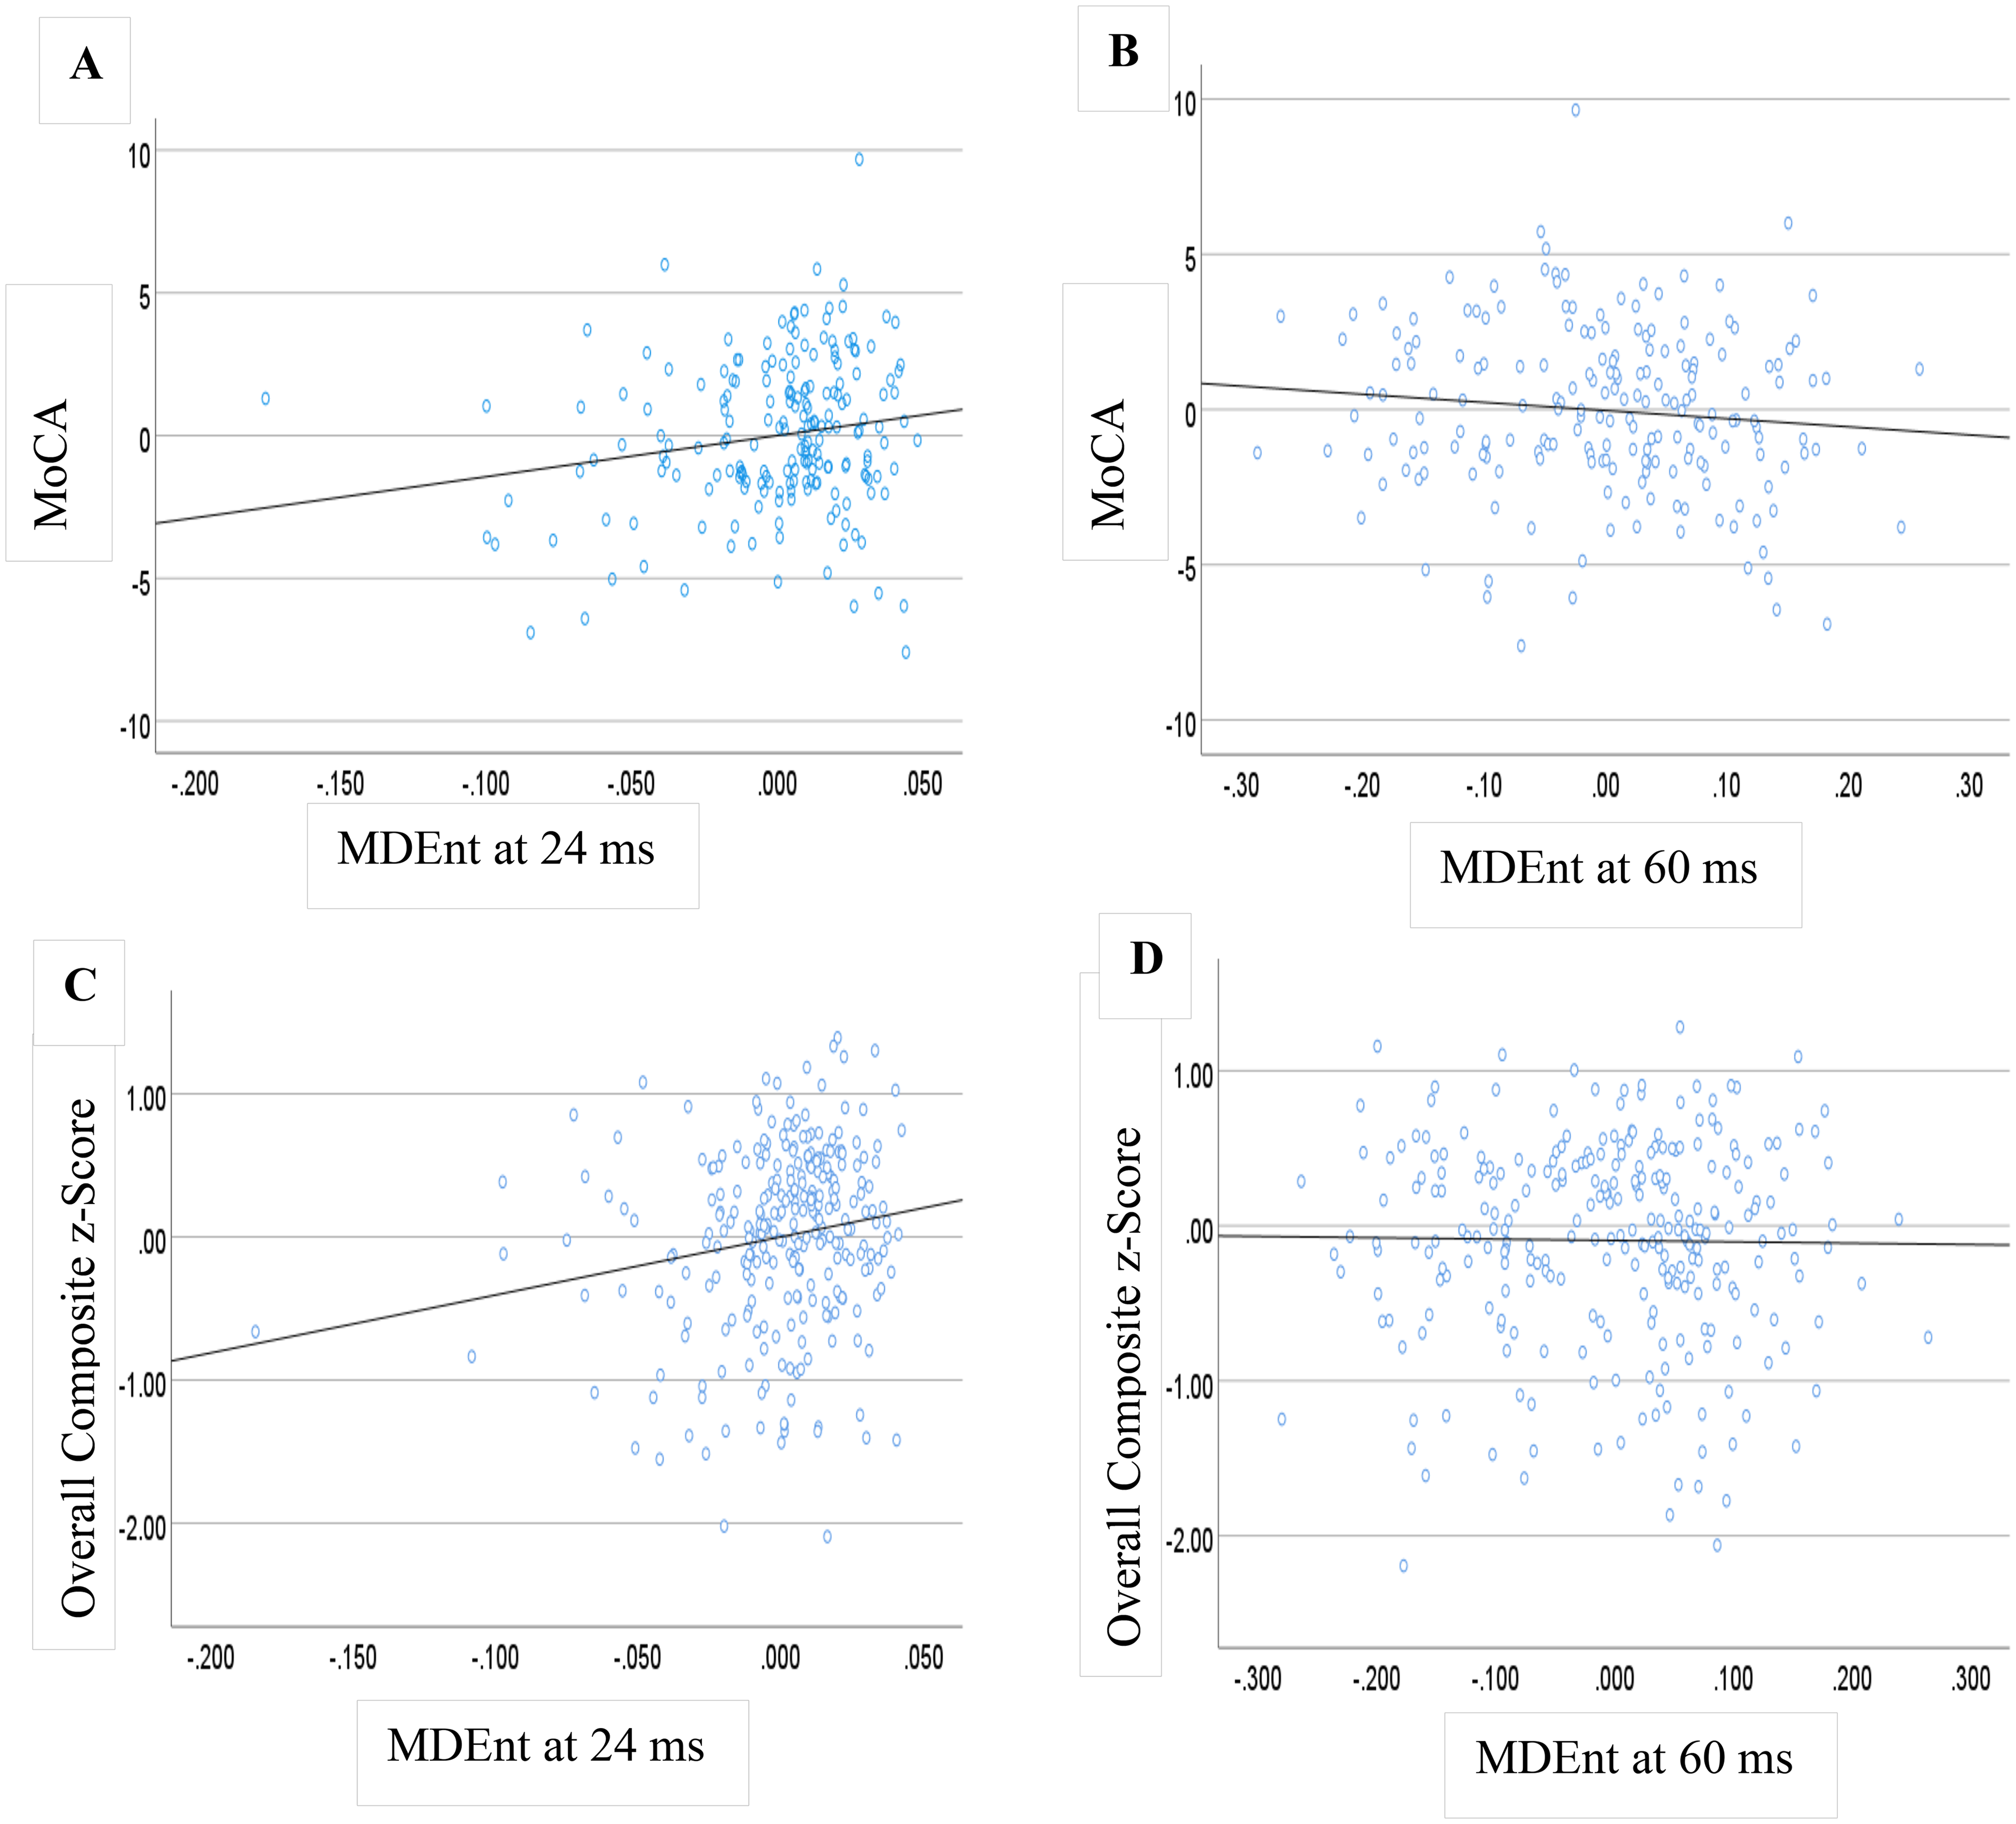
Multiscale dispersion entropy (MDEnt) and cognition. Partial regression plots demonstrating the associations between MDEnt at time scale 24 ms and 60 ms and the Montreal Cognitive Assessment (MoCA) total score (A and B) among AD, MCI, and HC participants, and overall composite in (C and D) among MCI, rMDD, rMDD + MCI, and HC participants. AD: Alzheimer's disease; HC: healthy controls; MCI: mild cognitive impairment; rMDD: remitted major depressive disorder.
MoCA: F (4, 193) = 84.68, p < 0.001, R square = 0.637, B for MDEnt at scale 24 ms = 14.368, t = 2.464, p = 0.015
MoCA: F (4, 193) = 81.22, p < 0.001, R square = 0.627, B for MDEnt at scale 60 ms = −2.309, t = −1.289, p = 0.199
For HC, MCI, rMDD, and rMDD + MCI:
Overall composite: F (4, 268) = 37.70, p < 0.001, R square = 0.360, B for MDEnt at scale 24 ms = 4.049, t = 2.890, p = 0.004
Overall composite: F (4, 268) = 27.00, p < 0.001, R square = 0.287, B for MDEnt at scale 60 ms = 0.334, t = 0.853, p = 0.394
Multiscale sample entropy (MSEnt) temporal dynamics
Across temporal electrodes, MSEnt exhibited the expected nonlinear pattern of increasing entropy at short time scales followed by a gradual decline toward longer scales (Supplemental Figure 5). This pattern was consistent across diagnostic groups. Although AD showed slightly elevated entropy values at longer scales and mildly reduced values at the shortest scales, the trajectories of all groups overlapped considerably at the lower scale factors and at the larger scale factors the differences with the AD group were smaller with MSEnt than with MDEnt. These modest differences indicate that MSEnt provides limited group separation, in contrast with the clearer divergence observed for MDEnt across comparable scales (Figure 1).
Group differences at short scale (24 ms) for Hc versus MCI versus Ad
At the short scale of 24 ms (scale factor = 6), analysis of covariance controlling for age and education did not reveal a significant main effect of diagnostic group (F(2, 194) = 2.35, p = 0.098, partial η2 = 0.024). Pairwise comparisons were nonsignificant for all contrasts (AD–HC: p = 0.117; AD–MCI: p = 0.188; HC–MCI: p = 1.000) (Supplemental Figure 6).
Group differences at short scale (24 ms) for Hc versus rMDD versus MCI versus MCI + rMDD versus Ad
ANCOVA showed a significant main effect of group, F(4, 309) = 3.57, p = 0.007 (Supplemental Figure 7). Estimated marginal means were: HC = 1.976 ± 0.006, rMDD = 1.987 ± 0.006, MCI = 1.971 ± 0.004, rMDD + MCI = 1.980 ± 0.005, AD = 1.956 ± 0.007. Bonferroni-corrected pairwise comparisons indicated AD < rMDD (p = 0.006, Cohen's d ≈ 0.80) and AD < MCI + rMDD (−0.024 ± 0.008, p = 0.031, Cohen's d ≈ 0.62); contrasts with HC (p = 0.263, Cohen's d ≈ 0.52) and MCI p = 0.466, Cohen's d ≈ 0.39) were not significant. Differences among the non-AD groups were not significant after Bonferroni adjustment (all p ≥ 0.218).
Group differences at long scale (60 ms) for Hc versus rMDD versus MCI versus MCI + rMDD versus Ad
The 60 ms scale (scale factor = 15) revealed a significant main effect of group (F(4, 309) = 10.07, p < 0.001) (Supplemental Figure 8). Bonferroni-corrected post-hoc tests demonstrated that the AD group displayed higher entropy values than all other groups (AD–HC, p < 0.001; AD–rMDD, p < 0.001; AD–MCI, p < 0.001; AD–rMDD + MCI, p < 0.001), with large effect sizes (Cohen's d ≈ 1.0–1.3). No other between-group differences reached significance.
Associations between MSEnt and cognitive performance for Hc versus rMDD versus MCI versus MCI + rMDD versus Ad
Linear regression models did not show significant associations between MSEnt and MoCA and overall composite scores as follows (Supplemental Figure 9):
For HC, MCI, and AD:
MoCA: F (4, 193) = 80.90, p < 0.001, R square =0.626, B for MSEnt at scale 24 ms = 3.214, t = 0.639, p = 0.524
MoCA: F (4, 193) = 82.71, p < 0.001, R square = 0.632, B for MSEnt at scale 60 ms = −2.935, t = −1.767, p = 0.079
For HC, MCI, rMDD, and rMDD + MCI:
Overall composite: F (4, 268) = 34.62, p < 0.001, R square = 0.341, B for MSEnt at scale 24 ms = 0.521, t = 0.493, p = 0.623
Overall composite: F (4, 268) = 34.59, p < 0.001, R square = 0.340, B for MSEnt at scale 60 ms = −0.145, t =−0.397, p = 0.692
Stability of MDEnt versus MSEnt
To empirically compare stability, we computed CV% (=100 × SD/Mean) for MDEnt and MSEnt across participants within each diagnostic group at 24 ms and 60 ms using identical preprocessing and parameters (Supplemental Table 1). At both scales and in every group, MDEnt showed lower CV% than MSEnt: 24 ms—HC 0.78% versus 2.03%, rMDD 0.51% versus 1.71%, MCI 0.93% versus 1.93%, rMDD + MCI 0.70% versus 1.70%, AD 1.54% versus 2.49%; 60 ms—HC 3.41% versus 6.13%, rMDD 3.29% versus 5.67%, MCI 3.83% versus 7.00%, rMDD + MCI 3.18% versus 5.92%, AD 2.98% versus 6.63%. This uniform, group-by-group pattern indicates that MDEnt is consistently more numerically stable than MSEnt at both short and long time scales.
Discussion
In this first study examining MDEnt in older adults with AD or with any of MCI, rMDD, or rMDD + MCI as risk conditions for AD, we found that MDEnt at a short time scale is lower in AD than in MCI and in MCI than in HC older adults. A diagnosis of rMDD without MCI did not impact MDEnt, as participants with rMDD and intact cognition did not differ from HC participants, and participants with rMDD and MCI did not differ from those with MCI alone. In contrast to MDEnt at a short time scale, MDEnt at a long time scale only differentiated the AD group (higher value) from all other groups. Lastly, we found that MDEnt at the short but not the long time scale was associated with cognition.
Our findings of reduced complexity at a short time scale in AD and MCI are consistent with previous literature,9,15–18,20 including literature demonstrating decreased power within the alpha and low beta frequencies among individuals with AD.4,6,9,15–19,21 Our study expands current knowledge to a more diverse and larger group of individuals with MCI and using MDEnt as a more powerful entropy method. In contrast, rMDD status did not impact this measure, suggesting that entropy at short time scale is more closely associated with cognitive impairment rather than a disease state that increases the risk for cognitive impairment or dementia. The associations between MDEnt at a short time scale and cognitive performance are in support of this interpretation.
The lack of differentiation among clinical groups at a long time scale (60 ms) for MDEnt, except for a higher MDEnt in the AD group, suggests that complexity at this time scale is affected only in advanced stages of cognitive impairment. The long scale MDEnt may reflect broader, more stable brain network connectivity that is not affected until the later stages of disease progression. In fact, long time scale MDEnt may reflect broader, more stable brain network connectivity that requires an advanced disease state to start being affected. In AD, this increased entropy at long time scale could be indicative of widespread disruptions in neural circuitry and reduced synchrony among brain regions, reflecting the diffuse nature of neurodegenerative changes. These disruptions may lead to increased variability in long time scale MDEnt, as the brain's ability to maintain stable, organized activity becomes impaired. Conversely, at earlier stages of cognitive decline, such as MCI, the brain may still exhibit relatively preserved global complexity, making it harder to distinguish from healthy controls based on long time scale measures.7,12,13 Additionally, since the long time scale MDEnt findings are unrelated to cognitive performance in our data, it reinforces the idea that these measures may capture overarching alterations in brain dynamics that are more evident in later stages of AD, rather than reflecting subtle cognitive changes at earlier stages. Further longitudinal research is needed to find how these changes in the short and long time scales relate to the progression of neurodegenerative diseases and their impact on overall brain function.
The lack of a significant difference between the HC and rMDD groups in our study for MDEnt at time scales 24 or 60 ms may be attributed to the composition of our rMDD dataset, which involves elderly individuals with remitted MDD. In contrast, the earlier study concerning HC and MDD involved young subjects with acute MDD. 31 In addition, given that these participants were in remission, our findings may be indicative of the MDD related cognitive function rather than their mood state.
While our study focused on AD, the MDEnt patterns observed may not be AD-specific. Different dementia syndromes exhibit distinct pathophysiological mechanisms that could differentially affect brain complexity. For instance, frontotemporal dementia primarily affects frontal and temporal regions and might show different spatial patterns of complexity changes. Lewy body dementia, with its characteristic fluctuating cognition and visual hallucinations, might exhibit more variable complexity patterns. Vascular dementia, resulting from cerebrovascular pathology, could show focal complexity changes corresponding to affected vascular territories. Future research should systematically compare MDEnt patterns across different dementia syndromes to determine whether specific complexity signatures could aid in differential diagnosis.
At 24 ms, MDEnt showed a clear ordering (HC > MCI > AD) with a large group effect (F(2194) = 17.83, p < 0.001) and a significant association with MoCA (t = 2.464, p = 0.015), whereas MSEnt showed no main effect and no association with cognition. At 60 ms, both metrics distinguished AD from other groups, but only MDEnt preserved the scale-dependent inversion (lower entropy at short scales, higher at long scales), while MSEnt captured only the long-scale elevation. Across both cognitive outcomes—MoCA (HC/MCI/AD) and the overall composite (HC/MCI/rMDD/MCI + rMDD)—only MDEnt at 24 ms showed a reliable partial effect, whereas MSEnt did not at 24 ms or 60 ms. Consequently, MDEnt demonstrated stronger group discrimination and the only significant partial association with cognition.
We note limitations to our study. First, we had relatively small sample sizes for the AD, HC and rMDD groups compared to the other groups. Second, the diagnosis of AD in our study was based on clinical assessment and did not incorporate biomarkers of AD. Nevertheless, a clinical diagnosis of AD based on the NINCDS-ADRDA criteria has been suggested to be highly trustworthy.61,62 Third, we analyzed relatively short EEG recordings (10 min with at least 6 min of clean data after preprocessing). While this duration is standard in clinical EEG studies and sufficient for entropy analysis, longer recording durations could provide more robust estimates of brain complexity and better capture temporal dynamics. Fourth, the cross-sectional nature of our study limits our ability to track how MDEnt evolves with disease progression. Longitudinal studies are needed to determine whether early changes in complexity can predict future cognitive decline. Fourth, we focused our analysis on temporal lobe electrodes based on their relevance to AD pathology; however, whole-brain analysis could reveal additional spatial patterns of complexity changes.
Future research should explore several promising avenues. Combining MDEnt with other EEG features based on power spectrum analysis and functional connectivity could determine whether these measures complement each other and lead to higher classification accuracy. Additionally, investigating the relationships between MDEnt, spectral power, and connectivity measures could provide insights into the neurophysiological mechanisms underlying complexity changes. Machine learning approaches integrating multiple EEG features could potentially develop more robust diagnostic tools. Finally, examining MDEnt as a treatment response biomarker could help monitor intervention efficacy in clinical trials for cognitive impairment.
Conclusions
This study makes several main contributions to EEG analysis and cognitive disorders. First, by evaluating MDEnt across a large dataset including HC, MCI, and AD, we provide a robust assessment of how brain complexity at both short (reflecting local processing) and long (reflecting global processing) time scales vary among these groups. Second, we found that rMDD, despite being a risk factor for dementia, does not significantly affect MDEnt. Lastly, our findings underscore the importance of the short time scale MDEnt as a sensitive marker for cognitive function.
Footnotes
Acknowledgements
We gratefully acknowledge the contributions of our research team and clinical partners at CAMH for their assistance in data acquisition, study coordination, and scientific guidance. We also thank the participants and their families for their involvement in this research.
Ethical considerations
All research procedures involving human subjects were done in accord with the ethical standards of the Helsinki Declaration of 1975, and under a protocol approved by our hospital's Institutional Review Board (CAMH: The Centre for Addiction and Mental Health, Toronto, ON, CA).
Consent to participate
All participants provided written informed consent as approved by the local Research Ethics Board and Clinical Trials Ontario.
Consent for publication
All participants provided written informed consent as approved by the local Research Ethics Board and Clinical Trials Ontario.
Author contribution(s)
Funding
The authors disclosed receipt of the following financial support for the research, authorship, and/or publication of this article: This work was funded by Brain Canada, a Canada Research Chair, and the Labatt Family Network for Research on the Biology of Depression.
Declaration of conflicting interests
The authors declared the following potential conflicts of interest with respect to the research, authorship, and/or publication of this article: AJF has received grant support from the US National Institutes of Health, the Patient-Centered Outcomes Research Institute, the Canadian Institutes of Health Research, Brain Canada, the Ontario Brain Institute, the Alzheimer's Association, AGE-WELL, the Canadian Foundation for Healthcare Improvement, and the University of Toronto. BHM holds and receives support from the Labatt Family Chair in Biology of Depression in Late-Life Adults at the University of Toronto. He currently receives research support from Brain Canada, the Canadian Institutes of Health Research, the CAMH Foundation, the Patient-Centered Outcomes Research Institute (PCORI), the US National Institute of Health (NIH), Capital Solution Design LLC (software used in a study funded by CAMH Foundation), and HAPPYneuron (software used in a study funded by Brain Canada). Within the past five years, he has also received research support from Eli Lilly (medications for an NIH-funded clinical trial) and Pfizer (medications for an NIH-funded clinical trial). He has been an unpaid consultant to Myriad Neuroscience. BGP receives research support from the Peter & Shelagh Godsoe Endowed Chair in Late-Life Mental Health, CAMH Foundation and Discovery Fund, National Institute of Aging, Brain Canada, the Canadian Institutes of Health Research, the Alzheimer's Drug Discovery Foundation, the Ontario Brain Institute, the Centre for Aging and Brain Health Innovation, the Bright Focus Foundation, the Alzheimer's Society of Canada, the W. Garfield Weston Foundation, the Weston Brain Institute, the Canadian Consortium on Neurodegeneration in Aging and Genome Canada. BGP receives honoraria from the American Geriatrics Society and holds United States Provisional Patent No. 16/490,680 and Canadian Provisional Patent No. 3,054,093 for a cell-based assay and kits for assessing serum anticholinergic activity. CEF receives grant funding from the following sources: Vielight Inc, Hoffman La Roche, Novo-Nordisk, CIHR-CCNA, Mitochondrial Innovation Initiative, NIH, Brian Canada, the Weston Foundation, St. Michaels Hospital Foundation Heather and Eric Donnelly Endowment. CRB has received grant support from Pfizer, Lundbeck, and Takeda in the past 5 years. DMB has received research support from CIHR, NIH, Brain Canada and the Temerty Family through the CAMH Foundation and the Campbell Family Research Institute. He received research support and in-kind equipment support for an investigator-initiated study from Brainsway Ltd. He is the site principal investigator for three sponsor-initiated studies for Brainsway Ltd. He also receives in-kind equipment support from Magventure for two investigator-initiated studies. He received medication supplies for an investigator-initiated trial from Indivior. LM has received research funding from the Alzheimer's Society of Canada, Centre for Aging and Brain Health Innovation, Ontario Ministry of Health and Long-Term Care, and Brainsway, Ltd. TKR has received research support from Brain Canada, Brain and Behavior Research Foundation, BrightFocus Foundation, Canada Foundation for Innovation, Canada Research Chair, Canadian Institutes of Health Research, Centre for Aging and Brain Health Innovation, National Institutes of Health, Ontario Ministry of Health and Long-Term Care, Ontario Ministry of Research and Innovation, and the Weston Brain Institute. TKR also received in-kind equipment support for an investigator-initiated study from Magstim, and in-kind research accounts from Scientific Brain Training Pro. TKR participated in 2021 and 2022 in an advisory board for Biogen Canada Inc. HA, MPM, MR, HB, RZ, NH, SK, and DG report no competing interests.
Data availability statement
The data generated and analyzed in the study is available from the corresponding author upon reasonable request.
Supplemental material
Supplemental material for this article is available online.
References
Supplementary Material
Please find the following supplemental material available below.
For Open Access articles published under a Creative Commons License, all supplemental material carries the same license as the article it is associated with.
For non-Open Access articles published, all supplemental material carries a non-exclusive license, and permission requests for re-use of supplemental material or any part of supplemental material shall be sent directly to the copyright owner as specified in the copyright notice associated with the article.