
Abstract
Background
Sensory impairments are associated with cognitive decline and Alzheimer's disease risk.
Objective
We studied how sensory function and cognitive change varied by race/ethnicity in Hispanic, non-Hispanic Black (NHB), and non-Hispanic White (NHW) older US adults.
Methods
We studied 2799 individuals, 57–85 years-old, in the National Social Life, Health, and Aging Project with baseline sensory and follow-up Montreal Cognitive Assessment (MoCA) information from 2005–2016. Hearing was interviewer-rated; vision, smell, taste, and touch were objectively measured. Senses were categorized (poor, moderate, normal); number of poor senses (impairment) was summed. Multivariable linear regressions evaluated the association between sensory impairments and cognition, adjusting for demographic and clinical variables. We tested for differences by race/ethnicity using interaction terms.
Results
Hispanic (n = 180) and NHB (n = 509) older adults had higher prevalence of ≥1 sensory impairments and lower cognition scores versus NHW respondents (n = 2110). Having multiple impairments significantly interacted with race/ethnicity such that estimates for the association with cognition was significantly lower for NHB versus NHW respondents (beta = −3.08, 95% CI: −5.14, −1.02; p = 0.004). Interactions were borderline significant for smell, where estimated difference in cognition associated with moderate (β=−0.91, 95% CI: −1.91, 0.10, p = 0.077) and poor (β=−1.33, 95% CI: −2.77, 0.11, p = 0.071) smell was lower for NHB versus NHW participants.
Conclusions
Our findings suggest racial/ethnic differences in how strongly sensory impairments predict cognition, especially for number of impairments and possibly smell. Further insight may reduce disparities in cognitive aging.
Introduction
Up to 94% of United States (US) adults aged 65 and older have loss of function in at least one sensory domain (e.g., hearing, vision, smell, taste, touch). 1 Sensory impairments affect quality of life and are associated with increased risk for cognitive decline, dementia, and other poor health outcomes.2–8 Previous studies have identified associations between cognition and individual sensory impairments in hearing,9,10 vision,11,12 smell, 13 and touch, 14 as well as multiple sensory deficits. 15 However, many prior studies have been conducted in White and European samples, or White and Black Americans. Few studies with sensory assessments have included Hispanic/Latino individuals or examined whether associations differ by race/ethnicity.16,17
Rates of dementia are 1.5 to 2 times higher in non-Hispanic Black Americans and Hispanic Americans compared to White individuals, and the prevalence of sensory impairments may also differ by race/ethnicity. 18 Additional research on racial differences in prevalence of sensory impairments might help clarify which groups are impacted disproportionately. From a public health standpoint, exploring racial and ethnic associations with health outcomes may accelerate efforts to reduce risk for cognitive decline in patients who are known to have sensory impairments. It is also important to understand the extent to which differences by race/ethnicity are driven by social determinants of health and/or higher late-life health burden of cardiovascular or other comorbidities.
The objective of this research was to study how sensory function (in vision, hearing, smell, taste, touch) and cognition varied by race and ethnicity in older, community-dwelling US adults. We studied Hispanic, non-Hispanic Black, and non-Hispanic White adults in the National Social Life, Health, and Aging Project (NSHAP) and examined correlations and interactions between race/ethnicity, sensory impairments, and cognitive function and decline.
Methods
Study sample
NSHAP is a population-based longitudinal study that examines the health and social well-being of community-dwelling older Americans.19,20 By obtaining a wide range of assessments, including on sensory function, chronic disease, and physical and cognitive health of older adults, NSHAP can provide healthcare professionals with insights into the multilevel factors that affect the overall health of older adults. 20 It might also be the first national survey to contain information on all five senses concurrently. 20 The National Opinion Research Center and University of Chicago conducted in-home interviews of older adults who were born in the United States between 1920–1947.1,20 2799 older male and female American adults aged 57 to 85 at time of recruitment comprised our analytic sample. Respondent data was collected in 2005 to 2006 through NSHAP Round 1 interviews. 21 Subsequent interviews of the participants were taken in Round 2 (conducted in 2010 to 2011) 22 and Round 3 (2015 to 2016). 23 Participants were excluded due to reporting Asian, Pacific Islander, American Indian, and/or Alaskan Native race (n = 193) because of the small count or not reporting race (n = 13).
Sensory function
Vision, hearing, smell, taste, and touch were tested in Round 1. We categorized participants into “normal”, “moderate”, and “poor” sensory function based on previously published cut-points. 1
Vision. Visual acuity was tested binocularly based on the Snellen eye chart 24 ; participants were instructed to wear glasses if they normally used them for distance vision. Visual acuity from 20/200 to 20/80 was defined as ‘poor’, 20/63 and 20/50 as ‘moderate’, and 20/40 to 20/10 as ‘normal’.
Hearing. Interviewers were instructed to “Please rate the respondent's functional health and behavior during the interview on the following scales: practically deaf versus normal hearing?” where 1 indicated practically deaf and 5 indicated normal. Cut points were as follows: a score of 1 or 2 was identified as ‘poor’, 3 was ‘moderate’, and 4 or 5 were ‘normal’ functioning. 24
Smell. To assess olfactory function, participants smelled scented pens of common odors: rose, leather, orange, fish, and peppermint.25,26 After smelling the scent, participants were shown four answer choices and asked to identify the presented scent. Odor identification was scored based on the number of errors from 0 to 5. Individuals who made 3, 4, or 5 errors were defined as having ‘poor’ functioning, 2 errors were defined as ‘moderate’, and 0 or 1 errors were defined as having ‘normal’ smell functioning.
Taste. Gustatory function was measured via tasting flavored paper strips that were sour, sweet, bitter, or salty. Respondents selected their response from these four choices. Like olfactory function scoring, cut points for taste were based on the number of errors. ‘Poor’ taste was defined as 3 or 4 errors, ‘moderate’ was 1 or 2 errors, and ‘normal’ functioning was 0 errors. 24
Touch. Tactile acuity was evaluated using single-point discrimination and two-point discrimination. 24 Participants were asked to indicate the number of points they felt. 2-point tests were administered at distances of 4 mm, 8 mm, and 12 mm on the skin. Individuals who correctly identified the single-point test, and the two-point 12 mm and two-point 8 mm tests, but not the two-point 4 mm test were identified as having ‘moderate’ touch functioning. Individuals who had correct responses on all four tests were categorized into ‘normal’ touch functioning. All other individuals were indicated as having ‘poor’ tactile functioning as long as they had no missing data.
Multiple. Among participants who completed all sensory tests, we categorized participants as having none, one, or multiple (2+) sensory impairments based on the number of senses with “poor” function. Participants also completed self-reported questionnaires for each sense, which we examined in secondary analyses.
Cognition
Cognition was measured using the Montreal Cognitive Assessment (MoCA) in Round 2 (∼5 years after Round 1) and Round 3 (∼5 years after Round 2) 27 (it was not assessed in Round 1). The MoCA was the only measurement of cognitive function administered in Round 2 and Round 3. The MoCA is a test of overall cognitive functioning, with components testing several cognitive domains, including memory, visuo-constructional skills, calculations, and others. 28 The MoCA has been validated as a sensitive tool for early detection of cognitive decline and mild cognitive impairment. 28 We examined cognition using Round 2 MoCA scores and cognitive change between Round 2 and Round 3 as separate continuous outcomes.
Other characteristics
Age at baseline of the respondent was calculated at Round 1 from date of birth. Sex, race, and Hispanic/Latino identity were self-reported. Race categories included ‘White/Caucasian’, ‘Black/African American’, ‘Asian, Pacific Islander, American Indian, or Alaskan Native’, ‘don’t know’, ‘refused’, or ‘not applicable’. Respondents were also asked whether they considered themselves Hispanic or Latino. Based on participant responses to race and Hispanic/Latino identity, ethnicity was designated in NSHAP as ‘White’, ‘Black’, ‘Hispanic, non-Black’, and ‘Other.’ We then categorized race/ethnicity as non-Hispanic White, Hispanic, and non-Hispanic Black. Education was categorized as the highest degree obtained, with options being ‘less than high school’, ‘high school/equivalent’, ‘vocational certificate / some college / association’, and ‘bachelors or more’. One of eight options was reported for household income: ‘0–24,999’, ‘25,000–49,999’, ‘50,000–99,999’, ‘100k or higher’, ‘refused’, ‘don’t know’, ‘not applicable’, ‘and ‘incomplete interview’. We pooled the last four responses (refused, don’t know, not applicable, and incomplete interview) into one category called ‘unknown’. Similarly, participants were asked whether they are covered by private insurance, with options being ‘no’, ‘yes,’ and we categorized all other responses as ‘unknown’ (refused, don’t know, not applicable, no answer, not returned). History of hypertension, diabetes, and stroke were self-reported at Round 1. Participants reported whether or not they ever smoked cigarettes regularly and if they smoke (coded as never, former, current). Similarly, respondents were asked if they ever drank alcohol regularly and if they drink alcohol (coded as never, former, current).
Statistical analyses
We performed descriptive statistics of demographic (age, sex, education, household income, private insurance) and clinical (hypertension, diabetes, stroke, smoking, drinking) characteristics by race/ethnicity. We also examined the prevalence of sensory impairments (vision, hearing, smell, taste, touch) by race/ethnicity. To inform whether any differences in prevalence of sensory impairments were driven by other demographic factors beyond race/ethnicity, we used logistic regressions to evaluate the association between race/ethnicity and each poor sensory impairment (versus normal or moderate) adjusting for age, sex, education, household income, and private insurance. Participants in the analytic sample had complete race, sensory, and cognitive test data.
We used linear regression models to evaluate associations between each sensory function and cognition at Round 2 for participants overall. Then, we further tested interactions between race/ethnicity and each sense. We examined race/ethnicity stratified estimates by each sensory level for any significant or borderline significant interactions, as well as overall interactions using a likelihood ratio test. We repeated analyses for the change in cognition from Round 2–3 (∼5 years). All regression models additionally adjusted for age, sex, education, race/ethnicity, comorbidities (hypertension, diabetes, stroke), smoking and alcohol use, household income, private insurance status, and time between Round 1 and Round 2; models of change in cognition also included adjustment for time between Round 2 and Round 3. The mean time between Round 3 and 2 was 5.05 years, with a standard deviation of 0.40. The mean time between Round 2 and 1 was 5.15 years, with a standard deviation of 0.42. Self-reported sensory function may capture different aspects of sensory loss and have a different relationship with cognition, so we examined self-reported sensory function as a secondary analysis. Analyses were conducted in R (version 4.3.0). All tests were two-sided with α = 0.05; we report 95% confidence intervals.
Institutional Review Boards at National Opinion Research Center at University of Chicago approved this study.
Data availability
All data from NSHAP Rounds 1, 2, and 3 are publicly available through the National Archive of Computerized Data on Aging (NACDA) https://www.icpsr.umich.edu/web/pages/NACDA/colectica-portal.html.
Results
Differences in participant characteristics by race/ethnicity
There were 2799 respondents that comprised our analytic sample, including Hispanic (N = 180), non-Hispanic Black (N = 509), and non-Hispanic White (N = 2110) participants, with mean age of 69. Table 1 shows demographics (age, sex, education, household income, private insurance) and prevalence of clinical variables (hypertension, diabetes, stroke, smoking cigarettes, drinking alcohol) for participants overall and by race/ethnicity. Hispanic and non-Hispanic Black participants were on average younger and less educated than non-Hispanic White participants; non-Hispanic Black participants also had higher prevalence of diabetes, stroke, and hypertension (Table 1). Of the respondents, non-Hispanic White individuals had the greatest prevalence of private insurance and the highest household income brackets. Habits for smoking cigarettes and drinking alcohol also varied by race/ethnicity. Hispanic respondents had the lowest prevalence of current smoking, and non-Hispanic Black respondents had the lowest prevalence of current drinking.
Participant characteristics.
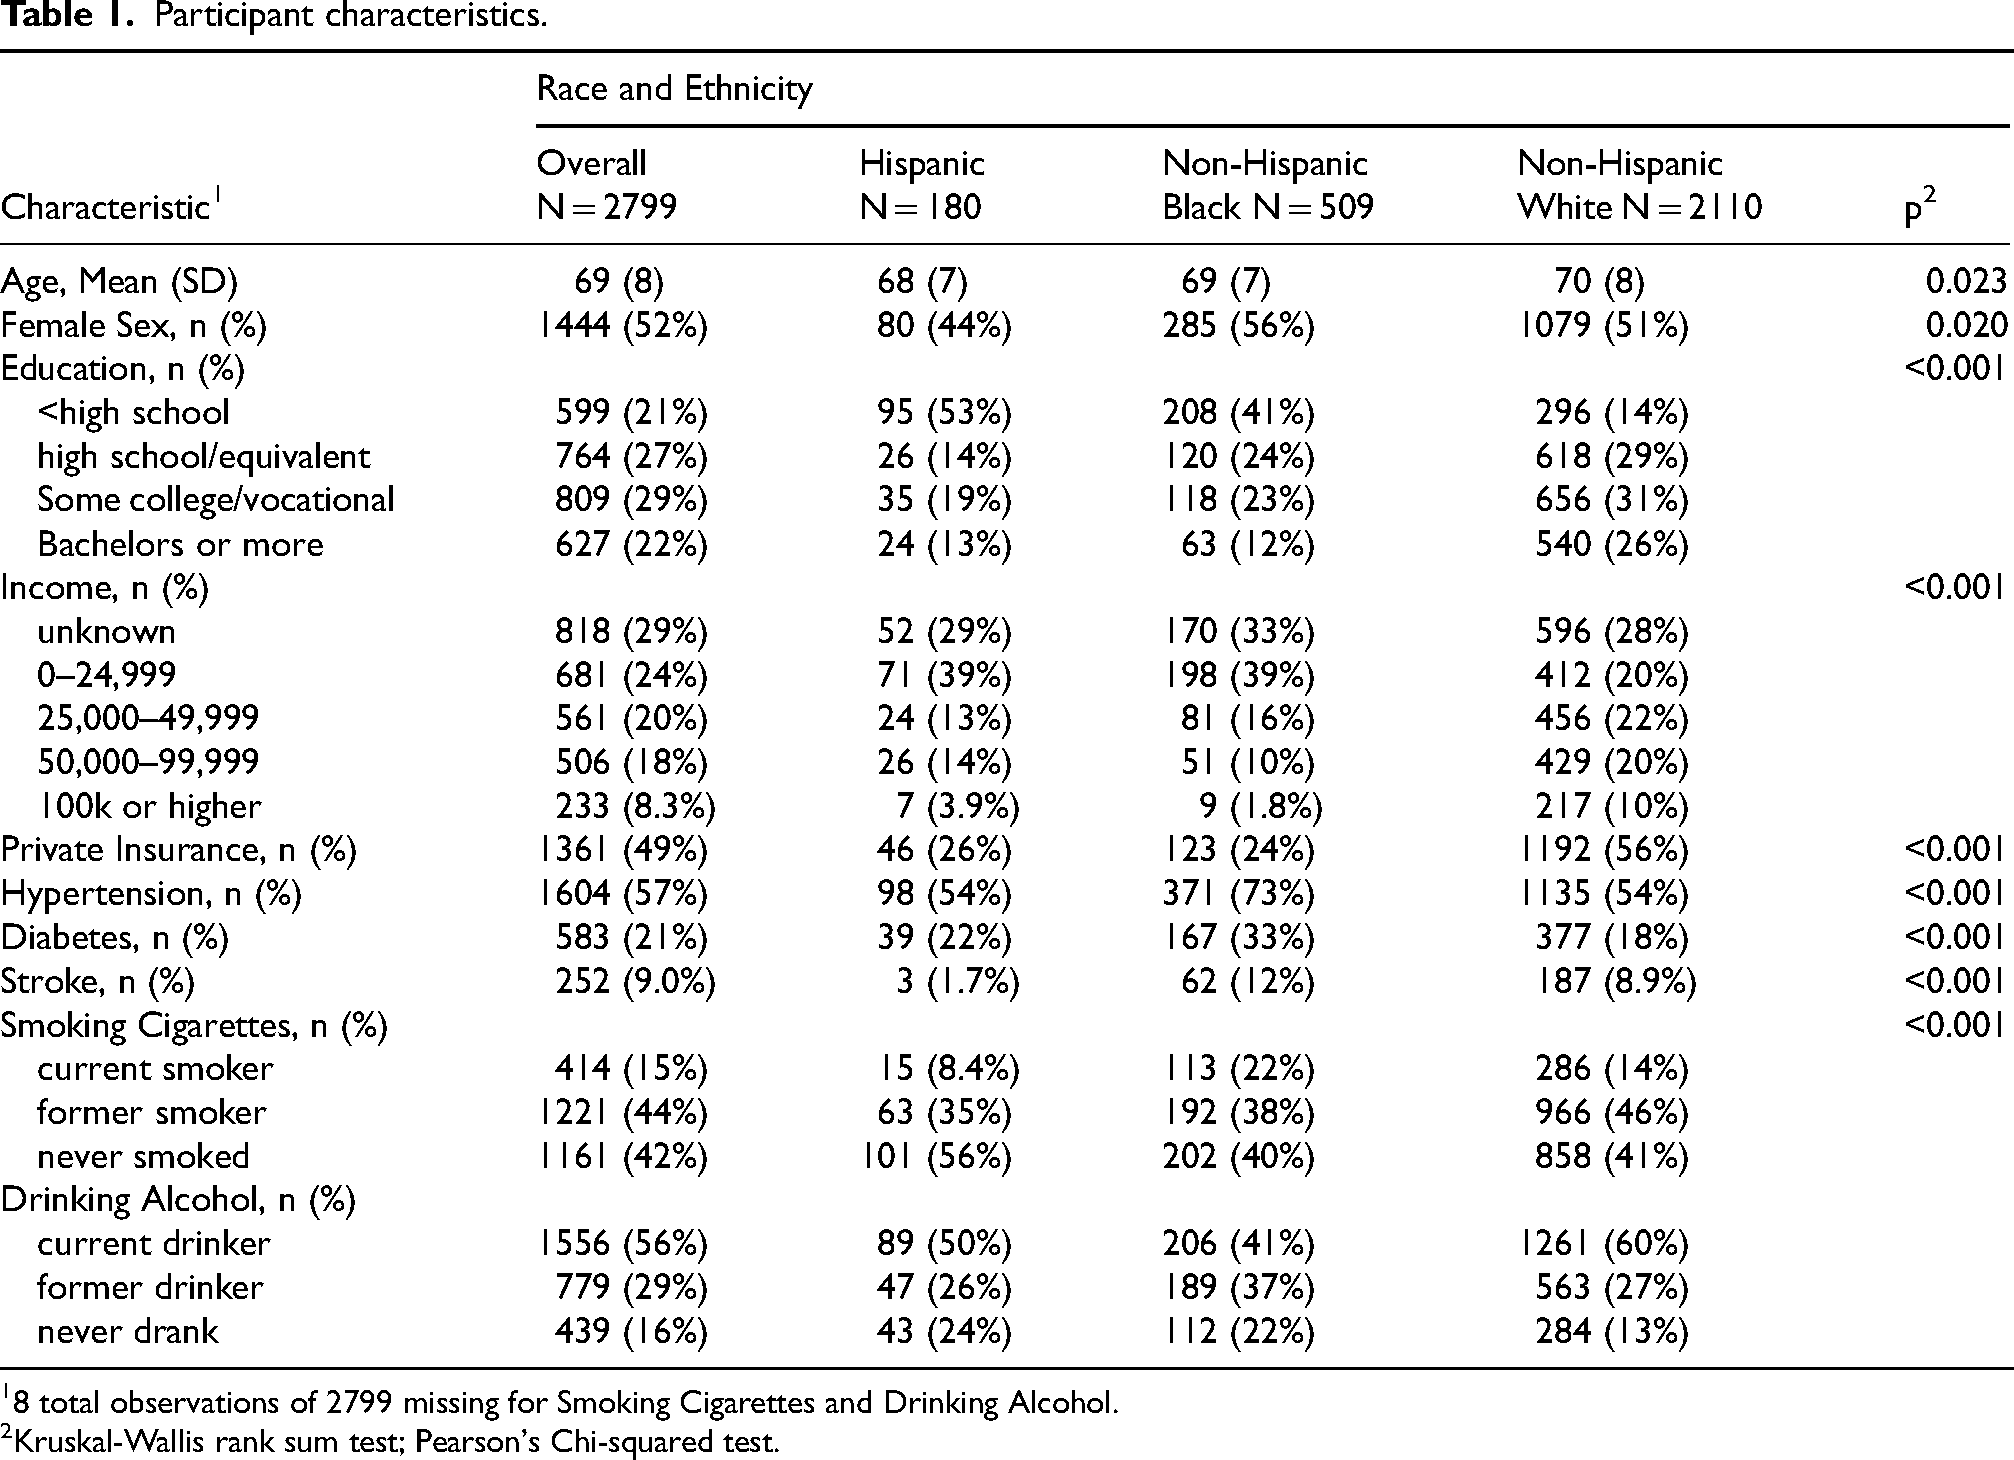
8 total observations of 2799 missing for Smoking Cigarettes and Drinking Alcohol.
Kruskal-Wallis rank sum test; Pearson's Chi-squared test.
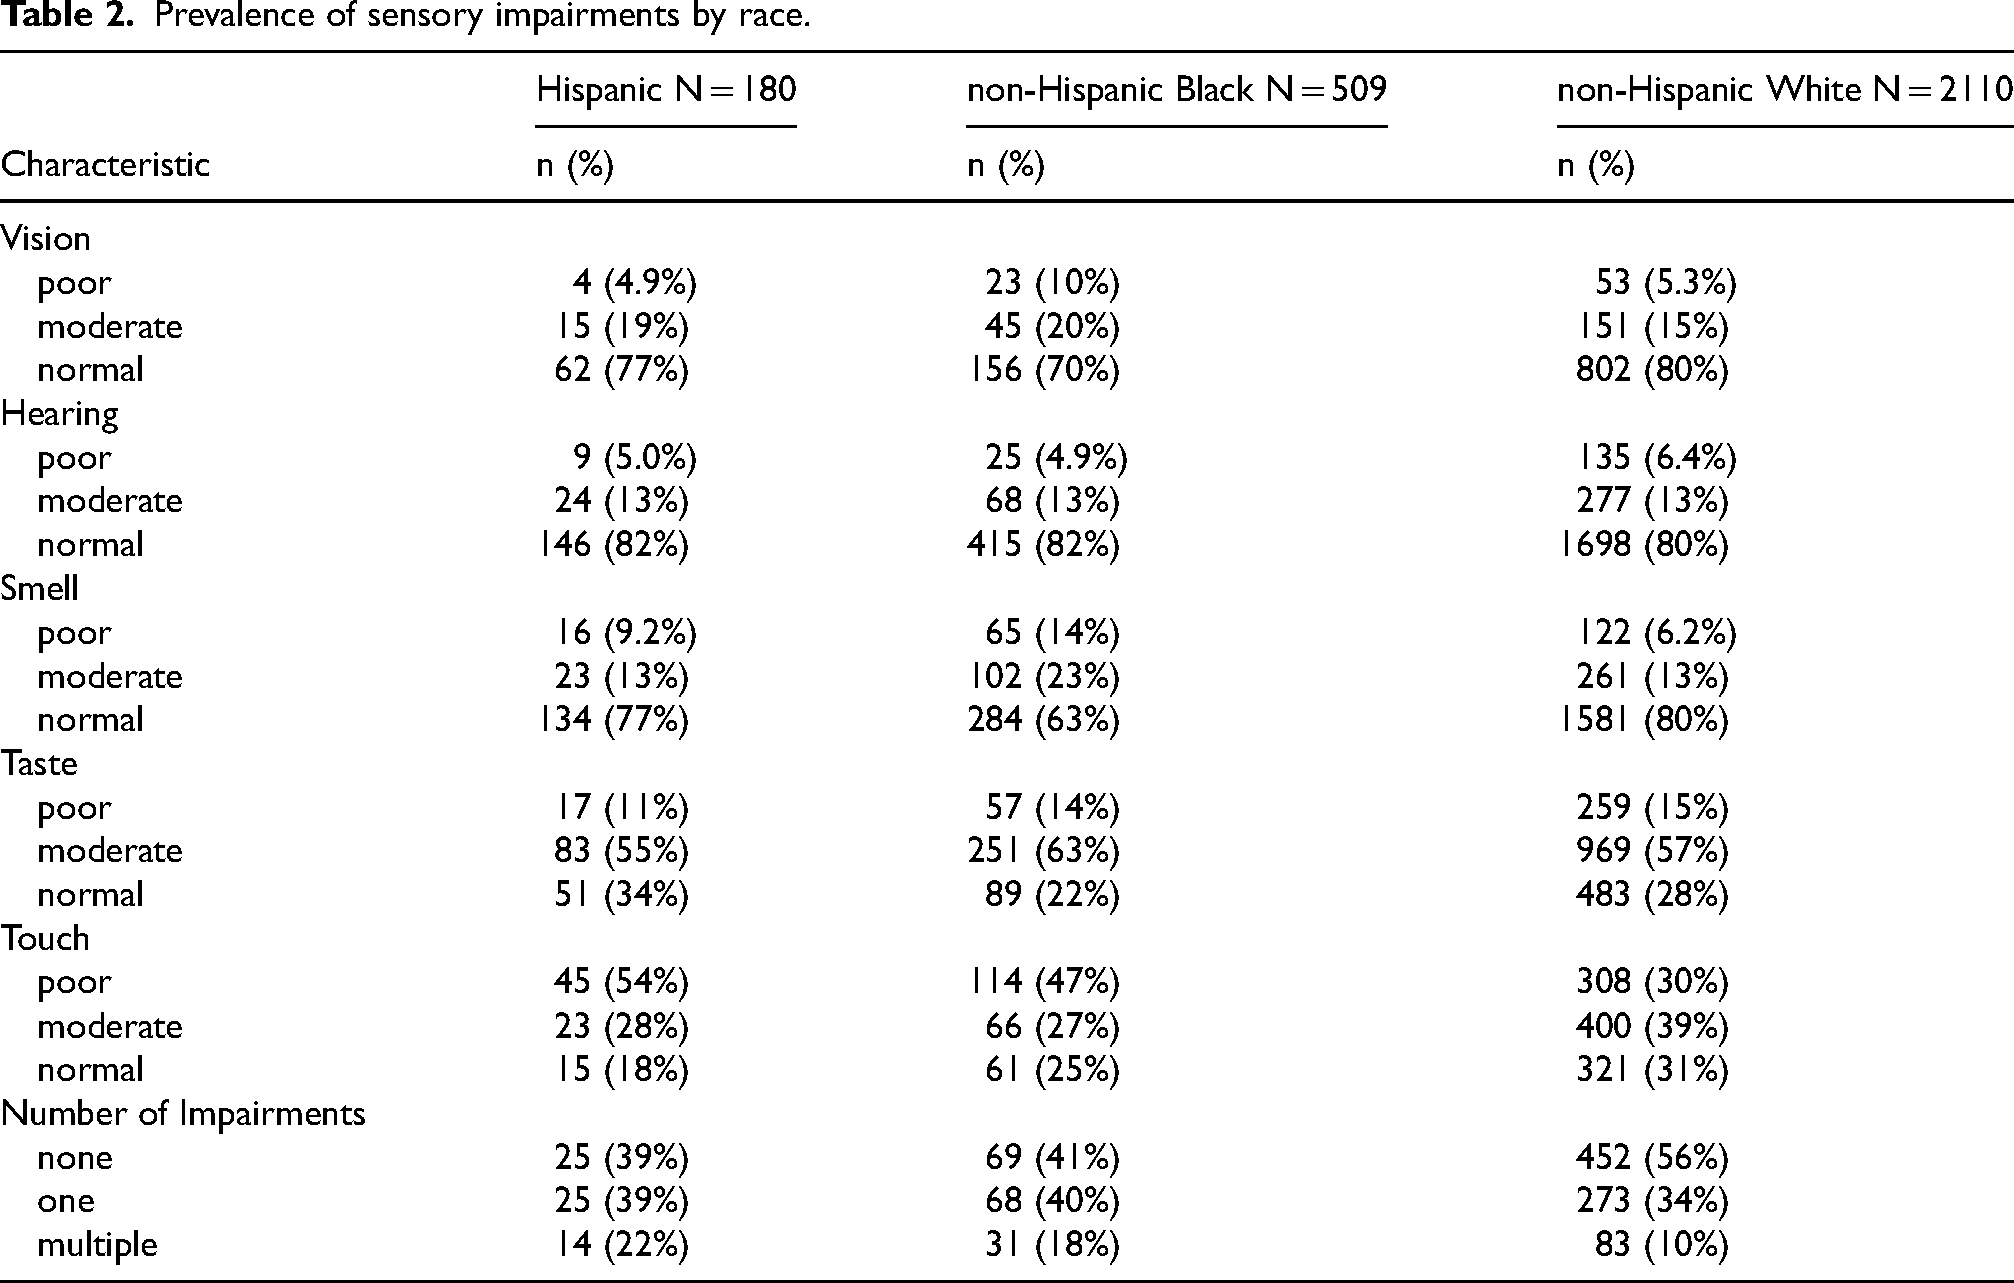
Hispanic and non-Hispanic Black participants tended to have worse sensory outcomes compared to non-Hispanic White participants (Table 2). Non-Hispanic Black participants had a higher prevalence of poor vision (10%), lower prevalence of poor hearing (4.9%), and higher prevalence of poor smell (14%) compared to Hispanic (4.9%, 5.0%, and 9.2%, respectively) and non-Hispanic White participants (5.3%, 6.4%, 6.2%). Hispanic and non-Hispanic Black individuals both had higher prevalence of poor touch (54% and 47%, respectively) and one or multiple impairments (61% and 58%) compared to non-Hispanic White individuals (poor touch: 30%, one or multiple impairments: 44%). Overall, moderate or poor sensory function was common, especially for touch and taste tests.
Prevalence of sensory impairments by race.
In exploratory models adjusting for age, sex, education, household income, and private insurance, there were still several significant disparities in sensory impairment prevalence by race, primarily comparing non-Hispanic Black individuals compared to non-Hispanic White individuals (Table 3). Hispanic individuals had significantly greater odds of touch impairment compared to non-Hispanic White individuals (2.03, 95% CI: 1.14, 3.81, p < 0.05). Non-Hispanic Black individuals had significantly greater odds of impaired vision (1.56, 95% CI: 1.07, 2.26, p < 0.05), smell (2.36, 95% CI: 1.83, 3.04, p < 0.05), and taste (1.37, 95% CI: 1.04, 1.82, p < 0.05), with odds of smell dysfunction being markedly higher compared to non-Hispanic White participants.
Associations of race/ethnicity with poor sensory function (outcomes).
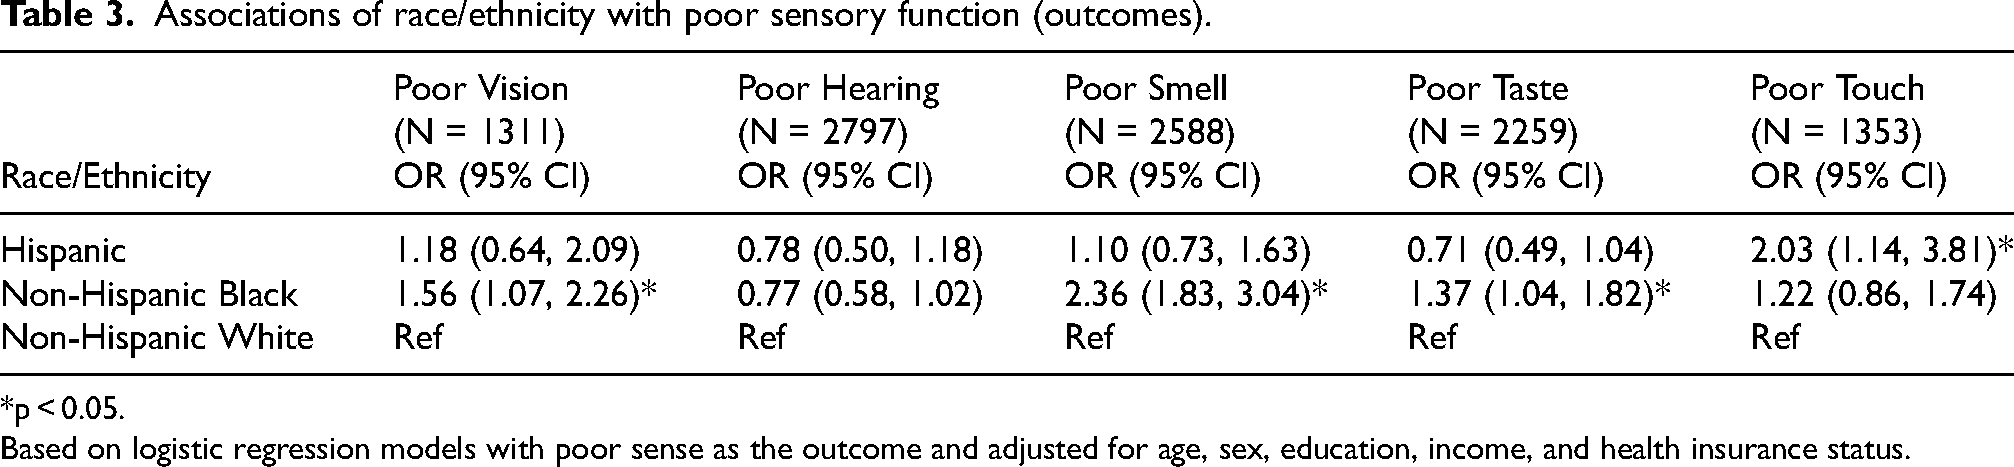
*p < 0.05.
Based on logistic regression models with poor sense as the outcome and adjusted for age, sex, education, income, and health insurance status.
Overall associations between sensory function and cognition
Among participants overall, moderate hearing function (−0.57, 95% CI: −0.99, −0.15, p < 0.01), moderate smell function (−0.77, 95% CI: −1.19, −0.36, p < 0.001), poor smell function (−0.84, 95% CI: −1.46, −0.21, p < 0.01), and poor taste function (−0.57, 95% CI: −1.03, −0.10, p < 0.05) were associated with worse cognition compared to normal function at Round 2 (Table 4). There were no significant associations between touch and vision with cognition at Round 2 (Table 4). Number of impairments was not overall associated with cognitive function, but we observed trends linking increased number of impairments with worse cognition. Trends were mostly negative for sensory impairments and cognitive outcomes (Table 4). The strength of the association was greatest for smell. For cognitive decline from Round 2 to 3, sample sizes were small, and estimates were inconsistent (Table 4). Only poor vision was associated with a significant decline in cognition from Round 2 to 3 (−1.92, 95% CI: −3.33, −0.51, p < 0.01).
Association between sensory impairments and cognitive outcomes at round 2 and 3 analyzed with linear regressions.
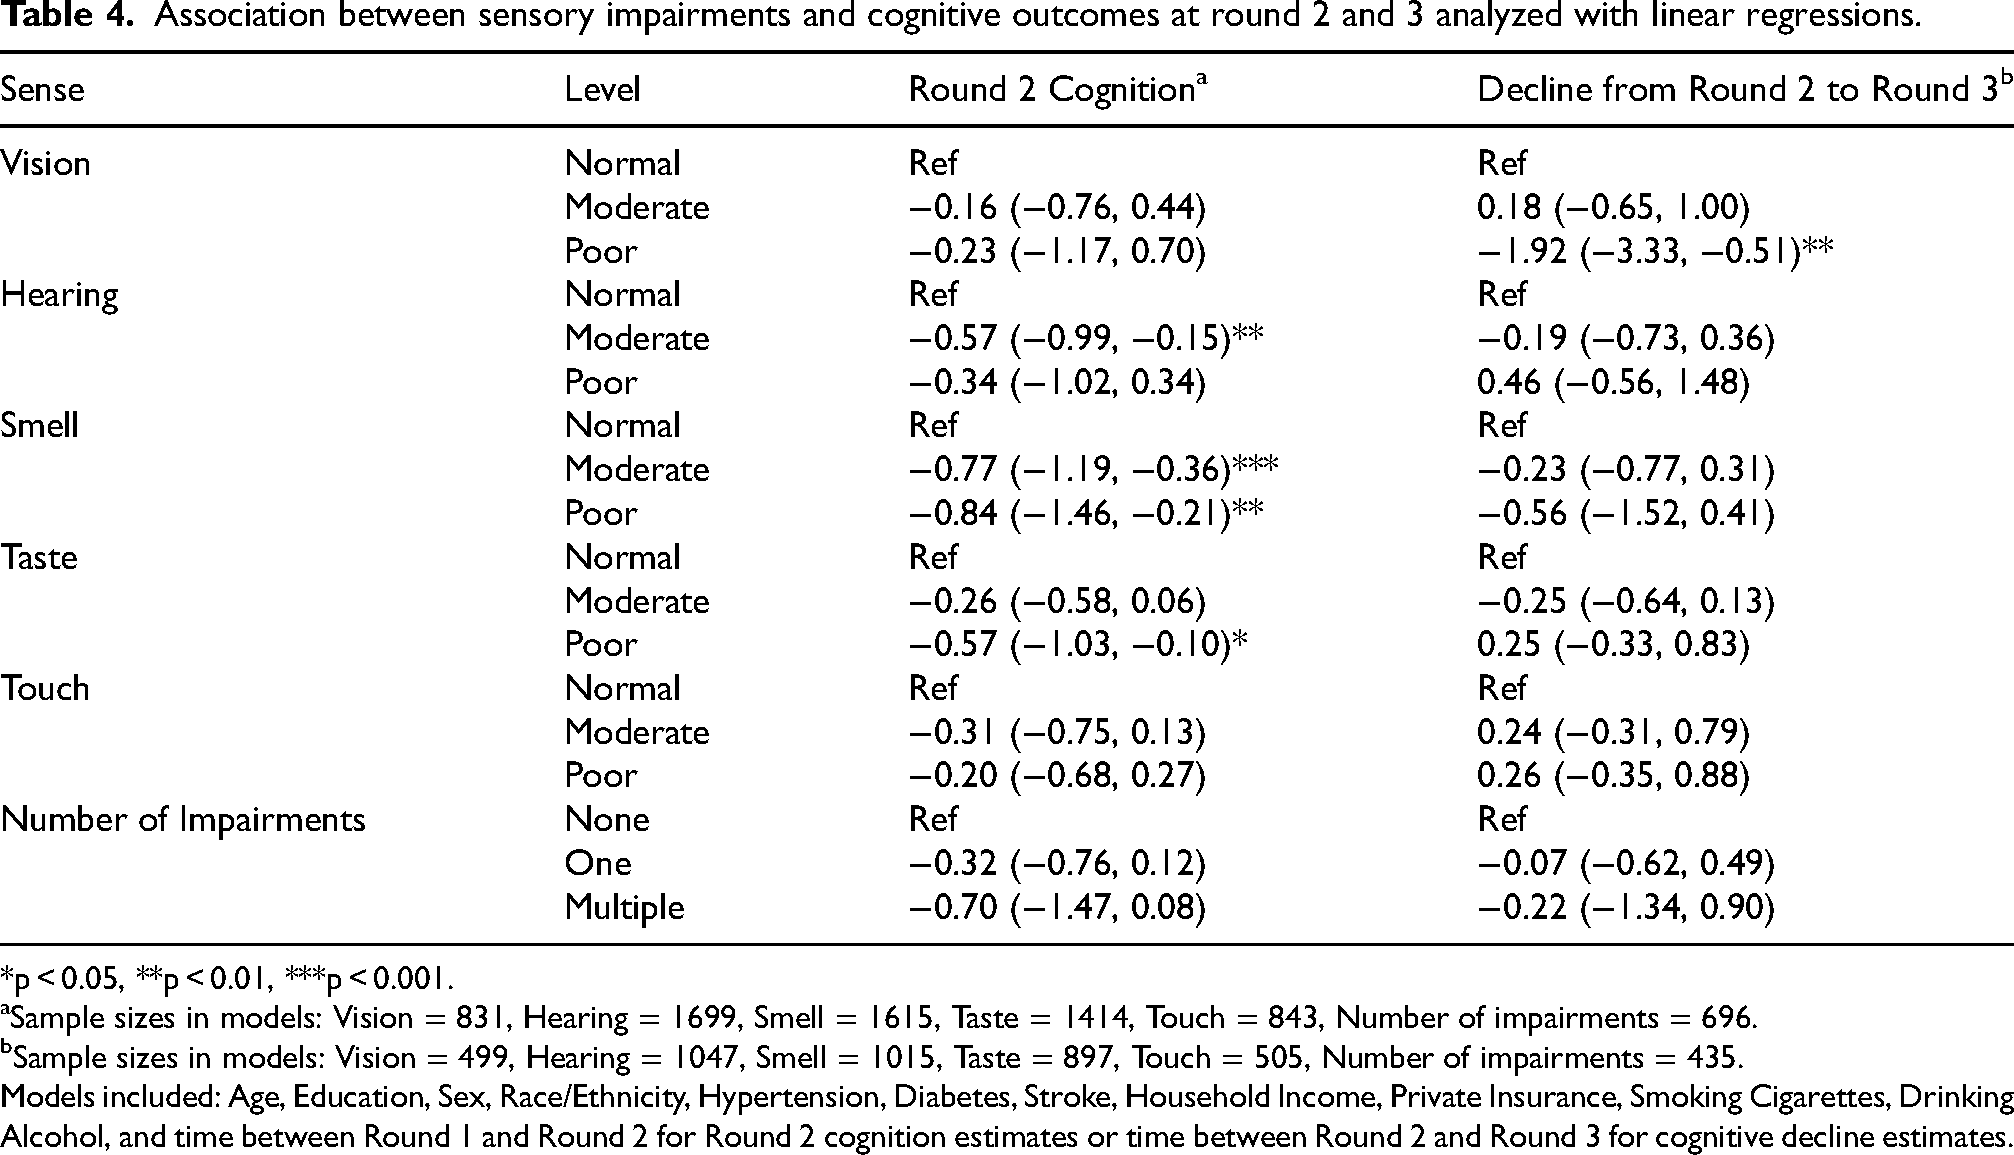
*p < 0.05, **p < 0.01, ***p < 0.001.
aSample sizes in models: Vision = 831, Hearing = 1699, Smell = 1615, Taste = 1414, Touch = 843, Number of impairments = 696.
bSample sizes in models: Vision = 499, Hearing = 1047, Smell = 1015, Taste = 897, Touch = 505, Number of impairments = 435.
Models included: Age, Education, Sex, Race/Ethnicity, Hypertension, Diabetes, Stroke, Household Income, Private Insurance, Smoking Cigarettes, Drinking Alcohol, and time between Round 1 and Round 2 for Round 2 cognition estimates or time between Round 2 and Round 3 for cognitive decline estimates.
We examined self-reported sensory function in a secondary analysis; results were generally not significantly associated with cognitive outcomes at Round 2 or cognitive decline from Round 2 to 3 (Supplemental Table 1), with the exception of poor vision for participants overall at Round 2 and moderate vision for participants overall from Round 2 to 3. Very few participants (n = 35) reported Parkinson's disease in Round 2, so we did not examine this as an explanatory variable further.
Interactions by race or ethnicity for sensory function and cognition
In models with Round 2 cognition as an outcome, we tested interactions with race/ethnicity for each of the sensory impairments at each level of functioning (Supplemental Table 2). The only trends for interactions by race/ethnicity were for smell and multiple sensory impairments, so we focused on these below. Moderate (−0.91, 95% CI: −1.91, 0.10, p = 0.077) and poor (−1.33, 95% CI: −2.77, 0.11, p = 0.071) smell functioning were borderline associated with lower cognition for non-Hispanic Black participants, compared to non-Hispanic White participants (Supplemental Table 2). Likewise, estimates for having one sensory impairment compared to none was also borderline associated with lower cognition for non-Hispanic Black compared to non-Hispanic White respondents (−1.19, 95% CI: −2.50, 0.12, p = 0.074) (Supplemental Table 3). Having multiple impairments was associated with significantly lower cognition for non-Hispanic Black participants (−3.08, 95% CI: −5.14, −1.02; p = 0.004), compared to non-Hispanic White participants (Supplemental Table 3).
Figure 1A and 1B illustrate the associations of smell and number of impairments, respectively, with cognition stratified by race/ethnicity. For both smell and multiple impairments, associations with cognition were minimal among non-Hispanic White participants and trends for worse sensory impairment and cognition were most pronounced among non-Hispanic Black participants with Hispanic participants in between. Furthermore, trends were graded such that the poor smell and multiple impairments had the highest estimated magnitude of association. Confidence intervals were wider for the smaller sample of Hispanic participants. We also examined adjustments for additional demographic and clinical variables (e.g., hypertension, diabetes, stroke, private insurance, smoking cigarettes, and drinking alcohol) to determine if interactions were explained by other factors; while estimates after adjustment for clinical variables were less precise, trends were similar.
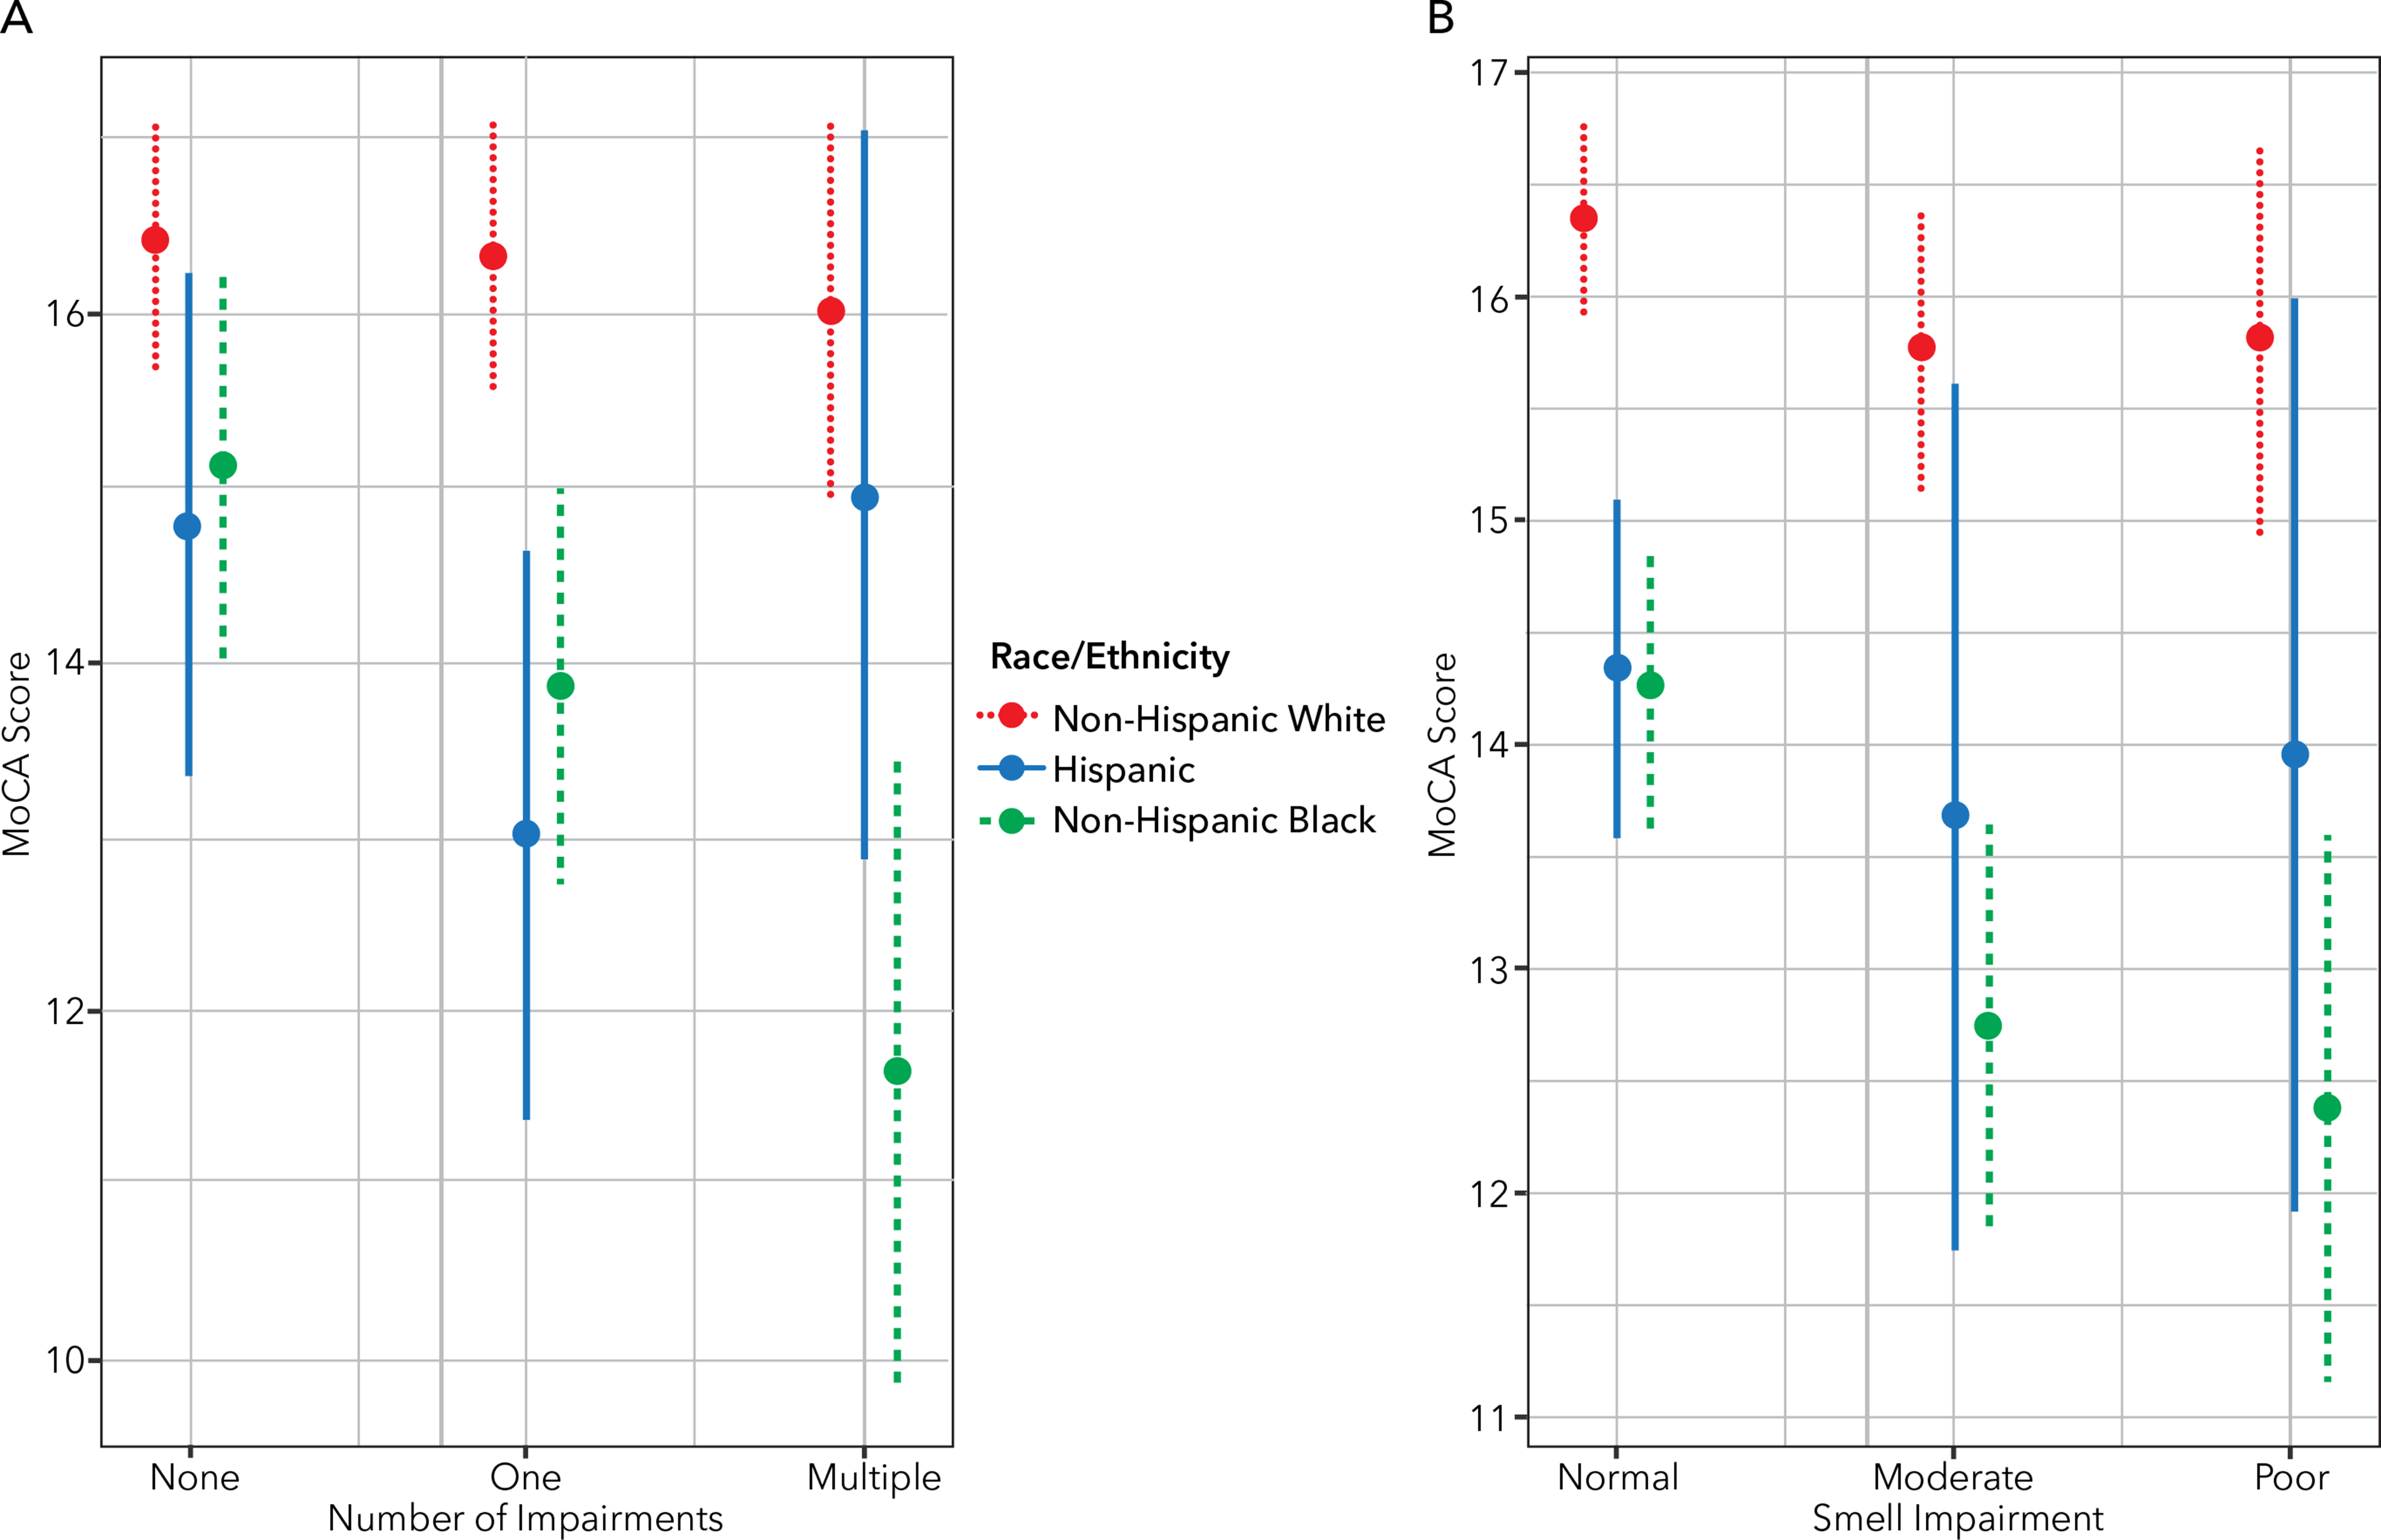
Interactions of race/ethnicity with number of impairments (A) and smell (B) on associations with cognition. Round 2 MoCA scores were predicted by number of impairments and smell impairments and their interactions with race/ethnicity, adjusted for age, education, sex, household income, and time between Round 1 and Round 2 of data collection.
Discussion
We studied the relationships between sensory impairments, cognition, and race/ethnicity in a well-described population-based study of older US adults with multiple measures of sensory function. Our results demonstrated that traditionally underrepresented populations, including non-Hispanic Black and Hispanic participants, trended towards worse levels of sensory impairments compared to non-Hispanic White individuals; these differences were not fully explained by age, sex, education, household income, private insurance, or clinical comorbidities. We also confirmed associations between vision, smell, and multiple sensory impairments and lower cognition. We further studied interactions between race and sensory impairment and found that smell and number of sensory impairments were more strongly associated with lower cognition among Hispanic and especially non-Hispanic Black participants compared to non-Hispanic White participants. These findings suggest that sensory impairments may exacerbate racial disparities in cognitive outcomes among older adults.
This work builds on additional evidence showing overall associations between sensory impairments and cognitive function. We found associations among participants overall for vision, smell, and multiple sensory impairments, similar to other work.4,5,29 Sensory impairments may be associated with lower cognitive function through several mechanisms. 30 First sensory loss and cognitive decline are strongly age related and may share other common causes including vascular disease, inflammation, and other biologic aging processes.31,32 Second, sensory processing and closely linked peripheral regions (e.g., olfactory bulb) may be impacted by neurodegeneration from Alzheimer's disease and Parkinson's or Lewy body disease, which also impairs overall cognition.33–35 Finally, some senses, such as hearing and vision, may hasten cognitive decline either directly (e.g., through changes to brain structure or function) 36 or indirectly (e.g., through loneliness, depression, physical mobility) 37 contributing to worse cognition and faster cognitive decline. 7
This study addresses an important gap in prior literature on race/ethnicity differences in the link between sensory function and cognition. There are studies that have examined differences by race or ethnicity in prevalence of sensory function, without measuring associations with cognition. 38 We build on these studies, as well as on a number of studies showing associations between individual and multiple sensory impairments and worse cognitive outcomes among older adults and some in different geographic locations.39–45 Some studies on the association between sensory impairments and cognitive decline do not study differences by race and ethnicity.3,40,46 One study found associations between multisensory impairment and dementia for both Black and White older adults, but did not have power to test interactions. 15 Multiple studies have found associations between hearing, vision, and dual sensory impairment and cognitive decline in Asian populations.47–50 Few previous studies have examined taste or touch in association with cognition or evaluated differences by race/ethnicity.14,51,52 Although some work has found associations with touch overall, 14 we did not find overall associations with touch or interactions by race/ethnicity. However, we did find that poor taste was associated with lower cognition at Round 2, although there was no evidence for interaction by race/ethnicity.
Our study suggests that racial differences may exist in the association between sensory impairment and cognitive decline. In particular, we found that associations between smell and multiple sensory impairments were elevated for non-Hispanic Blacks and borderline elevated for Hispanics, compared to non-Hispanic Whites. Interestingly, these results were not explained by adjustment for clinical variables, income, education or health insurance type. There could be other important aspects of social determinants of health that were not measured in our study 53 that may drive our findings. For example, nutritional health, 54 racism and discrimination,55,56 physical risk and hazard of respondents’ occupation,57,58 neighborhood pollution,59,60 residential condition,61,62 geographical location as urban or rural,63,64 quality of education rather than just educational level,65,66 satisfaction of healthcare,67,68 and cultural beliefs69,70 have been associated with sensory impairments and/or worse cognition. These factors were not captured in our study and could account for our findings if any were associated with both sensory impairments and cognition. The exact social determinants are unclear as they have not been comprehensively studied for all senses. In general, though, negative social determinants are associated with worse cognition, 65 poorer sensory function, 71 and other poor health outcomes. 72 Imperfect measurement of any of the variables we included (e.g., education) could also lead to residual confounding and explain associations. 73 Further, prior research suggests sensory loss may intersect with race/ethnicity to exacerbate health disparities, such as health care access.53,74 Sensory impairments are associated with decreased self-rated mental health and frequent loneliness, so increased awareness of this is important to provide patient-centered care.75,76 Additional larger studies with robust social determinants of health measures should be conducted to validate our findings in other populations and to determine drivers of these differences.
Our study has several important limitations. Sensory impairments for all senses were only measured at Round 1 so we could not examine changes in sensory function. For hearing in particular, measurements were interviewer-rated and thus not objective, so ratings could have been influenced by external factors such as how well the interviewer communicated with the respondent. This may affect our results by misestimating the prevalence of hearing impairment in our study population. For participants who wore corrective eyewear, vision results could have varied between study waves based on any improvements in their eyewear prescriptions and differences in income or insurance by race and ethnicity that impact access to corrective wear. 77 There was more missing data for vision, touch, and number of impairments in models examining Round 2 cognition and decline from Round 2 to 3, which may impact generalizability. Only one measure of cognition (MoCA) was available in NSHAP, but it was not administered in Round 1, limiting options for longitudinal modeling from baseline. A different measure was assessed at Round 1 and has been shown to have limited sensitivity.78,79 96% scored cognitively normal in Round 1 thus limiting ability to use this in models due to lack of variation. 80 Although we considered demographics and potential comorbidities, there is still some potential that other life factors or variables that were not considered in our study could have influenced the cognitive and sensory outcomes of participants over time. Though we detected some interactions by race/ethnicity, the sample sizes, especially for Hispanic participants may not have been sufficient to detect all interactions. We were also only able to study Hispanic, non-Hispanic Black, and non-Hispanic White participants, thus findings may not be generalizable to other racial and ethnic backgrounds. Future large-scale studies should collect objective sensory and cognitive data to examine associations among US older adults from other racial and ethnic backgrounds.
Nevertheless, our study is robust due to the longitudinal nature of the data which examined participants over 10 to 11 years. We leveraged majority objective sensory measures and examined understudied sensory measures including smell, touch, taste, and number of sensory impairments, in addition to hearing and vision, which are more commonly studied. Our study also goes beyond current research by further testing race/ethnicity and sensory interactions in the association with cognition and examining the extent to which demographic and clinical comorbidities could explain differences by race/ethnicity.
Our research indicates that there are racial and ethnic differences in the prevalence of sensory impairments and their association with cognition in older US adults. For smell and number of impairments, the association with cognition was stronger among non-Hispanic Black participants compared to non-Hispanic White participants with a similar trend among Hispanic participants. Studying demographic variables that influence cognitive and sensory function is important for identifying disparities in health status, determining a group's potential risk for health decline, and targeting interventions to improve health outcomes. Future work should determine whether diagnosing and treating sensory impairments in early stages may help prevent cognitive decline in individuals from minoritized groups. Further research is also necessary to identify the underlying mechanisms of differences in associations, such as incorporating information on health inequities.
Supplemental Material
sj-docx-1-alz-10.1177_13872877251387115 - Supplemental material for Racial and ethnic differences in the associations of sensory impairments with cognition in older United States adults
Supplemental material, sj-docx-1-alz-10.1177_13872877251387115 for Racial and ethnic differences in the associations of sensory impairments with cognition in older United States adults by Faaizah Arshad, Jayant M Pinto, Kristine Yaffe and Willa D Brenowitz in Journal of Alzheimer's Disease
Footnotes
Acknowledgements
We deeply appreciate NSHAP participants for their generous participation and acknowledge the individuals at the National Opinion Research Center at the University of Chicago for their efforts in collecting the data and making it available for public use.
Ethical considerations
An IRB at National Opinion Research Center at University of Chicago approved this study, and participants gave written informed consent.
Consent to participate
Not applicable
Consent for publication
Not applicable
Author contribution(s)
Funding
The authors disclosed receipt of the following financial support for the research, authorship, and/or publication of this article: This work was supported by the National Institute on Aging (K01AG062722); and a grant from the Alzheimer's Association (AARF-18-565846). The National Social Life, Health and Aging Project is supported by the National Institutes of Health, National Institute on Aging (R01AG021487, R37AG030481, R01AG033903, R01AG043538, R01AG048511), and National Institute on Drug Abuse (AG043538-08S1). The content is solely the responsibility of the authors and does not necessarily represent the official views of the National Institutes of Health.
Declaration of conflicting interests
The authors declared no potential conflicts of interest with respect to the research, authorship, and/or publication of this article.
Data availability statement
Supplemental material
Supplemental material for this article is available online.
References
Supplementary Material
Please find the following supplemental material available below.
For Open Access articles published under a Creative Commons License, all supplemental material carries the same license as the article it is associated with.
For non-Open Access articles published, all supplemental material carries a non-exclusive license, and permission requests for re-use of supplemental material or any part of supplemental material shall be sent directly to the copyright owner as specified in the copyright notice associated with the article.