
Abstract
Background
Early detection of dementia requires highly accurate and efficient screening tests that minimize patient burden.
Objective
To develop a machine learning model predicting dementia conversion within 3–5 years using Cube Copying Test (CCT) drawings at baseline.
Methods
This retrospective study analyzed CCT drawing data from 767 patients at the Center for Comprehensive Care and Research on Memory Disorders (2011–2020). Of the 2303 patients who met the inclusion criteria, 534 were excluded due to mild cognitive impairment (MCI) persistence, pending diagnoses, or new neurovascular diseases, while 1002 were lost to follow-up. Eligibility criteria included a baseline Mini-Mental State Examination (MMSE) score ≥24, absence of dementia diagnosis or anti-dementia medication intake, and completion of a 3–5-year follow-up without meeting exclusion criteria.
Results
Of 767 patients, 457 converted to dementia (318 with Alzheimer's disease, 116 with dementia with Lewy bodies, and 23 with frontotemporal dementia) within 3–5 years, while 310 did not. The model achieved an area under the curve of 0.85 for predicting dementia conversion. Shapley Additive exPlanations analysis identified PatchCore-derived features as the strongest predictors, distinguishing drawing patterns of converters and non-converters.
Conclusions
In patients who convert to Alzheimer's disease, dementia with Lewy bodies, or frontotemporal dementia, the very early stages of constructional apraxia-like symptoms already exist at the preclinical stage or MCI stage. Applying deep learning-based anomaly-detection models can detect these early drawing distortions that differ from normal aging and contribute to improving the performance of dementia-conversion prediction.
Keywords
Introduction
Early detection of dementia is essential to delaying its onset and progression. Advances in dementia treatments targeting the early stages of mild cognitive impairment (MCI) 1 have amplified the importance of early detection before conversion to dementia. Dementia progresses along a continuum from normal cognitive function (NC) to subjective cognitive decline (SCD), MCI, and dementia.2–4 Cognitive decline, marked by the accumulation of amyloid-β and other neuropathological changes, begins approximately 10–20 years before an MCI diagnosis,5–7 with accelerated decline starting 3–7 years prior. 8 Therefore, current efforts focus on identifying patients at high risk of dementia even before the MCI stage.
For instance, in Alzheimer's disease (AD), early detection with over 90% accuracy can be achieved through a combination of amyloid positron emission tomography and cerebrospinal fluid biomarkers. 9 However, these diagnostic tools are limited by high costs, invasiveness, and accessibility issues. By contrast, neuropsychological tests are cost-effective, non-invasive, and safe; yet, the accuracy of a single test is often inadequate, necessitating the combination of multiple assessments to reliably identify individuals at high risk. 10 Although comprehensive neuropsychological test batteries can achieve high diagnostic accuracy, they are time-consuming and place a considerable burden on examinees, making them impractical for large-scale community-based screening programs that play a crucial role in early detection. Therefore, a critical need exists for the development of tools that can accurately detect early signs of future dementia conversion using only a minimal number of test items. Particularly for community-based population-screening programs, such tools must be rapid, minimally invasive, and cost-effective while providing highly accurate and efficient screening with minimal patient burden.
Early signs of cognitive decline manifest in domains such as episodic memory, working memory, language, visuospatial abilities, and executive functions.5,7,11 Among these, visuospatial function often declines earlier than other cognitive domains, such as memory in major dementia subtypes, including AD and dementia with Lewy bodies (DLB).5,7,12 As a result, recent research has increasingly focused on visuospatial cognitive function as a critical indicator for early dementia detection.12,13
Early visuospatial decline is commonly assessed through tasks such as the Cube Copying Test (CCT), Clock Drawing Test, and Double Pentagon Test. Among these, the CCT is widely adopted in clinical practice due to its sensitivity to subtle changes, making it a reliable tool for detecting cognitive impairment.14–16 However, age-related changes can significantly influence CCT performance, even in the absence of dementia. For example, Ericsson et al. demonstrated that CCT accuracy declines with age, reporting that only 42% of individuals aged 75–79 years and 24% of those aged ≥90 years could copy correctly. 16 Moreover, demographic variables such as sex and years of education also impact performance; women typically score lower than men, 17 and individuals with more years of education tend to perform better on drawing tasks. 18
In other words, even older adults with NC may experience drawing distortions with aging, and non-converters may sometimes produce drawings that deviate from the model cube drawing. Therefore, to utilize drawing tests related to visuospatial function for early detection of dementia, distinguishing between drawing distortions caused by normal aging and subtle pathological drawing distortions that precede dementia conversion is necessary.
However, traditionally, tests such as the CCT have relied on qualitative evaluation, where scoring is fundamentally based on visual judgments of whether specific criteria related to deviations from the model cube drawing are met. This approach has the limitation that the reliable detection of minor abnormalities is hindered because it is influenced by the scorer's experience and biases. Additionally, since normal aging can also cause deviations from the model cube drawing, sufficient discrimination between drawing distortions associated with normal aging and those specific to patients who will eventually convert to dementia was not always possible.
Conversely, artificial intelligence (AI) technology can overcome the limitations of manual scoring by accurately, quantitatively, and objectively extracting and analyzing features from images. Machine learning models utilizing image data have the advantage of effectively leveraging AI capabilities compared to other modalities, such as numerical data. 19 Furthermore, by combining deep learning-based anomaly-detection models, it may be possible to extract not only features related to deviations from the model cube drawing, but also features that distinguish pathological distortions from drawing distortions caused by normal aging, the latter of which have been difficult to extract and quantify with traditional qualitative assessment methods.
Additionally, medical institutions often face difficulties in obtaining sufficient normal data. While machine learning with small datasets often presents challenges, these limitations can be overcome by leveraging high-precision industrial anomaly-detection models designed to identify minor distortions and significant structural defects. Specifically, PatchCore, 20 which achieved state-of-the-art performance in industrial applications in 2021, demonstrates exceptional results even with limited data. To our knowledge, no studies in neuropsychology have applied this model to detect distortions in patient drawings. However, such advanced anomaly-detection models developed in industrial domains could be highly effective for classification tasks in clinical research, particularly when access to normal data is restricted, as in our study.
Therefore, this study aimed to develop a machine learning model to identify patients at high risk of dementia conversion within 3–5 years using only CCT drawings, by dramatically enhancing the predictive performance of the CCT through the application of advanced AI technology.
Methods
Participants for the analysis
This retrospective study employed an opt-out procedure, as many patients had passed away, relocated, or were transferred to other institutions, making the acquisition of individual consent impractical. The study adhered to the principles of the Declaration of Helsinki and was approved by the Research Ethics Committee of the National Center for Geriatrics and Gerontology (approval number 1449).
Between January 2011 and December 2020, patients aged ≥60 years who visited the Center for Comprehensive Care and Research on Memory Disorders at the National Center for Geriatrics and Gerontology were included in the study. Inclusion criteria were a baseline Mini-Mental State Examination (MMSE) score of ≥24, the availability of CCT image data, no dementia diagnosis, and no pharmacological treatment for dementia. Individuals with visual impairments (such as cataracts or glaucoma), essential tremors, schizophrenia or delusional disorders, mood disorders, delirium, alcohol or substance dependence, intellectual disabilities, higher brain dysfunction, developmental disorders, epilepsy, subarachnoid hemorrhage, stroke, subdural hematoma, epidural hematoma, multiple cerebral infarctions, brain tumors, normal pressure hydrocephalus, Parkinson's disease, or other conditions affecting drawing or cognitive function were excluded at baseline.
Patients at baseline ranged from those who were cognitively normal to those with MCI. Those diagnosed with AD, DLB, or frontotemporal dementia (FTD) within 3–5 years from baseline were classified as “converters.” Patients who did not meet the criteria for MCI or dementia at the 3–5-year follow-up and whose cognitive function remained within the normal range, as determined through comprehensive physician assessments, brain imaging, and neuropsychological tests, were classified as “non-converters.” Diagnoses were based on established clinical criteria for AD, 21 DLB, 22 and FTD, 23 as well as the Diagnostic and Statistical Manual of Mental Disorders, Fifth Edition (DSM-5) criteria for major neurocognitive disorders. For the exclusion of cases diagnosed with MCI at the 3–5-year follow-up, judgment was made based on Petersen's criteria 24 or DSM-5 criteria for minor neurocognitive disorders. Specifically, amnestic MCI was diagnosed based on criteria that included a Clinical Dementia Rating score of ≥0.5, a Wechsler Memory Scale-Revised Logical Memory I score of ≤13, or a Logical Memory II score of ≤8. For non-amnestic MCI, physicians made comprehensive judgments based on Clinical Dementia Rating items related to executive function and judgment, as well as information obtained from family members about changes in daily functioning during follow-up.
The observation period was set at 3–5 years to accommodate variations in follow-up visits, as not all patients were followed up at the same time intervals. The CCT was not used in the diagnostic classification of converters and non-converters at the 3–5-year follow-up.
Participants who were lost to follow-up at 3–5 years (n = 1002) were excluded from the study. This group likely included individuals who no longer sought medical consultations due to symptom resolution, those who were transferred to nearby medical institutions, those who relocated, those admitted to care facilities, and those who passed away. However, as these participants did not attend follow-up visits, detailed background information about them is unavailable. Participants with unclear clinical progression or unconfirmed diagnoses of dementia (such as those with MCI or suspected dementia) during the 3–5-year follow-up were excluded. Therefore, while all cases included in the analysis had confirmed conversion to dementia, in some cases, the specific subtype (possible or probable diagnosis of AD, DLB, or FTD) was not definitively determined. MCI represents a gray zone3,4 in which some patients progress to dementia, while 4–15% may revert even in clinical populations.4,25,26 Therefore, participants diagnosed with MCI at the 3–5-year follow-up were excluded. Additionally, participants who developed new neurovascular conditions during the 3–5-year observation period, such as subarachnoid hemorrhage, stroke, subdural or epidural hematoma, brain tumors, meningiomas, or head injuries, were excluded because distinguishing whether cognitive decline resulted from these events was not feasible (Figure 1).
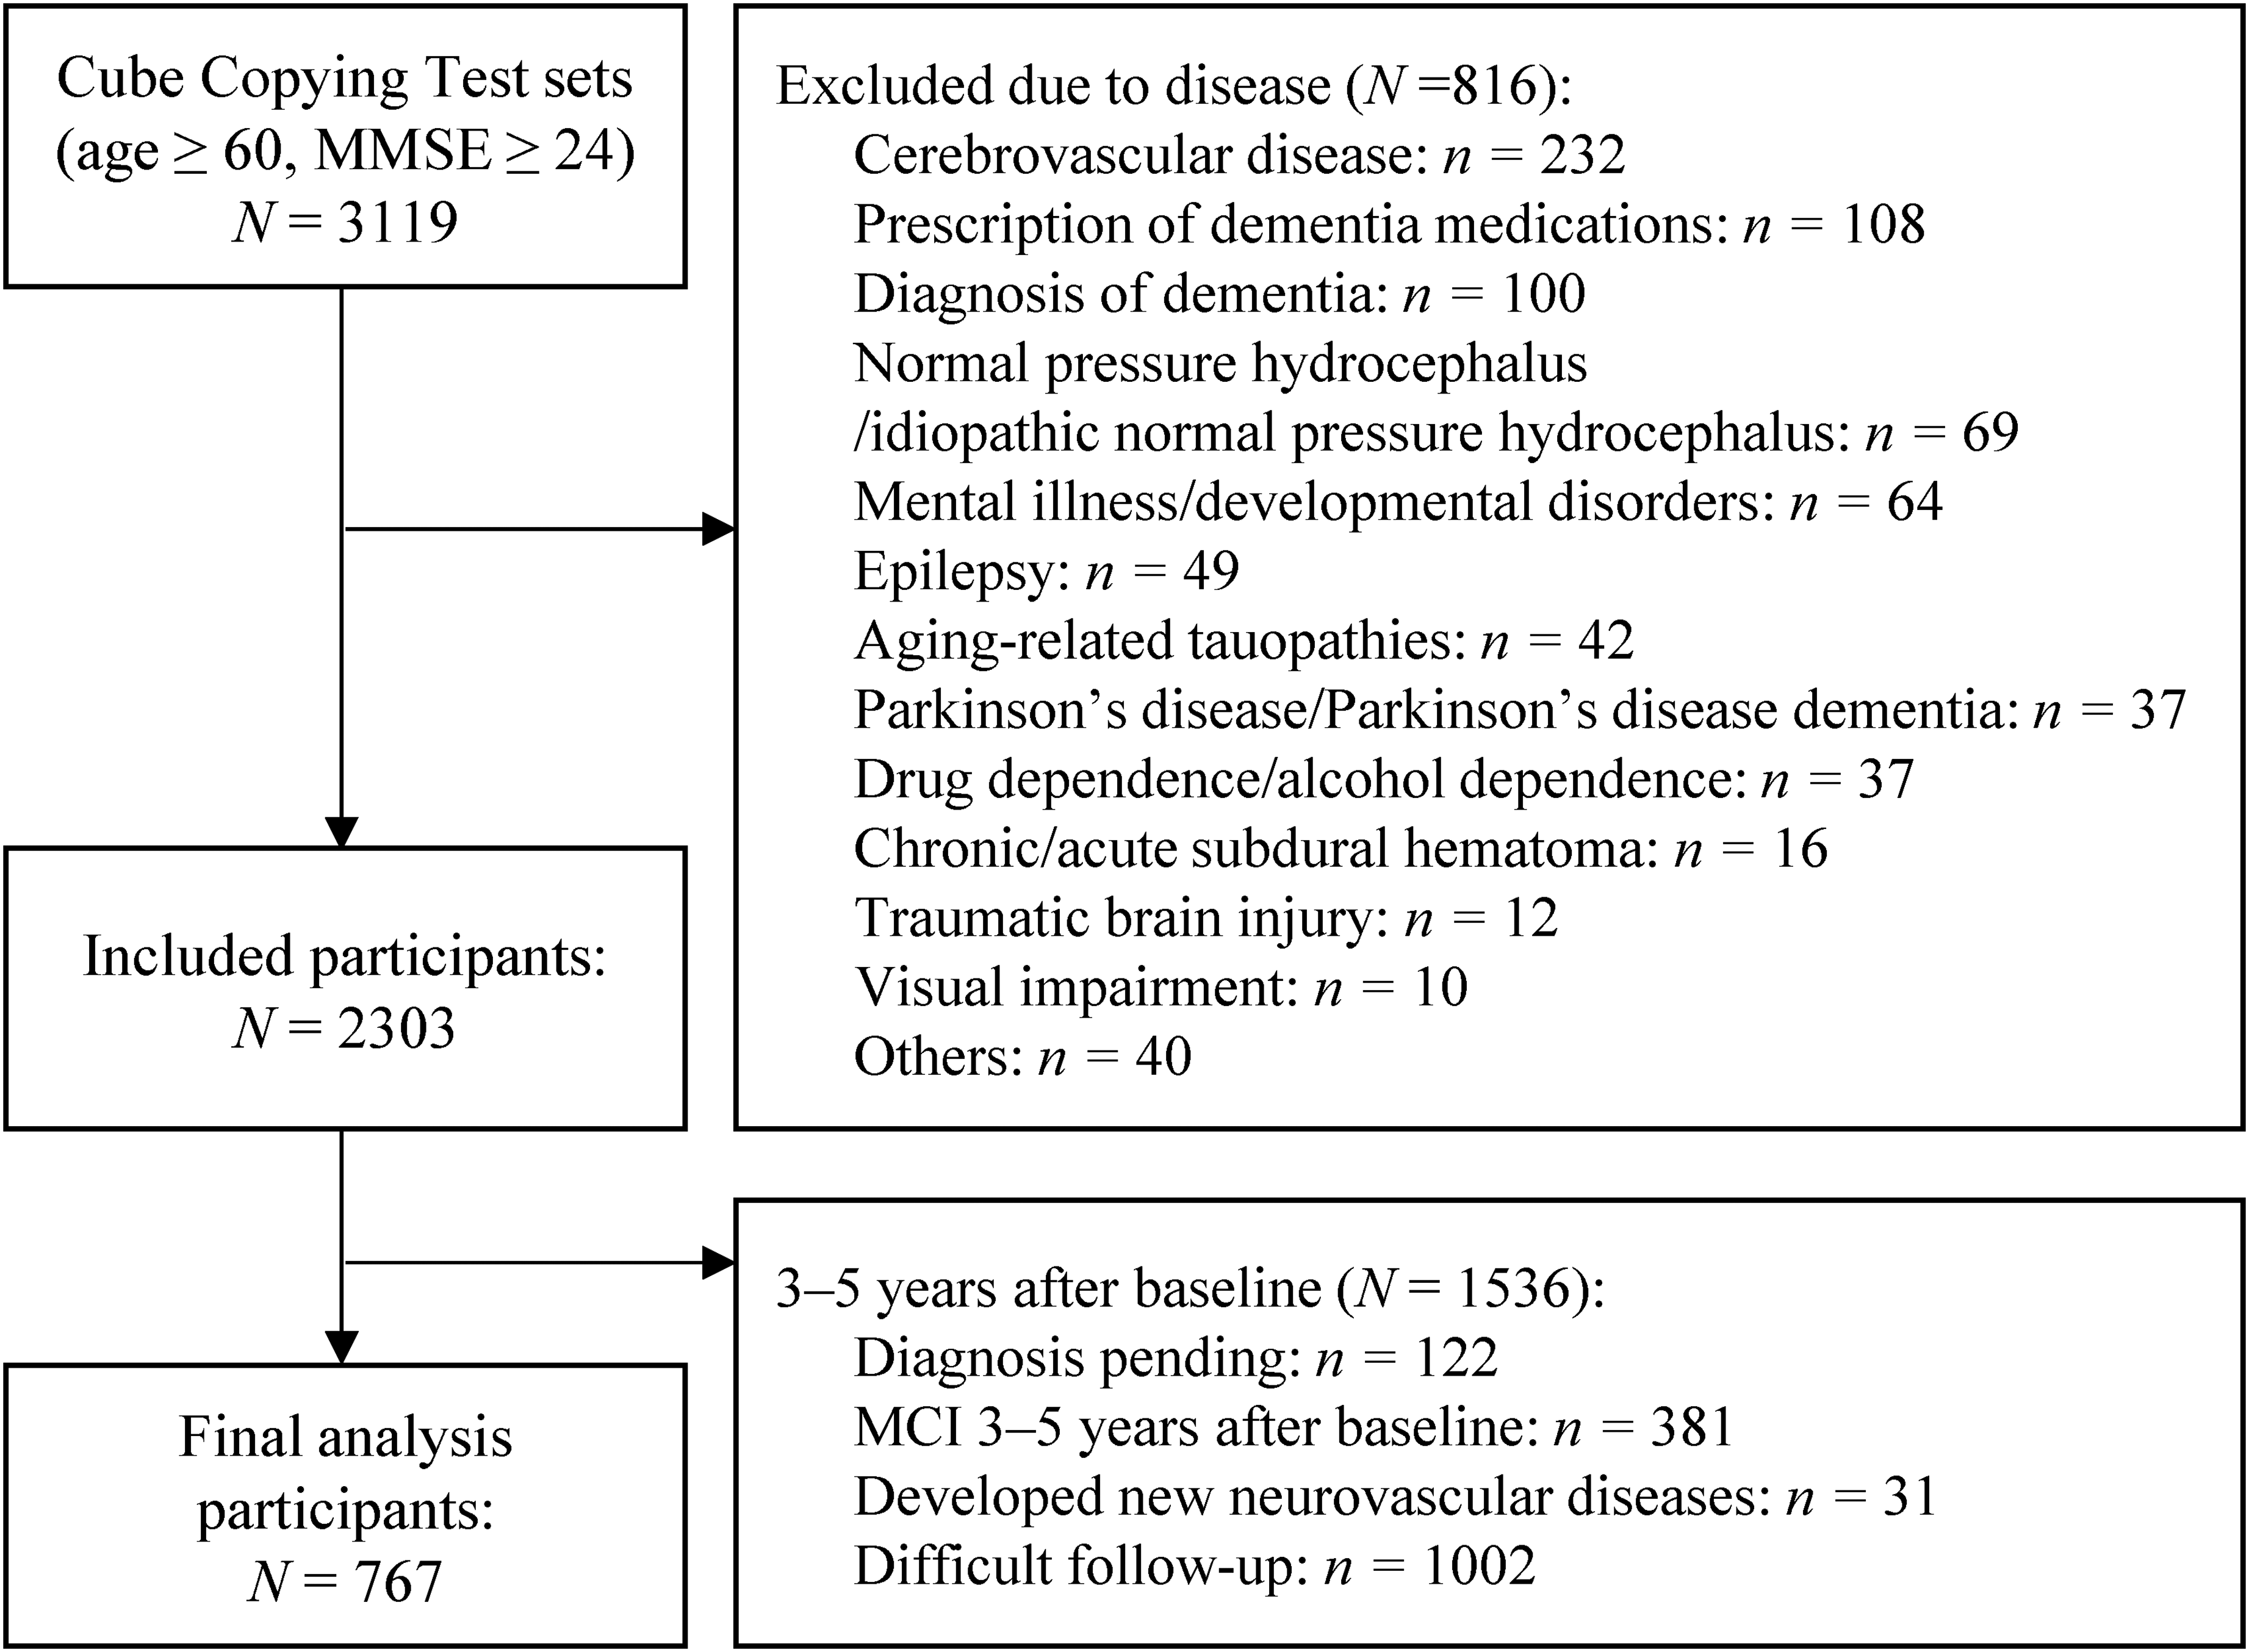
The process of screening participants for analysis. MMSE: Mini-Mental State Examination; MCI: mild cognitive impairment.
Image features
We analyzed the image data from CCT drawings created at baseline. Patients were shown the model cube drawing (4 cm on the long side, 1.9 cm on the diagonal, positioned 5.5 cm from the top of an A4 paper in portrait orientation) and instructed to copy it below the model using a pencil (Figure 2). The test was conducted individually by a clinical psychologist in a quiet room with no time limit. If a patient redrew the drawing, the clinical psychologist asked them to select one, and the chosen drawing was used for analysis. After the tests, the papers were saved as PDF files. During the study, the PDF data were extracted, and the clinical psychologists’ notes were removed. Only the patients’ drawings were cropped and retained for analysis. Since the study primarily aimed to identify characteristic distortions in drawings by older adults at high risk of converting to dementia, drawings that exhibited the closing-in phenomenon, where participants traced over the model drawing, were excluded from the analysis.

Cube Copying Test paper used for testing.
Related features
Since CCT performance is influenced by age, sex, and years of education,17,27 we included age at baseline, sex (male = 0, female = 1), and years of education since elementary school as related features in the model.
Design of the machine learning model
Dataset division. We randomly selected 33% of the entire non-converter dataset as the core image dataset for generating features using anomaly-detection models (PatchCore and convolutional autoencoders [CAE]). Subsequently, 80% of the remaining non-converter images (67% of the total) and all images of converters (100%) were randomly designated as training data, while the remaining 20% were set aside as testing data (Figures 3 and 4).
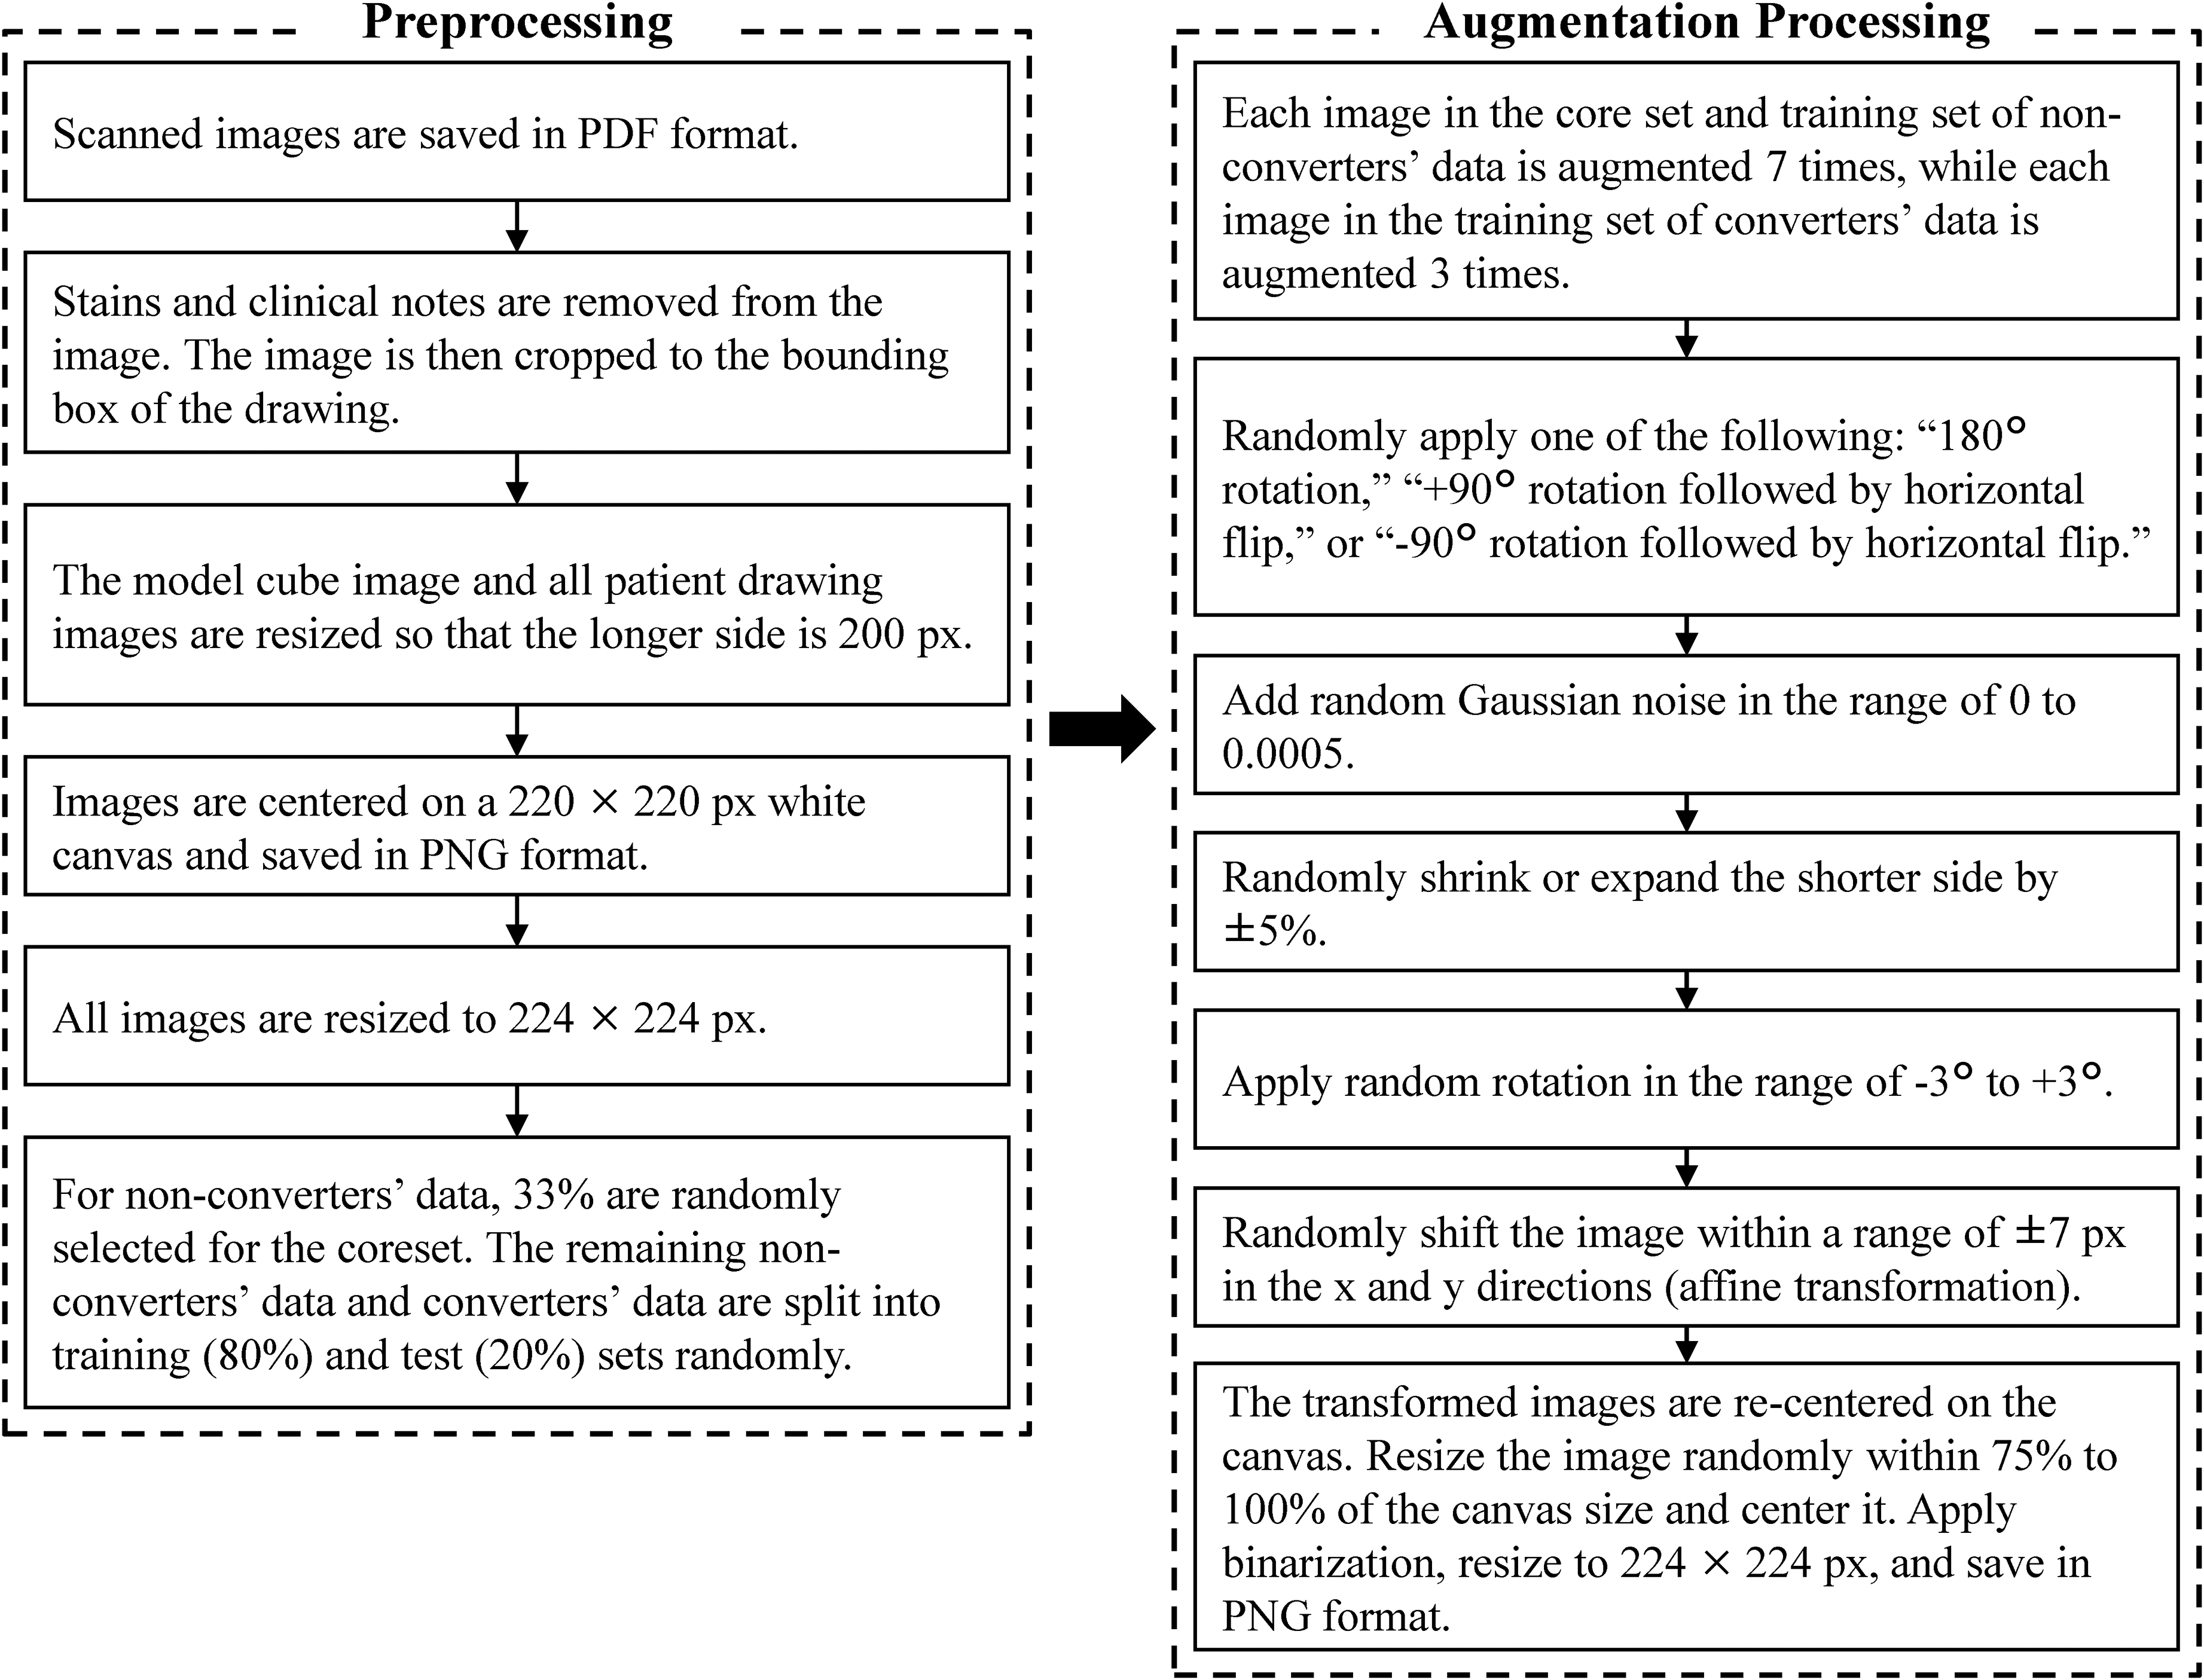
Overview of data pre-processing and augmentation processing.
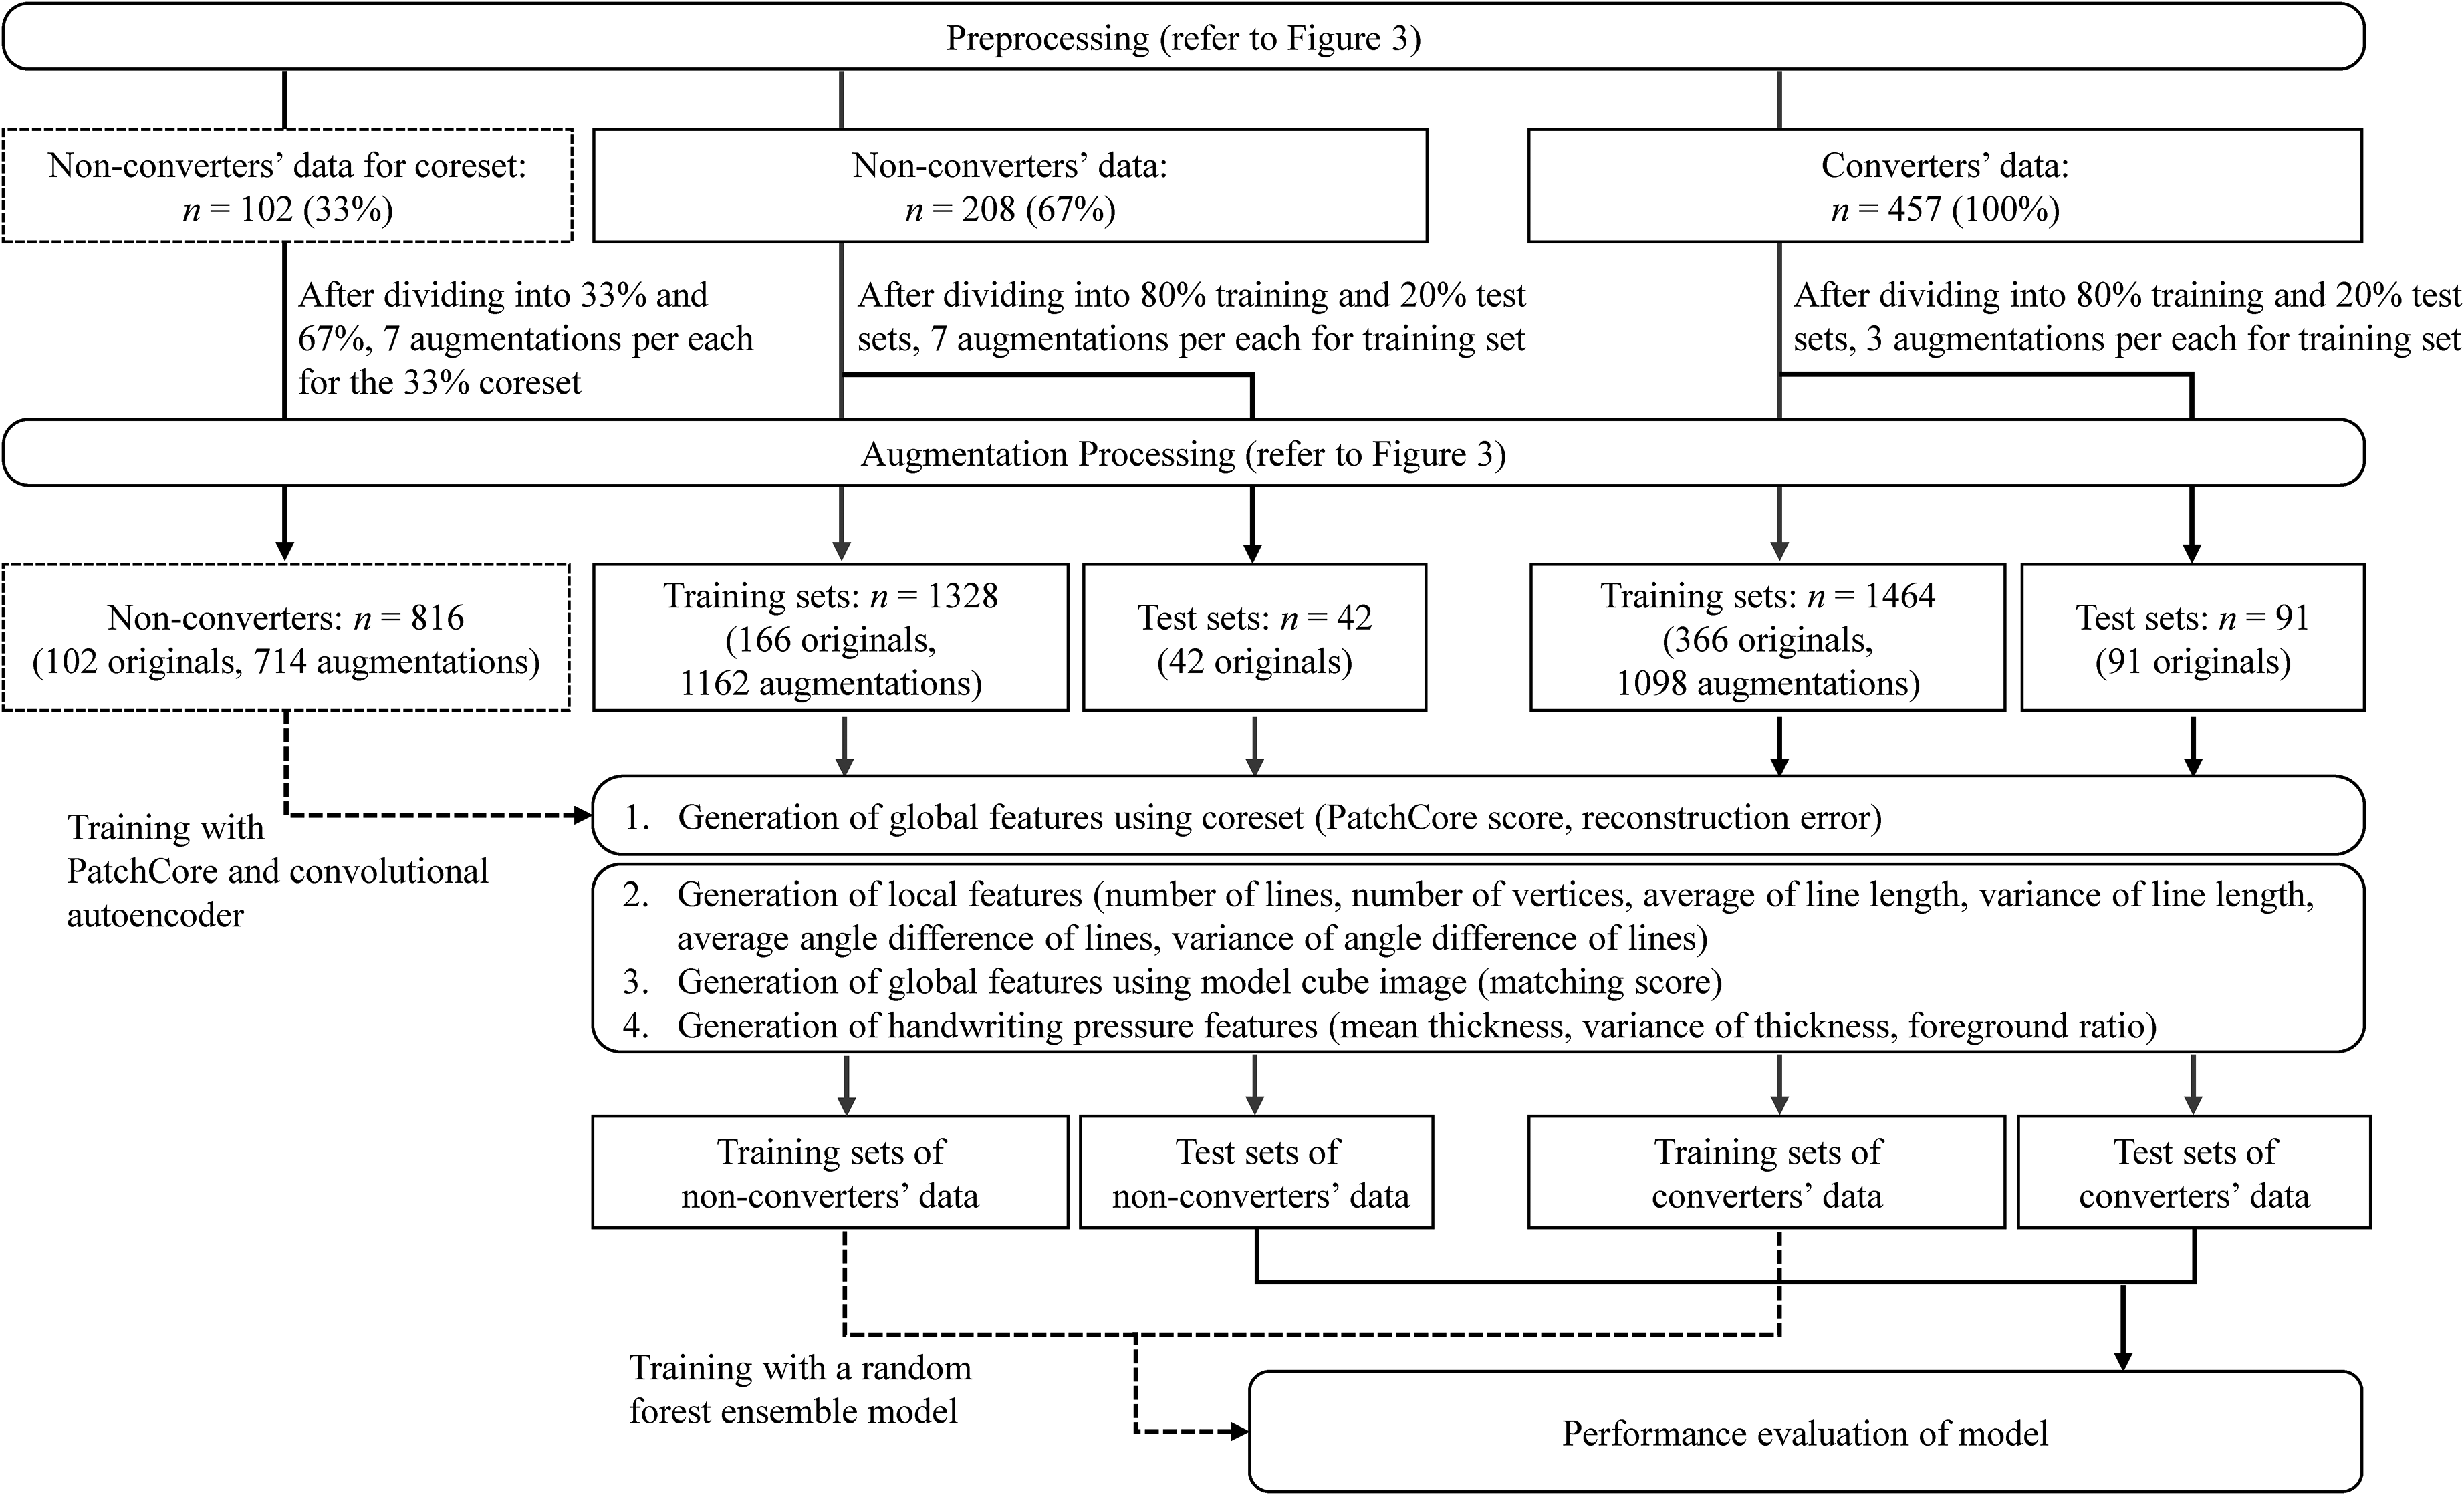
Feature extraction and machine learning flow.
Image data pre-processing. All image data were pre-processed by first removing stains on the paper and any notes made by the clinical psychologist. The images were then cropped to the bounding box of the drawing. The cropped images were resized so that the longer side measured 200 pixels and were centered on a 220 × 220-pixels white background. Finally, the image size was adjusted to 224 × 224 pixels. The same pre-processing steps were applied to the model cube image to ensure consistency in the matching-score calculation (Figure 3).
Data augmentation. Data augmentation was applied to all images except the test dataset. Images drawn by non-converters were augmented 7 times, while images drawn by converters were augmented 3 times.
Since no prior studies on data augmentation for dementia prediction using CCT images were found, the parameters in this study were independently determined through trial-and-error experimentation. The parameters were empirically selected by testing various parameter combinations and verifying the generated images as values were adjusted. The selection process aimed to balance the suppression of overfitting and the improvement of generalization performance while ensuring that transformations did not alter the clinical characteristics of the drawings, such as converting drawings associated with normal aging into pathological patterns or vice versa. Specifically, one of three rotation types (180° rotation, 90° rotation with a horizontal flip, or −90° rotation with a horizontal flip) was randomly selected and applied. Additionally, Gaussian noise was randomly added to the images. While maintaining the longer side of the images, the shorter side was randomly scaled by −5% to 5%. The images were rotated within the range of −3° to 3° and then binarized. The images were randomly shifted by −7 to 7 pixels along the x and y axes. Random affine transformations were applied, and the display range was adjusted to center the transformed images. Finally, the augmented images were saved in PNG format with a size of 224 × 224 pixels (Figure 3).
Local features
The scoring criteria for the CCT, as described in the instruction manual for the Japanese version of the Montreal Cognitive Assessment, 28 specify the presence of all necessary lines, absence of unnecessary lines, preservation of parallel relationships between lines, and similarity in their lengths. Since these characteristics are clearly defined, they can be quantitatively analyzed using conventional image-processing techniques based on a rule-based approach. Accordingly, the following procedure was employed to extract these features (Figure 4).
The images were first converted to grayscale, and the Hough transform was applied to detect line segments. Lines were classified as horizontal (angles within −10° to 10° or 170° to 190°), vertical (angles within 80° to 100° or −100° to −80°), or diagonal (all other angles) based on their angles relative to the horizontal direction. After extracting line endpoints, the following features were calculated for horizontal, vertical, and diagonal lines: the number of lines, average and variance of line lengths, and average and variance of the angles between lines of the same type (as a measure of line parallelism). Additionally, the number of vertices was calculated. For the number of lines in each direction (horizontal, vertical, and diagonal) and the number of vertices, the differences from the reference values (four lines in each direction and eight vertices) were computed. The absolute values of these differences were used as feature values.
Global features
The instruction manual for the Japanese version of the Montreal Cognitive Assessment 28 specifies that the CCT must be drawn in three dimensions. However, its definition is not sufficiently clear. Moreover, normal aging can introduce distortions in CCT drawings,16–18 suggesting that even non-converters may produce images that deviate from the ideal cube representation. To address this issue, we employed both rule-based and data-driven approaches to quantify not only features related to deviations from the model cube drawing (matching score), but also differences from images drawn by non-converters included in the core set through feature extraction using deep learning-based anomaly-detection models (PatchCore scores and reconstruction errors; Figure 4).
Matching score. Similarity to the model cube image was assessed using the Speeded-Up Robust Features algorithm. 29 This algorithm detects feature points in both images, extracts their descriptors, and matches them. The matching score, generated based on the number of matched feature points, represents a rule-based approach that directly compares drawings to a predefined reference image.
PatchCore score. A core set comprising 33% of non-converter images was used to establish a reference distribution. These features quantified the dissimilarity between test samples (67% of non-converters and 100% of converters) and the reference distribution derived from non-converter images. After extracting image features using a pre-trained ResNet50 model, the PatchCore score, 20 defined as the distance to the nearest point within the core set, was computed and saved as a feature. Additionally, anomaly-detection results were visualized to confirm the appropriateness of the model. A higher PatchCore score signifies a greater deviation from the non-converter core set. This represents a data-driven approach that leverages deep learning-based feature extraction.
Reconstruction error. Similar to the PatchCore score, 33% of the non-converter images were used as a core set to capture structural differences from non-converters in the remaining samples. After extracting image features using a pre-trained ResNet18 model, CAE was trained on the core set. Hyperparameters were optimized using Bayesian optimization. These included the hidden layer size, number of epochs, L2 weight regularization, and sparsity proportion. The reconstruction error, calculated based on the difference between the input and reconstructed images, was saved as a feature. A higher reconstruction error indicates greater structural deviation from the core set of non-converters, representing another data-driven approach using deep learning.
Handwriting pressure features
Since dementia is associated with reduced handwriting pressure, 30 the average and variance of line thickness, as well as the ratios of foreground pixels, were calculated to quantify handwriting pressure as a feature (Figure 4).
Image feature selection, model training, and evaluation
Missing values were estimated and imputed using the k-nearest neighbor method. Related features (age, sex, and years of education) were analyzed using the Mann–Whitney U test for continuous variables and chi-squared test for categorical variables to assess differences between the converter and non-converter groups. These variables were subsequently included in the model as covariates to adjust for their effects. The differences in image features between non-converters and converters were analyzed using two-sided analysis of covariance. Correlation coefficients between selected image features were calculated to identify and address multicollinearity. Pairs of features with an absolute correlation coefficient of 0.8 or higher were identified, and one feature from each pair was excluded. The mean and standard deviation (SD) were calculated for each feature using the labels. If more than half of the features for an image data point exceeded ±3 SD, that data point was considered an outlier and excluded.
The selected image and related features were integrated using a Random Forest ensemble model. This method was chosen based on several advantages: it is a well-established and representative approach, effectively handles nonlinear feature combinations, performs well with limited training data, provides implicit feature selection through random feature sampling that emphasizes optimal feature combinations, offers interpretability through feature importance analysis, and balances versatility with ease of implementation. During model selection, the performances of XGBoost and Support Vector Machine (SVM) were also compared. Random Forest was ultimately selected due to its superior performance.
Optimal hyperparameters, including the number of learning cycles, maximum number of splits, minimum leaf size, and number of variables to sample, were identified through Bayesian optimization using the training dataset. These hyperparameters were then applied to train the Random Forest ensemble model. To reduce overfitting, Shapley Additive exPlanations (SHAP) values were calculated to identify features with minimal contributions. Image features with SHAP values below a set threshold were excluded, and the model was retrained using the remaining features. To ensure consistency and avoid data leakage, the test data were processed using the same methods as the training data. The final model was trained, and predictions were made independently of the test data using the same parameters determined from the training dataset.
A 10-times five-fold cross-validation was performed to evaluate the accuracy and area under the curve (AUC) of the final model. Accuracy, sensitivity, specificity, F1 score, and AUC were calculated for the simple model, which used only related features (age, sex, and years of education), and the final model, which included image features in addition to the related features. Additionally, 95% confidence intervals (CIs) for the model metrics were computed using bootstrap resampling. The AUCs of the two models were compared using a two-sided DeLong test.
SHAP values, representing the contribution of each feature to the final model, were calculated. Absolute SHAP values were computed to evaluate the average impact of each feature on the predictions, and the mean and SD for each feature were calculated. Furthermore, a beeswarm plot was created for each label using SHAP values to visually interpret the distribution and impact of features.
Finally, the Mann–Whitney U test was used to examine differences in image features between misclassified and correctly classified images in the test dataset. Statistical tests were conducted with a significance level of p < 0.05. Effect sizes were calculated using Cohen's d or Cliff's δ for continuous variables and Cramér's V for categorical variables.
Software
The analysis was performed using MATLAB R2024a® from The MathWorks®. The Deep Learning Toolbox (version 24.1), Image Processing Toolbox (version 24.1), Statistics and Machine Learning Toolbox (version 24.1), Parallel Computing Toolbox (version 24.1), and Computer Vision Toolbox add-ons for MATLAB® were utilized. SHAP values were calculated using the Python SHAP library (version 0.46.0).
Results
In total, 767 participants met the criteria, comprising 457 converters (318 with AD, 116 with DLB, and 23 with FTD) and 310 non-converters (Table 1). While some participants with DLB and FTD had comorbid AD, the distribution of dementia subtypes among study participants (AD: 69.6%, DLB: 25.4%, FTD: 5.0%) aligned well with previously reported prevalence rates in the literature (AD: 60–77%, DLB: 15–20%, and FTD: 5–15%).31–35 Cardiovascular disease was observed in 178 (38.9%) of the converters and 115 (37.1%) of the non-converters.
Characteristics of the participants (n = 767).
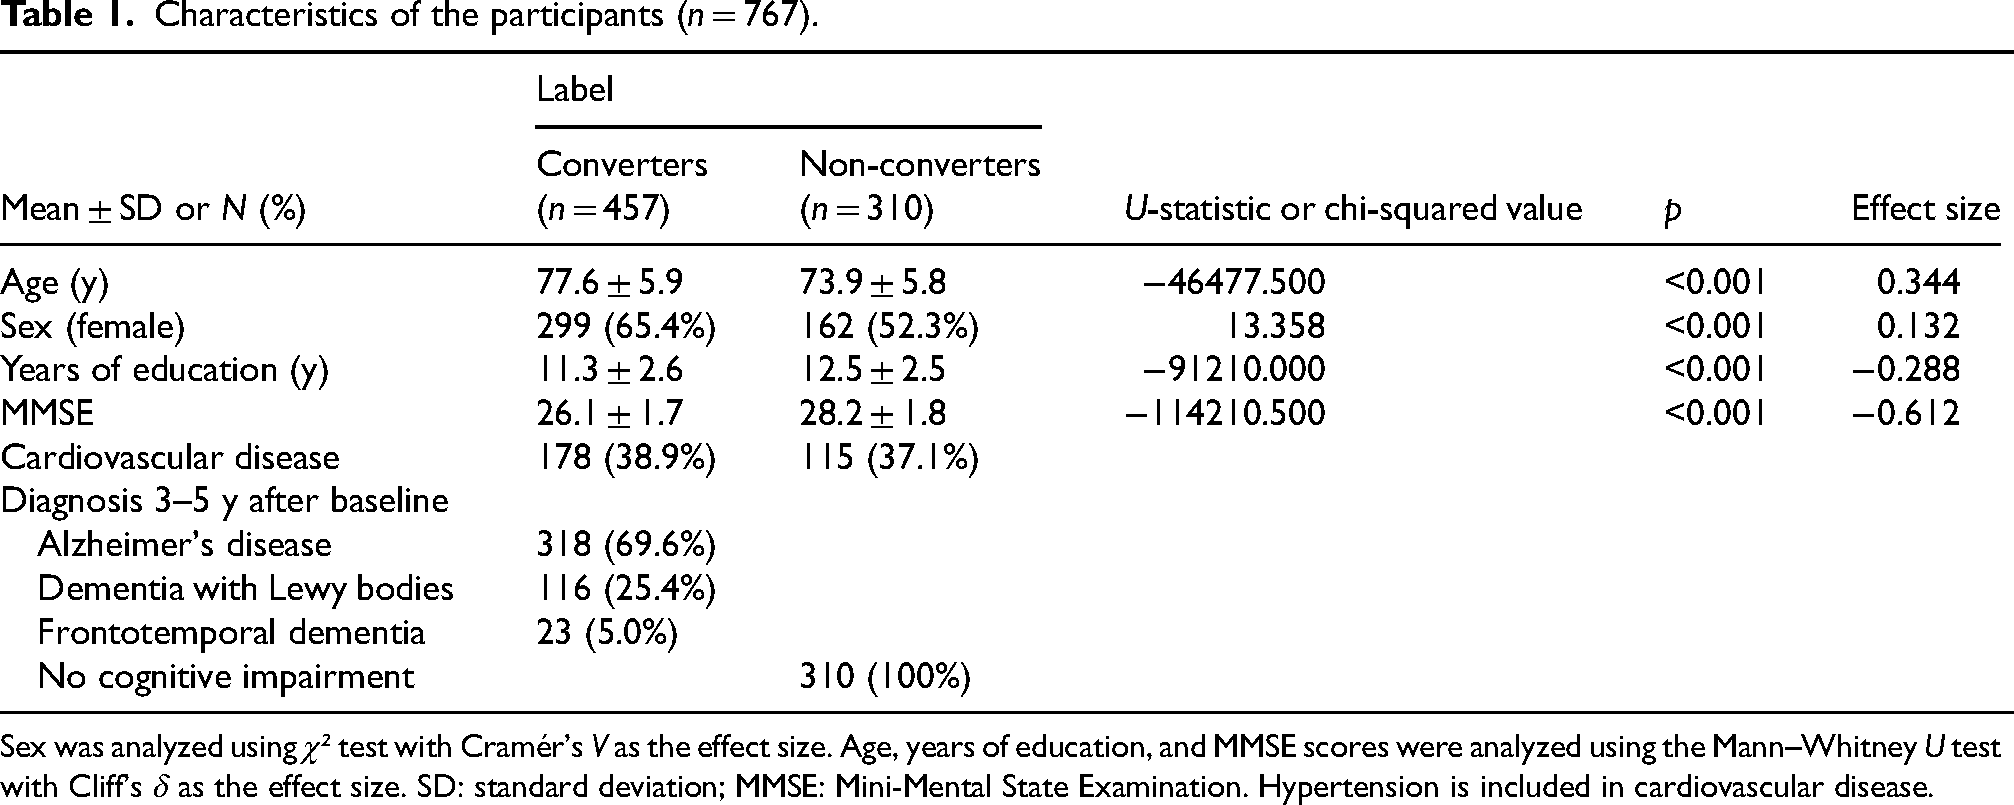
Sex was analyzed using χ² test with Cramér's V as the effect size. Age, years of education, and MMSE scores were analyzed using the Mann–Whitney U test with Cliff's δ as the effect size. SD: standard deviation; MMSE: Mini-Mental State Examination. Hypertension is included in cardiovascular disease.
The analysis of covariance revealed significant differences between converters and non-converters for all but one image feature. For local features, converters demonstrated greater absolute differences from the reference values (four lines in each direction) in the number of lines detected across all directions (horizontal, vertical, and diagonal) compared to non-converters. Converters also exhibited larger absolute differences from the reference value (eight vertices) in the number of vertices. Additionally, converters had shorter horizontal and vertical lines and longer diagonal lines than non-converters. For all line types, converters showed greater variance in line lengths, larger average angle differences between lines of the same type, and greater variance in angle differences for horizontal and diagonal lines.
Regarding global features, converters had lower matching scores, higher PatchCore scores, and greater reconstruction errors. For handwriting pressure features, converters displayed lower mean line thicknesses, greater variance in thickness, and lower foreground ratios than non-converters (Table 2).
Differences between converters and non-converters after adjusting for related features (ANCOVA).
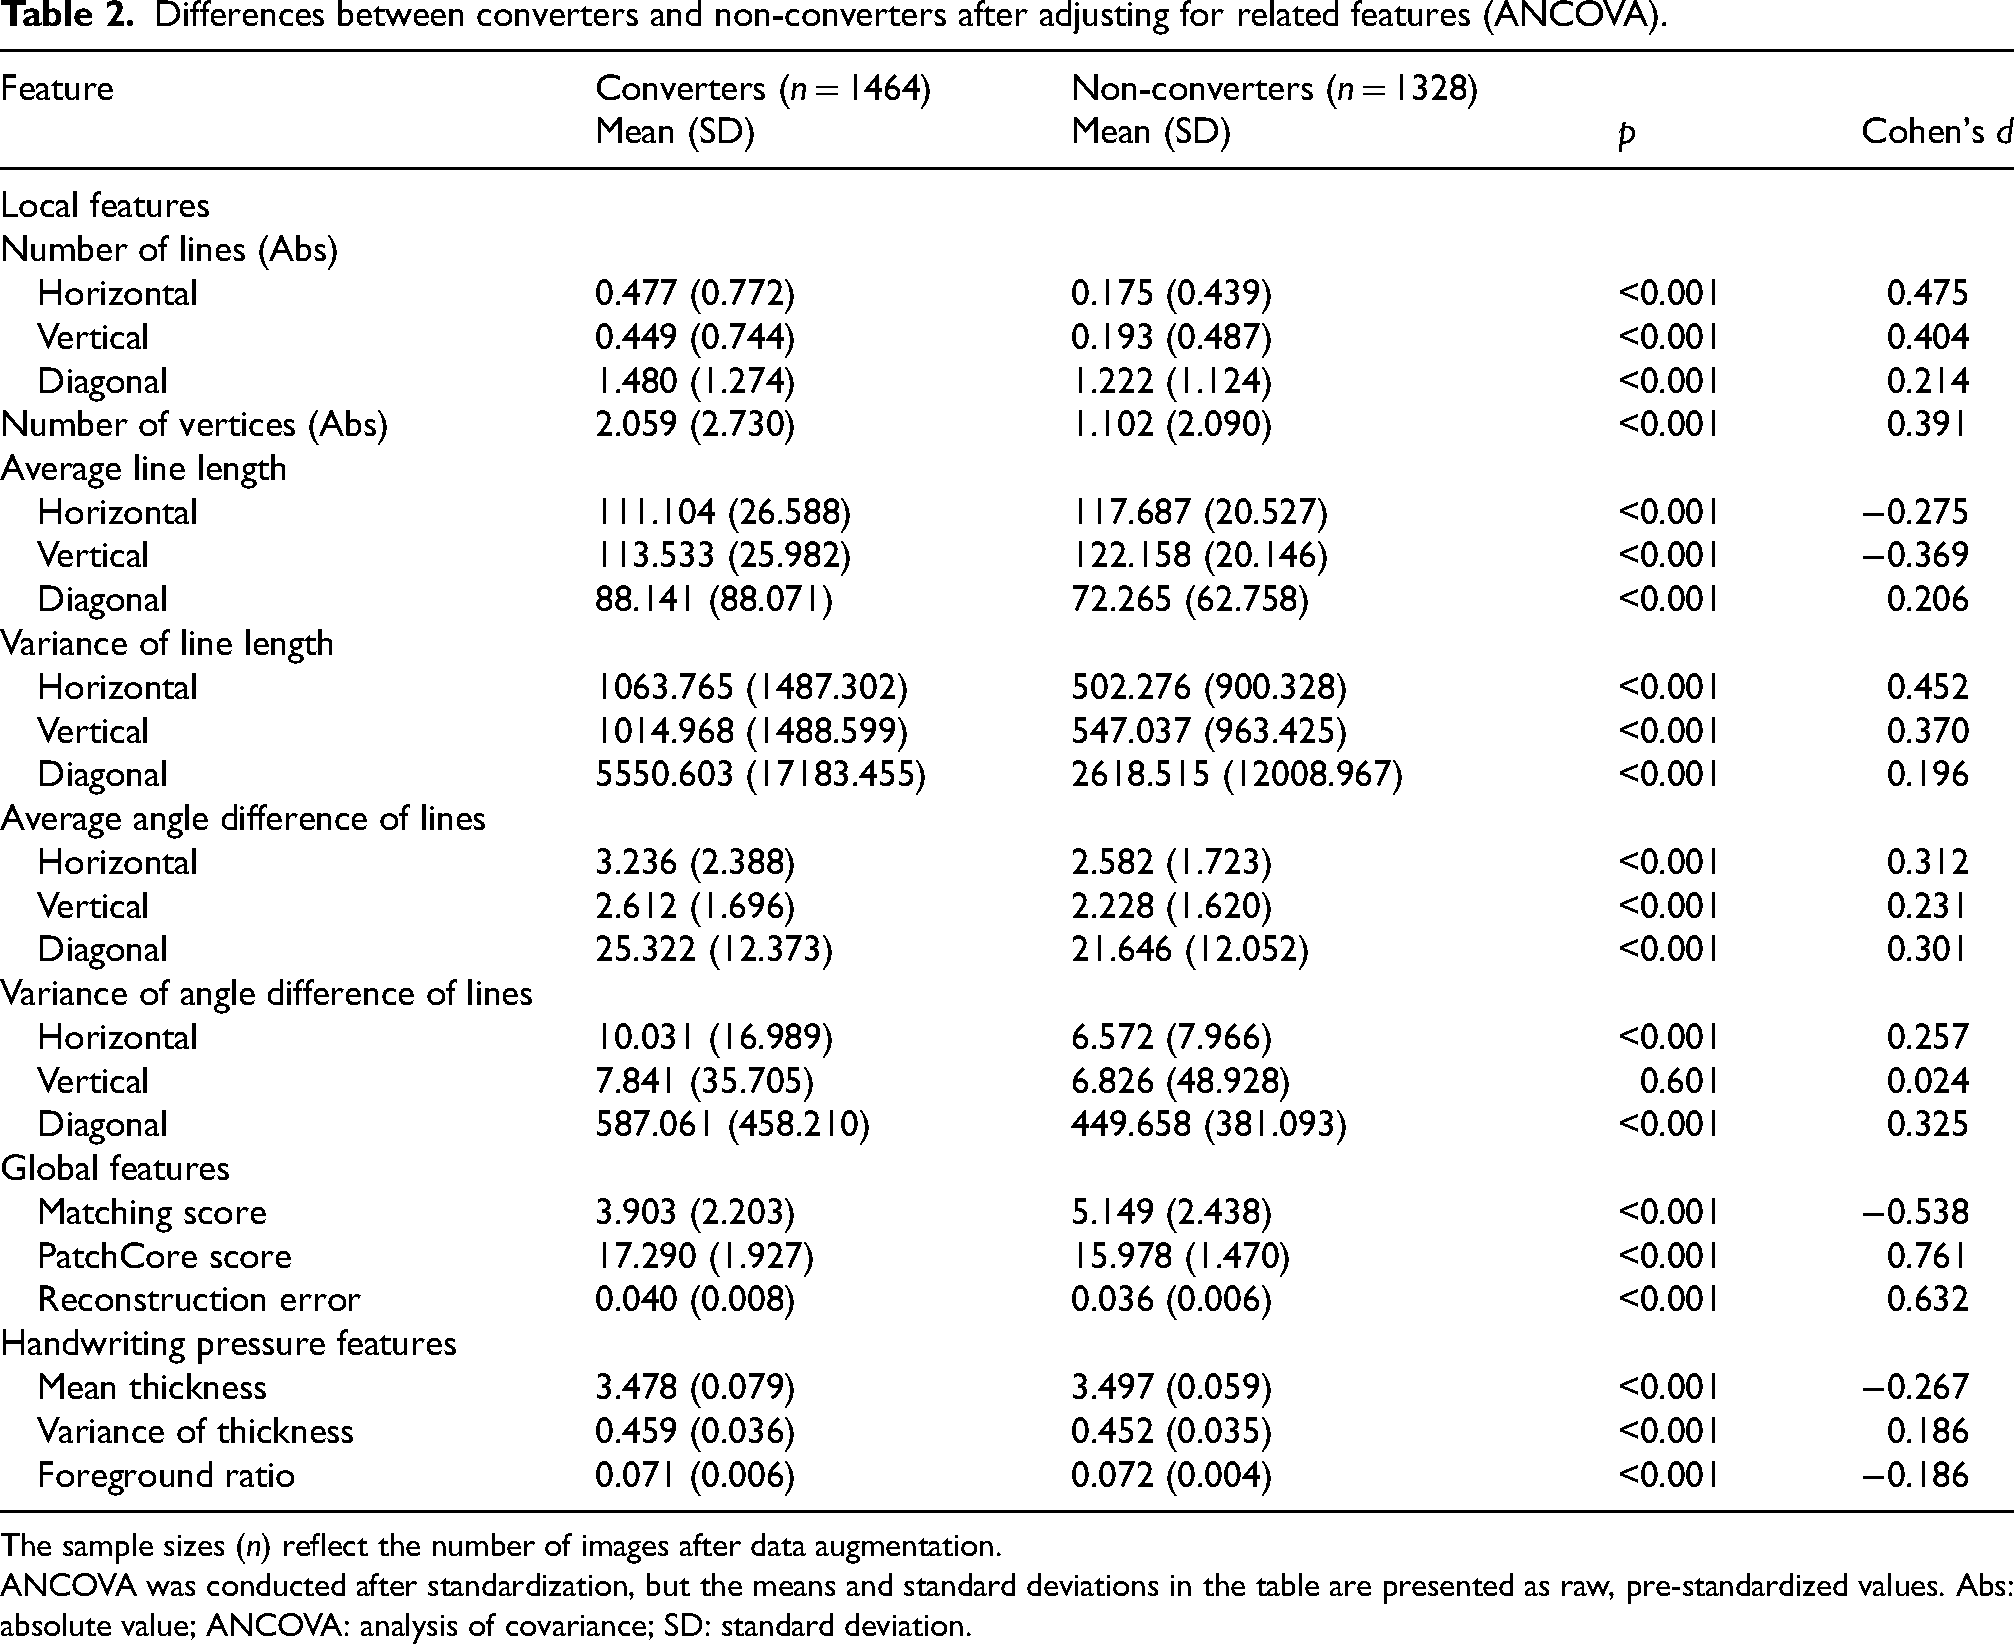
The sample sizes (n) reflect the number of images after data augmentation.
ANCOVA was conducted after standardization, but the means and standard deviations in the table are presented as raw, pre-standardized values. Abs: absolute value; ANCOVA: analysis of covariance; SD: standard deviation.
To prevent multicollinearity, the correlation coefficients for all image feature values were examined, and no feature pairs with absolute values of 0.8 or higher were found. Outlier detection was performed, but no outliers were identified. Consequently, 22 image features were selected for inclusion in the initial model.
Using the 22 selected image features and three related features, hyperparameters were optimized through Bayesian optimization, and the initial Random Forest ensemble model was trained. SHAP values were calculated to refine the model. One image feature (number of vertical lines) with SHAP values below the threshold of 0.0005 was excluded. The final model was retrained using the remaining 21 image features and three related features as inputs.
During model selection, XGBoost showed a training AUC of 1.00 but exhibited lower generalization with a test AUC of 0.73, indicating overfitting. The SVM model yielded moderate results with a test AUC of 0.83, accuracy 0.75, sensitivity 0.76, specificity 0.74, and F1 score 0.81. While SVM achieved slightly higher specificity, Random Forest demonstrated superior performance across all other metrics, with smaller discrepancies between training and test data.
Following 10 iterations of five-fold cross-validation, the final Random Forest model achieved an AUC of 0.85 (95% CI: 0.78–0.91) for the test data (Table 3). The ROC curves are shown in Figure 5. The difference in AUC between the final model and a simple model using only the related variables was evaluated using the DeLong test. The final model demonstrated a significantly higher AUC (p < 0.001, Cohen's d = 1.307).
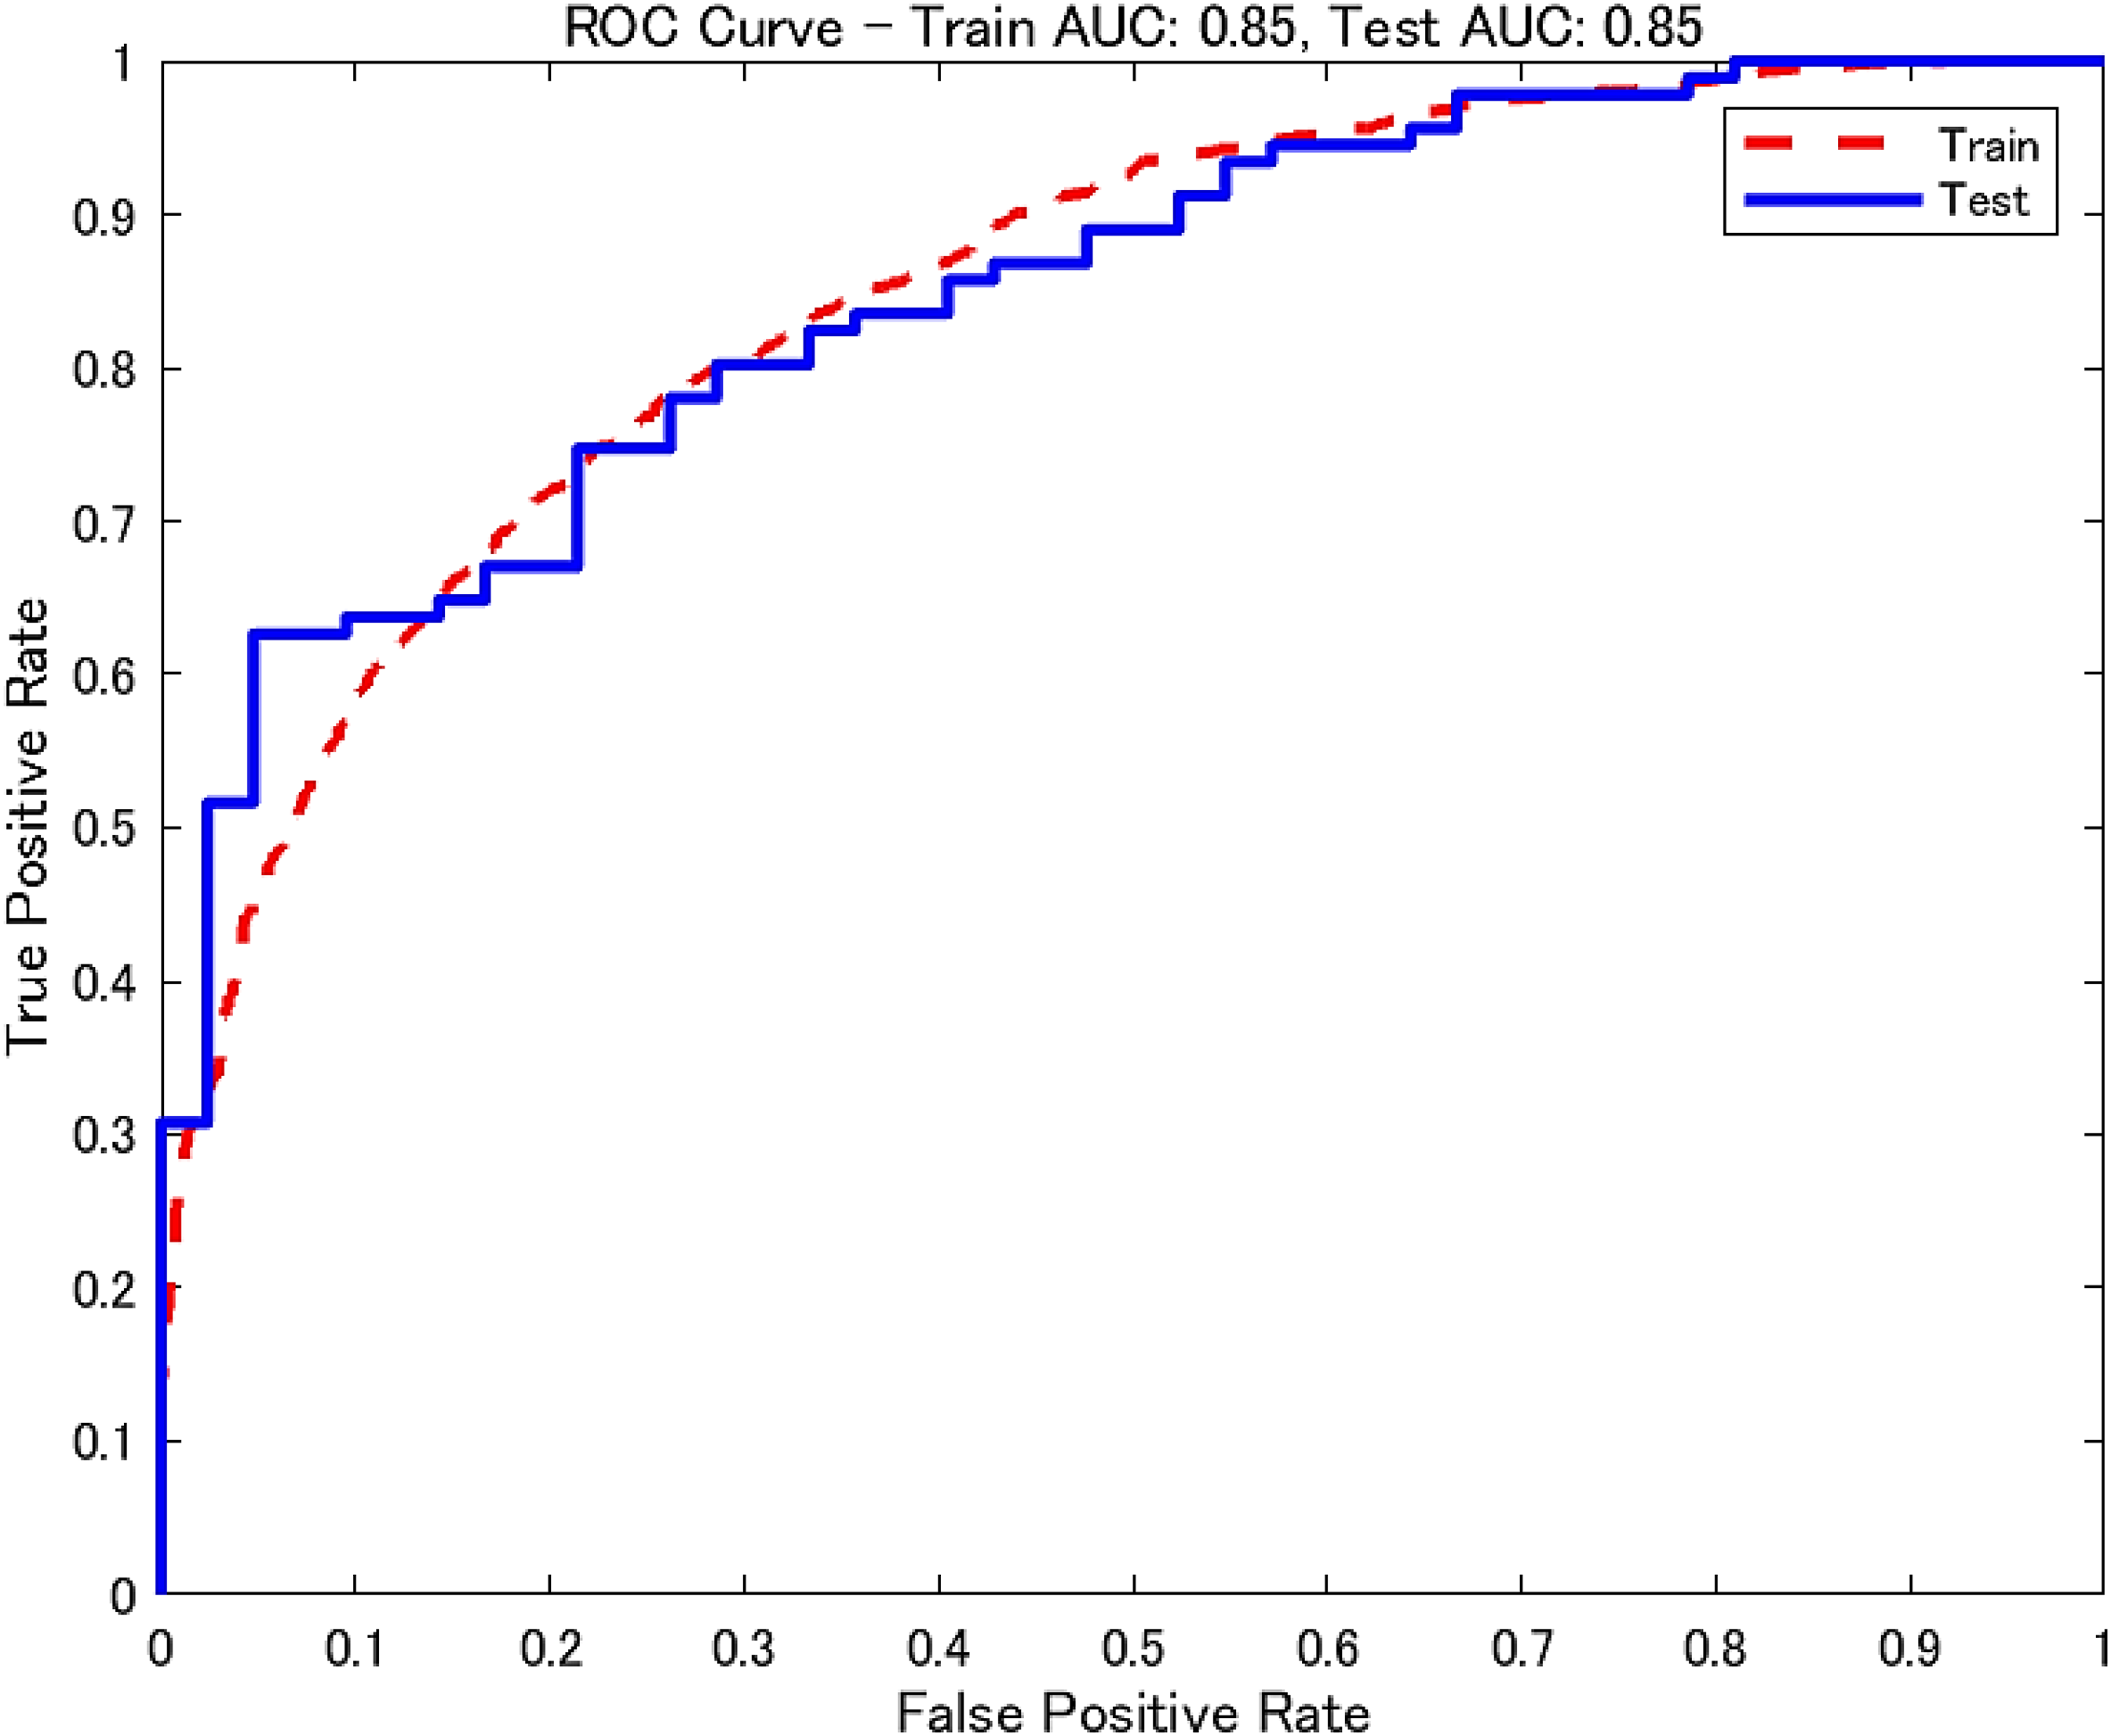
ROC curve for the final model. AUC: area under the curve; ROC: receiver operating characteristic.
Performance evaluation of test data.
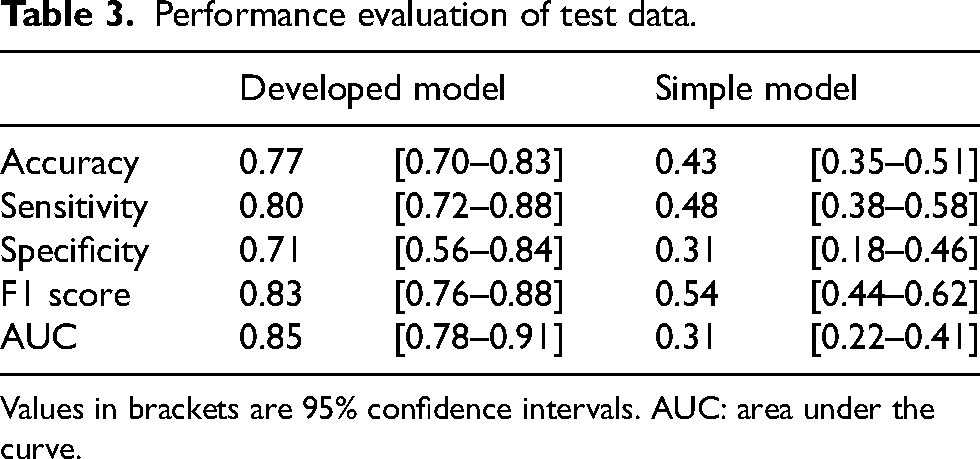
Values in brackets are 95% confidence intervals. AUC: area under the curve.
SHAP values indicated that among the image features, the PatchCore score, reconstruction error, and variance in horizontal and vertical line lengths substantially contributed to the final model's predictions (Table 4, Figure 6).
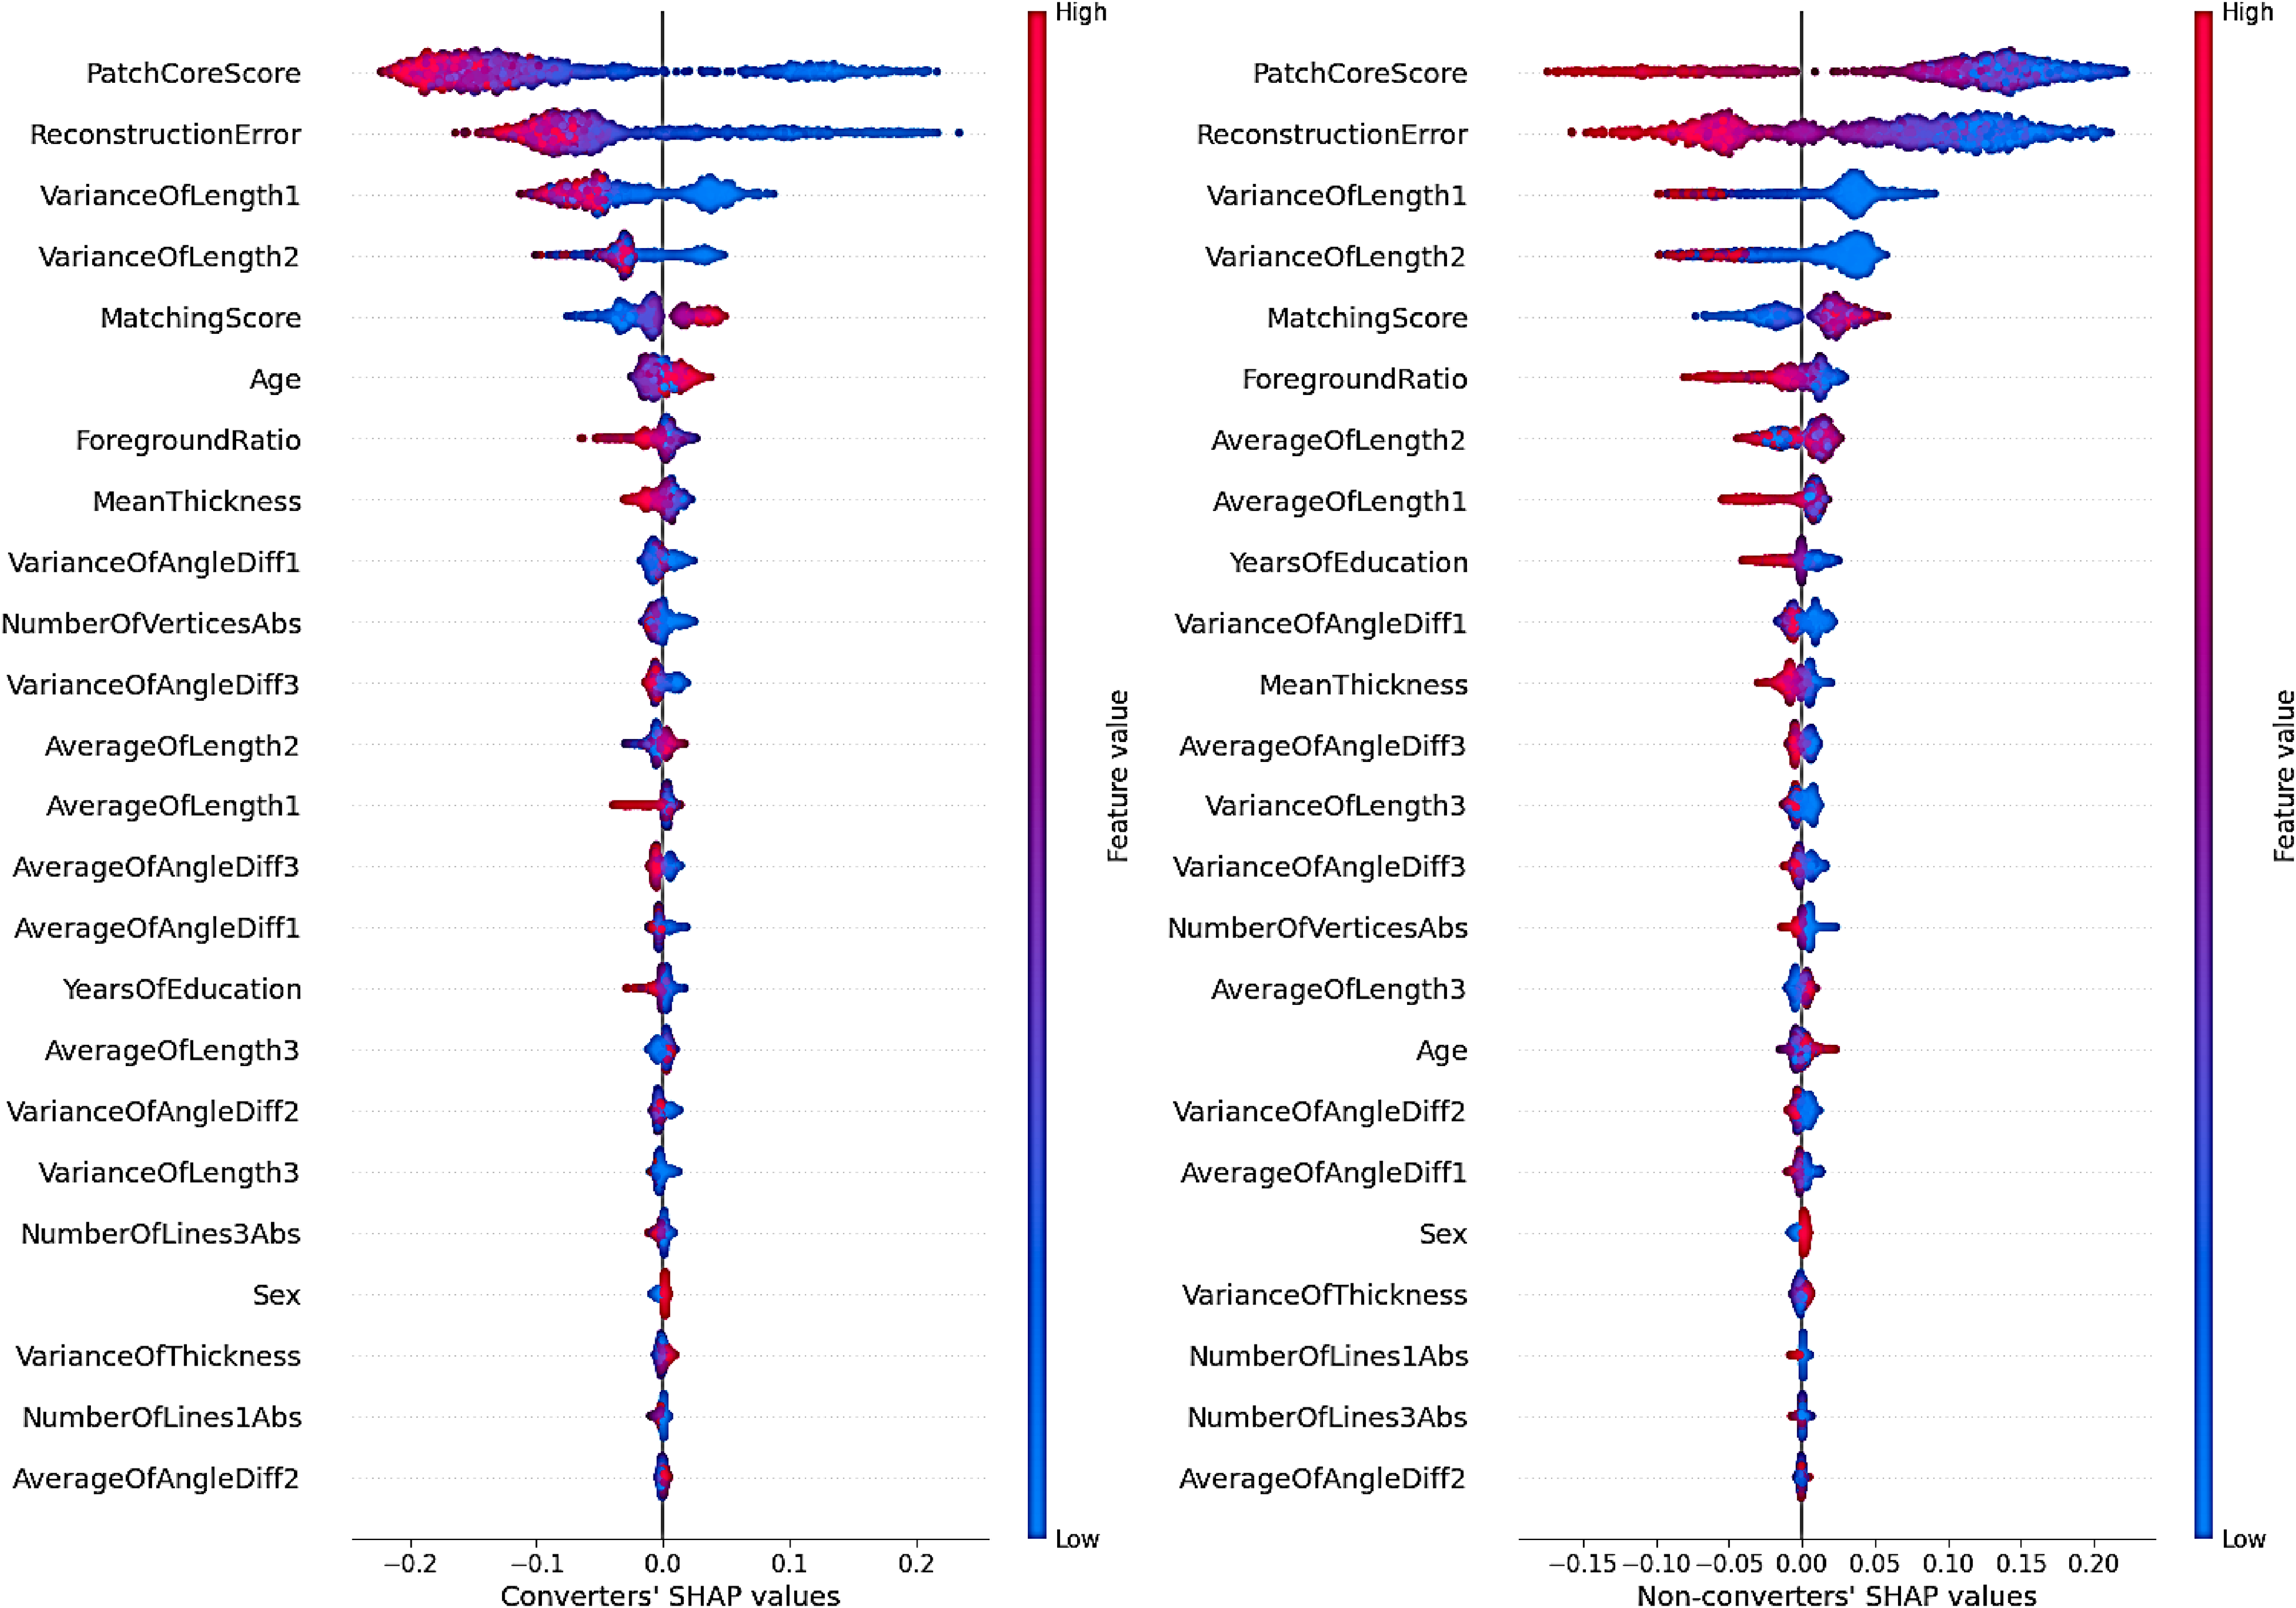
Shapley additive exPlanations (SHAP) beeswarm plot by label for features selected in the final model.
Mean and standard deviation of absolute SHAP values for features selected in the final model.
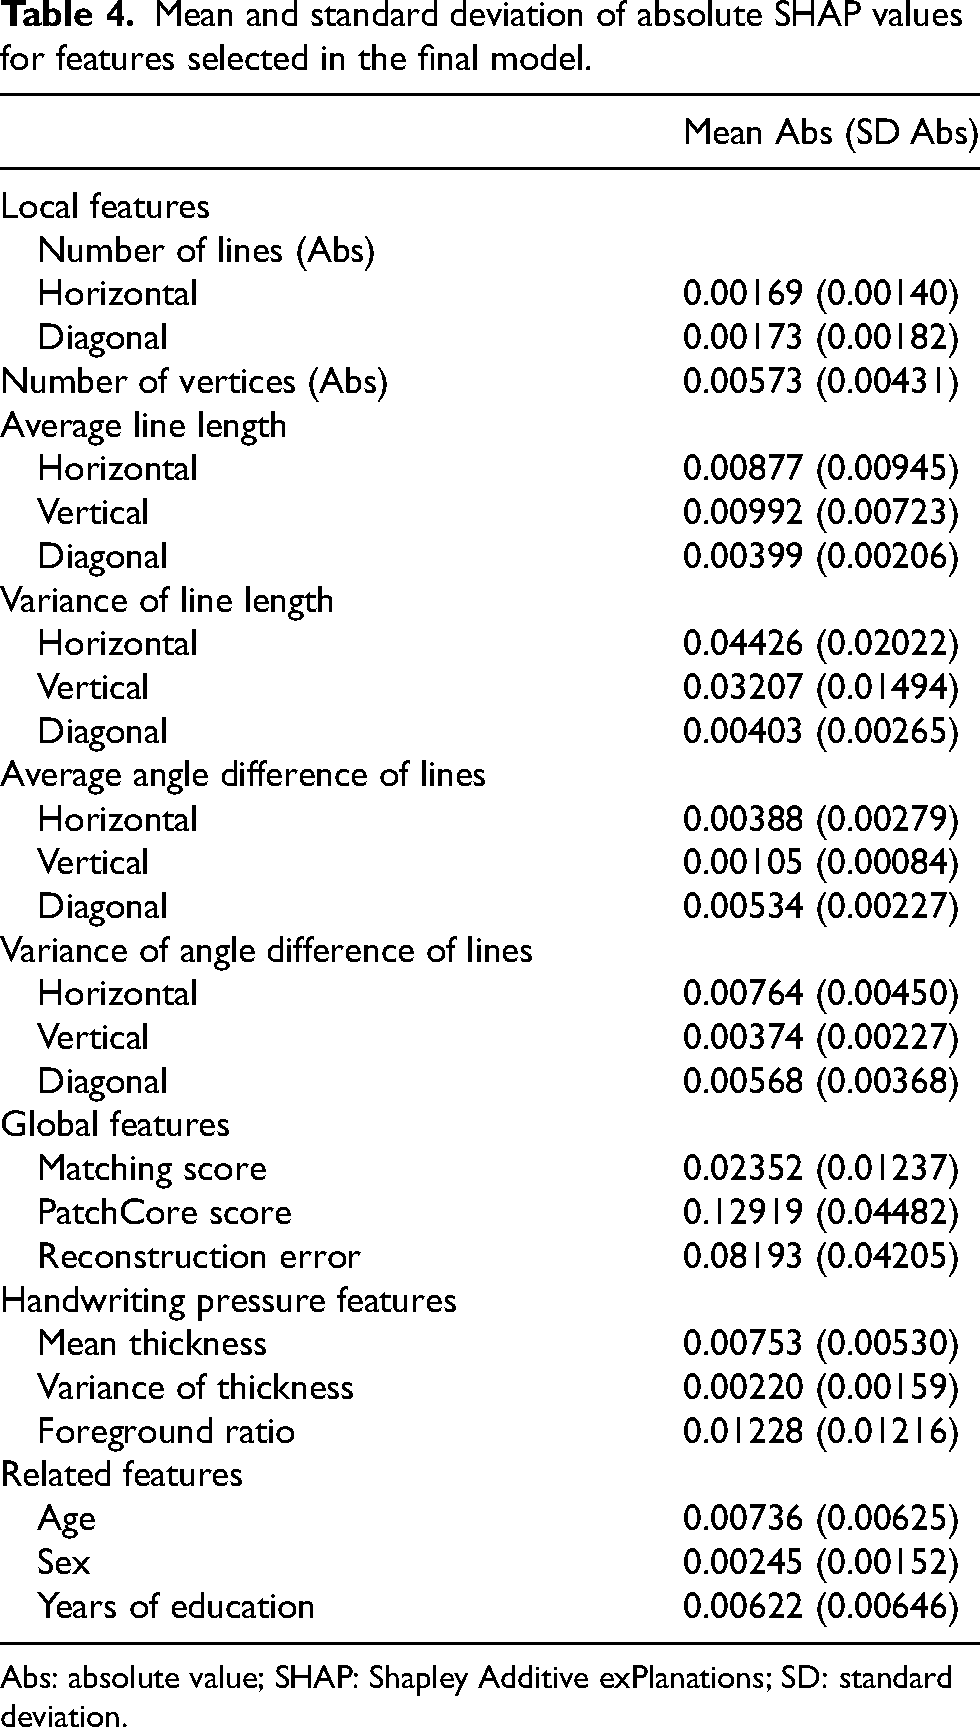
Abs: absolute value; SHAP: Shapley Additive exPlanations; SD: standard deviation.
Finally, for the test dataset, differences in image features between misclassified and correctly classified images were analyzed by labels (Table 5). The results showed that for converters, misclassified images exhibited smaller absolute differences from the reference values in the number of lines detected in horizontal and diagonal directions, as well as in the number of vertices, compared to correctly classified images. Misclassified images also exhibited longer horizontal and vertical lines, shorter diagonal lines, and smaller variances in line lengths within each line type (horizontal, vertical, and diagonal). Additionally, misclassified images had smaller averages and variances in angle differences among vertical and diagonal lines. Regarding global features, misclassified images had higher matching scores, lower PatchCore scores, and fewer reconstruction errors. For handwriting pressure features, misclassified images exhibited higher mean thickness, lower variance in thickness, and higher foreground ratios.
Differences in image features between misclassified and correctly classified images by label.
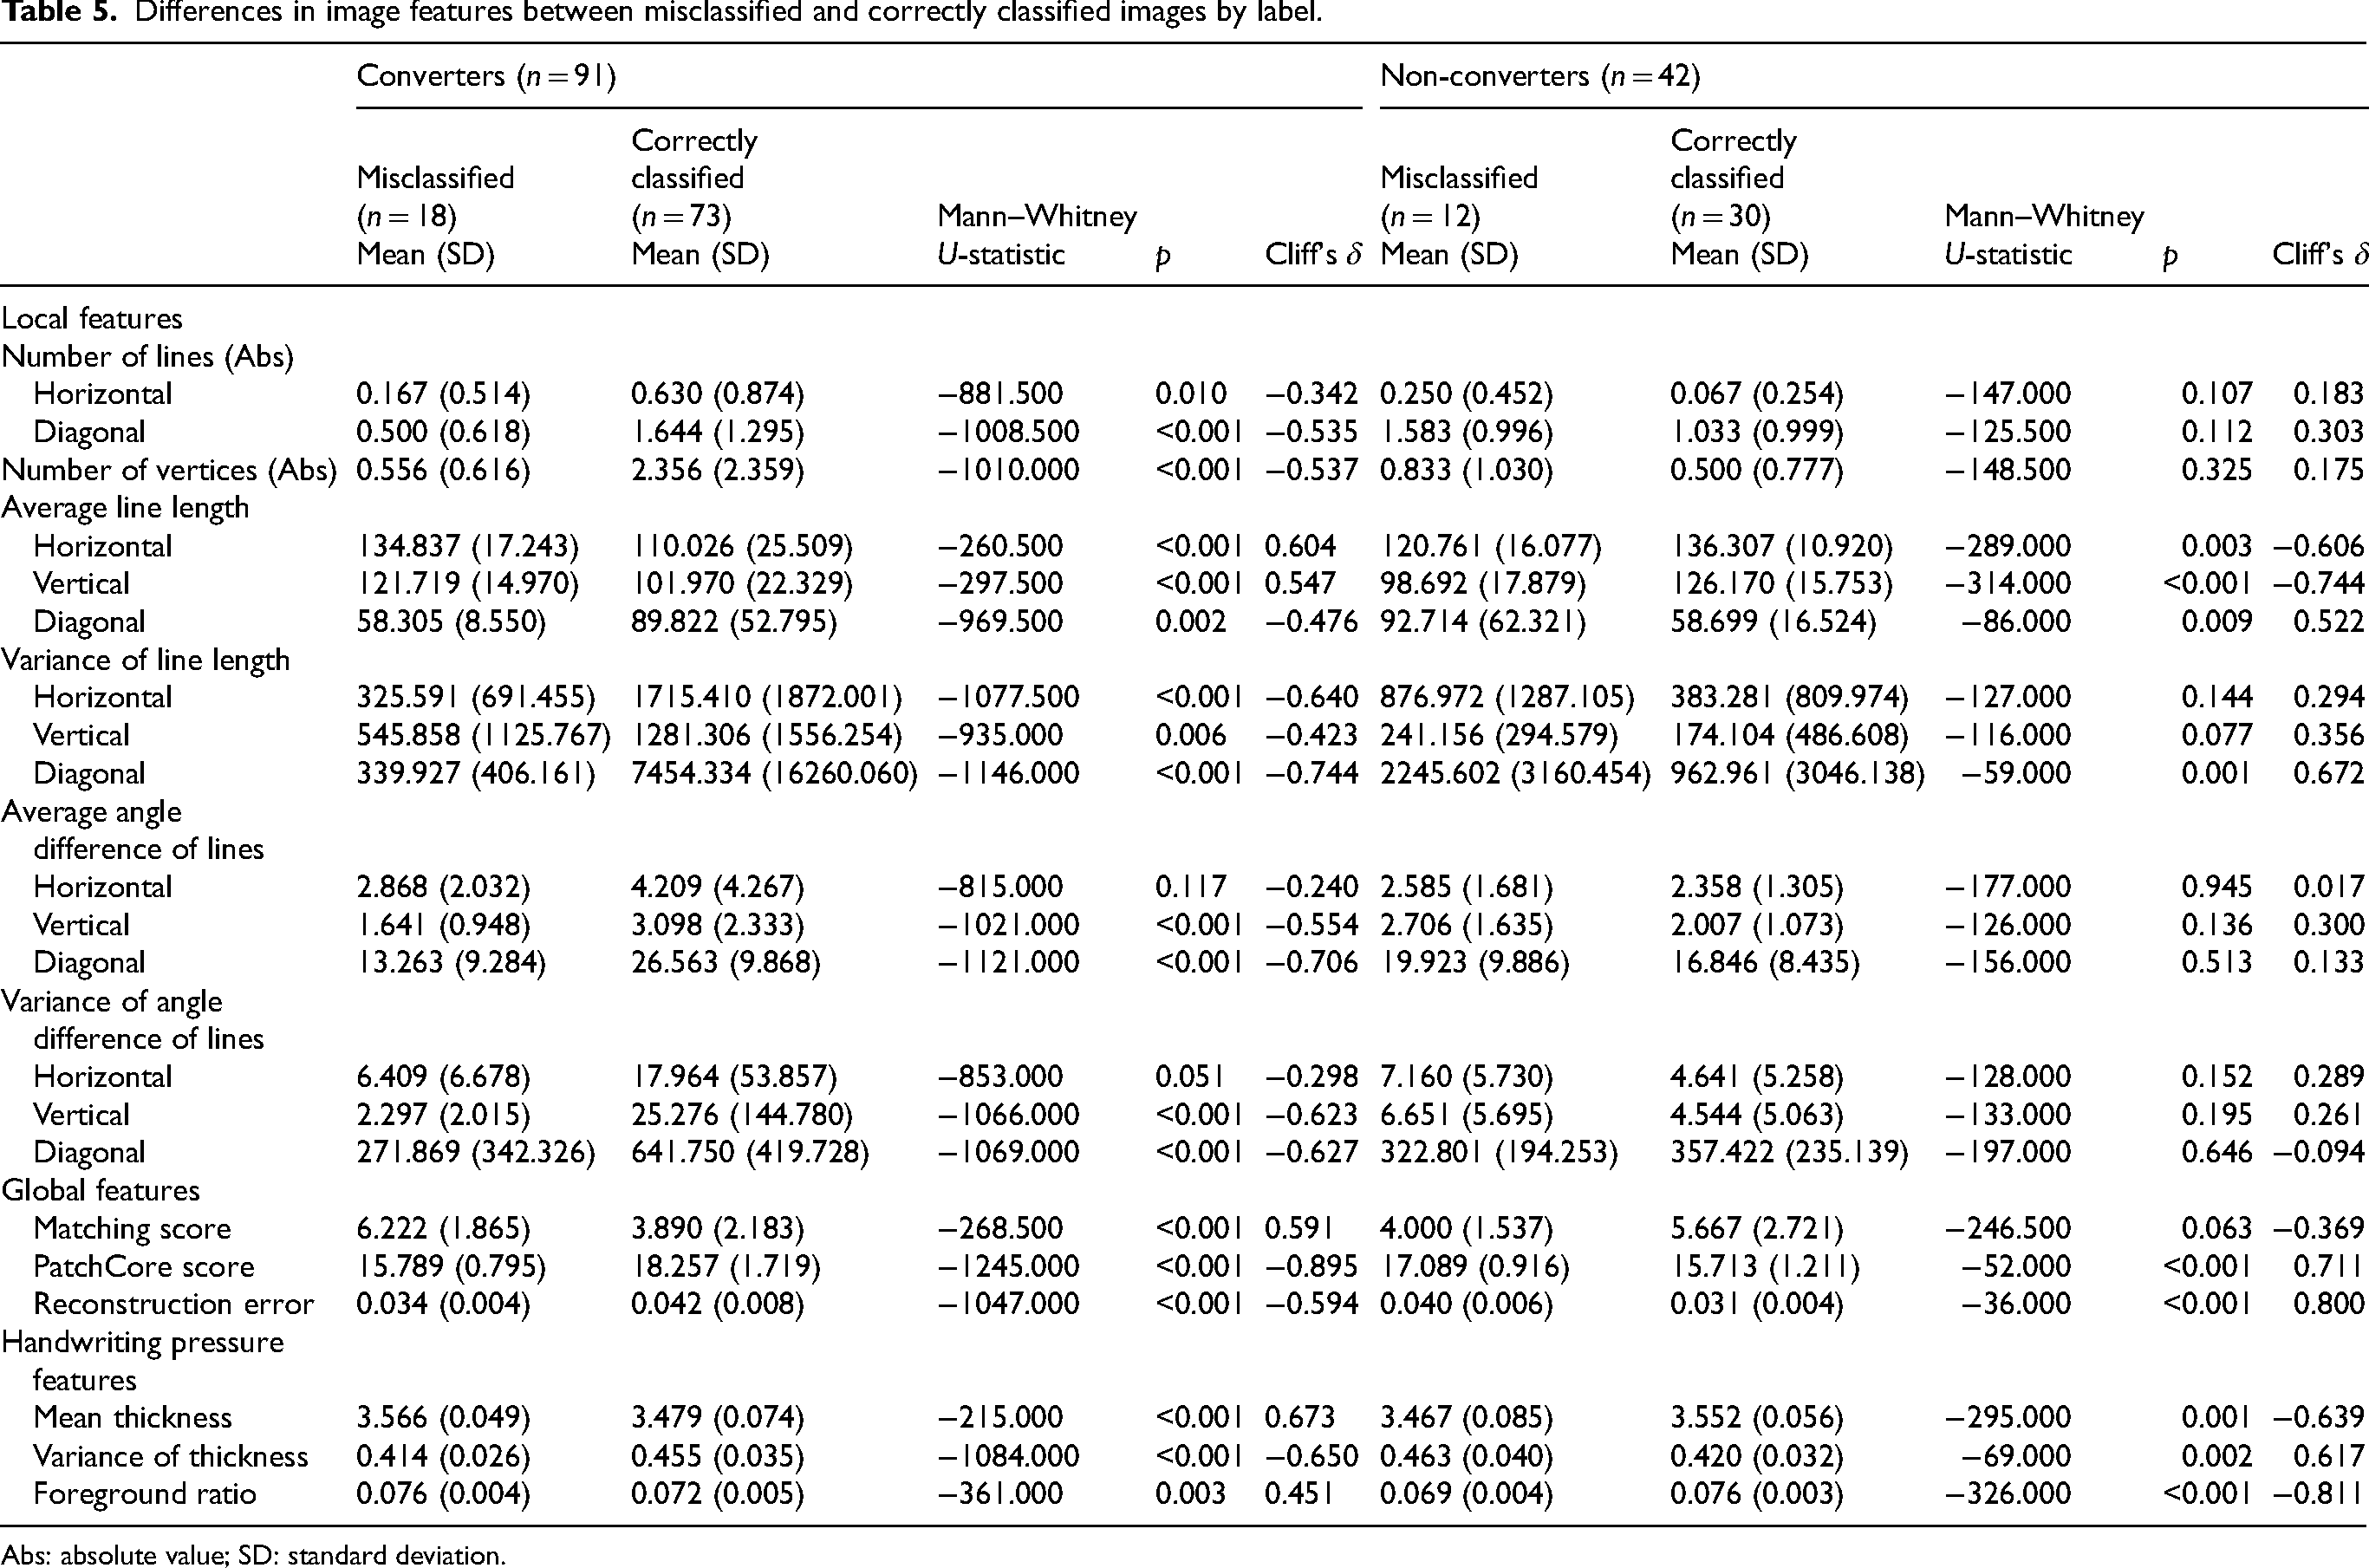
Abs: absolute value; SD: standard deviation.
For non-converters, misclassified images exhibited shorter horizontal and vertical lines and longer diagonal lines compared to correctly classified images. Additionally, misclassified images showed greater variance in line lengths among diagonal lines. Global features of misclassified images included higher PatchCore scores and greater reconstruction errors. Handwriting pressure features of misclassified images showed lower mean thickness, greater variance in thickness, and lower foreground ratios compared to correctly classified images.
Discussion
In this study, a machine learning model was developed to predict dementia conversion within 3–5 years using only CCT drawings from patients with NC or MCI at baseline. The model achieved an AUC of 0.85, sensitivity 0.80, and specificity 0.71 using CCT image features and related features (age, sex, and years of education).
Among the tested algorithms, Random Forest demonstrated the most stable generalization performance and was less prone to overfitting compared to XGBoost and SVM. Given the relatively small dataset and the wide variety of feature types, including categorical variables and deep learning-derived image features, Random Forest was considered the most suitable approach for this study.
To our knowledge, this is the first study to develop a machine learning approach for identifying individuals at high risk of dementia conversion using CCT alone, without requiring time-consuming neuropsychological test batteries or invasive biomarker assessments.
Previous studies using CCT data have primarily focused on distinguishing dementia status at the time of testing. One study reported an AUC of 0.73, with a sensitivity of 81.9% and specificity of 53.9%, by manually scoring features such as the number of vertices, edge lengths, and three-dimensionality to classify dementia versus non-dementia. 36 Another study achieved an AUC of 0.78, accuracy 0.77–0.78, and F1 score 0.50–0.51 in classifying MCI versus normal cognition using deep learning with CCT. 37 In contrast, our study tackled the more challenging task of predicting future dementia conversion by detecting subtle drawing differences between future converters and non-converters.
To enhance predictive performance, our approach not only considered traditional features related to geometric deviations from the model cube drawing, but also utilized deep learning-based anomaly-detection models to extract features that distinguish pathological drawing distortions from drawing distortions arising from normal aging. In particular, PatchCore, an industrial-grade anomaly-detection model, demonstrated highly effective performance in detecting structural anomalies in drawings, distinguishing pathological changes from normal aging, thereby significantly improving model accuracy.
Our findings suggest that very early signs of constructional apraxia-like symptoms are already present during the preclinical or MCI stages in individuals who will eventually convert to AD, DLB, or FTD and that these subtle changes can be detected using high-precision AI technology. Visuospatial dysfunction in patients with dementia encompasses difficulties in object recognition, spatial orientation, figure-ground discrimination, visual integration, and visual attention.38–41 These impairments are often reflected in CCT drawings as inappropriate sizes, inaccurate line lengths and shapes, failures in connecting lines or positioning, lack of parallelism, missing elements, unnecessary lines, and distortions or simplifications of three-dimensional structures.38,39,41–43
In this study, converters’ drawings exhibited greater discrepancies from the reference values for the number of lines in all directions (horizontal, vertical, and diagonal) and the number of vertices compared to those of non-converters. These deviations likely reflect characteristics such as drawing with multiple discontinuous lines rather than a single straight line, producing wavy lines, endpoints failing to overlap at a single point, and lines that were inappropriately segmented or connected at incorrect points.
Converters also exhibited shorter horizontal and vertical lines and longer diagonal lines than non-converters, along with greater variance in the lengths of all line types. This pattern suggests a distorted drawing style characterized by compromised perspective and reduced accuracy. Additionally, the average angle differences between lines of the same type, as well as the variance of angle differences between horizontal and diagonal lines, were larger. These findings indicate that converters’ drawings lacked parallelism, reflecting inconsistency in their drawing styles (Figure 7).
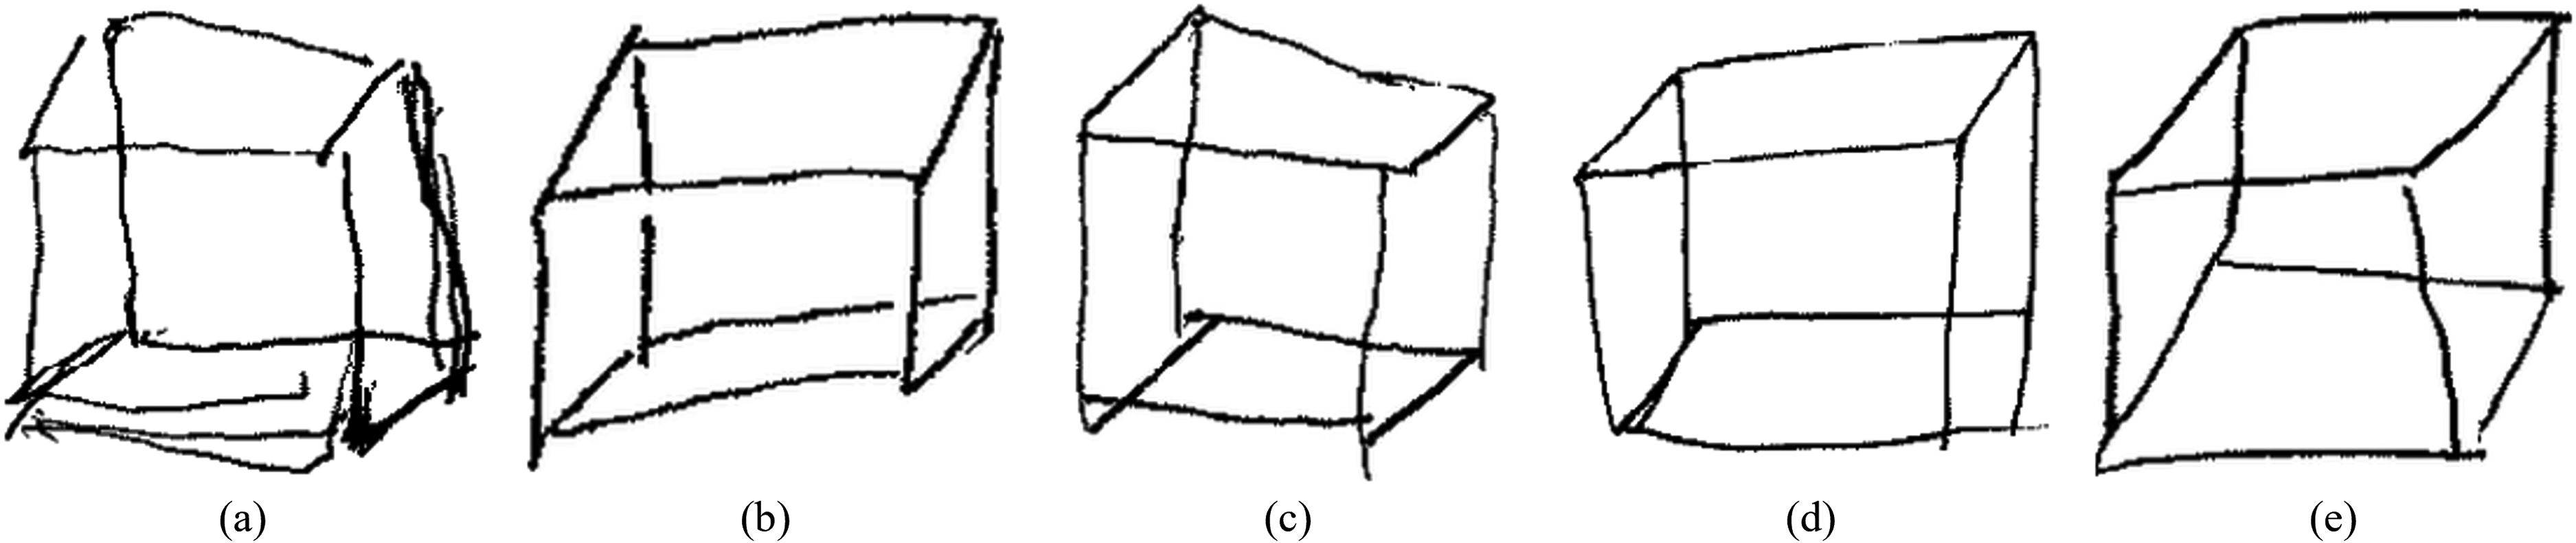
Characteristics of converters’ drawings. (a) Multiple discontinuous, wavy lines instead of a single straight line. (b) Lines segmented at intersections with other lines. (c) Endpoints do not converge at a single point. (d) Incorrect connection positions of endpoints. (e) Lengths and angles between lines of the same type differ, causing a lack of parallelism.
The lower matching scores observed in converters further support the distinct drawing characteristics associated with progression to dementia. Conversely, non-converters demonstrated higher matching scores, suggesting that while aging may cause some drawing distortions, as noted in previous studies, their drawings remained closer to the model cube drawing than those of converters. The higher PatchCore scores and reconstruction errors of the CAE using the core set indicate that converters exhibit structurally different drawing styles, not only compared to the model cube drawing but also to non-converters. While normal aging can lead to distortions in drawings and a reduction in the accuracy of the CCT, 16 this study demonstrates that these distortions have structurally distinct characteristics compared to those observed in individuals at high risk of progressing to dementia within 3–5 years.
Additionally, consistent with previous studies, 30 converters exhibited weaker handwriting pressure, drew thinner lines, and showed greater variability in line darkness compared to non-converters. The association between lower grip strength and increased dementia risk has been previously highlighted,44–46 and the results of this study align with these findings.
Compared to DLB, AD typically presents with milder visuospatial impairments or constructional deficits, while FTD shows even milder visuospatial impairments than AD and DLB, as reported in previous studies.15,47–50 Despite most converters in this study being patients with AD, the model achieved an AUC of 0.85 based on a single test result related to visuospatial impairment. This result supports those of previous studies12,13 emphasizing the importance of visuospatial function as an indicator for the early detection of dementia.
The SHAP values indicated that among the image features, those generated using the PatchCore algorithm contributed the most to the model's predictions. Visualization of the anomaly-detection points identified by the PatchCore algorithm confirmed the model's appropriateness, as these points closely corresponded to areas that clinical psychologists typically focus on during assessments (Figure 8). This study demonstrated that PatchCore's anomaly-detection approach, originally developed for industrial applications, can be effectively repurposed to analyze visuospatial cognitive impairments in drawing tests. Additionally, the reconstruction error of the CAE and the variances in horizontal and vertical line lengths contributed significantly to the model's predictions. These results indicate that both global structural features, particularly those related to differences from drawing distortions associated with normal aging, and local features, particularly those related to parallelism and consistency, are critical for accurate prediction.
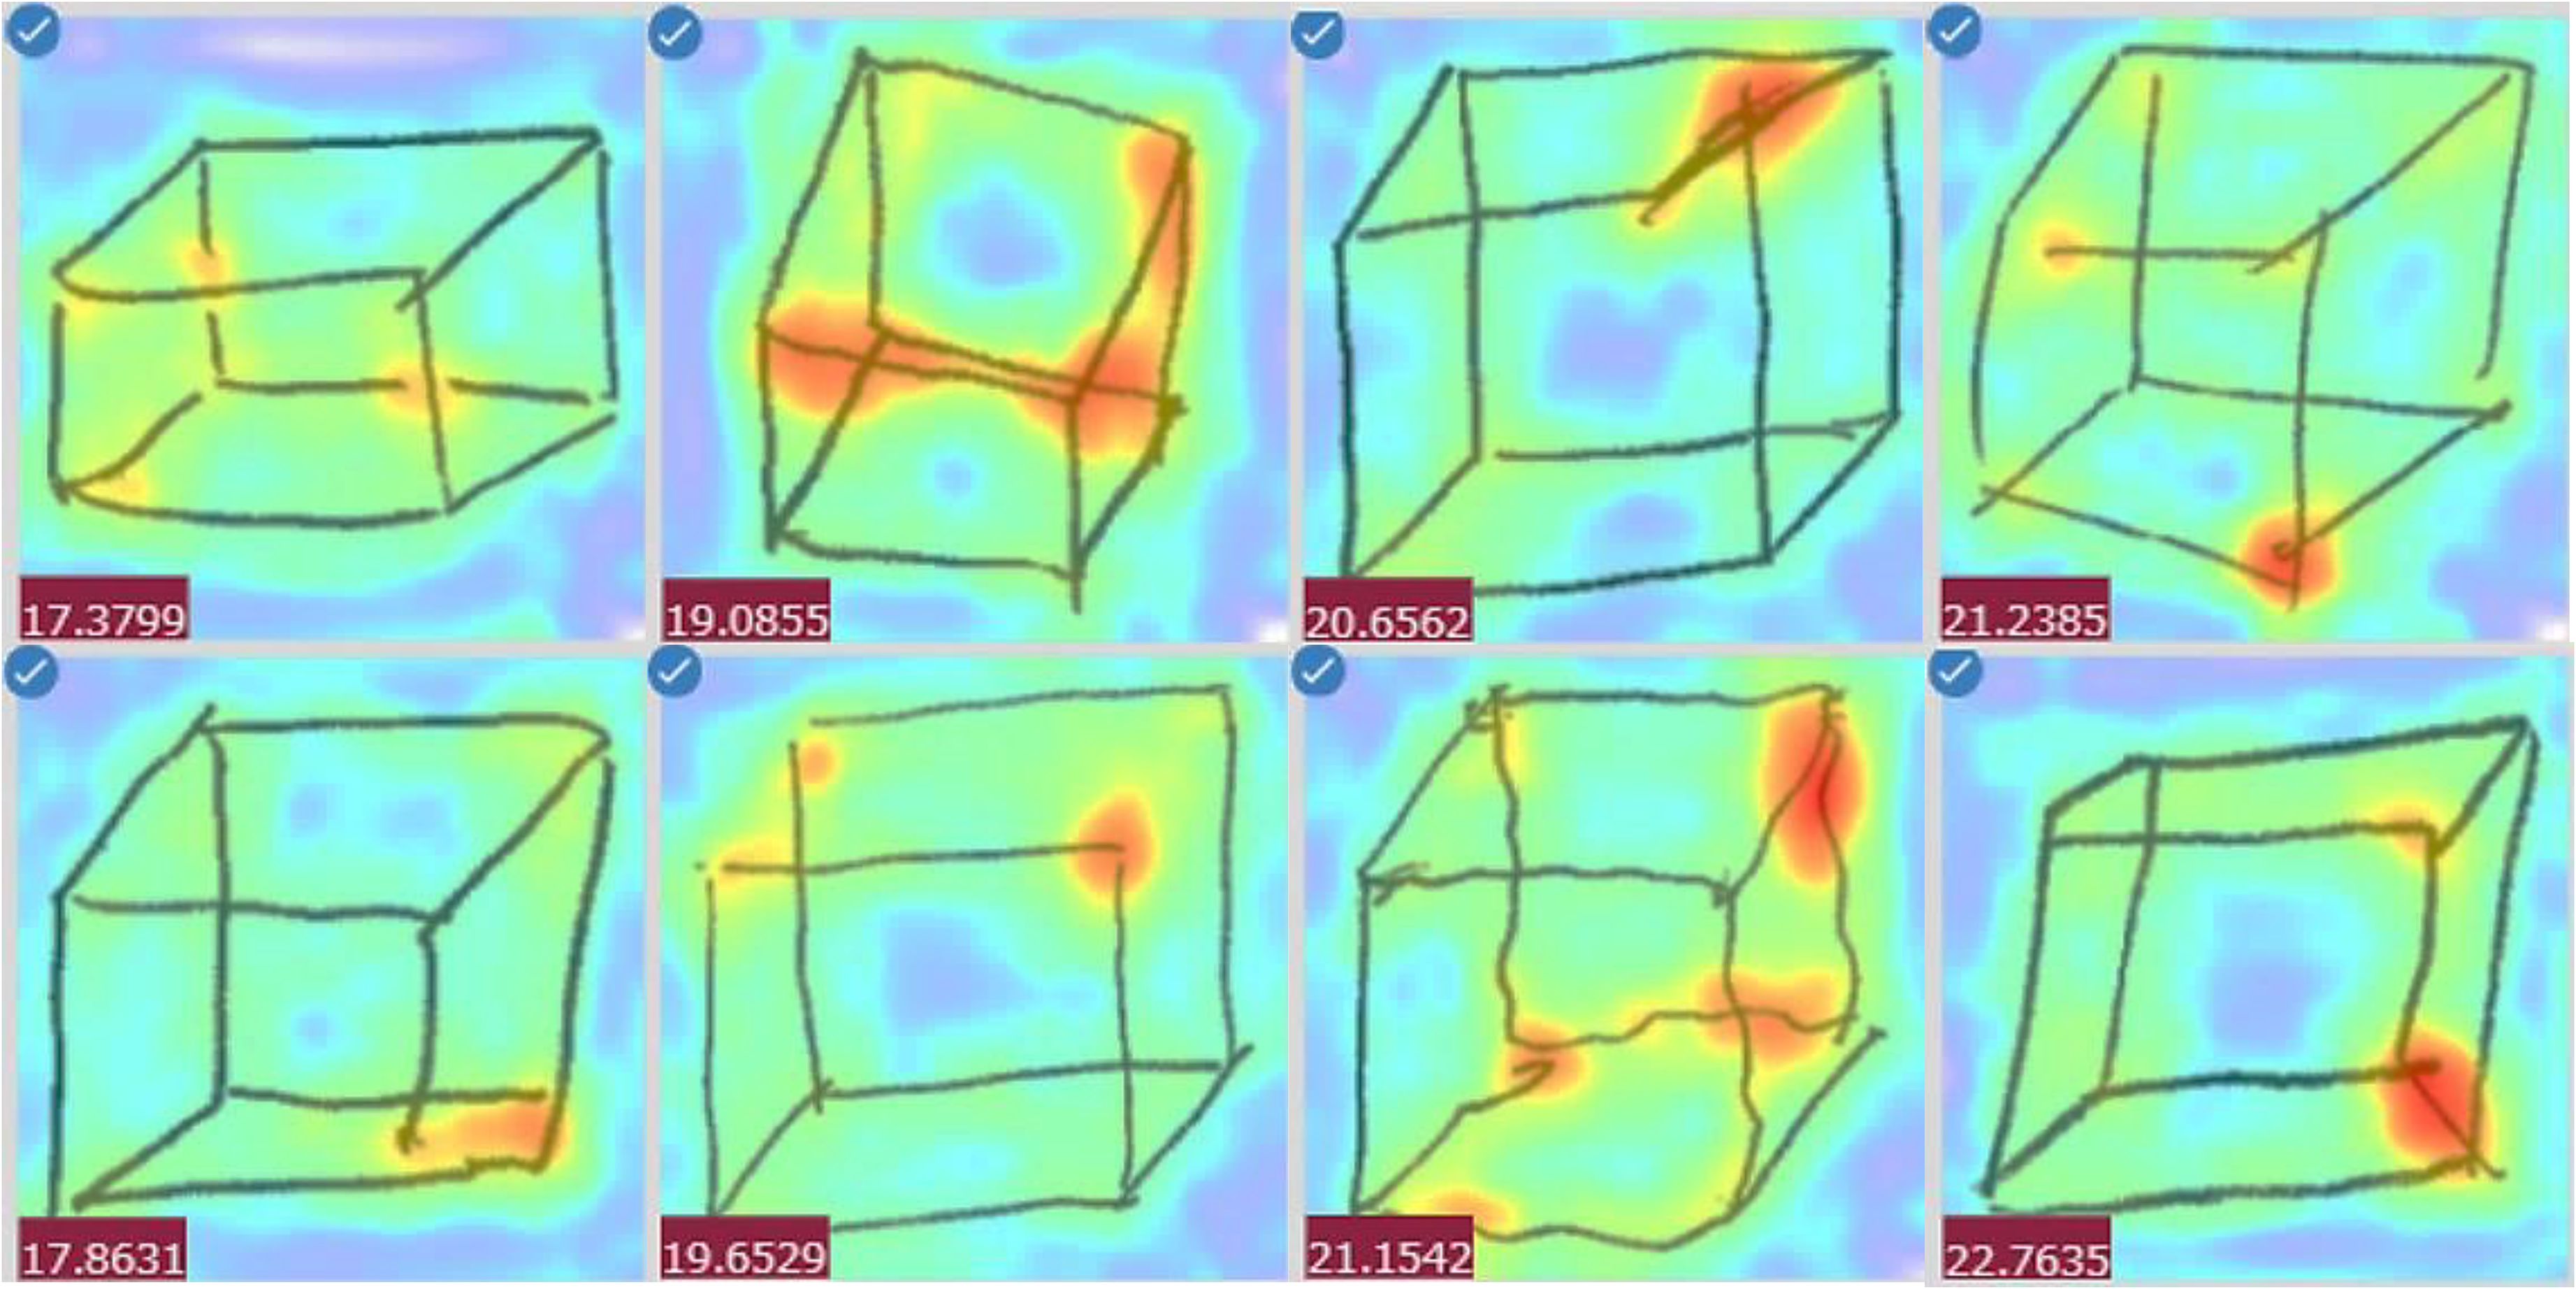
Visualization of anomaly-detection locations using PatchCore.
Conversely, analysis of misclassified cases revealed that converter and non-converter images shared features with their misclassified categories. In other words, some converters display drawing styles similar to those of non-converters and vice versa. This suggests that even with advanced AI technology, misclassification remains possible. Some high-risk individuals may present with minimal visuospatial impairments and produce relatively undistorted drawings, whereas cognitively normal individuals may create significantly distorted drawings due to factors such as their educational background. Therefore, to improve the reliability of dementia-risk assessment, CCT should be administered in conjunction with other cognitive domain evaluations, such as memory tests.
Our findings suggest that AI-enhanced CCT technology has the potential to serve as a practical solution for community-based, large-scale screening, providing a rapid, minimally invasive, and cost-effective option. Beyond these advantages, the CCT's non-verbal nature makes it uniquely suitable for cognitive assessment across diverse populations, including individuals with hearing impairments, non-native speakers, and immigrant populations, contributing to more equitable and accessible cognitive screening. This aspect will become increasingly important as healthcare systems continue to serve diverse communities with varying levels of language proficiency and cultural backgrounds.
Future integration into digital platforms could facilitate remote cognitive assessments, reduce geographical barriers, and support the broader adoption of dementia screening in both clinical and community settings.
Limitations
While the model demonstrated good sensitivity (0.80), its specificity was relatively low (0.71). The data were collected retrospectively from a single memory clinic in Japan, which may have introduced several sources of bias and limited the generalizability and external validity of our findings. This is recognized as a major limitation of our study.
Patients with subjective memory complaints have a 2.07 times higher relative risk of progressing to dementia than those without such complaints. 51 Additionally, depression is a known risk factor for dementia. 52 The study participants were patients who visited the clinic multiple times due to perceived cognitive abnormalities reported by themselves or their families. Consequently, the sample may have included a higher proportion of individuals with subjective memory complaints or depressive tendencies compared to the general population, indicating a potentially high-risk sample.
Analysis of misclassified cases revealed that some non-converters exhibited drawing styles similar to those of converters. In this study, we attempted to exclude MCI cases based on follow-up diagnostic results at 3–5 years according to Petersen's criteria 24 or DSM-5; however, complete exclusion was difficult, particularly for non-amnesic MCI, and some may have been included in the non-converter group.
From a data availability perspective, this database began collection in 2011, limiting the maximum available follow-up period to approximately 10 years. Additionally, the consultation rate during the pre-dementia conversion stage was low, and long-term longitudinal data were very limited. While extending the follow-up period would enable analysis of longer-term progression patterns, prolonged follow-up increases the risk of new medical events such as stroke, trauma, and depression, which could obscure the causal relationship with baseline image features. Considering these factors, the observation period for this study was set at 3–5 years from baseline.
Although some variations exist across studies, reports indicate that the annual conversion rate from MCI to dementia and the recovery rate from MCI to normal cognition are each approximately 15%26,53,54; approximately half of the patients with MCI are expected to show clear outcomes within 3–5 years. This period setting was judged to capture relatively definitive cognitive outcomes rather than short-term temporary changes. Nevertheless, progression to dementia can take longer than this timeframe,5–7 and some patients classified as non-converters may have developed the condition later. Additionally, patients with MCI or an undetermined diagnosis after 3–5 years, as well as those who were challenging to follow up with, were excluded. Among those difficult to follow up, some may have been institutionalized or deceased, while others might have experienced improved or stable cognitive function, and therefore, did not return to the clinic. This selection bias may have influenced the study's results.
The data used in this study were collected from a single facility in Japan. The CCT is influenced by the educational content and standards of a country or region, 18 and the findings may reflect Japan-specific factors, such as mathematics education. The SHAP value for years of education, as shown in Table 4, was 0.00622, which was relatively small compared to the image features. These results may differ in countries or regions where drawing cubes is not a common practice in school education.
Despite these limitations, our model achieved a high AUC of 0.85 using only CCT images, demonstrating strong predictive performance with a rapid, non-invasive, and low-burden assessment. While the feature-extraction methodology is adaptable through calibration and may be applicable across cultural contexts using region-specific data, extensive external validation remains essential for clinical translation. To address these limitations and ensure broader applicability, we are preparing multi-center collaborative validation studies. These upcoming efforts will involve diverse populations across various healthcare settings and cultural backgrounds, leveraging larger sample sizes to enhance the robustness, generalizability, and real-world applicability of our model.
Conclusion
A machine learning model was developed to predict dementia conversion within 3–5 years using only CCT drawings from patients with NC or MCI at baseline. The model achieved strong predictive performance with an AUC of 0.85.
To our knowledge, this is the first study to develop a machine learning approach for identifying individuals at high risk of dementia conversion using CCT alone, without requiring time-consuming neuropsychological test batteries or invasive biomarker assessments. Notably, PatchCore, an industrial-grade anomaly-detection model, exhibited highly effective performance at detecting structural anomalies in drawings that distinguish pathological changes from normal aging.
Our findings indicate that very early signs of constructional apraxia-like symptoms are already present during the preclinical or MCI stages in individuals who will eventually convert to AD, DLB, or FTD and that these subtle changes can be detected using high-precision AI technology.
For community-based population-screening programs, rapid, minimally invasive, and cost-effective assessment tools that can provide highly accurate and efficient screening while minimizing patient burden are essential. When combined with minimal additional assessments such as brief memory tests, this AI-enhanced CCT technology has potential applications for developing practical screening tools suitable for real-world implementation.
Footnotes
Acknowledgements
We sincerely thank the patients and their families for providing the data. We also extend our gratitude to Ms. Shigemi Yamamoto (Department of Neurology, National Center for Geriatrics and Gerontology) for organizing the data, Assoc. Prof. Takashi Nakazawa (Emerging Media Initiative, Kanazawa University) for his programming guidance, and Prof. Nobuhiko Asakura (Center for Mathematical Modeling and Data Science, The University of Osaka) and Assoc. Prof. Atsushi Koike (Graduate School of Information Sciences, Tohoku University) for their advice on performance improvement.
ORCID iDs
Ethical considerations
The study adhered to the principles of the Declaration of Helsinki and was approved by the Research Ethics Committee of the National Center for Geriatrics and Gerontology (approval number 1449).
Consent to participate
This retrospective study employed an opt-out procedure, as many patients had passed away, relocated, or were transferred to other institutions, making the acquisition of individual consent impractical.
Consent for publication
This article contains data derived from individual participants. As the study was retrospective and many patients were deceased, had relocated, or had been transferred, obtaining written informed consent for publication from each individual was impractical. In accordance with the Declaration of Helsinki, the Research Ethics Committee of the National Center for Geriatrics and Gerontology approved the study and granted a waiver of individual consent for publication (approval number 1449). An opt-out procedure was implemented, allowing patients or their legally authorized representatives to decline the use of their data. All non-essential identifying information has been omitted to protect participant confidentiality. We confirm that documentation of the approved waiver and opt-out procedures is maintained in our institutional research records.
Author contribution(s)
Funding
The authors disclosed receipt of the following financial support for the research, authorship, and/or publication of this article: This work was supported by the Grant-in-Aid for JSPS Fellows (Grant Number 23KJ1482) and Research Funding for Longevity Sciences (20–43) from the National Center for Geriatrics and Gerontology, Japan.
Declaration of conflicting interests
The authors declared no potential conflicts of interest with respect to the research, authorship, and/or publication of this article.
Data availability statement
The dataset will be made publicly available on GitHub upon publication. Due to ongoing application development, the source code is not publicly available at this time but can be provided by the corresponding author upon reasonable request for academic research purposes.