
Abstract
Background
Enlarged perivascular spaces (EPVS) and mild behavioral impairment (MBI) are associated with greater dementia risk.
Objective
We investigated cross-sectional associations between EPVS burden and MBI presence and symptom severity.
Methods
Participants were dementia-free older adults in the Comprehensive Assessment of Neurodegeneration and Dementia (COMPASS-ND) study. EPVS were assessed using a validated visual rating scale applied to T2-weighted magnetic resonance imaging. MBI was measured using the informant-reported MBI Checklist (MBI-C) with a cut-point of >5 for MBI presence. Multivariable logistic and zero-inflated negative binomial regressions modelled EPVS associations with MBI presence and symptom severity, respectively, adjusting for age, education, Montreal Cognitive Assessment score, and presence of hypertension with an EPVS*sex interaction term.
Results
Among 363 participants (52.9% female), every 1-point rise in total EPVS score was associated with 1.28-fold greater odds of having MBI (95%CI:1.06–1.53, p = 0.009). When examining regional EPVS burden, those with higher centrum semiovale scores had greater odds of MBI (aOR = 1.47, 95%CI:1.08–2.00, p = 0.01), but this association was not significant for the basal ganglia (aOR = 1.37, 95%CI:0.95–1.97, p = 0.09) or midbrain (aOR = 1.49, 95%CI:0.80–2.79, p = 0.21). Total and regional EPVS scores were not associated with MBI symptom severity. None of the associations were moderated by sex.
Conclusions
Older adults with greater global and centrum semiovale EPVS burden are more likely to have MBI. These findings suggest that early microvascular pathology may contribute to later-life emergent and persistent behavioral symptoms, although longitudinal data are required, along with other indicators of vascular pathology.
Keywords
Introduction
Dementia is characterized by cognitive and behavioral impairment severe enough to affect daily life. While Alzheimer disease (AD) is the most common cause of dementia in older adults, there is a significant role of vascular factors in the trajectory of dementia. 1 Cerebrovascular risk factors and related diseases among older adults affect nearly one-third of patients with dementia. 2 Brain infarcts, arterial lipid deposits, or arteriolar wall thickening have been found in many patients diagnosed with AD in autopsy studies, indicating comorbid vascular pathology. 3 Studies also implicate vascular disease in over 90% of cases of probable AD and mixed AD pathology. 4
Cerebral small vessel disease (CSVD) is the most common vascular pathology in dementia. CSVD is a chronic and progressive vascular disease that affects arterioles, capillaries, and small veins of the brain. 5 Several longitudinal studies have investigated the coexistence of CSVD with AD pathology in those with dementia, with some indicating an additive relationship and others illustrating a synergistic contribution to cognitive impairment.6–9 Neuroimaging features of CSVD are associated with a greater risk of AD. 10
Enlarged perivascular spaces (EPVS) are a neuroimaging feature of CSVD, alongside other markers such as white matter hyperintensities (WMHs) and lacunes. 11 EPVS has been reported to increase in number on magnetic resonance imaging (MRI) with age, along with other brain features of CSVD.12,13 Similar to other CSVD features,13,14 high EPVS burden predicts future risk of dementia. 15 EPVS burden in the centrum semiovale is associated with a greater risk of incident cognitive decline and dementia, independent of other vascular risks, total brain volume, WMHs, and covert infarcts. 16 Hence, EPVS may be a useful subclinical MRI marker to identify individuals who are at higher risk of developing dementia.
While behavioral symptoms are core features of dementia, these symptoms can also emerge in advance of dementia.17,18 These behavioral changes have been incorporated into a validated clinical construct called mild behavioral impairment (MBI). 17 MBI is characterized by the later-life onset of persistent neuropsychiatric symptoms (NPS) that represent change from longstanding behaviors, as an indicator of dementia risk. Numerous studies have supported MBI, whether concurrently presenting with mild cognitive impairment (MCI) or absent objective cognitive impairment in persons with subjective cognitive decline (SCD) or normal cognition, as a clinical marker of risk for incident dementia.18–22
The link between MBI and specific neurodegenerative etiologies of dementia has been explored primarily with AD biomarkers, including amyloid-β (Aβ) and phosphorylated tau (p-tau), AD genetic risk factors like Apolipoprotein E, and AD patterns of brain atrophy or neurodegeneration.23–33 However, other brain pathologies and atrophy patterns may contribute to later-life emergent and persistent behavioral symptoms.34,35 There is some evidence supporting the association between cerebrovascular pathologies and behavioral impairment. Recent findings show that NPS are common in cerebral amyloid angiopathy (CAA), with severity linked to greater white matter hyperintensity volume. 36 Postmortem studies also reported associations between NPS and cerebrovascular disease. 37 Cardiovascular risk factors, like diabetes, hypertension, and stroke, additionally accelerate cognitive decline and exacerbate the presence of NPS, such as depression and apathy.38,39 More recently, studies have found an association between greater burden of vascular risk factors (e.g., hypertension, diabetes, dyslipidemia, high body mass index) and MBI.40–42
However, the association between CSVD markers and MBI remains poorly characterized, and EPVS burden has not been studied in this regard. Therefore, we aimed to investigate cross-sectional associations between EPVS burden and MBI presence (i.e., MBI + status) and symptom severity. Given that EPVS in different regions may reflect different underlying CSVD pathology, a secondary analysis examined associations involving regional EPVS burden in the basal ganglia, centrum semiovale, and midbrain EPVS. 43 Due to the high prevalence of cerebrovascular disease in older adults with dementia and the association between MBI and WMH volume, 44 we hypothesized that older adults with greater EPVS burden would be more likely to have MBI and exhibit greater MBI symptom severity.
Method
Study design
Data were from the Comprehensive Assessment of Neurodegeneration and Dementia (COMPASS-ND), a Canada-wide prospective cohort study aiming to investigate several causes of neurodegeneration and their interactions (ClinicalTrials.gov NCT03402919).45,46 COMPASS-ND participants included older adults with dementia, MCI, SCD, and cognitively normal individuals (CN). For this study, we defined CN as those who performed in the normal range on neuropsychological testing, which includes those who were CN and had SCD. Data collected included sociodemographic information, clinical and cognitive data, structural brain imaging, biomarkers, and measures of sensory function. Extensive descriptions of COMPASS-ND recruitment and data collection procedures have been published elsewhere. 45 The COMPASS-ND study was approved by the Jewish General Research Ethics Board. 45 Data were downloaded on October 2, 2023. Data were collected with ethical approval by institutional review boards at each of the 13 study sites affiliated with the study, with written informed consent provided by participants. 47
Participants
The complete sample from COMPASS-ND consisted of 1284 participants. However, the Mild Behavioral Impairment Checklist (MBI-C) was only introduced into the study about two years after its initial launch.48,49 Therefore, only participants enrolled thereafter were administered the MBI-C (n = 531). From this subset of participants, further exclusions were made if participants (1) had a diagnosis of dementia, indicating that they no longer met criteria for MBI (n = 115) 17 ; (2) were missing T2 MRI scans (n = 36); (3) had poor quality T2 scans, where EPVS severity could not be accurately assessed (n = 15); and (4) were missing data for covariates such as sex, education, or Montreal Cognitive Assessment (MoCA) score (n = 2). The final sample size was 363 (Figure 1).
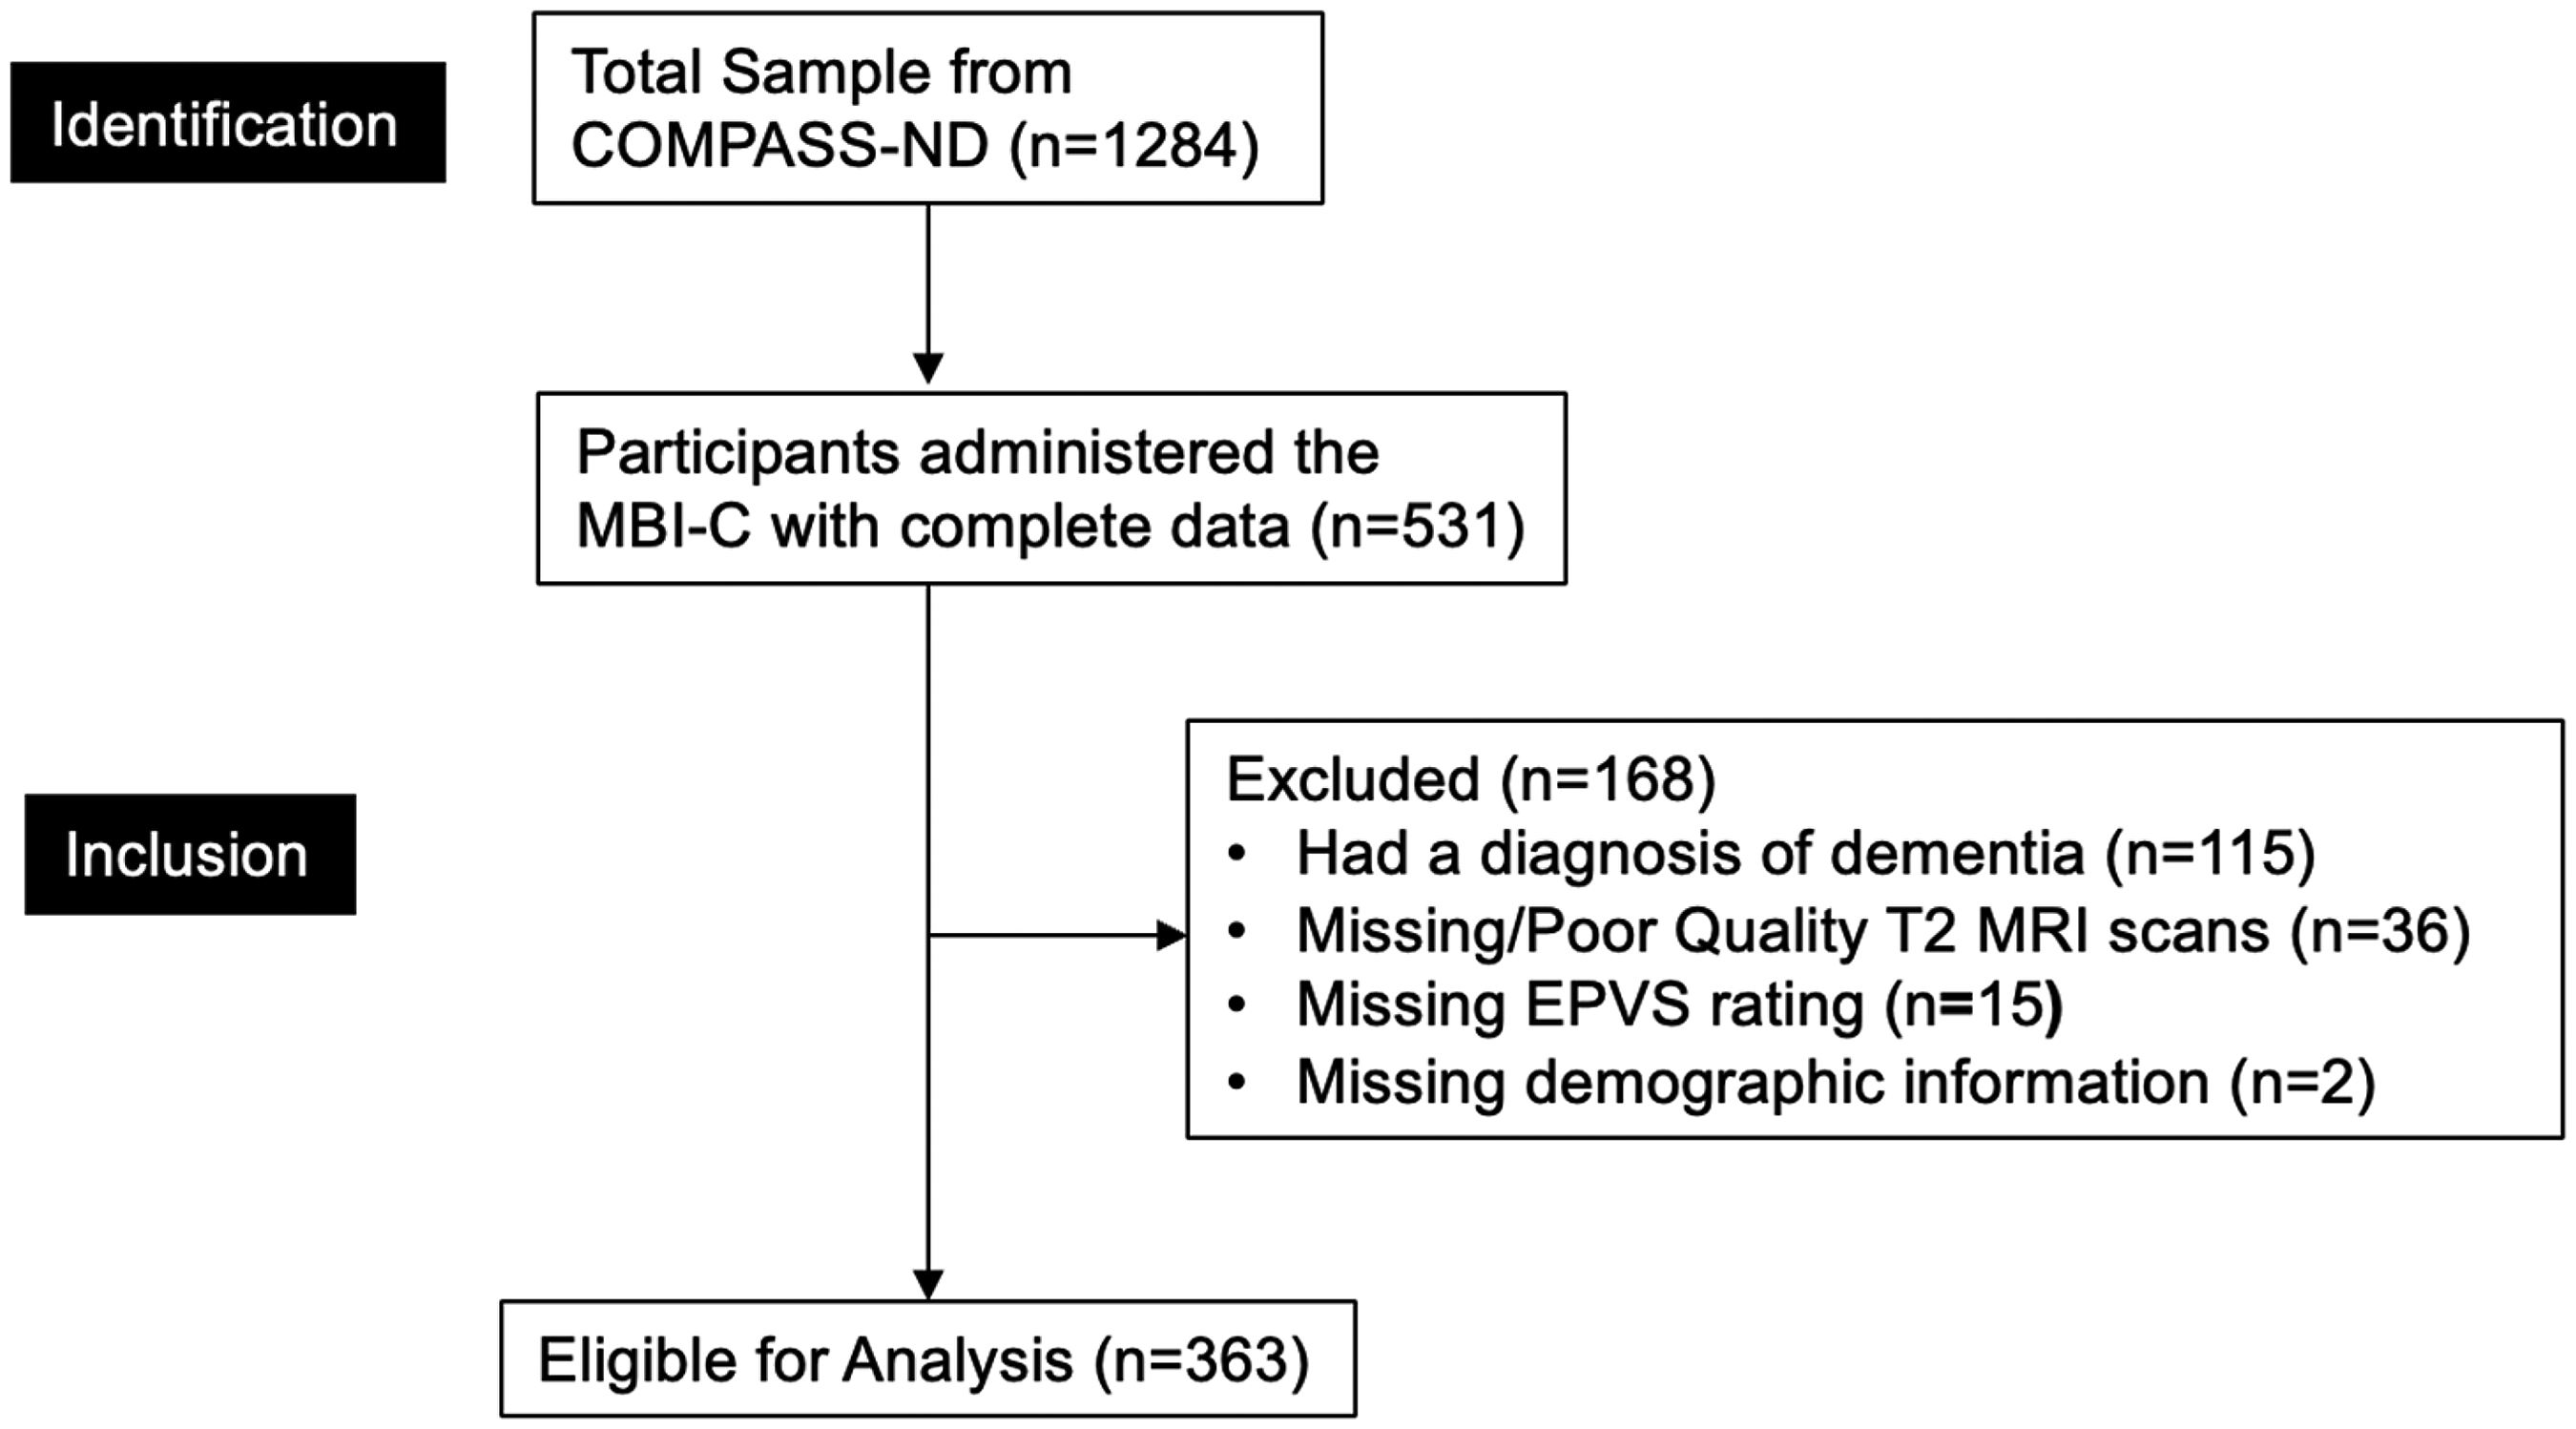
Participant flow-diagram. Demographics included age, sex, education, and MoCA score. COMPASS-ND: Comprehensive Assessment of Neurodegeneration and Dementia; MBI-C: Mild Behavioral Impairment Checklist; MRI: magnetic resonance image; EPVS: enlarged perivascular spaces; MoCA: Montreal Cognitive Assessment.
MRI acquisition
Brain MRIs were acquired using the previously validated Canadian Dementia Imaging Protocol (http://www.cdip-pcid.ca).50,51 Across data collection sites, participants underwent MRI scanning on a 3 T magnet machine. 45 The sequences used included three-dimensional T1, proton density/T2, fluid-attenuated inversion recovery, gradient echo, resting-state functional MRI, and diffusion tensor imaging.
For this study, data on EPVS were collected from T2-weighted MRI scans which allow for more accurate detection of EPVS due to the high contrast between EPVS and the white matter. 52 Three-dimensional inversion-prepared T2-weighted images were acquired using the following parameters: repetition time (TR)/echo time (TE) = 650/20 ms, flip angle = 20°, voxel size = 0.94 × 0.94 × 3.0 mm3, field of view (FOV) = 240 × 240 mm, resolution = 0.94 × 0.94 × 3.0 mm.50,51
Enlarged perivascular spaces rating
EPVS were assessed by three raters (DG, AG, GM) using a validated visual rating scale, which evaluates the number of EPVS in the basal ganglia and centrum semiovale, as well as the presence/absence of EPVS in the midbrain. 53 This scale was used in this study as it incorporates all relevant EPVS sites and allows the rating of all grades of EPVS severity on standard structural brain MRI. 53 EPVS severity is rated from 0–4 in the basal ganglia and centrum semiovale. A rating of 0 indicates no EPVS, 1 indicates 1–10 EPVS, 2 indicates 11–20 EPVS, 3 indicates 21–40 EPVS, and 4 indicates more than 40 EPVS. For the midbrain, only presence or absence is recorded, with a maximum score of 1. For each rating, both hemispheres and all relevant slices are assessed; however, only the slice and hemisphere with the highest number of EPVS are used for the rating. The total EPVS score is obtained from the sum of the three regional ratings.
Inter-rater reliability was established through a training program wherein AG (neurologist with 10 years of experience in neuroimaging research) trained DG and GM on EPVS ratings using 20 training cases graded in person. All three raters then independently rated 20 unseen testing cases. Gwet's agreement coefficient (AC, particularly suitable for samples with greater frequencies of certain values, e.g., 0–1) and percentage agreement with AG were calculated, with Gwet's AC > 0.6 and agreement >70% set a priori as thresholds for DG and GM to attain in order to proceed with independent ratings. 54
Mild behavioral impairment
MBI was measured using the informant-reported MBI-C. 48 The MBI-C comprises five domains assessed by 34 items: decreased motivation (6 questions), emotional dysregulation (6 questions), impulse dyscontrol (12 questions), social inappropriateness (5 questions), and abnormal perceptions (5 questions). Each question assesses the severity of symptoms and can be answered on a scale from 0–3, with 0 indicating no symptoms and 3 indicating severe symptoms. The full MBI-C is available for free at https://www.mbitest.org/. MBI presence was ascertained based on an MBI-C total score >5, as this cut-off can effectively distinguish between participants with and without MBI in CN and mixed CN and MCI samples.55,56 The MBI total score, ranging from 0–102, was calculated by summing the scores for each item, with higher scores indicating more severe symptoms.
Statistical analyses
Multivariable logistic regressions modelled the cross-sectional associations between total, basal ganglia, centrum semiovale, and midbrain EPVS scores (predictors) and MBI presence (outcome). Multivariable zero-inflated negative binomial regression modelled the cross-sectional associations between total, basal ganglia, centrum semiovale, and midbrain EPVS scores (predictors) and MBI symptom severity (outcome). This model was used because the distribution of MBI-C scores resembled an overdispersed (variance > mean and variance increases quadratically) Poisson distribution with an excess of zeroes. Raw coefficients, which are in the natural logarithmic scale, were exponentiated to facilitate interpretation along the original MBI-C scale of measurement. The corresponding coefficients reported in this paper represent the adjusted multiplicative change in the MBI-C total score for each one-unit rise in EPVS score.
The analyses were controlled for age, sex, education, MoCA score, and presence of hypertension; sex was explored as a moderator for all associations as per the COMPASS-ND publications and data access policy. R version 4.4.0 was used to conduct all statistical analyses. 57
Results
Participant characteristics
Participant characteristics for all analyses are summarized in Table 1. Of the total sample (n = 363), the mean age was 74.6 (SD = 7.2, range = 54.8–95.1), 192 (52.9%) were females, and mean years of education was 15.7 (SD = 3.4, range = 5.0–30.0). Regarding cognition, 180 (49.6%) participants had MCI, and 183 (50.4%) were CN, with a mean MoCA score of 25.3 (SD = 3.6, range = 13.0–30.0). There were no significant differences in vascular risk factor presence between the MBI presence and absence groups with the exception of hypertension, which was more common in the MBI group. The median EPVS score was 5.0 (IQR = 4.0–6.0), with a median basal ganglia EPVS score of 2.0 (IQR = 1.0–2.0), centrum semiovale EPVS score of 2.0 (IQR = 2.0–3.0), and midbrain EPVS score of 1.0 (IQR = 1.0–1.0). Lastly, the median MBI-C score was 2.0 (0–8.0); 125 (34.4%) participants were MBI + based on the MBI-C total score cut-off >5.
Participant demographics.
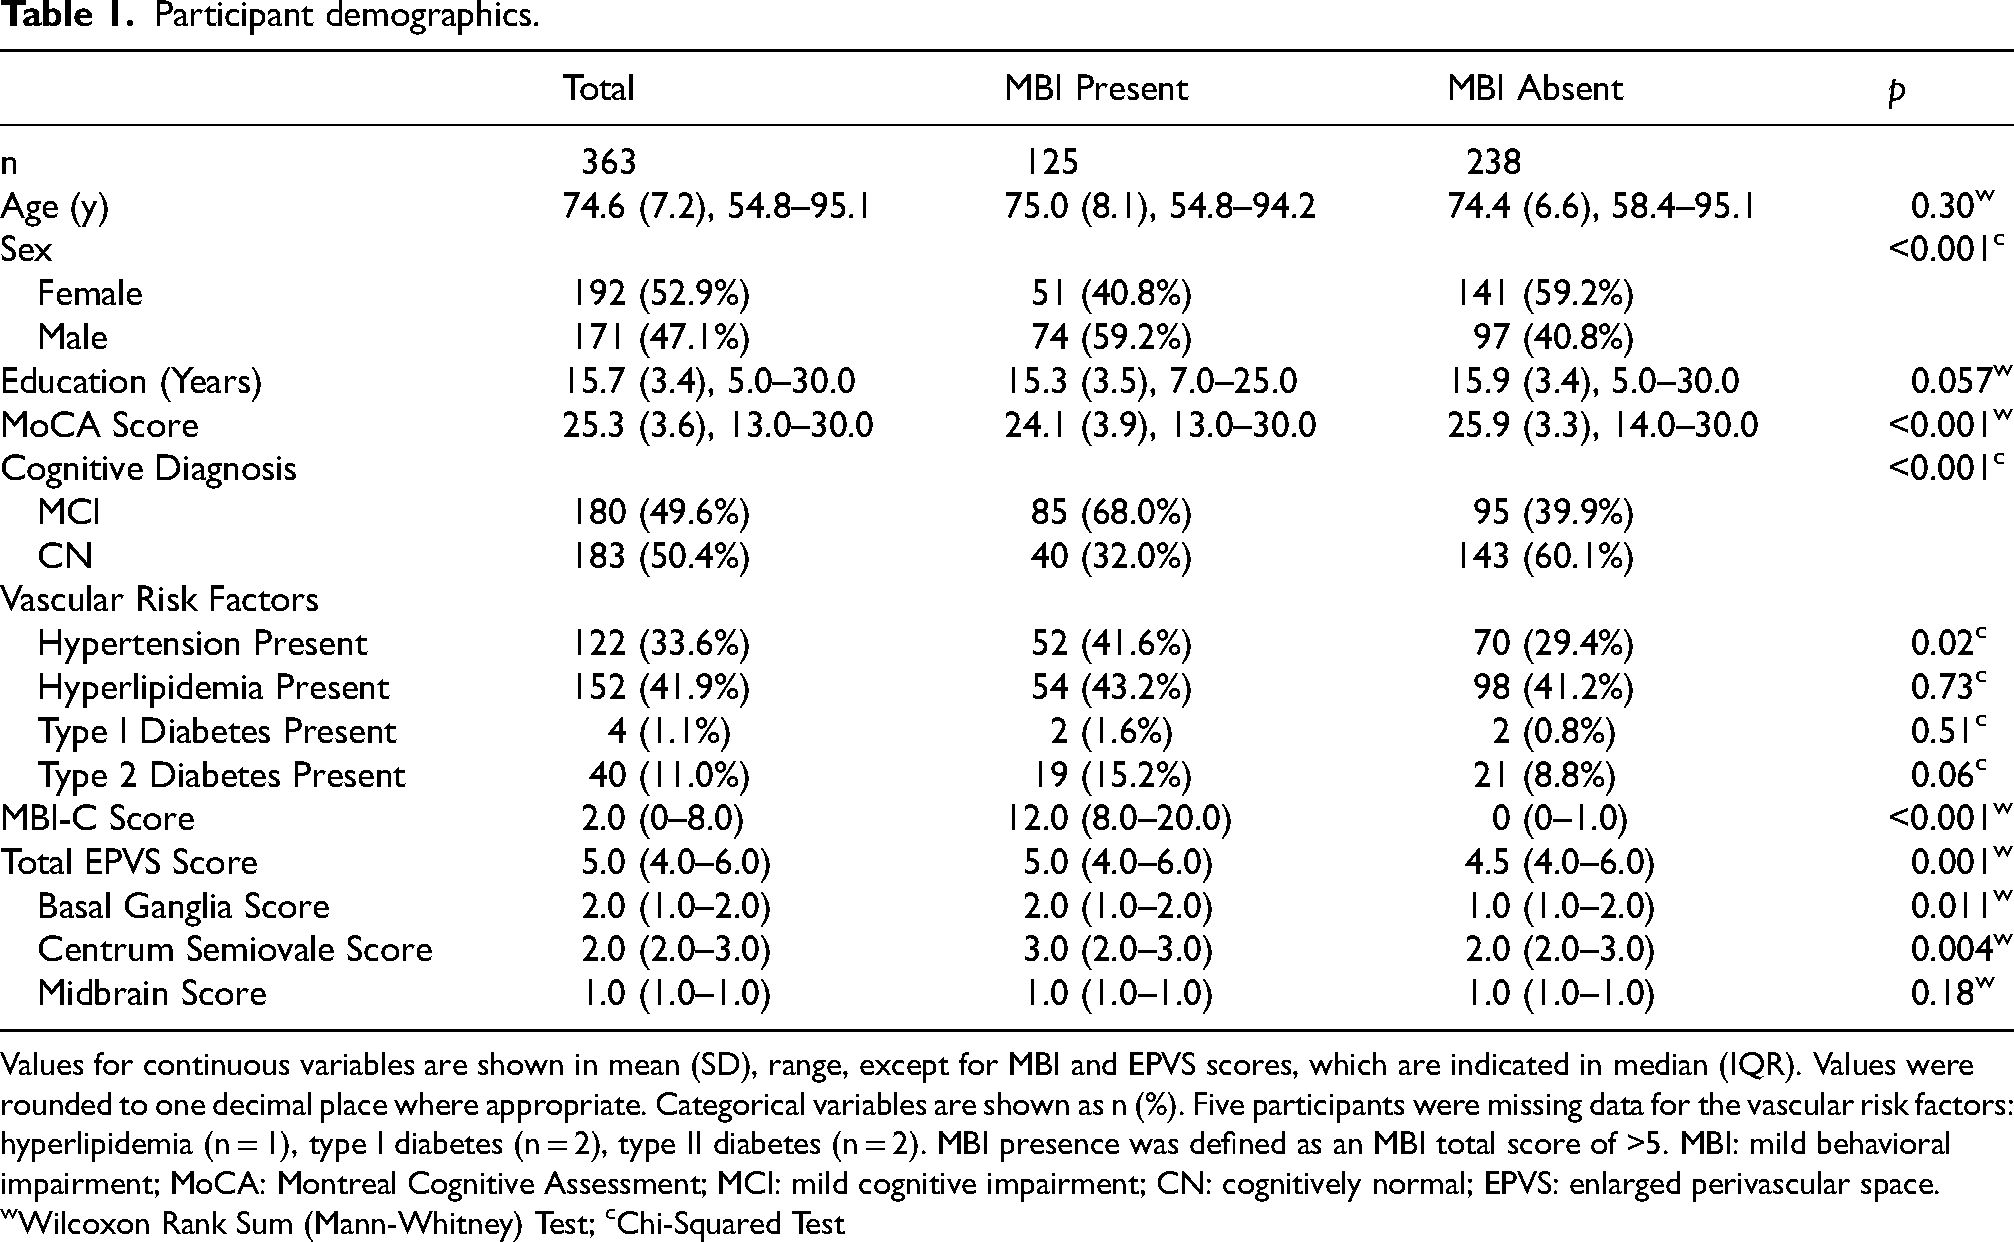
Values for continuous variables are shown in mean (SD), range, except for MBI and EPVS scores, which are indicated in median (IQR). Values were rounded to one decimal place where appropriate. Categorical variables are shown as n (%). Five participants were missing data for the vascular risk factors: hyperlipidemia (n = 1), type I diabetes (n = 2), type II diabetes (n = 2). MBI presence was defined as an MBI total score of >5. MBI: mild behavioral impairment; MoCA: Montreal Cognitive Assessment; MCI: mild cognitive impairment; CN: cognitively normal; EPVS: enlarged perivascular space. wWilcoxon Rank Sum (Mann-Whitney) Test; cChi-Squared Test
Inter-rater reliability of EPVS ratings
Compared to the senior expert rater, each rater attained the pre-set thresholds of Gwet's AC > 0.60 and agreement > 70% based on 20 independently rated test cases from the dataset. Specifically, Gwet's AC and percentage agreement were, respectively, 0.76–0.80 and 85.0–85.7% for midbrain ratings, 0.74–0.94 and 80.0–95.2% for the basal ganglia, and 0.72–0.79 and 81.0–85.0% for the centrum semiovale.
The association between EPVS score and MBI status
As shown in Table 2 and Figure 2, for every 1-point rise in EPVS total score, the odds of having MBI increased by a factor of 1.28 (95%CI:1.06–1.53, p = 0.009). When examining subregion EPVS scores, those with higher centrum semiovale scores had greater odds of MBI (aOR = 1.47, 95%CI:1.08–2.00, p = 0.01). However, this association was not observed for the basal ganglia (aOR = 1.37, 95%CI:0.95–1.97, p = 0.09) or midbrain (aOR = 1.49, 95%CI:0.80–2.79, p = 0.21). The associations between total and subregion EPVS and MBI status were not dependent on sex, based on our moderation analyses (EPVS total*sex aOR = 0.83, 95%CI:0.58–1.17, p = 0.29; EPVS basal ganglia*sex aOR = 0.73, 95%CI:0.37–1.46, p = 0.38; EPVS centrum semiovale*sex aOR = 0.80, 95%:0.44–1.48, p = 0.48; EPVS midbrain*sex aOR = 0.88, 95%CI:0.25–3.08, p = 0.84).
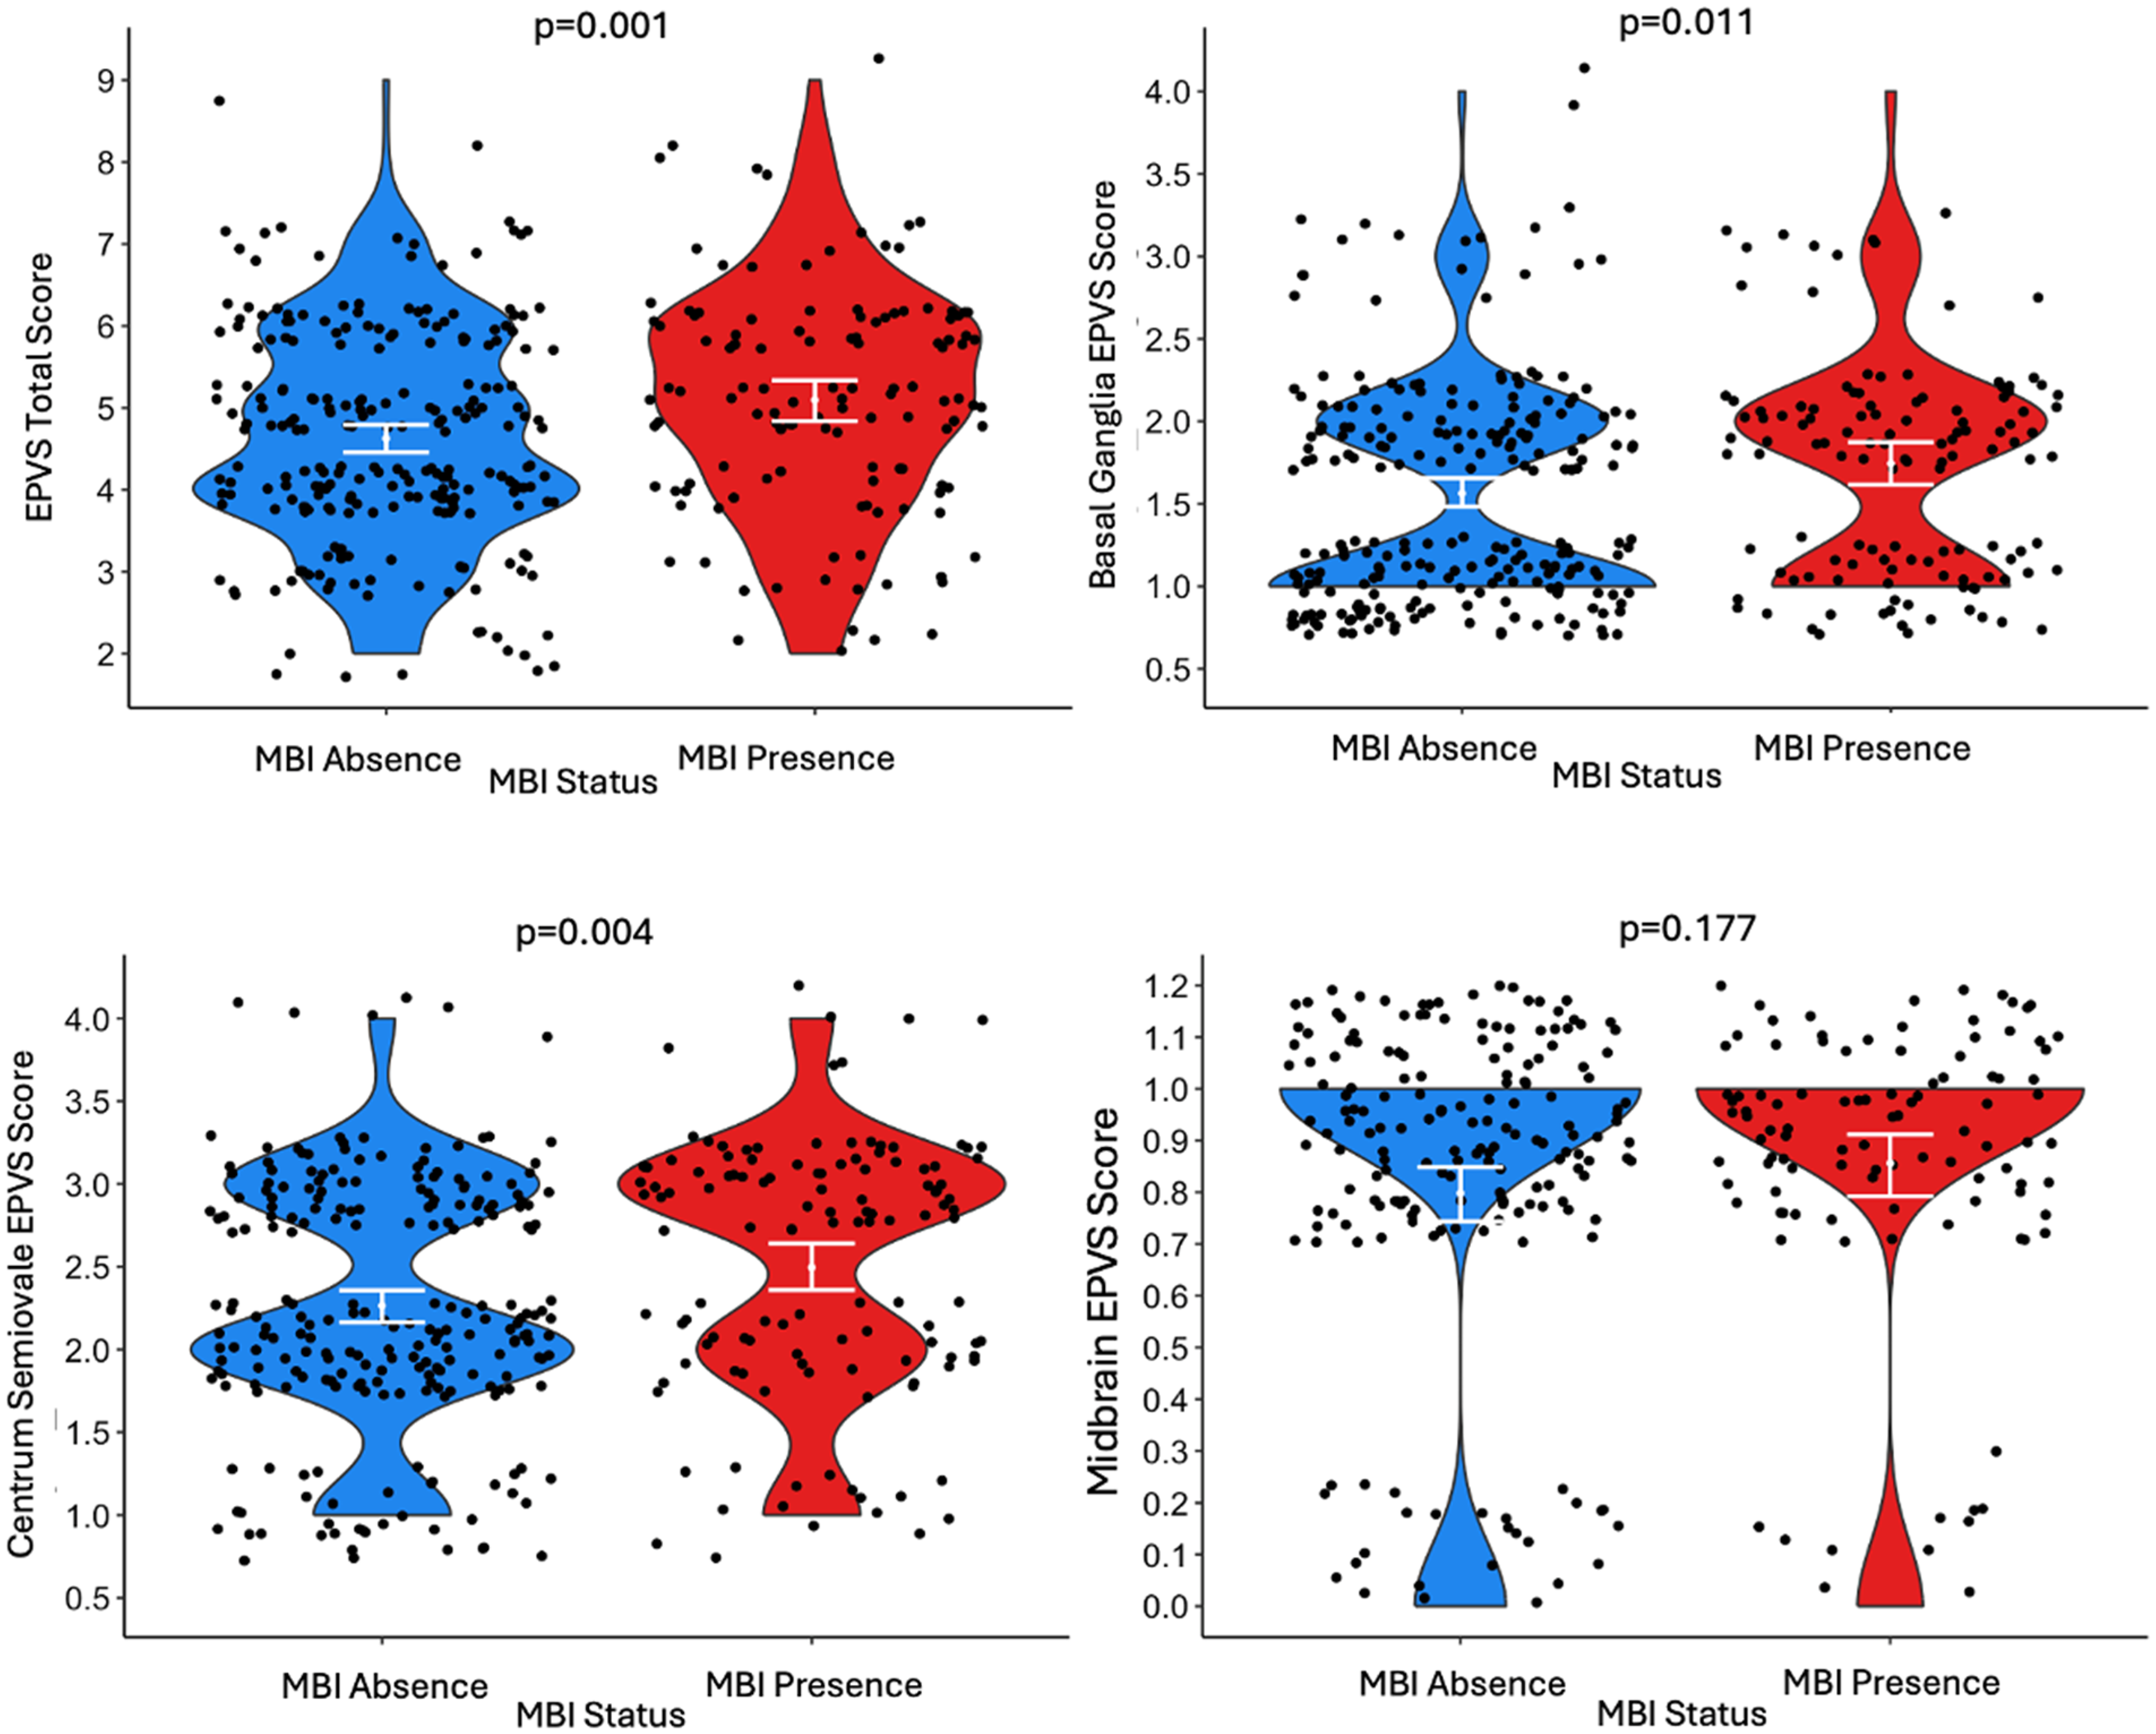
Violin plots for the distribution of the total EPVS score, basal ganglia EPVS score, centrum semiovale EPVS score, and midbrain EPVS score for participants with MBI absence and presence. MBI presence was determined using an MBI-C total score cut-off of >5. The white line indicates the interquartile range. Data points were jittered randomly by up to 0.4 units along the x-axis and 0.3 units along the y-axis to reduce overlap. Wilcoxon rank-sum test p-values are provided above each plot representing the difference between the MBI absence and presence distributions. EPVS: enlarged perivascular spaces; MBI: mild behavioral impairment; MBI-C: mild behavioral impairment checklist (n = 363).
Multivariable regression model outputs for the association between MBI presence, MBI total score, and EPVS ratings.
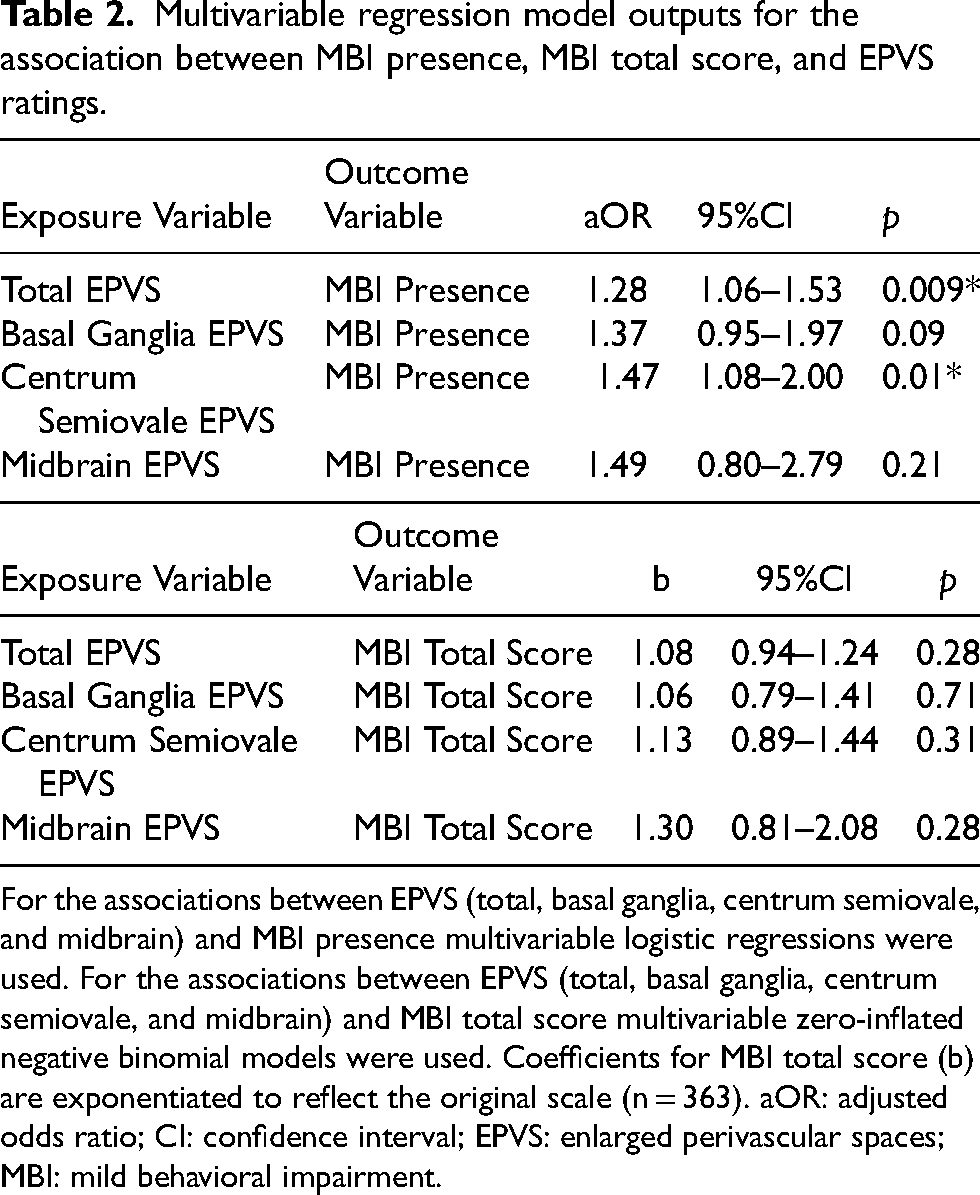
For the associations between EPVS (total, basal ganglia, centrum semiovale, and midbrain) and MBI presence multivariable logistic regressions were used. For the associations between EPVS (total, basal ganglia, centrum semiovale, and midbrain) and MBI total score multivariable zero-inflated negative binomial models were used. Coefficients for MBI total score (b) are exponentiated to reflect the original scale (n = 363). aOR: adjusted odds ratio; CI: confidence interval; EPVS: enlarged perivascular spaces; MBI: mild behavioral impairment.
The association between EPVS score and MBI symptom severity
As shown in Table 2 and Figure 3, the total EPVS score was not associated with MBI-C total score (b = 1.08, 95%CI:0.94–1.24, p = 0.28). Additionally, none of the basal ganglia (b = 1.06, 95%CI:0.79–1.41, p = 0.71), centrum semiovale (b = 1.13, 95%CI:0.89–1.44, p = 0.31), or midbrain (b = 1.30, 95%CI:0.81–2.08, p = 0.28) EPVS scores were associated with MBI-C total score. The associations between total and subregion EPVS and MBI symptom severity were not dependent on sex, based on our moderation analyses (EPVS total*sex b = 0.89, 95%CI:0.68–1.17, p = 0.41; EPVS basal ganglia*sex b = 0.70, 95%CI:0.41–1.21, p = 0.21; EPVS centrum semiovale*sex b = 0.88, 95%:0.55–1.42, p = 0.60; EPVS midbrain*sex b = 1.05, 95%CI:0.40–2.74, p = 0.92).
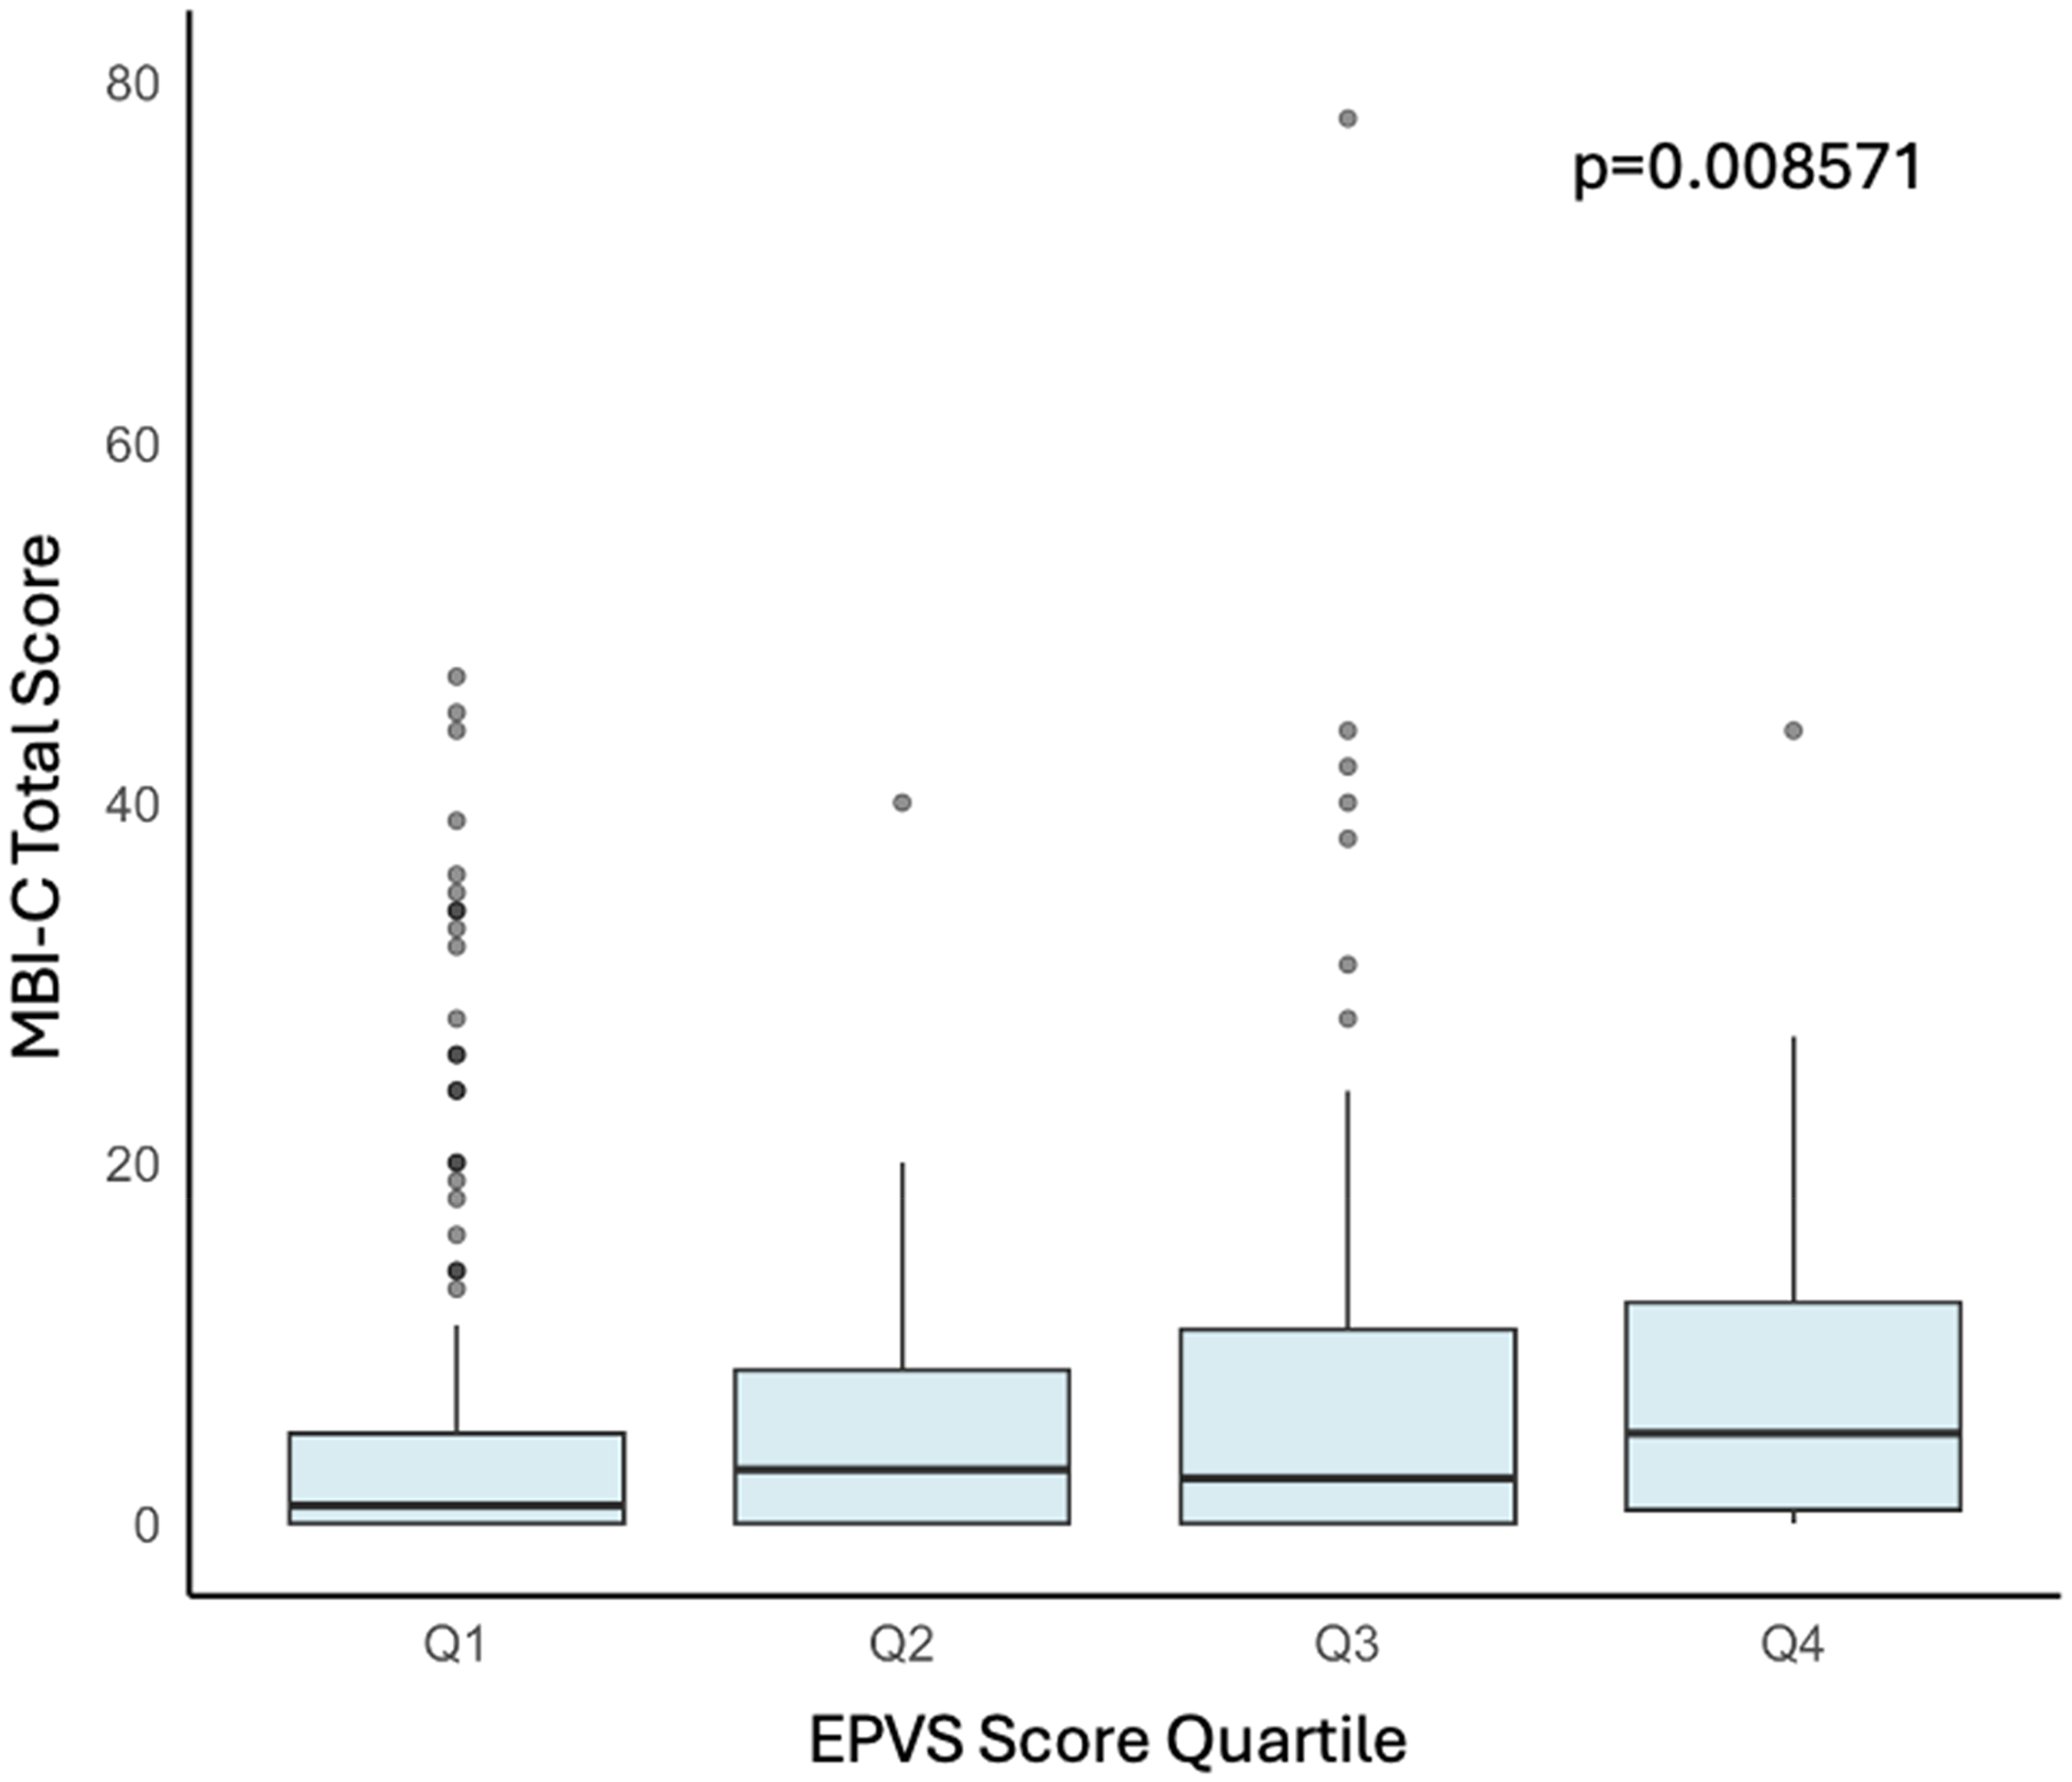
Boxplot for the distribution of the EPVS score quartiles as a function of the total MBI-C score. Kruskal-Wallis test p-value represents differences between quartiles. EPVS: enlarged perivascular spaces; MBI-C: Mild Behavioral Impairment Checklist (n = 363).
Discussion
This study examined the cross-sectional associations between EPVS burden and MBI presence and severity to understand the relationship between these dementia risk markers. We found that participants with greater total and centrum semiovale EPVS burden had greater odds of having MBI.
Our exploration of the relationship between EPVS and MBI adds to the previous literature on the association of cerebrovascular pathology with neuropsychiatric symptoms. First, there is a link between NPS preceding dementia and vascular disease. 58 For instance, the worsening of NPS is a clinical indicator of CSVD progression and progression in NPS and CSVD are associated with cognitive decline. 59 Postmortem studies have found an overlap between the presence of NPS and cerebrovascular disease in non-dementia populations. 37 Studies have also found that the number of vascular comorbidities, like arterial hypertension, diabetes, and dyslipidemia, were positively associated with MBI-C scores greater than 6.5. 40 In memory clinic patients with MCI, patients with MBI had a 9.3% greater WMH volume. 44 NPS are also common in CAA, where their severity is linked to white matter hyperintensity, suggesting white matter damage as a contributing factor. 36 However, no previous studies, to our knowledge, investigate the relationship between EPVS and MBI.
There may be several mechanisms underlying this association between global EPVS burden and the presence of MBI. First, PVS are involved in several pathways that aid in clearing brain waste, like the perivascular, 60 glymphatic, 61 and intermural periarterial drainage pathways. 62 Enlargement of PVS is a marker of dysfunction in these drainage pathways. 63 Thus, impaired clearance, as indicated by EPVS, could lead to the accumulation of toxic metabolites such as Aβ, increasing dementia risk. Given the association between MBI and Aβ, 26 MBI might be a clinical marker of poor Aβ clearance. Additionally, EPVS are associated with neuroinflammation, possibly due to reduced clearance of pro-inflammatory cytokines and increased blood-brain barrier (BBB) permeability.64,65 Dysfunctions of glymphatic clearance may exacerbate neuroinflammation by impairing the clearance of pro-inflammatory cytokines. 66 Because the BBB is the internal boundary of the PVS, 67 inflammation in the PVS can disrupt the BBB, leading to the infiltration of other immune cells and furthering neuroinflammation. NPS have also been shown to have associations with neuroinflammation and oxidative stress,68–71 suggesting that EPVS and MBI may both be markers of neuroinflammation.
This study also found that the EPVS scores in the centrum semiovale were associated with MBI status. However, EPVS scores in basal ganglia and midbrain were neither associated with MBI presence nor its severity. This finding may relate to the fact that EPVS in different regions have different underlying etiologies. For instance, EPVS in the basal ganglia are associated with hypertensive angiopathy.72–74 In contrast, EPVS in the centrum semiovale are associated with advanced age and cerebral amyloid angiopathy, 75 which is frequently associated with AD,76–79 and has shown associations with MBI. 36 Thus, it is possible that MBI is more strongly associated with amyloid deposition, including vascular amyloid, than other vascular disease, as only centrum semiovale EPVS were significantly associated with MBI in this study.
On the other hand, EPVS score was not associated with the severity of MBI, as reflected by the MBI-C total score. Considering the fact that EPVS are one of the earliest markers of CSVD, preceding vascular pathologies like lacunes, cerebral microbleeds, 63 and WMHs,11,80 these early signs of EPVS alone may not be associated with severe MBI symptoms. However, this finding was unexpected, and future studies may seek to study the relationship of MBI symptom severity with more granular assessments of EPVS with emerging technology, such as automated quantification of EPVS numbers or of combining EPVS with other markers of CSVD. Additionally, it may be worth studying the relationship between EPVS and MBI symptom severity in populations with more severe CSVD burden.
This study is not without limitations. First, these are cross-sectional data, so no causal associations can be inferred. Future studies should investigate the longitudinal relationships between these markers to monitor changes in MBI over time as a function of EPVS severity. Second, the rating of EPVS severity is subject to human error and may not reflect the precise extent of vascular pathology in the participants. However, we used a rigorous system of training and testing of inter-rater reliability to ensure a high quality of our EPVS ratings. Lastly, cerebrospinal fluid (CSF) data were only available in a limited number of participants, and thus information about AD biomarkers such as amyloid-β 42, phosphorylated tau, and total tau were not included in the models. Exploring AD biomarkers in the context of EPVS is another avenue for future studies.
Conclusion
This study explored the relationship between EPVS severity and MBI presence and severity. We hypothesized that a greater EPVS burden would be associated with greater odds of MBI presence and increased MBI symptom severity. We found that greater global and centrum semiovale EPVS burdens were associated with MBI presence; however, we found no associations between EPVS burden and MBI symptom severity or between basal ganglia and midbrain EPVS scores and MBI presence or severity. These findings suggest that EPVS may contribute to later-life emergent and persistent behavioral symptoms, consistent with known associations between EPVS and cognition, and merit further validation in longitudinal studies. Future studies should investigate MBI associations with other CSVD markers.
Footnotes
Acknowledgements
Eric E. Smith and Aravind Ganesh are members of Team 7 and Zahinoor Ismail is a member of Team 11, which are a part of the Canadian Consortium on Neurodegeneration in Aging (CCNA).
Ethical considerations
Consent to participate
All participants and their study partners provided written informed consent at the start of the COMPASS-ND study.
Consent for publication
Not applicable
Author contributions
Funding
The authors disclosed receipt of the following financial support for the research, authorship, and/or publication of this article: The Canadian Consortium on Neurodegeneration in Aging is supported by a grant from the Canadian Institutes of Health Research with funding from several partners. ZI is supported by CIHR (Grant BCA 527734) and the NIHR UK Exeter Biomedical Research Centre.
Declaration of conflicting interests
The authors declared the following potential conflicts of interest with respect to the research, authorship, and/or publication of this article: EES reported consulting (unpaid) for Alnylam Pharmaceuticals and Eli Lilly, and an advisory board (unpaid) for Eisai. ZI has served as an advisor/consultant to CADTH, EISAI, Lilly, Lundbeck/Otsuka, Novo Nordisk, and Roche. ZI is an Editorial Board Member of this journal but was not involved in the peer-review process of this article nor had access to any information regarding its peer-review. The remaining authors declared no potential conflicts of interest with respect to the research, authorship, and/or publication of this article.