
Abstract
Background
Type 2 diabetes (T2D) is a prevalent metabolic condition associated with increased risk of cognitive decline and dementia, including Alzheimer's disease (AD). While both T2D and AD are linked to neurodegeneration, the extent to which their patterns of brain atrophy overlap remain unclear.
Objective
To assess the similarities and differences in cortical atrophy patterns among individuals with controlled and uncontrolled T2D, mild cognitive impairment (MCI), and AD.
Methods
Structural magnetic resonance imaging data from the UK Biobank (UKBB) and the Alzheimer's Disease Neuroimaging Initiative (ADNI) were analyzed. Participants aged 55 and older were selected. Linear regression models were applied to generate cortical thickness maps for each group, controlling for age and sex. Group comparisons were conducted using permutation-based tests accounting for spatial autocorrelation.
Results
The study included 175 individuals with T2D (86 uncontrolled, 89 controlled) and 127 healthy controls without diabetes (HC) from UKBB, 334 individuals with MCI, 119 with AD and 315 cognitively healthy (CH) from ADNI. Uncontrolled T2D was associated with significant cortical atrophy in specific brain regions, with partial overlap in neurodegeneration patterns observed in MCI and AD. However, correlations between the cortical thinning patterns were weak and non-significant, suggesting distinct trajectories. Controlled T2D showed no significant cortical thinning, supporting the potential neuroprotective effects of glycemic control.
Conclusions
Uncontrolled T2D is linked to region-specific cortical atrophy that partially overlaps with MCI and AD but follows an independent neurodegenerative trajectory. Effective diabetes management may help preserve brain structure and reduce dementia risk, highlighting the importance of early metabolic intervention.
Keywords
Introduction
The widespread epidemic of type 2 diabetes mellitus (T2D) has far reaching consequences, particularly as a well-established epidemiological risk factor for Alzheimer's disease (AD), 1 with numerous studies reporting increased incidence of cognitive decline and dementia among affected individuals. AD remains the most common cause of dementia worldwide.2–4 The prevalence of both T2D and AD therefore pose significant challenges for society, especially for those with an aging population. 5
The growing prevalence of both T2D and AD has intensified interest in their potential mechanistic and anatomical convergence. Although T2D and AD are traditionally viewed as distinct conditions, increasing evidence points to overlapping pathological mechanisms, including insulin resistance and metabolic dysfunction. These similarities have led some researchers to refer to AD as ‘type 3 diabetes,’ reflecting its hypothesized link to impaired brain glucose metabolism.6–8
While T2D eventually affects peripheral nerves and AD predominantly affects the central nervous system, 9 a mounting body of evidence indicate that they both share similar features,3,9 including disruptions in glucose metabolism,3,5 inflammatory responses,3,5,9 oxidative stress,3,5,9,10 and impaired cellular waste removal. 5
The insufficient regulation of blood sugar levels may contribute to the development of AD. 7 Brain insulin resistance, a factor common to both etiologies, was shown to contribute to AD pathology by influencing amyloid-β (Aβ) plaques and neurofibrillary tangles, creating a self-perpetuating loop. 3 Recent insights propose AD as a neuroendocrine disorder, 10 sometimes referred to as type 3 diabetes,5,7,10–12 emphasizing the role of insulin in neurotransmitter release and memory-associated signaling pathways.3,4
Moreover, both T2D and AD display connections with neurodegeneration.3,13 AD results in brain cortical atrophy in a distinct pattern, often reported,14,15 which encompasses the hippocampal, entorhinal and parahippocampal cortices, alongside the middle temporal gyrus. On the other hand, several studies have thoroughly investigated the influence of T2D on brain cortical thickness. The collective findings suggest that T2D is correlated with cortical brain atrophy and a decrease in cortical thickness across multiple regions of the brain including global gray matter volume and overall cerebral cortex thickness, with prominent reductions in the left anterior and posterior cingulate, superior frontal, and middle temporal lobes, on top of subcortical atrophy. 16 Notably, several of these regions, including the cingulate and middle temporal lobes, are also vulnerable in early AD, suggesting a potential convergence in regional atrophy patterns between T2D and AD. Other affected areas, albeit less frequently, include the left lateral occipital cortex, middle temporal gyrus, paracentral lobule, transverse temporal gyrus, right superior frontal gyrus, and left orbitofrontal cortex. 16 However, the degree of similarity of brain atrophy patterns between both diseases and the extent of their overlap remains under studied.
The overlap in brain atrophy patterns between AD and T2D is now well-characterized, with increasing evidence from human neuroimaging studies demonstrating consistent regional convergence, particularly in the medial temporal lobe, posterior cingulate, and prefrontal cortices. 16 This anatomical convergence is paralleled by shared neuropathological mechanisms, including central insulin resistance, mitochondrial dysfunction, chronic neuroinflammation, and oxidative stress. 6 A high degree of overlap would suggest potential shared pathways, further explaining the mechanistic relationships between T2D and AD and mild cognitive impairment (MCI).
While AD and T2D both show patterns of cortical thinning, this phenotypic similarity does not confirm shared pathophysiological origins. It remains plausible that distinct mechanisms—such as amyloid-related neurotoxicity in AD versus metabolic and vascular dysfunction in T2D—could lead to comparable structural outcomes. Previous studies have proposed common pathways involving insulin resistance, oxidative stress, and neuroinflammation.3,4,6,7 Yet others emphasize disease-specific gene expression, progression patterns, and underlying molecular triggers that remain distinct across diseases.9,11,14 Thus, establishing anatomical overlap through cortical maps does not imply mechanistic convergence, but rather highlights regions of potential vulnerability that merit further mechanistic investigation.
The purpose of this study is to systematically compare cortical thinning in T2D (stratified by glycemic control), AD, and its prodromal form, MCI, using cortical thickness maps generated through linear regression and tested via permutation-based correlation analysis. To this end we created brain maps expressing these changes with respect to groups of cognitively healthy subjects, then compared patterns using permutation analyses. We hypothesized that uncontrolled T2D would exhibit greater overlap with AD than controlled T2D, and that this similarity would increase along the cognitive impairment continuum (from MCI to AD), modulated by glycemic control. However, this overlap is interpreted as anatomical correspondence, not necessarily evidence of a shared etiological pathway. These findings may support the hypothesis of mechanistic convergence, but further studies are needed to establish a causal link between T2D and AD.
Methods
Ethics
Our study was conducted with approval from the Neuroscience and Mental health institutional review board of the Centre Intégré Universitaire de Santé et Services Sociaux de la Capitale Nationale (#2021–2022), with UKBB data application 85063.
Participants
To accomplish our objective, this study involved analysis of archived data from two large-scale cohorts: the population-based United Kingdom Biobank (UKBB) (https://www.ukbiobank.ac.uk/) and the multicenter, observational clinical study, Alzheimer's Disease Neuroimaging Initiative (ADNI) (https://adni.loni.usc.edu/). Recruitment, measurement methods, and quality control details are available at https://www.ukbiobank.ac.uk/ and in cited publications.
AD and MCI: the ADNI dataset
To investigate changes in AD and MCI, we used data obtained from the ADNI database (https://adni.loni.usc.edu/). The ADNI was launched in 2003 as a public-private partnership, led by Principal Investigator Michael W. Weiner, MD. The primary goal of ADNI has been to test whether serial magnetic resonance imaging (MRI), 17 positron emission tomography (PET), other biological markers, and clinical and neuropsychological assessment can be combined to measure the progression of MCI and early AD. For up-to-date information, see www.adni-info.org. ADNI imaging data, with detailed protocols available at http://adni.loni.usc.edu/methods/documents/mri-protocols/, was used to create the AD brain maps. Using the FreeSurfer (v.6.0)18,19 longitudinal pipeline, T1-weighted images were processed and cortical thickness data from each parcel of the Desikan-Killiany-Tourville atlas (DKT) 20 extracted to perform the analysis.
Diagnostic criteria
In the initial ADNI cohort, classification into cognitively healthy (CH), MCI, and AD categories was determined using specific criteria. Memory loss, the Mini-Mental State Examination (MMSE), the Clinical Dementia Rating (CDR) score, and the Logical Memory II subscale of the Wechsler Memory Scale-Revised were employed. Participants reporting memory lapses were classified as MCI or AD, while CH individuals did not report such issues. The MMSE scores required for CH and MCI were between 24 and 30, and for AD, between 20 and 26. CDR scores for CH, MCI, and AD were 0, 0.5, and 0.5 to 1, respectively, with MCI needing a memory box score of 0.5. Education-specific cutoffs for the Logical Memory II test were applied: CHs subjects scored ≥9, ≥5, and ≥3 for 16, 8–15, and 0–7 years of education, respectively, while MCI and AD subjects scored ≤8, ≤4, and ≤2 for the corresponding educational levels. 21 We selected all CH, MCI, and AD participants from ADNI who did not have T2D at baseline and for whom MRI data were available (cf. Figure 1).
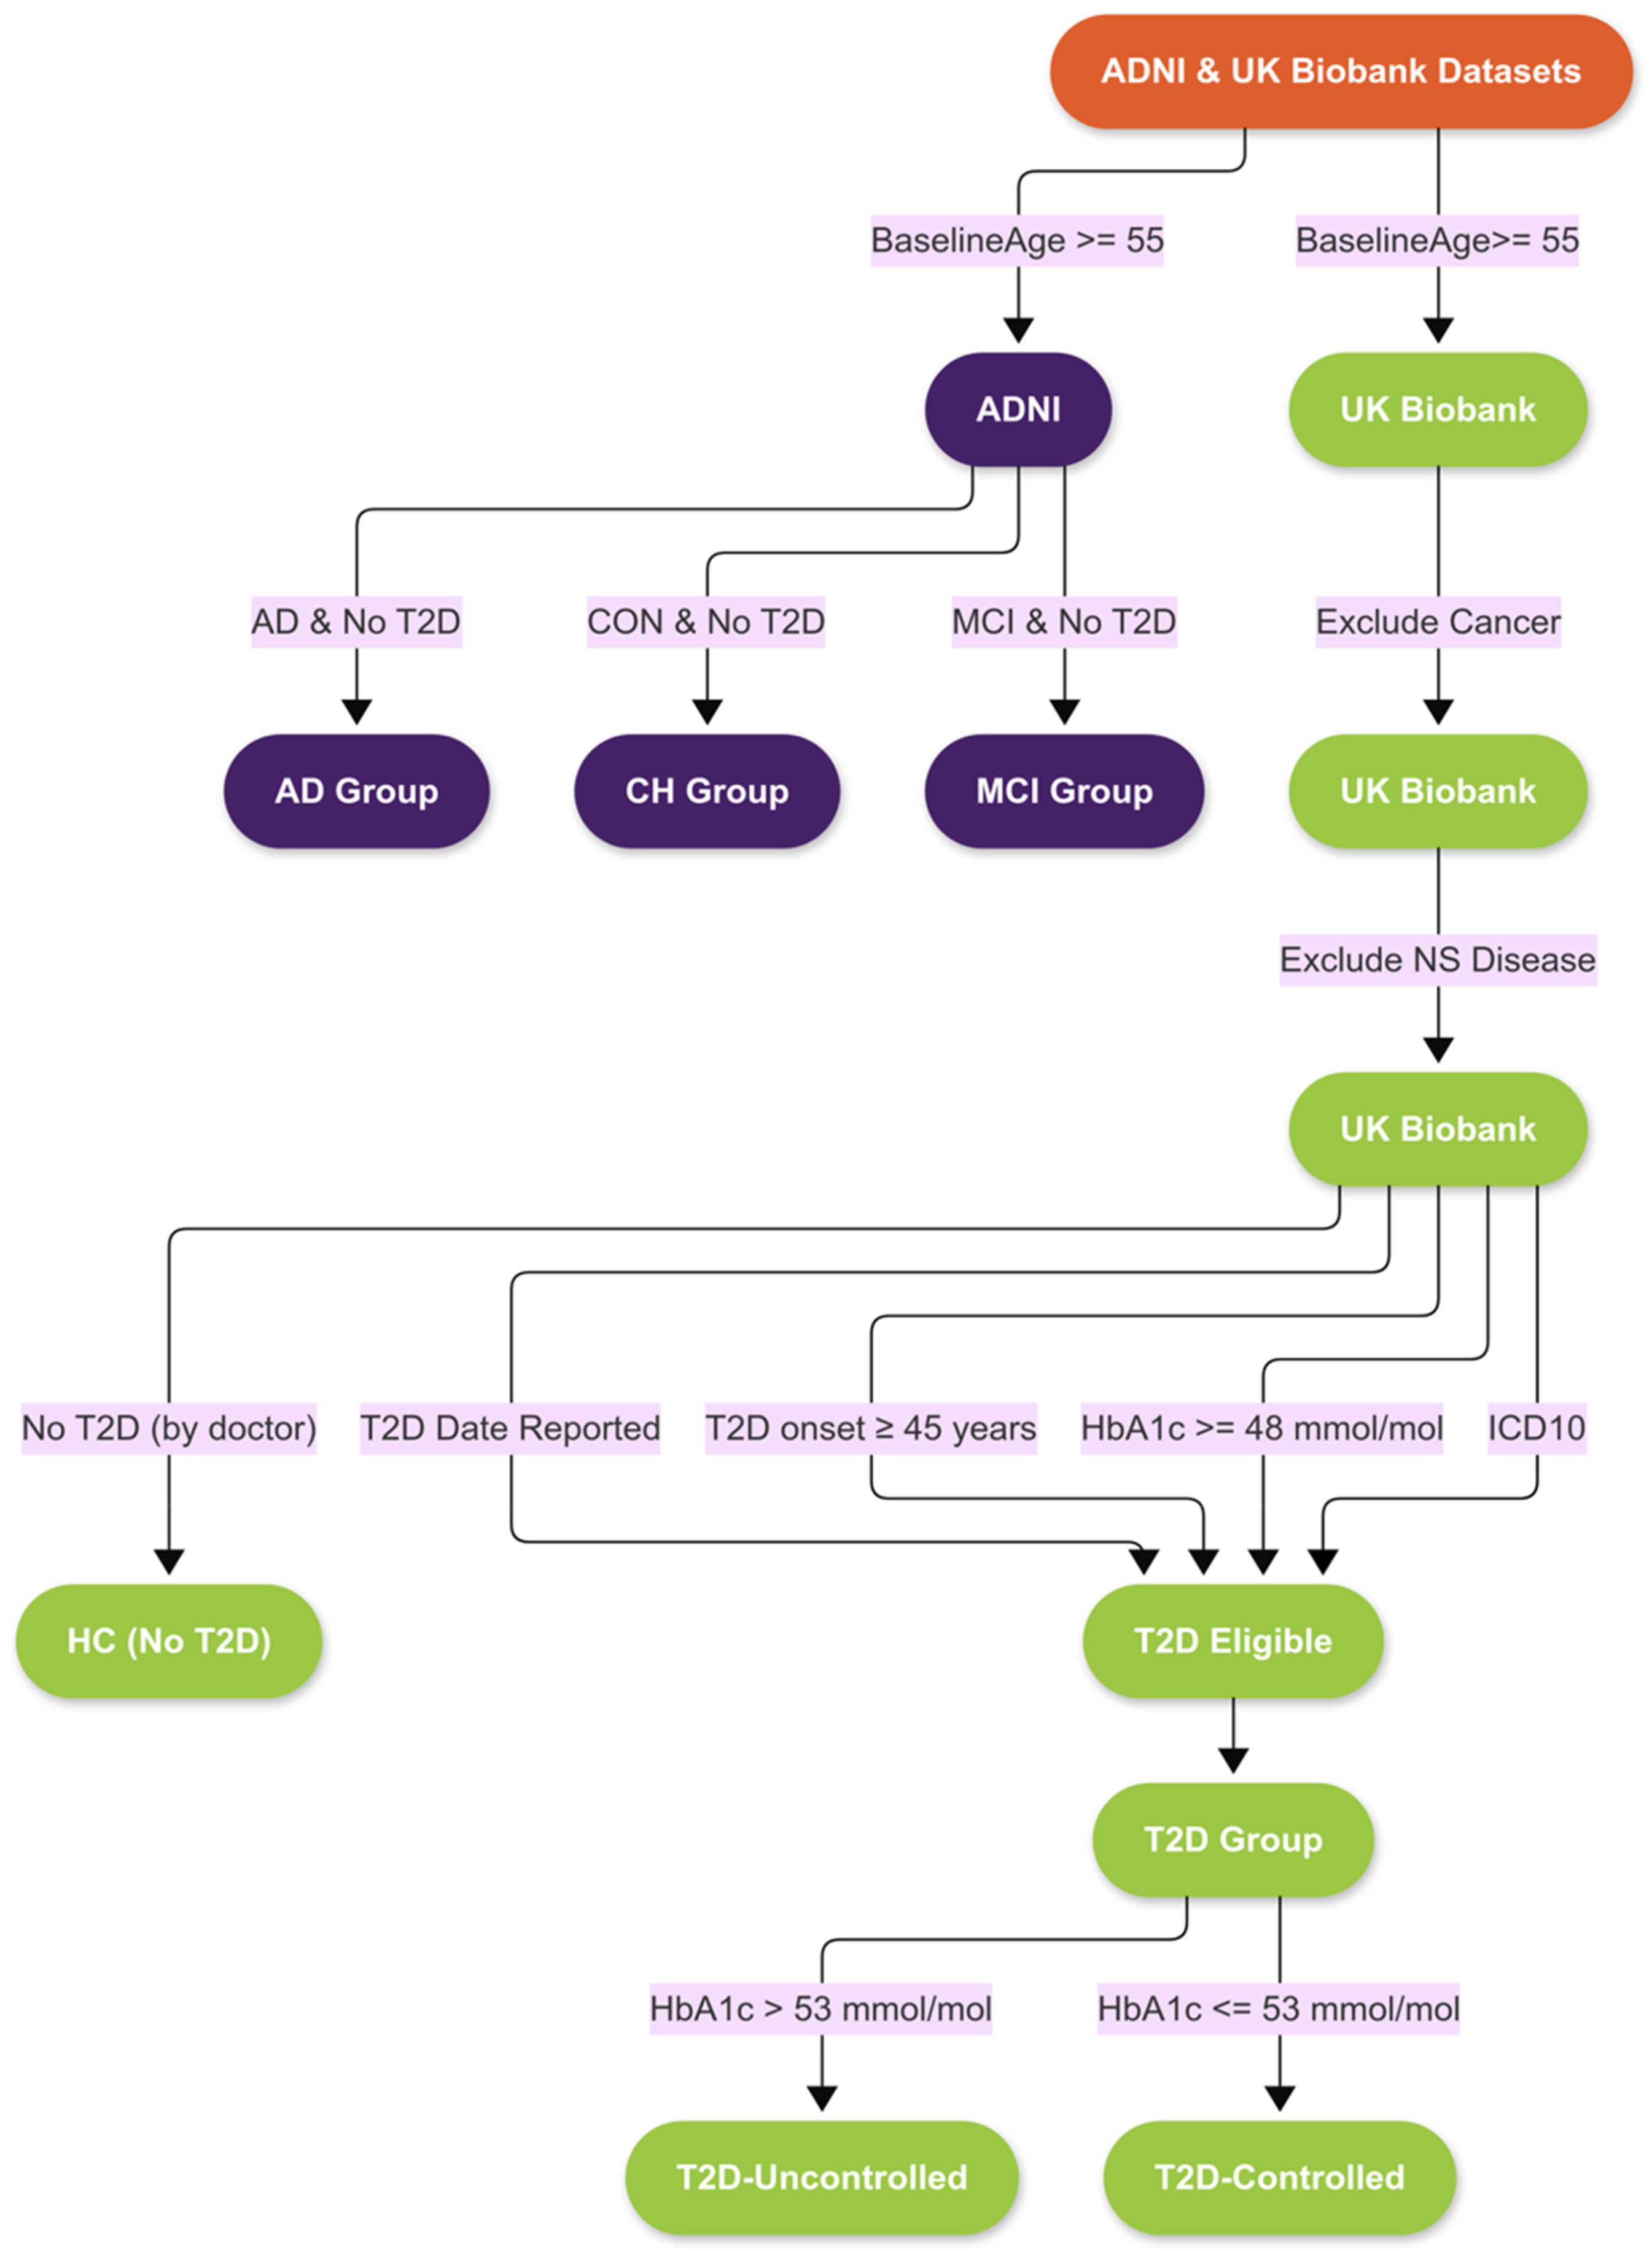
Flowchart of participant selection. Right: Data extraction from UKBB to identify individuals with uncontrolled and controlled type 2 diabetes (T2D) as well as healthy controls without diabetes. Left: Data extraction from the ADNI cohort to identify participants diagnosed with Alzheimer's disease (AD), mild cognitive impairment (MCI), or cognitively healthy (CH) individuals, all without T2D at baseline. MRI availability was required in both cohorts. ADNI: Alzheimer’s Disease Neuroimaging Initiative; MRI: magnetic resonance imaging.
ADNI MRI analysis
Each T1-weighted MRI was processed using FreeSurfer version 6.0, a free open-source software used to quantify brain anatomy (https://surfer.nmr.mgh.harvard.edu). Cortical parcellation was performed using the DKT atlas, which provides a standardized anatomical framework for regional analysis. 20 MRI data were processed with the “recon-all -all” pipeline, utilizing fully automated parameters without manual interventions. To account for variability in image quality and head size, cortical thickness measures were normalized using the NOMIS tool, which applies regression models to standardize values into Z scores based on a reference cohort of 6909 cognitively healthy adults. 22
UKBB T2D cohort and participant selection
To investigate T2D-related brain changes we used data from participants in the UKBB, one of the largest prospective, population-based cohorts worldwide. Between 2006 and 2010, over 500,000 participants provided demographic and health-related data at 22 specialized assessment centers (baseline visits). Since 2014, a portion (around 10%) of these participants has been recalled for neuroimaging and further assessment of phenotypic traits, including frailty (imaging visit).
Our analysis included all participants with both brain MRI morphometric data and linked electronic health records. 17 Because T2D is not uniformly labeled in the UKBB, inclusion criteria were based on a multi-tiered strategy. First, we identified participants with an entry in the “type 2 diabetes date” field. Next, we included those with glycated hemoglobin (HbA1c) values ≥48 mmol/mol, in accordance with current diagnostic thresholds.23,24 We further restricted our sample to individuals whose reported age at onset was ≥45 years old,23,24 and who also had a corresponding International Classification of Diseases, 10th Revision (ICD10) diagnosis. 25 After merging these criteria, duplicate entries were removed to yield the final T2D sample.
To reduce potential confounding effects, individuals with major comorbidities, including cancer or any nervous system disorders (as per ICD-10 codes), were excluded. The resulting cohort was then stratified into two groups: participants with HbA1c values >53 mmol/mol (were classified as having uncontrolled T2D, and those with values ≤7.0% (53 mmol/mol) as having controlled T2D, following American Diabetes Association guidelines.26,27
Healthy control participants from the UKBB were defined as individuals without a history of diabetes, neurological disease, or cancer. All comparisons were conducted within the UKBB cohort to ensure consistency in imaging protocols and demographic characteristics.
Control group definition and within-cohort comparison strategy
To ensure robust, unbiased comparisons, control groups were independently defined within each dataset. In the ADNI cohort, cognitively normal participants were identified based on a baseline diagnosis of “Control” and absence of diabetes (CH). This group served as the normative reference for quantifying cortical thickness differences in both the AD and MCI groups, forming the basis for the brain maps presented in Figure 1.
In the UKBB dataset, healthy controls (HC) were selected using stringent exclusion criteria. Participants were included only if they reported no history of diabetes, neurological disorders, or cancer. These controls provided the reference for comparisons with participants with controlled and uncontrolled T2D, enabling within-cohort analysis of disease-specific cortical changes.
Within each cohort, we performed parcel-wise linear regression analyses where cortical thickness was modeled as a function of diagnosis (e.g., T2D, AD, MCI), age, and sex. The beta estimates shown in our brain maps represent the adjusted effect of disease status on cortical thickness, corrected for multiple comparisons using False Discovery Rate (FDR). Importantly, each condition (e.g., AD, MCI, uncontrolled or controlled T2D) was compared only with the healthy control group from the same data source (ADNI or UKBB). By comparing regression-based outputs (e.g., beta estimates) rather than raw cortical thickness values, we mitigate cross-cohort variability and focus on interpretable neuroanatomical patterns associated with each condition
The right panel of Figure 1 illustrates the participant selection process from UKBB, including individuals with controlled and uncontrolled T2D and healthy controls without diabetes.
UKBB MRI analysis
In the UKBB sample, the imaging data for creating brain maps of T2D were obtained directly from UKBB files. Details of the imaging pipeline can be found in Alfaro-Almagro et al. 28 and at https://www.fmrib.ox.ac.uk/ukbiobank/protocol/. Equivalent to ADNI, quality-controlled cortical thickness data for each parcel of the DKT atlas, derived also from FreeSurfer (v.6.0.0), 18 were used in the analysis.
Age restriction and demographic alignment across groups
To ensure fair comparisons across disease groups while minimizing demographic confounding, we employed a structured sampling protocol for control selection. Given that the ADNI cohort includes older participants (ages 55–97) while UKBB cohort spans a broader range (40–70 years), we restricted our analysis to participants aged 55 and older—defined and identified as the most at-risk group for age-related neurodegeneration in the Livingston et al. analysis. 1
To improve demographic comparability, the age distribution of all groups—including controlled and uncontrolled T2D, healthy controls from UKBB, MCI, and cognitively healthy controls from ADNI—was aligned with that of the AD group. This was implemented through bin-wise proportional sampling in 5-year age intervals (e.g., 55–60, 60–65), preserving the relative age structure of the AD population.
Additionally, we adjusted the sex distribution of each group to reflect that of the AD group (53% male, 47% female) through proportion-based resampling. These procedures were applied independently within each cohort, preserving cohort-specific internal validity and reducing the risk of confounding in group comparisons.
Data analysis
Cortical thickness maps and linear regression analysis
We generated brain maps of cortical thickness neurodegeneration in AD, MCI, and uncontrolled/controlled T2D, with linear regression models with the Penguin Python package (v.3.8.16) (https://pypi.org/project/penguins). Cortical thickness values from each DKT parcel were modeled as dependent variables in separate regressions.
Each model included age, sex, and diagnosis group (e.g., AD versus CH, MCI versus CH, uncontrolled T2D versus healthy controls, controlled T2D versus healthy controls) as independent variables. We used the pingouin.linear_regression function, which performs Ordinary Least Squares regression while handling missing data. Regression models were run independently for each cortical region (i.e., parcel), and the resulting beta coefficient for the diagnosis variable was extracted as a measure of regional cortical atrophy associated with disease status. The key output was the beta coefficient associated with the diagnosis variable, which reflects the adjusted effect size of disease status on cortical thickness.
The resulting beta estimates were used to construct statistical brain maps representing group-level differences in cortical thickness. Only diagnosis-related coefficients were retained for downstream visualizations (e.g., brain maps and correlation analyses). p-values were corrected using the FDR method to account for multiple comparisons across regions.
Additionally, Min-Max scaling was applied to explanatory variables to ensure standardization and comparability across regressions. This approach yielded interpretable, regression-derived markers of neuroanatomical change associated with each condition.
For UKBB data, cortical thickness was measured in millimeters (mm) using FreeSurfer outputs. For ADNI, we used the original FreeSurfer thickness values, which were then standardized using the NOMIS tool to generate Z-scores, correcting for image quality, and estimated total intracranial volume. As a result, beta estimates from ADNI reflect standardized deviations from normative values, while those from UKBB reflect raw thickness differences in millimeter (mm).
All statistical comparisons were restricted to within-cohort analyses to preserve internal validity. This design choice minimizes confounding from inter-cohort differences in neuroimaging acquisition protocols, preprocessing pipelines, population characteristics, and diagnostic criteria. By limiting analyses to within each dataset, we ensured that observed differences in cortical thickness reflect disease-related effects rather than methodological variability.
Brain maps visualization
To visualize group-level cortical atrophy patterns, we developed a custom Python script (available at: https://git.valeria.science/medics/useful-code/brainfig_Nilearn) using the Nilearn and NiBabel libraries (https://nilearn.github.io/dev/plotting/index.html#plotting). This tool projects diagnosis-related beta coefficients—obtained from parcel-wise linear regression models—onto realistic cortical surfaces using FreeSurfer-derived DKT parcellations. Regional beta values are mapped to surface vertices, with sulcal depth overlaid as anatomical background shading for spatial context. To optimize visual clarity across comparisons with differing effect size distributions, beta estimates are log-transformed while preserving sign. The resulting cortical maps offer anatomically faithful, high-contrast representations of regional cortical thinning across diagnostic groups.
Spin tests
To assess spatial correlation between maps (e.g., AD versus T2D), we employed Spearman's rank correlation analysis accompanied by a spin test for statistical significance. Permutation-based tests address spatial autocorrelation, as described in Alexander-Bloch et al.19,29 Because of significant autocorrelation among neighboring DKT parcels, conventional p-values may not be reliable. Hence, spatial permutation tests, also known as spin tests, are recommended.19,29 Basically, the technique involves spinning a spherical projection of a brain map's surface, back projecting it onto the brain surface, and comparing it to another. 29 By repeating this strategy n times (in our case, n = 10,000 permutations), we can obtain a more reliable p-value that accounts for autocorrelation in the data. The spin test was employed to assess the robustness of these correlations by generating a null distribution of correlation coefficients through random permutations of the data. This approach provides a non-parametric means to evaluate the likelihood that the observed correlations could arise by chance. Figure 2 illustrates our data analysis procedure. The full source code used for the analysis in this study is accessible at https://git.valeria.science/medics/studies/permutation-analyses-t2d.

Data analysis flowchart. Participants from ADNI were categorized into AD, MCI, and Cognitively Healthy groups; while UKBB participants into Uncontrolled T2D, Controlled T2D and HC without Diabetes groups. All T2D patients were compared with HC without Diabetes from UKBB, and AD and MCI to cognitively healthy individuals (CH) from ADNI. Brain maps for AD, MCI, and controlled and uncontrolled T2D were created using linear regression models (a), and comparisons were made between maps using permutation-based (spin) tests considering spatial autocorrelation (b, c). ADNI: Alzheimer’s Disease Neuroimaging Initiative; MCI: mild cognitive impairment.
Sample size and power considerations
A priori power analysis was conducted to determine the sample size required for detecting an effect size of 0.5, which was selected based on prior literature suggesting this as a medium effect size relevant to the neurodegenerative changes under investigation. Using an alpha level of 0.05 and aiming for 80% power, a two-tailed independent t-test indicated that a minimum of 64 participants per group would be necessary to detect such an effect with sufficient power. Notably, the smallest group in this study, the uncontrolled T2D group, exceeded this requirement with 86 participants. As a result, the likelihood of a Type II error (false negative) is reduced, strengthening the reliability of findings derived from all comparisons.
Ethics statement
This study involved the secondary analysis of de-identified human data from two publicly available databases: the UK Biobank (application number 85063) and the ADNI. All participants in these cohorts provided informed consent, and the original studies received ethics approval from their respective institutional review boards. No new human or animal subjects were recruited or studied by the authors.
Results
Study groups
Following our exclusion criteria, our final UKBB cohort was composed of 19,381 participants out of the 43,172 participants from the UKBB with imaging data. After applying sex and age ranges on all the groups to the AD group, our ultimate groups for analysis included uncontrolled T2D (N = 86), controlled T2D (N = 89), and HC without T2D (N = 127) from the UKBB. Quality-controlled cortical thickness data derived from FreeSurfer (v6.0.0) and processed using the UKBB pipeline were used. 28 Baseline characteristics of the participants are presented in Table 1. Group comparisons revealed no significant differences in age, education, body mass index (BMI), or HbA1c across the six cohorts, as assessed by one-way analysis of variance and analysis of covariance, nor in sex distribution, as assessed by chi-square test (all p > 0.05; exact values reported in Table 1). Similarly, age at onset of type 2 diabetes did not differ significantly between the uncontrolled and controlled T2D groups. These findings indicate that demographic and clinical characteristics were comparable across groups, thereby minimizing the risk of confounding in subsequent analyses.
Demographic and clinical characteristics of study participants by group.

*Values are expressed as mean ± standard deviation. T2D: type 2 diabetes; HC: healthy controls; MCI: mild cognitive impairment; AD: Alzheimer's disease; CH: cognitively healthy; SD: standard deviation; ADNI: Alzheimer’s Disease Neuroimaging Initiative. Note: “–” indicates data not available or not applicable.
Brain maps
Figure 3 presents cortical surface brain maps depicting regional beta estimates from linear regression models comparing disease groups with their respective controls. These visualizations include comparisons between individuals with uncontrolled and controlled T2D versus non-diabetic controls, as well as AD and MCI groups versus CH individuals. The color intensity reflects the magnitude of cortical thinning, with cooler colors (e.g., blue) indicating stronger atrophy and warmer colors (e.g., red) indicating relative preservation or thickening. To enhance contrast and highlight subtle regional effects, beta estimates were log-transformed while preserving directionality. These maps provide a spatial overview of disease-related cortical changes across DKT-parcellated regions. Our comparative analysis of neurodegeneration patterns reveals both distinct differences and notable similarities in specific brain regions across these groups. In the uncontrolled T2D group, several regions exhibit statistically significant cortical thinning compared to CH without T2D; including the left (p = 0.039), and right insula (p = 0.015). The beta estimates for these regions indicate a negative correlation with cortical thickness, suggesting that greater atrophy is present in these areas (See Supplemental Table 3).

Cortical surface visualization of regional beta estimates derived from linear regression models comparing cortical thickness between disease and control groups. (a) AD versus CH; (b) MCI versus CH; (c) Uncontrolled T2D versus HC; (d) Controlled T2D versus HC. Beta estimates reflect the adjusted effect of diagnosis on cortical thickness at each DKT-parcellated region. For visualization purposes, beta values were log-transformed (while preserving directionality). DKT: Desikan-Killiany-Tourville; MCI: mild cognitive impairment.
In the controlled T2D group, cortical thickness differences compared to CH without T2D did not reach statistical significance in any of the examined brain regions except for the left pericalcarine cortex (p = 0.036). Notable trends, however, were observed in the left cuneus (p = 0.054) and right pars orbitalis (p = 0.060), suggesting potential subtle effects that warrant further investigation with larger sample sizes. These results suggest that cortical thinning is less pronounced in controlled T2D compared to uncontrolled T2D, highlighting the potential protective effects of diabetes management (See Supplemental Table 4).
Spatial correspondence between cortical thickness patterns in AD and T2D and MCI
To quantitatively assess the relationship between T2D and neurodegeneration in AD and MCI, we employed Spearman's rank correlation analysis accompanied by a spin test for statistical significance. The Spearman correlation analysis revealed weak and non-significant associations between the overall patterns of cortical thinning across groups. The strongest correlation was observed between AD and uncontrolled T2D, though it did not reach statistical significance (ρ = 0.256, p-spin = 0.061). Correlations for other group comparisons were similarly weak and non-significant (see Supplemental Table 7).
To further explore the spatial relationships between cortical thinning patterns across conditions, we visualized pairwise correlations using dot and bar plots (Figure 4). These visualizations show Spearman's correlation coefficients (ρ) and spin-test p-values, comparing cortical thickness maps between Uncontrolled T2D, Controlled T2D, AD, and MCI. The results from our study indicate that the correlations are weak and not statistically significant (p-spin > 0.05), reinforcing the interpretation that the observed structural changes in T2D may follow trajectories distinct from those in AD and MCI. These results are further illustrated in Figure 5, which presents a Venn diagram and an UpSet plot highlighting overlapping brain regions showing significant cortical thinning in Uncontrolled T2D, AD, and MCI. While AD shows widespread regional involvement, only a limited subset of regions overlap with uncontrolled T2D and MCI, suggesting partially shared but largely condition-specific neuroanatomical vulnerabilities.

Spearman's correlation coefficients (ρ) with spin-test p-values illustrating the spatial correspondence of cortical thickness atrophy patterns between groups. The dot plot displays pairwise comparisons of Uncontrolled T2D, Controlled T2D, AD, and MCI groups. MCI: mild cognitive impairment.
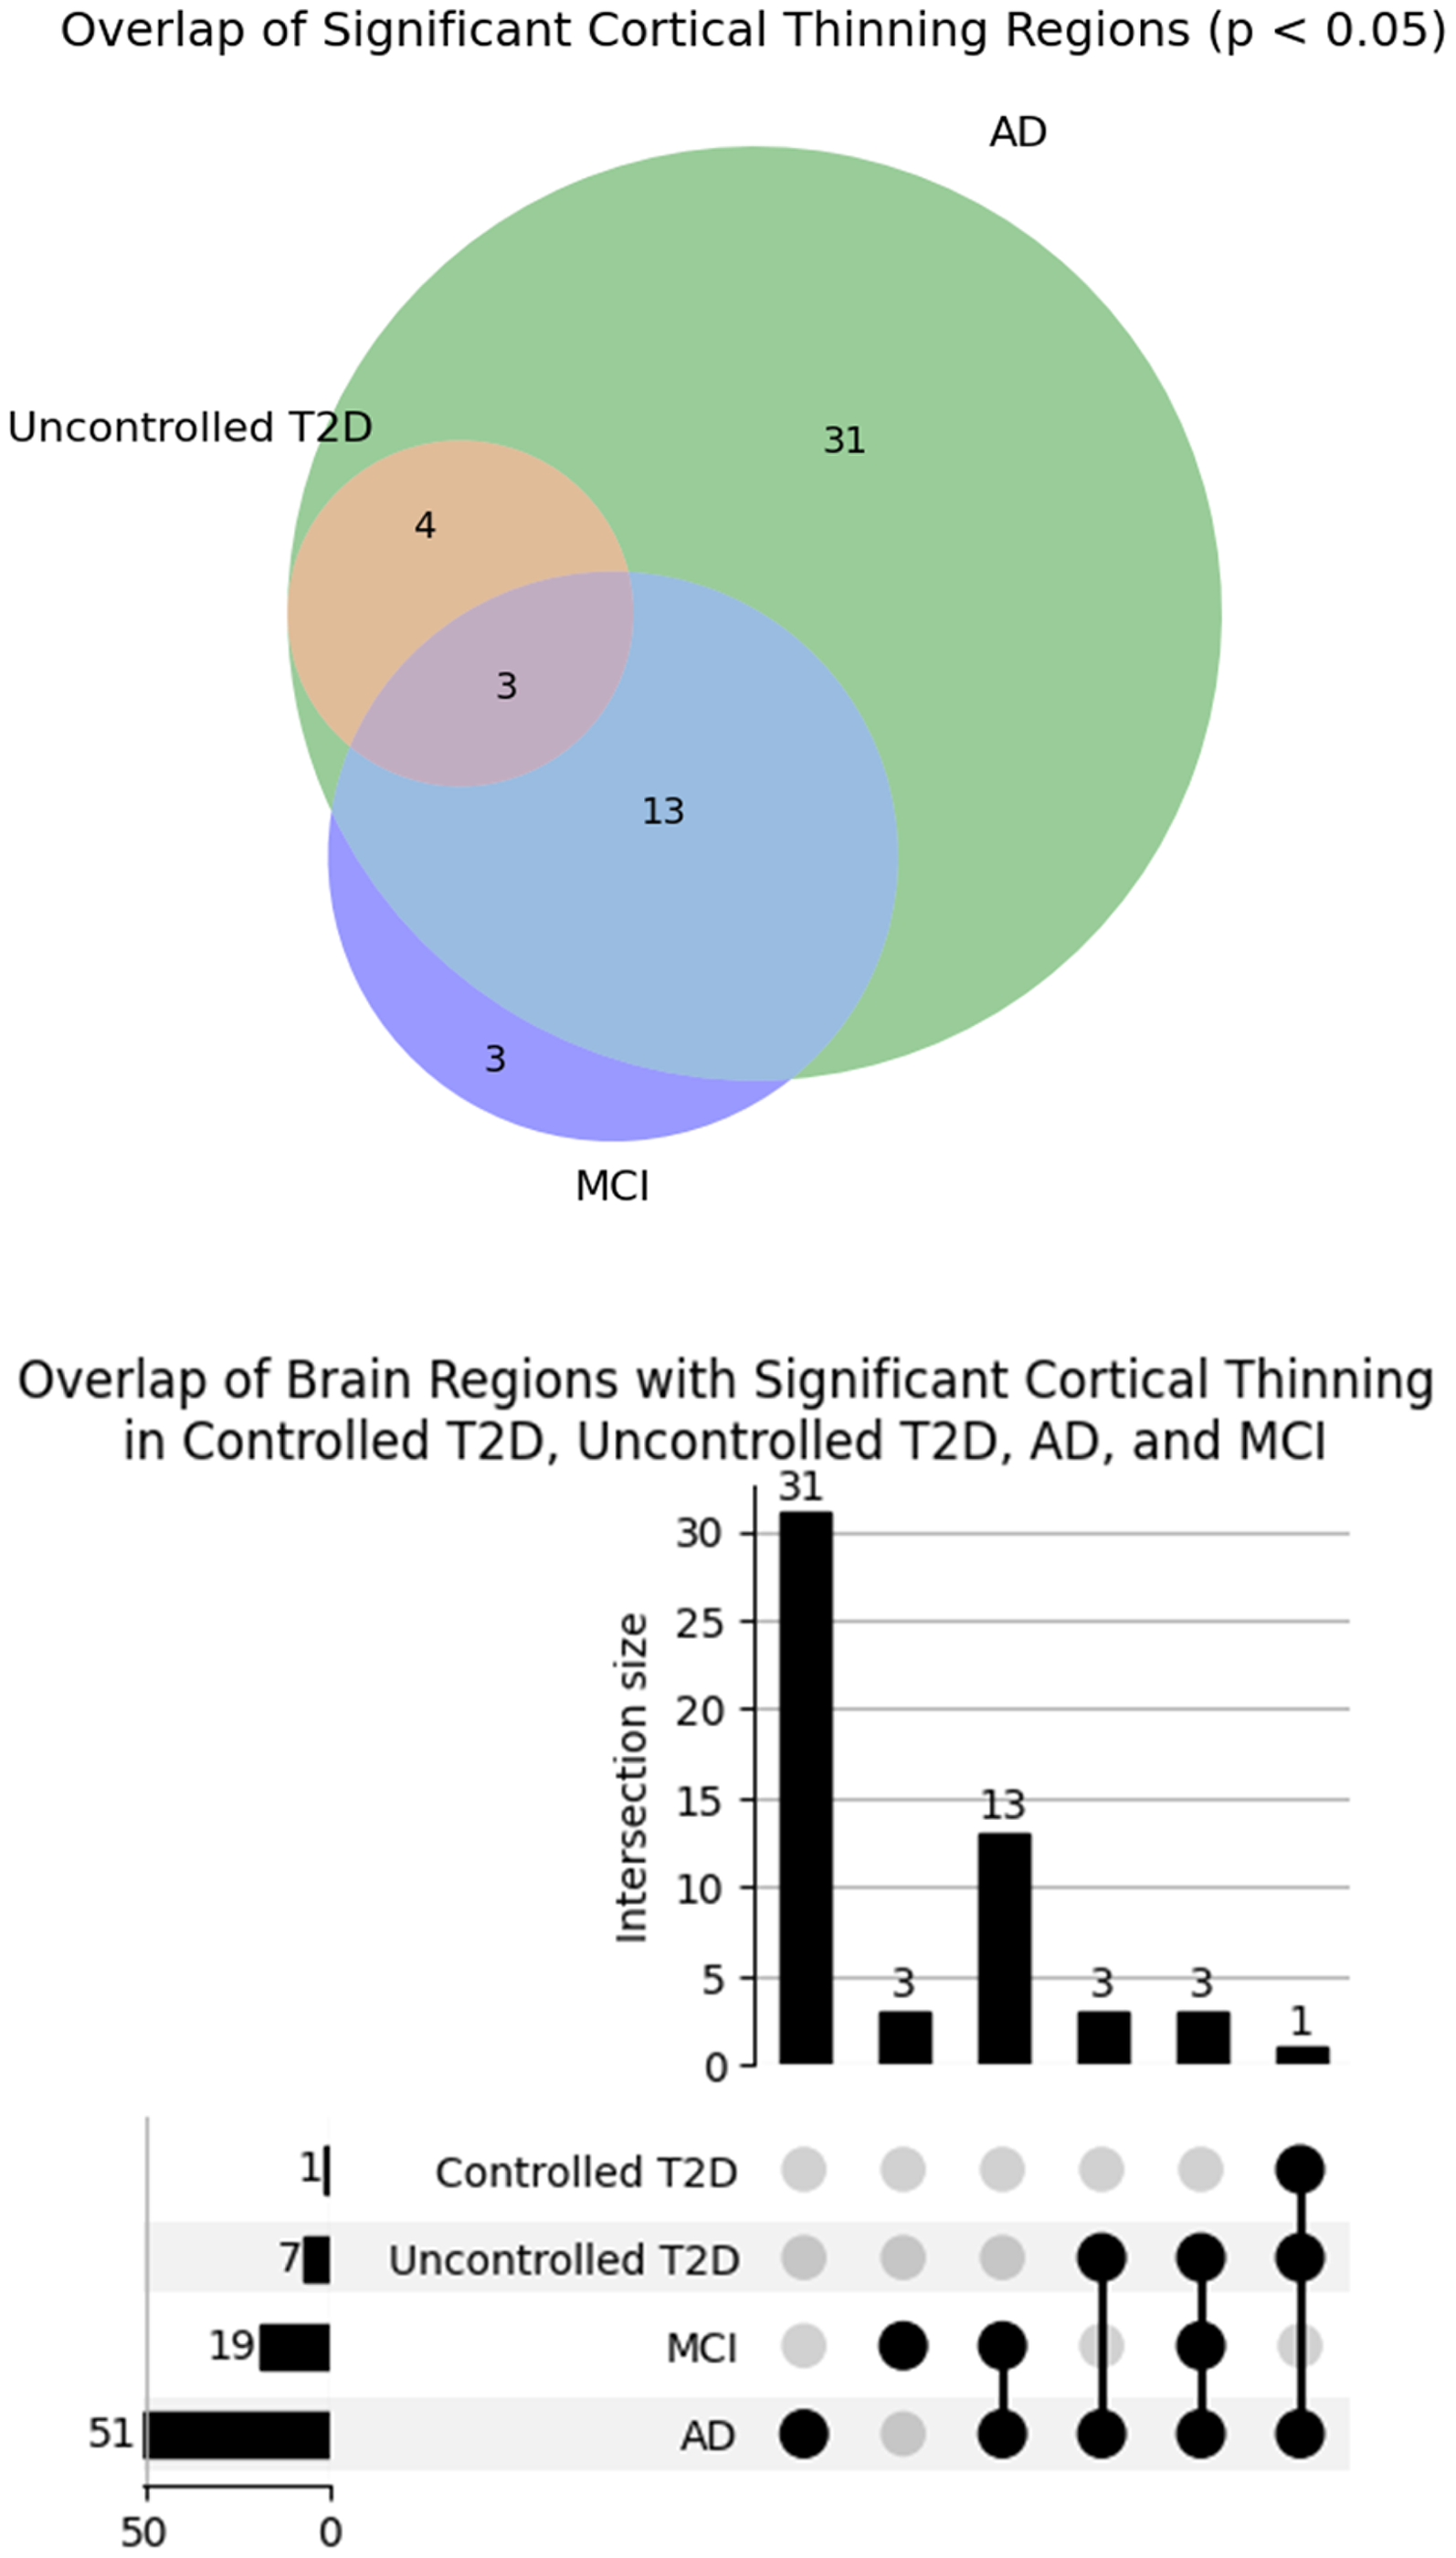
Visualization of overlapping brain regions showing significant cortical thinning (p < 0.05) among individuals with controlled T2D, uncontrolled T2D, ad, and MCI. The UpSet plot (right) quantifies intersections and unique contributions of each group or combination of groups, while the accompanying Venn diagram (left) provides an intuitive representation of shared and distinct atrophic regions across conditions. MCI: mild cognitive impairment.
Discussion
This study investigated whether cortical thickness atrophy patterns associated with uncontrolled T2D overlap with those observed in AD and MCI. Our results revealed partial convergence, with shared atrophy in regions of the frontal, parietal, and temporal lobes—including the insula, superior frontal cortex, supramarginal gyrus, and postcentral gyrus. These findings suggest overlapping regional vulnerabilities related to memory, executive function, motor coordination, and spatial awareness. However, the overall neurodegenerative patterns remained distinct across groups, as supported by weak inter-group correlations, emphasizing the need for region-specific analyses to disentangle shared versus unique pathways.
Frontal Lobe: Atrophy in the frontal lobe, including the prefrontal cortex, is evident in both AD and uncontrolled T2D. The dorsolateral prefrontal cortex, responsible for executive functions such as decision-making and problem-solving,
30
shows significant degeneration in both conditions. MCI also presents with atrophy in the frontal lobe, albeit less extensive than in AD, suggesting a progressive neurodegenerative process. Parietal Lobe: The parietal lobe, particularly the posterior parietal cortex, is affected in both AD and uncontrolled T2D. This region is crucial for spatial awareness and navigation.
31
The precuneus, associated with episodic memory and visuospatial processing, also shows atrophy in these conditions. MCI displays some atrophy in the parietal lobe, reflecting the intermediate stage of neurodegeneration. Insular Cortex: Significant atrophy is observed in the insular cortex in both AD and uncontrolled T2D. The insula is involved in interoceptive awareness, emotional regulation, and autonomic control.
32
MCI shows moderate atrophy in the insular cortex, suggesting early neurodegeneration in this region.
These findings are consistent with our previous work, A systematic review of the impact of type 2 diabetes on brain cortical thickness, 16 which highlights the association between type 2 diabetes and cortical atrophy in key brain regions such as the insula, medial frontal cortex, superior temporal gyrus, and precuneus as frequently affected in T2D. These regions partially overlap with those observed in AD and MCI, reinforcing the notion that both shared and distinct neuroanatomical vulnerabilities exist. This growing body of evidence underscores the impact of metabolic dysfunction on neurodegenerative processes, reinforcing the need for region-specific analyses to elucidate shared and distinct patterns of atrophy across T2D, AD, and MCI.
Future research should focus on longitudinal studies to further elucidate the causal pathways linking glycemic control to brain health and cognitive outcomes, with an emphasis on the role of HbA1c as both a biomarker and a modifiable risk factor in neurodegeneration.
Shared patterns between uncontrolled T2D and AD
In comparing uncontrolled T2D and AD, we observed partial overlap in cortical thinning, particularly within the frontal, parietal, and insular cortices. However, the overall spatial correlation between group-level cortical thickness patterns was weak and non-significant, suggesting that the neurodegenerative trajectories of T2D and AD are at least partially distinct. While our results do not demonstrate strong anatomical convergence, they are not incompatible with prior research linking T2D to an increased risk of developing AD-related pathology.9,16,33–38 This risk may stem from systemic or mechanistic factors beyond spatially overlapping cortical atrophy, including insulin resistance, inflammation, and vascular contributions. Notably, the absence of significant atrophy in the controlled T2D group may suggest potential neuroprotective effects associated with effective glycemic regulation. Several mechanisms may underlie this protection. Chronic hyperglycemia has been shown to induce neuronal apoptosis through the generation of reactive oxygen species and mitochondrial dysfunction, both of which impair cellular energy production and viability.3,39 Additionally, hyperglycemia can damage endothelial cells, leading to impaired cerebral blood flow and blood-brain barrier breakdown, further compromising nutrient and oxygen delivery to brain tissue.3,5 Excess extracellular glucose and impaired insulin signaling may also contribute to excitotoxicity by increasing glutamate accumulation and overstimulating N-methyl-D-aspartate receptors, thereby disrupting calcium homeostasis and triggering neuronal injury.3,4 Furthermore, dysregulated glucose metabolism can impair axonal energy homeostasis, contributing to synaptic dysfunction and structural degradation over time. Effective glycemic control may attenuate these neurotoxic cascades, thereby preserving cortical structure and function.
Shared patterns between MCI and T2D
Similar to findings with AD, our analysis showed that uncontrolled T2D and MCI share cortical thinning in regions such as the frontal, parietal, and insular cortices—areas involved in executive function, attention, and cognitive control. However, Spearman's correlation and spin test analyses revealed only a weak association between the overall cortical thinning patterns of the two groups, suggesting that while regional vulnerabilities overlap, the underlying neurodegenerative mechanisms may differ. These findings are consistent with prior studies linking T2D to MCI-related pathology and supporting the notion of partially independent disease trajectories.40–42
Importance of glycemic control in neurodegeneration
Glycemic control plays a pivotal role in mitigating neurodegenerative changes associated with T2D. In this study, HbA1c served as both a continuous marker of glycemic control and the stratification basis for separating controlled versus uncontrolled T2D groups, consistent with WHO and American Diabetes Association guidelines.23,24,26,27 Our findings align with prior research demonstrating a strong negative relationship between HbA1c levels and cortical thickness, even within prediabetic ranges,43,44 underscoring the importance of early glycemic management in preserving brain health.
Additionally, variability in HbA1c has been linked to an increased risk of dementia and hippocampal atrophy in individuals without diabetes, 43 emphasizing the broader relevance of glycemic stability. These findings support the role of HbA1c not only as a biomarker of disease burden and progression but also as a clinically actionable criterion for stratifying neurodegenerative risk based on glycemic status.
Our study contributes to the growing body of evidence suggesting a complex interplay between metabolic dysfunction, cortical atrophy, and cognitive decline.33–35,37,45,46 By identifying specific brain regions affected in uncontrolled T2D that anatomically overlap with areas vulnerable in AD, we reinforce the notion that metabolic dysregulation may contribute to localized neurodegenerative changes, rather than a global AD-like atrophy pattern.
Furthermore, maintaining stable HbA1c levels appears to have neuroprotective effects. Individuals with controlled T2D exhibited significantly less brain atrophy compared to those with uncontrolled T2D.47,48 This suggests that rigorous glycemic management may slow neurodegenerative progression and preserve cognitive function. Mechanistically, consistent glycemic control may reduce fluctuations that otherwise promote oxidative stress and inflammation—two key contributors to neural damage and cortical thinning. 39 Beyond these factors, prolonged hyperglycemia has been shown to impair cerebral blood flow, disrupt neurovascular coupling, and compromise blood–brain barrier integrity.3,5 Such vascular dysregulation may reduce nutrient and oxygen delivery to cortical tissue, accelerating neurodegeneration. Additionally, mitochondrial dysfunction, often triggered by chronic insulin resistance and glucose toxicity, increases vulnerability to excitotoxicity through dysregulated glutamate signaling.3,4 This in turn can activate apoptotic pathways, further contributing to neuronal loss and cortical atrophy.3,39
Taken together, these findings highlight glycemic control as a crucial component in both therapeutic and preventive strategies aimed at preserving brain health. Future studies should investigate the mechanisms linking metabolic regulation to cortical integrity and explore interventions that optimize glycemic stability across both diabetic and non-diabetic populations.
Implications of trends toward cortical thinning in uncontrolled T2D
While our analysis did not yield statistically significant findings after correction, several brain regions in individuals with uncontrolled T2D showed consistent trends toward cortical thinning with p-values just above the conventional threshold (e.g., right transverse temporal gyrus, p-corrected = 0.054; right medial orbitofrontal cortex, p-corrected = 0.051). These trends, though not conclusive, may still be biologically informative when considered alongside prior literature and the functional roles of these regions.
Importantly, the implicated regions—including the medial orbitofrontal cortex, caudal middle frontal gyrus, and superior temporal gyrus—are known to support executive function, reward processing, and auditory and language-related cognition, all domains that may be subtly affected in T2D. Although we refrain from making definitive claims about these findings, the observed directional consistency across multiple functionally relevant regions suggests a pattern worth exploring further in larger or more powered studies.
Rather than interpreting these trends as evidence of biological significance, we present them as hypotheses-generating signals that warrant further investigation. Future research with greater statistical power and multimodal approaches may clarify whether these regions are early targets of T2D-related cortical vulnerability.
These results highlight the importance of considering subtle regional changes as potential early markers of neurodegeneration. Future studies with larger sample sizes or advanced statistical modeling may reveal stronger associations, helping to clarify whether these regions signal early cognitive decline in T2D and whether they represent viable targets for early intervention.
Building on these considerations, we applied FDR correction for multiple comparisons to reduce the risk of Type I errors and ensure the robustness of our results. However, given the modest sample sizes, these power considerations reflect the balance between statistical rigor and the practical limitations of working with large-scale observational datasets. To preserve internal validity, all statistical comparisons were restricted to within-cohort analyses. This approach reduces potential confounding due to differences in neuroimaging acquisition protocols, preprocessing pipelines, and population structures across the UKBB and ADNI datasets. Consequently, the findings are most generalizable to populations with characteristics similar to those of each respective cohort.
Limitations and future directions
While our study offers valuable insights into the neuroanatomical correlates of T2D and cognitive impairment, several limitations warrant consideration, and avenues for future research merit exploration.
First, the cross-sectional design limits causal inference and precludes the assessment of temporal relationships between T2D, cognitive decline, and neurodegeneration. Longitudinal studies are needed to track the trajectory of cortical atrophy and cognitive decline in T2D and to identify critical windows for intervention.
Second, our analysis focused solely on cortical thickness as a structural marker of neurodegeneration. While informative, a multimodal imaging approach, incorporating techniques such as fluorodeoxyglucose PET and perfusion MRI, could offer a more comprehensive view of both structural and functional brain alterations in T2D.
Third, our exclusion of individuals with comorbid conditions may limit generalizability. Since T2D commonly coexists with metabolic and vascular disorders that can influence brain health, future studies should aim for broader, more representative samples with detailed phenotyping to better capture the heterogeneity of T2D-related cognitive dysfunction.
Fourth, although we explored the role of glycemic control in neurodegeneration, the underlying biological mechanisms remain unclear. Future investigations should assess the influence of insulin resistance, T2D medications, and metabolic dysregulation on brain structure and function to help identify therapeutic targets.
Fifth, the interpretation of neuroimaging findings in the context of cognitive function warrants caution, as cognitive impairment is a multifaceted construct that extends beyond structural brain changes alone. Future research should integrate neuroimaging data with cognitive assessments and biomarker profiles, such as inflammatory markers, neurodegeneration-associated proteins, and metabolic indicators, to gain a more nuanced understanding of T2D-related cognitive decline. Such an approach may facilitate the development of personalized intervention strategies aimed at preserving cognitive health in individuals with T2D.
Sixth, because this study integrates data from two independent cohorts (UKBB and ADNI), same-subject validation across metabolic and neurodegenerative conditions was not feasible. Likewise, wet lab validation (e.g., molecular biomarkers or postmortem analyses) was beyond the scope of this imaging-based study. Future studies should aim to validate these findings within longitudinal or multimodal cohorts that include both imaging and biomarker data from the same individuals to better understand causal pathways and biological underpinnings.
Seventh, although the cohorts are independent and unpaired, cortical thickness data were processed through standardized pipelines in both datasets and statistical models were adjusted for age and sex. This allowed for a consistent analytic approach and biologically meaningful comparison of region-specific atrophy patterns across the metabolic and neurodegenerative spectrum.
Lastly, while only age and sex were included as covariates in our models, we examined BMI and education level to ensure these variables were not significantly different across groups (Table 1), thereby reducing the risk of confounding. BMI was assessed because it reflects metabolic status and systemic inflammation—factors known to influence brain structure and integrity, particularly in individuals with metabolic disorders such as T2D. Higher BMI has been associated with increased risk of cortical thinning and reduced gray matter volume, with obesity-related neurodegeneration shown to mimic AD.18,19 Education level was evaluated as a proxy for cognitive reserve, which may modulate the relationship between neuropathology and cognitive performance. Differences in education could influence brain structure resilience and thus potentially confound associations with cortical. 49 However, incorporating additional covariates such as hypertension, cholesterol, or physical activity—while relevant—would substantially increase model complexity and was beyond the scope of this analysis. Future work using multivariable frameworks may better clarify the individual and synergistic roles of these factors.
Conclusion
Our findings indicate that individuals with uncontrolled T2D exhibit cortical thinning in specific brain regions, some of which show overlap with the neurodegenerative patterns observed in MCI and AD. However, the overall cortical atrophy profile appears distinct, as suggested by weak and non-significant correlations between the patterns. This may reflect a partially independent neurodegenerative process associated with metabolic dysfunction in T2D. In contrast, individuals with controlled T2D did not show significant cortical thinning, suggesting a potential association between glycemic control and preserved cortical structure.
While causality cannot be inferred from this observational study, the region-specific thinning observed in uncontrolled T2D highlights the need for longitudinal and mechanistic studies. These results support the hypothesis that metabolic dysregulation may contribute to cognitive decline via targeted cortical vulnerabilities. Early and sustained metabolic management could play an important role in protecting brain health in T2D, with implications for clinical care and population-level dementia prevention strategies.
Supplemental Material
sj-docx-1-alz-10.1177_13872877251365671 - Supplemental material for Commonalities in cortical neurodegeneration between type 2 diabetes and Alzheimer's disease
Supplemental material, sj-docx-1-alz-10.1177_13872877251365671 for Commonalities in cortical neurodegeneration between type 2 diabetes and Alzheimer's disease by Mahboubeh Motaghi, Olivier Potvin, Simon Duchesne and for the Alzheimer's Disease Neuroimaging Initiative in Journal of Alzheimer's Disease
Footnotes
Acknowledgments
UK Biobank: This research has been conducted using the UK Biobank Resource (https://pubmed.ncbi.nlm.nih.gov/25826379/) under application number 85063. Alzheimer's Disease Neuroimaging Initiative (ADNI): Data collection and sharing for this project was funded by the Alzheimer's Disease Neuroimaging Initiative (ADNI) (National Institutes of Health Grant U01 AG024904) and DOD ADNI (Department of Defense award number W81XWH-12-2-0012). ADNI is funded by the National Institute on Aging, the National Institute of Biomedical Imaging and Bioengineering, and through generous contributions from the following: AbbVie, Alzheimer's Association; Alzheimer's Drug Discovery Foundation; Araclon Biotech; BioClinica, Inc.; Biogen; Bristol-Myers Squibb Company; CereSpir, Inc.; Cogstate; Eisai Inc.; Elan Pharmaceuticals, Inc.; Eli Lilly and Company; EuroImmun; F. Hoffmann-La Roche Ltd and its affiliated company Genentech, Inc.; Fujirebio; GE Healthcare; IXICO Ltd;Janssen Alzheimer Immunotherapy Research & Development, LLC.; Johnson & Johnson Pharmaceutical Research & Development LLC.; Lumosity; Lundbeck; Merck & Co., Inc.;Meso Scale Diagnostics, LLC.; NeuroRx Research; Neurotrack Technologies; Novartis Pharmaceuticals Corporation; Pfizer Inc.; Piramal Imaging; Servier; Takeda Pharmaceutical Company; and Transition Therapeutics. The Canadian Institutes of Health Research is providing funds to support ADNI clinical sites in Canada. Private sector contributions are facilitated by the Foundation for the National Institutes of Health (![]() ). The grantee organization is the Northern California Institute for Research and Education, and the study is coordinated by the Alzheimer's Therapeutic Research Institute at the University of Southern California. ADNI data are disseminated by the Laboratory for Neuro Imaging at the University of Southern California.
). The grantee organization is the Northern California Institute for Research and Education, and the study is coordinated by the Alzheimer's Therapeutic Research Institute at the University of Southern California. ADNI data are disseminated by the Laboratory for Neuro Imaging at the University of Southern California.
Ethical considerations
This study involved secondary analysis of de-identified human data from the UK Biobank (application number 85063) and the ADNI. All participants in these cohorts provided informed consent, and the original studies received ethics approval from their respective institutional review boards. No new human or animal subjects were recruited or studied by the authors.
Author contributions
Funding
The authors disclosed receipt of the following financial support for the research, authorship, and/or publication of this article: MM was supported in part by a grant from the Canadian Institutes for Health Research to SD (PJT-159778). This research also utilized data from UKBB (application number 85063) and ADNI, funded by the National Institutes of Health (Grant U01 AG024904), the Department of Defense (award number W81XWH-12-2-0012), and various industry and academic partners.
Declaration of conflicting interests
The authors declared no potential conflicts of interest with respect to the research, authorship, and/or publication of this article.
Data availability statement
The data supporting the findings of this study are openly available from UKBB (https://www.ukbiobank.ac.uk/) and the ADNI (![]() ) upon formal application and approval.
) upon formal application and approval.
Supplemental material
Supplemental material for this article is available online.
References
Supplementary Material
Please find the following supplemental material available below.
For Open Access articles published under a Creative Commons License, all supplemental material carries the same license as the article it is associated with.
For non-Open Access articles published, all supplemental material carries a non-exclusive license, and permission requests for re-use of supplemental material or any part of supplemental material shall be sent directly to the copyright owner as specified in the copyright notice associated with the article.