
Abstract
Background
Alzheimer's disease (AD) is a neurodegenerative disorder characterized by cognitive decline, amyloid plaques, neurofibrillary tangles, and neuroinflammation. Glial cells—astrocytes, microglia, and oligodendrocytes—play essential roles in AD progression, but their pathway-specific genetic contributions remain unclear.
Objective
To identify glial cell type-specific biological pathways associated with AD using pathway-based polygenic risk score (PRS) analysis.
Methods
We applied PRSet to evaluate associations between glial-specific pathways and AD in a discovery dataset (ADc1234ADA), adjusting for the top two principal components (Model 1), and additionally for sex, age, and APOE ε4 status (Model 2). Pathways with nominal significance (p < 0.05) were further tested in an independent replication dataset (ADNI). Results from both datasets were meta-analyzed and assessed for statistical significance using Bonferroni correction. Competitive p-values were used to determine the relative contribution of each pathway within glial types. Genes from significant pathways were used in a follow-up gene-based PRS analysis, following the same modeling and validation steps.
Results
In Model 1, we identified four significant astrocytic, six microglial, and one oligodendrocyte pathways. In Model 2, five astrocytic and three oligodendrocytic pathways remained significant; no microglial pathways met significance. The top pathways were the immune system in astrocytes, antigen processing in microglia, and transport and trafficking in oligodendrocytes. At the gene level, BCL3 and BIN1 were significant in Model 1, while only BIN1 remained in Model 2.
Conclusions
These findings highlight distinct glia-specific genetic contributions to AD, particularly involving immune-related pathways, and demonstrate the value of cell-type-specific PRS approaches in AD research.
Keywords
Introduction
Alzheimer's disease (AD) is a complex neurodegenerative disorder characterized by progressive cognitive decline and extensive brain pathology, including amyloid plaques, neurofibrillary tangles, and neurodegeneration. 1 While much research has focused on neuronal dysfunction in AD, emerging evidence suggests that glial cells—astrocytes, microglia, and oligodendrocytes—play crucial roles in the disease's pathogenesis.2,3 Glial cells are known to play an important role in homeostasis maintenance, immune responses, and neuronal support and protection within the central nervous system (CNS). Recent research on glial cells has remarkably revealed their cell-type-specific roles in neurodegenerative diseases in how they disrupt neuronal transmission and homeostasis within the brain, as well as have enhanced reactivity and functional alterations in the context of these diseases, including in AD. 4 In addition, both intrinsic factors (age, sex, genetic background, etc.) and extrinsic factors (pathogens, nutrition, microbiota, etc.) influence their functions or states. 5 However, it remains unclear if glial dysfunctions in AD represent primary glial-genetic deficits and not merely secondary responses to disturbances in neuronal functioning.
Genetic studies based on single-nucleotide polymorphisms (SNPs) have gained remarkable insight into primary genetic processes that might be the underpinning mechanisms for disease. With increasingly large samples, genome-wide association studies (GWAS) have confirmed that AD is highly polygenic, with over 80 significant loci and aggregation of a tiny effect of each SNP accounting for a small proportion of the variance in case-control status. 6 Thus, investigation of variants across the entire genome or a particular pathway, rather than just top loci, will likely be most informative to identify the disease-relevant biological etiology. Polygenic risk scores (PRS), which aggregate the effects of multiple genetic variants, have emerged as powerful tools to assess the cumulative genetic risk for complex disorders like AD. 7 Yet, traditional thresholding or “best-fit” PRSs do not provide genetic risk at cell-type-specific or biological pathway levels. 8 Alternatively, PRS can be composed of SNPs mapped to genes or gene sets, which reflect the encoding of different biological functions, termed pathway-based PRS or PRSet. 9 This approach has been applied to AD, where pathway-specific PRSs were identified as associated with many AD-related traits, such as amyloid-β (Aβ) deposition, brain structure, tau pathology, cognitive function, and clinical status.10–15 However, given the growing interest in the role of glial cells in AD, the association between AD and pathway-PRSs for each glial cell type remains largely unexplored.
Glial cells play overlapping roles in AD, suggesting genetic risk may manifest differently across cell types.16–20 Microglia, resident immune cells in the brain, are an inflammatory response cell that has a role in pathways such as the immune system, antigen processing, cytokines, etc. Astrocytes, the most abundant brain glial cells, are known for pathways related to the response to oxidative stress, assisting microglia in the immune system, preserving synaptic function, and protecting neurons from lipotoxicity.21,22 Prolonged activation of astrocytes can contribute to neuroinflammation and cognitive decline. Oligodendrocytes demonstrate pathways in myelination and provide metabolic and trophic support for axons within the brain.23–25 The disruption of oligodendrocytes and myelin results in axonal demise and neurodegeneration, such as AD. Evidence links glial-mediated neuroinflammation to neurodegeneration and cognitive decline in AD. Understanding cell-type-specific roles in the correlation of AD could pave the way for novel therapeutic strategies.
In this study, we conduct a pathway-based PRS across various glial cell types to identify cell-type-specific pathways contributing to AD. By leveraging the largest AD GWAS data, cell-type-specific pathways, and AD genotype data, we aim to identify which glial cell-specific pathways are significantly associated with AD risk. A meta-analysis of two independent datasets adjusted with top principal components (PCs) was initially conducted, followed by additional adjustments with common AD-risk factors, including age, sex, and APOE ε4 count. Association between AD and gene-based PRSs was further conducted for the genes from those significant pathways.
Methods
Study design overview
The overall design of our study is shown in Figure 1. Briefly, pathway-based PRSs were constructed following the instructions of PRSet 9 and analyzed within each of the glial cells in target individual genotype data from AD cases and controls. To this end, we obtained the functional gene sets across three glial cell types (Supplemental Table 1) from a previous study 26 and used AD GWAS summary statistics of European ancestry as our base data. 27 A pathway-based PRS was first conducted using a discovery target dataset (ADc1234ADA), adjusted for the top two PCs in Model 1. This was followed by replication in an independent target dataset (Alzheimer's Disease Neuroimaging Initiative, ADNI) for pathways that showed nominal associations (p < 0.05) in the ADc1234ADA dataset. A meta-analysis was conducted when the OR signal was in the same direction in both datasets. In addition, the association between AD and pathway-based PRSs was also determined through meta-analysis by adjusting for additional covariates: age, sex, and APOE ε4 allele count (Model 2) in both target datasets. Gene-based PRS analysis was then carried out for genes from all the significant glial cell-type-specific pathways to determine the glia-specific genes associated with AD.
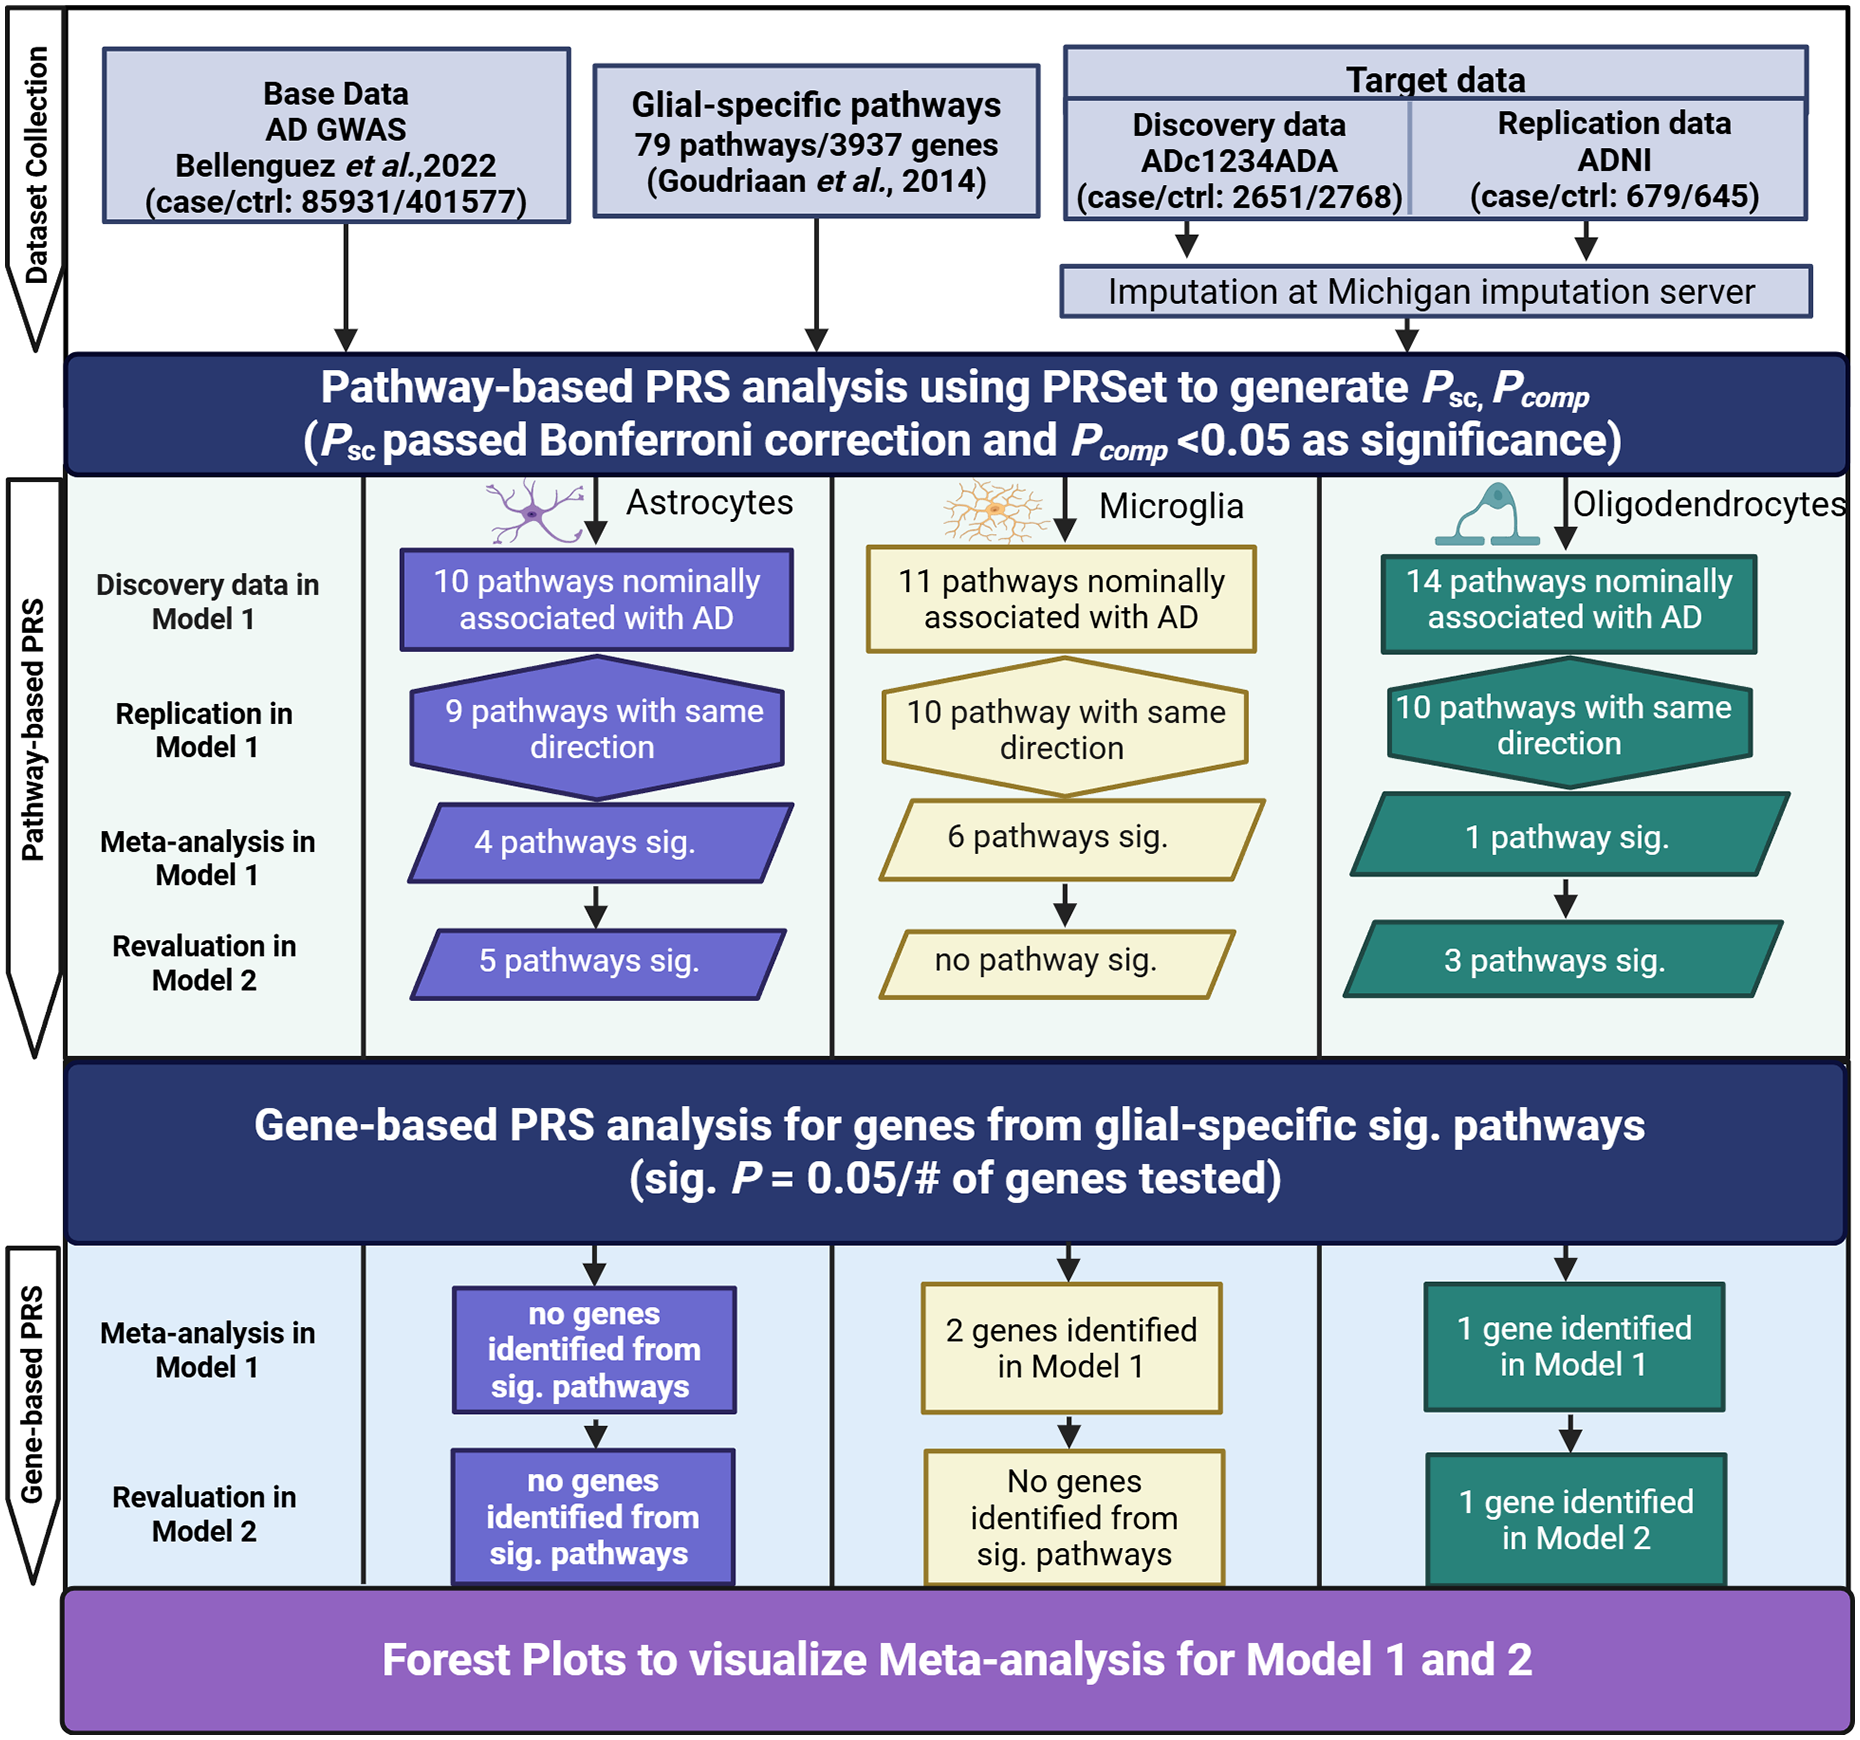
Study design flowchart. “Base” data provide summary statistics for SNPs shared with individuals in the “Target” data. 79 glial-specific pathways were included in this study. PRSet was used to assess the correlation between glia-specific pathways and AD in both discovery and replication datasets followed by meta-analysis in two models. Model 1 was adjusted for PC1 and PC2, whereas Model 2 included additional covariates (sex, age, and APOE ε4 allele count). In Model 1, 35 pathways were found to be nominally genetically associated with AD diagnosis in the discovery data (p < 0.05), while 29 pathways were found with the same direction in the replication data. Pathways that passed the Bonferroni correction in self-contained psc (from meta-analysis) and had a pcomp < 0.05 in the discovery data were considered significant. Gene-based PRS analysis was further conducted for genes within the pathways identified in our pathway-based PRS analysis. Three genes were confirmed to be significantly associated with AD by the meta-analysis in Model 1, while only one gene was significantly associated with AD in Model 2.
Data sources
AD GWAS summary statistics data
For our base data, we obtained the AD GWAS summary statistics from the GWAS catalog (Cat#: GCST90027158), comprising 39106 clinically diagnosed AD cases, 46828 proxy AD cases (AD reported in at least one parent), and 401577 controls in discovery data. 27 This AD GWAS data was retrieved from the largest AD genomic consortia for the European population.
Glial gene-set data
Lists of non-overlapping genes under specific pathways across three glial cells were obtained from a detailed literature search, Gene Ontology (GO) annotations, and advanced glial knowledge in a previous comprehensive study (See more details in the previous publication). 26 There are a total of 79 gene sets/pathways with 31 in astrocytes (1998 genes), 19 in microglia (289 genes), and 29 in oligodendrocytes (1650 genes) in the final lists (See Supplemental Table 1). Of note, overrepresentation analysis from the previous study has confirmed that those pathways are indeed good representatives of glial cell-type-specific functioning. 26 Additionally, we verified that there was no overlap of genes between the different cell types included in our analysis. The number of genes per pathway ranges from 8 to 591 (mean = 92). Please note APOE gene was excluded from our analysis and therefore did not contribute to any pathways.
AD genotype data (target data): discovery and replication datasets
For AD genotype data, we requested two datasets as discovery data from the dbGaP: one was from the National Institute of Aging/Late-onset Alzheimer's Disease Study (NIA/LOAD) cohort consents 1 to 4 (phs000168.v2.p2, ADc1234), 28 and another one was from the Multi-Site Collaborative Study for Genotype-Phenotype Associations in Alzheimer's Disease Study (phs000219.v1.p1, GenADA). 29 Per the 1984 National Institute of Neurological Disorders and Stroke-Alzheimer's Disease and Related Disorders (NINCDS-ADRDA) clinical criteria, we only included definite, probable, or possible AD cases within these target files. 30 Patients with non-specified dementia, another neurological disease-related dementia, or individuals of non-European ancestry were removed from this study. The two datasets were imputed separately and then merged as the discovery dataset (See below for imputation). To validate the results from the discovery data, we used an independent AD genotype data ADNI, as replication data. 31 This ADNI study consisted of three phases: ADNI1, ADNIGO2, and ADNI3. 31 Data used in the preparation of this article were obtained from the Alzheimer's Disease Neuroimaging Initiative (ADNI) database (adni.loni.usc.edu). The ADNI was launched in 2003 as a public-private partnership, led by Principal Investigator Michael W. Weiner, MD. The primary goal of ADNI is to test whether serial magnetic resonance imaging, positron emission tomography, other biological markers, and clinical and neuropsychological assessment can be combined to measure the progression of mild cognitive impairment and early AD. To maximize the number of genetic variants and sample size, we performed imputation for all genotype data using the Michigan Imputation Server (minimac4) (https://imputationserver.sph.umich.edu) with the 1000 Genomes Phase 3v5 as the reference.32,33 After imputation, we conducted quality control to retain SNPs with imputation quality (INFO) > 0.3, a minor allele frequency (MAF) > 0.01, a Hardy–Weinberg equilibrium test p-value > 0.000001, a missing genotype rate, and missing rate per person < 0.01 by using Plink (v.1.9). 34 We then merged the imputed ADc1234 and GenADA data as our discovery data (ADc1234ADA) with AD cases and controls of 2651/2768. The merged ADNI data was used as replication data with AD cases and controls of 679/645. Table 1 shows the demographic characteristics of the discovery and replication data with information on APOE genotypes.
Demographic characteristics of the discovery and replication data with information of APOE genotypes.
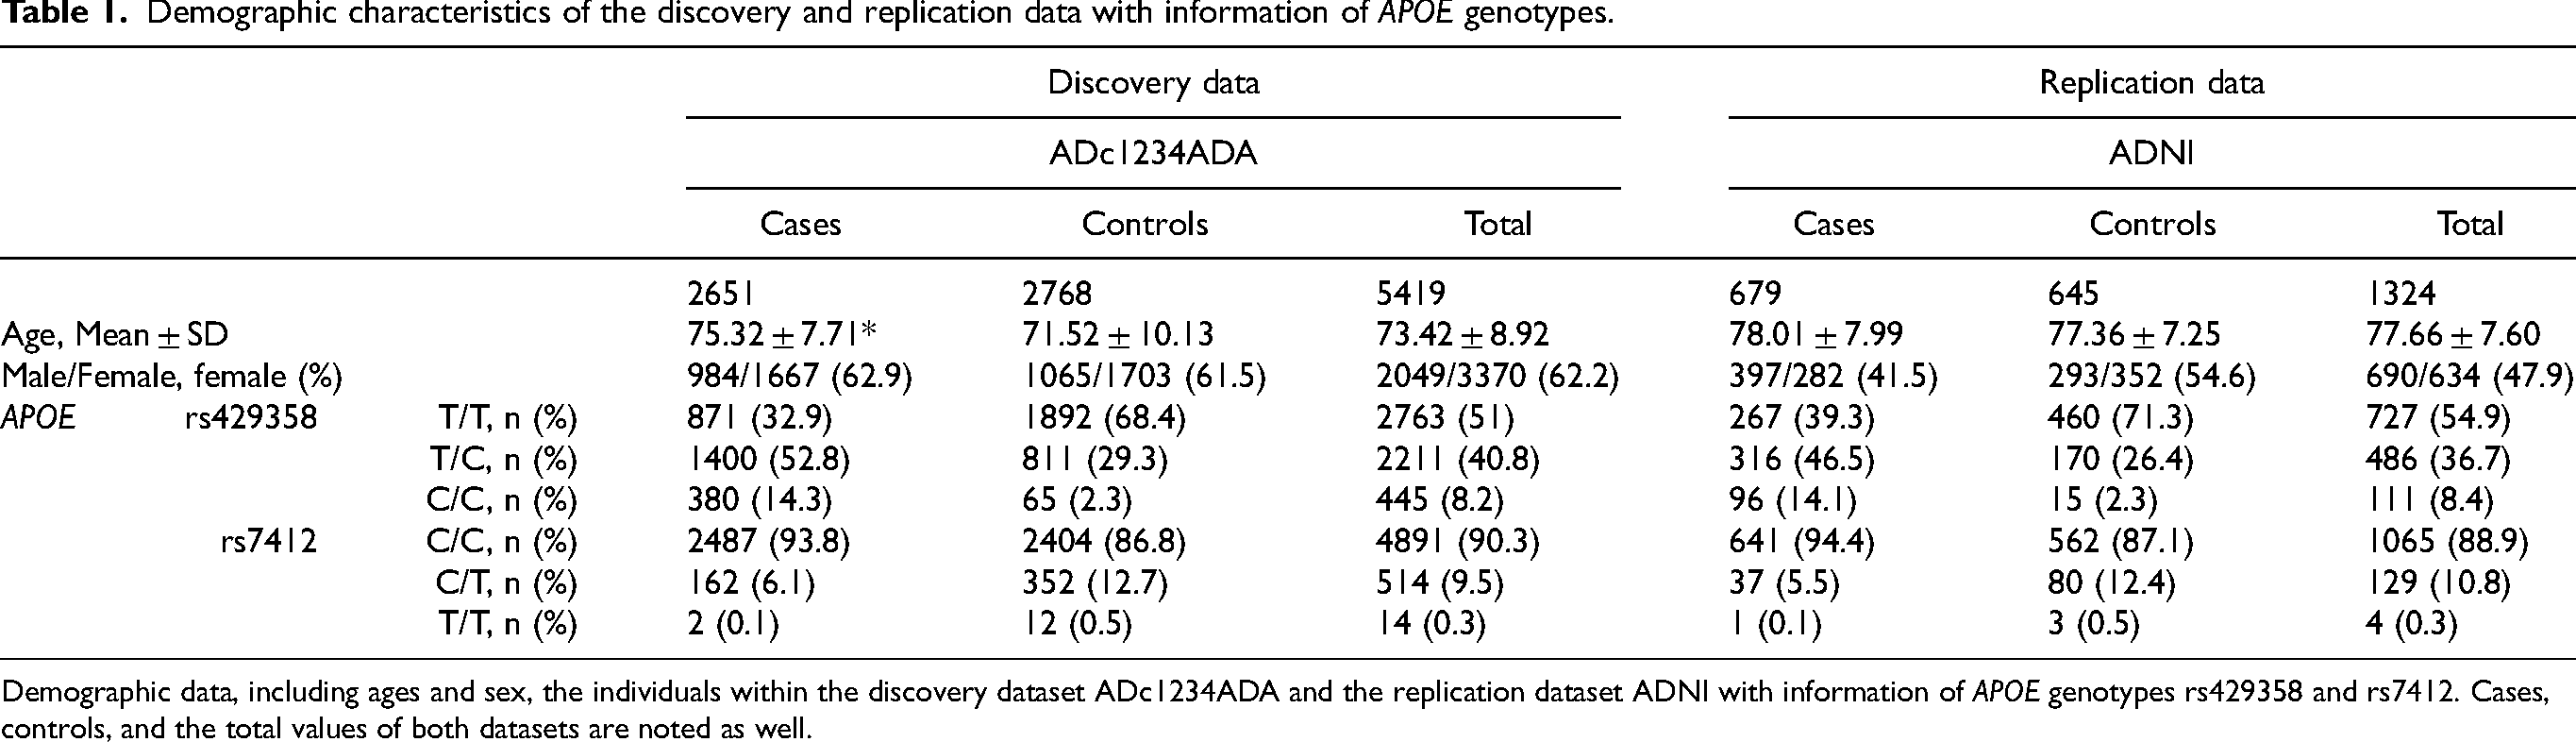
Demographic data, including ages and sex, the individuals within the discovery dataset ADc1234ADA and the replication dataset ADNI with information of APOE genotypes rs429358 and rs7412. Cases, controls, and the total values of both datasets are noted as well.
Pathway-based and gene-based PRS analyses via PRSet software
Pathway-based PRS analyses
Using AD GWAS summary statistics and pathways mentioned above, we calculated pathway-based PRSs for the glial cell-type-specific pathways for AD cases and controls in the target data. To this end, we used the default linkage disequilibrium (LD) clumping (‐‐clump-kb 250 kb ‐‐clump-p 1.0 ‐‐clump-r2 0.1) without p-value thresholding, as recommended by the authors of PRSet version 2.3.5. 9
We tested two logistic regression models for the association between pathway-based PRSs and AD diagnosis. In Model 1, we evaluated the association adjusted for the potential bias of genetic variance from different population substructures. 35 Thus, the PRS from the glial-specific pathway and the top two PCs were included in the logistic regression analysis. In Model 2, we evaluated the association with additional adjustment for those common AD-risk factors, such as age, sex, and APOE ε4 allele count.
For two pathways (the immune system and protein metabolism), which were identified as significant in at least two types of glial cells, we conducted Reactome pathways analysis using the Reactome Pathway Browser (version 3.4.1) 36 (https://curator.reactome.org/PathwayBrowser/#/) to further identify the top pathways more specifically associated with each cell type.
Gene-based PRS analyses
Next, we identified which genes were associated with AD from those significant pathways within each glial cell type. To this end, we collected all the unique genes from pathways that passed the combined self-contained psc-value. Gene-based PRS was conducted with the same procedure as in the pathway-based PRS for both discovery and replication data. Finally, we performed a meta-analysis combining the results from both datasets. Significant genes were identified if their associations passed the Bonferroni-corrected p-value threshold (0.05/# of genes tested in each glial cell type).
Meta-analysis and statistical analyses
Initially, Model 1 was conducted in the discovery data for all 79 pathways across the three glial cell types. For pathways with an association p-value < 0.05 in the discovery data, we then conducted Model 1 in the replication data. If the effects in both discovery and replication data were in the same direction, 37 we then conducted a meta-analysis of both discovery and replication data. We used the R package “metafor” v.4.6.0 with a fixed-effect model for the meta-analysis, where a combined self-contained psc-value was generated for the association. Bonferroni corrected psc were used to account for multiple testing (at α = 0.05) within each of the three glial groups. Meta-analysis for Model 2 was only conducted in the pathways that passed the Bonferroni correction from Model 1. Furthermore, an additional competitive test was performed on the discovery data to assess the enrichment of the pathways that showed significance in the combined self-contained test. We utilized the built-in PRSet permutation function ‐‐set-perm 1000 to accomplish this test. 9
To visualize the results from the meta-analysis, we performed a forest plot using the “forestploter” package 3.1.3. 38
Results
Significant pathways associated with AD in astrocytes
Of the 31 astrocyte-specific pathways, we found that 10 pathways reached a nominal association (p < 0.05) in the discovery data (ADc1234ADA) from Model 1. We then replicated the association of the same 10 pathways in the replication data (ADNI). As a result, we found that nine pathways had the same direction in terms of effect in the OR values. Next, we conducted a meta-analysis of the two datasets for the nine pathways and found that seven pathways passed the Bonferroni-corrected psc threshold (0.05/9 = 0.0056) (Table 2), all of which were positively correlated to AD (ORs > 1). The seven pathways were the immune system (OR = 1.098, 95% CI = 1.046–1.152, psc = 1.49 × 10⁻⁴), response to oxidative stress (OR = 1.097, 95% CI = 1.045–1.151, psc = 1.74 × 10⁻⁴), protein metabolism (OR = 1.088, 95% CI = 1.037–1.142, psc = 5.82 × 10⁻⁴), protein modification (OR = 1.086, 95% CI = 1.035–1.140, psc = 7.74 × 10⁻⁴), cytoskeleton (OR = 1.076, 95% CI = 1.025–1.129, psc = 0.003), cell cycle & division (OR = 1.079, 95% CI = 1.029–1.133, psc = 0.002), and tyrosine-kinase signaling (OR = 1.077, 95% CI = 1.026–1.130, psc = 0.003). Furthermore, we found that four out of the seven pathways passed the competitive pcomp-value threshold of 0.05, suggesting they were astrocyte-specific, enriched pathways significantly associated with AD. These four pathways were related to response to oxidative stress (pcomp = 0.004), protein modification (pcomp = 0.030), immune system (pcomp = 0.036), and cytoskeleton (pcomp = 0.043) (See Table 2 and Figure 2).
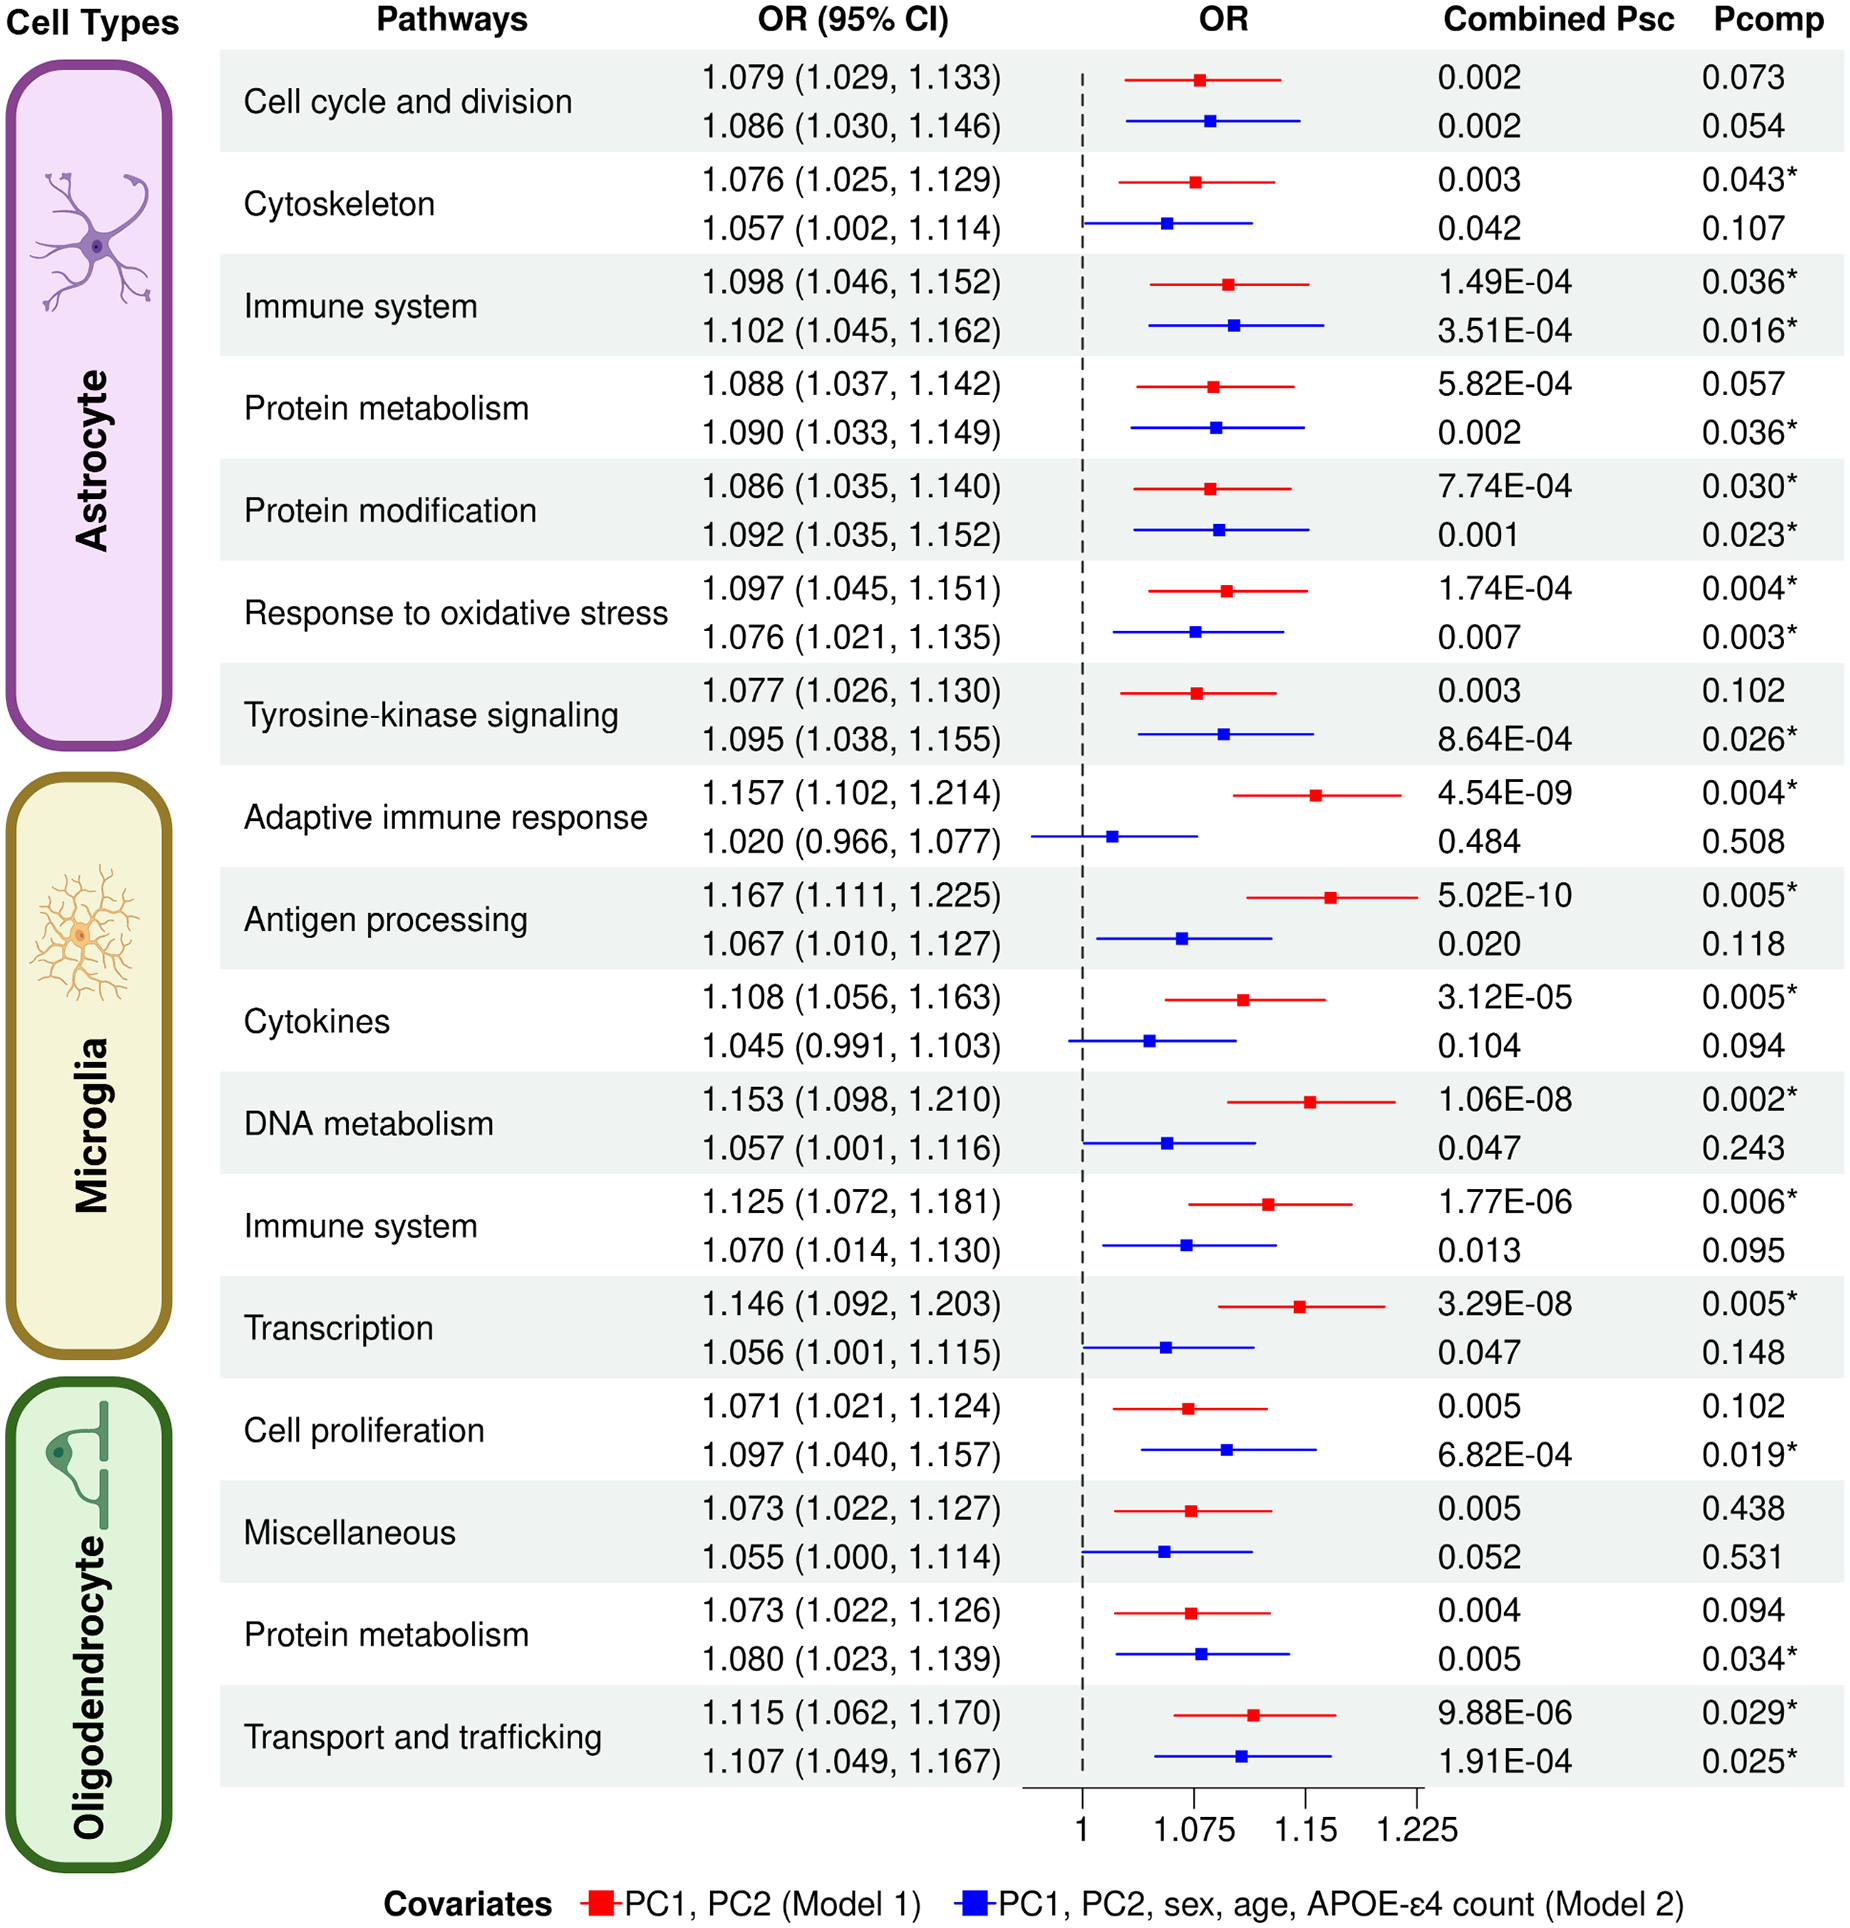
Genetic correlation between AD and PRSs of glial-specific pathways from three types of glial cells. It showed the Forest plots of 17 pathways that passed the Bonferroni-corrected psc threshold from a meta-analysis in Model 1. OR (95%CI): Odds ratio of the respective pathways with the lower and upper 95% confidence intervals. The asterisk (*) indicates a significantly enriched association with AD. (Color figure available in online).
Meta-analysis for association between astrocyte-specific pathways and AD (Bonferroni-corrected psc = 0.0056).
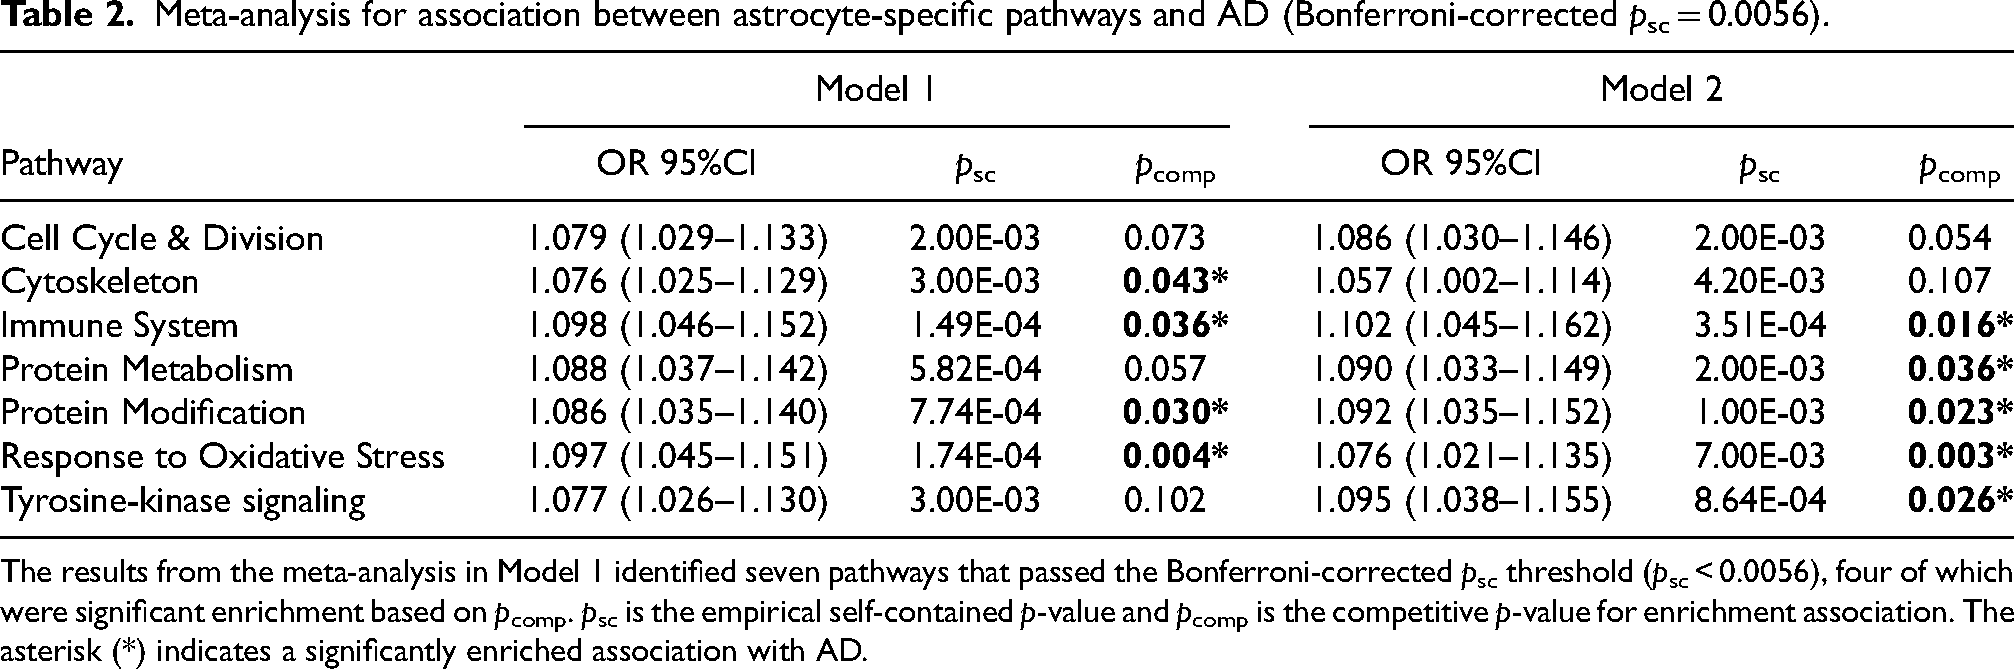
The results from the meta-analysis in Model 1 identified seven pathways that passed the Bonferroni-corrected psc threshold (psc < 0.0056), four of which were significant enrichment based on pcomp. psc is the empirical self-contained p-value and pcomp is the competitive p-value for enrichment association. The asterisk (*) indicates a significantly enriched association with AD.
In Model 2, we re-evaluated the association by adjusting for additional covariates, sex, age, and the APOE ε4 allele count. We found a similar result as in Model 1, showing a nominally suggestive association (p < 0.05) in the same 10 pathways in the discovery data. In the replication data, the nine pathways showed the same effect of positive directionality. Further meta-analysis in Model 2 showed that the same seven pathways passed the Bonferroni-corrected psc threshold. Notably, five pathways showed significant enrichment for AD in Model 2 after adjustment, based on a competitive pcomp-value (< 0.05). These pathways differed slightly from those identified in Model 1. Three were overlapping with Model 1 results, response to oxidative stress (pcomp = 0.003), protein modification (pcomp = 0.023), and immune system (pcomp = 0.016), while two were newly identified in Model 2: protein metabolism (pcomp = 0.036) and tyrosine-kinase signaling (pcomp = 0.026). The overall results from Models 1 and 2 in astrocytes were in Supplemental Table 2.
Out of the original 1998 astrocytic-specific genes, 337 unique genes were from all significant pathways under Bonferroni-corrected psc in Models 1 and 2. A Bonferroni-corrected psc-value (0.05/337 = 1.48 × 10⁻⁴) was used to determine the significance of the association for astrocyte-specific genes. As a result, no gene from astrocytes was found significantly associated with AD from either Model 1 or Model 2.
Significant pathways associated with AD in microglia
Of the 19 microglial pathways, 11 pathways displayed a nominally suggestive association of p < 0.05 in our discovery data from Model 1. Among those 11 pathways were 10 pathways that had the same directionality of effect with the replication data. The meta-analysis of the two datasets (discovery and replication data) showed that six out of the ten pathways reached significance after the Bonferroni-corrected psc (0.05/10 = 0.005), all of which were positively correlated to AD (ORs > 1). As seen in Table 3, the six significant pathways were the immune system (OR = 1.125, 95% CI = 1.072–1.181, psc = 1.77 × 10⁻⁶), DNA metabolism (OR = 1.153, 95% CI = 1.098–1.210, psc = 1.06 × 10⁻⁸), transcription (OR = 1.146, 95% CI = 1.092–1.203, psc = 3.29 × 10⁻⁸), adaptive immune response (OR = 1.157, 95% CI = 1.102–1.214, psc = 4.54 × 10⁻⁹), antigen processing (OR = 1.167, 95% CI = 1.111–1.225, psc = 5.02 × 10⁻¹⁰), and cytokines (OR = 1.108, 95% CI = 1.056–1.163, psc = 3.12 × 10⁻⁵). All six pathways had a competitive pcomp < 0.05, indicating they were all considered microglia-specific, enriched pathways significantly associated with AD in Model 1.
Meta-analysis for association between microglia-specific pathways and AD (Bonferroni-corrected psc = 0.005).
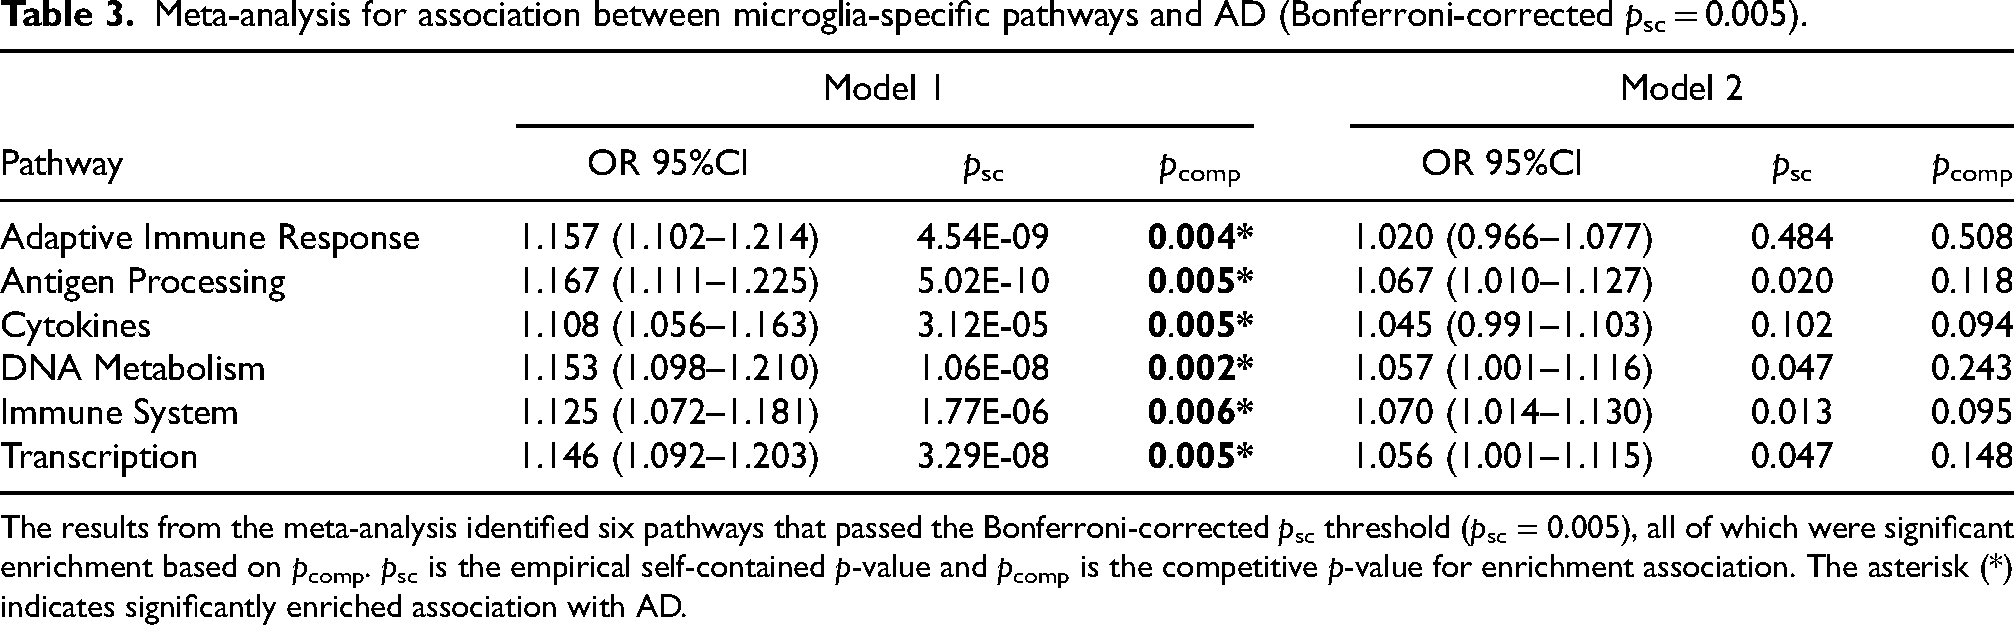
The results from the meta-analysis identified six pathways that passed the Bonferroni-corrected psc threshold (psc = 0.005), all of which were significant enrichment based on pcomp. psc is the empirical self-contained p-value and pcomp is the competitive p-value for enrichment association. The asterisk (*) indicates significantly enriched association with AD.
In Model 2, which included additional covariates, we re-evaluated the association for the 11 pathways that exhibited a nominally suggestive association (p < 0.05) in Model 1 across both discovery and replication datasets. 10 of the 11 pathways showed the same effect of positive directionality. However, none of the pathways passed the Bonferroni-corrected psc-value threshold (0.05/10 = 0.005) in the meta-analysis (See Table 3 and Figure 2). The overall results from Models 1 and 2 in microglia were in Supplemental Table 3.
Out of the original 289 microglial genes, 139 unique genes were included in the six pathways with combined psc under the Bonferroni-corrected threshold (0.05/10 = 0.005) in Model 1. Gene-based PRS analysis identified two microglial genes, BCL3 and RELB, significantly associated with AD in Model 1, but not in Model 2, after the Bonferroni correction (0.05/139 = 1.92 × 10⁻⁴). The results were OR (95% CI) = 1.145 (1.090–1.202), p = 5.26 × 10⁻⁸ for BCL3, and OR (95% CI) = 1.149 (1.049–1.206), p = 2.84 × 10⁻⁸ for RELB (Figure 3).
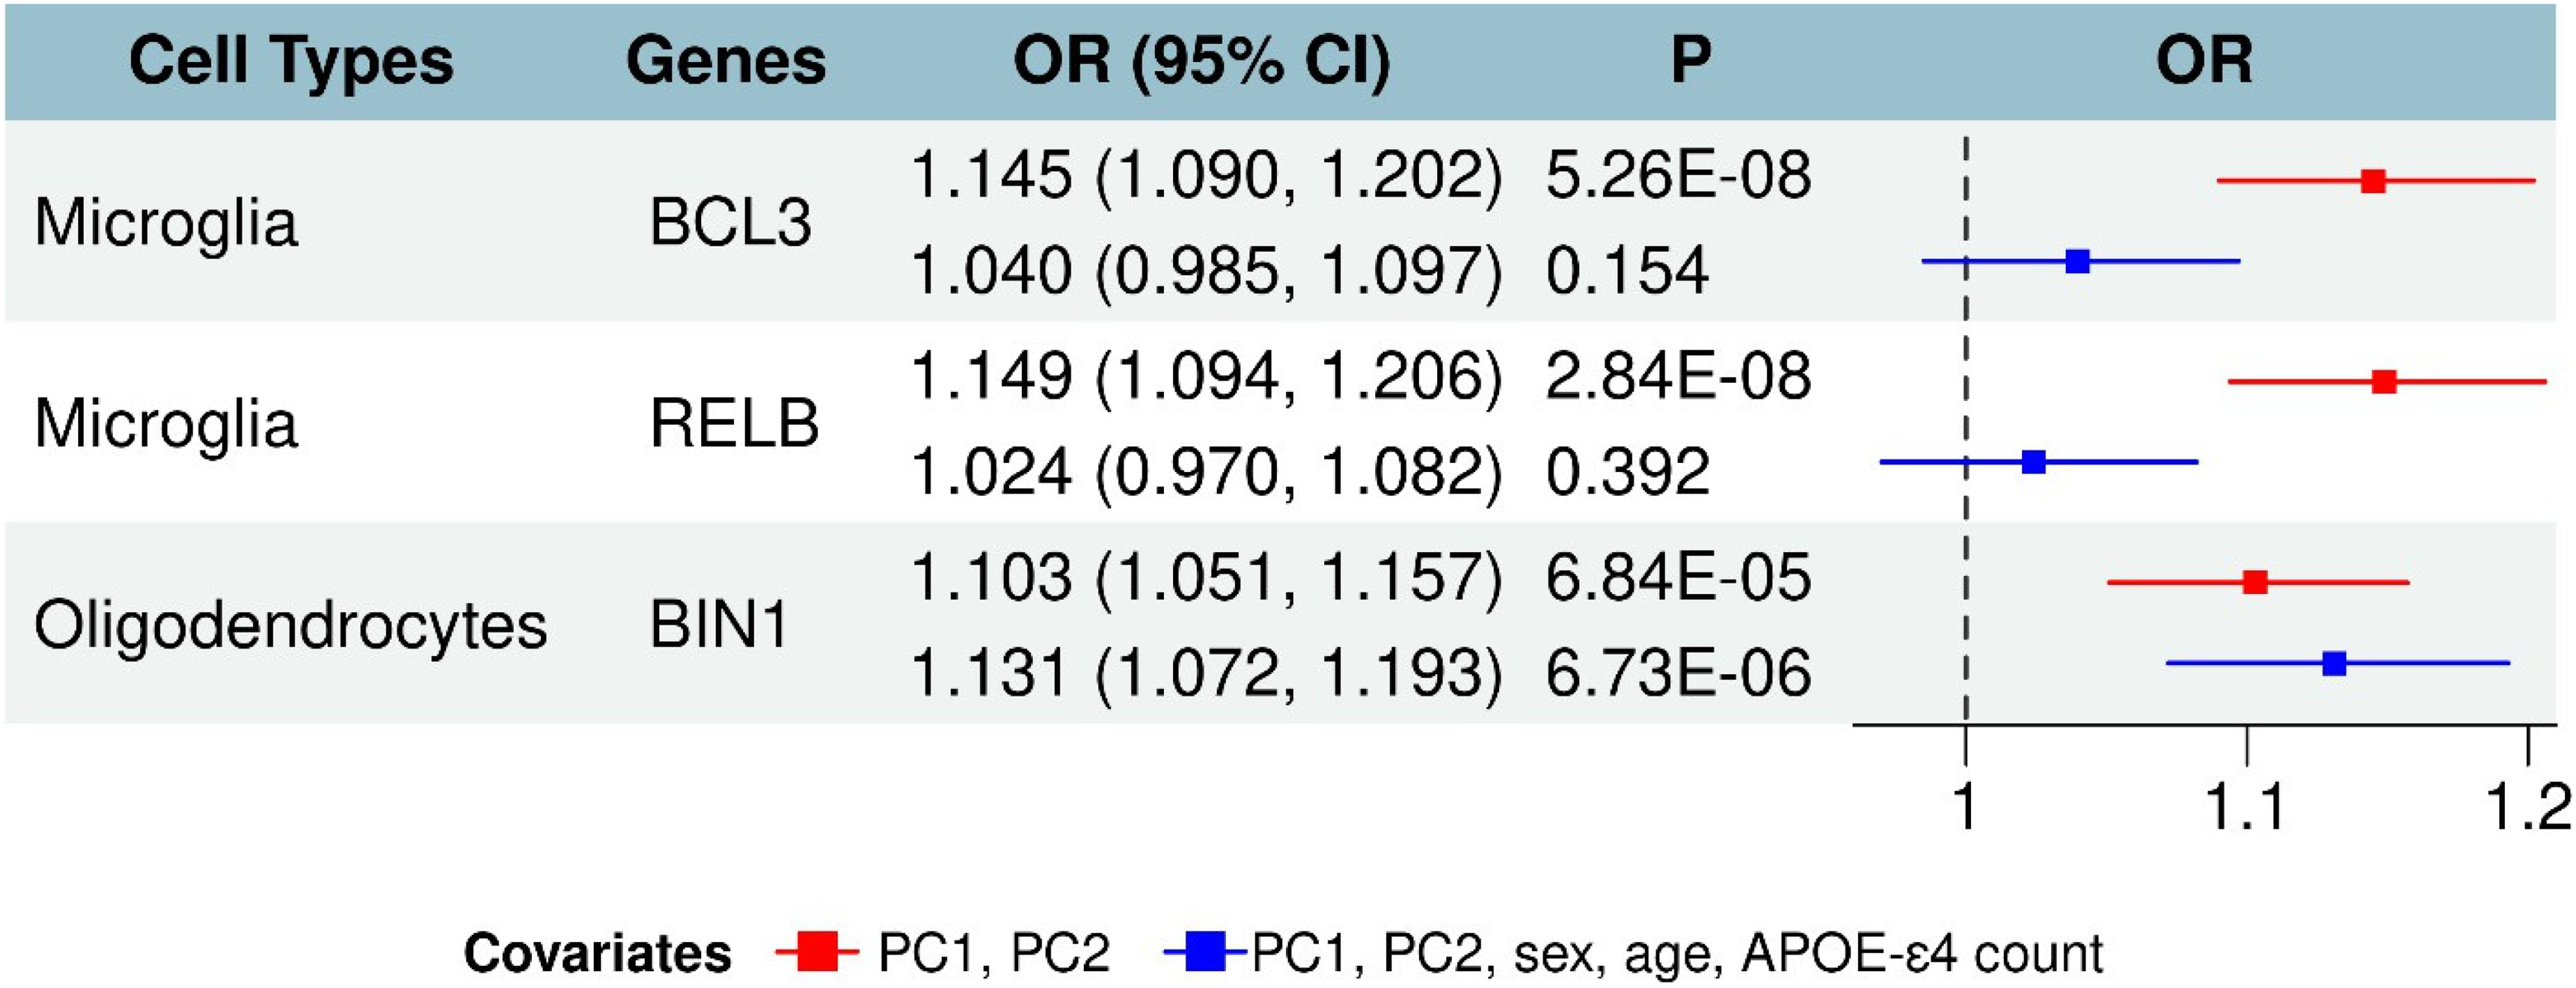
Microglia & oligodendrocyte-specific genes are significantly associated with AD. Three glia-specific genes were significantly associated with AD from a meta-analysis. In Model 1 adjusted with PC1 and PC2, two microglia-specific genes (BCL3 and RELB) and one oligodendrocyte-specific gene (BIN1) were significantly associated with AD. In Model 2 adjusted with PC1, PC2, sex, age, and APOE ε4 count, only one oligodendrocyte-specific gene (BIN1) was significantly associated with AD.
Of note, BCL3 is associated with pathways related to DNA metabolism, the immune system, adaptive immune response, cytokines functional pathways, transport & trafficking. RELB is associated with pathways related to DNA metabolism, immune system, adaptive immune response, and antigen processing functional pathways.
Significant pathways associated with AD in oligodendrocytes
Of the 29 total pathways in oligodendrocytes, we found that 14 pathways reached a nominal association in the discovery dataset from Model 1 with a p < 0.05, and 10 of those pathways had the same effect directionality in the replication data. After meta-analysis, four of the 10 pathways reached significance with a Bonferroni-corrected psc < 0.05/10 = 0.005, all of which were positively correlated to AD (ORs > 1). As seen in Table 4 and Figure 2, the four significant pathways were cell proliferation (OR = 1.071, 95% CI = 1.021–1.124, p = 0.005), protein metabolism (OR = 1.073, 95% CI = 1.022–1.126, p = 0.004), transport and trafficking (OR = 1.115, 95% CI = 1.062–1.170, p = 9.88 × 10⁻⁶), and miscellaneous (OR = 1.073, 95% CI = 1.022–1.127, p = 0.005). Out of the four pathways, only one pathway, transport and trafficking, showed a significant pcomp of 0.029. Thus, transport and trafficking pathway was considered the only oligodendrocyte-specific enriched pathway that was significantly associated with AD.
Meta-analysis for association between oligodendrocyte-specific pathways and AD (Bonferroni-corrected psc = 0.005).
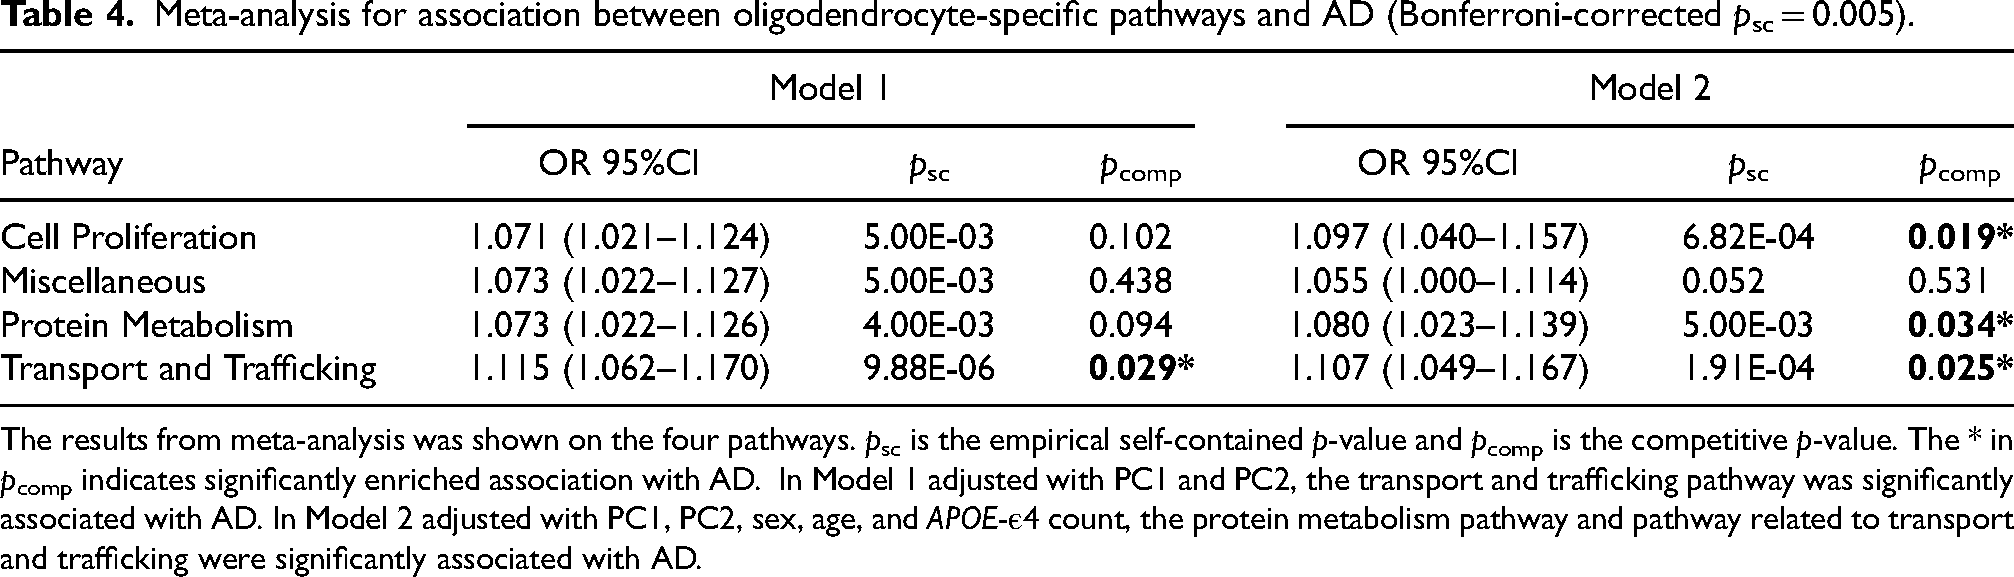
The results from meta-analysis was shown on the four pathways. psc is the empirical self-contained p-value and pcomp is the competitive p-value. The * in pcomp indicates significantly enriched association with AD. In Model 1 adjusted with PC1 and PC2, the transport and trafficking pathway was significantly associated with AD. In Model 2 adjusted with PC1, PC2, sex, age, and APOE-ε4 count, the protein metabolism pathway and pathway related to transport and trafficking were significantly associated with AD.
In Model 2, we used the same 14 out of the 29 oligodendrocyte pathways that were nominally associated with AD (p < 0.05) in Model 1 for both the discovery and replication data. 10 of those pathways showed the same effect of positive directionality in both datasets. As shown in Table 4, the same 4 pathways as in Model 1 were analyzed through meta-analysis. As a result, three of the four pathways reached significance with the pcomp < 0.05. The three pathways were cell proliferation (OR = 1.097, 95% CI = 1.040–1.157, p = 6.82 × 10⁻⁴), protein metabolism (OR = 1.080, 95% CI = 1.023–1.139, p = 0.005), and transport and trafficking (OR = 1.107, 95% CI = 1.049–1.167, p = 1.91 × 10⁻⁴). The overall results from Models 1 and 2 in oligodendrocytes were in Supplemental Table 4.
Out of the original 1650 oligodendrocyte-specific genes, and after the gene duplicates were removed, only 470 genes were associated with the three pathways and had passed the Bonferroni-corrected p-value threshold (0.05/10 = 0.005) in Model 1. We excluded genes in the Miscellaneous pathway, as the role of this pathway in AD remains uncertain. p-values from the meta-analysis with Bonferroni correction (0.05/470 = 1.06 × 10⁻⁴) were used to determine the significance of the association between those gene and AD. Within our results, the gene BIN1 (OR = 1.103, 95% CI = 1.051–1.157, p = 6.84 × 10⁻⁵ in Model 1 and OR = 1.131, 95% CI = 1.072–1.193, p = 6.73 × 10⁻⁶ in Model 2) was found to have a significant association with AD in both models (See Figure 3) and was enriched in pathways related to transport and trafficking and cell proliferation.
Reactome analysis
For Immune System-related pathways, we observed distinct profiles across glial cell types. In microglia, the most enriched and specific pathways included the signaling of Interleukin-4, Interleukin-10, Interleukin-13, Interferon, and Cytokine in the broader Immune System category. Astrocytes showed enrichment in the profiles Detoxification of reactive oxygen species, Immune system, Activation of C3 and C5, Interleukin-18 Signaling, and Nuclear events stimulated by ALK signaling in cancer. Oligodendrocytes were found to be enriched for the Immune system, Interleukin-1 family signaling, Innate immune system, Downstream signal transduction, and signaling by receptor tyrosine kinases.
For Protein Metabolism-related pathways, we once again observed cell-type-specific enrichment. In microglia, the top profiles enriching these pathways included Cytokine signaling in the immune system, Signaling by interleukins, Immune system, Interleukin-4 and Interleukin-13 signaling, and Innate immune system. The overlap with immune-related processes between the glial cells is noted and highlights the need for further decomposition of broad categories. In astrocytes, more protein-specific pathways emerged, such as Metabolism of proteins, Negative regulation of the PI3K/AKT network, Mitochondrial translation elongation, PI5P, PP2A, and IER3 regulation of PI3K/AKT signaling, and Mitochondrial translation. Oligodendrocytes showed enrichment in Metabolism of proteins, Post-translational protein modification, Antigen processing: Ubiquitination and proteasome degradation, Deubiquitination, and Class I MHC-mediated antigen processing and presentation. All the results from reactome analysis were in Supplemental Tables 5 and 6
Discussion
This study presents a comprehensive pathway-based PRS analysis, showing distinct pathways associated with AD across various brain glial cell types. For astrocytes, we found that AD was significantly associated with pathways related to the immune system, response to oxidative stress, protein modification, and cytoskeleton in Model 1, while two more pathways (protein metabolism and tyrosine kinase signaling) were significant in Model 2. For microglia, six pathways, including DNA metabolism, transcription, the immune system, antigen processing, adaptive immune response, and cytokines, were significantly associated with AD in Model 1, but none of them reached significance in Model 2. For oligodendrocytes, one pathway related to transport & trafficking reached significance in Model 1, while two extra pathways (cell proliferation and protein metabolism) reached significance in Model 2. In addition, we identified a total of three glial-specific genes significantly associated with AD: BCL3 and RELB (microglia), and BIN1 (oligodendrocytes).
Our findings are consistent with existing literature, emphasizing astrocytes’ involvement in the immune system, such as response to oxidative stress. Under severe oxidative stress, the cellular response encompasses increasing cell replication time, cell cycle abnormalities, and oxidative damage due to the cell cycle requiring high amounts of oxygen to function properly.39,40 The significant pathways related to cytoskeleton and protein modification in astrocytes might indicate an association between AD and reactive astrocytes, which undergo structural and functional changes with potential protein structural changes in response to inflammation or disease. 21 Astrocytes can convert into two reactive forms: A1 (neurotoxic) and A2 (neuroprotective). 41 The mechanisms behind astrocyte switching forms are unclear. Current literature suggests that astrocyte reactivity is primarily influenced by intracellular signaling pathways, including the nuclear factor kappa-B (NF-κB). 41 The dysregulation of the NF-κB pathway is associated with conditions of autoimmune and neurogenerative diseases, and prolonged periods of activity have led to an increase in inflammatory proteins. Given our results of significant astrocytic pathways, intracellular signaling pathways may lead to the discovery of additional novel neuroinflammatory mediators during AD development.
Our results also reinforce the critical role of microglia, the brain's resident CNS immune cells known for mediating neuroinflammatory processes and responding to amyloid plaques, in immune system-related processes as they exhibited strong associations with the immune system (adaptive immune response, cytokines, and antigen processing) and DNA metabolism (transcription) pathways in Model 1, especially in cytokine signaling and antigen processing. Dysfunction of these pathways may exacerbate AD by impairing protein clearance and sustaining an inflammatory response. 22 Cytokines are signaling molecules responsible for communication between immune cells, especially during inflammation and neuroinflammatory diseases, and are involved in cell proliferation and disease pathogenesis.42,43 During the event of a degenerative disease, characterized by molecules with danger-associated molecular patterns (DAMPs) such as Aβ protein deposition, CNS cells produce pro-inflammatory cytokines, causing an increase in the immune system's sensitization to inflammation.43,44 While the inflammatory response acts as a defense mechanism, as inflammation occurs when damaged cells release cytokines to attract immune effector cells to the site of infection, unregulated and prolonged periods of inflammation can lead to chronic inflammation and inflammation-associated diseases.45,46 Antigen processing is also involved in the body's immune system. As mentioned previously, specific cells are attracted to the site of infection via cytokines, some of which are antigen-presenting cells (APCs). These APCs process antigens obtained from pathogens and present antigen peptides to Major Histocompatibility Complexes (MHC) class II molecules, forming a complex that binds to antigen-specific receptors on T lymphocytes for activation.47–49 Activated T cells differentiate and carry out varying functions for pathogen elimination, such as helper T-cells secreting cytokines to attract other immune cells or cytotoxic T cells phagocytizing infected host cells.50–52 Dysfunction of the antigen processing mechanisms may compromise the immune system, preventing a complete clearing out of pathogens, such as the inability to remove Aβ (a protein that interferes with antigen processing and presentation and T cell activation), and contributes to the overall progression of neurogenerative diseases like AD. 53
Notably, our results showed that four pathways, transcription, adaptive immune response, and cytokine-related pathways, were significantly associated with microglial pathways in Model 1, which included only the top two principal components (PC1 and PC2). However, none of these associations remained significant in Model 2, which additionally adjusted for sex, age, and APOE ε4 status. This suggests that microglial-specific pathways may significantly impact AD in general, but their effects are not independent of these key covariates. It remains unclear why significance was lost when sex, age, and APOE ε4 were included. A likely explanation is that these covariates may interact with, mediate, or exhibit collinearity with microglial pathways, particularly in the context of gene expression and immune activity in microglial cells. These factors may partially or fully explain the observed associations in Model 1. Further studies are warranted to clarify the individual and interactive roles of sex, age, and APOE ε4 in modulating microglial pathways and their contribution to AD risk.
Oligodendrocytes, responsible for myelination and maintaining axonal integrity, showed a significant association with one pathway related to transport and trafficking in Model 1. However, three pathways, including cell proliferation, protein metabolism, and transport and trafficking, reached significance in Model 2. Given that protein metabolism in both astrocytes and oligodendrocytes showed a significant association with AD, there might be interactions between these glial cell types in the context of AD. Further studies focusing on the interplay between these glial cells could gain a more holistic understanding of AD pathology and uncover new avenues to protect CNS integrity and function. The cell proliferation from oligodendrocytes appears to be affected by exposure to numerous free radicals, leading to a state of oxidative stress in the CNS.35,37
Our pathway-based approach provides a better understanding of the genetic architecture of AD compared to traditional GWAS, which often overlooks the functional context of identified risk loci. After filtering the genes, calculating PRSs for 139 microglial genes, 337 astrocytic genes, and 470 oligodendrocyte genes, conducting a meta-analysis, and applying Bonferroni corrections, there were three single genes with a positive and significant association to AD: BCL3, RELB, and BIN1. BCL3 and RELB were found in significant microglial pathways, while BIN1 was found in significant oligodendrocyte pathways.
Previous literature supports the significance of the roles of microglial genes BCL3 and RELB in AD, especially in their involvement in the NF-κB signaling pathway.54,55 This signaling pathway refers to a family of transcription factors responsible for molecular functions, including the mediation of inflammatory responses, the maintenance of cytokine production, and DNA transcription. It can be activated by amyloid-beta accumulation, and when activated, characterizes signaling pathways resulting in either increasing neuroprotection or worsening neurodegeneration as seen in AD-like diseases.56,57 The BCL3 (B-cell lymphoma 3) gene is a transcriptional co-activator that impacts cell replication and is activated when interacting with NF-κB transcription factors. The gene encodes a protein responsible for NF-κB pathway regulation.58–61 BCL3 is capable of upregulating or inhibiting NF-κB target genes, impacting cellular proliferation and immune response. 59 The RELB gene, a member of the NF-κB transcription factor family, is involved in immune-system-related pathways, especially inflammation and neuroinflammation.61,62 Increased RELB expression within immune effector cells is caused by pro-inflammatory stimuli and may result in suppression of microglial involvement in the immune response, posing a major issue when preventing AD disease progression.62,63
Prior literature suggests oligodendrocyte gene BIN1 (Bridging Integrator 1) is mainly involved in neuronal homeostasis regulation and myelin disruption.23,24 BIN1 has many functions in modeling neuronal myelin, suggesting involvement in the myelin degeneration characteristic of AD. Myelin damage is also associated with amyloid plaques and axon degeneration. BIN1 may be a significant contributor to AD due to dysregulation of homeostasis of the neuronal firing process and overall dysfunctions of the neuronal network in oligodendrocytes, which are observed in the early stages of AD and are associated with severe cognitive decline. 24
The identification of distinct genetic pathways in different glial cell types opens new avenues for targeted therapeutic interventions. For instance, modulating the microglial pathways involved in antigen processing activity within the immune system and the astrocytic pathways involved in the immune system and oxidative stress could offer potential strategies for slowing or preventing AD progression. 17 Moreover, understanding the role of oligodendrocytes in AD could lead to novel approaches to protect myelin integrity and support neuronal health.
We acknowledge the limitations in our analyses. First, pathway-based PRS relies heavily on accurate, well-defined pathways and complete databases. However, many complex diseases that involve multiple pathways may not have yet been fully mapped. This incomplete understanding means that scores may overlook crucial variants not associated with known pathways. Secondly, another limitation of our study is the exclusive focus on individuals of European ancestry
Future research should aim to integrate longitudinal data to capture dynamic changes in glial cell function at different stages of AD for a better understanding of the roles of those glial cells in AD. Expanding this approach to include other cell types, such as neurons and endothelial cells, could provide a more comprehensive understanding of the cellular interactions underlying AD. Ethnic populations beyond those of European ancestry should be included to account for potential differences in the underlying mechanisms of AD, particularly in specific glial-cell pathways and genes across populations. Furthermore, exploring the impact of environmental factors could offer additional insights into the underlying mechanisms of the disease. In summary, our pathway-based PRS analysis underscores the critical role of glial cell-type-specific genetic contributions to AD, highlighting the importance of immune system pathways. Moving forward, the top pathways identified through our reactome analysis can be leveraged to refine and enhance pathway specificity within broader biological categories. Prioritizing these more granular reactome submodules, particularly those nested within the overarching Immune System and Protein Metabolism pathways, will allow future studies to streamline gene set analyses and improve biological interpretability. By focusing on these more functionally defined modules, researchers can better isolate key mechanisms underlying AD risk and reduce noise from overly broad pathway groupings.
By uncovering the distinct contributing pathways associated with specific glial cell types, our findings lay the groundwork for developing targeted therapeutic strategies and advancing our understanding of the molecular mechanisms underlying this devastating disease.
Supplemental Material
sj-xlsx-1-alz-10.1177_13872877251362258 - Supplemental material for Distinct glial functions are associated with Alzheimer's disease based on cell-type- and pathway-specific polygenic risk score analysis
Supplemental material, sj-xlsx-1-alz-10.1177_13872877251362258 for Distinct glial functions are associated with Alzheimer's disease based on cell-type- and pathway-specific polygenic risk score analysis by Tyrell Pratt, Alice Lee, Jennifer Zheng, Faria Tavacoli, Hayley Ho, Tingwei Liu, Hui Zhan, Jingchun Chen and in Journal of Alzheimer's Disease
Supplemental Material
sj-xlsx-2-alz-10.1177_13872877251362258 - Supplemental material for Distinct glial functions are associated with Alzheimer's disease based on cell-type- and pathway-specific polygenic risk score analysis
Supplemental material, sj-xlsx-2-alz-10.1177_13872877251362258 for Distinct glial functions are associated with Alzheimer's disease based on cell-type- and pathway-specific polygenic risk score analysis by Tyrell Pratt, Alice Lee, Jennifer Zheng, Faria Tavacoli, Hayley Ho, Tingwei Liu, Hui Zhan, Jingchun Chen and in Journal of Alzheimer's Disease
Footnotes
Acknowledgments
We thank the patients for their participation in the AD GWAS studies, NIA/LOAD ADc1234 Cohort, GenADA studies, and ADNI studies, and the original investigators who conducted these studies and made the data available. For the Alzheimer's Disease Neuroimaging Initiative* data collection and sharing for this project were funded by the Alzheimer's Disease Neuroimaging Initiative (ADNI) (National Institutes of Health Grant U01 AG024904) and DOD ADNI (Department of Defense award number W81XWH-12-2-0012). ADNI is funded by the National Institute on Aging, the National Institute of Biomedical Imaging and Bioengineering, and through generous contributions from the following: AbbVie, Alzheimer's Association; Alzheimer's Drug Discovery Foundation; Araclon Biotech; BioClinica, Inc.; Biogen; Bristol-Myers Squibb Company; CereSpir, Inc.; Cogstate; Eisai Inc.; Elan Pharmaceuticals, Inc.; Eli Lilly and Company; EuroImmun; F. Hoffmann-La Roche Ltd and its affiliated company Genentech, Inc.; Fujirebio; GE Healthcare; IXICO Ltd; Janssen Alzheimer Immunotherapy Research & Development, LLC.; Johnson & Johnson Pharmaceutical Research & Development LLC.; Lumosity; Lundbeck; Merck & Co., Inc.; Meso Scale Diagnostics, LLC.; NeuroRx Research; Neurotrack Technologies; Novartis Pharmaceuticals Corporation; Pfizer Inc.; Piramal Imaging; Servier; Takeda Pharmaceutical Company; and Transition Therapeutics. The Canadian Institutes of Health Research is providing funds to support ADNI clinical sites in Canada. Private sector contributions are facilitated by the Foundation for the National Institutes of Health (![]() ). The grantee organization is the Northern California Institute for Research and Education, and the study is coordinated by the Alzheimer's Therapeutic Research Institute at the University of Southern California. ADNI data are disseminated by the Laboratory for Neuro Imaging at the University of Southern California.
). The grantee organization is the Northern California Institute for Research and Education, and the study is coordinated by the Alzheimer's Therapeutic Research Institute at the University of Southern California. ADNI data are disseminated by the Laboratory for Neuro Imaging at the University of Southern California.
ORCID iDs
Ethical considerations
Only the existing data were included in this study. Contributing studies received ethical approval from their respective institutional review boards (IRB). This study was performed per the Declaration of Helsinki and approved by the IRB at the University of Nevada, Las Vegas.
Consent to participate
Informed consent was obtained from all subjects and/or their legal guardian(s) in the original studies.
Author contributions
Funding
The authors disclosed receipt of the following financial support for the research, authorship, and/or publication of this article: This work was supported by grants awarded to JC by the IDSA Foundation (Sponsor Reference#: 70823173), NIH NIGMS MW CTR-IN Pilot Grant (U54GM104944), and NIH R15 grant (R15AG083618-01A1). ADNI data collection and sharing for this project were funded by the Alzheimer's Disease Neuroimaging Initiative (ADNI; National Institutes of Health Grant U01 AG024904). Other contributors and funding sources can be found on the ADNI website: ![]() .
.
Declaration of conflicting interests
The authors declared no potential conflicts of interest with respect to the research, authorship, and/or publication of this article.
Data availability statement
The data for our base data summary statistics can be found in the European Bioinformatics Institute GWAS Catalog GCST90027158 (https://www.ebi.ac.uk/gwas/studies/GCST90027158). Access to the NIA-LOAD ADc1234 (phs000168.v2.p2) and GenADA (phs000219.v1.p1) studies is provided by dbGaP (![]() ) upon request. The Alzheimer's Disease Neuroimaging Initiative (ADNI) is a multisite initiative for the prevention and treatment of AD. The ADNI genotype data in the present study is available under the ADNI Data-sharing policy.
) upon request. The Alzheimer's Disease Neuroimaging Initiative (ADNI) is a multisite initiative for the prevention and treatment of AD. The ADNI genotype data in the present study is available under the ADNI Data-sharing policy.
Supplemental material
Supplemental material for this article is available online.
References
Supplementary Material
Please find the following supplemental material available below.
For Open Access articles published under a Creative Commons License, all supplemental material carries the same license as the article it is associated with.
For non-Open Access articles published, all supplemental material carries a non-exclusive license, and permission requests for re-use of supplemental material or any part of supplemental material shall be sent directly to the copyright owner as specified in the copyright notice associated with the article.