
Abstract
Background
Mild cognitive impairment (MCI) has been related to impairment in cerebrovascular perfusion and microstructural magnetic resonance imaging (MRI) parameters. However, the relationship between cerebrovascular perfusion and microstructure remains understudied, especially within normal-appearing white matter (NAWM).
Objective
This study aimed to investigate the differential relationship between white matter cerebrovascular perfusion and microstructure between normal cognition (NC) and MCI using multiple MRI measurements within NAWM.
Methods
We examined differences between 24 MCI and 55 NC participants in NAWM for cerebrovascular perfusion and microstructural measures, including cerebrovascular reactivity (CVR), cerebral blood flow, arterial transit time (ATT), and intracellular volume fraction (ICVF), isotropic volume fraction, and orientation dispersion index in models adjusted for vascular risk factors including hypertension, glycemic status, and the presence of APOE ε4 allele.
Results
In the voxel-wise analyses within NAWM, participants with MCI exhibited lower CVR, prolonged ATT, and lower ICVF. Additionally, ATT and ICVF demonstrated a negative interrelationship in voxel clusters affected by MCI.
Conclusions
Impaired ATT and ICVF in NAWM appeared to be closely interlinked in MCI, while CVR served as an independent imaging biomarker. Further investigation into the intrinsic link between ATT and ICVF in NAWM is warranted.
Keywords
Introduction
Associations between cerebrovascular perfusion imaging biomarkers and cognitive status have been demonstrated in previous studies. Impairments in cerebral blood flow (CBF) have shown the potential contribution of CBF alterations to cognitive decline.1,2 Arterial spin labeling (ASL) magnetic resonance imaging (MRI) provides various cerebrovascular perfusion imaging biomarkers, such as CBF and arterial transit time (ATT). ATT represents the time spent for the ASL bolus to travel from the labeling plane to brain locations of interest and hence forms a map of the transit times. Although ATT is not solely a measure of brain perfusion, as it can be affected by the diameter and tortuosity of the feeding vessels, prolonged ATT may represent impaired perfusion at rest.3–6 Specifically, prolonged ATT has been observed in individuals with Alzheimer's disease (AD) or mild cognitive impairment (MCI).7,8
Recent studies suggest that cerebrovascular reactivity (CVR) in response to hypercapnia may be a more sensitive biomarker of perfusion abnormalities than resting CBF.9,10 CVR is an indicator of the compensatory dilatory capacity of CBF in response to a vasoactive stimulus, such as a hypercapnic challenge. We have shown that decreased CVR may imply poor hemodynamics and is associated with cognitive decline. 9 Perfusion abnormalities may be particularly important for white matter (WM) even though it has lower perfusion than gray matter (GM) due to its longer ATT. 11 This is because periventricular WM receives blood primarily from the watershed areas of the brain, making it especially susceptible to impaired perfusion.12,13
Few studies have investigated WM perfusion in relation to cognitive status or cognitive performance. However, most studies have focused on white matter hyperintensities (WMHs) because WMH lesions have very low perfusion.10,14 Although some studies have examined the perfusion of normal-appearing white matter (NAWM) in relation to cognitive impairment and its comparison with WMH,15,16 direct investigations of NAWM perfusion specifically in MCI and cognitively normal (NC) individuals remain limited. However, understanding impairments in NAWM is important, as they may indicate vascular or microstructural contributions to AD in cognitively impaired individuals and could also serve as precursors of WMH.
Neurite orientation dispersion and density imaging (NODDI) was introduced to estimate the microstructural complexity of axons and dendrites using multi-shell diffusion acquisition. 17 Intracellular volume fraction (ICVF) in NODDI represents axonal density in WM, also known as neurite density index. Isotropic volume fraction (ISOVF) reflects the proportion of free water, such as cerebrospinal fluid or edema, while the orientation dispersion index (ODI) quantifies the variability in neurite orientation, capturing the complexity of fiber organization. Lower ICVF, higher ISOVF, and ODI changes have been observed in MCI in previous studies.18,19
We hypothesized that a significant correlation exists between impaired cerebrovascular perfusion and the deterioration of NAWM microstructure in cases of MCI. This presumption is underpinned by the higher vulnerability of oligodendrocytes, responsible for the formation of myelin sheaths, to impaired perfusion in comparison to neurons and astrocytes.20,21 Consequently, in this study, it is hypothesized that impaired cerebrovascular perfusion in WM is related to NAWM structural damage. Furthermore, existing animal studies suggest that cerebral hypo-perfusion induces the loss of oligodendrocytes and WM damage.22,23 To investigate this, we conducted voxel-wise analyses using multiple MRI measurements. The cerebrovascular perfusion parameters included CBF, ATT, ASL-based CVR (
Methods
This study involves human subjects. The study protocol was approved by the Wake Forest University Health Sciences Institutional Review Board Office. All participants provided their written informed consent to participate in this study.
Study participants
The Wake Forest Alzheimer's Disease Research Center focuses on the contribution of metabolic and vascular factors to AD expression. The study targets middle-aged and older adults (aged 55 and older) who are at a higher risk of AD. Participants for the clinical Core were recruited from a variety of sources, including the Kulynych Memory Assessment Clinic, local neurology, geriatric psychiatry, and primary care practices, as well as through collaborations with community leaders, advertisements, and community presentations. Among these Clinical Core participants, 79 individuals enrolled in additional MRI sequences including T1-weighted, T2-fluid attenuated inversion recovery (FLAIR), dynamic single-post labeling delay (PLD) pseudo-continuous ASL (PCASL), multi-PLD PCASL, and NODDI. The exclusion criteria for the Clinical Core have been described previously. 24 Additionally, patients with severe neurodegenerative diseases such as stroke, Parkinson's disease, AD, multiple sclerosis, or those with a recent severe head injury involving loss of consciousness for more than 30 min within the past year, or with permanent neurologic sequelae, were excluded from this study.
Cognitive status
Cognitive status was adjudicated at baseline on all available participants; 24 MCI participants were diagnosed according to National Institute of Aging/Alzheimer's Association criteria. 25 Adjudication was determined by consensus from an expert panel comprised of investigators with extensive experience in assessing cognitive status. The panel included neuropsychologists, neurologists, and geriatricians.
Hypertension and impaired glycemic status
Brachial blood pressure was measured to define hypertensive status for each participant using a DINAMAP automated blood pressure device (GE Healthcare, Chicago, IL) in a seated position in a quiet and dark room after a 5-min rest. 45 hypertensive participants were defined as systolic blood pressure (SBP)
Apolipoprotein E (APOE) ε4
Apolipoprotein E (APOE) genotype was determined by TaqMan (Thermo Fisher Scientific, Waltham, MA) using single nucleotide polymorphisms.24,26 APOE ε4 participants were classified by the presence of one or more APOE ε4 alleles. Notably, no participants in this study cohort carried both APOE ε2 and APOE ε4 alleles.
MRI acquisition
Participants underwent MRI scans, including T1-weighted, T2-FLAIR, single-PLD PCASL, multi-PLD PCASL, and NODDI. Experiments were performed on a 3T Siemens Skyra MRI scanner with a 32-channel head coil (Siemens Healthineers, Erlangen, Germany). T1-weighted structural images with full brain coverage were acquired using a three-dimensional volumetric magnetization prepared rapid gradient echo sequence with resolution of 1 × 1 × 1 mm (TR = 2300 ms; TE = 2.98 ms; TI = 900 ms; flip angle = 9
Dynamic single-PLD PCASL images were obtained during resting and computer-controlled
Multi-PLD PCASL images were acquired with a total of eight PLDs with varying bolus. The first three PLDs were 100 ms with different PCASL labeling durations (500, 1100, and 1700 ms, respectively). The other 5 PLDs ranged from 600 to 3000 ms in increments of 600 ms, with PCASL labeling duration of 1800 ms. Each TI had minimum TR (1700, 2300, 2900, 3500, 4100, 4700, 5300, and 5900 ms for the 8 TIs, respectively). In PCASL, TI is the summation of labeling duration and PLD. A 2D single-shot EPI acquisition without background suppression was used to cover the whole brain (matrix size = 56 × 70 × 36, resolution = 3 × 3 × 4 mm). Flow crusher gradients on all three orthogonal axes were applied immediately after an excitation RF pulse to remove flowing signals faster than 10 cm/s. Multi-PLD PCASL provided ATT and CBF.
Diffusion MRI was acquired with the following parameters: 2 mm isotropic voxel; TR = 3500 ms; TE = 106 ms; FA = 90; 9 b0 images; 30 diffusion-weighing directions at b-value = 711 s/mm2 and 60 directions at b-value = 2855 s/mm2.
Hypercapnic challenge
Inducing a hypercapnic challenge is one of the most robust methods for obtaining CVR. CVR is usually calculated as the percent difference between baseline CBF and hypercapnic CBF. The dynamic single-PLD PCASL acquisition time was 5 min comprising 2 min of the baseline scan, 2 min of the hypercapnic period, and 1 min of recovery back to baseline. The hypercapnic challenge was induced by breathing in
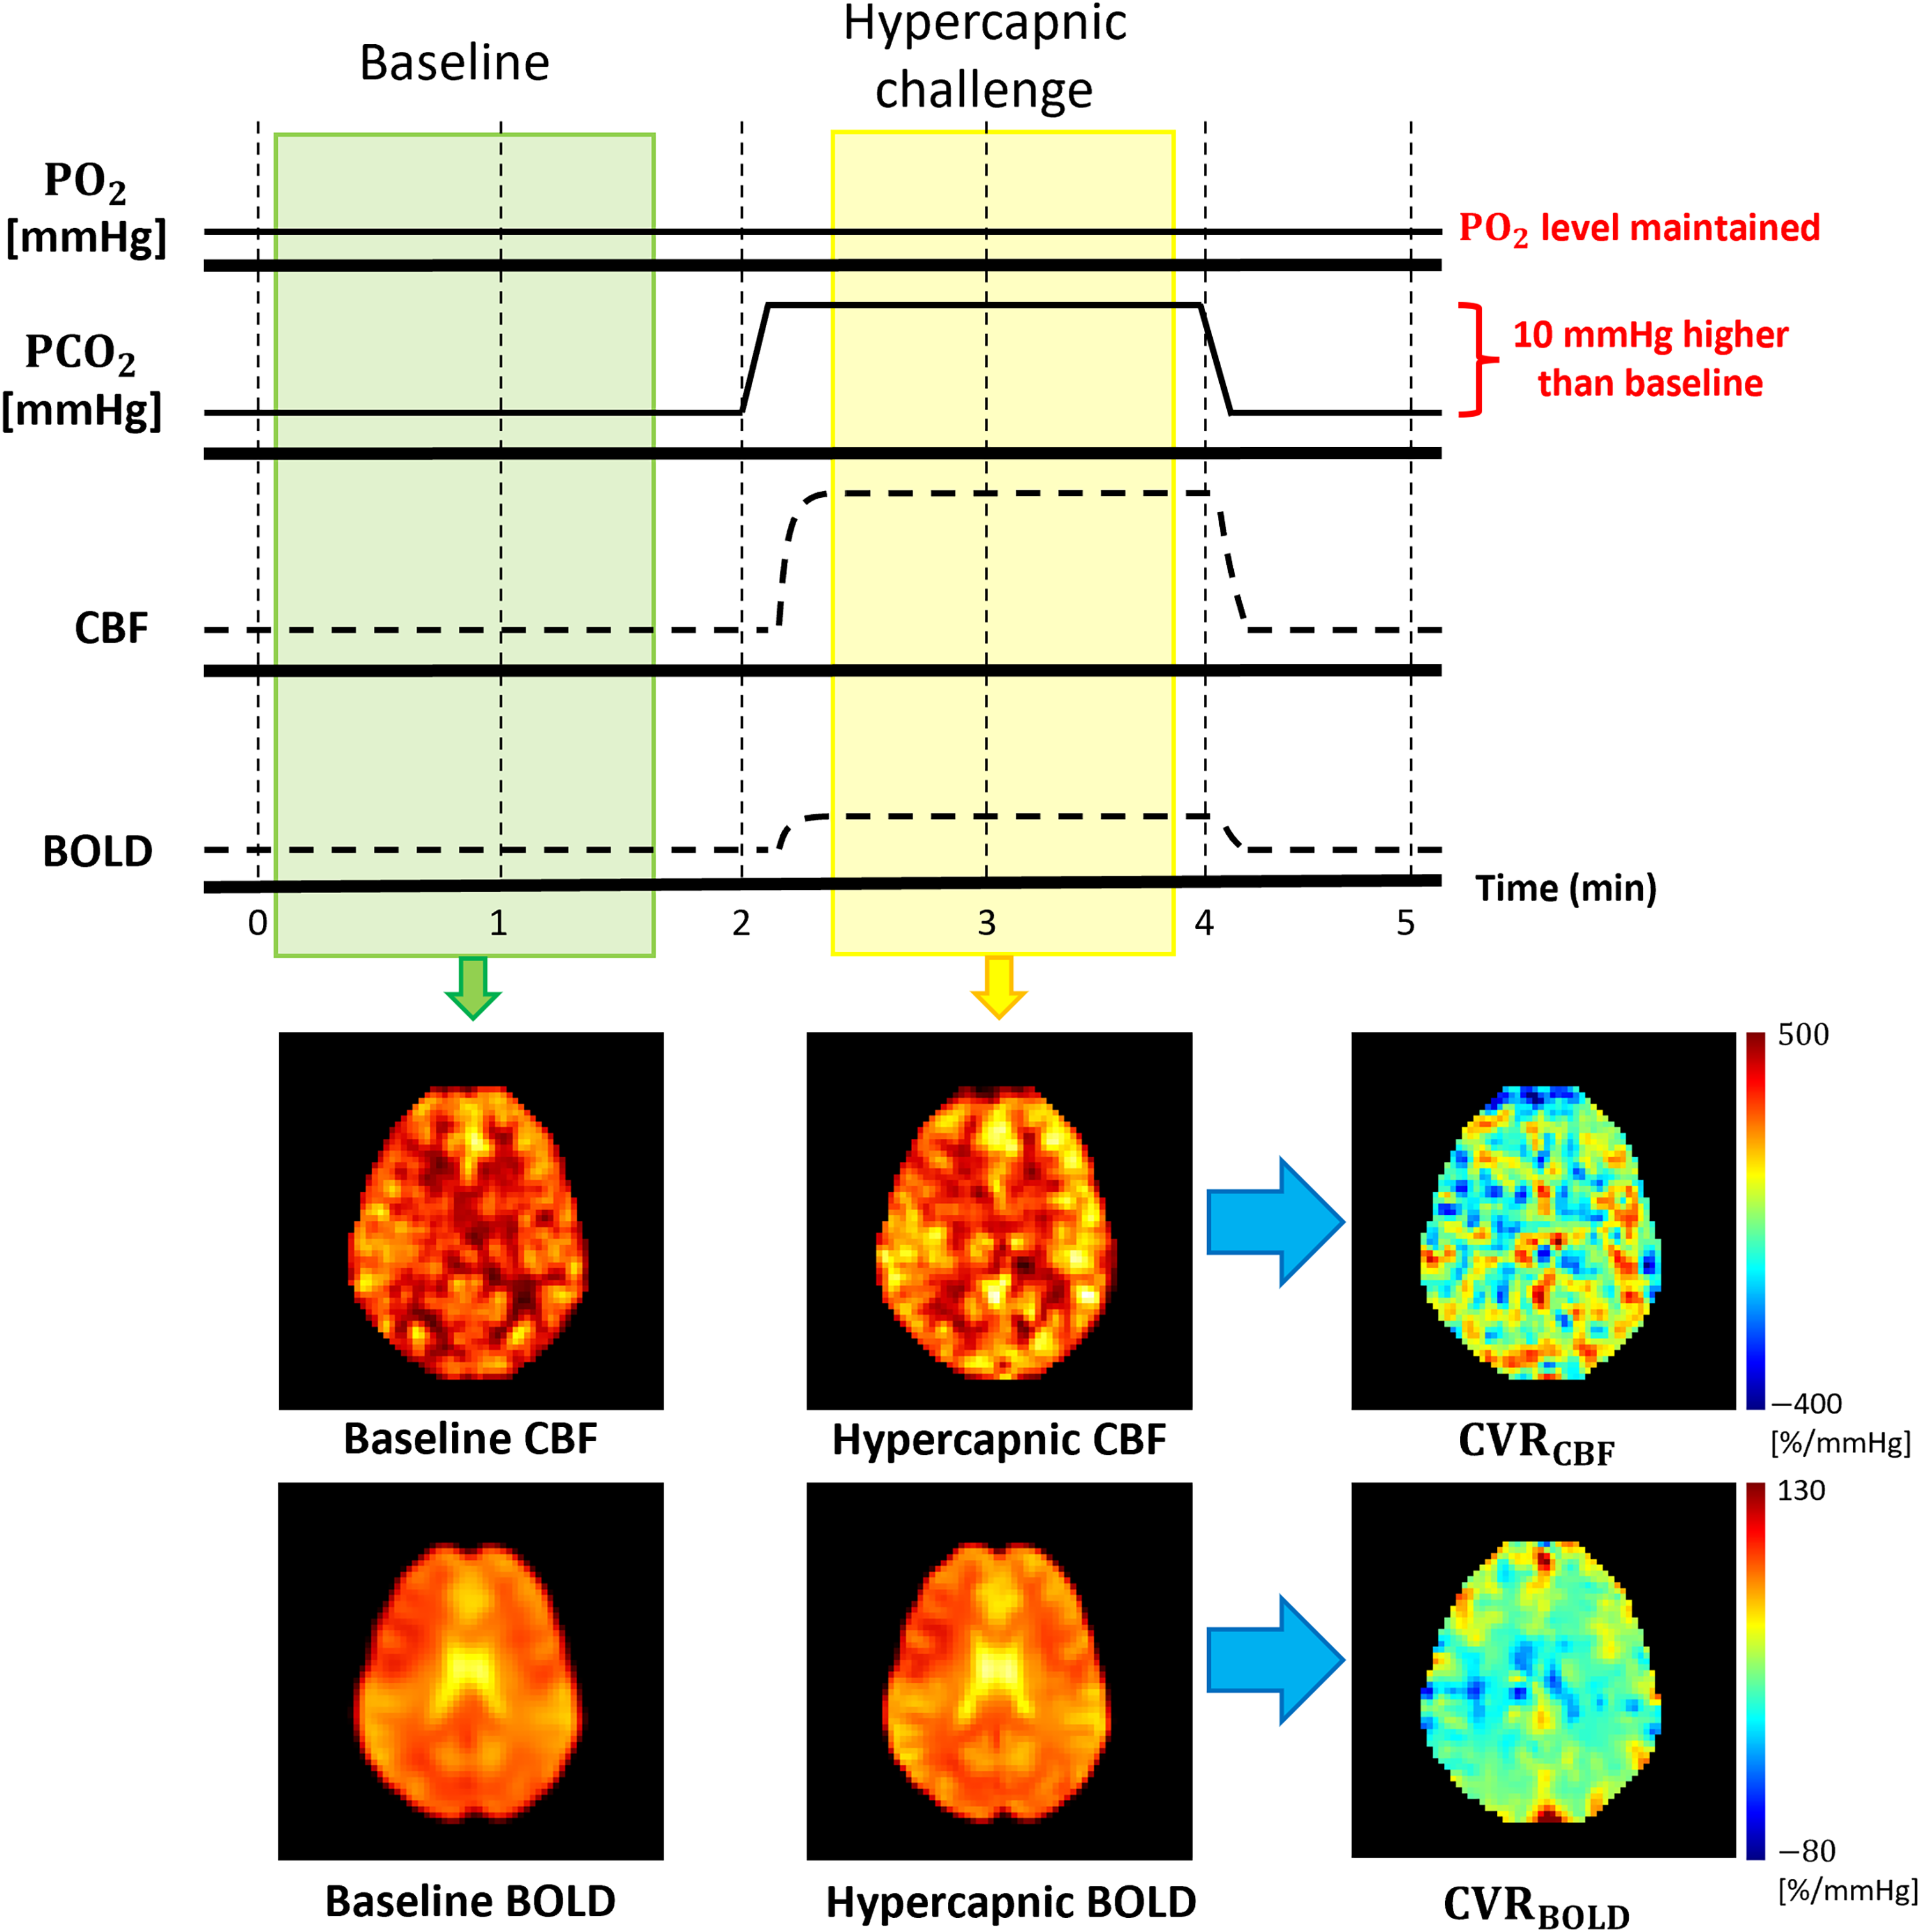
Cerebrovascular reactivity measurements using a hypercapnic paradigm. Dynamic PCASL scan allowed simultaneous
Image processing: T1-weighted image
The processing of the structural T1-weighted image comprised file conversion into the Neuroimaging Informatics Technology Initiative (NIFTI) format, normalization to the Montreal Neurological Institute (MNI) template, and tissue segmentation. Image normalization and segmentation were performed using the SPM12 and CAT12 tools. 27 The normalization and segmentation processes also provided tissue probability maps (TPMs) for each participant based on TPM templates of SPM12. 27 The segmentation process included skull stripping and tissue segmentations for WM. Whole brain GM and WM masks were created for each participant based on the respective TPMs, where GM or WM probabilities were greater than 0.5.
Image processing: single-PLD PCASL, multi-PLD PCASL, ICVF, ISOVF, and ODI
The image processing of the single-PLD PCASL and multi-PLD PCASL images consisted of converting to NIFTI, head motion correction, subtraction between tag and control images, tissue segmentation, partial volume correction (PVC), and normalization. For multi-PLD PCASL, susceptibility distortion was also corrected after NIFTI conversion. Two M0 images were acquired using opposing phase-encoding directions such as left to right and right to left, which were used to determine the susceptibility-induced off-resonance field distortion using the FMRIB Software Library (FSL) topup. 28 The spm_realign function from SPM12 was used for head motion correction for both single- and multi-PLD PCASL images. 27 The subtraction between tag and control images for both single-PLD PCASL and multi-PLD PCASL provided 4D perfusion-weighted images (PWIs) for each participant. The 4D PWI from the single-PLD PCASL comprised a series of 3D PWIs, while the 4D PWI from the multi-PLD PCASL consisted of a set of 3D PWIs with varying PLDs.
The 3D PWIs of the single-PLD PCASL were evaluated using an ASL kinetic model and then converted into absolute CBF units (ml/100 g/min) for each participant. The cerebrospinal fluid (CSF) signal (
Diffusion MRI images collected with reversed phase-encode blips were corrected for susceptibility-induced off-resonance field distortion using FSL topup, 28 and for distortion induced by eddy currents and head motion using FSL eddy. 33 The corrected images were then smoothed with a 3D 2-mm Gaussian kernel. ICVF, ISOVF, and ODI images were estimated using accelerated microstructure imaging via convex optimization from corrected and smoothed NODDI data. 34
The normalization process for all images involved aligning with T1-weighted images and then standardizing to the reference image: the MNI template, with resolution of 1.5
CVR calculations
Both

WMH segmentation and WMH fractions
The T2-FLAIR images were co-registered to the T1-weighted images using SPM12. 27 In this study, WMH segmentation was achieved using a U-Net enhanced with multi-scale highlighting of foregrounds (HF), a method developed in 2021. 35 This U-Net with multi-scale HF method provided a WMH mask of each participant in their native space. Since the created WMH masks were probability maps, they were thresholded at a value of 0.5. Each participant's WMH mask was then normalized to the MNI template. It is important to note that each participant's NAWM mask was created by excluding the WMH region from their WM mask. Additionally, a WMH fraction for each participant was calculated based on the ratio between the skull-stripped whole brain volume and their respective WMH volumes.
Experiments and statistical analyses
Participant demographics were compared between MCI and NC using chi-square tests and t-tests. All analyses on image data were performed on 1.5 mm isotropic MNI space including statistical tests and calculations for minimum voxel clusters. For each perfusion and microstructural imaging metric, separate statistical analyses were performed: a global analysis in the whole-brain NAWM and a voxel-wise NAWM analysis. Each participant's NAWM mask was applied to each image modality to exclude WMH regions from the analyses. For the global NAWM analyses, a mean value of each image metric was calculated for each participant. Separate multiple linear regression analyses were conducted to investigate the relationship between each imaging parameter (CBF, ATT,
To explore the inter-relationship between cerebrovascular perfusion and microstructural parameters, we conducted voxel-wise linear regression analyses between perfusion and microstructural parameters separately in MCI and NC groups. These analyses were also adjusted for covariates, including age, sex, years of education, hypertension status, impaired glycemic status, and presence of APOE ε4 allele. Notably, we analyzed only imaging parameters that showed a statistically significant difference between MCI and NC when analyzed individually.
Additional multiple linear regression analyses were performed to determine whether WMH fraction varied by cognitive status, adjusted for the same covariates and vascular risk factors including hypertension status, impaired glycemic status, and the presence of APOE ε4 allele. In these analyses, the log-transformed WMH fractions were used as the outcome variables while cognitive status, age, sex, years of education, and vascular risk factors were the predictors.
The statistical analyses were conducted in MATLAB R2023a with an alpha = 0.05 for all analyses. The minimum cluster sizes of the voxel-wise analyses for each image modality were corrected for multiple comparisons. A Gaussian-shaped autocorrelation function with full width at half maximum was used with family-wise error (FWE)-corrected cluster threshold of p < 0.05. Specifically, 3dFWHMx and 3dClustSim from analysis of functional neuroimages (AFNI) (α=0.05, p < 0.05, nearest neighbor = 3, bi-sided) were used to avoid inflated false positives. 36
Results
Demographics and cognitive status
The characteristics of the study population are summarized in Table 1. We observed differences between MCI and NC in age, and years of education. Although the cognitive score was not used in this study, a difference in the Mini-Mental State Examination score between MCI and NC was also observed (Table 1). Additionally, Supplemental Table 1 provides participant demographics with partially available positron emission tomography (PET)-determined amyloid-
Characteristics of study population.
p-values were obtained from Chi-square test and t-test for categorical variables and quantitative variables, respectively, for statistical test between MCI and NC.
MCI: Mild cognitive impairment; MMSE: Mini-Mental State Examination.
Cerebral blood flow
In the global NAWM analysis, a non-significant trend of lower CBF (
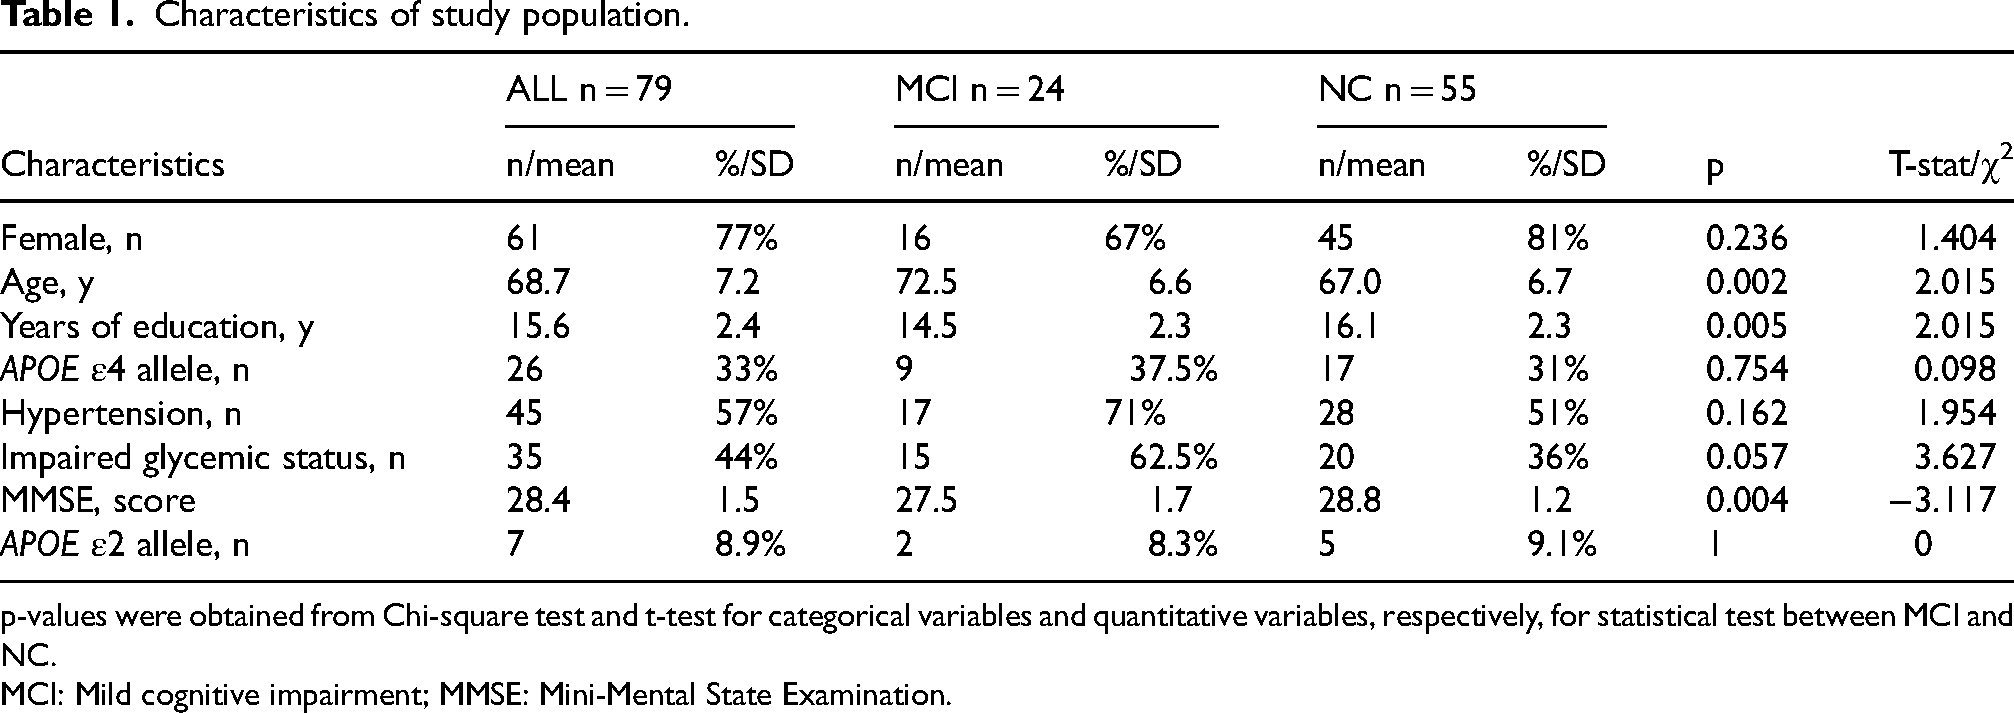
Arterial transit time
Participants with MCI exhibited a non-significant trend toward prolonged ATT at the global NAWM level (
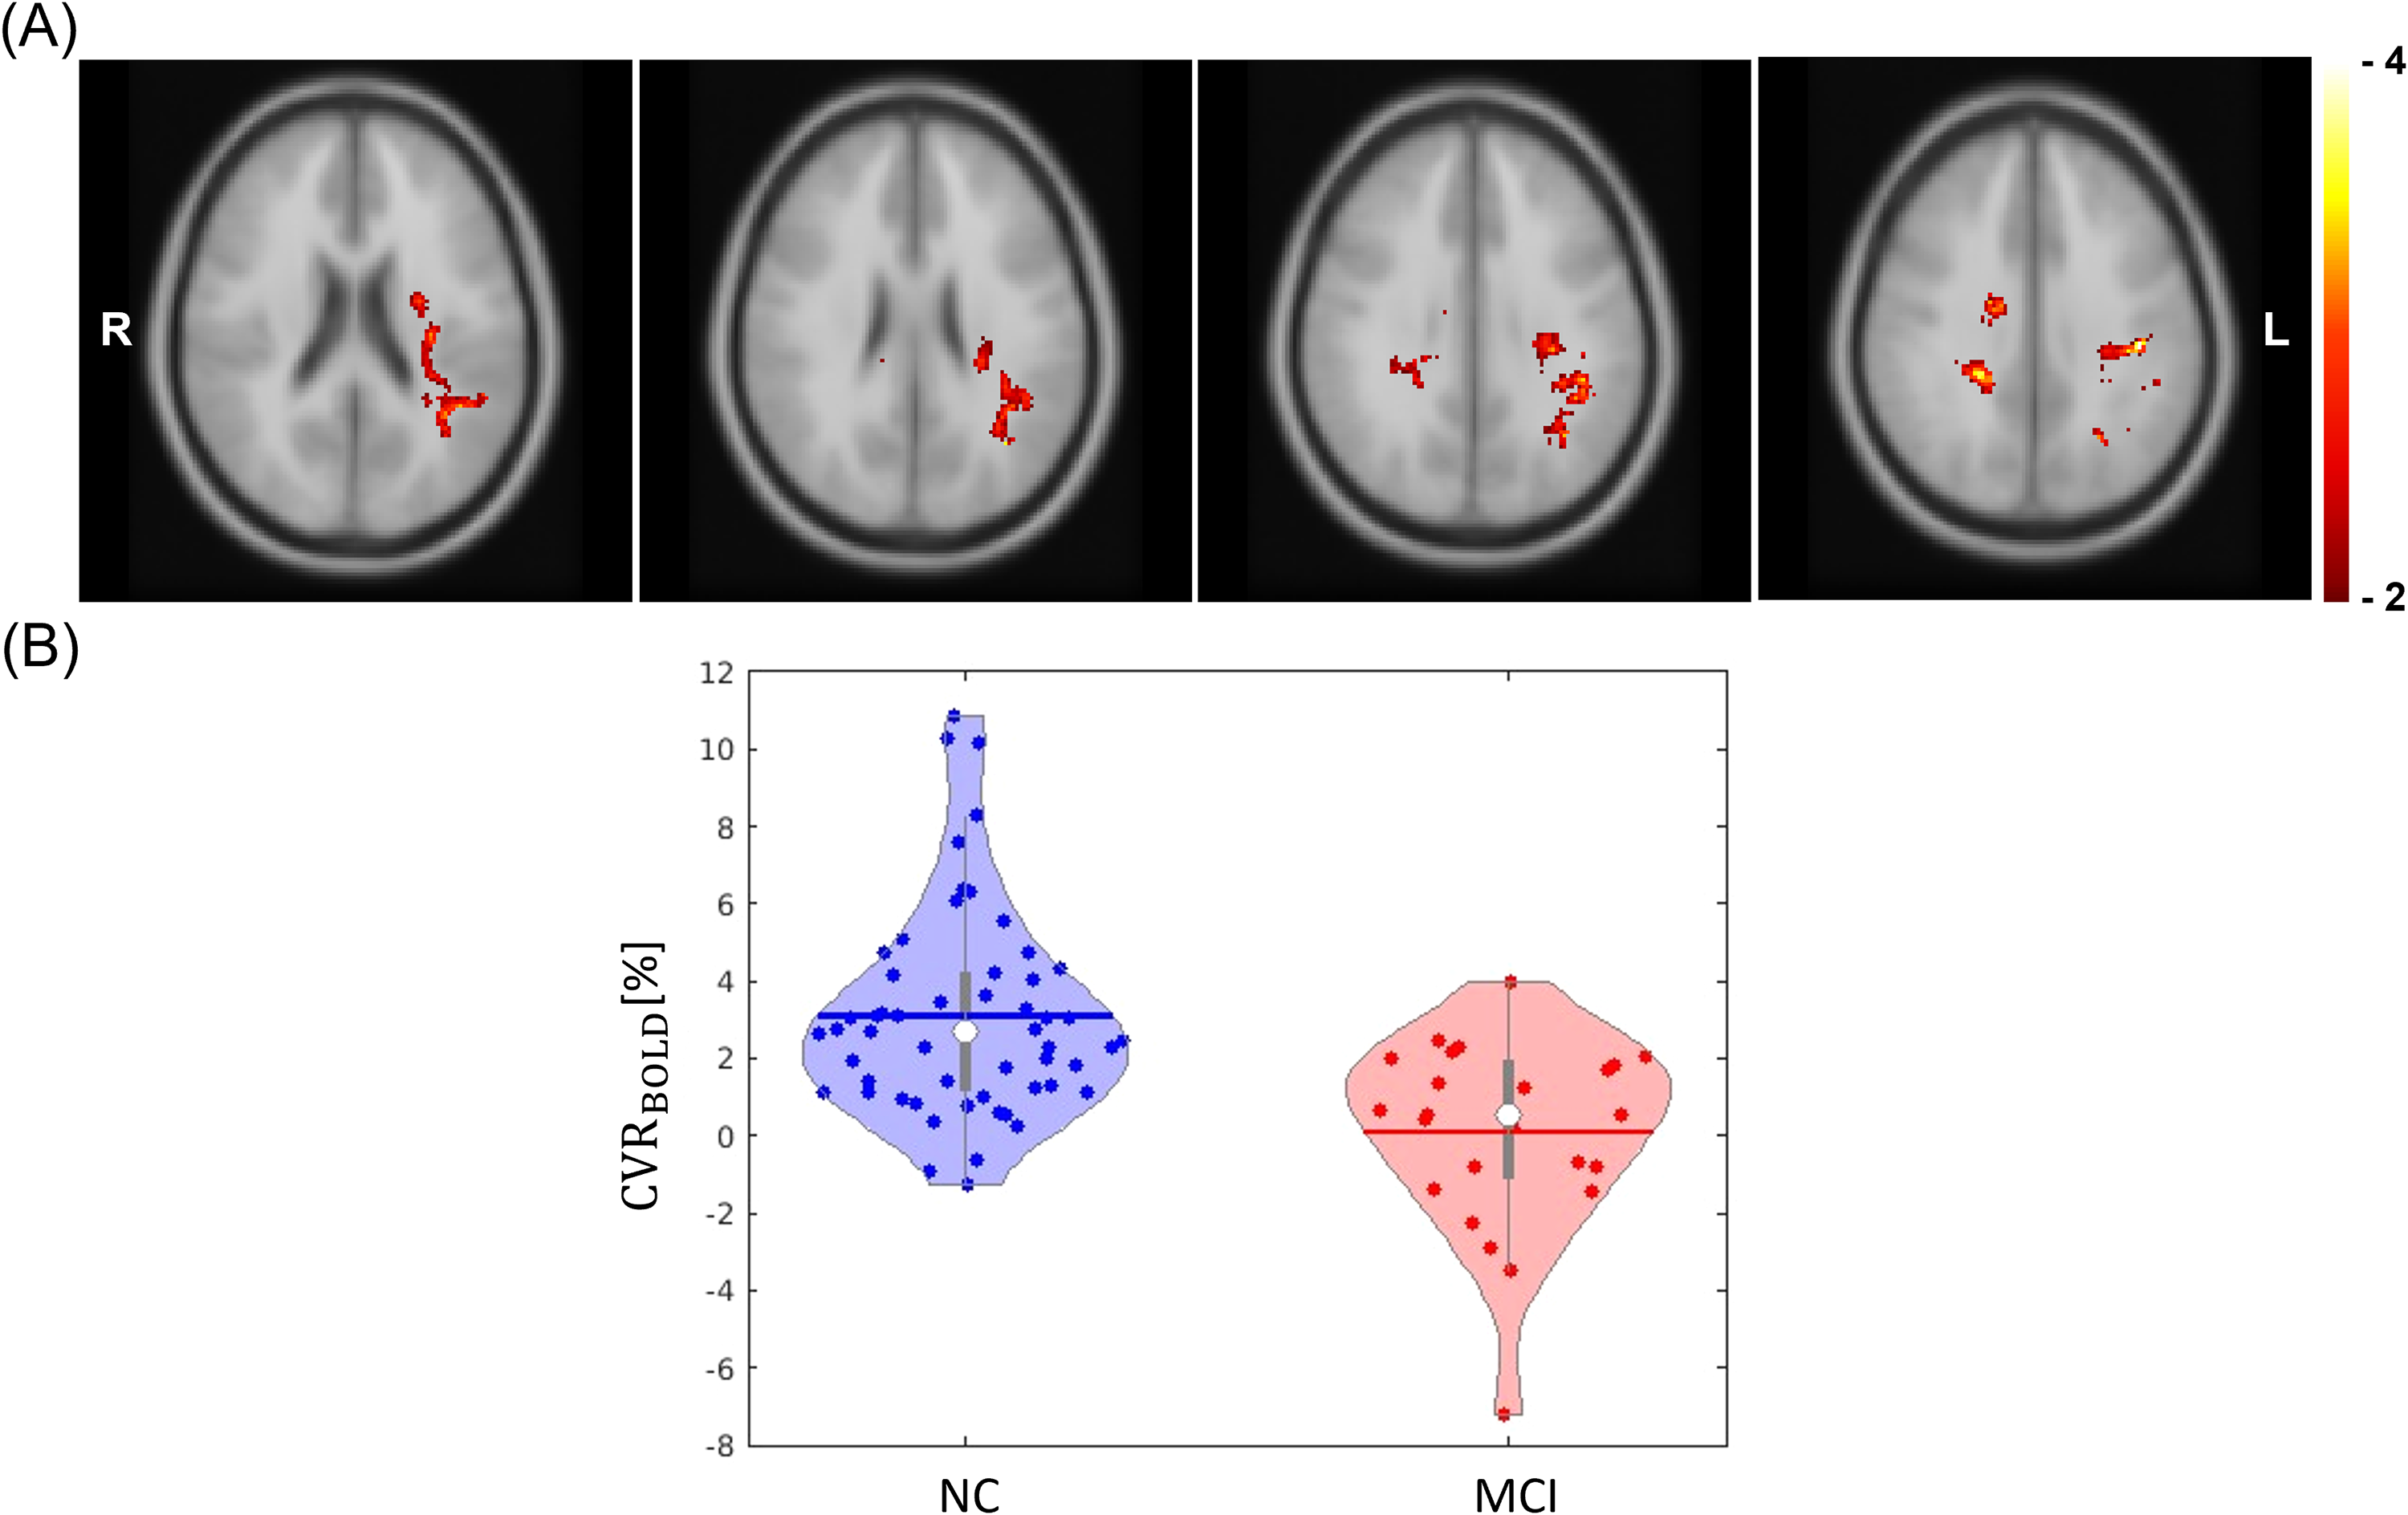
(A) The voxel clusters that showed statistically significant difference in ATT between NC and MCI participants, adjusted for covariates: age, sex, years of education, hypertension status, impaired glycemic status, and APOE ε4 allele (MNI Z coordinate 53, 56, 59, and 62 are shown from left to right). The color bar indicates the covariates-adjusted t-statistics. The minimum cluster size of ATT analysis was 1790 voxels. (B) The violin plots illustrate the covariate-adjusted ATT of each cognition group within the voxel clusters. The horizontal lines and white dots represent the mean and median values, respectively. ATT: arterial transit time; MCI: Mild cognitive impairment; MNI: Montreal Neurological Institute.
Cerebrovascular reactivity
In the global NAWM level analyses, neither
(A) The voxel clusters that showed statistically significant difference in
Microstructural parameters
In the global NAWM, participants with MCI showed a non-significant trend toward lower ICVF values (
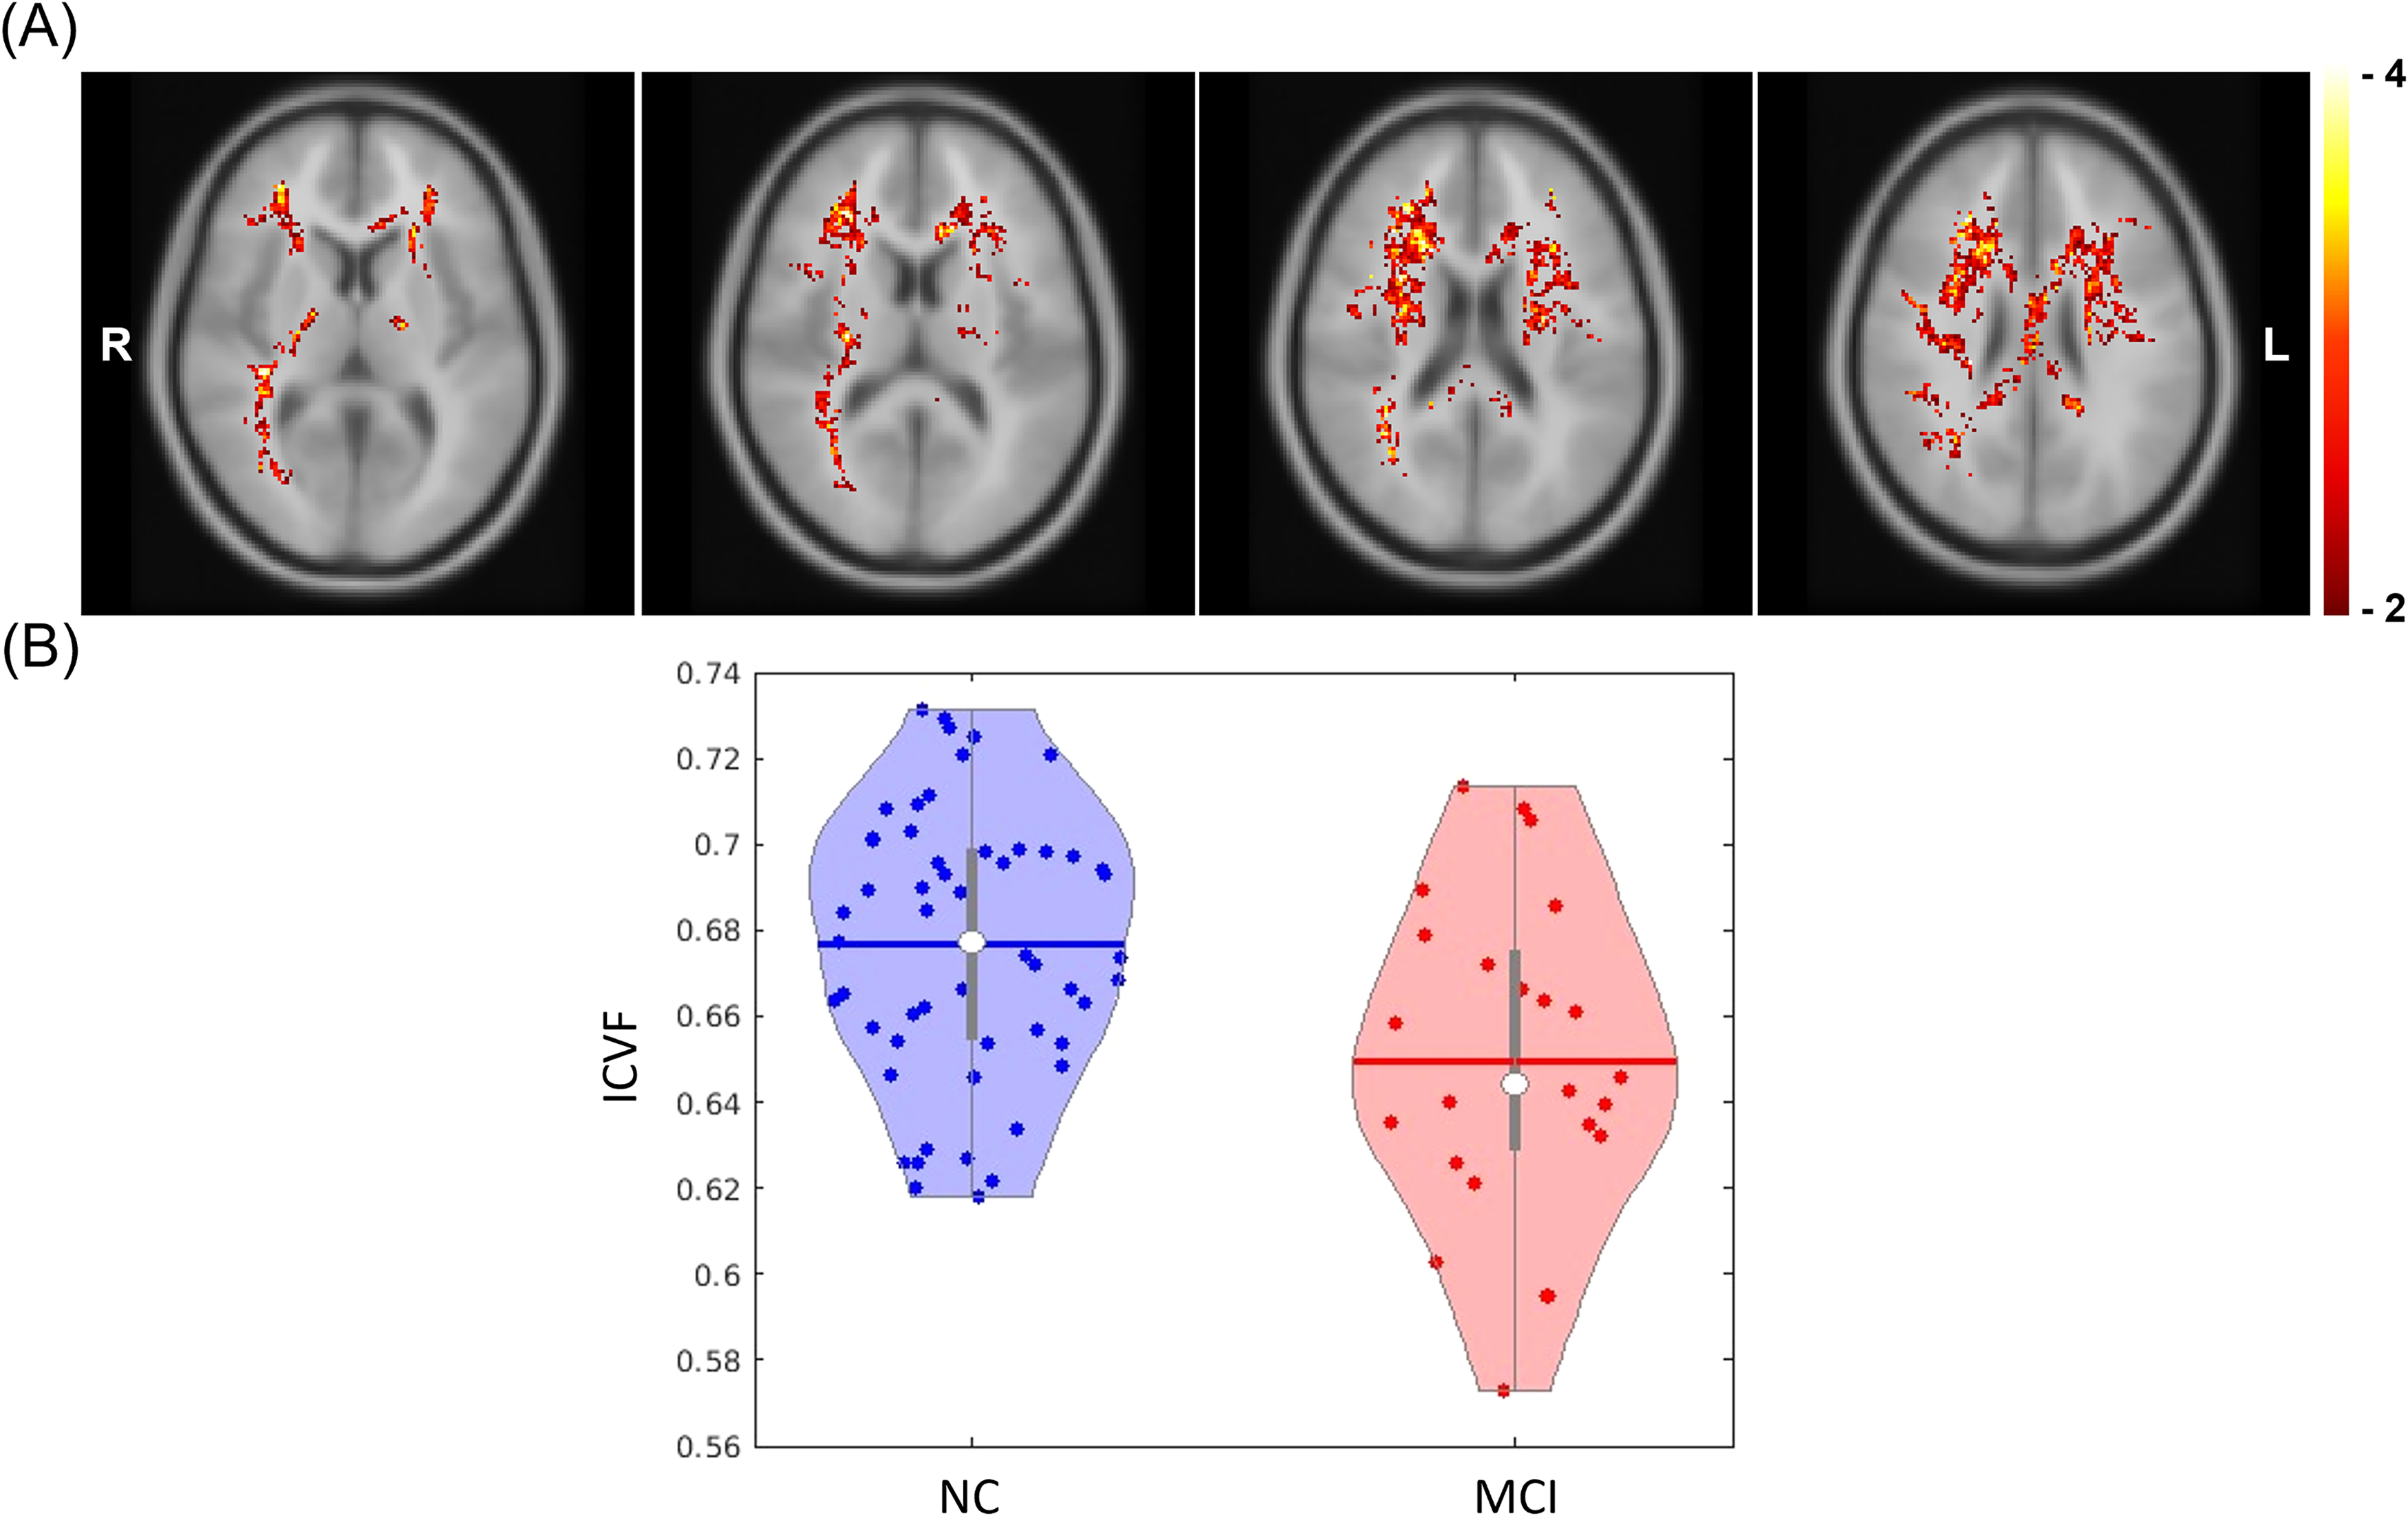
(A) The voxel clusters that showed statistically significant difference in ICVF between NC and MCI participants, adjusted for covariates: age, sex, years of education, hypertension status, impaired glycemic status, and APOE ε4 allele (MNI Z coordinate 54, 58, 62, and 66 are shown from left to right). The color bar indicates the covariates-adjusted t-statistics. The minimum cluster size ICVF analysis was 1983 voxels. (B) The violin plots illustrate the covariate-adjusted ICVF for each cognition group within the voxel clusters. The horizontal lines and white dots represent the mean and median values, respectively. ICVF: intracellular volume fraction; MCI: Mild cognitive impairment; MNI: Montreal Neurological Institute.
Associations between cerebrovascular perfusion parameters and ICVF
Voxel-wise analyses of NAWM identified significant associations between MCI and three parameters: ATT,
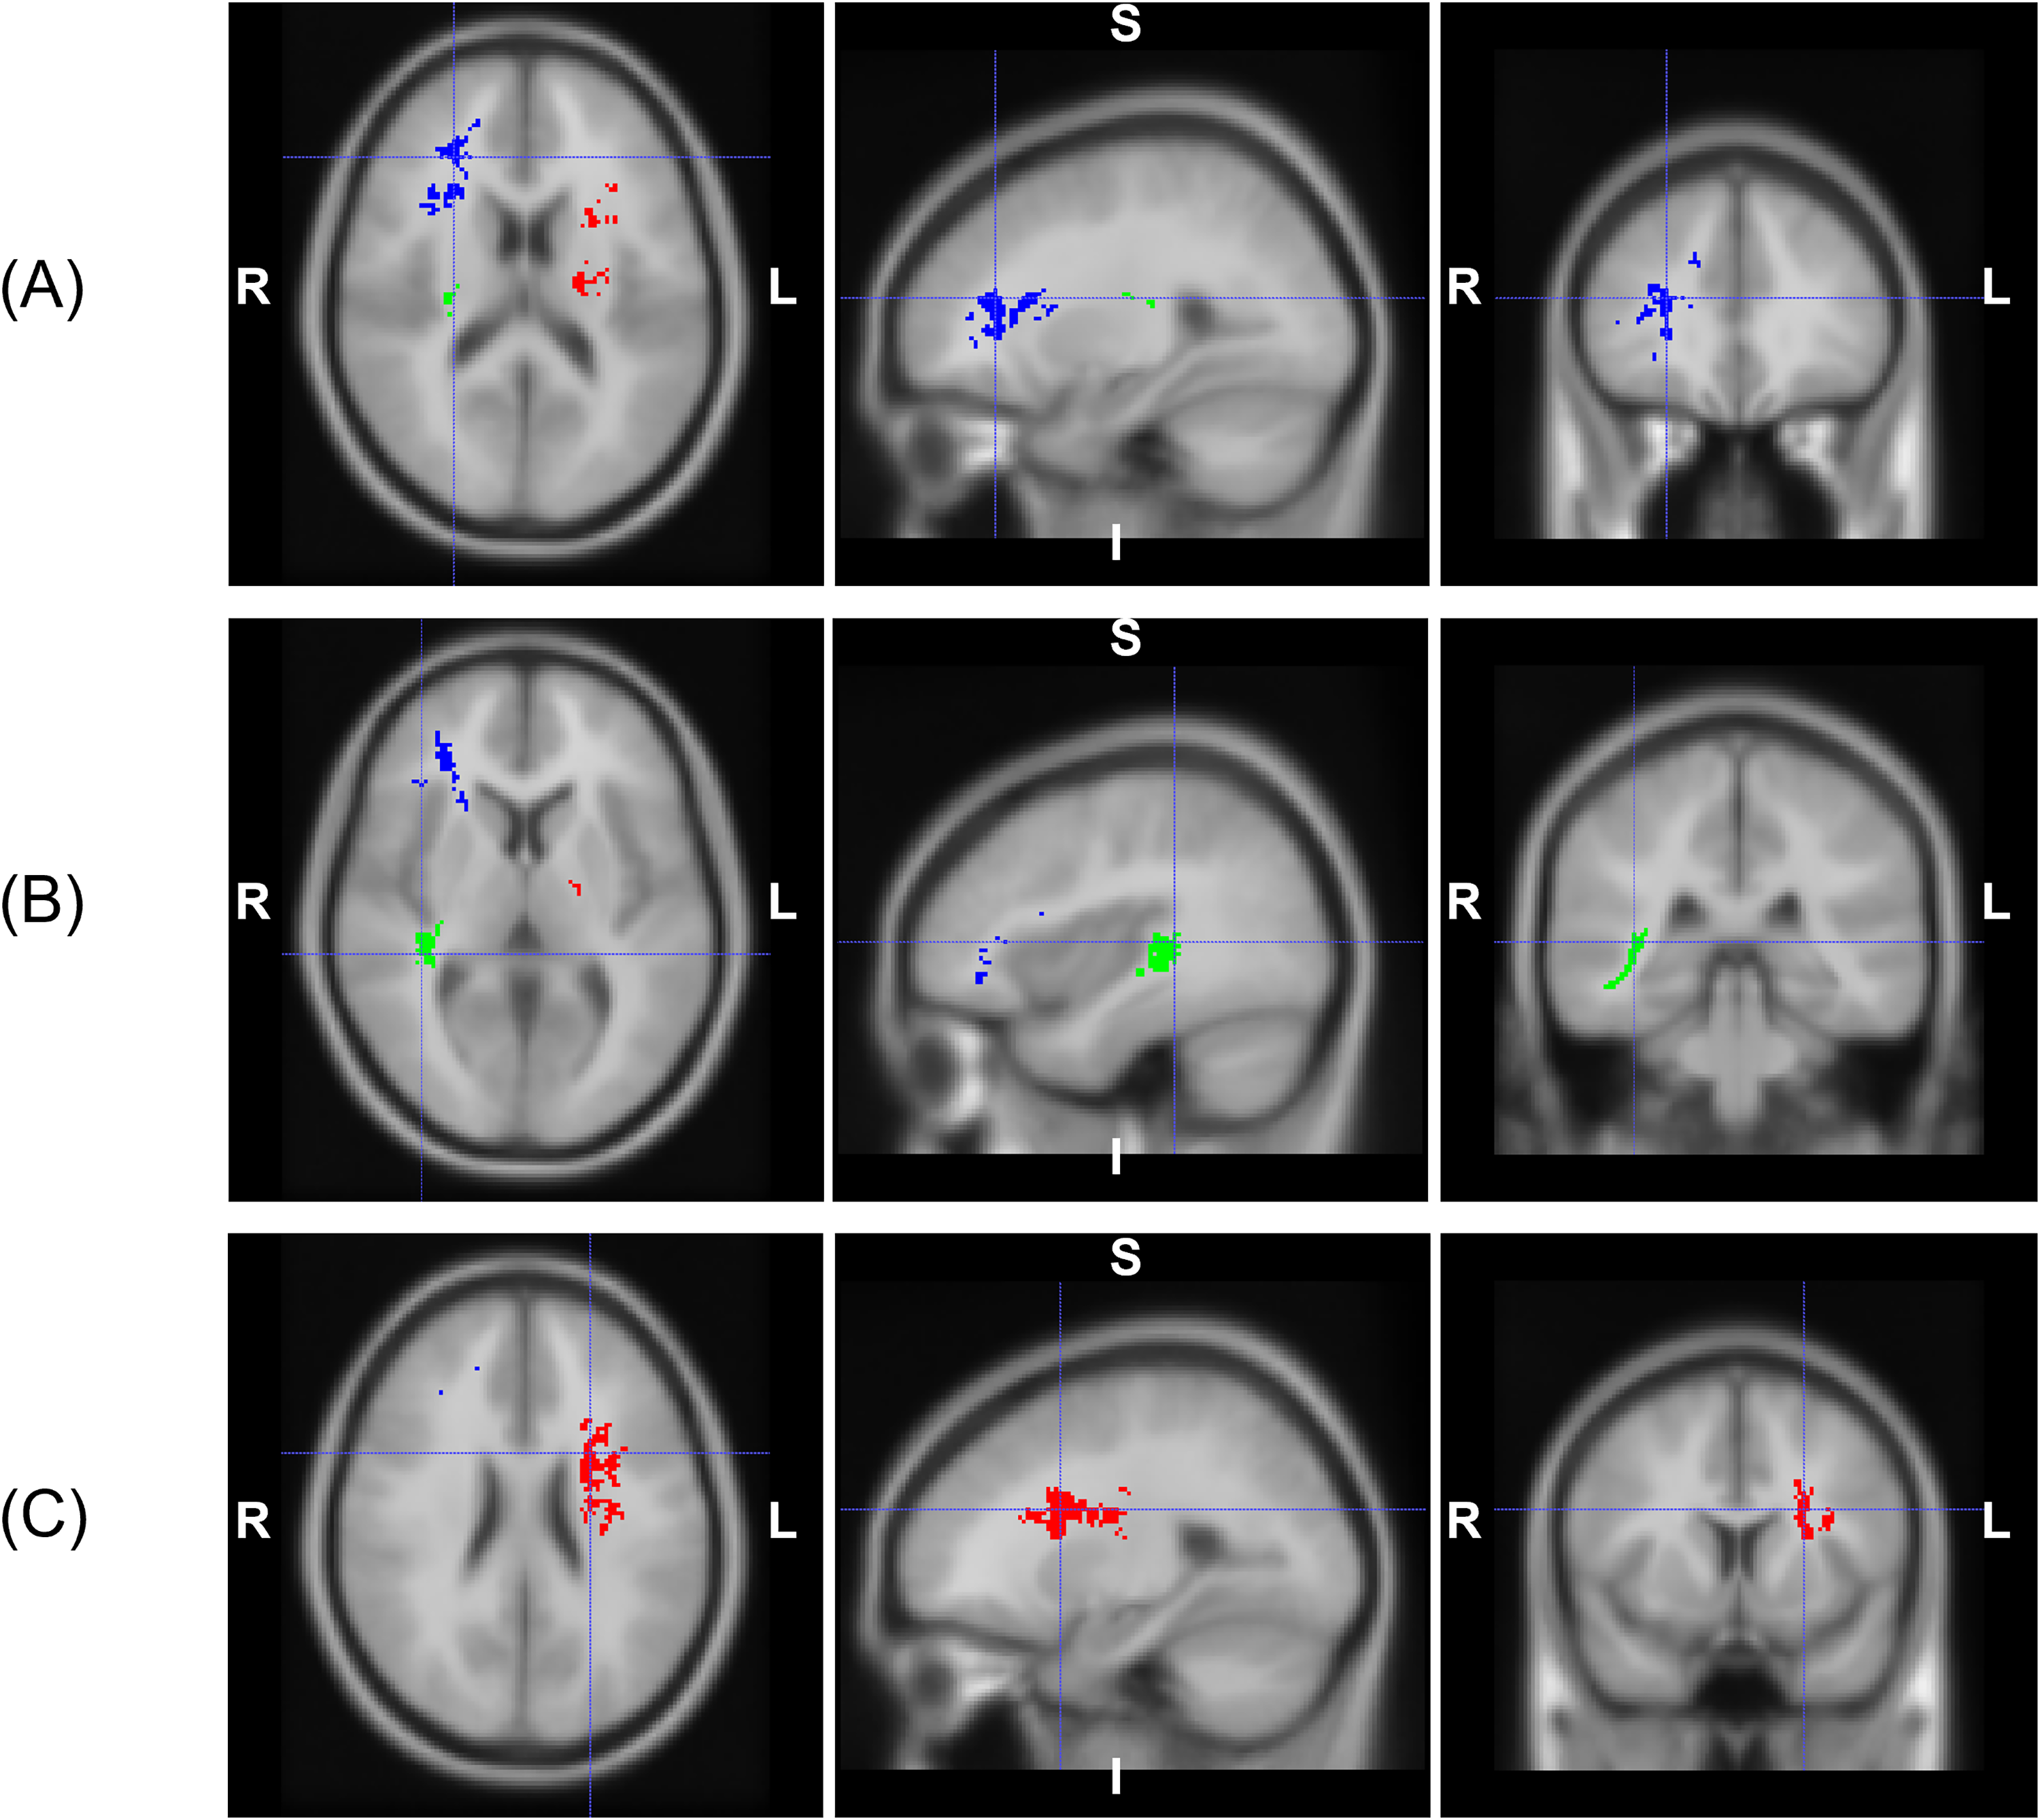
(A) Three overlapping voxel clusters between ATT and ICVF in right-posterior-inferior (RPI) orientations: (A) cluster #1 in blue (MNI coordinate X = 43, Y = 107, Z = 60), (B) cluster #2 in green (MNI coordinate X = 35, Y = 62, Z = 53), and (C) cluster #3 in red (MNI coordinate X = 77, Y = 91, Z = 65). ATT: arterial transit time; MNI: Montreal Neurological Institute.
Voxel-wise linear regression analyses between perfusion and microstructural parameters identified a voxel cluster demonstrating a significant negative association between ATT and ICVF in participants with MCI (Figure 6). Notably, this cluster was located in close proximity to the one formed by the overlapping ICVF-ATT voxels (Figure 5C). The majority of these voxels were concentrated in the left anterior and left superior corona radiata. In contrast, no other voxel-wise linear regression analyses revealed statistically significant associations between perfusion and microstructural parameters in either the MCI or NC groups.
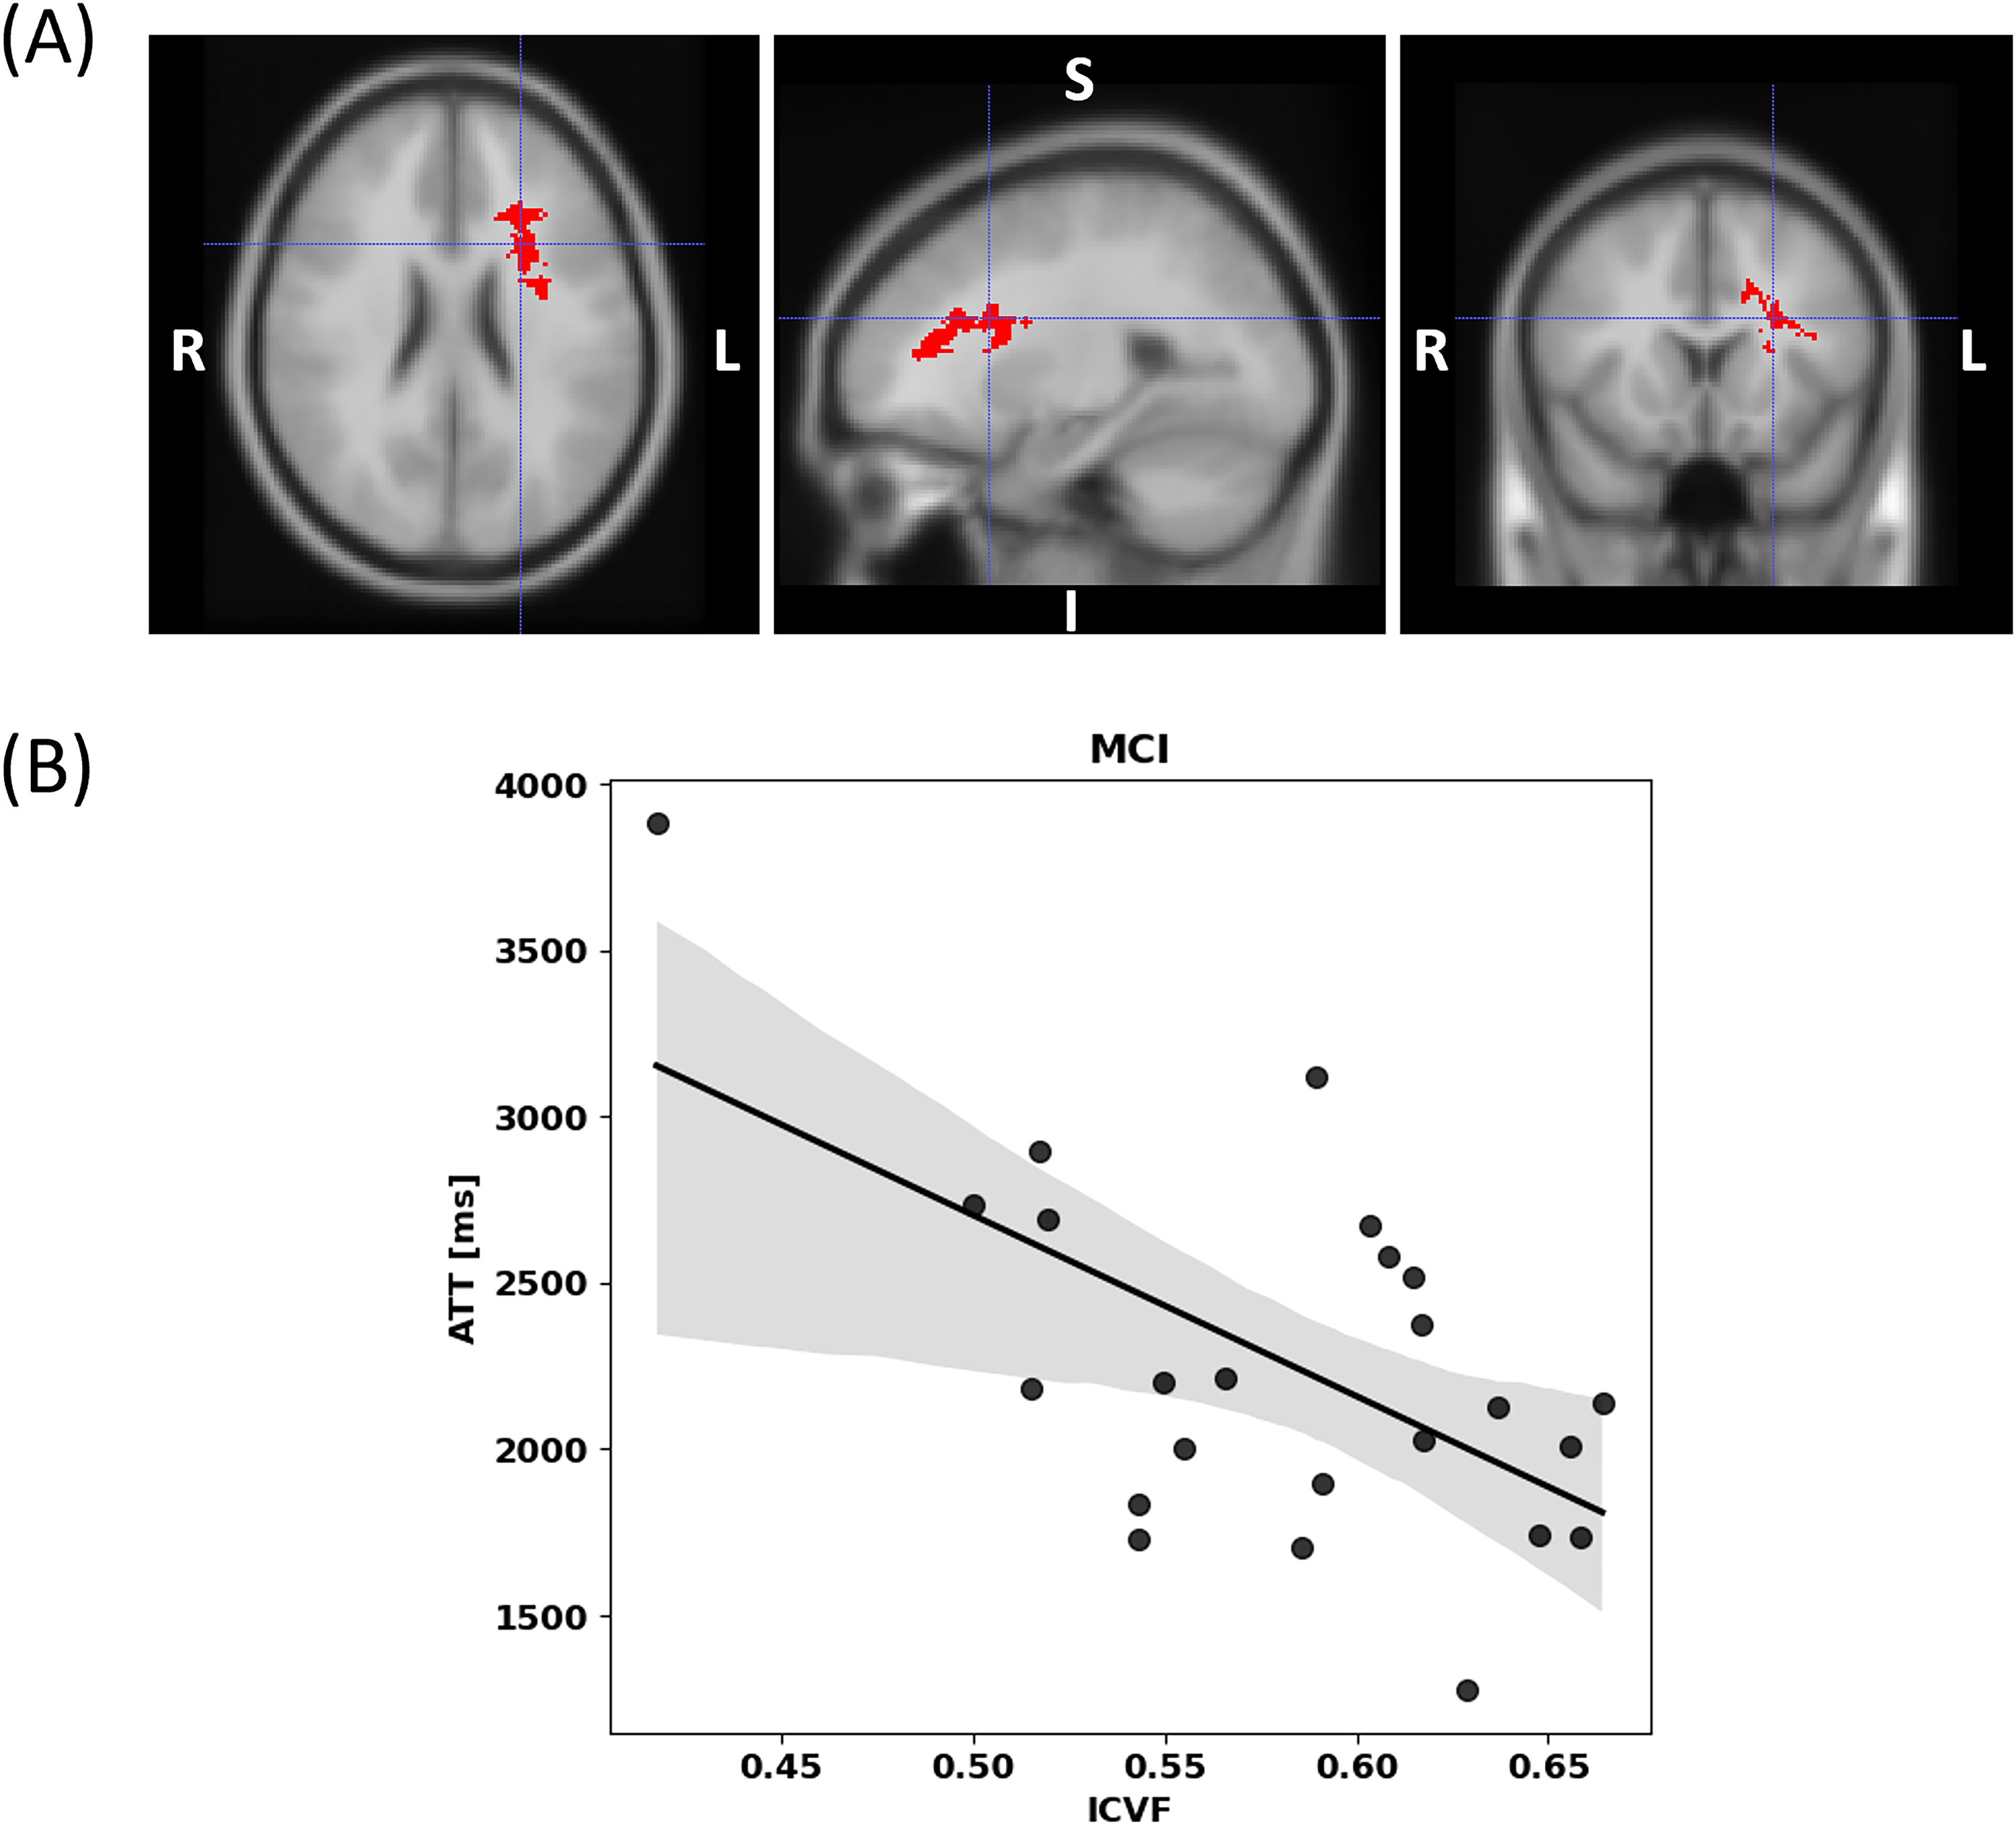
(A) The voxel clusters that showed statistically significant difference between ICVF and ATT in MCI participants, adjusted for covariates: age, sex, years of education, hypertension status, impaired glycemic status, and APOE ε4 allele (MNI coordinate X = 77, Y = 95, Z = 65). The minimum cluster size of ICVF-ATT analysis was 845 voxels. (B) Illustration of the relationship between ICVF and ATT within the voxel cluster shown in (A). ATT: arterial transit time; ICVF: intracellular volume fraction; MCI: Mild cognitive impairment; MNI: Montreal Neurological Institute.
White matter hyperintensities in MCI
The covariate-adjusted multiple linear regression analyses showed no statistically significant difference in WMH fractions between MCI and NC in this study cohort. WMH fractions had p-values greater than 0.1. There were no vascular risk factors showing statistically significant differences in WMH fractions.
Discussion
In this analysis of CBF, ATT, CVR, and white matter microstructure in well-characterized NC and MCI participants, the results in the NAWM demonstrated that MCI was associated with delayed arterial transit by ATT, lower reactivity to hypercapnia by
Among the investigated NODDI parameters, no statistical relationships were found between ISOVF or ODI and MCI, despite previous studies reporting increased ISOVF and ODI changes in MCI.18,19 Consequently, ICVF may serve as a more sensitive marker for MCI in our study cohort. Lower CBF is typically observed in cases of impaired cognitive performance or MCI.1,42 However, no differences in CBF were observed in this study cohort. This discrepancy could be due to prolonged ATT. Longer ATT reduces CBF signal, which potentially reduces CBF sensitivity in WM. Even though the implementation of multiple PLDs increased the accuracy and sensitivity of CBF quantification, the prolonged ATT in this cohort might have decreased CBF sensitivity. This is because delayed ATT could lead to underestimated CBF values. 43 Furthermore, several studies have shown that ATT can be a more sensitive parameter than CBF for physiological correlations.7,44,45 It is important to note that some vascular risk factors, such as hypertension and the presence of APOE ε4 allele showed statistically significant association with some cerebrovascular perfusion parameters. Lower CBF was observed in the participants with hypertension. This observation was consistent with previous findings. 26 The shortened ATT in participants with APOE ε4 allele needs further investigation, as the direct relationship between the APOE ε4 allele and ATT remains understudied. Although a few studies have explored the association between the APOE ε4 allele and ATT, none have analyzed WM perfusion.46,47 Shortened ATT in participants with the APOE ε4 allele may represent increased vulnerability to vessel narrowing, stiffening, or both. The absence of observed CBF changes in the presence of the APOE ε4 allele in this relatively healthy cohort may suggest potential compensatory mechanisms to maintain perfusion under cerebrovascular influences. However, this should not be interpreted as evidence of such compensatory mechanisms without further study.
There are several limitations in this study. We utilized a single echo scheme for single-PLD PCASL and BOLD acquisitions to cover a larger brain area in a shorter acquisition time. Typically, ASL scans employ a shorter TE. However, to minimize the impact of BOLD signal fluctuations on the ASL, we strategically collected baseline and hypercapnic scans during the plateau phase, reviewing the acquired data. In addition, the selected PLD of 1.2 s in single-PLD PCASL might not be long enough for WM quantification given that ATT can be 2000 ms or longer in deep WM.
48
This short PLD limits the assessment of ASL-based
The intrinsic physiological correlations between the reported MRI parameters and MCI still need to be explored. In this study, although a direct correlation between cerebrovascular perfusion and WM microstructural integrity was not established, the findings elucidated a notable association between prolonged ATT and microstructural deterioration in MCI. It is pertinent to note that while ATT does not directly quantify perfusion, it offers valuable insights into cerebrovascular dynamics, potentially linking altered blood flow characteristics to changes in WM microstructural integrity. This study thereby contributes to the insightful understanding of the relationship between cerebrovascular perfusion, as indirectly inferred through ATT, and WM microstructural integrity, specifically through ICVF.
In conclusion, this study demonstrated that markers of impaired WM perfusion and microstructure (lower
Supplemental Material
sj-docx-1-alz-10.1177_13872877251360740 - Supplemental material for The differential relationship between white matter cerebrovascular perfusion and microstructure between normal cognition and mild cognitive impairment
Supplemental material, sj-docx-1-alz-10.1177_13872877251360740 for The differential relationship between white matter cerebrovascular perfusion and microstructure between normal cognition and mild cognitive impairment by Donghoon Kim, Sarah Yoon, Timothy M. Hughes, Yu-Chien Wu, Danielle Harvey, Megan E Lipford, Samuel N Lockhart, Suzanne Craft, Laura D Baker, Christopher T Whitlow, Stephanie E Okonmah-Obazee, Christina E Hugenschmidt, Matthew Bobinski and Youngkyoo Jung in Journal of Alzheimer's Disease
Footnotes
ORCID iDs
Ethical considerations
This study was approved by the Institutional Review Boards at Wake Forest School of Medicine.
Consent to participate
Informed written consent was obtained from all participants.
Author contribution(s)
Funding
The authors disclosed receipt of the following financial support for the research, authorship, and/or publication of this article: This study was supported by the Wake Forest Alzheimer's Disease Research Center (NIH P30AG072947) and an NIH Research grant (RF1NS110043).
Declaration of conflicting interests
The authors declared the following potential conflicts of interest with respect to the research, authorship, and/or publication of this article: Suzanne Craft is an Editorial Board Member of this journal but was not involved in the peer-review process of this article nor had access to any information regarding its peer-review. Danielle Harvey has consulted for NervGen Pharma Corp. Christopher T. Whitlow has consulted for Biogen and Genentech.
Data availability statement
The data and code that support the findings of this study are available on request from the senior author.
Supplemental material
Supplemental material for this article is available online.
References
Supplementary Material
Please find the following supplemental material available below.
For Open Access articles published under a Creative Commons License, all supplemental material carries the same license as the article it is associated with.
For non-Open Access articles published, all supplemental material carries a non-exclusive license, and permission requests for re-use of supplemental material or any part of supplemental material shall be sent directly to the copyright owner as specified in the copyright notice associated with the article.