
Abstract
Background
A decline in driving skills is well documented in people with dementia.
Objective
To provide a current estimate and future forecast of drivers with dementia in Ontario, Canada, taking into account sex differences and longitudinal estimates of driving cessation in dementia.
Methods
We used historical provincial licensing data, population estimates and projections, as well as estimates of diagnosable dementia from the Landmark study of the Alzheimer's Society of Canada to create current estimates and forecasts of drivers with dementia in the province of Ontario, the most populous province of Canada, from 2024 to 2046. Sensitivity analyses were used to determine the impact of sex and assumptions regarding the rate of driving cessation.
Results
Assuming that an estimated 35% of people with diagnosable dementia stop driving very shortly after symptom onset followed by a more gradual decline over time, and that females stop driving twice as fast as men, we forecast approximately 154,000 drivers with dementia in the province of Ontario in 2046.
Conclusions
As dementia prevalence increases, our study provides a novel set of projections for drivers with dementia over the coming two decades, estimating a 221% to 226% increase. This work adds to the myriad of concerns about health and public services that will be needed to treat and support this population effectively, to detect early signs of dangerous driving among the cognitively impaired, and to provide alternative transportation options, once driving is no longer viable.
Introduction
With the aging of the population and the increased risk of dementia at higher ages, there is expected to be an increased prevalence of drivers with dementia. Approximately 7 million people in the US aged 65 years or older have dementia and this number is expected to increase to nearly 12 million by 2040. 1 Many people with dementia continue to drive and they often drive for several years after their diagnosis. A dementia diagnosis itself is not a contraindication to driving, as driving skills are affected to varying degrees depending on the disease severity and subtypes of dementia. 2 In the Canadian Outcome Study in Dementia, people diagnosed with mild-to-moderate dementia were followed longitudinally. 3 Out of 719 participants who were or had been drivers, 203 (28.2%) were still driving at the start of the study (baseline). Over an observation period that averaged 23 months, data was available for 200 patients, by which point 103 (51.5%) were still driving. Therefore, commensurate with the expected increase in the number of people with dementia in future years, there is an expected increase in the number of drivers with dementia as well.
Drivers with dementia have consistently been found to make more driving errors and be more likely to fail on-road driving tests compared with healthy controls.4–6 Most, though not all studies, have also shown dementia to be associated with an increased crash risk according to caregiver reports and state-reported data.4,6 Consequently, there is a high likelihood that drivers with dementia pose a risk to themselves and others with continued driving. Although the focus on drivers with dementia tends to be on the risk their driving poses, there are numerous adverse consequences associated with driving cessation including less social engagement, greater general health deterioration, and an increased risk of depression, institutionalization and death.7–9 Driving cessation is a major practical and emotional challenge for people with dementia and their family carers.10–12 Having to balance the driving risks posed by dementia and the adverse consequences associated with driving cessation makes decisions about stopping driving challenging for people diagnosed with dementia. The expected increase in numbers of drivers with dementia in the coming years will also pose a significant challenge for the family members of people with dementia, clinicians, and policy makers. Hence, a reasonable estimate of how large the cohort of drivers with dementia will be in future years is important to provide a perspective on the magnitude of this challenge.
To our knowledge, there has been only one prior population-based estimate and forecast of drivers with dementia. In 2004, Hopkins et al. combined census data with licensure data from Ontario's Ministry of Transportation as well as dementia prevalence data from the Canadian Study of Health and Aging, and estimated that there were 34,104 licensed drivers with dementia in Ontario in 2000, and that this number would grow to 98,032 by 2028. 13
The purpose of our study is to update Hopkins et al. estimates and forecasts of drivers with dementia in Ontario. Ontario is Canada's largest province, with an estimated 3,181,551 adults ages 65 years and over in 2024. Our study aims to take into account sex differences 14 and longitudinal estimates of driving cessation in dementia.3,15
Methods
Data sources
Three sources of data were used to forecast the Ontario licensed driver population out to 2046, a necessary first step in forecasting the prevalence of Diagnosable Dementia (DD) in that population: Historical licensed driver count data from the Ontario Ministry of Transportation (MTO) (2001–2022), historical Ontario population estimates from Statistics Canada (2001–2022) 16 and Ontario population forecasts from the Ontario Ministry of Finance (2023–2046). 17 The Ministry of Finance population forecasts relied on Statistics Canada's 2022 population estimates as a baseline. The year 2001 was chosen as the historical limit for analysis because prior to 2001, Ontario population data for individuals aged 90+ is not readily available. Additionally, in 1996, Ontario's 80+ Senior Driver's License Renewal program was modified with an annual driving test requirement being replaced by a bi-annual knowledge test. This change was associated with a substantial increase in the proportion of the Ontario 80+ population who remained licensed drivers in 1997.
To calculate the main forecasts of interest, i.e., the number of licensed drivers with diagnosable dementia, we also relied on age and sex-specific dementia incidence and prevalence forecasts from the Ontario sub-model used in the Landmark Study. 18 The Landmark study provides Canadian prevalence and incidence data on diagnosable dementia (“DD”) cases—i.e., individuals who would meet diagnostic criteria for dementia, whether or not they are actually diagnosed—in Canada.18–20 The forecasts in that study are based on data from Statistics Canada, with simulations of demographics, long-term health conditions and their comorbidities, and interactions. The estimates provided are based on those who are projected to meet the diagnostic criteria for dementia, but not based on actual diagnoses, as many people with dementia are never diagnosed with dementia. As such, in this manuscript we use the term “diagnosable dementia” (DD) instead of “dementia” (which may incorrectly imply that the individuals carry a diagnosis of dementia).
These forecasts were provided to us in aggregated age groups, e.g., 40–49, 50–54, 55–59, etc., so an interpolation scheme was employed to approximate forecasts by actual age in years, i.e., 40, 41, 42, etc. (Supplemental Methods).
Forecasting Ontario's licensed driver population
The proportion of the Ontario population that is licensed has changed gradually over time, even when considered in relatively narrow age ranges. As such, we used binary logistic or Poisson regression to project this proportion forward in time, by age and sex, and produced licensed driver count forecasts up to the year 2046 (Supplemental Methods). For a given age and sex, when less than 90% of the corresponding Ontario population was licensed in more than half the years of historical data (2001–2022), binary logistic regression was used for forecasting. When the probability of licensure skewed closer to one, a Poisson regression was used due to the instability of the logistic model. For model fitting, Ontario licensed driver count data for 2020 and 2021 were excluded due to the COVID-19 pandemic-related suspension of programs, including the 80+ Senior Driver's License Renewal program as well as delays in driver testing. These changes in program delivery resulted in unusually high counts of licensed drivers per population for several age groups. The rate of licensing for 2022 was consistent with previous trends and was therefore retained in modelling.
Forecasting approach for licensed drivers with diagnosable dementia
In our forecasting approach, we assumed the population of licensed drivers with diagnosable dementia who are age A in year Y (e.g., aged 67 in 2036) is composed of two groups: Group i) licensed drivers who newly acquire diagnosable dementia that year at that age, and Group ii)—licensed drivers who acquired diagnosable dementia in a previous year at a younger age (e.g., one year previous being year Y-1 at age A-1, two years previous being year Y-2 at age A-2, etc.), but remain alive and licensed in year Y.
To calculate the contribution of Group i (newly acquired diagnosable dementia) to the forecasted prevalence of licensed drivers with diagnosable dementia, we assume that the probability of acquiring diagnosable dementia for a licensed driver who was previously unaffected by diagnosable dementia is the same as any other previously unaffected member of the population of the same age in the same year. In this case, the probability of any previously unaffected individual (licensed driver or otherwise) at age A in year Y acquiring diagnosable dementia is simply the forecasted diagnosable dementia incidence at that age in that year (directly available from the Landmark study 18 ) divided by the previously unaffected population of that age in that year. The previously unaffected population size is calculated by subtracting the difference between forecasted diagnosable dementia prevalence and incidence for individuals of the given age in the given year (i.e., the component of prevalence carried over from previous years) from the Ontario population at age A in year Y. Multiplying the probability of newly acquiring diagnosable dementia at age A in year Y by the previously unaffected licensed driver population provides a forecast for the number of licensed drivers who newly acquire diagnosable dementia at that age in that year. Calculating the previously unaffected driver population requires an estimate of affected drivers from the previous year, so calculations must be performed recursively (see Supplemental Methods for full details).
Turning to Group ii (previously acquired diagnosable dementia), if estimates for the number of licensed drivers with diagnosable dementia at age A-1 in year Y-1, age A-2 in year Y-2, etc., are available, then their contribution to the total number of drivers with diagnosable dementia at age A in year Y can also be determined recursively from an empirically measured driving survival curve. In the Canadian context, Herrmann et al. 3 conducted a three-year prospective study of 883 Canadians with mild to moderate dementia, of which 203 were still driving at study baseline, 516 had ceased driving, and the remainder had never driven. For those who were still driving at baseline, their average age was 74.55 [SD: 6.37], and their average Mini-Mental State Examination (MMSE) score was 24.25 [SD: 3.33], placing the majority in the mildly impaired range (MMSE score of 21–26). In terms of survival, approximately 75% of the baseline still-driving group remained as drivers after one year, 50% after two years, and 25% after three years. This remarkably linear survival curve is similar to one provided in a Missouri study by Stout et al. (2018), 15 which, to our awareness, is the only other driving cessation study that yielded a survival curve for drivers with dementia. Since most of Herrmann et al.'s still-driving participants appear to have been at an early stage of dementia, their driving survival curve could serve as an appropriate basis for calculating the contribution of Group ii. Specifically, based on that study, we might assume 75% of licensed drivers who acquired diagnosable dementia at age A-1 in year Y-1, 50% of those who acquired diagnosable dementia at age A-2 in year Y-2, and 25% who acquired DD at age A-3 in year Y-3 are still licensed at age A in year Y.
The methods described above are sufficient to provide an upper bound forecast for licensed drivers with dementia. However, it is possible that some drivers may not follow the Herrmann et al. (2006) 3 survival curve, but rather cease driving immediately upon, or very close in time, to first experiencing symptoms of diagnosable dementia. We note that 516 participants in Herrmann et al.'s study had already ceased driving prior to baseline and did not contribute to the estimation of the survival curve. In that study, those ceased-driving participants were an average of 2.64 years older than the still-driving group (203 participants) at baseline and presented with worse cognitive function scores (MMSE score of 21.33 [SD: 4.94] compared to 24.25 [SD 3.33] for the still-driving group). Due to the ceased-driving group's worsened cognitive state and more advanced age at study baseline, relative to the still-driving group, we assumed that each member of the former had stopped driving by the time of the study baseline, either due to progression along a survival curve. That is, they followed the same survival curve as the still-driving group, but it began on average 2.64 years prior to study baseline or due to immediate cessation in relation to initial diagnosable dementia symptoms, possibly well before study baseline in some cases. If at baseline all members of the ceased driving group were simply 2.64 years more advanced along the driving survival curve (a crude approximation) that was ultimately followed by the still-driving group, then 35% of the ceased-driving group would still have been driving at baseline. However, since they were not still driving, we make a conservative assumption that 35% of licensed drivers who newly acquire diagnosable dementia at any given age in any given year stop driving immediately. Thus, to produce our best estimate forecasts for licensed drivers with diagnosable dementia, we use the methods described in the previous section, but reduce the size of Group i by 35%. As there is little precise data beyond the Herrmann et al. 3 study as to the exact proportion of those who stop driving upon the diagnosis of dementia, and it is uncertain as to whether that study is reflective of real-world driving cessation rates, we conduct sensitivity analyses by adjusting this estimate to 25% and 45%.
In addition to producing best estimate forecasts and upper bound forecasts, we also produced an even more conservative lower bound set of forecasts by assuming all drivers who acquire diagnosable dementia cease driving within a year of acquiring diagnosable dementia (Supplemental Methods).
Finally, research suggests that females are twice as likely to cease driving at any point after acquiring dementia than males.14,21 We adjusted our best estimate forecasts with this in mind as a further sensitivity analysis (Supplemental Methods).
Results
Forecasting the licensed driver population
Generalized linear modelling projected the number of licensed drivers aged 40+ in Ontario will increase by 38%, from 6.85 million in 2024 to 9.44 million in 2046 (Figure 1(a)). This increase aligns with the forecasted 39% increase in Ontario's 40+ population, from 7.9 million in 2024 to 10.9 million in 2046. 16
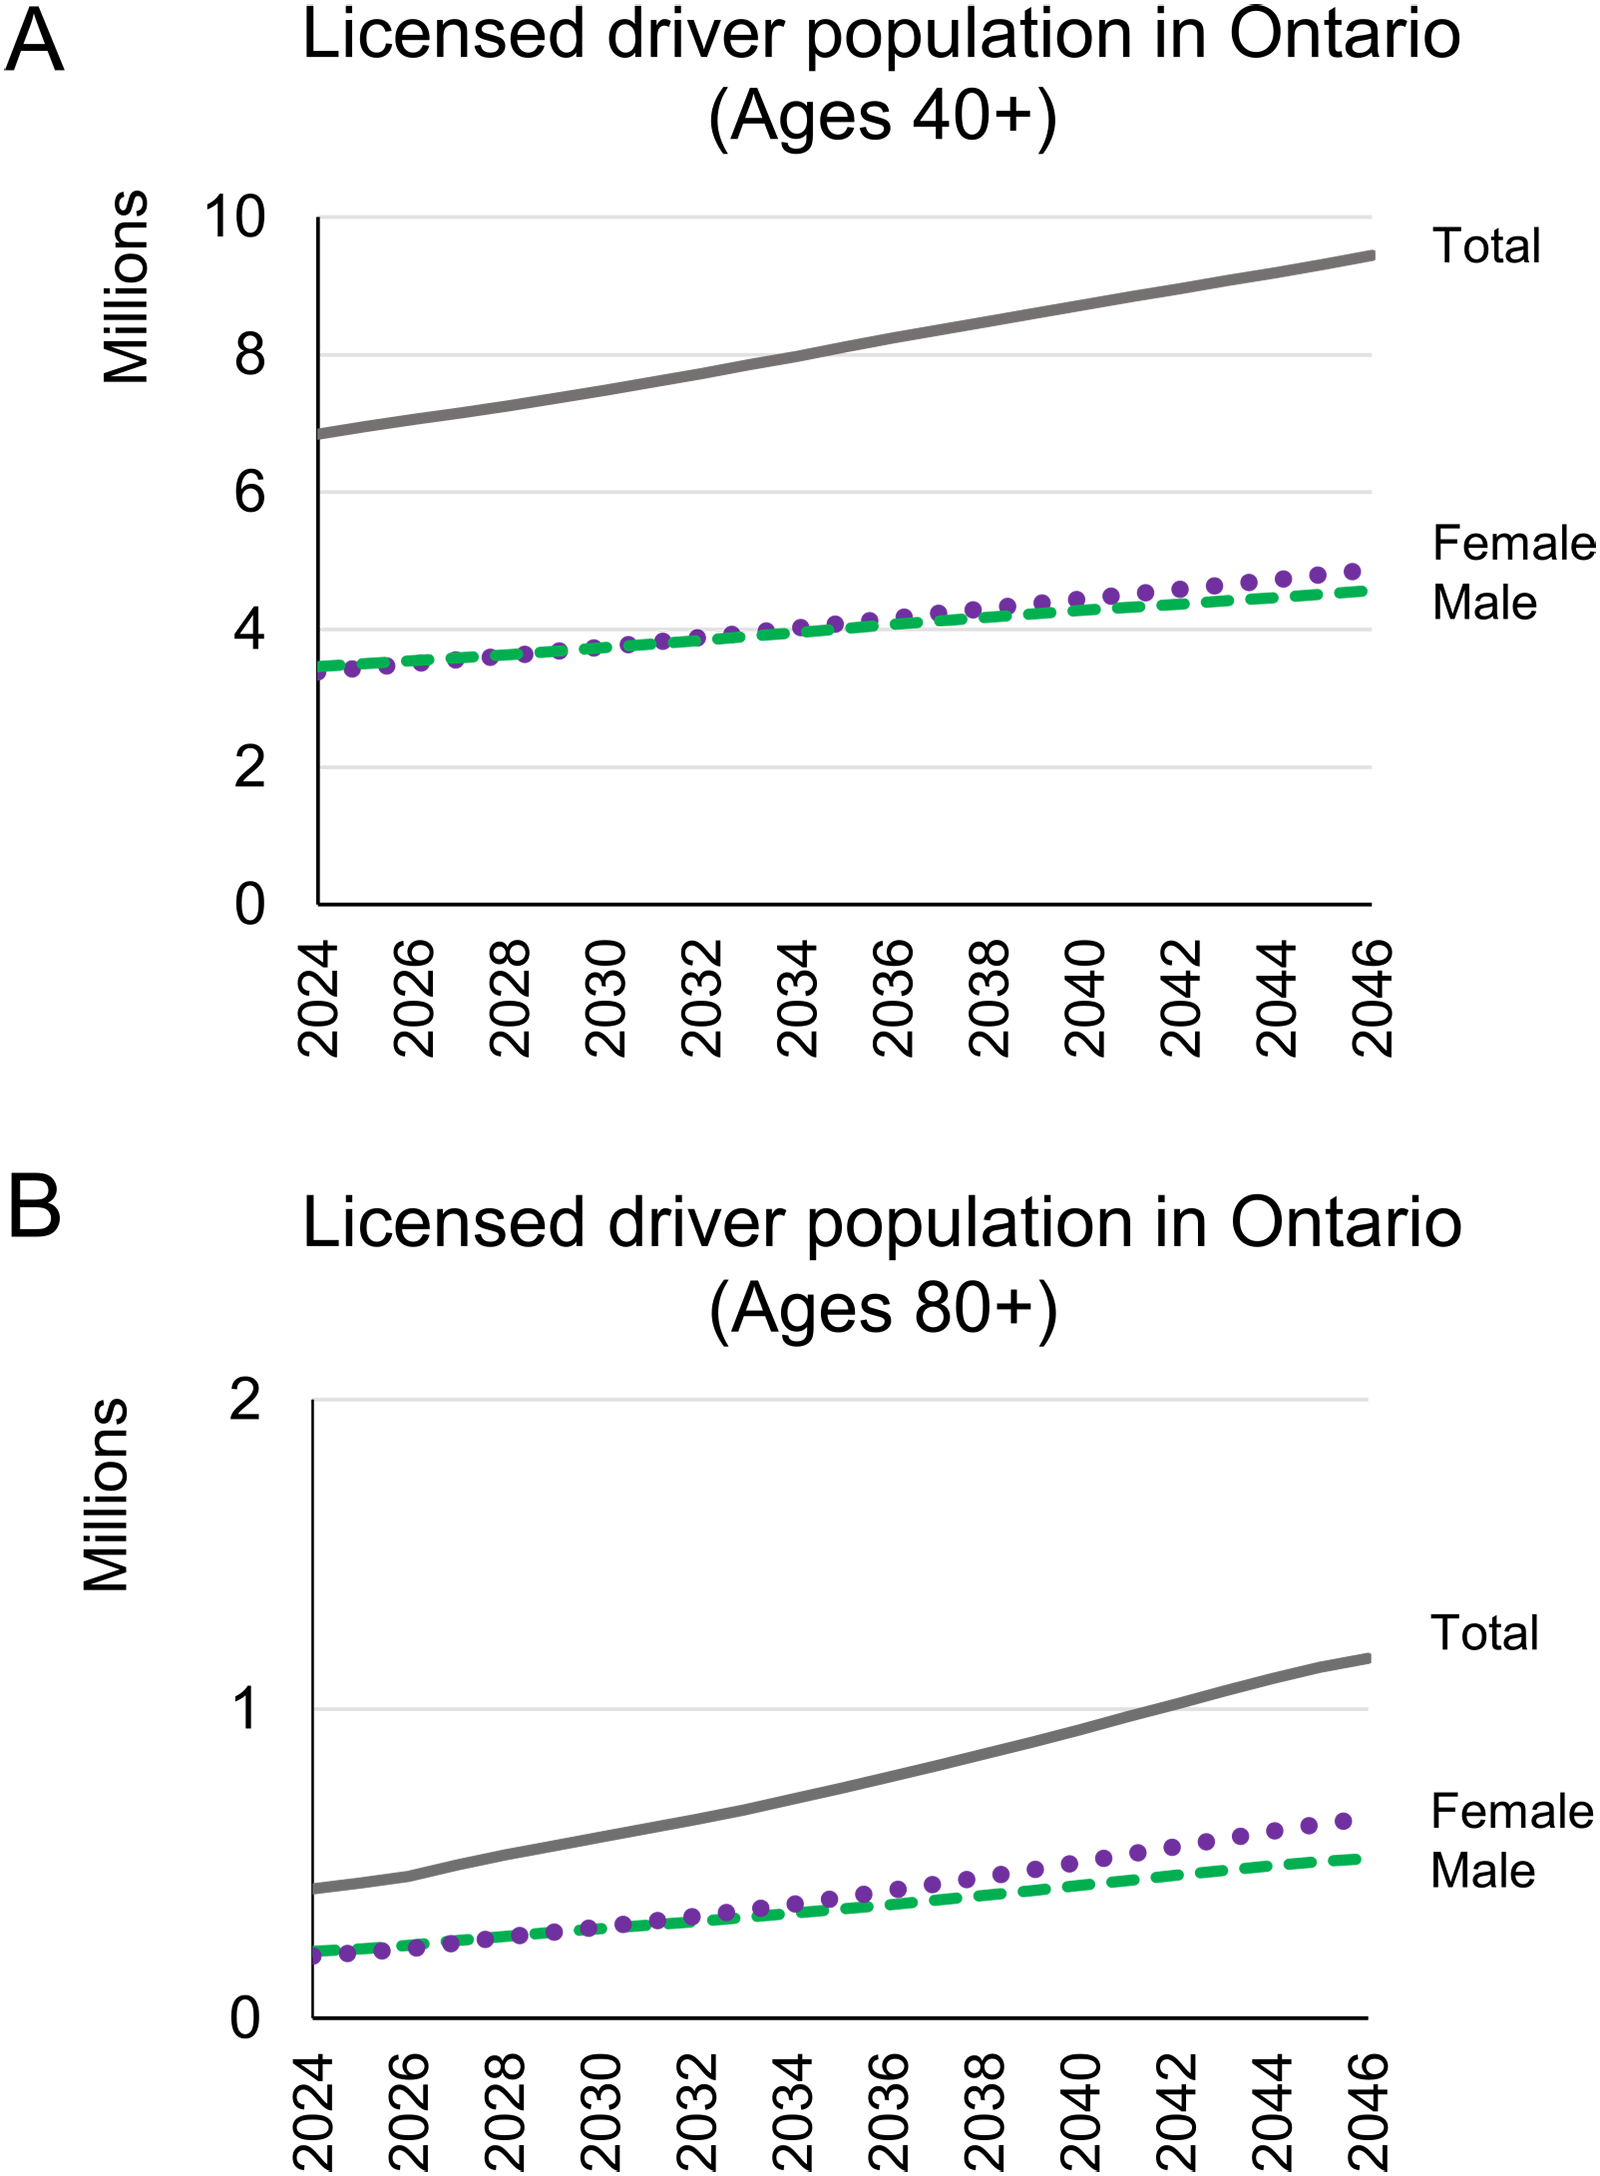
The forecasted number of drivers in Ontario from 2024 to 2046 of (a) ages 40 and over or; (b) ages 80 and over. We show the yearly numbers of licensed males and females, which sum to the total licensed population.
Looking specifically at the 80+ year old population, we forecast that the number of licensed drivers will increase by 178% from 418,000 in 2024 to 1.16 million in 2046 (Figure 1(b)). This surpasses the forecasted 139% increase for Ontario's 80+ total population from 743,000 in 2024 to 1.78 million in 2046. 16 Much of this excess increase in the 80+ licensed driver population relative to the population is due to the growth in the number of older females with a license. From 2024 to 2046, the female 80+ licensed driver population is forecasted to increase by 221% from 201,000 in 2024 to 647,000 in 2046 compared to a corresponding overall population increase of 128% from 438,000 in 2024 to 1 million in 2046. 16
Forecasting the prevalence of diagnosable dementia in the licensed driver population.
For our “best estimate” forecast (Figure 2 curve ii), in which we assumed 35% of drivers quit driving immediately in relation to acquisition of diagnosable dementia while the remainder ceased driving more gradually, we forecasted the number of Ontario licensed drivers with diagnosable dementia to be 174,000 in 2046, which is a 128% increase from the 76,000 we estimate to exist in 2024.
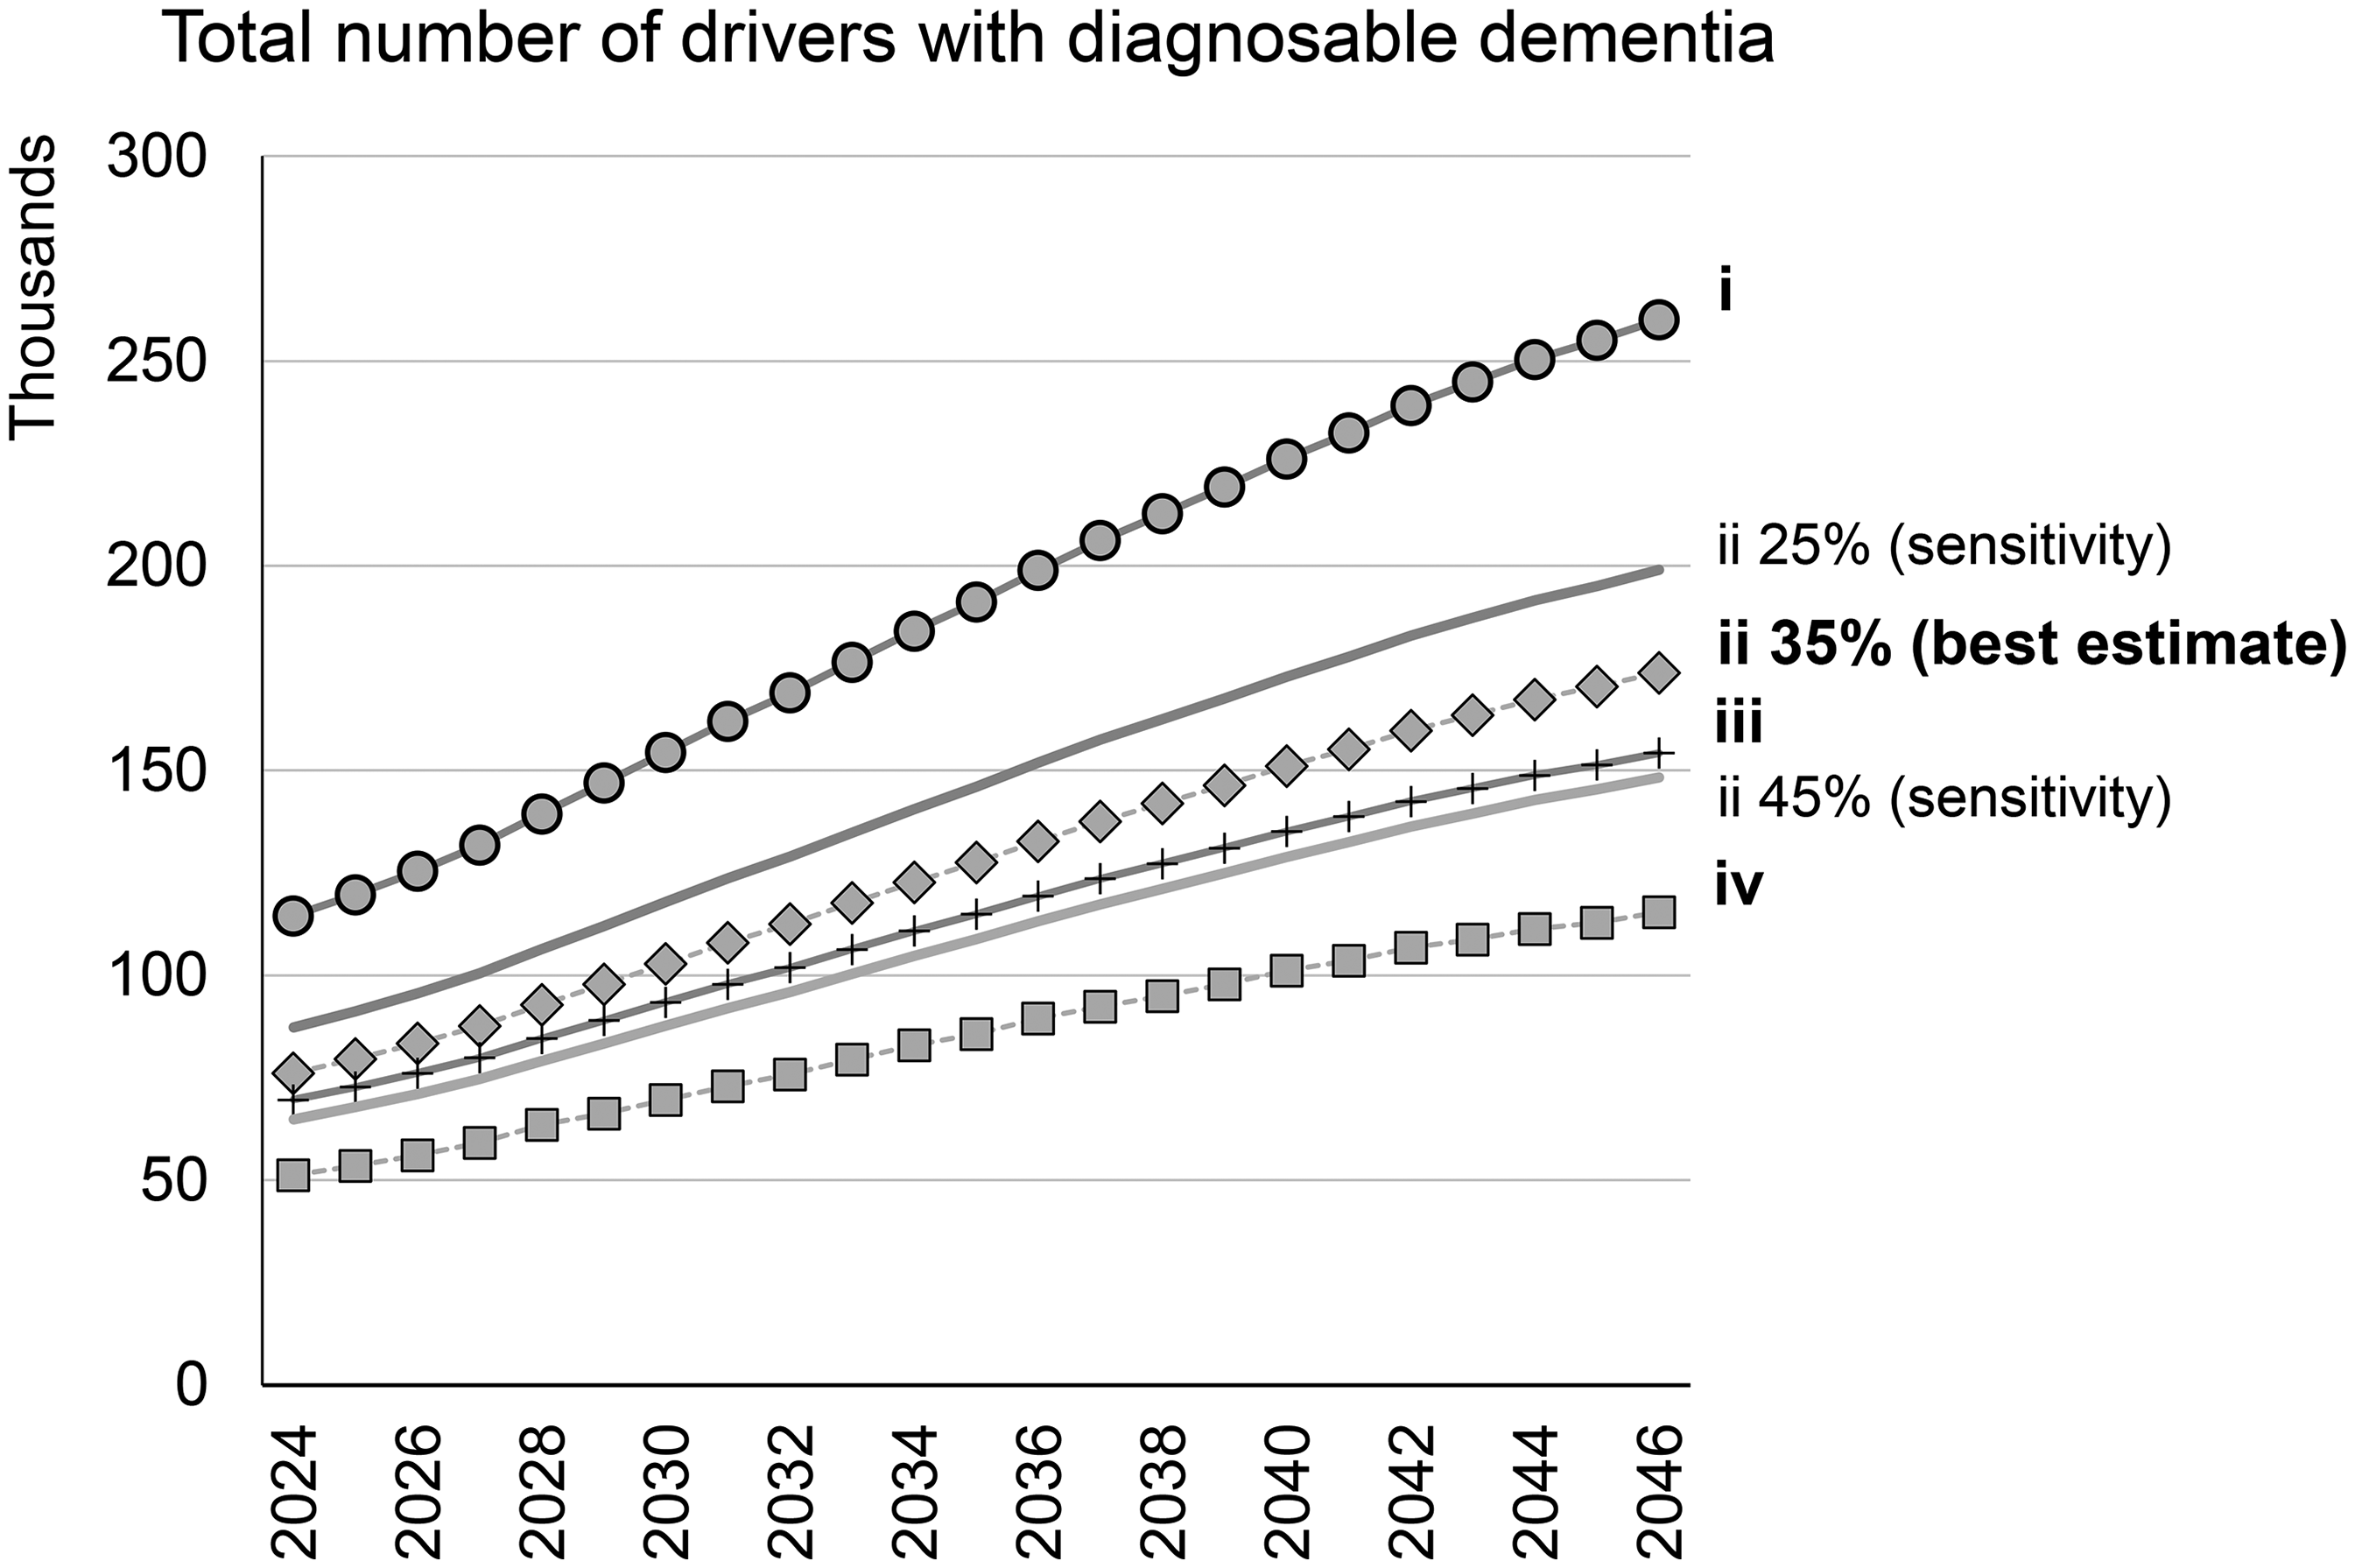
The number of licensed drivers in Ontario with diagnosable dementia in the following scenarios: i. Least conservative estimate, assuming all drivers with DD experience driving cessation following survival curve reported in Herrmann et al.; ii. Best estimate, assuming both male and female populations experience an additional 35% cessation prior to the cessation from the survival curve reported in Herrmann et al.; ii 25%. Sensitivity analysis on the best estimate, assuming both male and female populations experience 25% cessation prior to the cessation from the survival curve reported in Herrmann et al.; ii 45%. Sensitivity analysis on the best estimate, assuming both male and female populations experience 45% cessation prior to the cessation from the survival curve reported in Herrmann et al.; iii. assuming both male and female populations experience an additional 35% cessation prior to the cessation from the survival curve reported in Herrmann et al., and females cease driving at 2x the male rate, and; iv. Most conservative estimate, assuming males and females all cease driving within 1 year of acquiring diagnosable dementia.
Adjusting the best estimate forecast to assume a lower 25% immediate cessation increases the estimated number of drivers with diagnosable dementia from 76,000 to 87,000 in 2024, and the forecasted number from 174,000 to 199,000 in 2046. Alternatively, increasing immediate cessation to 45% reduces the estimated number of drivers to 65,850 in 2024 and 148,000 in 2046. These sensitivity analyses are shown as curves “ii 25%” and “ii 45%” in Figure 2.
Our upper bound forecast (Figure 2 curve i), which assumes no cessation beyond what is reported in Herrmann et al.'s survival curve, 3 predicts a population of 260,000 licensed drivers with diagnosable dementia in 2046. In contrast, our most conservative, lower bound estimate (Figure 2 curve iv), which assumes all drivers will cease driving within one year of acquiring diagnosable dementia, produces a 2046 forecast of 115,000.
When we consider that sex-specific driving cessation may occur twice as fast for females as males (Supplemental Methods), while maintaining the overall survival curve matching Herrmann et al., our best estimate forecast becomes curve iii in Figure 2. Interestingly, the forecasted number of drivers with diagnosable dementia in 2046 under this scenario drops from our original “best estimate” of 174,000 to 154,000, which illustrates a remarkable lack of sensitivity of our forecast to differences in driving survival between male and female drivers. However, when we disaggregate our best estimate forecast by sex, it becomes immediately apparent that females contribute considerably more than males to the growth of the number of licensed drivers with diagnosable dementia from 2024 to 2046 (Figure 3).
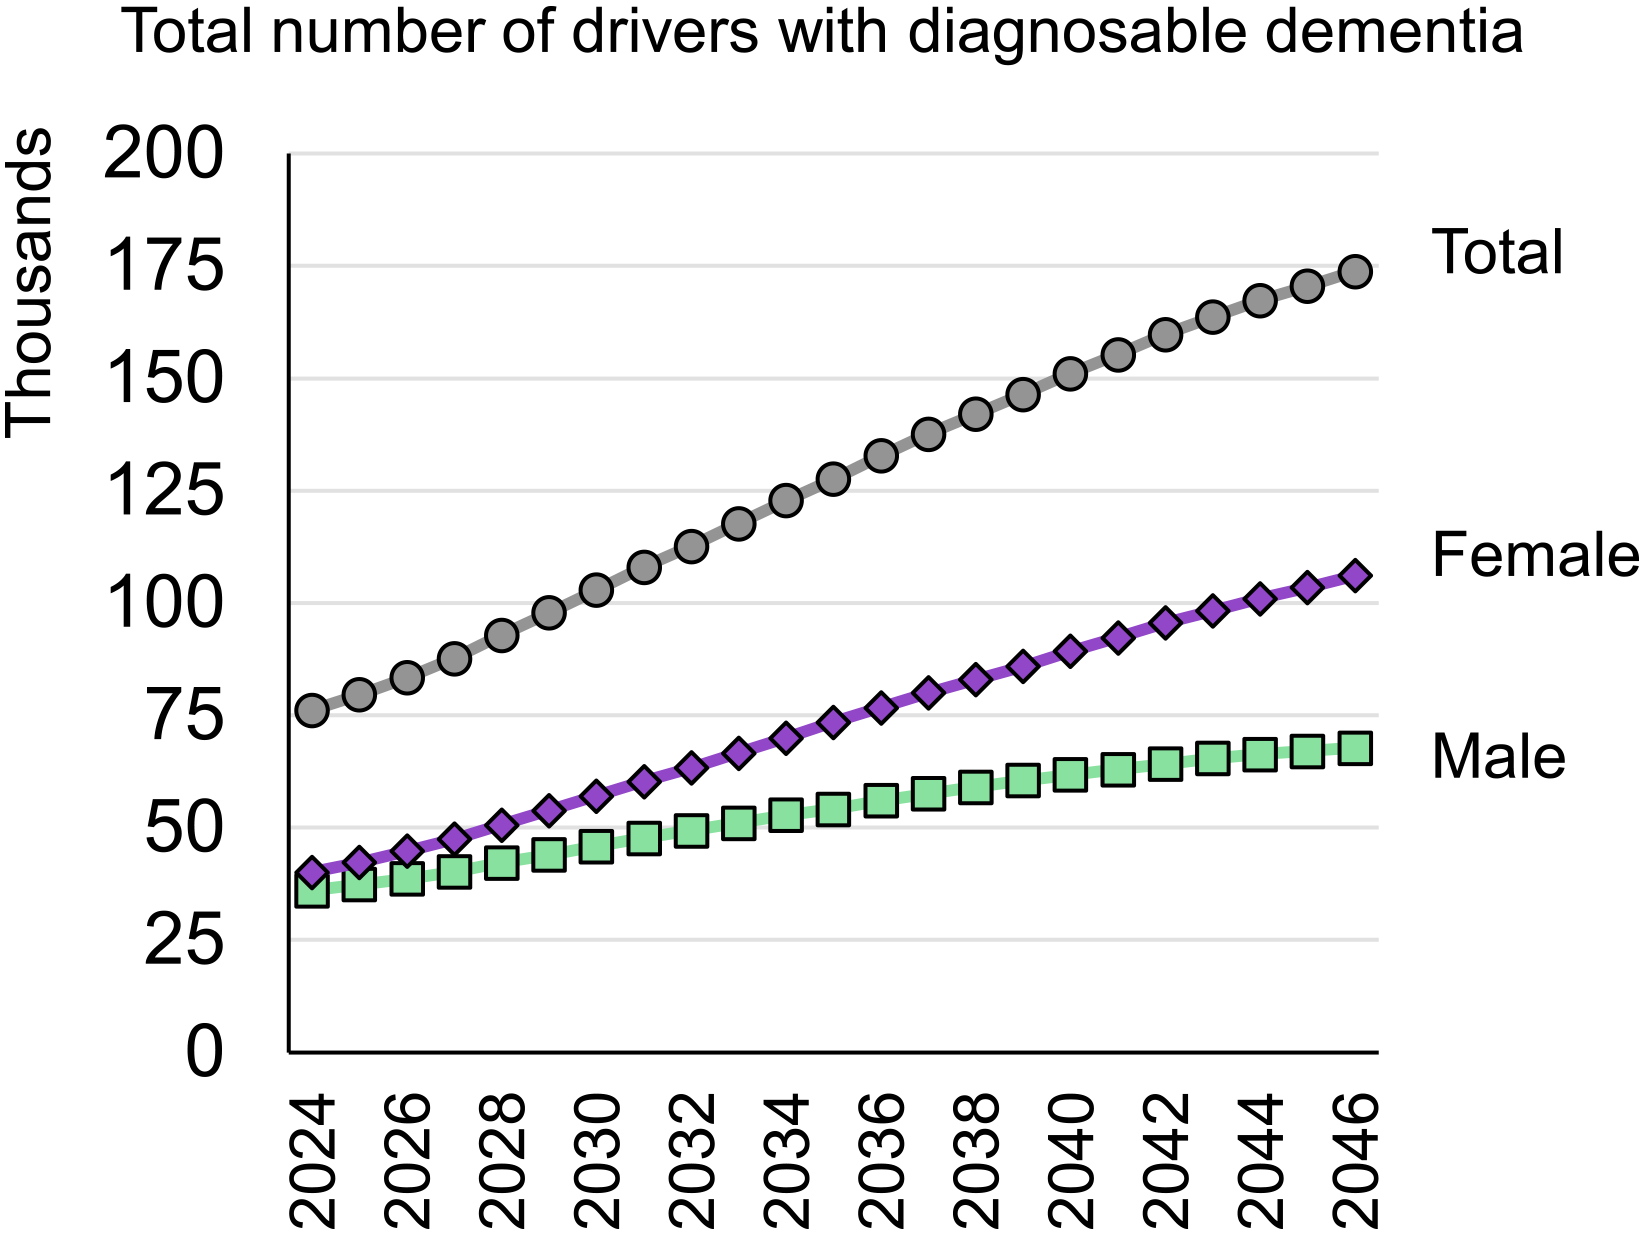
Disaggregation of “best estimate” forecast by gender. Estimate shown is the number of licensed drivers with diagnosable dementia assuming both male and female populations experience an additional 35% cessation prior to the cessation from the survival curve reported in Herrmann et al.
In addition to the sex-based trends our forecasts revealed, we also identified trends among older age groups. The 80–84 and 85–89 licensed driver age groups are forecasted to experience the greatest increases in diagnosable dementia over the 2024 to 2046 interval (Figure 4). Specifically, the number of male drivers ages 80–84 with diagnosable dementia is expected to double between 2024 and 2046, increasing from 10,000 to 20,000. For 80–84-year-old females, the number is expected to increase by a factor of 2.8, from 11,700 drivers to 32,700. The 90+ year-old age group of licensed drivers with diagnosable dementia is also expected to experience substantial growth. Interestingly, for females, this increase in the 90+ group intensifies in the mid-2030s (Figure 4).
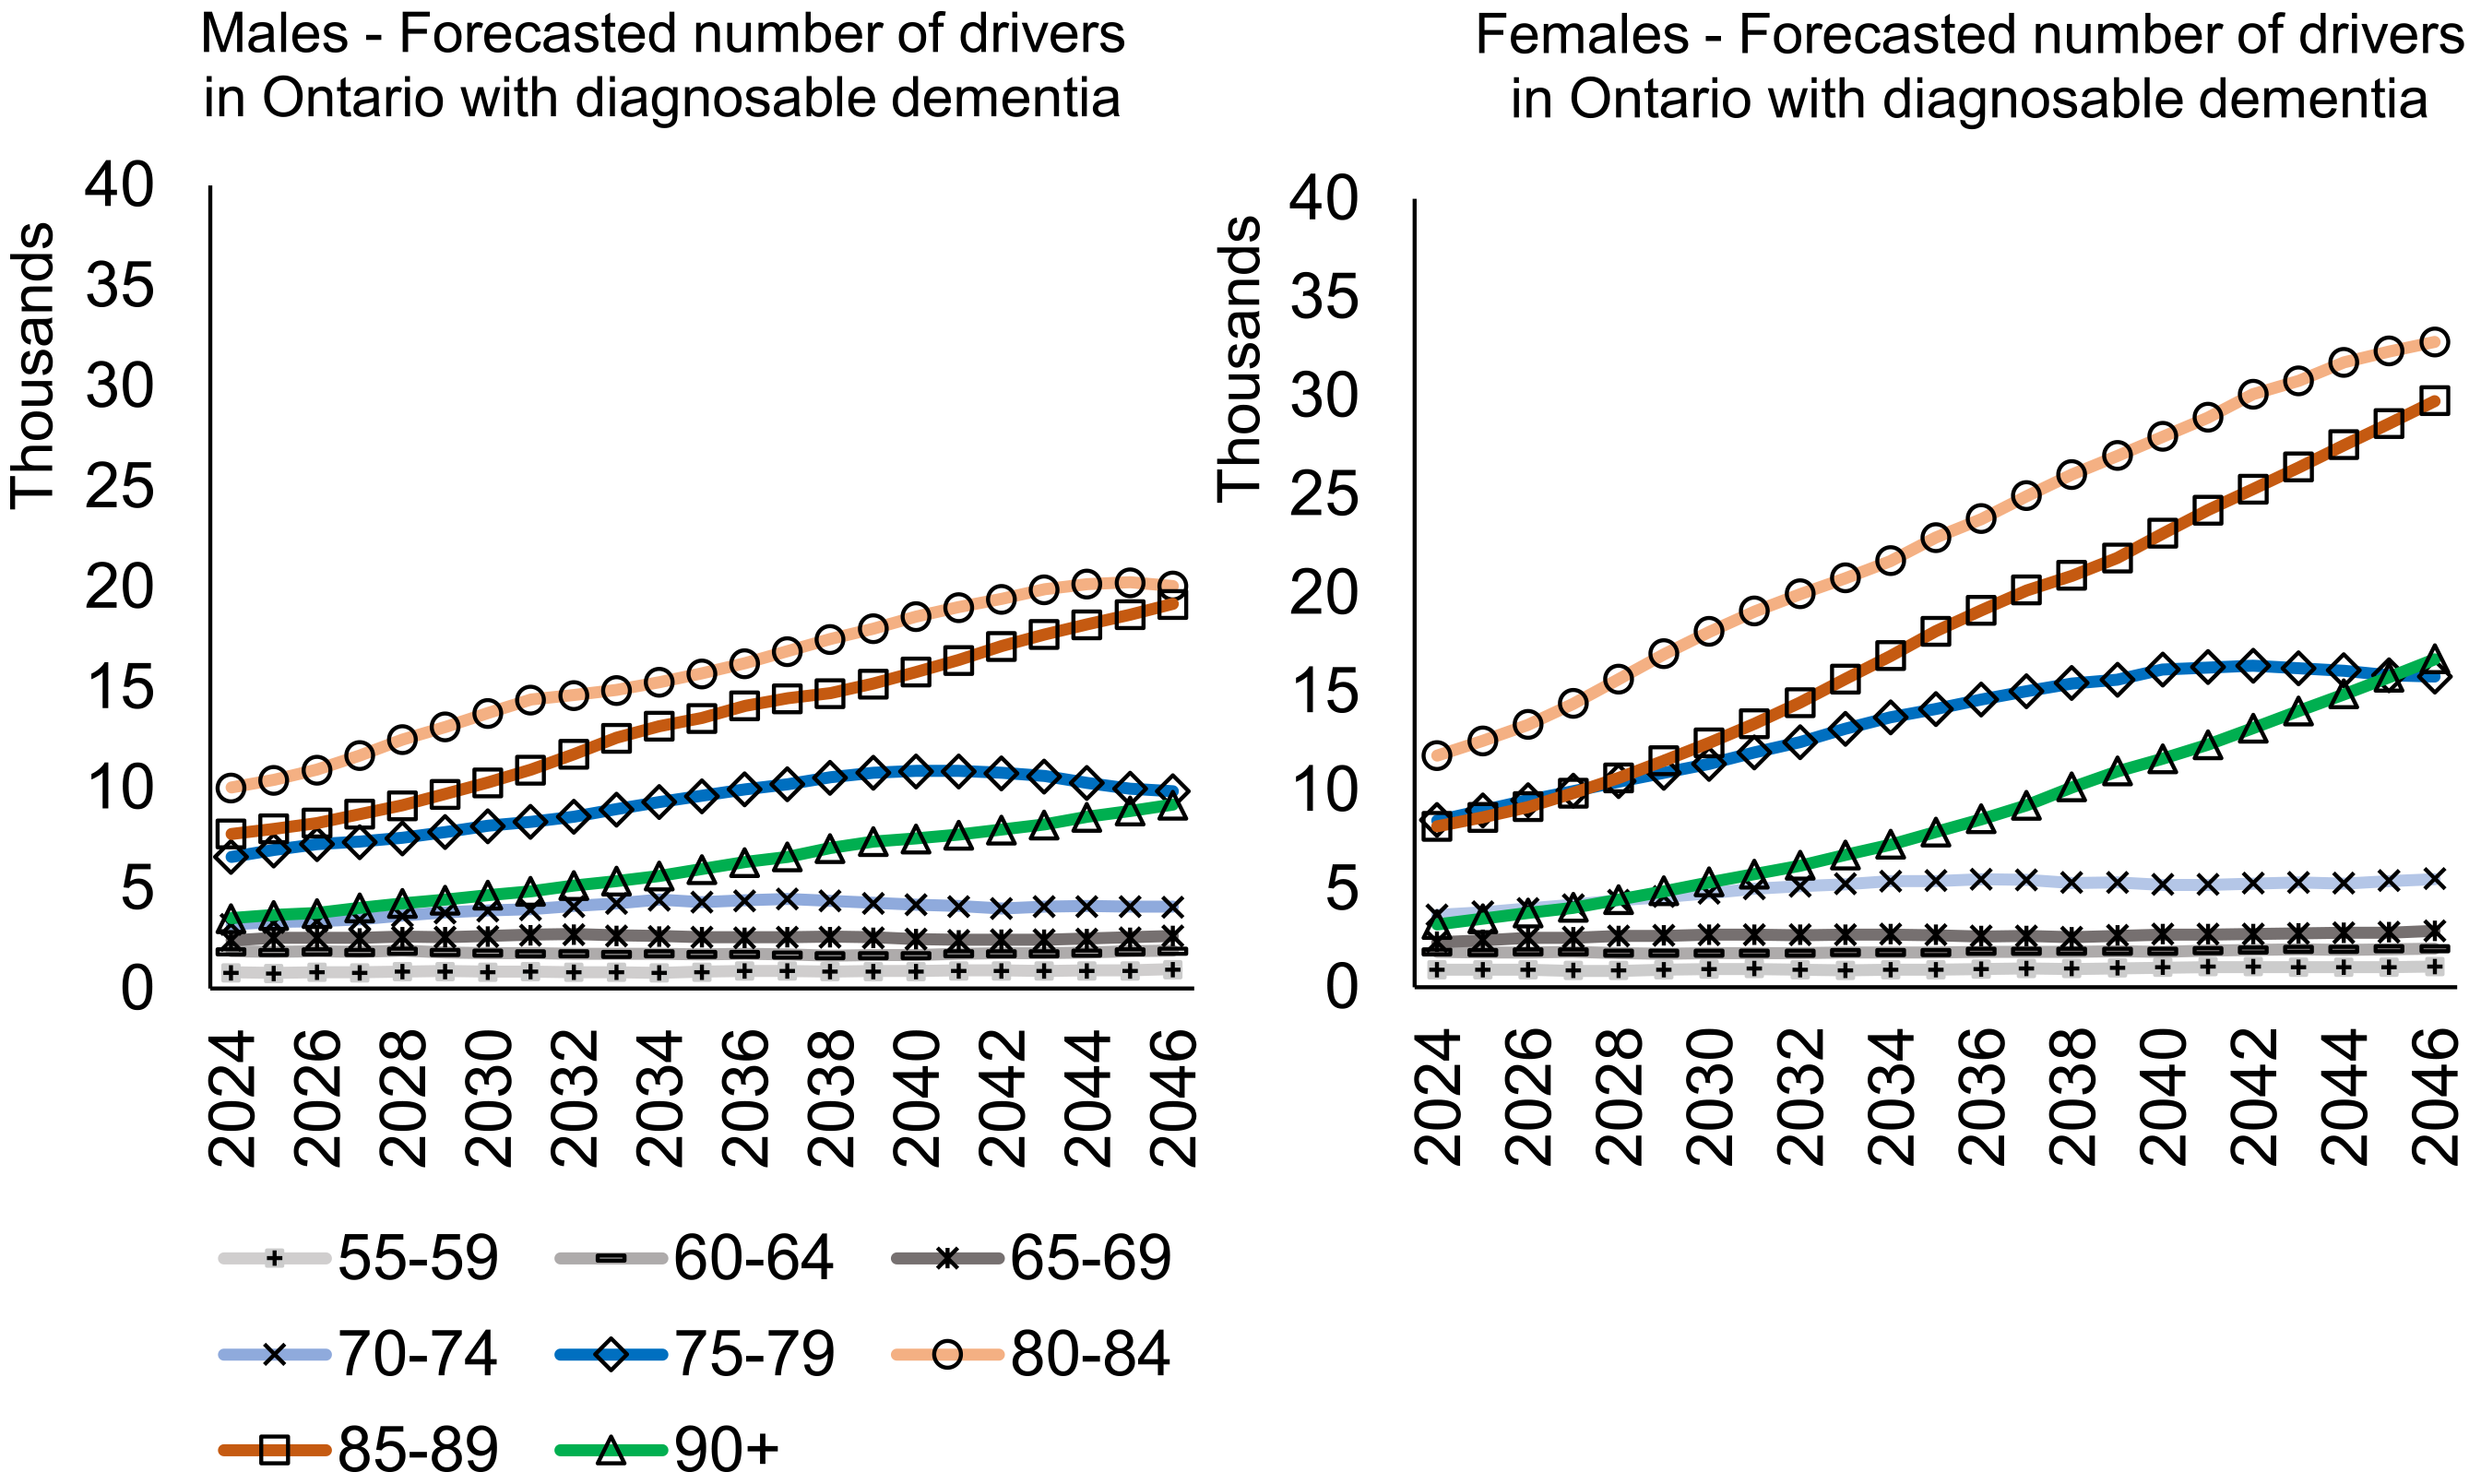
The number of licensed drivers with diagnosable dementia in the “best estimate” scenario, broken down by age and gender (left panel for males, right panel for females).
Discussion
Our study provides various estimates of the prevalence of drivers with diagnosable dementia on Ontario's roads now, with projections over the next 20 years, under various assumptions. In the most conservative assumption, in which all drivers with dementia stop driving within a year of symptom onset, approximately 50,000 drivers in 2024 will grow to approximately 113,000 in 2044. Our least conservative assumption in which people gradually stop driving as dementia progresses in a linear fashion, predicts that approximately 115,000 drivers in 2024 will grow to 255,000 drivers with diagnosable dementia by 2044. Since it is highly unlikely that either all drivers or no drivers become unlicensed immediately after symptoms onset, our intermediate “best estimate” assumptions probably provide a more realistic prediction. Assuming that about 35% of people with diagnosable dementia stop driving shortly after symptom onset, followed by a more gradual decline over time, and that females stop driving twice as fast as men, we forecast approximately 154,000 drivers with diagnosable dementia in 2046, up from approximately 69,000 in 2024. Most of the increases over time in driving with dementia are attributable to women in their 80s.
Forecasting of Ontario's licensed driver population revealed that the province will experience a notable increase in the number of licensed drivers ages 40 years and over, and this growth is particularly pronounced in the oldest driver (80 years and over) population. While these forecasts are simplistic, assuming a continuation of current trends in the proportion of the population of a given age and sex who will maintain a driver's license, they immediately raise some concern. The concern is chiefly that there will be an increasing numbers of drivers with deteriorating skills that contribute to a higher crash risk, 4 and at the same time, there will be many who will need to stop driving and face the negative health and social consequences of reduced mobility.7–9
In fact, our forecasts predict that the number of licensed drivers with diagnosable dementia ages 80 years and over will have the largest increase, compared to younger age groups. Drivers aged 80–89 years whether male or female, will remain the largest population of interest.
Our findings are surprisingly consistent with the only other study of dementia prevalence in the Ontario licensed driver population. 13 In that study, Hopkins et al. used licensed driver data and the community rate of dementia in the Ontario population to estimate the maximum number of drivers with dementia up to the year 2028, assuming that 75% of those drivers with dementia will continue driving. According to their forecasts, by 2028, there will be over 98,000 drivers aged 65 and over in Ontario with dementia. Although that estimate excluded drivers ages 40–64 and did not consider sex-specific differences in driving cessation, it compares well with our best estimate forecast for the number of drivers with diagnosable dementia in 2028, at 93,000.
The forecasts are especially concerning for females who may be at an even greater dementia risk than their male counterparts. 22 Our work and others have suggested that older women with dementia are more likely than older men with dementia to give up driving. 14 In the present study, we have documented that the historical gap in which far more men than women were licensed is narrowing, although interestingly the differential cessation rates by sex did not have a major impact on the projections.
At present, physicians are often reluctant to advise patients with cognitive impairment about driving and to report unsafe drivers to transportation authorities because of fears of damaging the physician-patient relationship.12,23,24 There is a critical need for the physician workforce grappling with growing numbers of older adults in the population to become comfortable with driving safety assessments. While it is important to avoid stigmatizing older drivers, as most remain safe, they have a higher prevalence of many chronic medical conditions including dementia that can significantly impact driving ability.25,26 It has been estimated that because of these medical conditions older adults living ages 70–74 years would have a life expectancy of 18 years for men and 21 years for women, but for both sexes an approximate driving life expectancy (years of active driving/licensure) of 11 years. 27
From a policy perspective, many older adults with medical conditions self-regulate their driving and thereby reduce their risk,28,29 although this is likely less common in those with dementia due to loss of insight about their cognitive impairment and the impact of dementia on driving. 30 Public education about this impact would help increase awareness of families and caregivers of important warning signs. 31 Transportation authorities can encourage self-reflection about driving safety at times of license renewal, and share the responsibility of driving cessation with those with dementia, their families and health care providers. 32 Further research is needed about whether older driver screening reduces bad driving outcomes without increasing pedestrian fatalities,33–35 and about the potential role of new and emerging technologies for driving, which may not be as helpful for those with cognitive impairment as for healthy older adults. 36 Moreover, more senior-friendly and dementia-friendly alternatives to the motor vehicle for transportation are required, 37 especially for those living in rural communities. 38
The strengths of this study are the use of up-to-date projections of population, licensure, and diagnosable dementia, as well as the incorporation of sex-specific and age-specific effects on these projections.
One important limitation of this work is the fact that not all of those licensed will be active drivers, although this is mitigated by the Ontario requirement of re-application for licensure every two years for adults aged 80 years and over. Secondly, in the Landmark Alzheimer's Association study, estimates were made using microsimulations of estimates of people who have developed symptoms of dementia, rather than diagnoses per se, 20 although the under-diagnosis of dementia in North America would lead to under-estimates of prevalence for our analysis. 39 Thirdly, there was limited literature (only two studies available to inform the driving survival curves,3,15 both were based on relatively small samples, and neither provided data broken down by sex and age. Hence for our forecasts of population, licensure, dementia and driving, we have a stacked set of approximations with accumulated uncertainty. Nonetheless, changing the immediate cessation proportion impacted the forecasts to a much lesser degree than the change in the proportion itself, i.e., a 29% change in immediate cessation (from 35% to 25%, or from 35% to 45%) leads to only a ∼13–15% change in the estimated total number of drivers with diagnosable dementia. This demonstrates that our original best estimate forecast, which assumes 35% immediate cessation, is somewhat insensitive to changes to this assumption. Fourth, a study of this nature cannot account for the full heterogeneity of dementia in terms of severity of cognitive impairment, presence of concomitant behavioral and psychological symptoms and medical comorbidities, and various etiologies. Finally, the forecasts in this study are derived from a single province in Canada, but since Ontario is Canada's most populous province, the results are likely relatively generalizable to large urban areas of North America and other high income countries.
Our study provides a novel set of projections for drivers with dementia over the coming decades, adding to the myriad of concerns about health and public services that will be needed to treat and support this population effectively and with dignity.
Supplemental Material
sj-docx-1-alz-10.1177_13872877251344873 - Supplemental material for Drivers with dementia: Forecasting the future
Supplemental material, sj-docx-1-alz-10.1177_13872877251344873 for Drivers with dementia: Forecasting the future by Mark Rapoport, Patrick A Byrne, Kim Pho and Gary Naglie in Journal of Alzheimer's Disease
Footnotes
Acknowledgements
The authors acknowledge the input of Dr Yoassry Elzohairy of the Ontario Ministry of Transportation, as well as Dr Josh Armstrong of Lakehead University for sharing data from the Landmark Study.
Author contributions
Ethical considerations
This research involved estimating and projecting the numbers of drivers with dementia based on publicly available data. Ethical approval was not required.
Funding
The author(s) disclosed receipt of the following financial support for the research, authorship, and/or publication of this article: Dr Rapoport receives salary support for research from Sunnybrook Psychiatrists. The authors received no financial support specifically for the research, authorship, and/or publication of this article.
Declaration of conflicting interests
The author(s) declared no potential conflicts of interest with respect to the research, authorship, and/or publication of this article.
Data availability statement
The data supporting the findings of this study are openly available at the links provided for references 15 and 16. The data from the Landmark Study were obtained from Dr Joshua Armstrong, the Principal Investigator of that study on behalf of the Alzheimer's Society of Canada.
Supplemental material
Supplemental material for this article is available online.
References
Supplementary Material
Please find the following supplemental material available below.
For Open Access articles published under a Creative Commons License, all supplemental material carries the same license as the article it is associated with.
For non-Open Access articles published, all supplemental material carries a non-exclusive license, and permission requests for re-use of supplemental material or any part of supplemental material shall be sent directly to the copyright owner as specified in the copyright notice associated with the article.