
Abstract
Background
Alzheimer's disease (AD), marked by progressive memory loss and cognitive decline, poses diagnostic challenges due to its multifactorial nature. Therefore, researchers are increasingly leveraging artificial intelligence and data-driven approaches to develop computerized clinical decision support systems (CCDSS), aiming to enhance early detection, improve treatment, and slow disease progression.
Objective
This study seeks to conduct a systematic review of the most recently developed AD-CCDSS, delving into their progress and the challenges to guide future development and implementation of CCDSS for AD-related decision-making and intervention strategies.
Methods
We follow the PRISMA 2020 guideline to search for articles published within the past seven years across PubMed, ScienceDirect, IEEE Xplore Digital Library, Web of Science, and Scopus, with Google Scholar as a supplementary source. Key components are then extracted from the selected studies for qualitative analysis, including data modalities, computational modeling approaches, system explainability and interpretability, research priorities, and graphical user interfaces designed for non-technical stakeholders.
Results
After searching and removing duplicates, we meticulously selected 55 studies. After reviewing key components of CCDSS, we highlight advancements and potential clinical applications, demonstrating their promise in enhancing decision support. However, despite growing attention to explainability in AD-CCDSS, its clinical applicability remains limited. Moreover, challenges such as multi-center system interoperability and data security remain underexplored, hindering real-world implementation.
Conclusions
This study analyzes recent translational AD-CCDSS, identifying key challenges in advancing CCDSS for clinical applications. It offers insights for researchers to enhance CCDSS development and facilitate their integration into clinical practice.
Keywords
Introduction
The World Alzheimer Report 2023 has presented that the number of people with Alzheimer's disease (AD) and the other types of dementia is projected to reach 139 million in 2050, which is 2.5 times higher than the figure in 2019. 1 Currently, over 55 million individuals worldwide are afflicted with dementia, with more than 60% of them residing in low- and middle- income countries. 2 Annually, approximately 10 million new cases emerge, highlighting the urgent need for comprehensive understanding and effective interventions to address this escalating public health concern. 2
AD is a neurodegenerative disorder and it is widely recognized as one of the most common forms of aging disease, accounting for 63% to 70%. 3 AD causes brain changes, including the accumulation of abnormal protein-amyloid and tau protein and neurocell degeneration. 4 Early symptoms are mainly reflected in memory loss, language barriers and thinking problems. 4 As the disease progresses, the degree of brain damage increases, resulting in memory loss and cognitive impairment, which negatively impact the patient's daily life and activities, bring a huge economic and mental burden to the family members or caregivers and may even lead to death. 5
AD has a long incubation period, making it difficult to detect at an early stage and thus impossible to carryout timely drug intervention. So far, no cure for the disease has been found, and its symptoms can only be alleviated by drugs. This may be because the occurrence and progression of the complex disease are affected by many potential factors. 6 Researchers in the area also recognize that early detection and intervention are essential for effective treatment. Mild cognitive impairment (MCI) is an early stage of AD, which is defined as a decline in cognitive ability with ageing. Mild injury in the brain is characterized by an impact on memory and executive function, which has less impact on daily life. Even when exhibiting more severe symptoms, it may not necessarily meet the diagnostic criteria for AD. 7 MCI can be classified into stable (sMCI) and progressive (pMCI) categories, in which sMCI will remain stable in the next few years, while pMCI will eventually evolve into AD. 8 The Alzheimer's Disease Neuroimaging Initiative (ADNI) divided MCI into early and late stages (i.e., EMCI and LMCI) 9 and some studies focus on distinguishing EMCI and LMCI for early detection of the disease.10,11 In addition, Csukly et al. 12 classified MCI into amnestic and non-amnestic types (i.e., aMCI and naMCI). It turns out that about 10%-15% of MCI patients worldwide are converted to AD every year.13,14 While the conversion rate from EMCI and LMCI to AD is 4.33% and 18.6%, respectively. 15 Hence early detection of MCI can support timely drug intervention to effectively slow down its progression into AD.
Given the challenges in diagnosing MCI in clinics, such as subtle differences in magnetic resonance imaging (MRI) images between MCI and the healthy controls (HC) that are hard to distinguish with the naked eyes, and the existence of numerous MCI subtypes making it difficult for clinicians to identify a specific subtype through a single test, 16 there is an increasing trend towards utilizing computer tools to assist doctors in detecting MCI. Significant research endeavors have been dedicated to construct the computerized clinical decision support systems (CCDSS), which can provide clinical diagnosis, disease prognosis, drug advice and warnings, and clinical guidelines to reduce the misdiagnosis made by the tired clinicians and reduce the workload of medical staff.17,18 CCDSS can also directly assist clinicians in developing personalized treatment plans that improve patients’ quality of life and slow the progression of the disease. 19 Meanwhile, since AD is a heterogeneous disease, the data's uncertainty, missingness, insufficiency, and multi-modality often bring difficulties to decision-making. 20 Therefore, developing CCDSS will be beneficial to translational medicine which impacts AD-related decision-making and intervention strategies.
Specifically, the knowledge-based CCDSS, which was conventional in the past, strictly follows the knowledge contained in the pre-built knowledge base. While the artificial intelligence (AI)-based CCDSS, which has been a research focus nowadays, needs a sufficient amount of data to learn rules and then make suggestions by using machine learning (ML) and statistical pattern recognition techniques.19,21 However, it is worth noting that deep learning (DL)-based CCDSS somehow limits their application due to the black box nature of DL. The produced results with limited explainability can't be fully evaluated and would not be accepted by the clinical community. Therefore, CCDSS does not only need to provide highly accurate and reliable decision-making support, but the process should be also reproducible, so that doctors can understand the results made by the system and can further provide an explanatory decision to diagnosing the diseases. 20 Interpretability is of utmost importance during the diagnostic phase, especially for CCDSS in the domain of AD, given its multi-factorial etiology and intricate nature.
Therefore, this comprehensive and systematic review addresses the following key research questions: What CCDSS have been developed by researchers for AD, and what methods have been employed for their modeling? Furthermore, how are these CCDSS used in the clinical management of AD, and what decision support can be provided to make clinical staff more trustworthy and convenient to use, so as to enhance the transformation potential of CCDSS?
The key contributions of this work are as follows:
Identification of research gap: The review identifies a gap in the existing literature by noting the limited coverage of updated comprehensive review articles specifically focusing on CCDSS in AD domain. Comprehensive summary of advancements: The review provides a comprehensive summary of recent advancements in CCDSS tailored for AD, offering a consolidated overview of the state-of-the-art technologies and methodologies. Comparison of functional models: A significant contribution lies in the comparison of performance, applicable scenarios, and clinical interpretability among different functional models used in CCDSS developed over the last seven years. This comparative analysis helps in understanding the strengths and limitations of various approaches applied. Focus on clinical interface design: An interactive graphical user interface (GUI) introduces a transformative pathway, equipping stakeholders with the means to initiate the evolution of CCDSS. Hence, a user-friendly GUI-based CCDSS should be accessible not only to IT but also to non-IT stakeholders who can comprehend and utilize it effectively.
The rest of the paper is structured as follows. The Methods section presents the method of screening the relative research articles. Then, the Results detail the screening results and reviews the spotted CCDSS in the perspectives of data modalities, feature extraction and feature selection, data modelling approaches and their performance comparison, as well as system explainability and model interpretability, followed by the GUI design. Finally, in the Discussion, the challenges of implementing CCDSS in clinical settings and the potential solutions, as well as the limitations of this study and potential extensions are discussed.
Methods
Search strategy
The purpose of this review is to provide an overview of studies that meet the following criteria: (1) focused on AD dementia; (2) used AI technology; (3) used AI technology to model CCDSS; (4) focused on AD diagnosis and prognosis. Hence, we create the following four keyword groups (KGs), each related to different aspects of the review scope.
KG1: Keywords related to disease: Alzheimer' s disease, Alzheimer, dementia, mild cognitive impairment, cognitive disorder, cognitive decline. KG2: Keywords related to AI methodology: artificial intelligence, machine learning, deep learning, computer reasoning. KG3: Keywords related to application: clinical decision support system, CDSS, computer-assisted, computer-aided, expert system. KG4: Keywords related to task of applying AI: prognosis, diagnosis, classification, prediction.
For the purpose of covering this study, we search the following prominent scholarly databases: (1) PubMed; (2) IEEE Xplore Digital Library; (3) Web of Science; (4) ScienceDirect; and (5) Scopus. In order to comprehensively search the relevant literature, Google Scholar is also used as a supplement tool for searching. From the above databases, we search the title, abstract, and keyword sections of articles. The initial search is conducted in December 2022, encompassing studies published within the preceding five years. Due to the extended review process, articles from 2023 and 2024 are subsequently supplemented. To limit the search to the review scope, we use a combination of 4 KGs in each online database. Table 1 lists the search query used in the PubMed database, for example.
The example search query from PubMed.
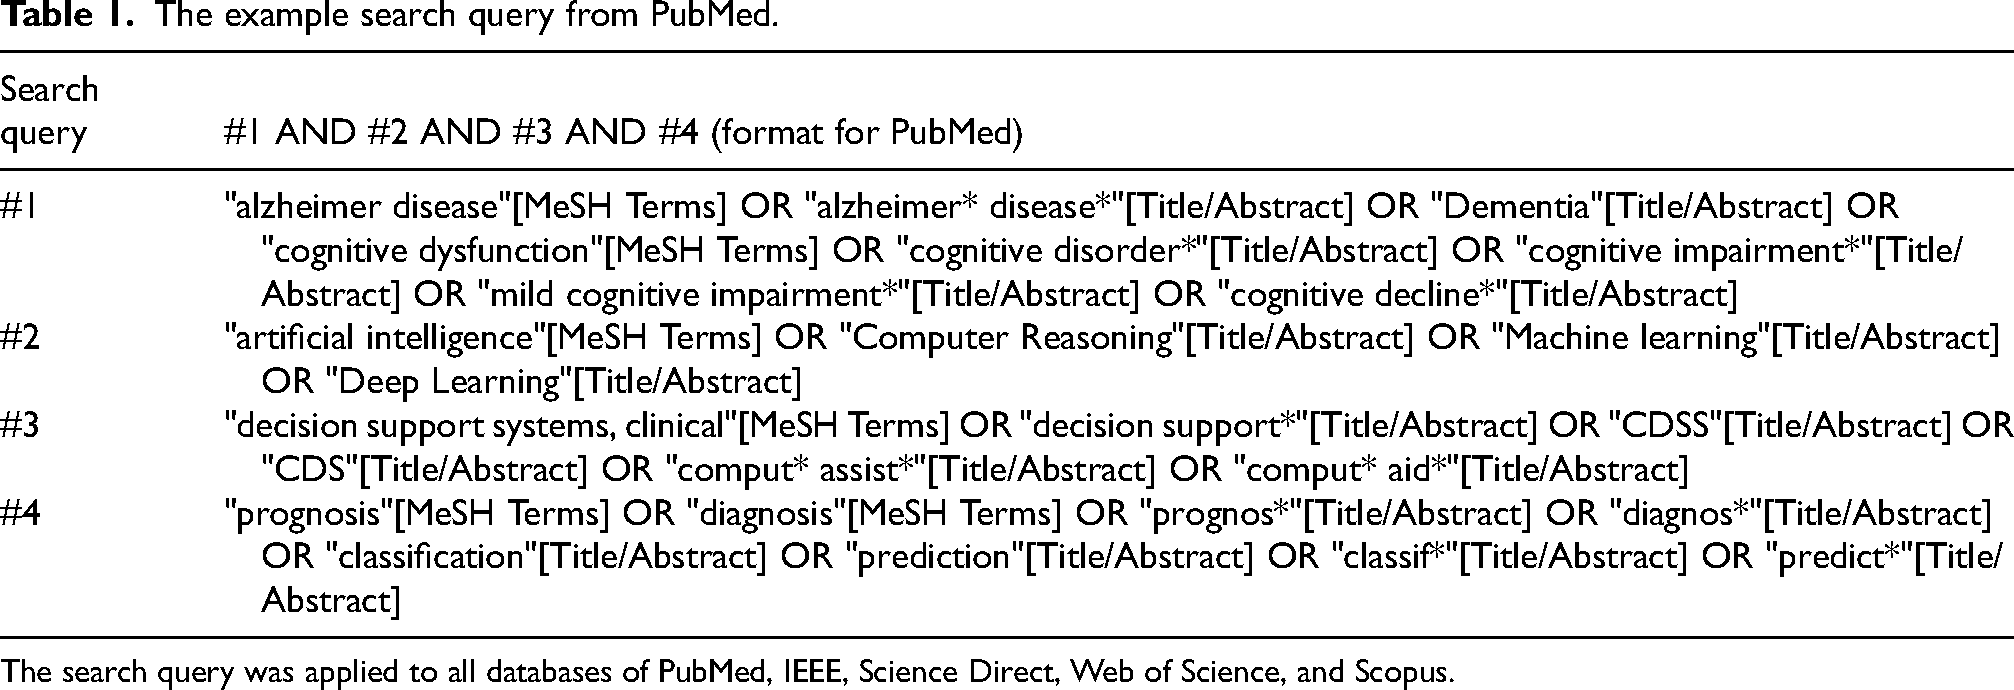
The search query was applied to all databases of PubMed, IEEE, Science Direct, Web of Science, and Scopus.
Eligibility criteria
Inclusion criteria:
Study Type: Articles with a target population of patients who underwent AD or MCI are considered. Language: Articles written in English are considered. Intervention & Exposure: Articles that apply AI algorithms to build a CCDSS are included. Participant: Articles that include journal papers and scientific reports. Outcome: Studies that include the detailed measure indicators which aim to implement CCDSS to improve AD management.
Exclusion criteria:
Study Type: Any articles on dementia that do not use AI technology or not provide specific software. Participant: Survey papers, book chapters, and manuscripts are not included in the study. Language: Any article written in a language other than English. Intervention & Exposure: Articles that do not apply AI algorithms to design a CCDSS as the main intervention for AD management are excluded. Outcome: Studies that fail to clearly report performance metrics of CCDSS. Duplicate: Exclude duplicate publications or multiple reports of the same study to avoid double-counting of data.
By strictly applying these inclusion and exclusion criteria at every stage of the review process, this study ensures comprehensiveness, transparency, and reproducibility, thereby enhancing the reliability and validity of the research findings.
Data collection
We calculate the following summary statistics from the final set of included articles: (1) publication year; (2) research focus; (3) modality and accessibility of data set; (4) features extraction and selection process; (5) AI model for modeling problem; (6) performance indicator (e.g., area under the receiver operating characteristic curve (AUC), whole accuracy (ACC), sensitivity, and specificity etc); (7) model explainability and interpretability; and (8) the GUI design of the CCDSS.
Through the detailed and comprehensive statistical data above, we can evaluate the performance of different CCDSS in practical applications more deeply and precisely, as well as the significant differences of heterogeneous modalities in constructing CCDSS. These differences are reflected not only in the technical performance and effect, but also in its adaptability and stability in different medical scenarios. Moreover, with the interpretability of CCDSS, we can obtain different pathological features, covering aspects like the disease's occurrence mechanism, development trend and possible complications. This provides doctors additional information to understand the patient's condition, judge it more accurately and formulate better treatment plans, improving medical service quality and efficiency and bringing better treatment effects and hopes to patients.
Study assessment process
The search results are imported into Endnote X9 to remove duplicate items. One reviewer (R_A) independently screens the titles and abstracts of each article to determine whether it meets the inclusion and exclusion criteria. If there is uncertainty about whether to include a particular article, a second reviewer (R_B) will make the determination. Similarly, R_A independently reviews the full text of each included article to determine whether it meets the inclusion criteria. If there is uncertainty about whether to include a particular article, R_B will review the full text to decide whether to include it in the review. Then, R_A independently uses the data collection form developed by the first author to extract all relevant data from the included articles. If there are any questions, R_A and R_B will discuss to address them out.
Results
Searching result
Using a structured workflow that we designed in line with PRISMA 2020 (Figure 1), 1698 records are screened across five databases based on pre-defined search criteria, with an additional 49 records retrieved from Google Scholar. EndNote X9 identifies and removes 282 duplicate entries. After reviewing the titles and abstracts, 477 articles are shortlisted, of which 13 are unavailable. Each paper is thoroughly evaluated against inclusion and exclusion criteria. Ultimately, 55 studies are selected for the final analysis, considering factors such as study type, intervention, exposure characteristics, and quality assessment.
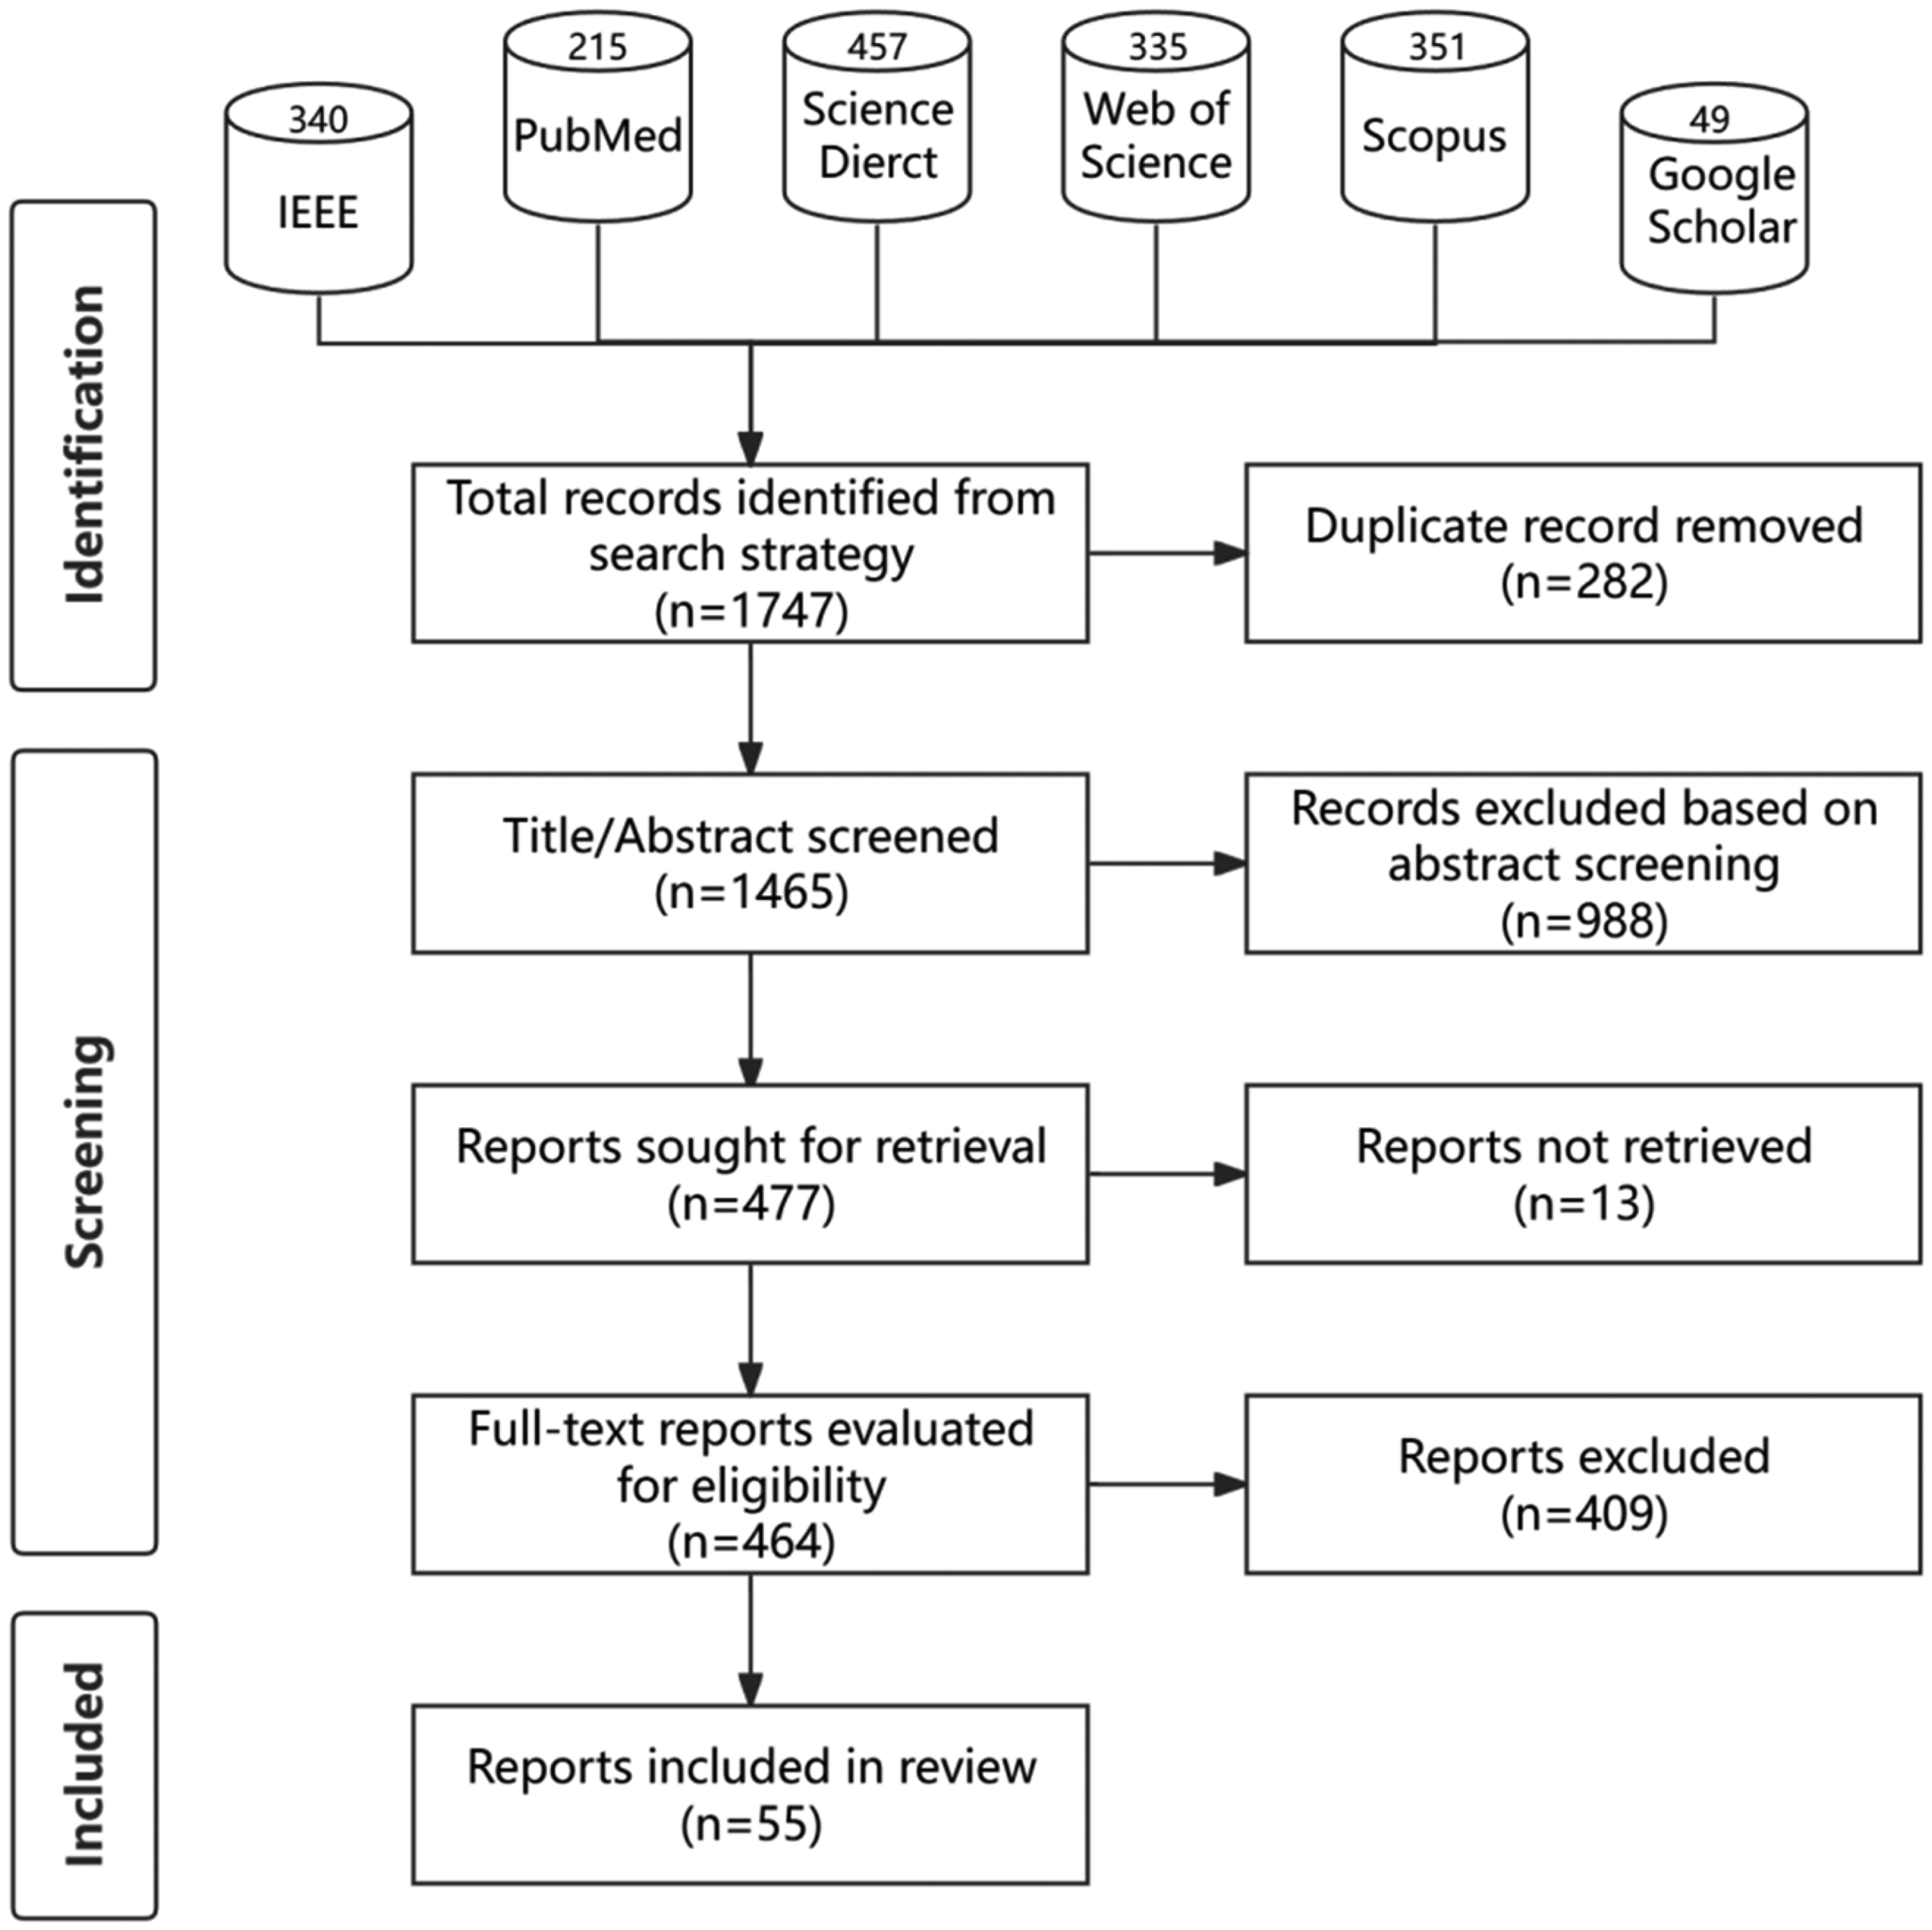
PRISMA (Preferred Reporting Items for Systematic Reviews and Meta-Analyses) 2020 flow diagram for systematic review outlining the number of studies identified and excluded at each stage. Note: Google Scholar is a supplement search tool.
Furthermore, the trending analysis shown in Figure 2 summarizes the number of the selected research articles published each year during 2018 and 2024, revealing the gradually increased focus on the AD-related CCDSS study.
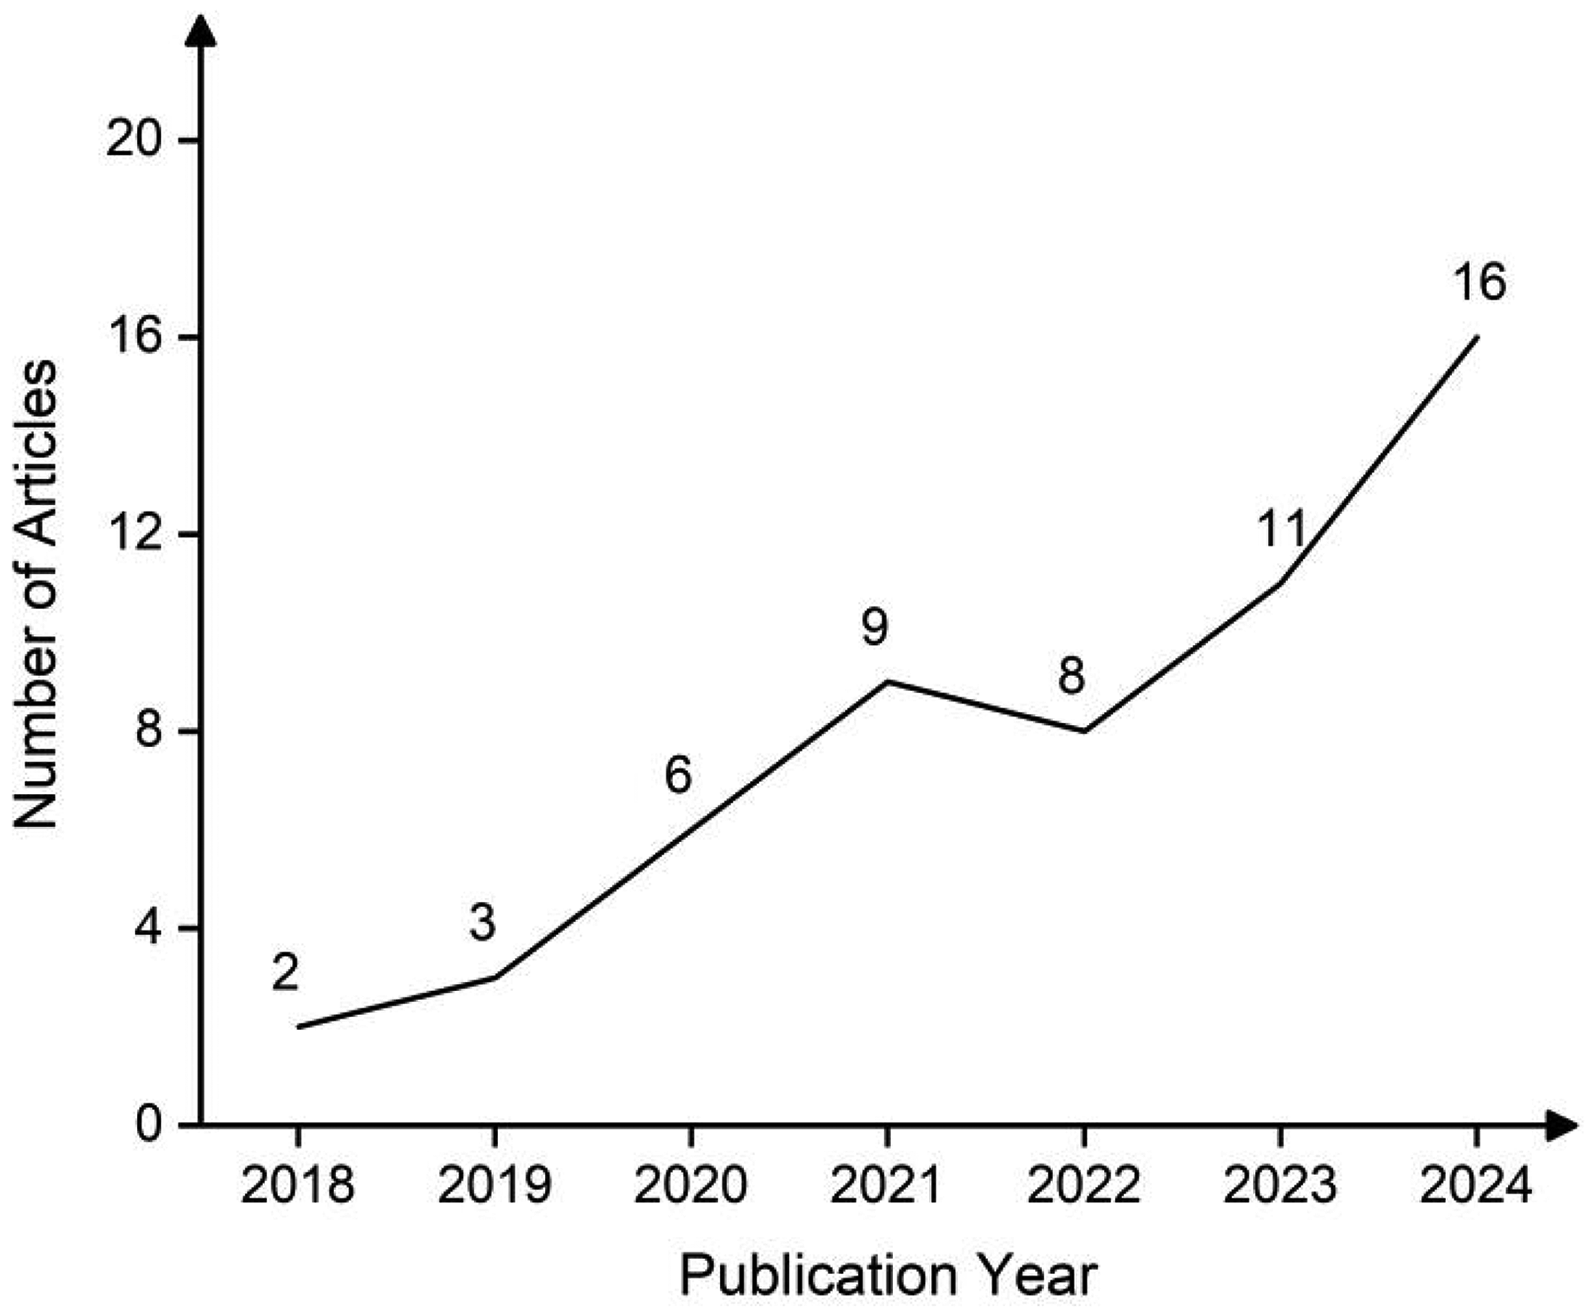
Number of articles included per year (2018–2024).
Data sources and data modalities
Since AD is a multimodal brain injury, gaining accurate detection should take into account various factors, such as cognitive assessment scores, neurophysiological indicators, symptoms, demographic statistics, and medical records. 22 In the clinical environment, cognitive assessments such as the Mini-Mental State Examination (MMSE) and Montreal Cognitive Assessment (MoCA) are commonly used to evaluate the probability of a patient having cognitive dysfunction. 23 For patients with uncertain cognitive impairment staging, further examinations are required, such as utilizing MRI scans to identify early-stage changes in the hippocampus and entorhinal cortex associated with AD or employing positron emission tomography (PET) for the identification of liquid biomarkers.24,25 The comprehensive use of multiple modalities helps to find small variations in each modality from the beginning stage and to obtain reliable diagnostic results. However, the accurate and timely diagnosis of AD continues to pose challenges for clinical staff due to multiple factors: first of all, they are not professional in dealing with a large number of complex numerical data and biomarker types; secondly, they can hardly prognose such small behavioral changes before the symptoms of AD patients present evidently. Therefore, there is an urgent need of building up CCDSS using AI techniques for advanced AD detection and prediction models to help clinicians diagnose and/or prognose the disease earlier and more accurately.
Currently, there are many publicly available datasets that integrate multimodal data in the field of dementia research, which provides valuable resources for researchers to deepen their understanding of the pathogenesis, diagnosis, and treatment strategies of dementia. Table 2 shows the description of certain publicly available databases for dementia research.
The brief description of commonly used publicly available databases for dementia research.
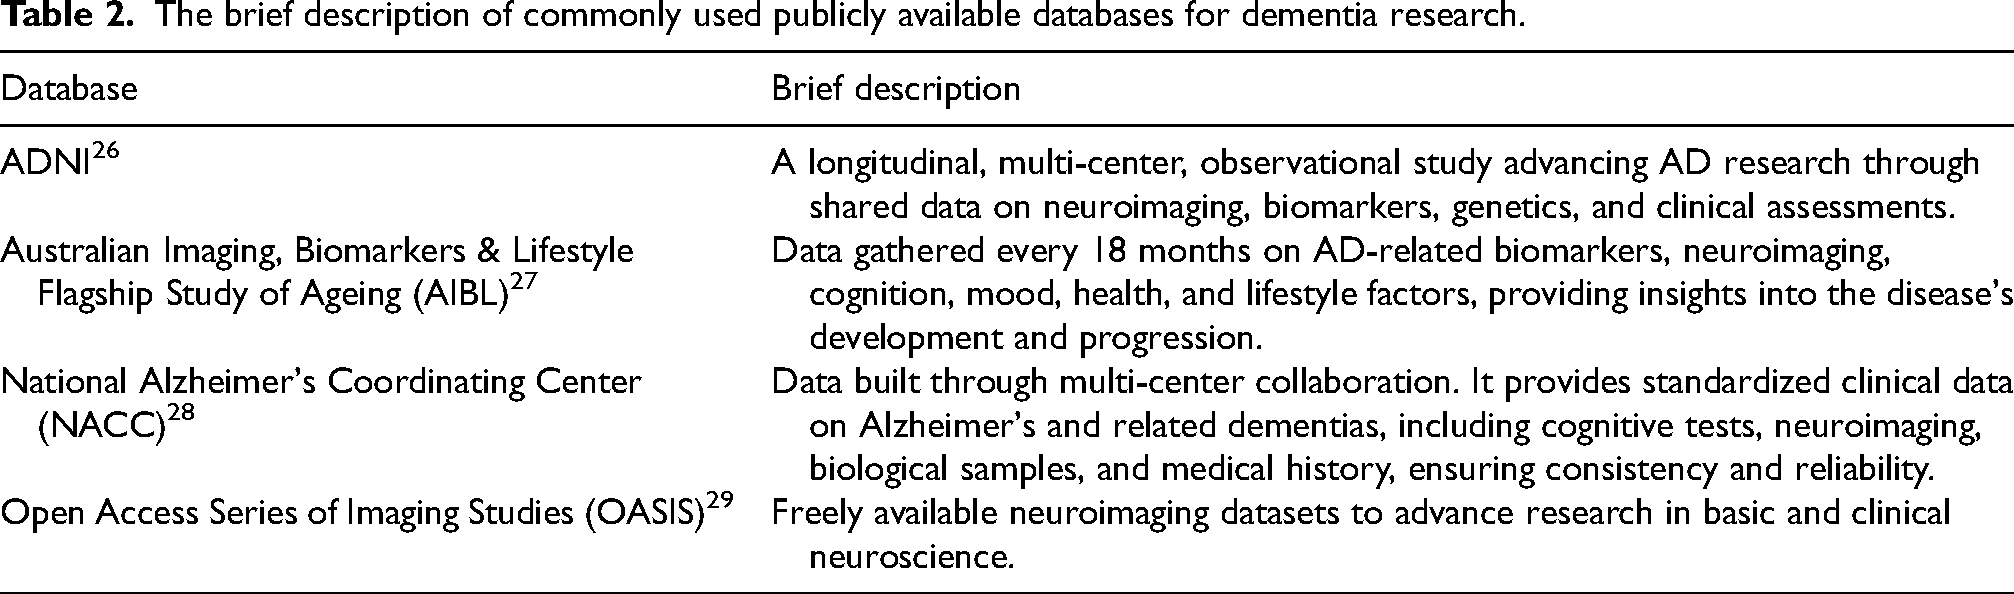
As illustrated in Figure 3(A), various ADNI protocols (ADNI-1, ADNI-2, ADNI-GO, and ADNI-3) represent the most frequently utilized public dataset among the included studies (33 studies), followed by AIBL with 9 studies. The majority of studies rely on datasets obtained from hospitals, institutions, and companies, while a subset recruits participants independently. Notably, only 29.1% of the studies utilizes multiple datasets for their experiments, as shown in Figure 3(B). Relying on a single dataset can introduce bias into the evaluation process, potentially compromising the accuracy and reliability of study results. This limitation arises because a single dataset often lacks diversity, representativeness, and comprehensive sample coverage, making it insufficient to fully and objectively reflect the real-world characteristics of the research subject.
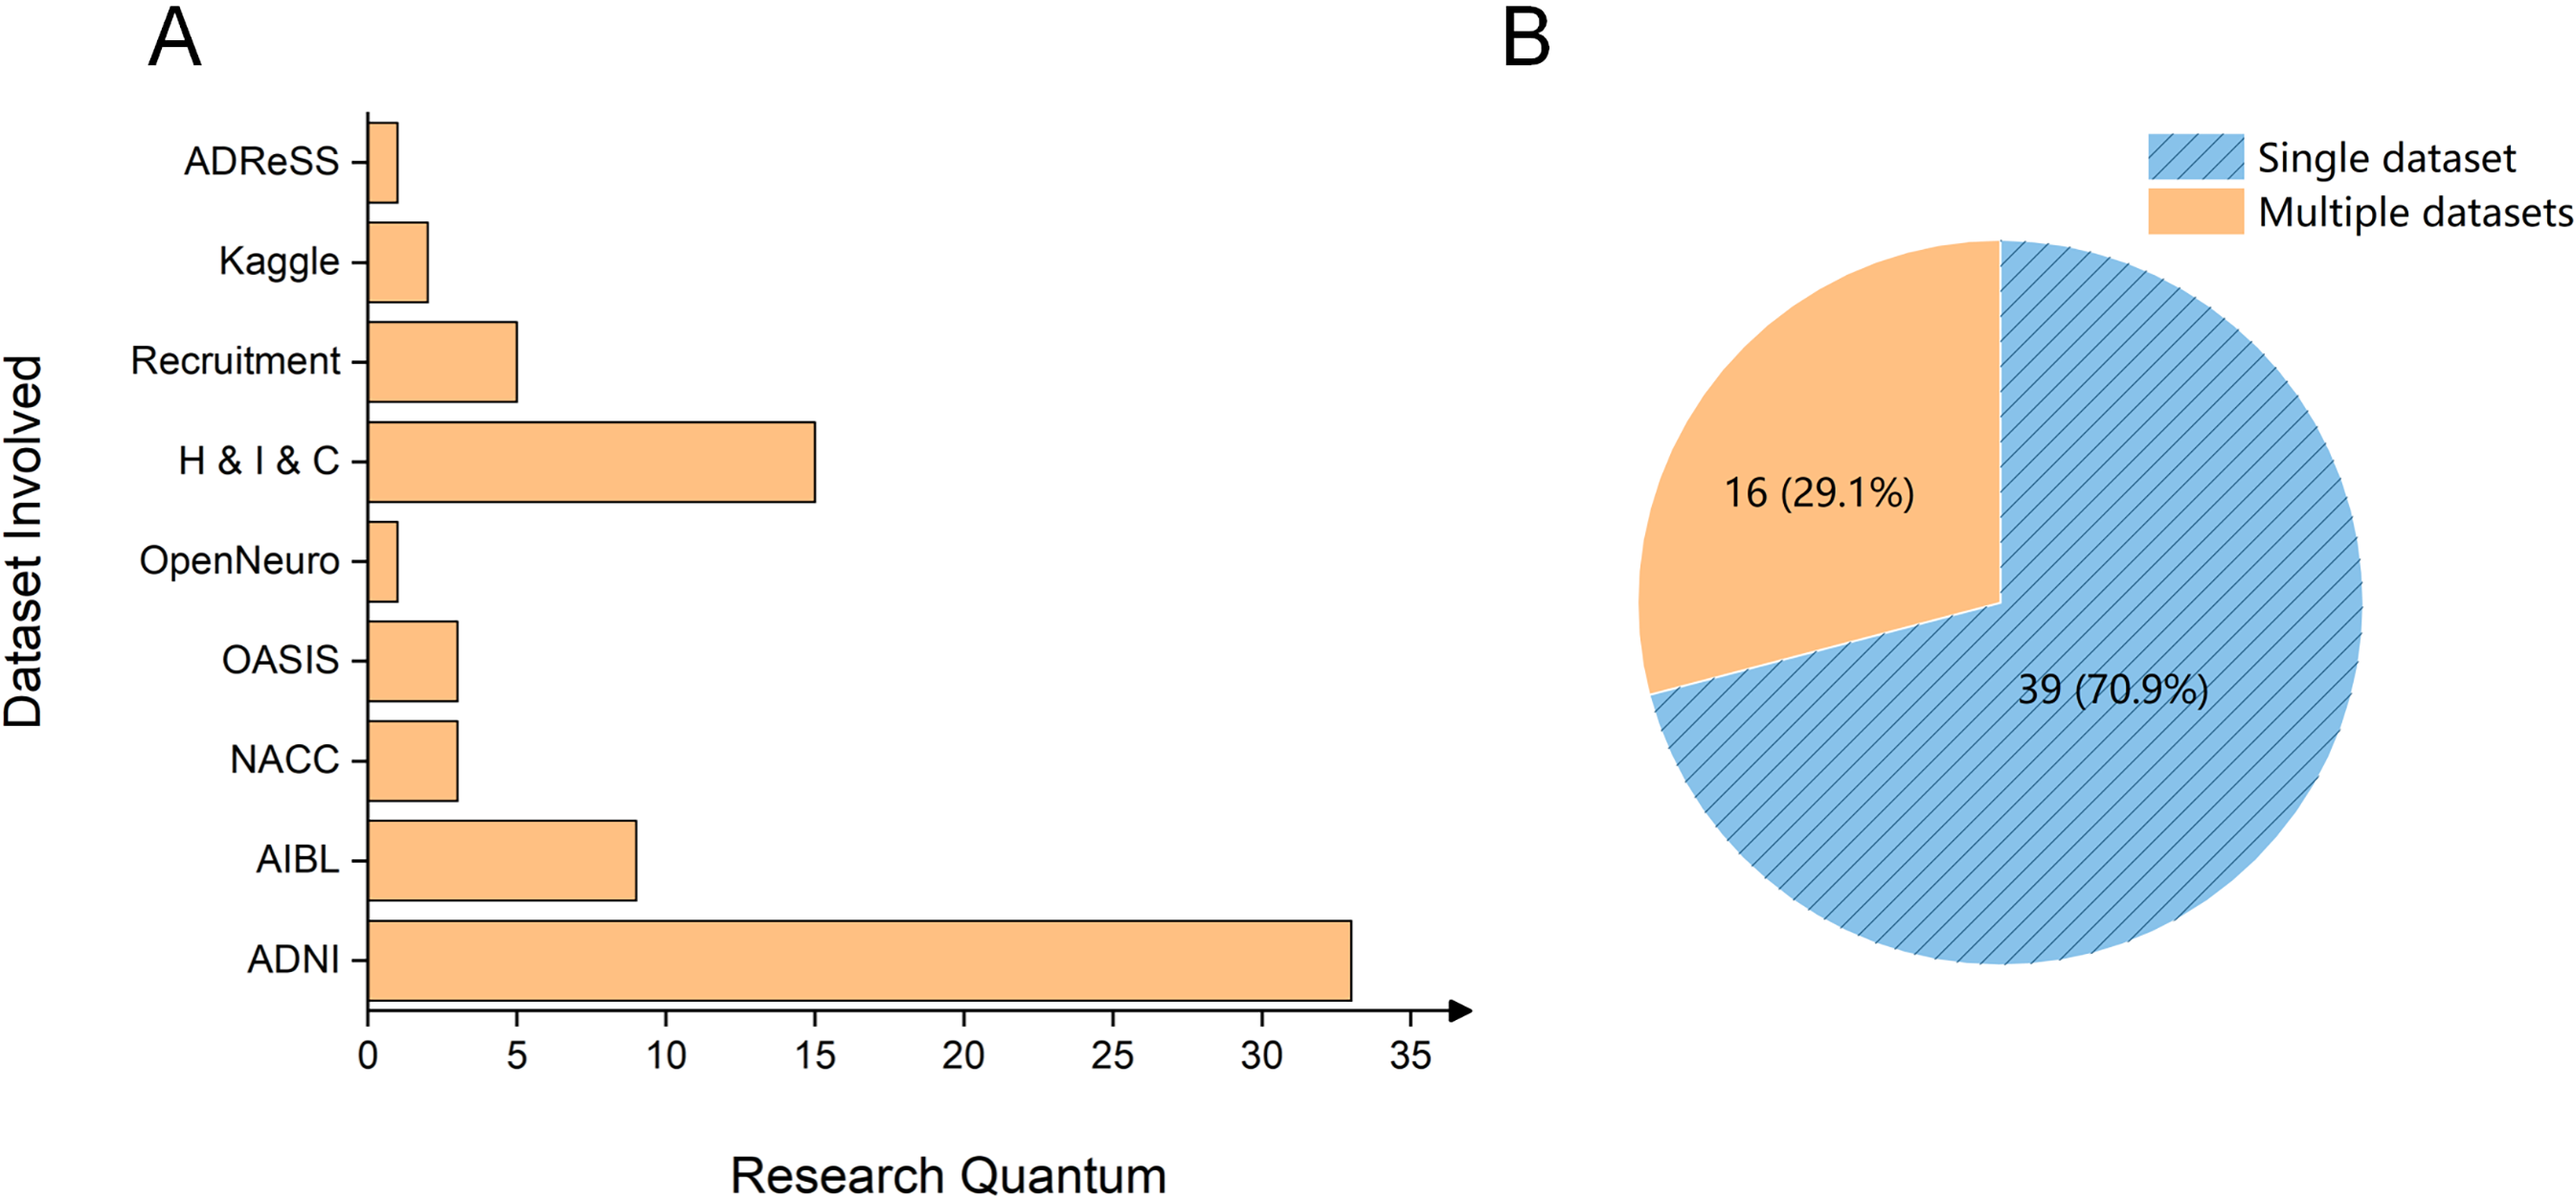
Statistics of databsets in 55 studies. (A) Distribution of included studies using the diverse datasets. (B) Proportion of studies utilizing single versus multiple datasets. H & I & C: Hospital & Institute & Company.
Exploring what kind of data is adopted for modeling in the research is of great significance for in-depth understanding of the study. The data employed to build CCDSS typically consists of multiple modalities, including both imaging and non-imaging data, because the diagnosis of such heterogeneous diseases normally depends on more than one single marker. This is illustrated in the donut chart in Figure 4(A), where 65.45% of the articles utilize multimodal data, with 25.45% incorporating both imaging and non-imaging data. Studies using single-modal non-imaging data and multimodal neuroimaging data account for the lowest proportions, at 12.73% and 10.91%, respectively. Notably, studies based solely on single-modal neuroimaging data account for 21.82%, ranking third among the included papers. This indicates that a significant portion of research still prioritizes single-modality imaging, likely because AI models (especially those using DL techniques) perform well with image data, leading to promising results. Similarly, Figure 4(B) illustrates the distribution of data modalities used in the included studies, with neuroimaging (e.g., MRI, PET, and electroencephalography (EEG)) being the most commonly used, followed by cognitive function assessments (CFA) and demographic data. This highlights that neuroimaging, CFA, and demographics provide valuable information to support doctors in AD diagnosis and treatment. Detailed description of the data used in 55 studies can be found in Table 3.
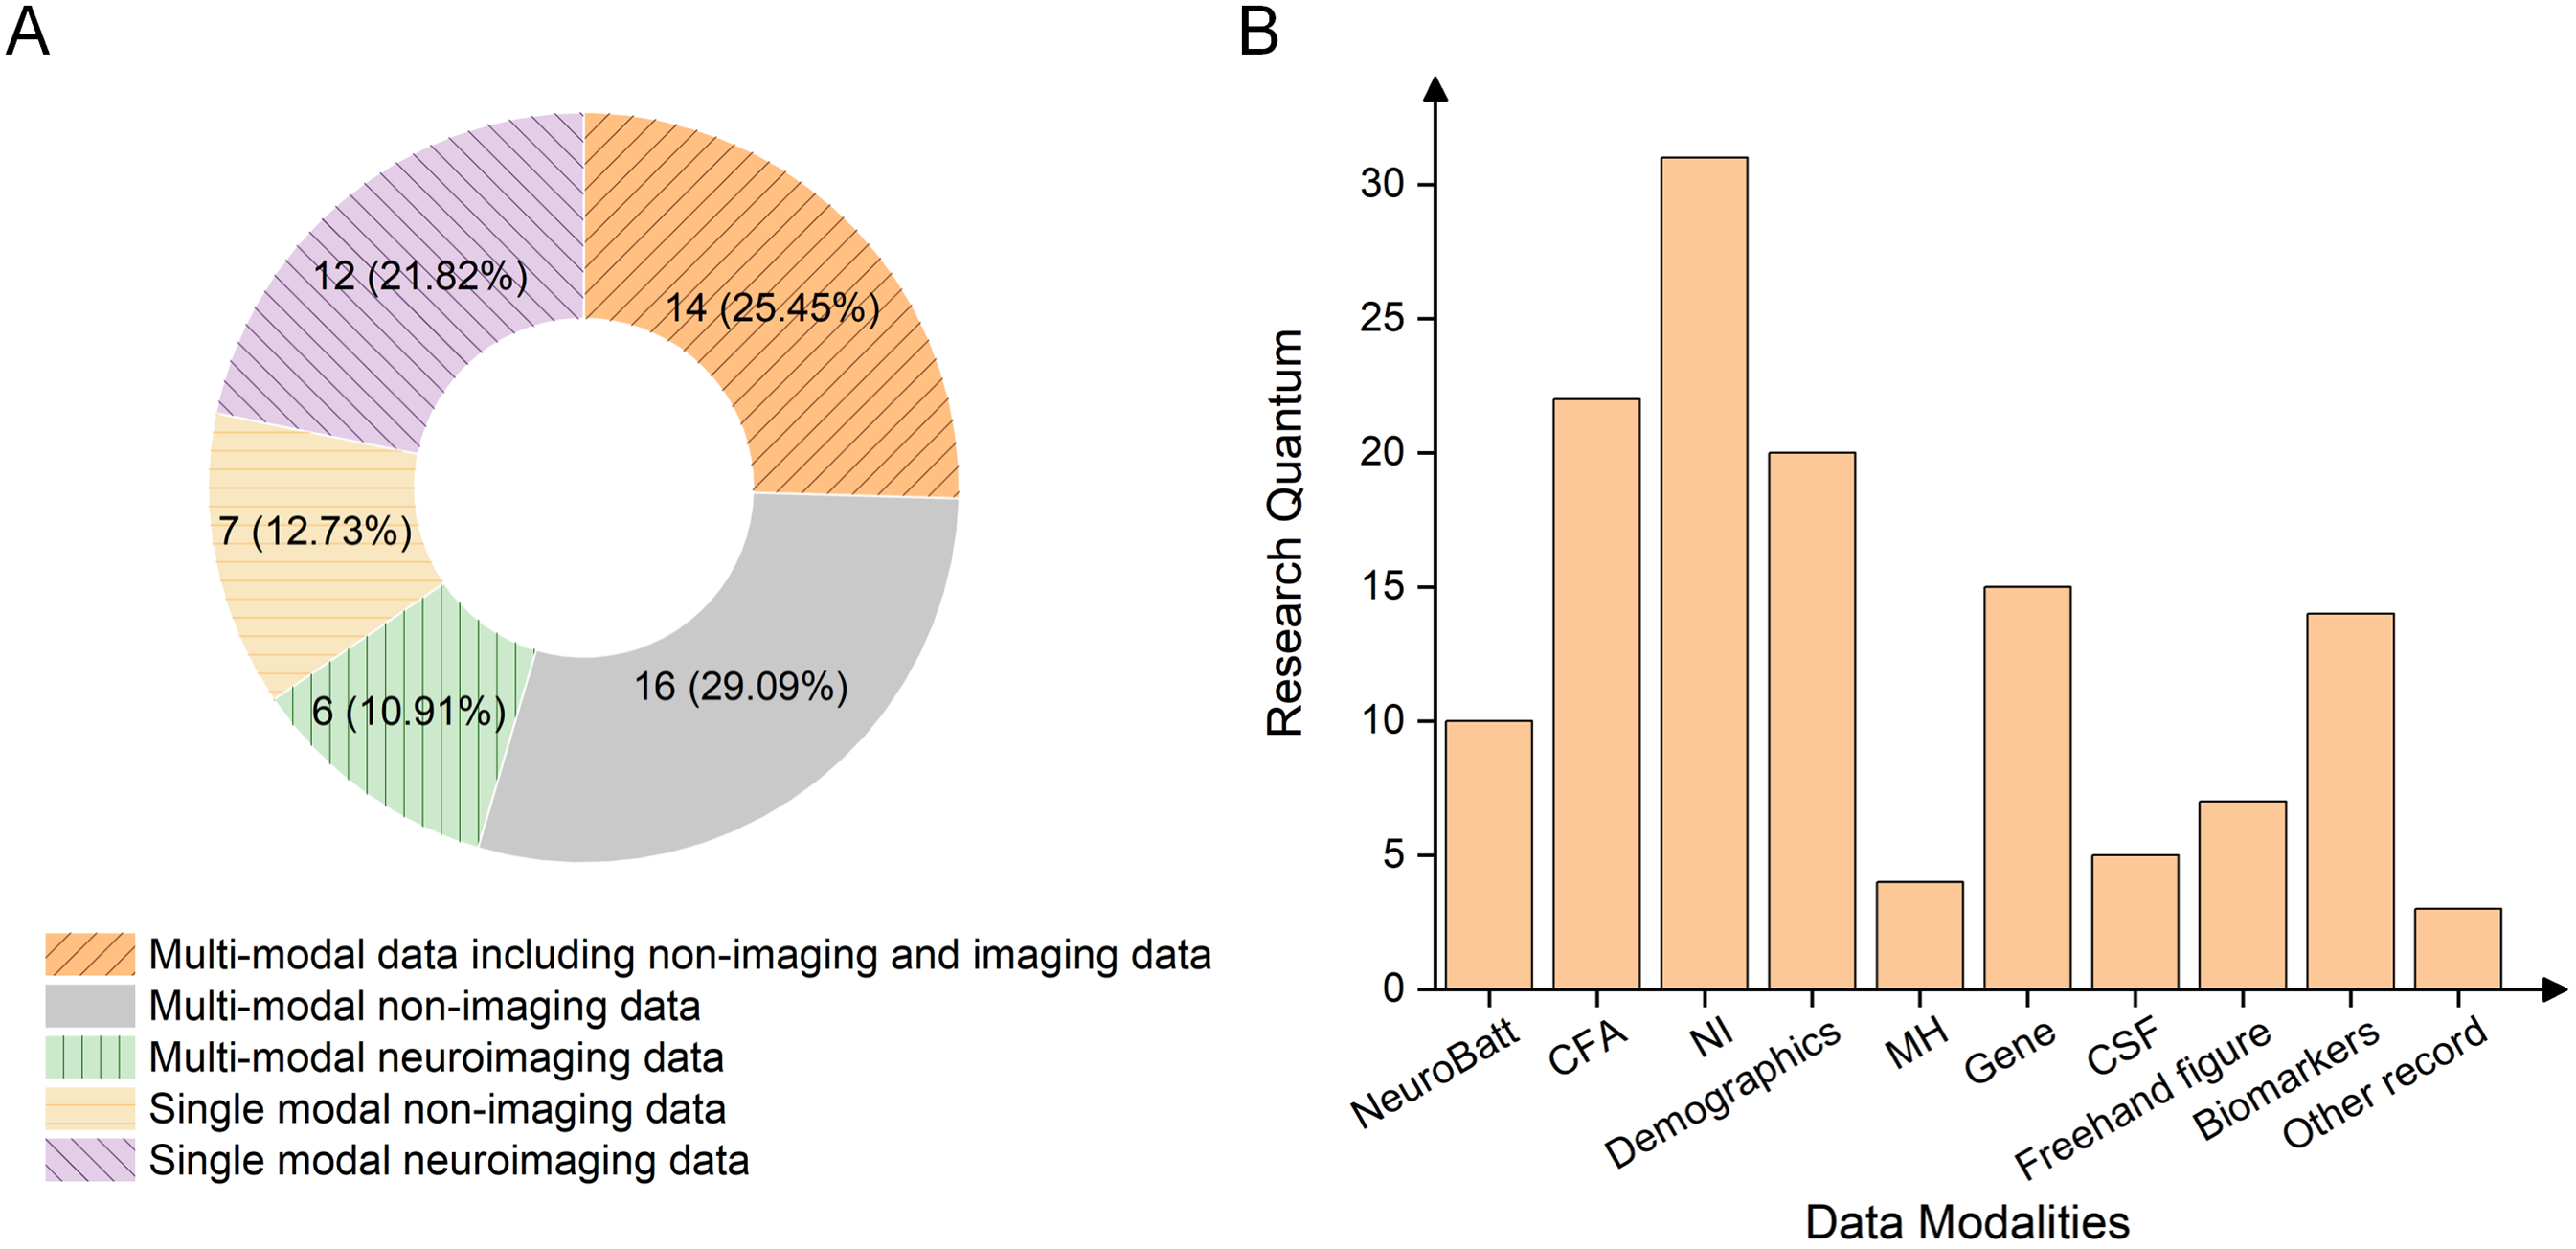
Statistics of data modality. (A) The proportions of the research articles using multi- or single- modal data. (B) The distribution of data modality usage. NeuroBatt: neuropsychological battery; CFA: cognitive function assessments; NI: neuroimaging; MH: medical history; Freehand figure: e.g., Archimedes spiral figure, Rey Osterrieth complex figure and other figure drawing test; Biomarkers: blood-biomarkers and neuroimaging-extracted biomarkers; other record: additional data type used.
Detailed description of the data used in the 55 CCDSS development.
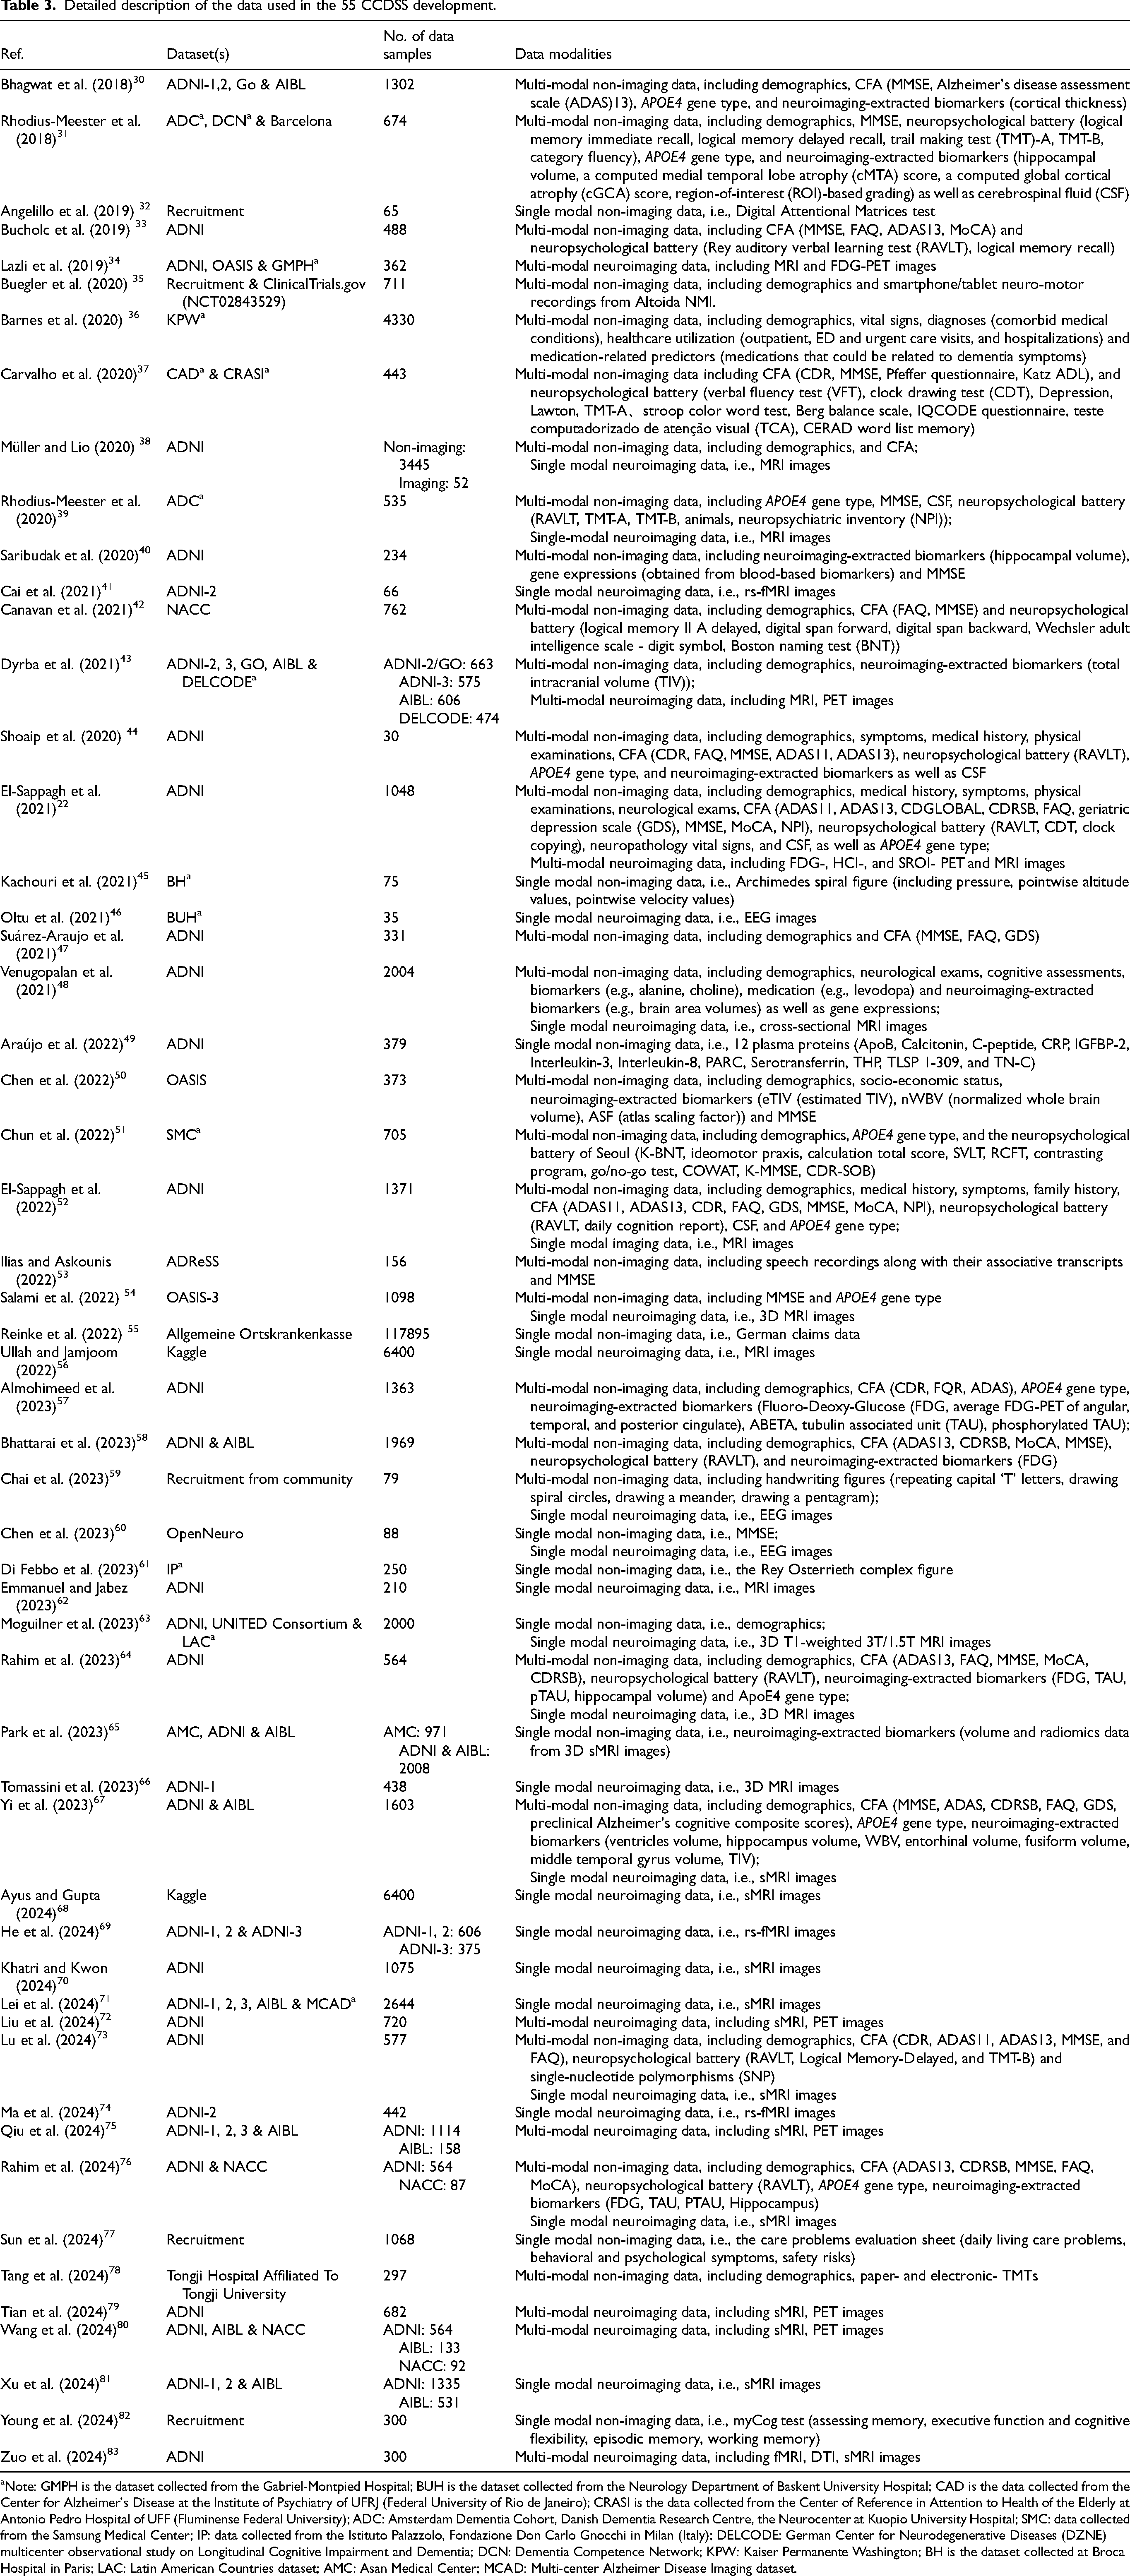
Note: GMPH is the dataset collected from the Gabriel-Montpied Hospital; BUH is the dataset collected from the Neurology Department of Baskent University Hospital; CAD is the data collected from the Center for Alzheimer's Disease at the Institute of Psychiatry of UFRJ (Federal University of Rio de Janeiro); CRASI is the data collected from the Center of Reference in Attention to Health of the Elderly at Antonio Pedro Hospital of UFF (Fluminense Federal University); ADC: Amsterdam Dementia Cohort, Danish Dementia Research Centre, the Neurocenter at Kuopio University Hospital; SMC: data collected from the Samsung Medical Center; IP: data collected from the Istituto Palazzolo, Fondazione Don Carlo Gnocchi in Milan (Italy); DELCODE: German Center for Neurodegenerative Diseases (DZNE) multicenter observational study on Longitudinal Cognitive Impairment and Dementia; DCN: Dementia Competence Network; KPW: Kaiser Permanente Washington; BH is the dataset collected at Broca Hospital in Paris; LAC: Latin American Countries dataset; AMC: Asan Medical Center; MCAD: Multi-center Alzheimer Disease Imaging dataset.
The goal of the CCDSS development
The most CCDSS in AD is developed for diagnosis assistance, particularly focusing on the binary classification of AD versus HC, resulting in an accuracy rate of around 95%.84–86 A study in 2015 reported that the highest accuracy rate for multiple classifications of AD versus MCI versus HC is 63%, with AUC of 78.8%. 87 In recent years, the development based on DL achieved 97.5% accuracy in the multi-class classification of HC versus MCI versus AD. 88 Another common task of the CCDSS focuses on prognosis, predicting the conversion rate or accurately predicting the year/month of the conversion from MCI to AD patients over a period of time.
Therefore, we classify the purposes of CCDSS into three categories: diagnosis, prognosis (e.g., disease progression or risk prediction), and recommendations (e.g., care or medication). As shown in Figure 5, diagnosis is the primary focus of most studies, accounting for 77.2%, followed by prognosis (15.8%) and recommendations (7%). Among these, two studies address both diagnosis and prognosis to provide additional support, helping doctors develop more comprehensive treatment and care plans.22,52 Of the 44 diagnostic studies, 75.6% employs binary classification (represented by the green ring filled with downward pattern in Figure 5), while 24.4% involves multi-class classification (represented by the green ring filled with upward pattern in Figure 5). This suggests that binary classification remains the dominant approach in the field. The reason may be due to the relatively strong performance of binary classification in dementia diagnosis, making it a preferred choice for researchers.
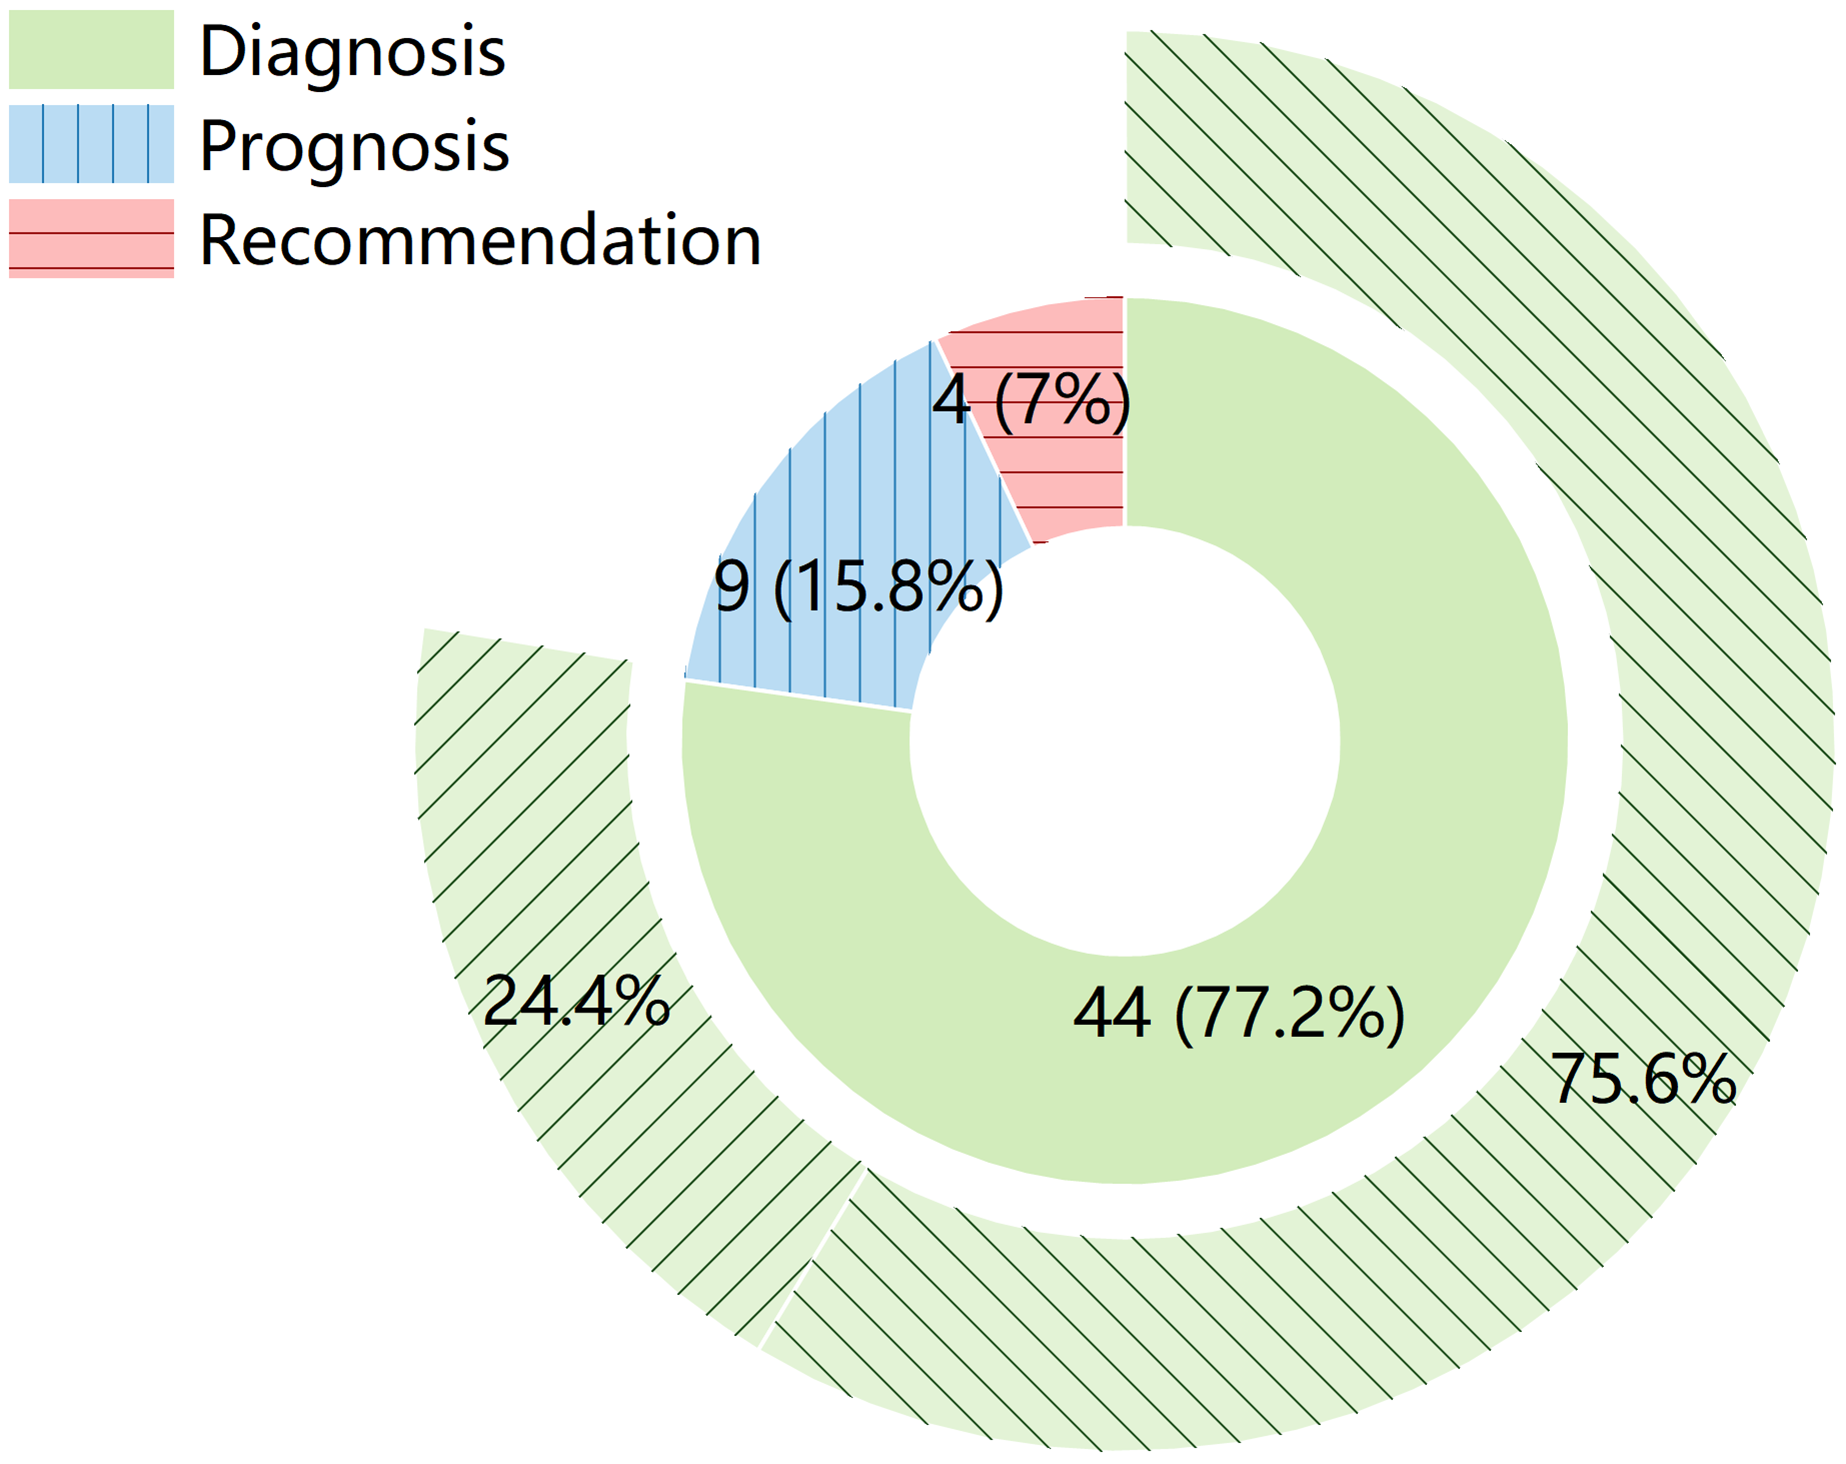
Distribution of CCDSS purposes in the included studies. The inner ring represents the proportion of the three categories (diagnosis in green, prognosis in blue with vertical stripes, and recommendations in pink with horizontal stripes), while the outer ring shows the distribution between binary (filled with downward pattern) and multi-class (filled with upward pattern) classification within the 44 studies on diagnosis.
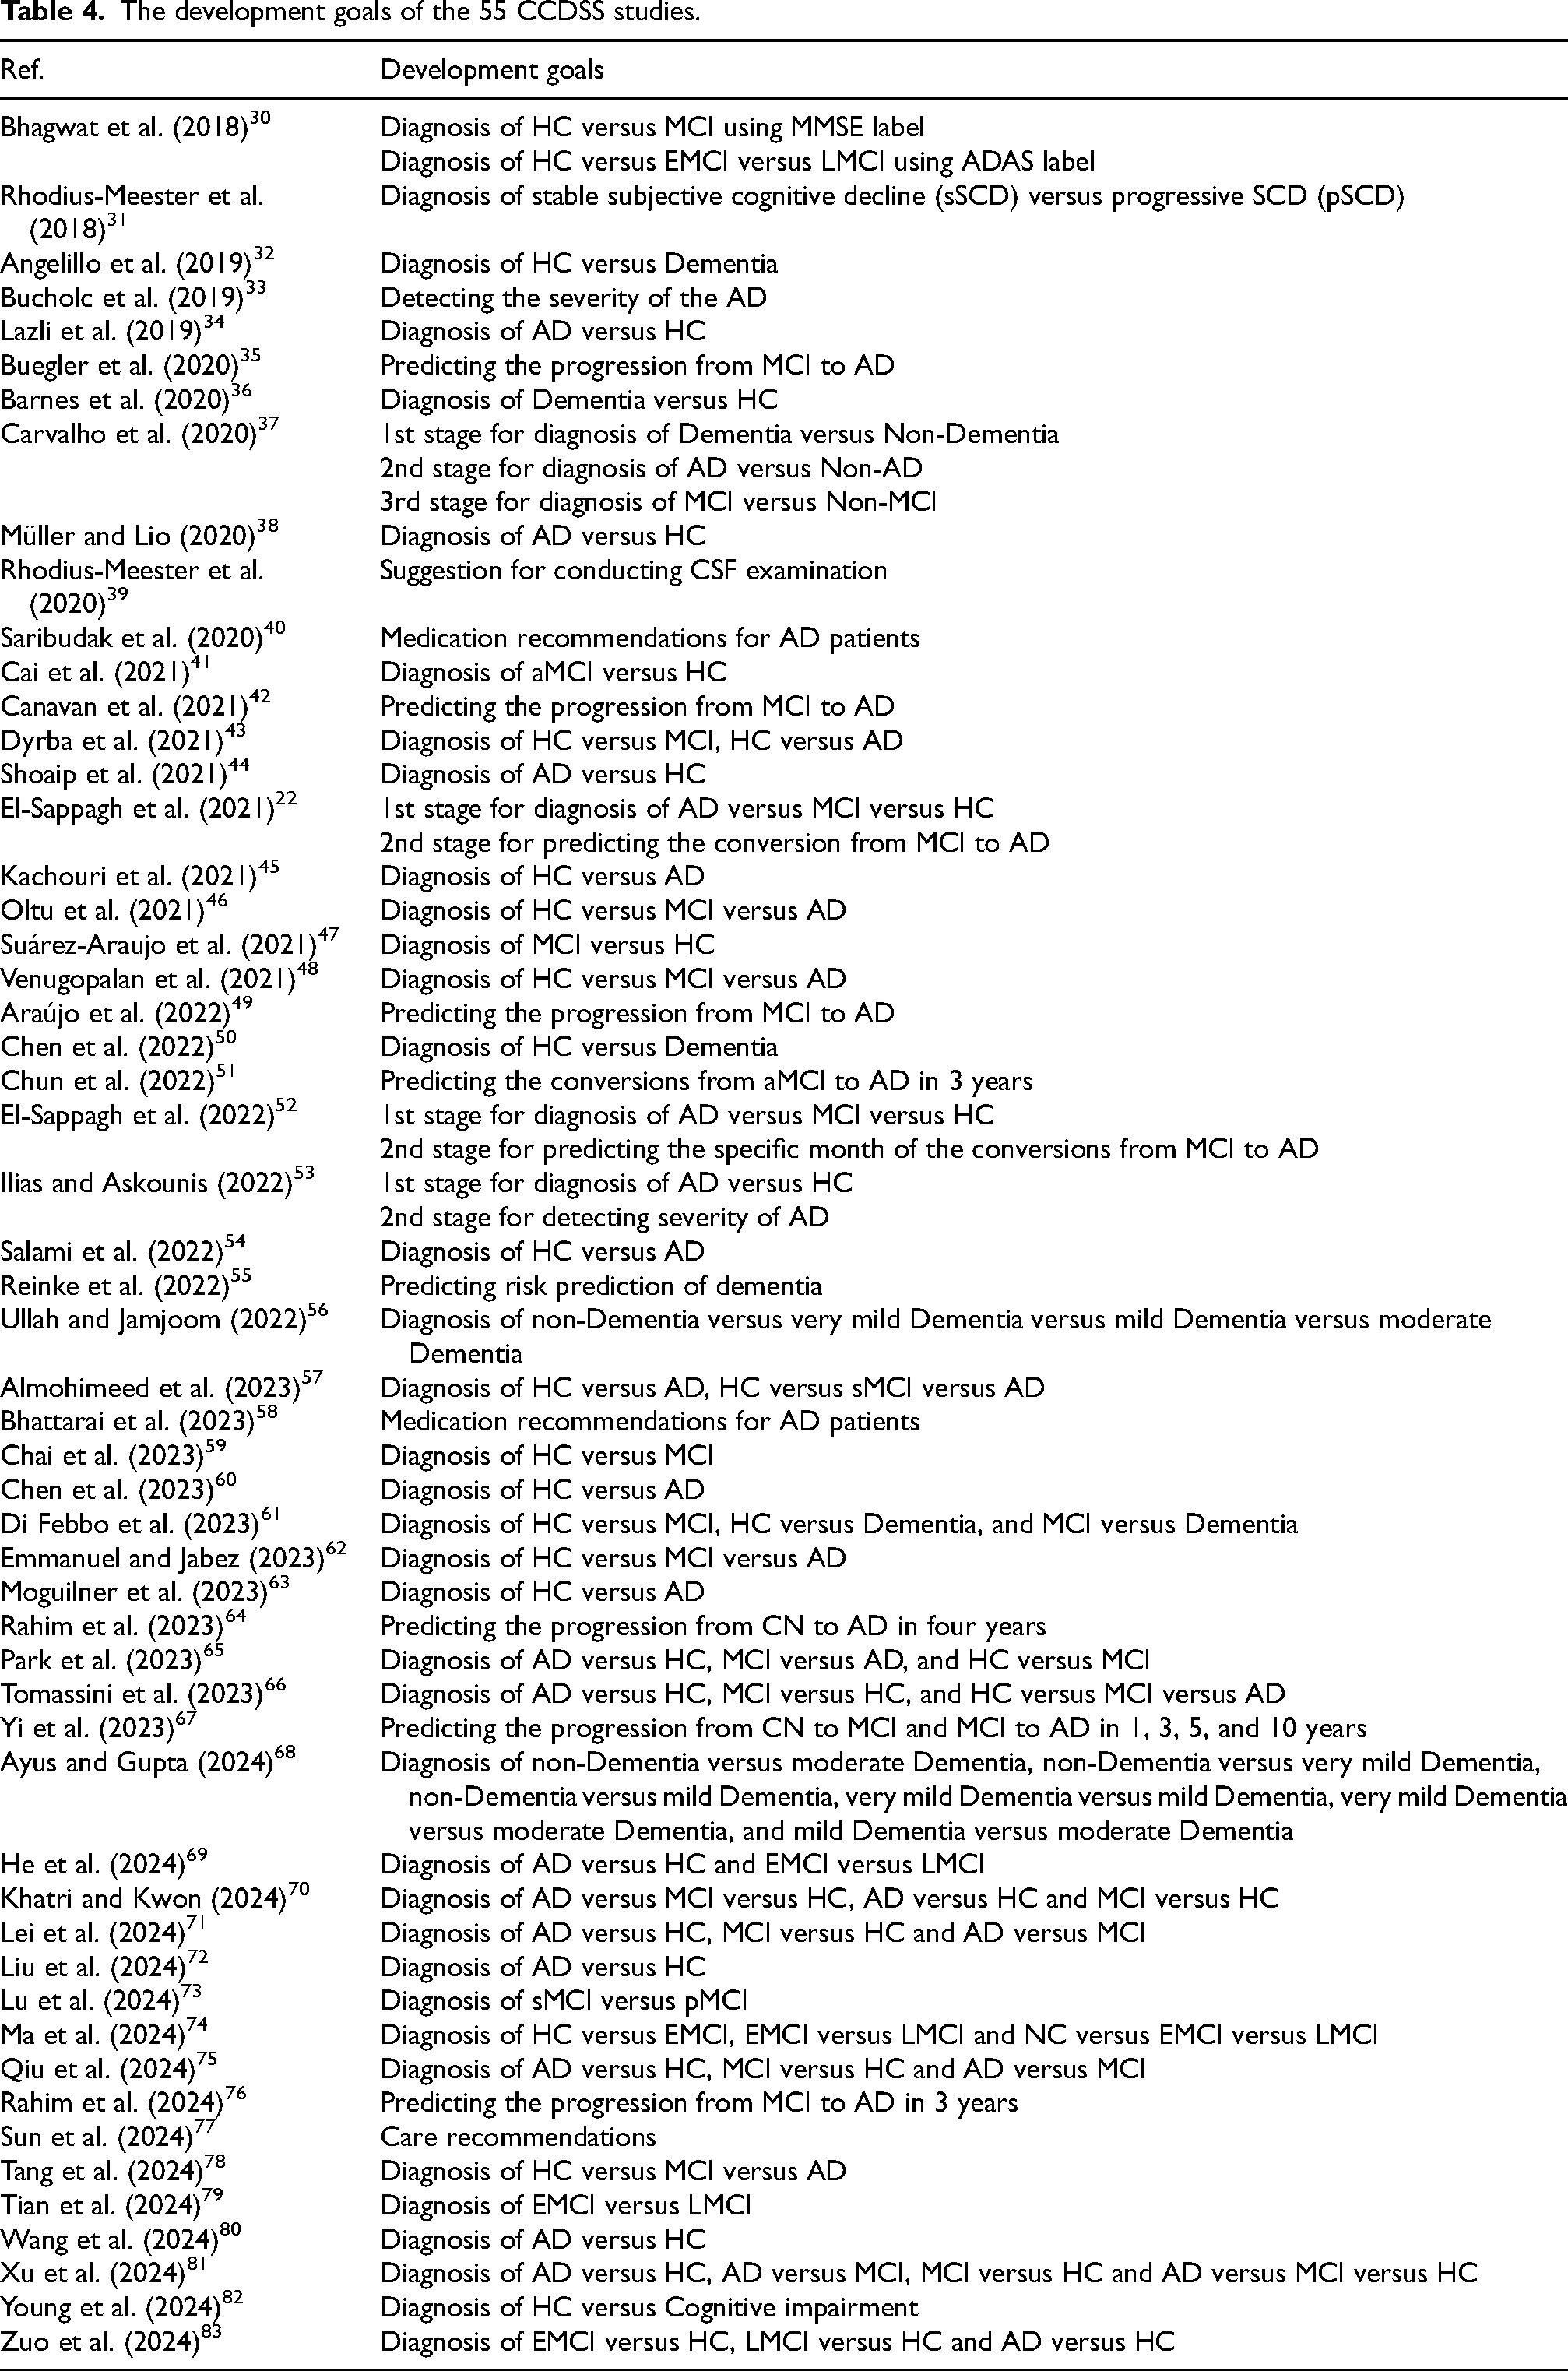
More importantly, since the complicate clinical situation varies from patient to patient, clinicians do not only need to make an accurate diagnosis, but also have to decide which drugs to prescribe and which tests to carry out. Therefore, the CCDSS could be designed with multiple functions apart from diagnosis and prognosis, such as examination, 39 care, 77 drug recommendations.40,58 Table 4 reports the detailed goals of the 55 CCDSS reviewed.
The development goals of the 55 CCDSS studies.
Feature extraction and feature selection
Feature extraction and feature selection are prerequisites for building a model. The former refers to the extraction of representative features from the original data that can reflect the essence of problem. 89 While the latter selects the most important or relevant part from a large number of features that have been extracted for further modeling. In real scenes, there may be a large number of redundant or irrelevant features, leading to the model being too complex and easy to overfit when not doing any screening. Therefore, feature selection can identify features that are truly valuable and associated with target variables for subsequent modeling task. 90
The filter method is one of the commonly used feature selection methods, which separates feature selection from classification by solely utilizing mathematical statistical methods to calculate the correlation between features and target variables, e.g., variance, Chi-square, information gain, relief, minimum redundancy maximum relevance. 91 For instance, Chun et al. 51 employed correlation coefficient-based methods to select features for predicting the conversions from aMCI to AD. Another one is the wrapper method, which evaluates the impact of feature combinations on model performance by selecting the best subset in each iteration of the ML process. 92 This method is more time-consuming and computationally complex, but it usually gets more accurate and reliable results. The recursive feature elimination (RFE) is a wrapper-style feature selection algorithm that can be combined with a variety of ML algorithms. For instance, it has been combined with random forest (RF) for selecting features.22,33 El-Sappagh et al. 22 employed RFE in combination with RF, support vector machine (SVM), and gradient boosting for feature selection in the diagnosis and prognosis of AD. Meanwhile, Bucholc et al. 33 used RF-RFE to select features for multi-class classification of AD versus MCI versus HC. While one study used the information gain followed by the RFE with cross validation method to select the most significant features subset again for multi-class classification of AD versus MCI versus HC. 52 In addition, there are embedded methods where the adjustments of model parameters are designed to directly influence the features to be selected, such as least absolute shrinkage and selection operator (LASSO). 93 LASSO uses L1 regularization to drive the coefficients of the model, thereby achieving sparsity for unimportant features and causing their coefficients in the model to become zero. 93 Also, Barnes et al. 36 used LASSO to select features from electronic health records to obtain key features of patients not diagnosed with dementia.
In addition, artificial neural network (ANN) has also been employed for feature selection, e.g., the study 47 adopted ANN as the fitness function and then used backward search to obtain the outperformed features combination for binary classification of MCI versus HC. Furthermore, DL can automatically learn highly abstract features with good expressiveness from raw data, especially in the field of images. For example, convolutional neural networks (CNNs) do not require complex feature engineering and can self-learn useful features from input data without affecting informational characteristics. 94 For instance, Salami et al. 54 built the ResNet18 model, which can automatically extract the favorable abstract features from MRI data for binary classification of AD versus HC, so as to obtain the outperformed model. Kachouri et al. 45 utilized the AlexNet to extract features from hand-drawn images (i.e., Archimedes spiral figure) for AD diagnosis. Chen et al. 60 combined vision transformer (ViT) technology with CNN to extract signal features from EEG data for diagnosing MCI versus HC. Also, other image extraction methods have been applied to different imaging data. The discrete wavelet transform can be utilized for extracting the subbands of EEG images from AD patients, followed by employing Burg's method for signal processing and spectrum analysis. 46 Chai et al. 59 utilized independent component analysis to process EEG images, extracting corresponding signal frequency bands. Subsequently, a band selection algorithm was employed to choose the optimal frequency bands as input features of the CCDSS for diagnosing MCI versus HC. Cai et al. 41 employed an adaptive structure feature generation strategy (ASFGS) to extract the structural characteristics of the brain functional network. Then, the multi-scale local feature detection strategy was utilized to extract local features. Finally, the extracted information was integrated into multi-scale features for classifying MCI versus HC.
In general, for high-dimensional data, feature extraction and feature selection can not only effectively reduce computing costs, eliminate redundant information, and speed up model training, but can also improve the generalizability and interpretability of the model.
Data modeling methods
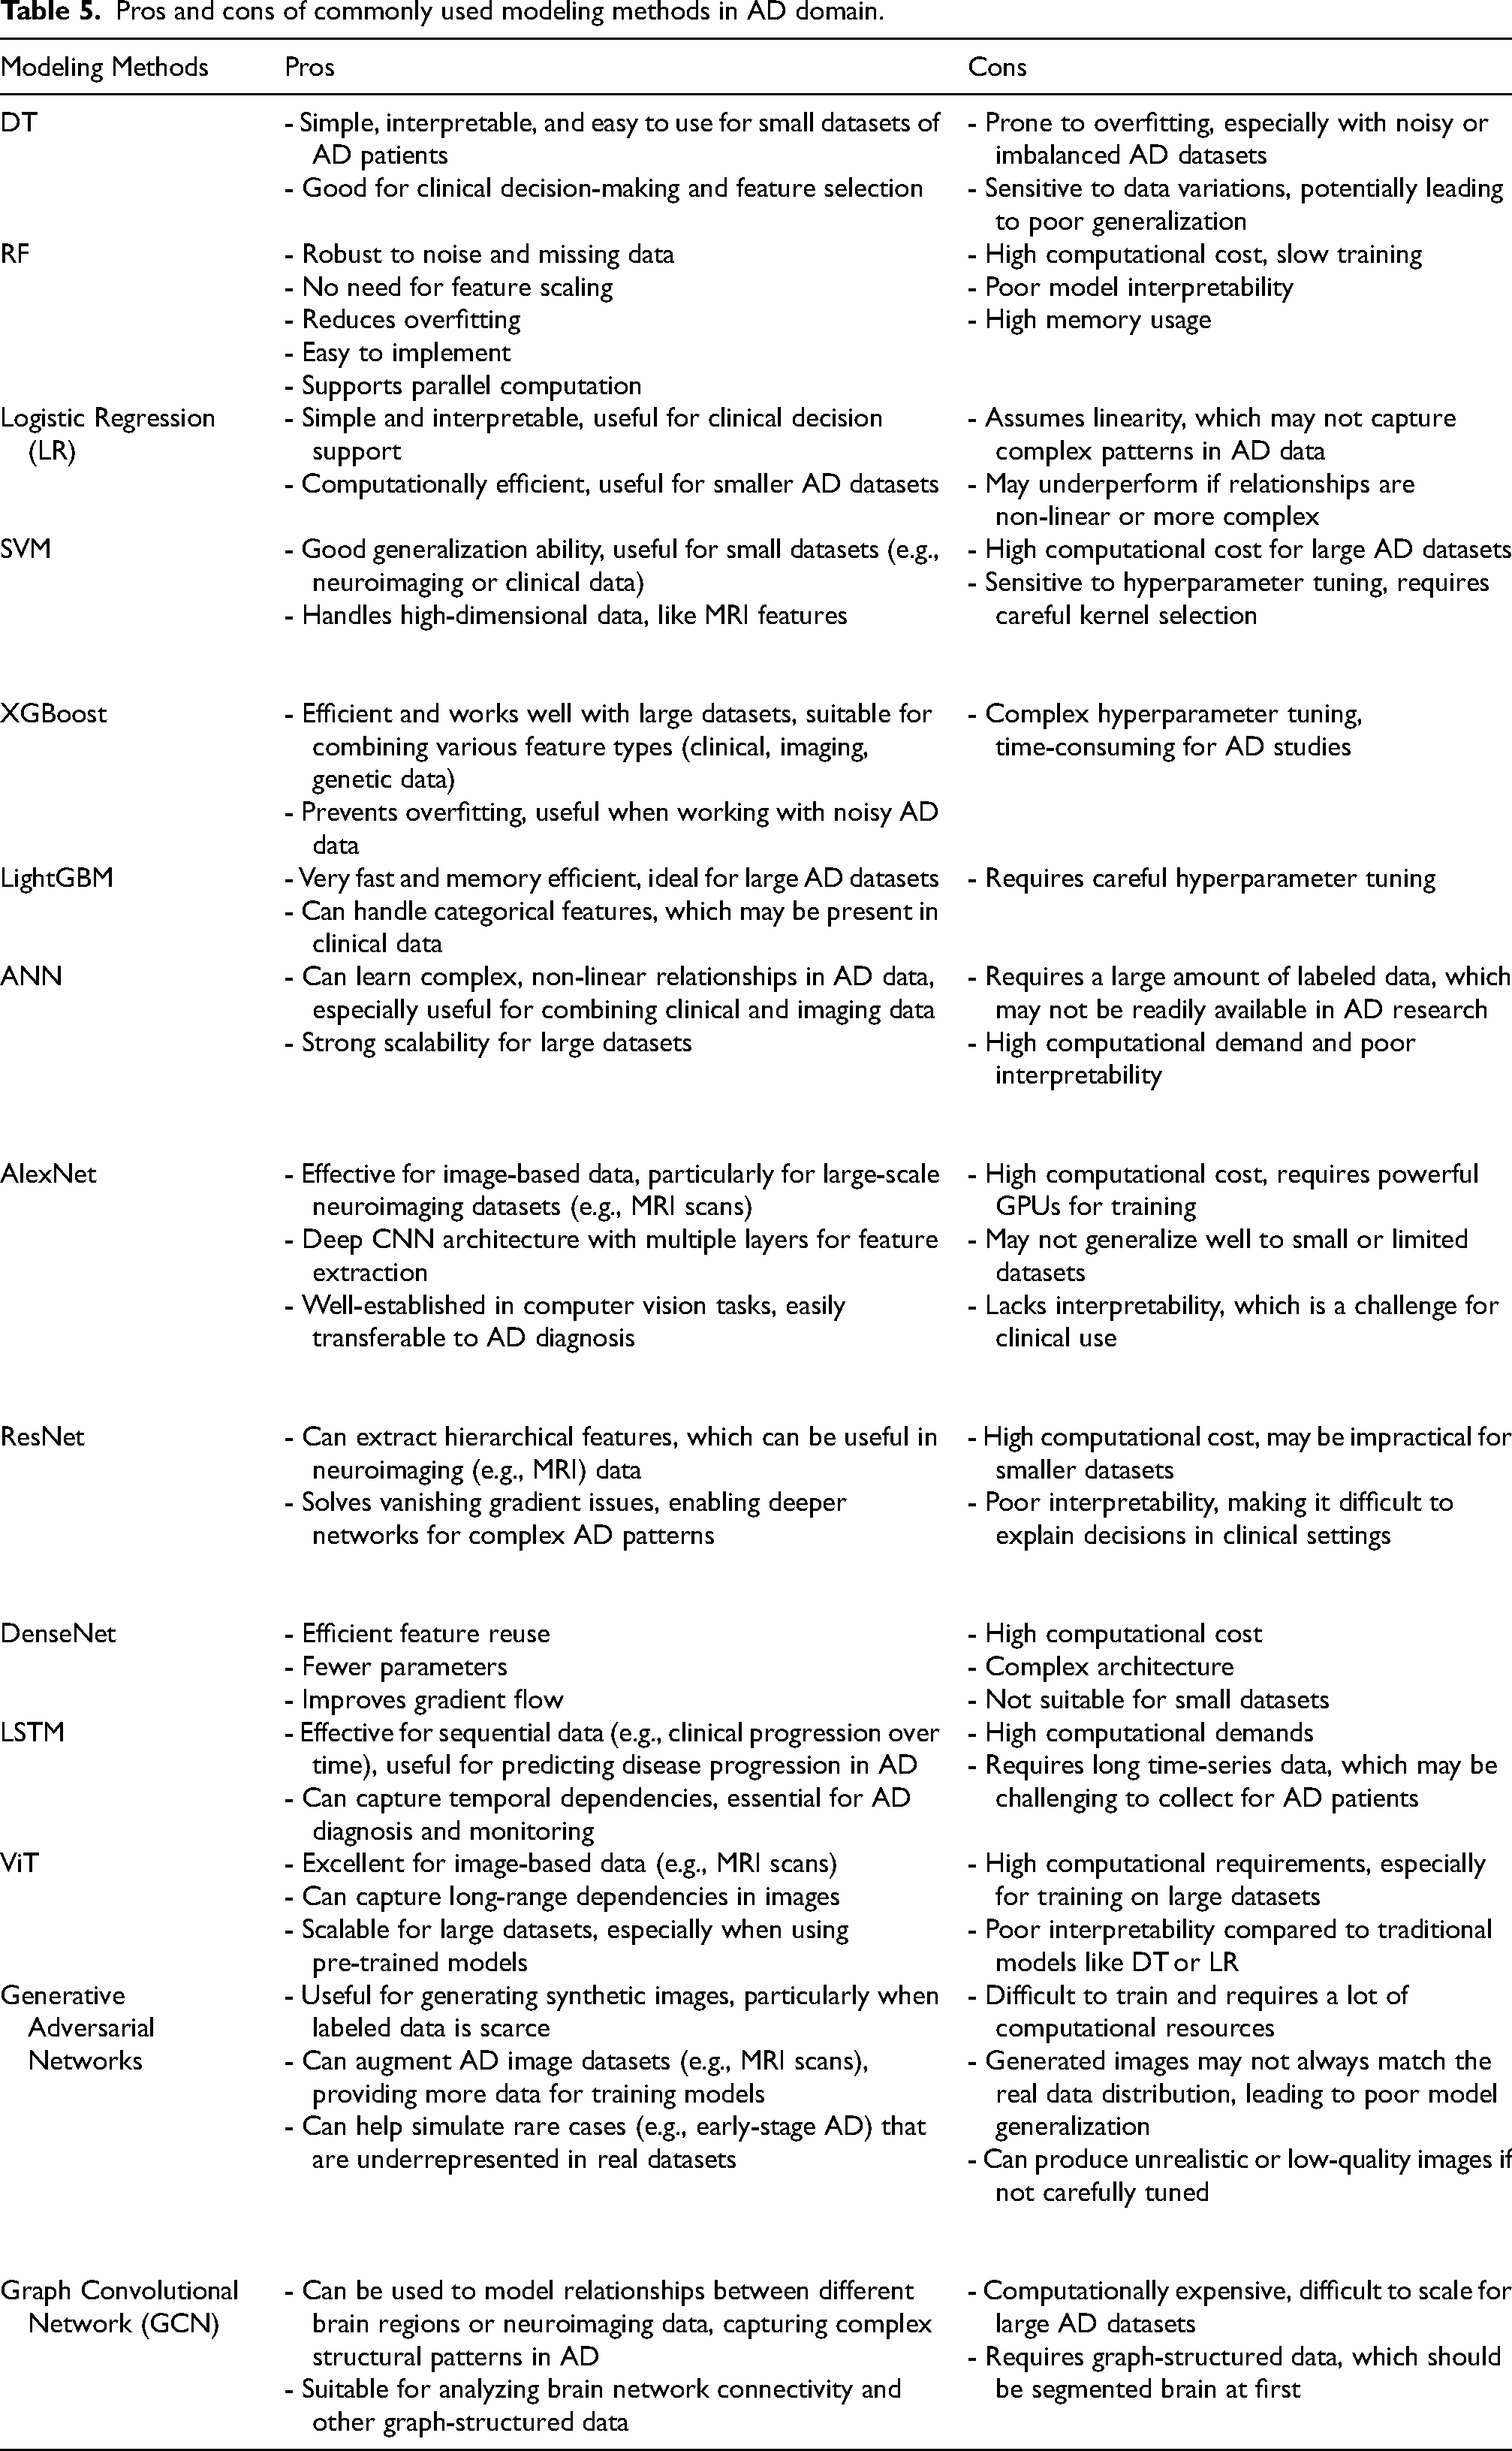
Given the disparities in data modality and dimensions, different data modelling methods are employed in order to effectively address specific objectives. Out of the 55 studies, 23 utilize traditional ML algorithms, while 30 are based on DL. The remaining 2 studies employ reinforcement learning (RL) and ontology, respectively. We summarize the commonly used models in Table 5, highlighting their pros and cons in the meantime.
Pros and cons of commonly used modeling methods in AD domain.
The commonly used traditional ML algorithms are SVM and RF. Typically, within the 8 SVM-based studies,33,34,37,41,45,57,59,61 7 works are for binary classification task.34,37,41,45,57,59,61 Cai et al. 41 implemented the classification of aMCI versus HC by building an SVM classifier with the kernel of radial basis function (RBF). The nonlinear RBF-SVM classifier can effectively separate different types of data samples by mapping the nonlinear data which are inseparable in the original space into a high-dimensional feature space and then building up hyperplanes in the space. 95 This mechanism makes the linearly inseparable problem changed to a separable one in the feature space.
Among the 10 studies that utilize ensemble learning based on decision trees (DT), 5 of them employ the RF model,22,32,37,38,55 two use the extreme gradient boosting (XGBoost),35,51 one utilizes bagged trees, 46 and the remaining two studies use light gradient boosting machine (LightGBM).49,78 Since DT offer better interpretability and ease of understanding, 96 they are preferred by approximately 50% of studies for constructing ensemble models. This choice is driven by the need to enhance system performance through ensemble learning, 97 while ensuring non-IT users can comprehend the system results effectively. For example, Müller and Lio 38 constructed an RF model to classify AD versus HC, and then used fuzzy methods to extract subsets of rules from the RF model, thereby enhancing the interpretability of the model.
In recent years, DL has made remarkable achievements in image processing, bringing some advantages, such as being able to learn from raw data without expert knowledge, generalizing well to new unseen data, and so on. However, due to its black box properties, it should be used with caution especially in clinical applications. Over the past decade, CNN has been the preferred DL method for building diagnostic decision support systems for AD, and has achieved high performance in classification tasks. 98 However, in the comparative analysis of different tasks, it is hard to conclude which one of the classic CNN models such as AlexNet, residual network (ResNet) and densely connected network (DenseNet) perform best because of pros and cons of the trade-off. Specifically, AlexNet 99 is a relatively shallow neural network model with only 8 layers, while ResNet 100 incorporates the concept of residual blocks to facilitate the training of extremely deep networks (such as those with 50 or even 152 layers), and ResNet addresses the issues of gradient vanishing and exploding in deep models. Studies based on DL in AD are as follows. Kachouri et al. 45 used AlexNet to extract features from simple images and then employed SVM for classifying AD versus HC. Dyrba et al. 43 constructed a CNN model for binary classification of AD versus HC, which was inspired by AlexNet and VGG. Ullah and Jamjoom 56 constructed a CNN model comprising of 3 convolutional layers, 3 pooling layers, 2 fully connected layers, and 1 output layer. This model successfully achieved the classification of four different stages of dementia. Di Febbo et al. 61 utilized ResNet50 for the analysis and processing of the Rey Osterrieth complex figure (ROCF) test, generating specific pattern datasets, and subsequently employed SVM to classify HC versus MCI versus dementia. Salami et al. 54 constructed an ensemble model of ResNet18 using MRI images and clinical data. Since the neurodegenerative disease may evolve over time, the long short-term memory (LSTM), 101 which is a recurrent neural network, has been applied to predict the conversion year and month from MCI to AD. 52 Also, LSTM can be used for classification tasks, e.g., Tomassini et al. 66 built a convolutional LSTM (ConvLSTM) based on MRI scan images for the multi-class classification of AD versus MCI versus HC. Rahim et al. 64 integrated CNN with LSTM for detecting the progression of AD. In addition, the depth model can be combined with other technologies. In the 1990s, Jang 102 proposed an adaptive-network-based fuzzy inference system (ANFIS) which is based on IF-THEN rules and possesses explanatory properties. Building upon ANFIS, Emmanuel and Jabez 62 developed an Advanced ANFIS (AANFIS) for multi-class classification of AD versus MCI versus HC. Besides, due to the rare clinical imaging data of different modal, researchers attend to use generative adversarial concept to augment AD image datasets. Ma et al. 74 integrated multimodal medical image data by estimating prior distributions, employing bidirectional adversarial mechanisms, and utilizing hypergraph perception networks with graph convolution operations to predict abnormal brain connectivity in AD.
It is noted that only one of the 55 studies uses ontology to build CCDSS. 44 In 1995, Gruber 103 proposed a standardized concept for explicitly constructing ontologies. Initially, the ontology is constructed by defining a series of terms, which requires a significant amount of work. Currently, CCDSS-based ontology utilizes the existing ontology and expands its functionalities to achieve research objectives. As in the study, 44 researchers constructed an AD Diagnosis Ontology (ADDO) by reusing two ontologies, i.e., Basic Formal Ontology and Ontology for General Medical Sciences.
Also, only one of the 55 studies adopts an intensive learning method, RL, which is usually applied in the field of competitive games and is optimized by rewarding and feedback on user behaviors. 58 The study used the idea of intensive learning to improve the MMSE score by analyzing the drug use of the AD patients and finally found the best treatment plan. A regression model and a DT were established to generate multiple states with different values of Alzheimer's disease assessment scale (ADAS), Rey auditory verbal learning test (RAVLT) immediate, RAVLT learning, age, the clinical dementia rating scales sum of boxes (CDRSB), MoCA, and Fluoro-Deoxy-Glucose (FDG). Furthermore, 6 drug combinations was used as behavioral selections, with MMSE score acting as a reward signal.
The analysis of the included studies highlights the diversity and complexity of techniques employed in CCDSS. Different data types (e.g., structured and unstructured data) and modalities (e.g., images, text, etc.) have unique characteristics and requirements. Constructing CCDSS with carefully selected methods and models tailored to these features can significantly enhance performance and accuracy, ultimately leading to improved outcomes.
Performance comparison
Regarding the performance comparison of different input data modalities, the overall ACC range for the binary classification of AD versus HC based solely on neuroimaging data type is from 85.09% 34 to 99.38%, 38 while for the multi-class classification of AD versus MCI versus HC, the accuracy ranges from 61.42% 81 to 96.5%. 46
For single-modal non-imaging data, the ACC range for the binary classification of Dementia versus HC is 81.5% 45 to 91%. 61 Furthermore, for multi-modal non-imaging data, the ACC range for the binary classification of AD versus HC is 86.25% 53 to 97%. 38 And the ACC range of the multi-class classification of AD versus MCI versus HC based on multiple non-imaging data, is 83% 33 to 90.03%. 57
For multi-modal data including neuroimaging and non-imaging, the ACC range of the binary classification of AD versus HC is 84.4% 43 to 94%, 63 and the ACC range of multi-class classification of AD versus MCI versus HC is 78% 48 to 93.33%. 22 Meanwhile, it turns out that the model built on small-sized imaging data has achieved high accuracy, e.g., the ACC of 96.5% and AUC of 0.99 on 35 patients’ samples 46 ; ACC of 86.57% and AUC of 0.8636 on 66 patients’ samples 41 ; ACC of 93.65% and AUC of 0.973 with 159 patients’ samples 34 ; and ACC of 99.38% with 52 patients’ samples. 38 This may be due to the relatively high-quality samples or the representative features extracted and selected, so that the models can effectively learn the insight of the data.
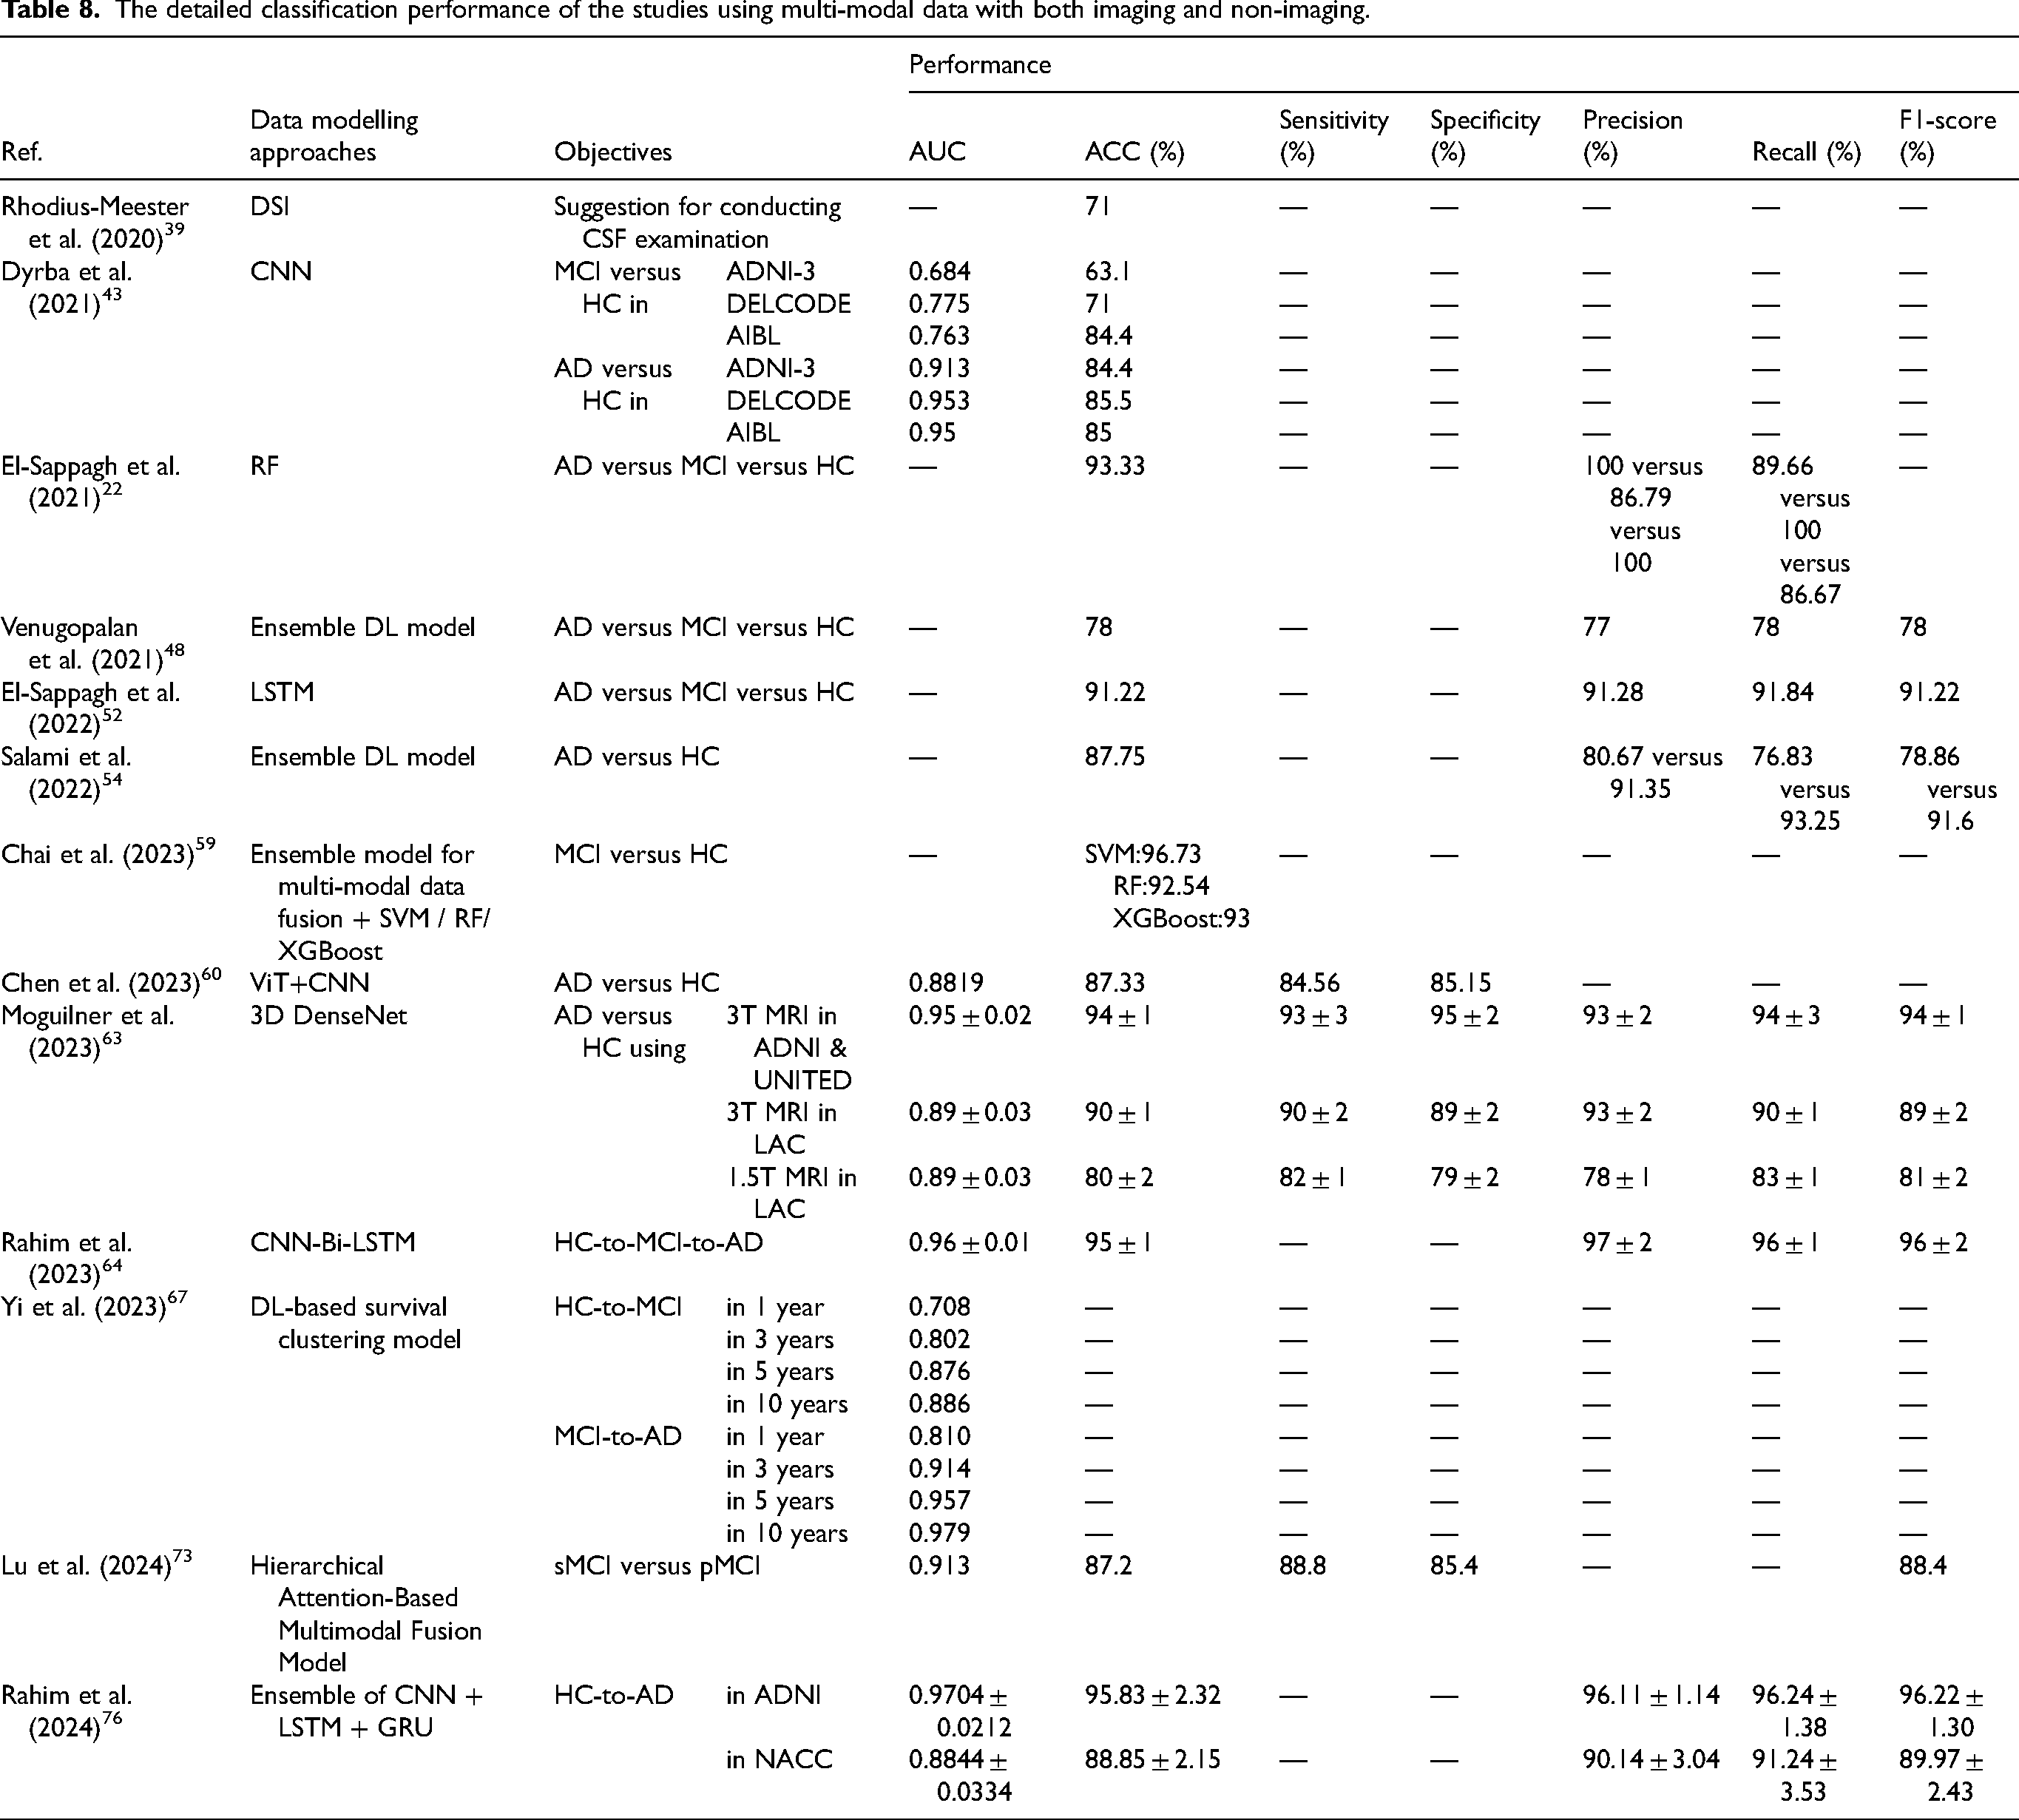
Currently, CCDSS for classification of AD employ single-modal or multi-modal data, simultaneously demonstrating commendable performance. Notably, studies utilizing neural imaging data from a singular modality exhibit superior classification outcomes, potentially attributed to the efficacy of deep neural networks in extracting highly representative image features. However, given the multifactorial and heterogeneous nature of AD, clinical diagnostics tend to lean towards the utilization of multi-modal data for enhanced diagnostic accuracy. The obtained classification results of the CCDSS developed on neuroimaging, non-imaging data, and multi-modal data including both imaging and non-imaging along with the built-in data modeling approaches are listed in Tables 6, 7 and 8, respectively.
The detailed classification performance of the studies using neuroimaging data.
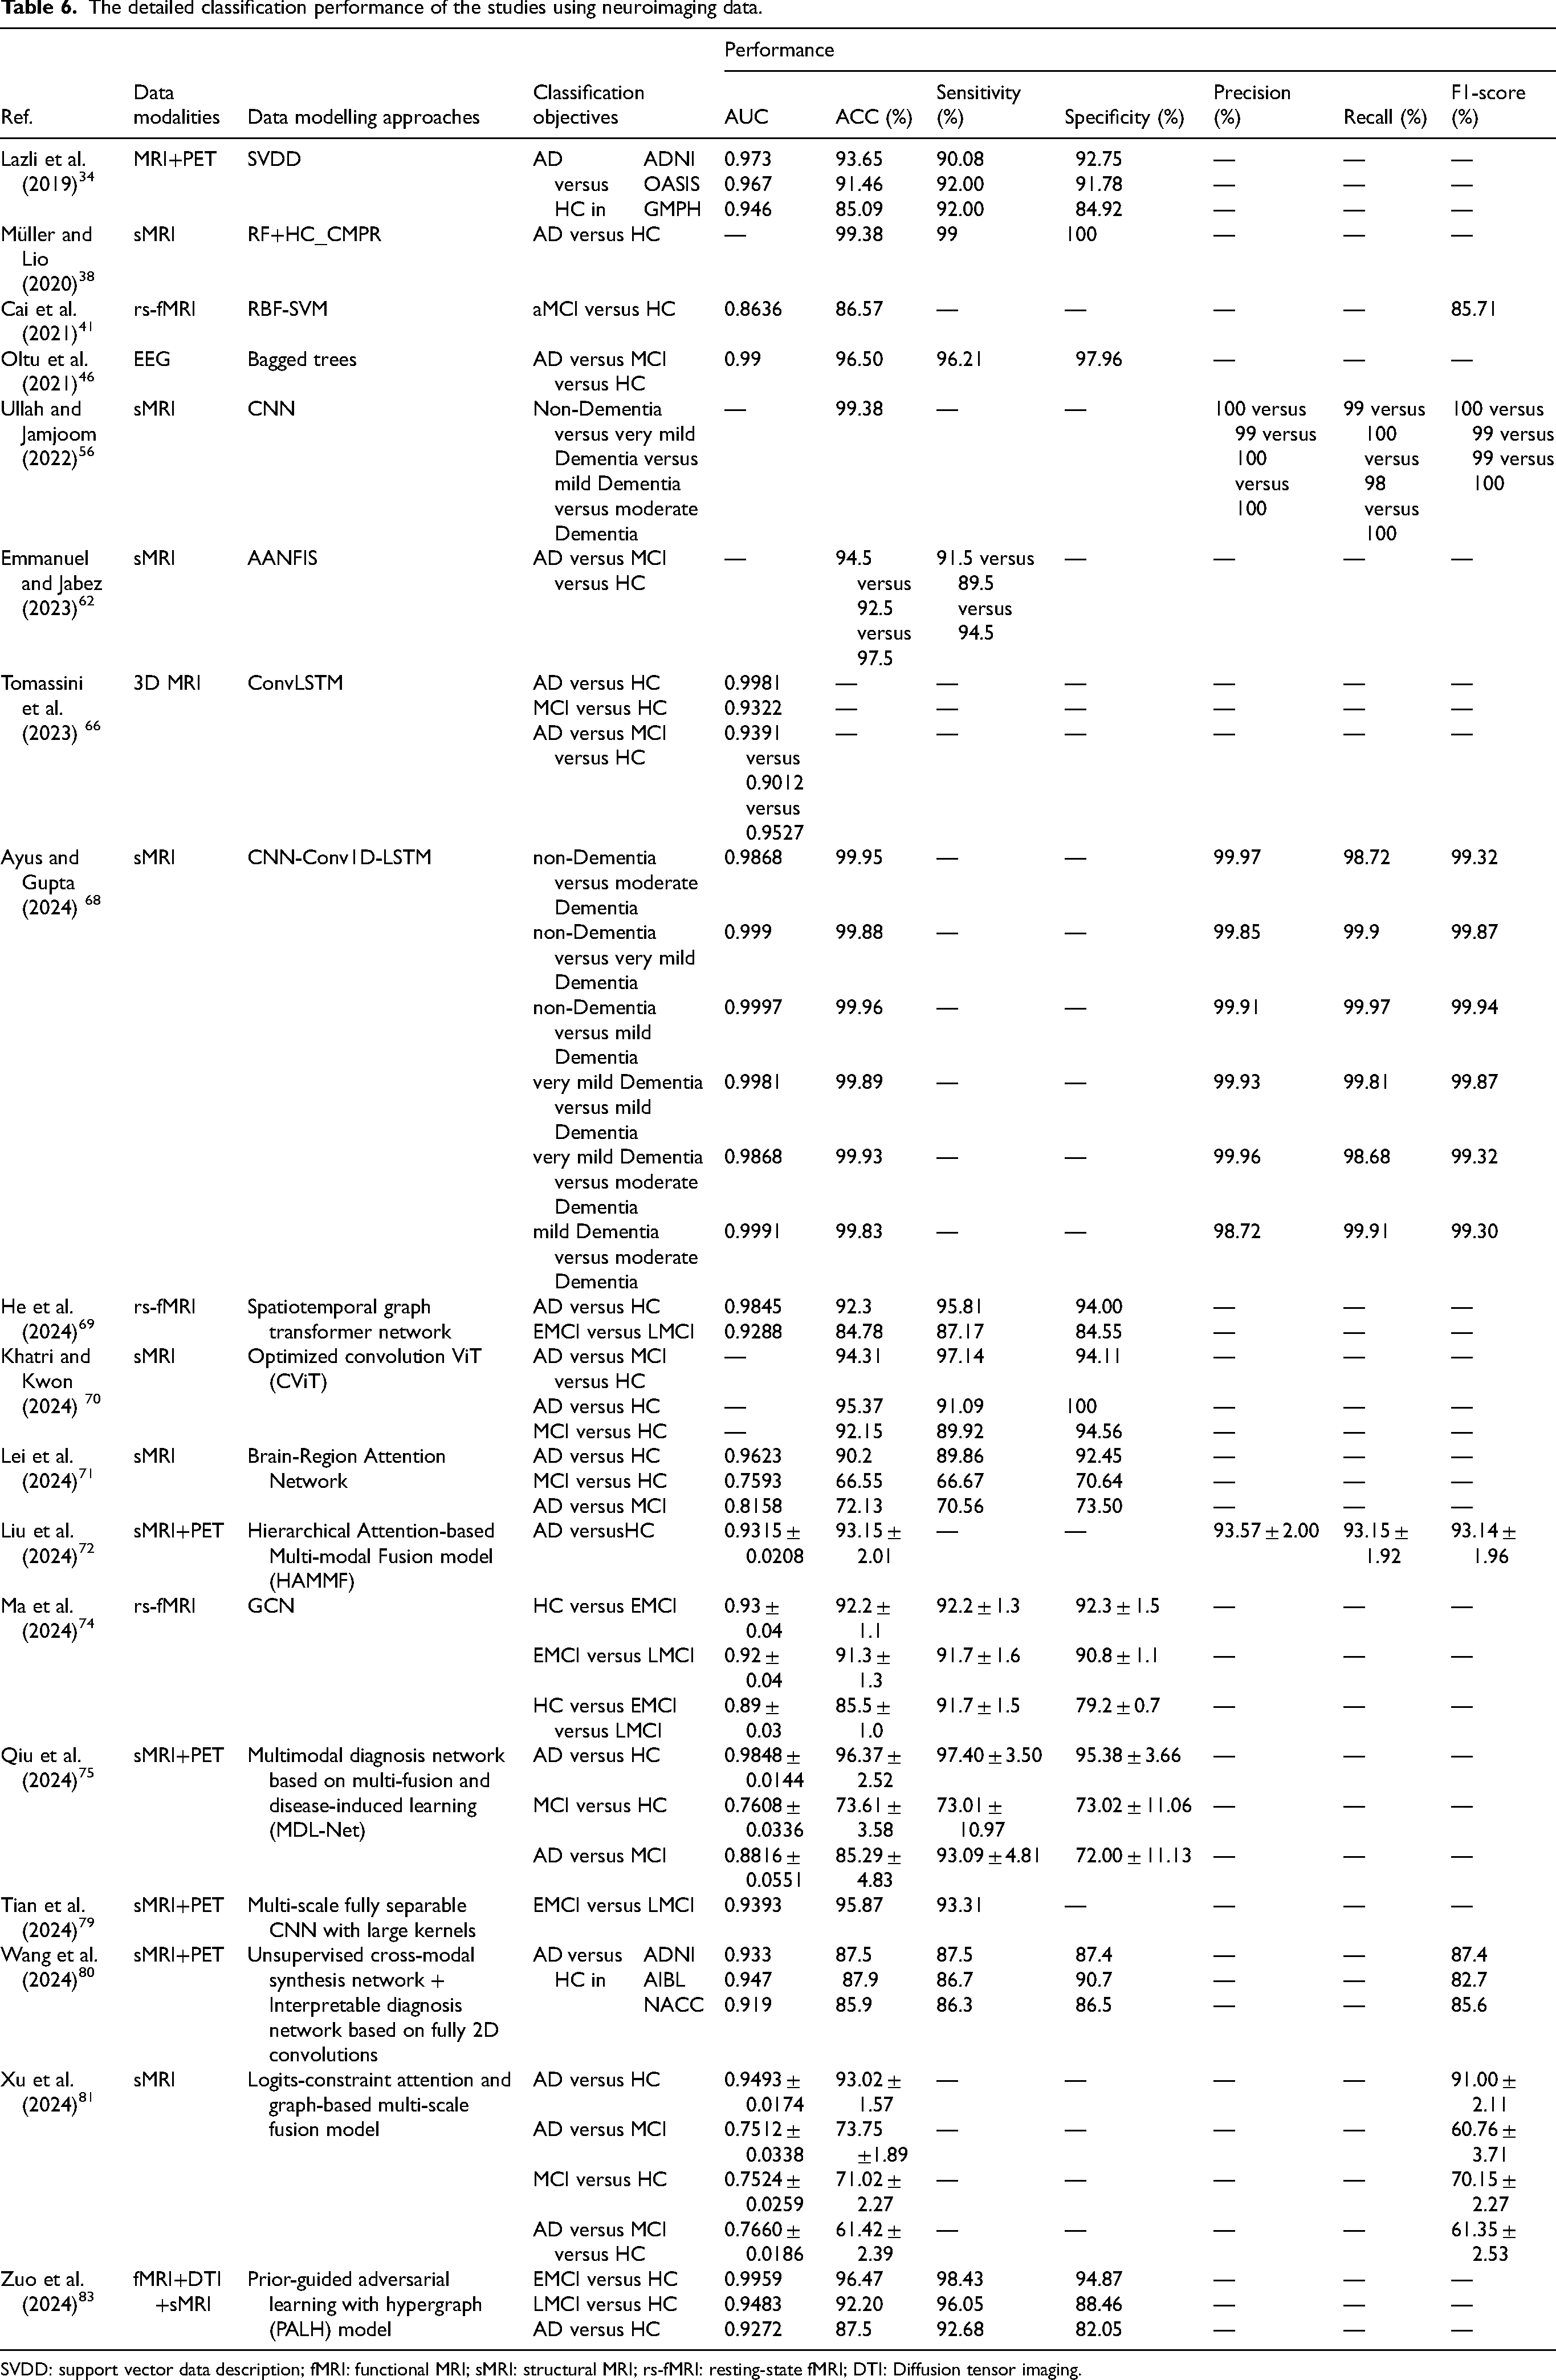
SVDD: support vector data description; fMRI: functional MRI; sMRI: structural MRI; rs-fMRI: resting-state fMRI; DTI: Diffusion tensor imaging.
The detailed classification performance of the studies using non-imaging data.
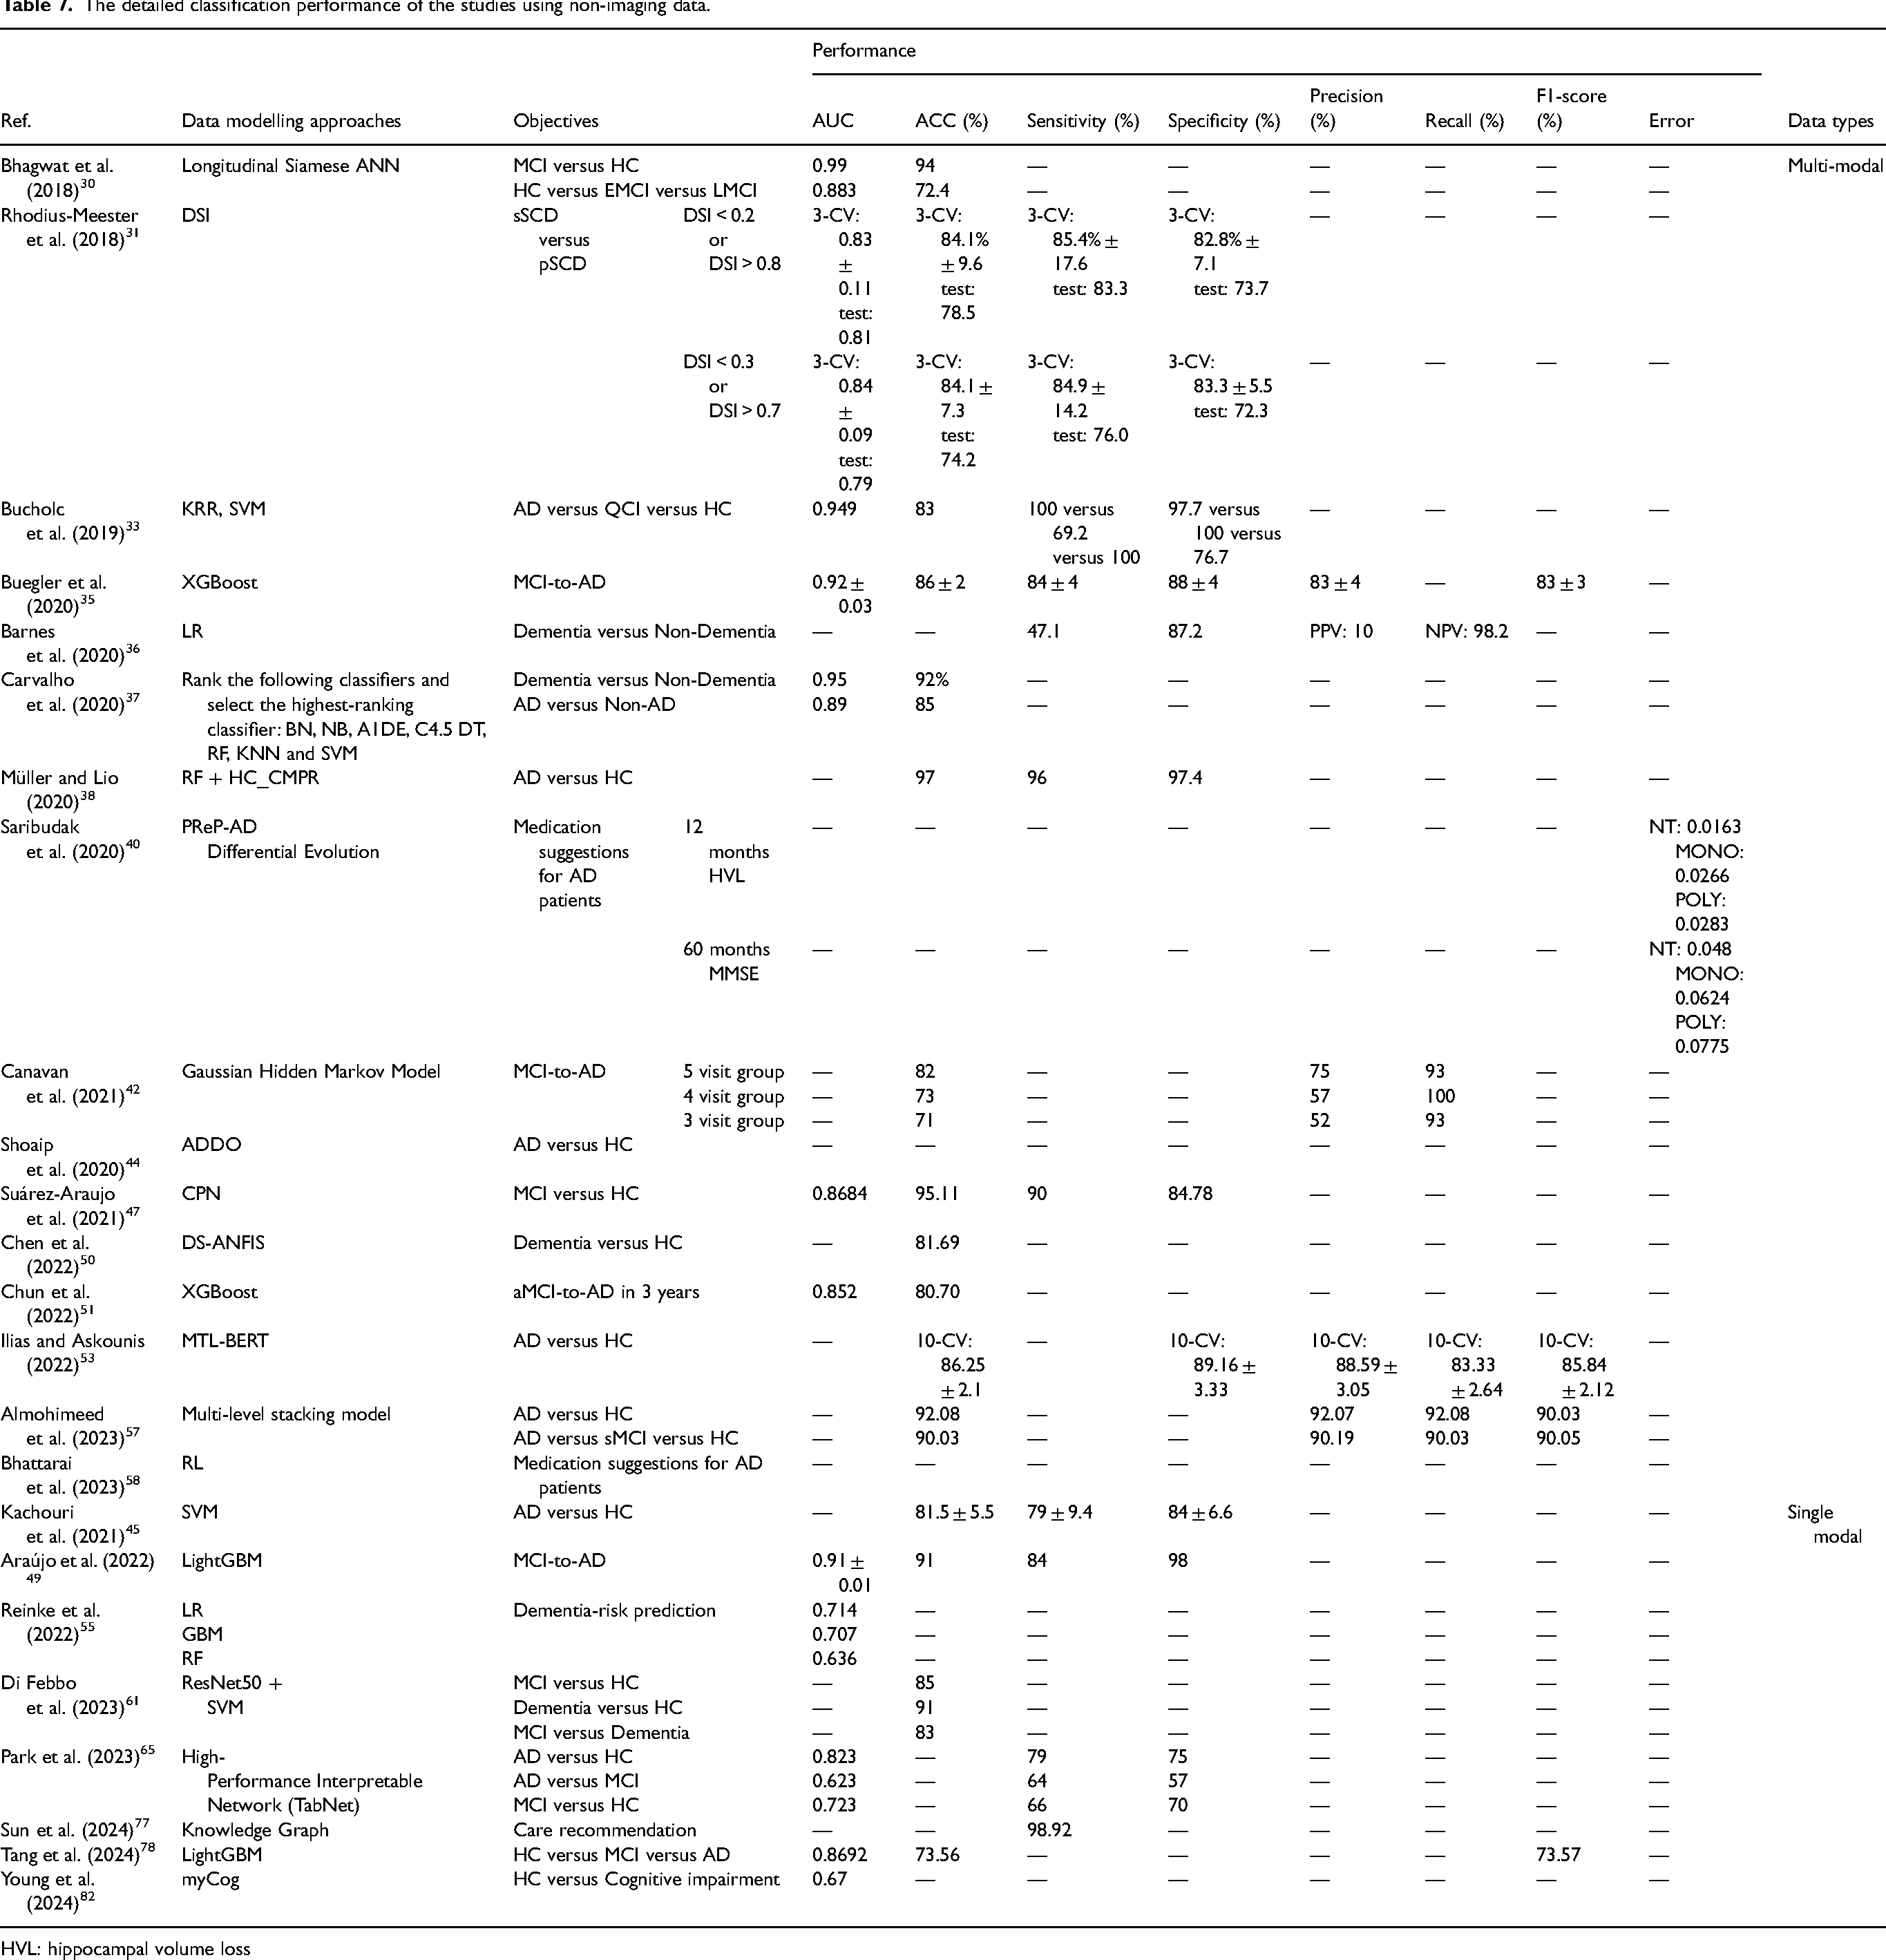
HVL: hippocampal volume loss
The detailed classification performance of the studies using multi-modal data with both imaging and non-imaging.
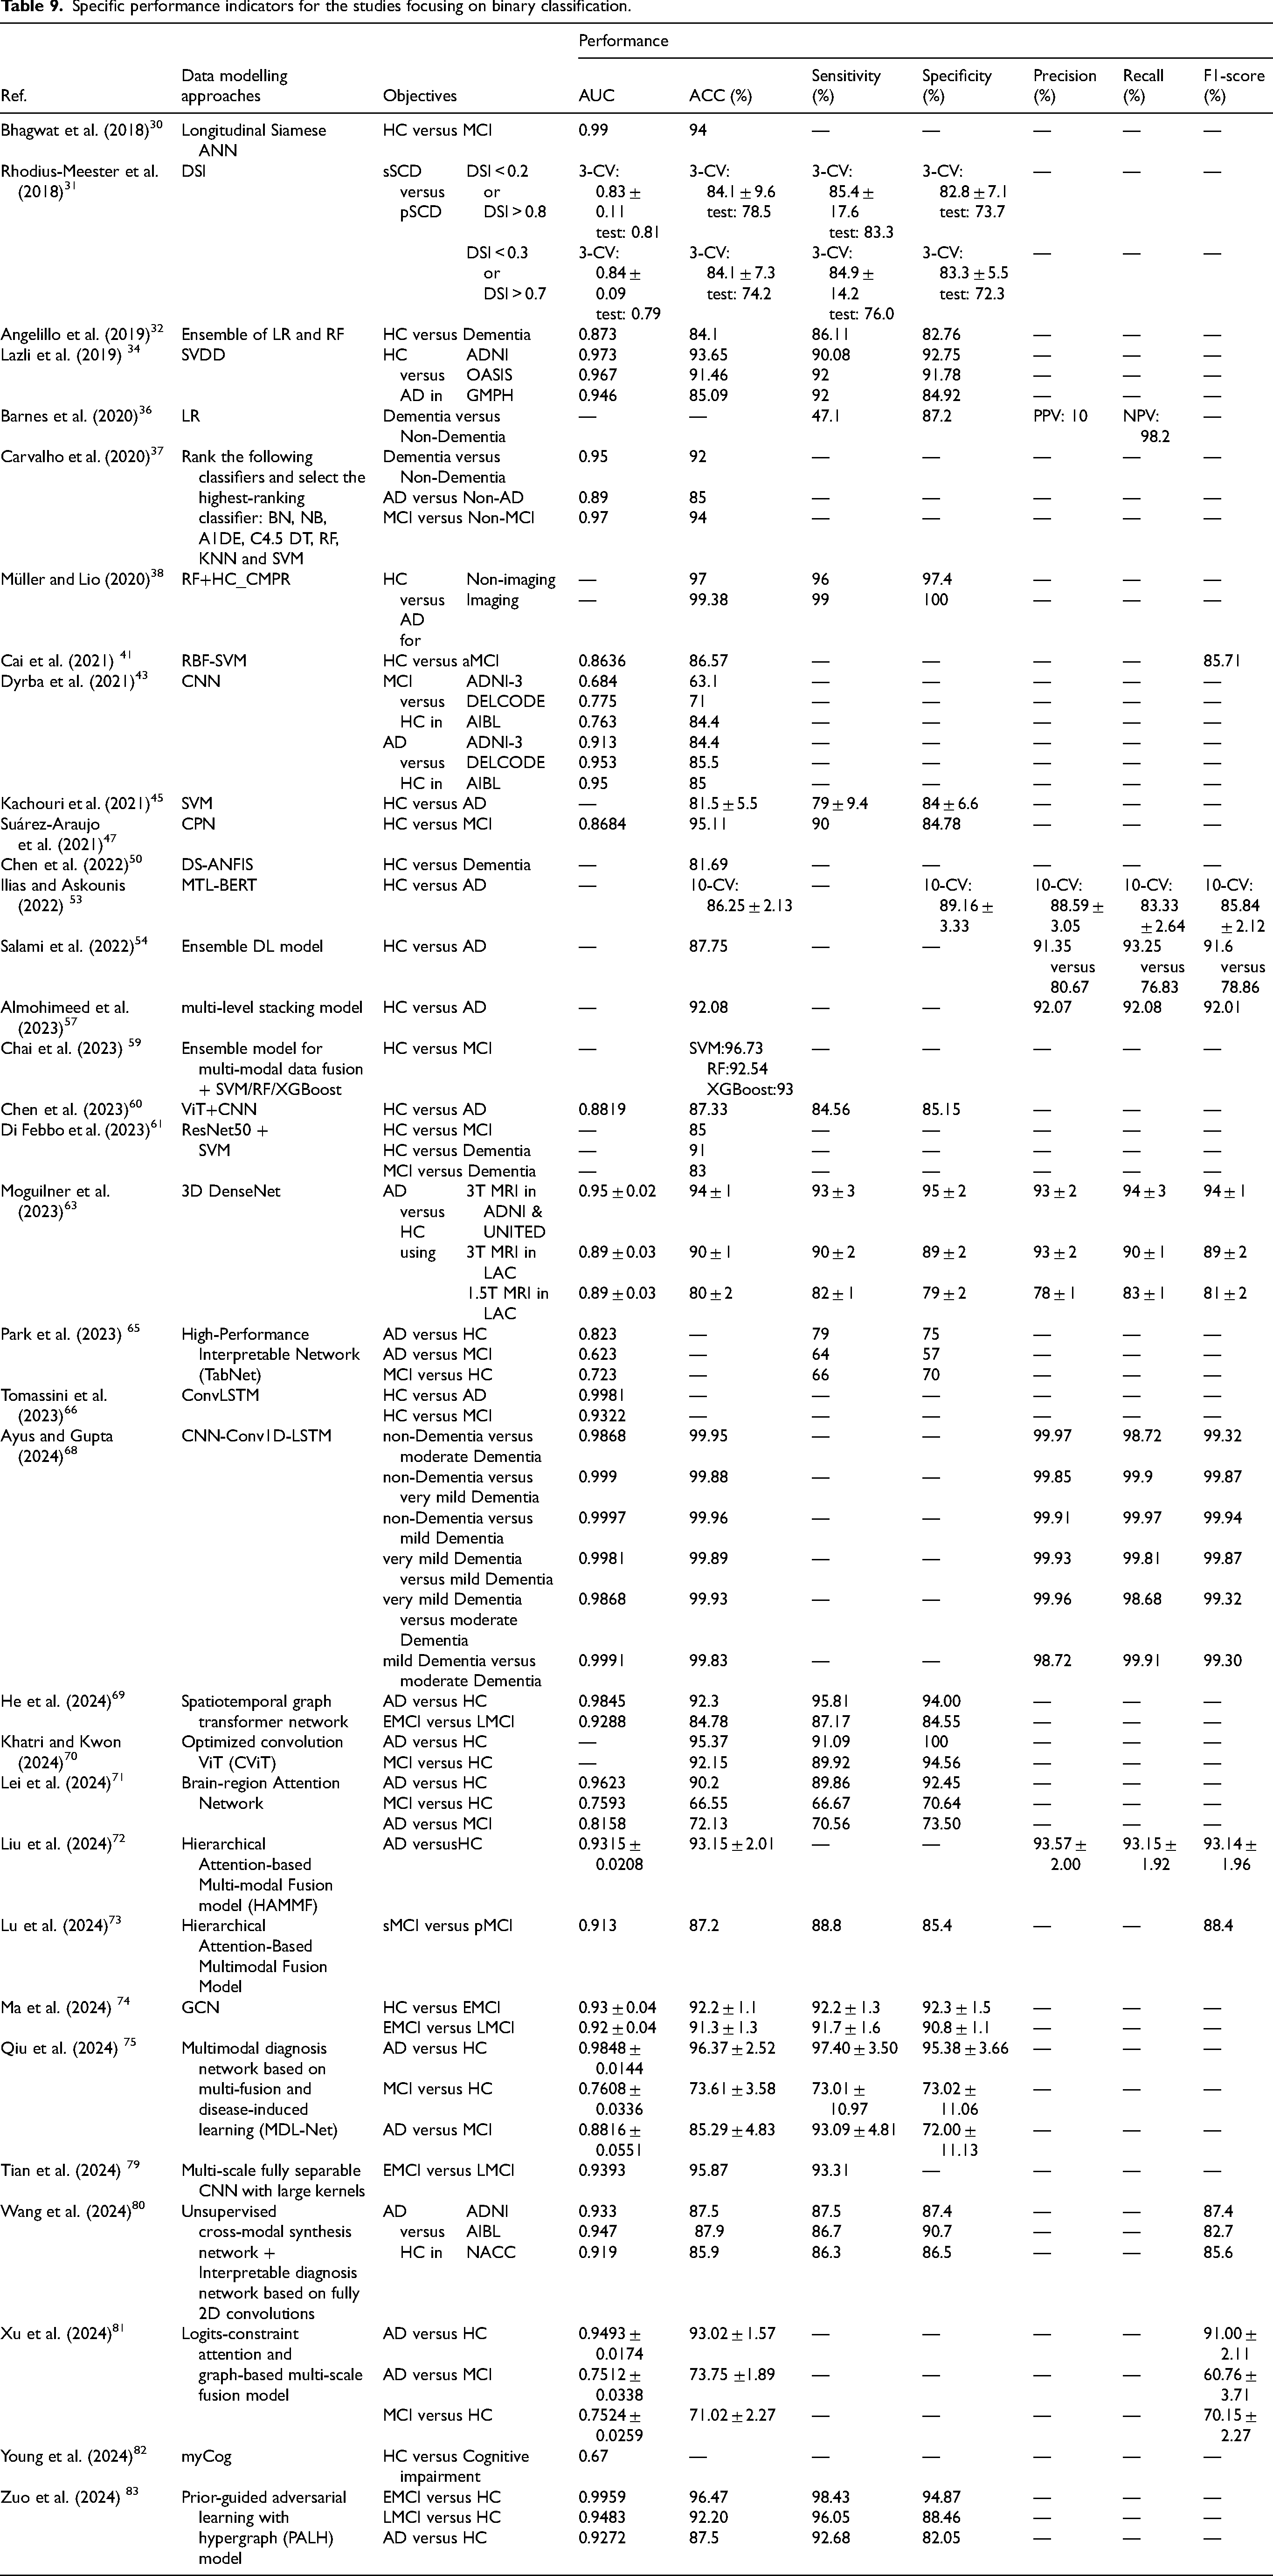
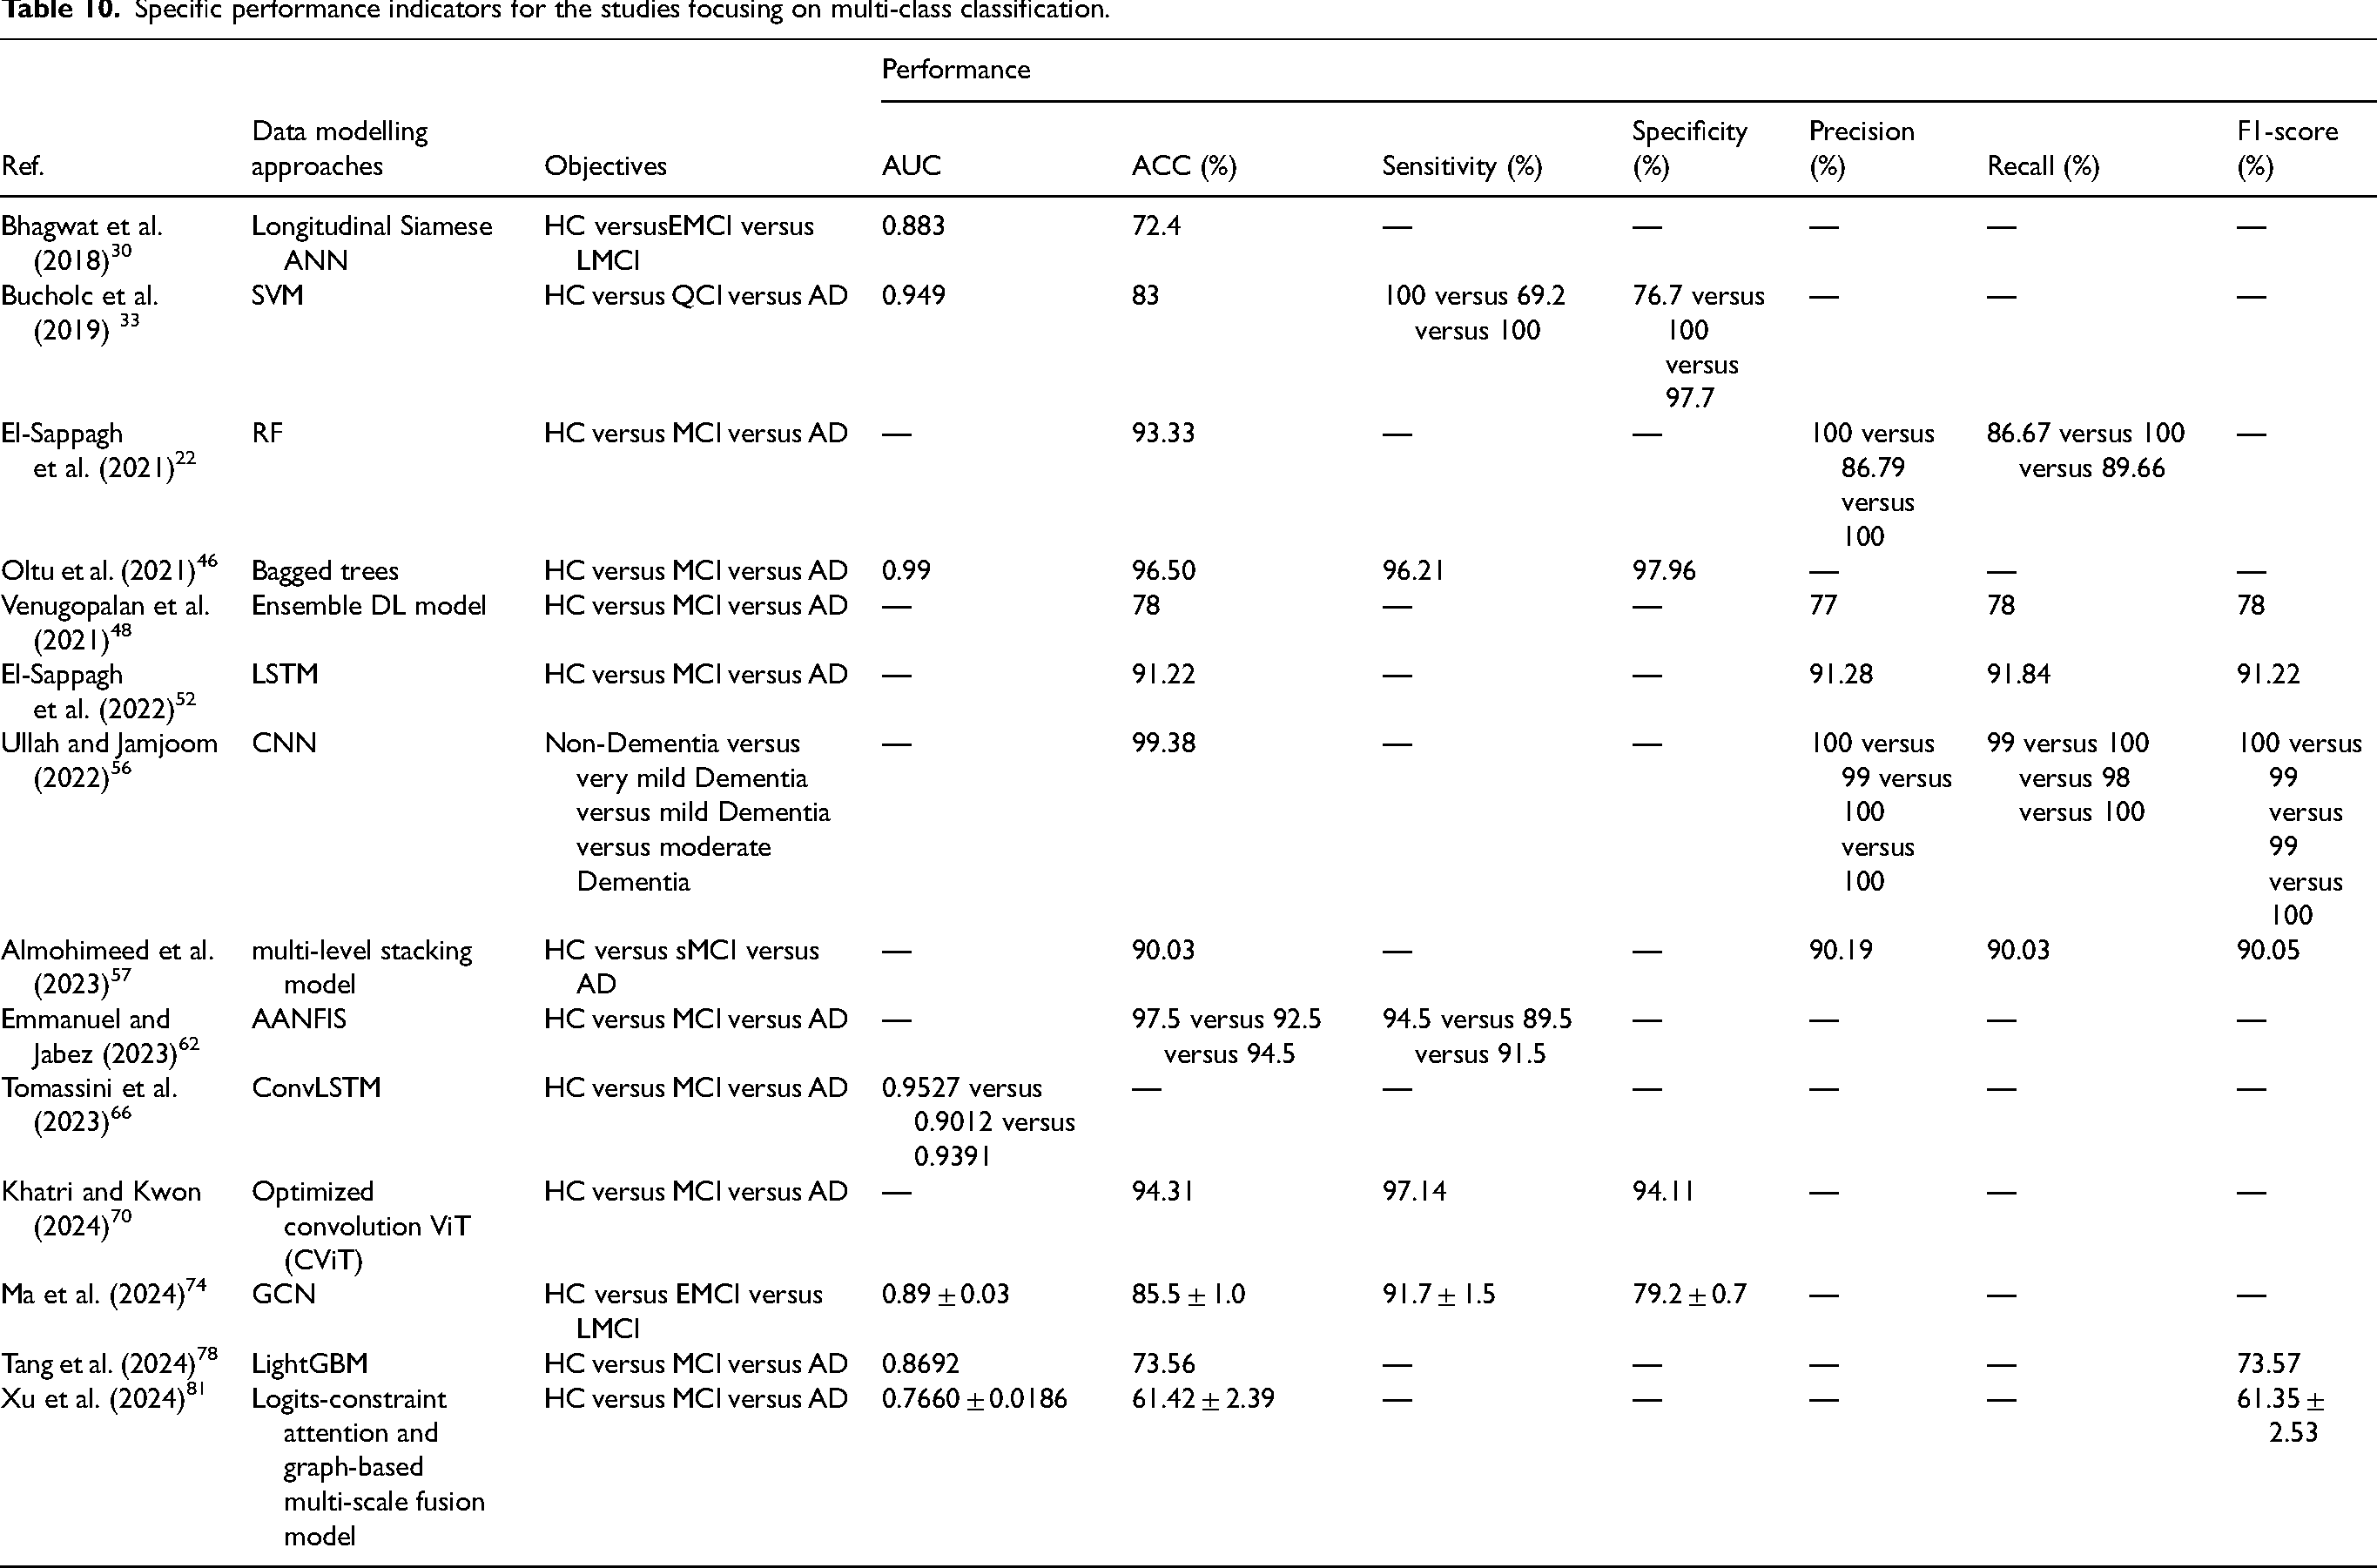
For the performance comparison with respect to the goal of CCDSS, 34 of the 55 studies focus on binary classification, 11 studies on multi-class classification, and 9 studies on conversion prediction (among which there are 3 studies that focused on both diagnosis and prognosis tasks simultaneously). The specific performance indicators for CCDSS focusing on binary-, multi- class classification and AD progression are summarized in Tables 9, 10, and 11, respectively.
Specific performance indicators for the studies focusing on binary classification.
Specific performance indicators for the studies focusing on multi-class classification.
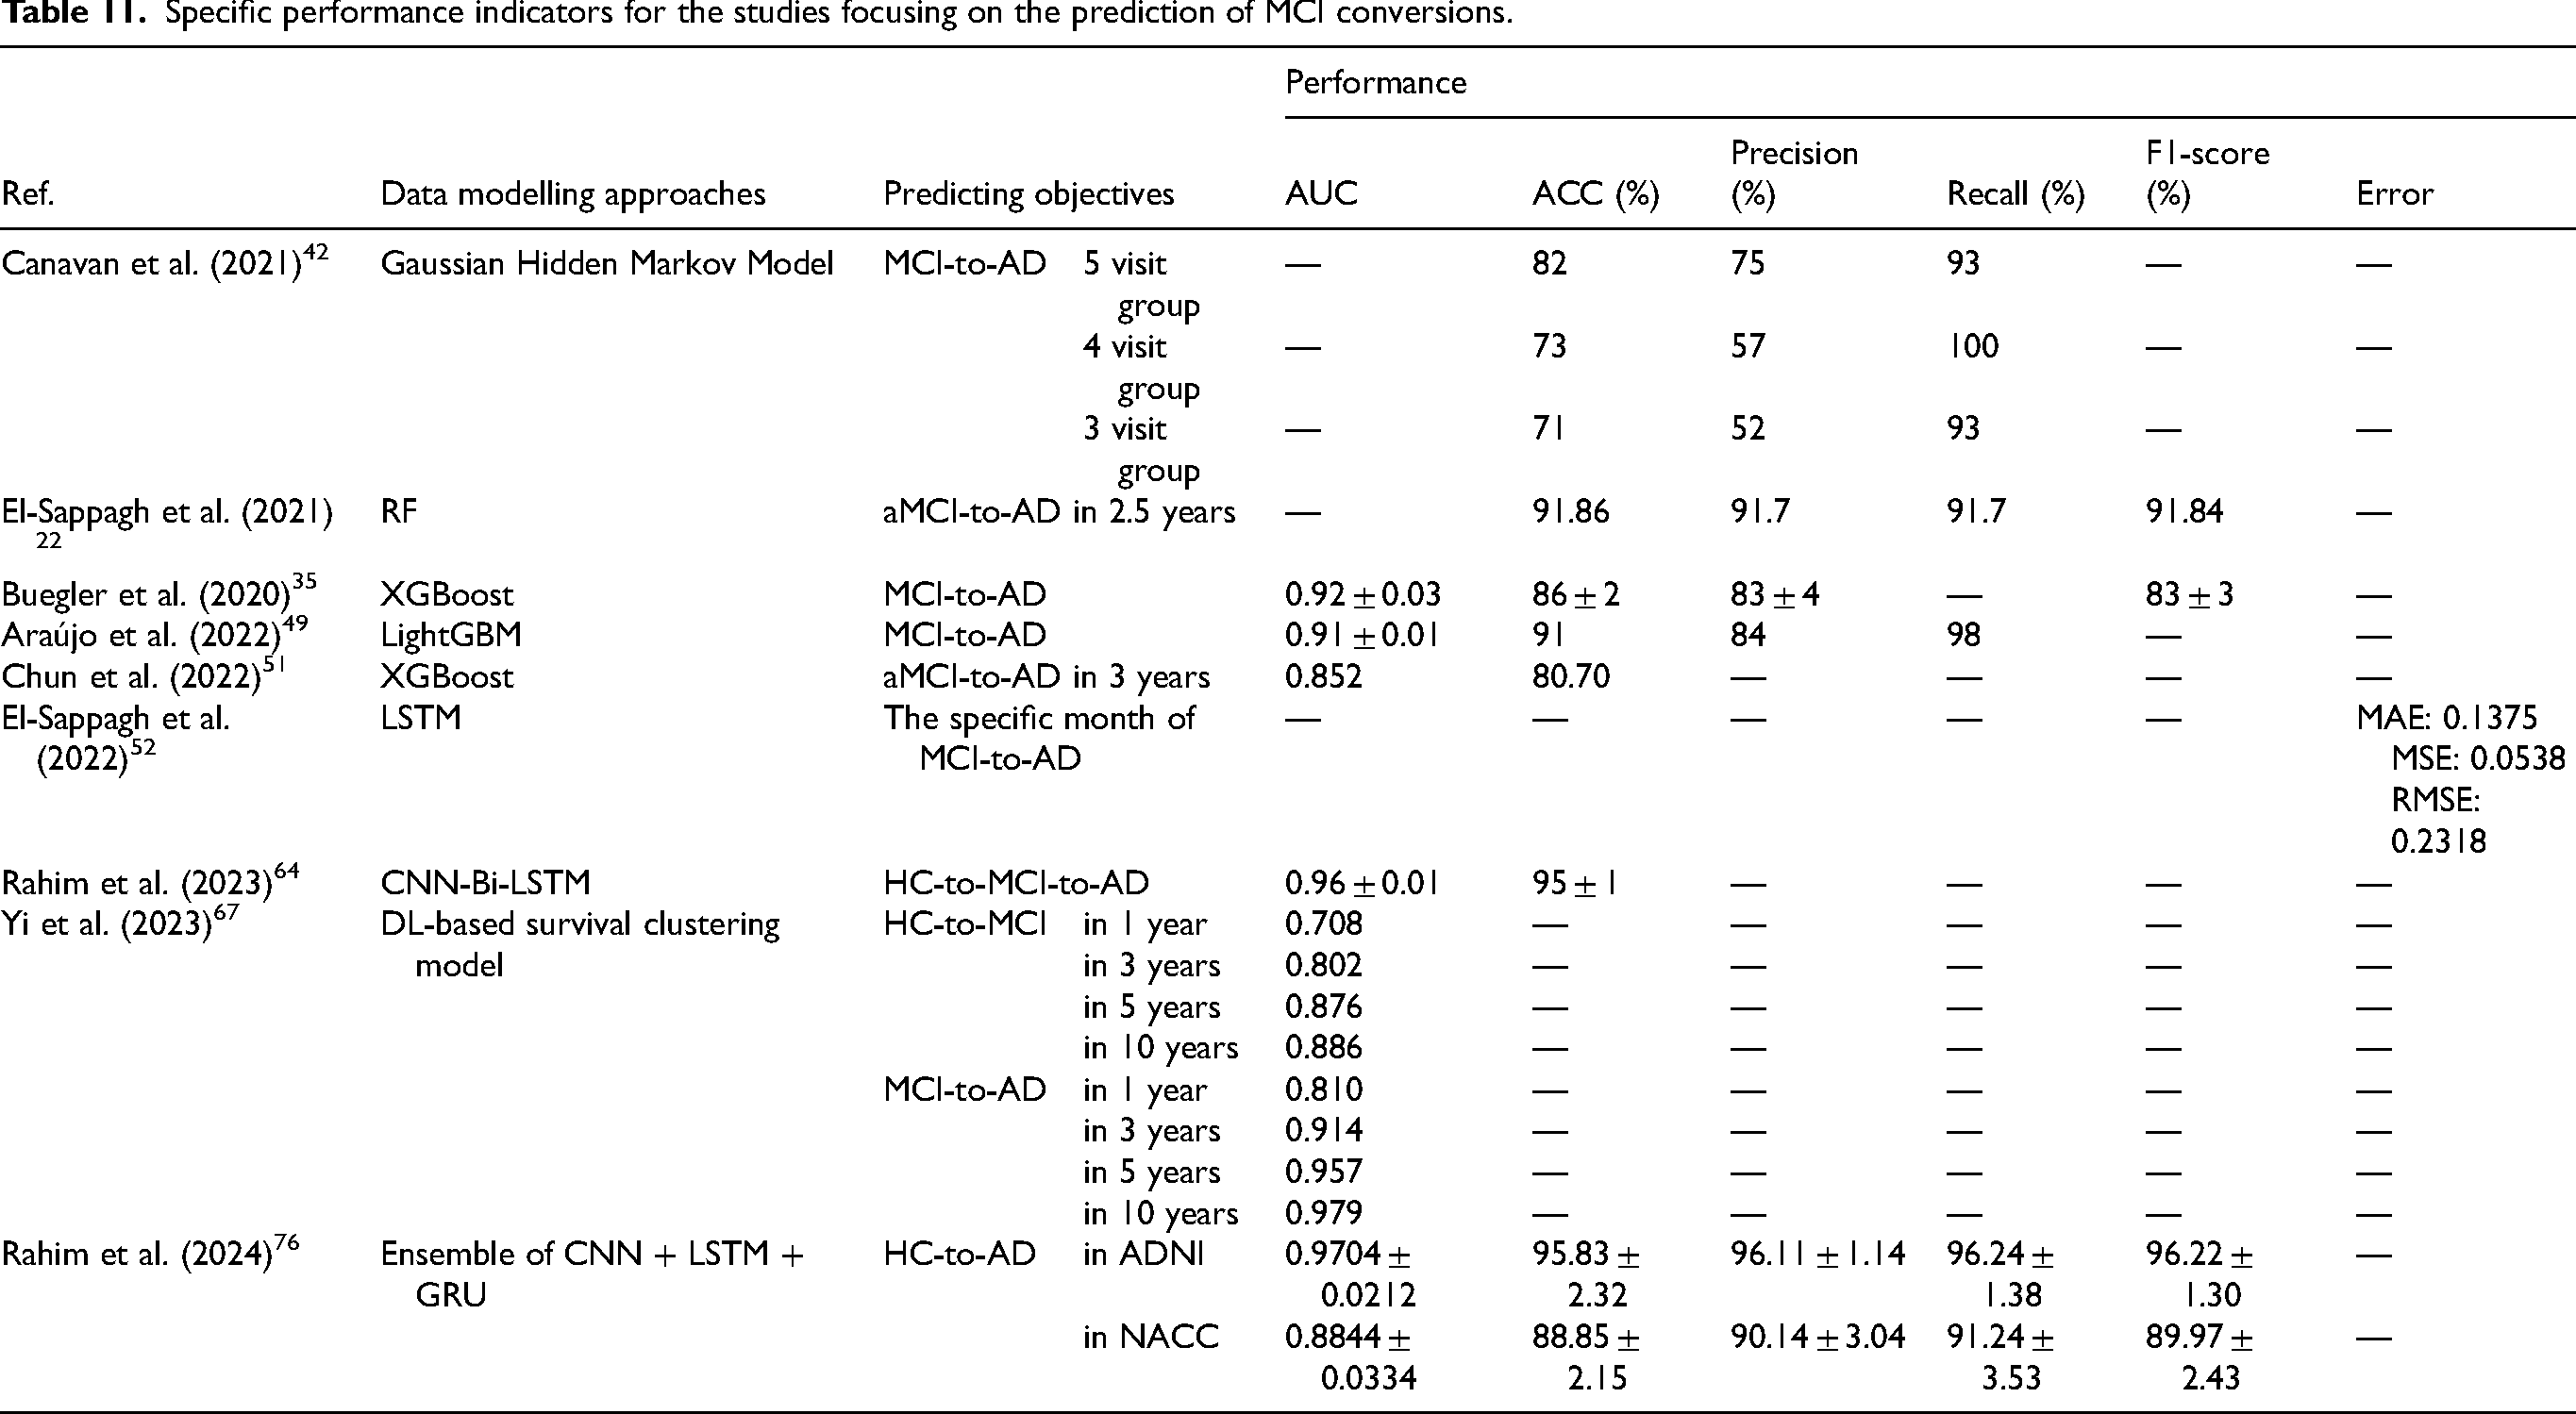
Specific performance indicators for the studies focusing on the prediction of MCI conversions.
In binary classification studies, the highest ACC for AD versus HC is 99.38% 38 and the highest AUC is 0.9981. 66 Meanwhile, the average ACC is 89.19% over the 19 studies.32,34,37,38,43,45,50,53,54,57,60,61,63,65,72,75,80,81,83 While the highest ACC for MCI versus HC is 96.47%, 83 and the average ACC is 84.59% over the 12 studies,30,41,43,47,59,61,65,66,70,71,74,83 which are lower than those for AD versus HC. This may be because the difference of MCI versus HC is less distinguishable than that of AD versus HC. In the multi-class classification studies, the highest ACC for HC versus MCI versus AD is 96.50%, 46 and the average ACC is 87.16% over the 10 studies.22,33,46,52,57,61,62,70,78,81
Furthermore, the 9 prediction studies are conducted for the conversions from HC to MCI and MCI to AD, 7 of which predict the conversion in patients (the AUC of 0.963 and ACC of 91.86% for MCI to AD 22 ; ACC of 82% for MCI to AD 42 ; AUC of 0.852 and ACC of 80.7% for MCI to AD 51 ; AUC of 0.96 and ACC of 95% for HC to AD, 64 AUC of 0.92 and ACC of 86% for MCI to AD 35 ; AUC of 0.91 and ACC of 91% for MCI to AD 49 ; AUC of 0.9704 and ACC of 95.83 for MCI to AD 76 ), one aims to predict the specific year of the conversions (the mean absolute error (MAE) of 0.1375, mean squared error (MSE) and root mean squared error (RMSE) of 0.0538 and 0.2318, respectively), 52 and the remaining one simultaneously focuses on the conversions of HC-to-MCI and MCI-to-AD (the AUC of 0.708, 0.802, 0.876 and 0.886 for predicting HC-to-MCI, and the AUC of 0.810, 0.914, 0.957 and 0.979 for predicting MCI-to-AD in 1, 3, 5 and 10 years, respectively). 67
System explainability and model interpretability
Using the constantly developed ML technologies, some well-trained models can even approach theoretically 100% classification accuracy. 104 However, the interpretability of the models is more crucial for clinicians to understand the diagnostic results from a pathological point of view and be able to explain the cause of the disease to the patient. 105 And the black-box mechanism in some ML methods may bring underlying bias and injustice, though the decision-making is correct. 106 Only the interpretable model can be supportive to find out the pathogenesis and thus validate pathological knowledge. Therefore, many current CCDSS are committed to improving the interpretability of the model embedded.
To achieve this, various explainable AI (XAI) techniques and methods have been developed. 107 For instance, the Shapley additive explanations (SHAP) method uses additive attribution to convert SHAP values from the machine learning feature space to the clinical variable space. 108 This transformation improves the interpretability of previous difficult-to-explain algorithms or models, which can effectively explain diagnostic results by visualizing the contributions of different features.109,110 Furthermore, the local interpretable model-agnostic explanations (LIME) method is employed to analyze and provide explanations for the prediction outcomes of individual samples, which can be applied to any ML model. 111 Also, the DL library contains some XAI libraries, such as Pytorch Captum and tensorflow tf-explain, for interpreting the DL model. El-Sappagh et al. 112 referred to the methods used for explaining model results as post-hoc XAI techniques, which imitate or simulate the behavior of the model in order to provide explanations. Post-hoc XAI offers both global and local explanations.
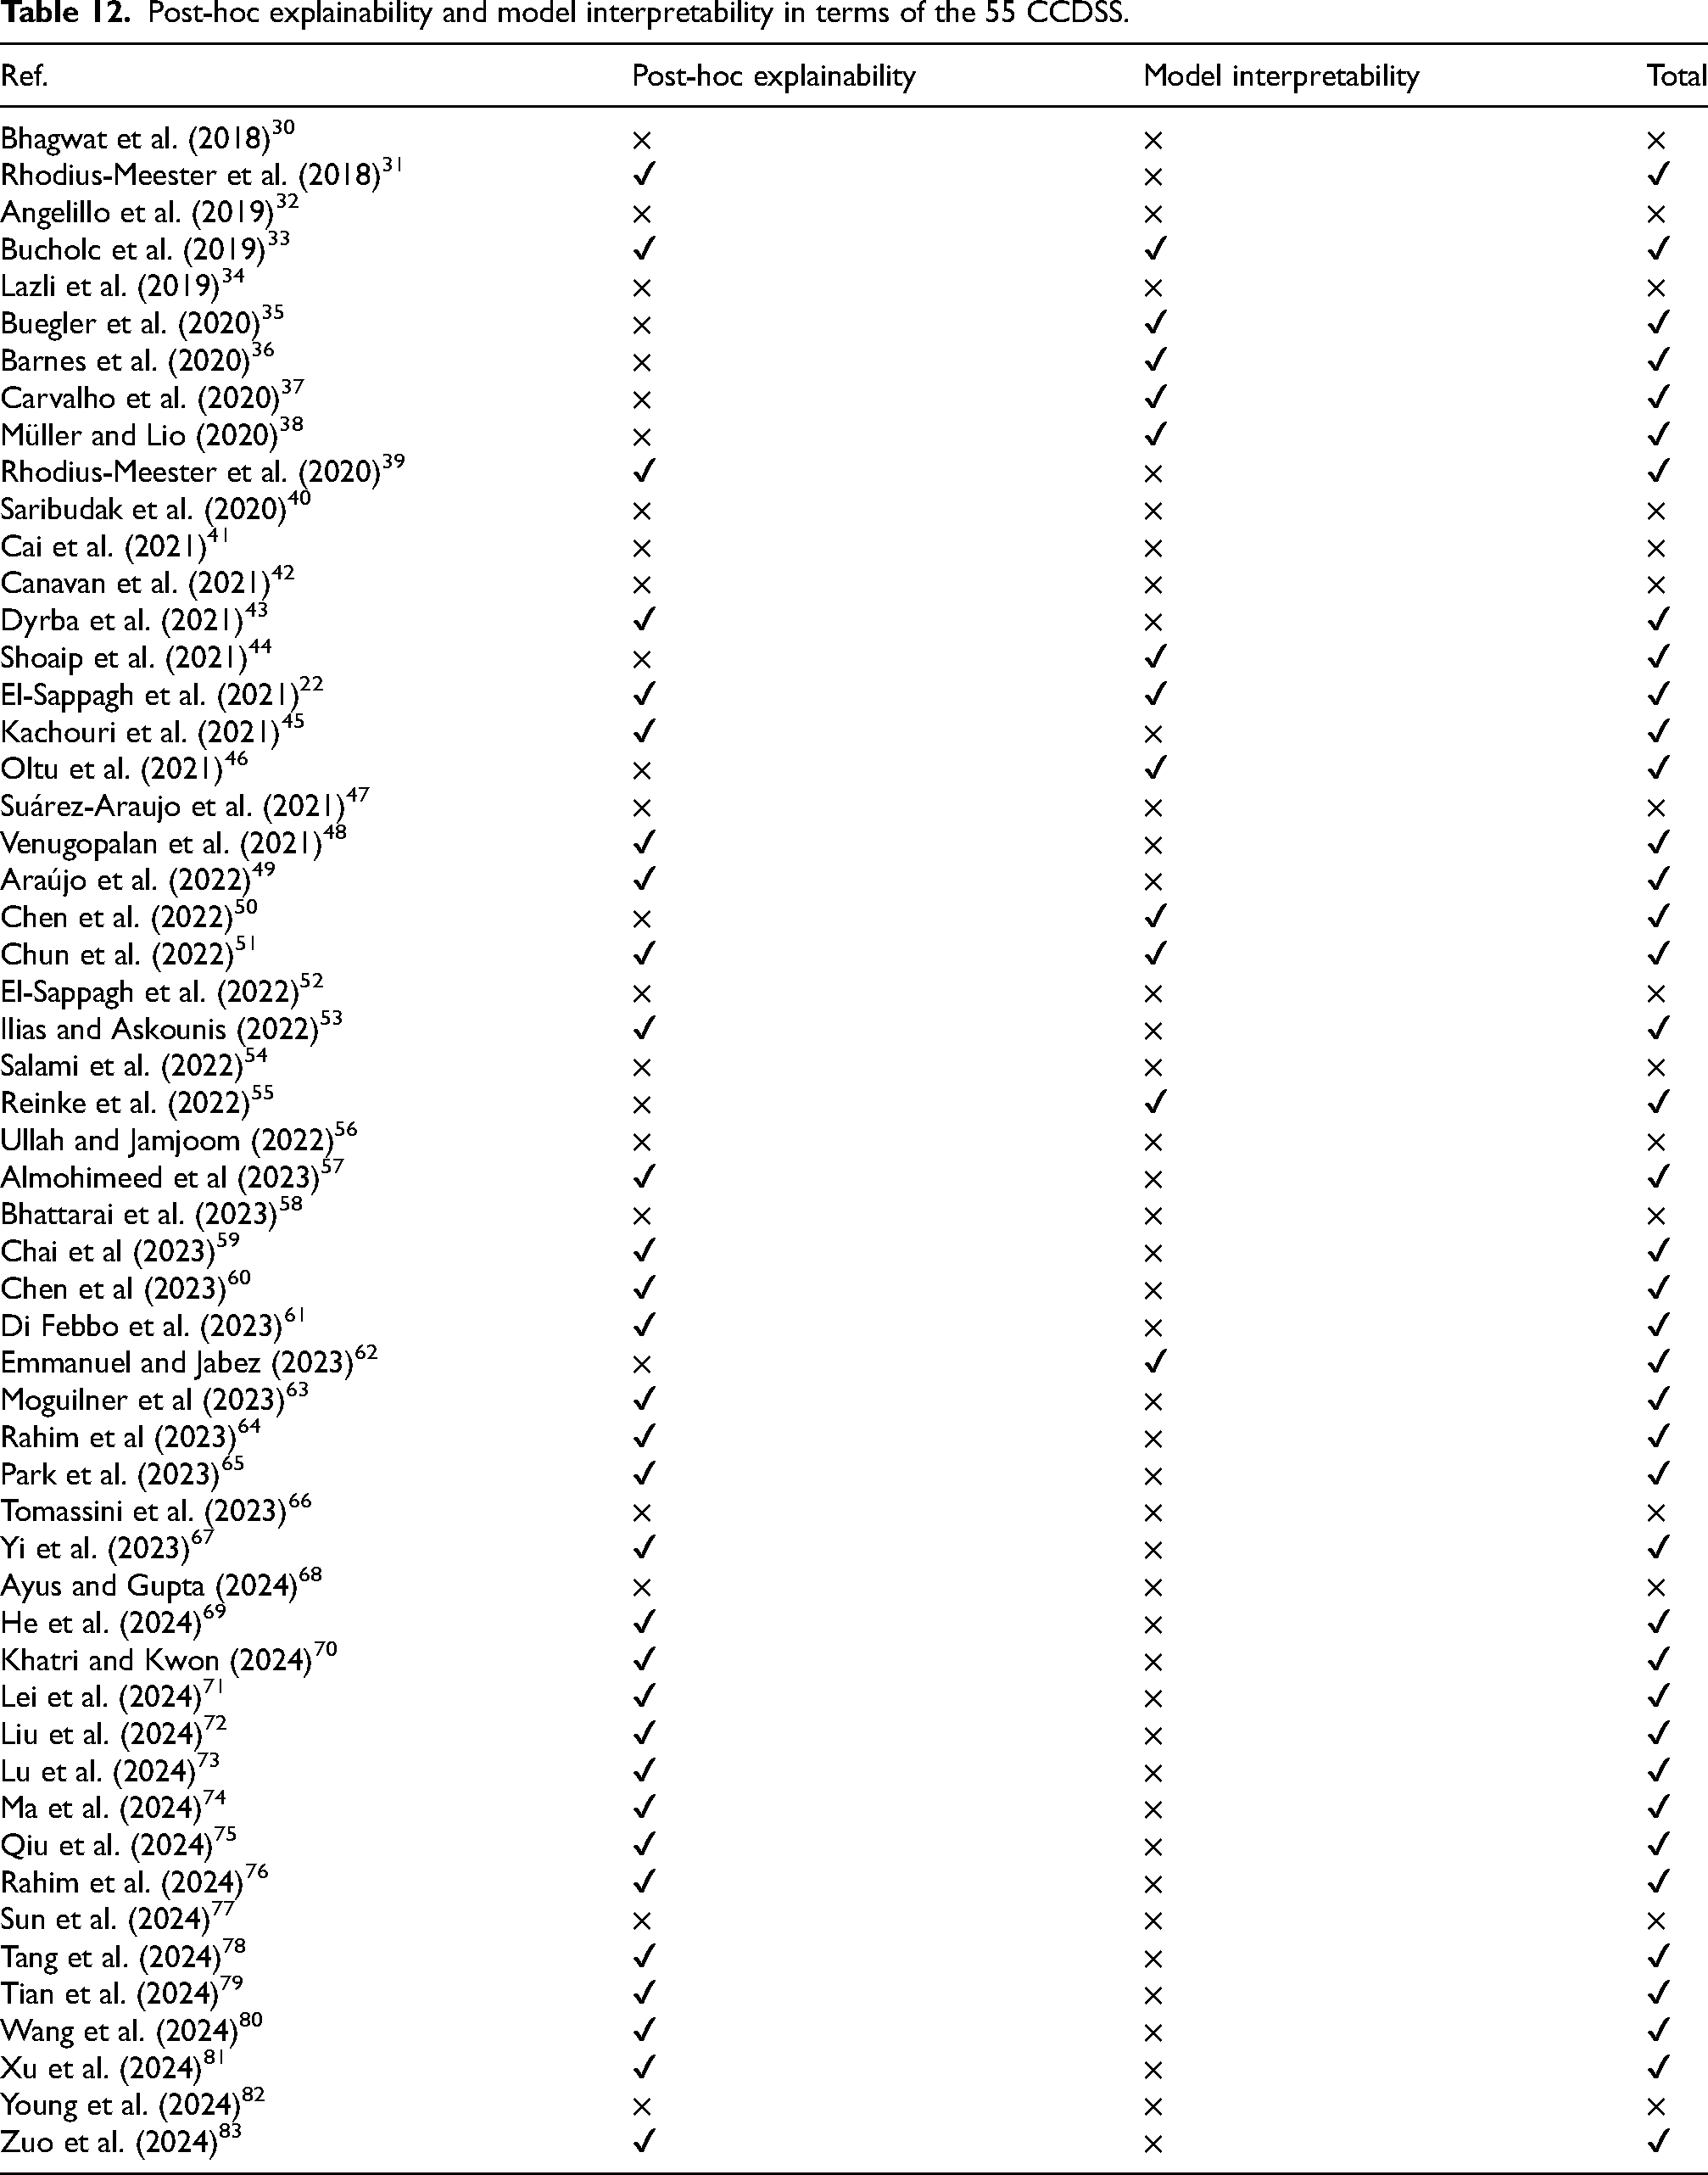
In practice, explainability and interpretability are two different concepts in level of detail. The former focuses on explaining the decision made by the CCDSS, while the latter focuses on understanding the insight of the models embedded. Especially, there is no standard definition for interpretability, because models can be interpreted at a greater level of detail and the criteria used to evaluate model performance may vary from different models. Tjoa and Guan 113 reported that, if the interpretations provided can achieve better task performance, then the model is considered highly interpretable, regardless of the traditional ML or DL models. For example, some medical segmentation works constitute a visual interpretation for further diagnosis or prognosis of the disease. They asserted that the proposed opaque models are deemed acceptable due to uncertain and incomplete medical knowledge. This implies that achieving high accuracy in diagnosis is prioritized over interpretability. However, in the medical field, where clinical decisions carry significant accountability, clinicians are required to meticulously consider additional details. In some critical situations, the decision made by the CCDSS without interpretations and explanations may not be entirely relied. Nevertheless, before the black box is opened, decision-making always has certain risks. Hence, the interpretability research is still essential even more crucial. Next two subsections will in more detail review system explainability and model interpretability, respectively. The XAI categorization is shown in Figure 6. Table 12 identifies which among the 55 CCDSS studies is developed based on XAI techniques and/or provides explainable results using an interpretable model. Of the 55 studies included, 44 offer diverse explanations from multiple perspectives and levels. These studies aim to provide doctors and users with valuable, practical insights, enabling them to make more accurate and informed judgments and decisions in AD management.
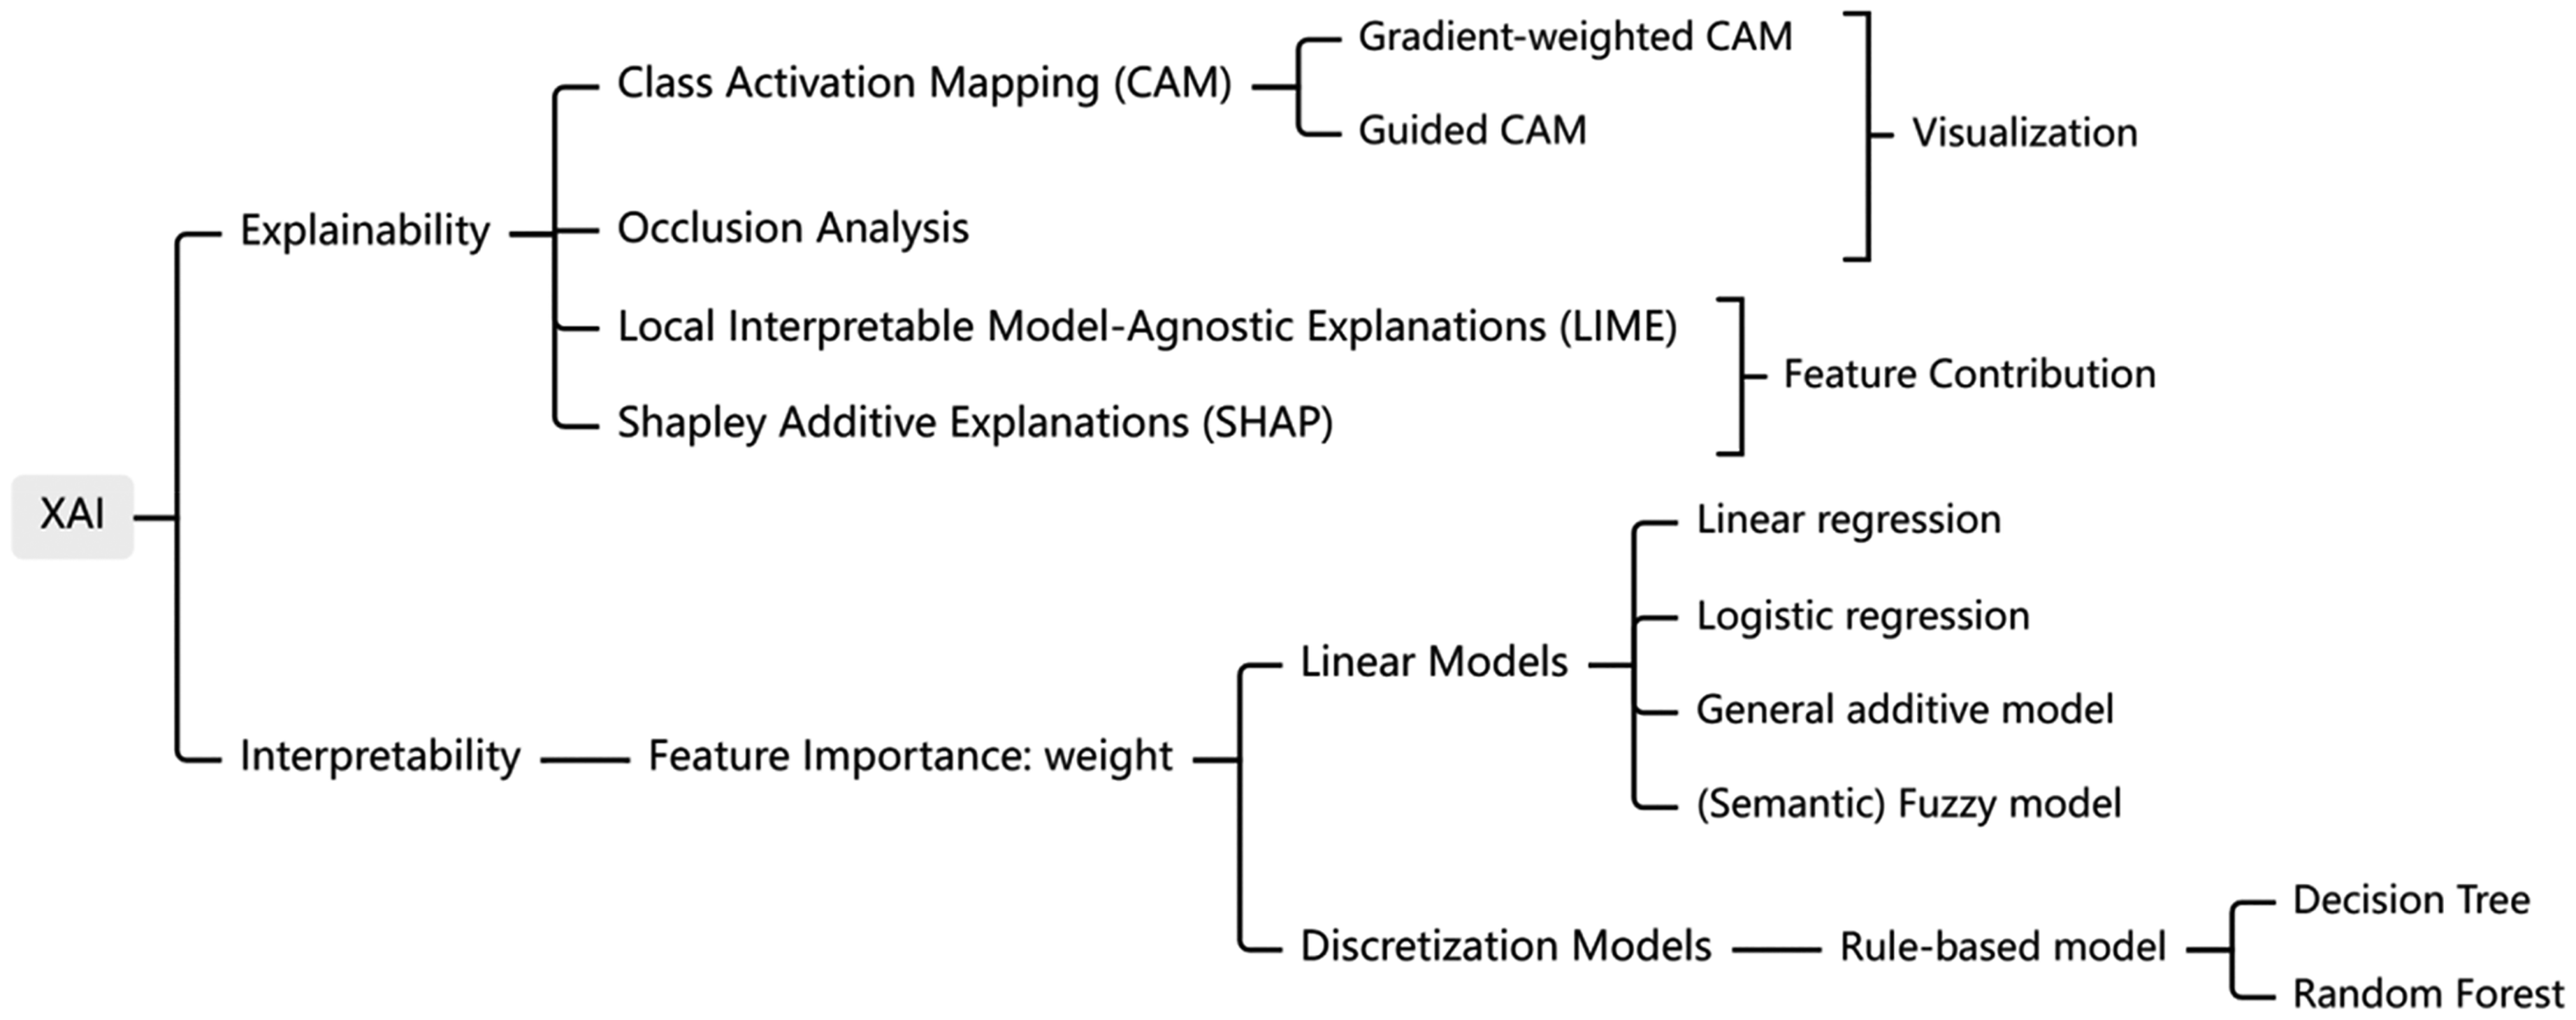
Classification diagram of XAI technology.
Post-hoc explainability and model interpretability in terms of the 55 CCDSS.
Explainability of the CCDSS
In fact, many research endeavors have been made to design explainable CCDSS for AD. Some studies use XAI to conduct explanatory analysis on models’ results. Chun et al. 51 implemented a graphical interface of both global and local explanations of the model. The global explanations can be achieved by the method of feature importance and the partial dependence plot (PDP), where feature importance is determined by observing the decrease in performance caused by randomly mixing specific features, and PDPs illustrate how average predictive values change when a specific feature varies across its marginal distribution. 114 While local explanation can be achieved through individual conditional expectations (ICE), break-down chart, and SHAP. The ICE plots show the local behavior of the model by holding other features constantly at specific eigenvalues. 115 These plots generate multiple curves, each representing the conditional expectation of a feature. The break-down chart illustrates the characteristic contribution to explaining the predictive results, while SHAP explains a single sample by calculating the contribution of each feature to the result. Judging from the results of global and local explanation, the CDRSB score is the most important feature due to its more objectiveness than the clinical diagnosis. The two-stage model, 22 implemented the SHAP method for both global and local explanations, and the global feature importance could be calculated through the SHAP. The first-stage found that the most influential feature is CDRSB, followed by MMSE; FAQ plays a major role in the second-stage and ADNI_MEM (which is composite logical memory score for the 8 longitudinal changes in memory) is the runner-up feature. In addition, supplementary explanations were generated to explain the RF model results based on DT and fuzzy unordered rule induction algorithm, which enhance the interpretability and confidence of the model. Di Febbo et al. 61 used the SHAP method to analyze the importance of partial features in ROCF, making their model easier to understand. Almohimeed et al. 57 utilized the SHAP method to conduct feature contribution analysis for decision-making, revealing the decisive features in the diagnosis of AD versus HC, as well as AD versus MCI versus HC. Yi et al. 67 attempted to unveil patterns in transformation predictions using SHAP and employed it as an indicator of its importance in pattern assignment. Ilias and Askounis 53 constructed a diagnostic model using text data transcribed from audio recordings of AD patients. They utilized LIME to explain the diagnostic results of the outperformed model and provide further information on language differences between AD and non-AD individuals.
Furthermore, some studies conduct explainability analysis on the results through custom visual interfaces. Dyrba et al. 43 designed an interactive visualization software for explaining the results from the 3D CNN model by generating a set of 2D relevant maps for each result and then capturing the brain regions related to AD. The visualization of the results show that hippocampus atrophy presents important information leading to AD and the atrophy of other cortical and sub-cortical regions also contributes to AD. Moguilner et al. 63 applied occlusion sensitivity to analyze sMRI images, identifying and visualizing the most relevant brain regions for the classification of AD and HC. Chen et al. 60 and Chai et al. 59 visualized brain activity by utilizing the power spectral density of different EEG frequency bands as features. Rahim et al. 64 utilized the guided gradient-weighted class activation mapping (Grad-CAM), which is a technique used in computer vision and DL algorithms to visualize image regions associated with specific class predictions, to provide information about the exact voxels involved in making accurate decisions within the CNN-Bi-LSTM model. Additionally, other views highlighting the same brain regions of interest are presented from different angles, offering a comprehensive explanation of the DL model. In 2018, Rhodius-Meester et al. 31 provided a disease state index (DSI) fingerprint of the model results for each patient, which combines all available data from that patient. The DSI value is presented both numerically and visually in color. DSI fingerprint displays the correlation between features and disease through boxes of different sizes, with larger boxes indicating a greater contribution of that feature to classifying sSCD and pSCD. Rhodius-Meester et al. 39 designed a visual interface to explain the results of simulated CSF in order to determine if the actual CSF is necessary for further diagnosing AD. They set up a probability of correct class value and analyzed its impact on the diagnosis of AD. Another visual interface developed can depict the severity of AD along with the corresponding cognitive and functional assessment scores. 33
In addition, Venugopalan et al. 48 ranked features based on model decreasing accuracy to determine their importance and gain insights into the model's decision-making process for the purpose of explainability. On the other hand, Kachouri et al. 45 employed principal component analysis to pinpoint the aspects of features that are more representative, thereby gauging how effectively the model has learned from them. Carvalho et al., 37 meanwhile, assessed feature importance by computing the certainty factor, revealing that the score of Clinical Dementia Rating scales (CDR) is particularly significant for diagnosing AD, with a certainty factor reaching 0.99.
Interpretability of the model
Linear models (e.g., linear regression, logistic regression (LR), general additive models, and (semantic) fuzzy models), discretization models (e.g., rule-based models, DT, or Bayesian network (BN)), and example-based models (including k-nearest neighbors (KNN) or case-based reasoning models) are generally considered interpretable. 112 It is found that more than half of the 55 studies chose traditional ML algorithms, because they are more interpretable than DL. It is particularly noteworthy that the ensemble algorithm based on the DT was widely used in these studies, as the DT produces rules and results that are easy to understand to a certain extent and the features importance can be calculated through DT structure. Methods such as bagged trees, as used for the classification of HC versus MCI versus AD, 46 XGBoost as utilized for predicting aMCI to AD, 51 and RF as employed for the classification of AD versus HC 38 are employed to calculate feature importance in order to explain the diagnostic results. In terms of the SVM method which is even less intuitively understandable than RF, it still is used in CCDSS for AD,33,41,59 because the SVM-based model, compared with that base on DL, can enhance its interpretability, such as by understanding feature weights through feature importance or understanding decision boundaries through the visual support vectors.
Some studies achieve interpretability through rule-based models. Mendel and Bonissone 116 proposed a rule-based system which is considered as an interpretable model. Müller and Lio 38 obtained the rule library by extracting the construction rules of RF, in which the rules are usually in the form of “IF” “THEN” and “ELSE”. Finally, by visualizing the rules of the predictive results, the model can be interpretable and the output of the system can be explainable. Chen et al. 50 provided a fuzzy rule base and inference process, which illustrates each rule using Gaussian membership functions and linguistic terms represented by fuzzy numbers. Also, the rule visualization provided by the study 62 is similar to that of the study. 50
However, deep models themselves lack interpretability, such as the ensemble model consisting of ResNet18 54 and the counter propagation network (CPN). 47 Deep models are more complex and challenging to understand compared to traditional ML models. Nevertheless, the lack of model transparency remains a significant obstacle for implementing CCDSS in clinical practice. 117 When clinicians utilize non-interpretable models for clinical practice (despite their high accuracy), concerns may still arise regarding the decision outcomes.
GUI design review
The factors to consider when evaluating the CCDSS include its usability, specifically how easy it is to use and how much training is required for its utilization. 118 One of the most straightforward aspects to assess in this regard is the evaluation of the GUI design tailored for non-technical stakeholders, because the GUI can introduce a transformative pathway, equipping stakeholders with the means to initiate the evolution of CCDSS that hold the potential to impact AD-related decision-making and intervention strategies.
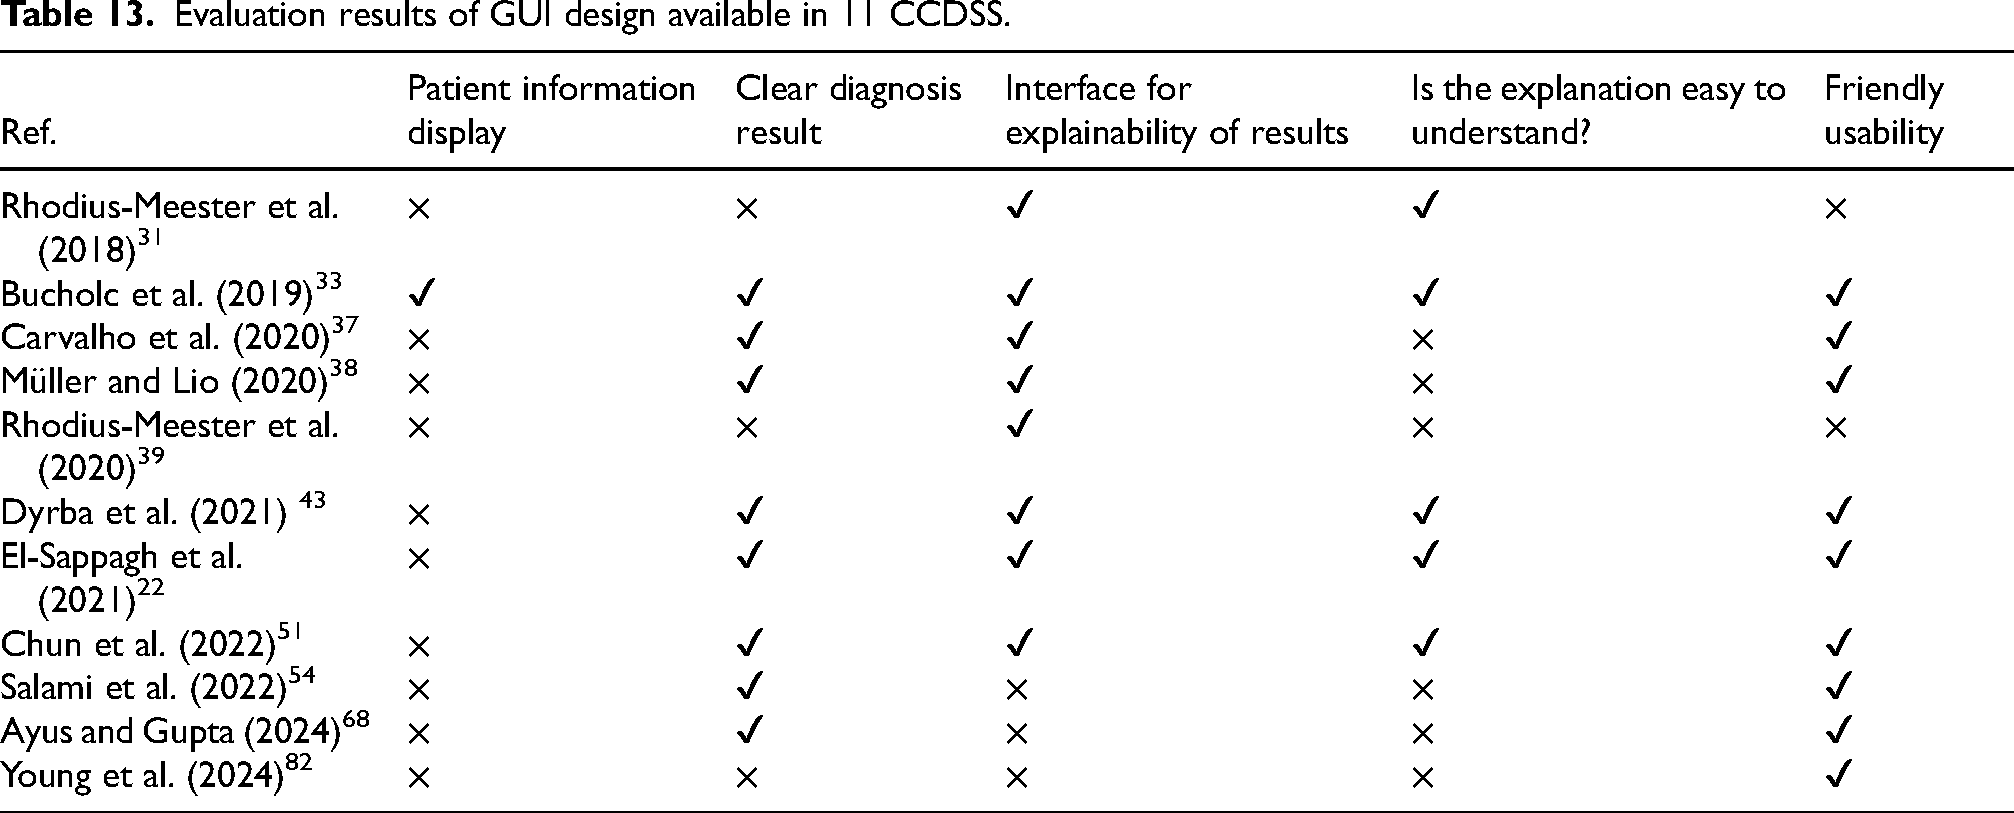
When evaluating the GUI associated with CCDSS, we focus on several key aspects. First, the overall design of the interface, e.g., whether it includes patient demographic information, is examined. Second, we look at how decision supports are presented and whether there is a clear decision support available. Then, we assess whether the interface provides explainability analysis for various clinical tasks and if the explanations provided are simple and easy to understand. After all, CCDSS is an encapsulated design like a black box especially for healthcare professionals who need to know the decision-making process in order to have greater confidence in it and further make precisely personalized treatment. Lastly, we consider the usability of the interface by examining whether it is intuitive and friendly for new users to quickly get started. Taking all these aspects into consideration, our research findings in relation to the GUI design available in 11 CCDSS can be summarized in Table 13.
Evaluation results of GUI design available in 11 CCDSS.
Results summary
This study evaluates 55 CCDSS based on data modalities, computational modeling, explainability and interpretability, research priorities, and GUI. These systems serve various functions, including diagnosis, disease management, prescription support and etc. 119 Among them, 44 focus on classifying AD, MCI, and HC, while 9 predict the progression of MCI to AD. Current CCDSS research prioritizes diagnosis and prognosis, with limited focus on other decision-support areas—only two studies recommend drugs, one suggests examinations, and another offers care recommendations. Notably, some systems integrate both diagnosis and prognosis, enhancing clinical decision-making.22,53
Using data from multiple different datasets can not only avoid the problem of data bias, but also avoid overfitting of modeling methods with the increase of data volume. 120 But in the results, less than a third of the CCDSS uses multiple datasets. Most of them use public ADNI data, while some rely on hospital or memory clinic datasets.
At the aspect of explainability and interpretability, traditional ML, favored for its interpretability over DL, remains widely used. Early CCDSS are expert systems requiring extensive domain knowledge, but modern approaches favor data-driven models, necessitating careful consideration of explainability and interpretability. This review examines interpretability methods, including Grad-CAM for image visualization and SHAP/LIME for feature attribution, aiding clinicians in understanding model predictions.
In addition, interoperability and data security remain a challenge for CCDSS across different medical systems, with only two studies taking it into account. Prior research proposes the incremental learning technology, which can incorporate new input and output without having to relearn the entire data again. 121 Carvalho et al. (2020) 37 proposed a dynamic decision-making model that can adapt to different medical centers by increasing assessment data, while also improving diagnostic capabilities in this way. Furthermore, Lei et al. (2024) 71 developed a federated learning framework to enhance data security without direct data sharing. Future CCDSS research should expand beyond diagnostic accuracy to improve explainability, interoperability and data security, and practical deployment.
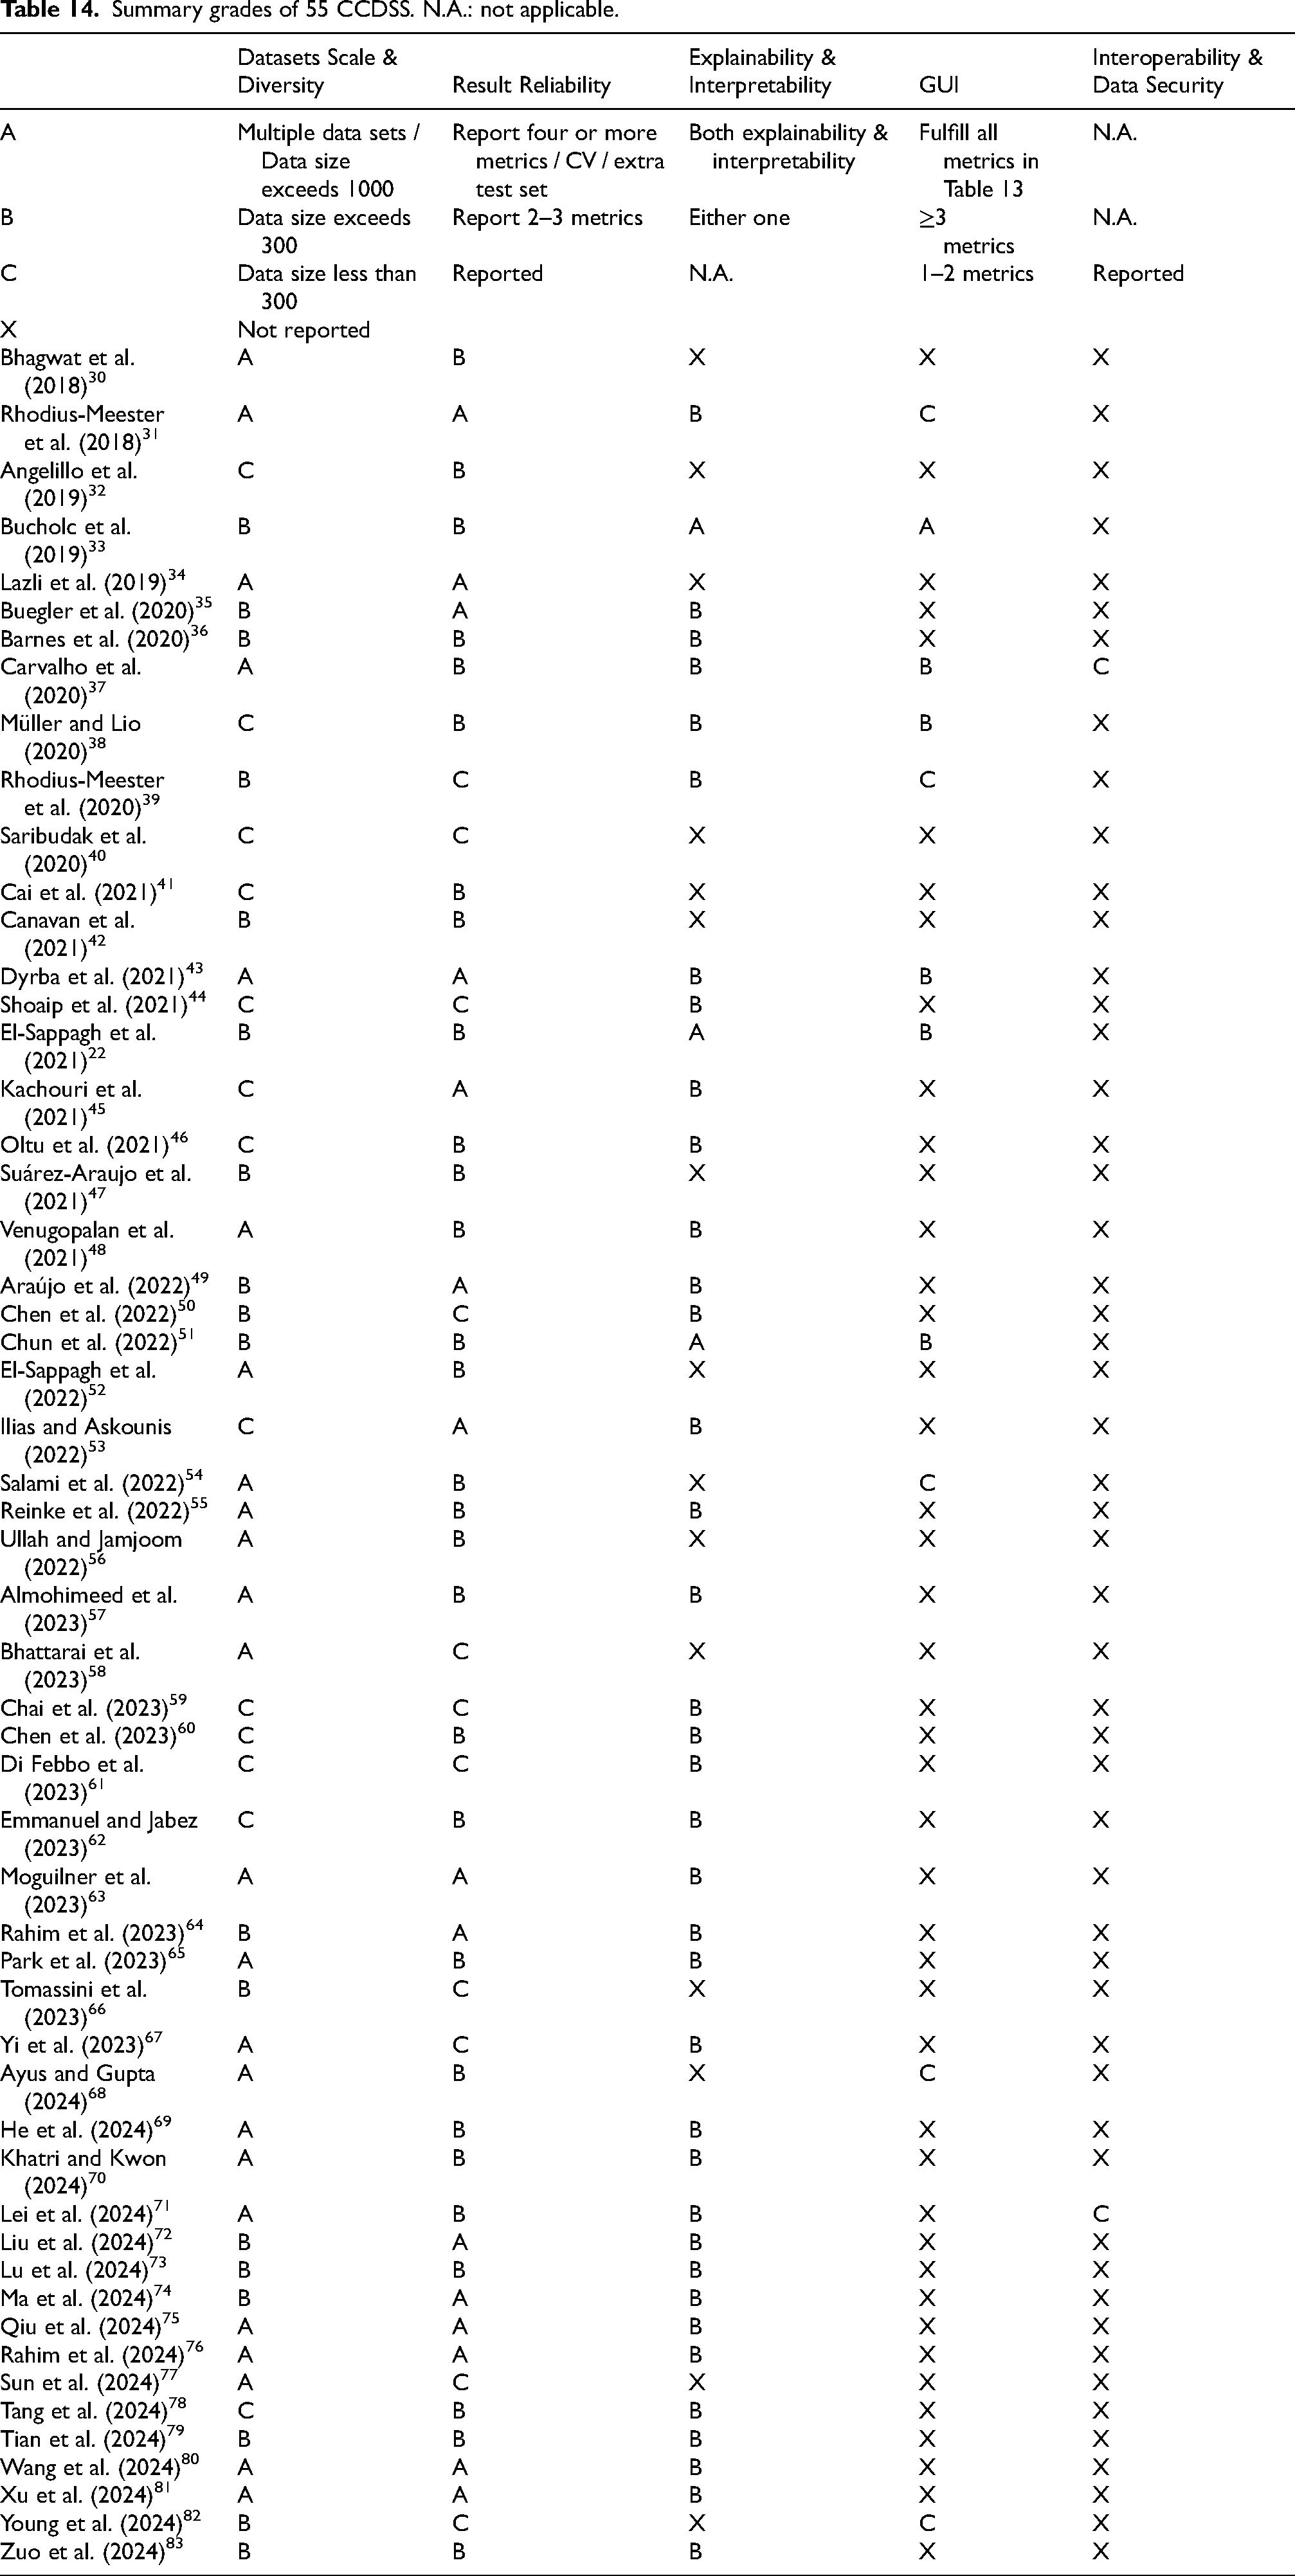
Therefore, based on model construction requirements, result analysis, and clinical application levels, we classify these 55 CCDSS into grades from A to X, evaluating them across five dimensions: datasets scale & diversity, reliability of reported performance, interpretability, user-friendly GUI, and interoperability & data security of multi-center systems. The explanation of grades divided from A to X is shown in Table 14 (top panel) for details. Notably, only Carvalho et al. (2020) 37 and Lei et al. (2024) 71 have taken into account the aspect of interoperability and data security in multi-center systems. However, Lei et al. (2024) 71 does not report on the GUI. Overall, the study from Carvalho et al. (2020) 37 demonstrates excellent clinical translational potential, as evidenced by the grading of ABBBC in Table 14.
Summary grades of 55 CCDSS. N.A.: not applicable.
Discussion
This work systematically extracts and reviews 55 studies on CCDSS for AD that have been developed over the last seven years. These studies use different data modeling approaches based on different data modalities to assist clinicians making decisions on different tasks such as diagnosing and prognosing AD. Clinically, AD diagnosis often relies on a variety of information, such as cognitive and neuropsychological assessment scale, neuroimaging and genetic test results. However, due to the complexity and heterogeneity of AD pathology, it is prone to clinical misdiagnosis. The CCDSS built with AI technology can diagnose AD patients from healthy populations relatively accurately and predict the disease progression of MCI to AD. This not only enhances clinicians’ confidence in diagnosis but also enables the design of personalized treatment plans through various CCDSS configurations, thereby achieving more precise prognostic outcomes and accelerating the care pathway. 122
The challenges of this review arise from the use of various data modalities and modeling methods, as well as the need to compare a wide range of studies with differing objectives. Several systematic reviews have focused on using ML to predict the progression of AD.7,123,124 Similarly, studies on ML and DL techniques for diagnosis aim to explore how these advanced technologies can improve diagnostic accuracy and efficiency.125,126 These reviews typically focus on a single modality or goal. However, to the best of our knowledge, there are few systematic reviews addressing computerized decision support systems specifically designed for clinical practice in the AD domain. In this case, our work could fill the gap of a lack of such review and updates. By analyzing the screened articles from different angles, we have comprehensively considered the functionalities, performance and explainability of the CCDSS currently reported, as well as its clinical practicability and GUI availability. It hence would provide a reference and a direction for enhancing the subsequent research and improving the design of CCDSS.
However, the challenges are still remain in clinical settings and local deployment. The challenges and corresponding recommendations of implementing CCDSS in clinical settings are as follows:
Model transparency: When it comes to medical transformation, building a trustworthy AI-based CCDSS is so important because doctors should be feeling confident enough with the decisions made by such CCDSS that directly affect people's lives. Currently, there are numerous XAI techniques available for explaining decision outcomes. However, the acceptance of these explanations requires evaluation by clinical professionals, which relies on effective communication between technical experts and clinical practitioners. The interoperability across different medical systems: Few studies have looked at interoperability in healthcare, but this must be addressed if CCDSS are to be promoted clinically. First of all, a unified standard in hospitals can be developed by an authority or relevant government departments to make the data structure of all hospitals consistent. Second, an incremental model can be used to provide different personalized systems. Being regularly refinable over time: The model needs to be refined regularly to ensure that it can learn new data and the latest trends in medicine, such as retraining clinical samples over a period of time. Data security: If the system is deployed across multiple locations on a cloud server, data security must be ensured to prevent any leakage of patient information.
Although the analysis of the filtered articles is as detailed as possible, this review still has limitations as follows: 1) non-English literature and some unobtainable literature are not included; 2) publications that only focus on the performance of algorithms are also excluded. To solve these limitations, our future work will consider incorporating studies that specifically focus on algorithm performance. If these studies demonstrate high-performance models and solutions with clinical usability, it will significantly contribute to the practical implementation of translational CCDSS in the medical domain.
To conclude, with the rise of precision medicine, CCDSS for AD has become an area of growing interest. The review highlights the potential for transformation of existing CCDSS through data-driven models. There are still challenges in integrating these CCDSS into clinical practice, particularly regarding interoperability and data security, as well as decision explainability. Overcoming these challenges requires improving model generalization with diverse data and balancing high accuracy in deep learning models with clinical interpretability needs. Additionally, designing user-friendly graphical interfaces is crucial for practical application, but must align with clinical needs. While there are significant challenges in integrating CCDSS for AD into clinical practice, there is also great potential for these systems to improve diagnostic accuracy, efficiency, and patient outcomes. By addressing the challenges of model transparency, interoperability, regular refinement, and data security, and by involving stakeholders in the design and evaluation process, future research can move closer to realizing the full potential of CCDSS in the medical domain.
Footnotes
Acknowledgments
The authors have no acknowledgments to report.
Author contributions
Funding
The author(s) disclosed receipt of the following financial support for the research, authorship, and/or publication of this article: This project was support by the Research Development Projects of Fujian Normal University, China (grant numbers DH-1736, DH-1711); Joint Funds for the Innovation of Science and Technology, Fujian province, China (grant number 2023Y9283); ARUK NI networking grant (grant number 71573R).
Declaration of conflicting interests
The author(s) declared no potential conflicts of interest with respect to the research, authorship, and/or publication of this article.
Data availability statement
All data generated or analyzed during this study are included in this published article