
Abstract
Background
Language deficits often occur early in the neurodegenerative process, yet traditional methods frequently fail to detect subtle changes. Natural language processing (NLP) offers a novel approach to identifying linguistic patterns associated with cognitive impairment.
Objective
We aimed to analyze linguistic features that differentiate cognitively unimpaired (CU), mild cognitive impairment (MCI), and Alzheimer's disease (AD) groups.
Methods
Data was extracted from picture description tasks performed by 336 participants in the DementiaBank datasets. 53 linguistic features aggregated into 4 categories: lexical, structural, syntactic, and discourse domains, were identified using NLP toolkits. With normal diagnostic cutoffs, cognitive function was evaluated with the Mini-Mental State Examination (MMSE) and Montreal Cognitive Assessment (MoCA).
Results
With age and education as covariates, ANOVA and post-hoc Tukey's HSD tests revealed that linguistic features such as pronoun usage, syntactic complexity, and lexical sophistication showed significant differences between CU, MCI, and AD groups (p < 0.05). Notably, past tense and personal references were higher in AD than both CU and MCI (p < 0.001), while pronoun usage differed between AD and CU (p < 0.0001). Correlations indicated that higher pronoun rates and lower syntactic complexity were associated with lower MMSE scores and although some features like conjunctions and determiners approached significance, they lacked consistent differentiation.
Conclusions
With the growing adoption of artificial intelligence (AI)-based scribing, these results emphasize the potential of targeted linguistic analysis as a digital biomarker to enable continuous screening for cognitive impairment.
Keywords
Introduction
Healthcare systems are facing a significant challenge trying to address the growing number of individuals at risk of cognitive impairment. At $818 billion, the World Health Organization estimates the global societal cost of dementia accounting for 1.09% of the global GDP. 1 Current medications for clinically evident forms of dementia, particularly Alzheimer's disease (AD), have shown limited therapeutic benefit and drawn great criticism regarding their safety and efficacy.2,3 Consequently, early detection still remains one of the most critical treatments in dementia care as it can offer the potential to delay or even prevent the onset of symptoms. Ensuring economical and scalable methods for early detection across diverse populations is essential for widespread adoption and effective interventions for cognitive impairment on a global scale. 4
Digital biomarkers, such as speech analysis, offer a promising solution for adaptable techniques in AD research due to their noninvasive and accessible nature. For example, ambient artificial intelligence (AI)-scribing systems are becoming more and more popular in clinical settings and present a novel using linguistic patterns. Early pilot programs in major health systems have indicated that ambient recordings are likely to become a standard part of clinical workflows.5,6 Originally intended for documentation purposes, these systems can now be used for linguistic analytics as a secondary tool for continuous and discrete monitoring frameworks for dementia care. Not only have developments in voice-recognition technologies shown feasibility, but they also underline the possibilities of using natural language processing (NLP) in large-scale cognitive assessments to solve important gaps in present diagnostic practices, such as the reliance on labor-intensive clinical evaluations and limited access in underserved populations.7,8 Notably, one study showed that digital cognitive screeners can even outperform conventional approaches such as the Mini-Mental State Examination (MMSE) and the Montreal Cognitive Assessment (MoCA) in detecting dementia and mild cognitive impairment (MCI) while showing high completion rates and economic scalability. 8
Language deficits are among the earliest signs of cognitive impairment in neurodegenerative diseases and more than often precede more overt symptoms. 9 Previous studies have identified that some key indicators of cognitive impairment, often exhibited by patients with AD, include reduced syntactic complexity, reduced lexical diversity and increased reliance on pronouns.10–12 Additionally, shifts in referential language, such as increased pronoun use, are attributed to difficulties in maintaining coherent and connected speech as impairment progresses. 10 AI deep learning systems such as the transformer-based models like BERT (Bidirectional Encoder Representations from Transformers), have also effectively captured the contextual relationships between words and temporal features across sentences to discriminate between the progression from MCI to AD. 13 This differentiation is particularly important because MCI is regarded as a critical intermediary cognitive state between normal aging and dementia.9,14 Some features of speech that individuals with MCI exhibit are word-finding difficulty, low lexical variety, slower rates of speech, and frequent disjointed and halting pauses in communication. 15 Further, exploratory studies found that newer generative transformer-based models, such as generative pre-trained transformers (GPTs), can also accurately identify fine linguistic traces correlated with cognitive impairment in test cases, performing similarly to two blinded specialists and produced structured medical notes based on patient and physician conversations showing tremendous promise in a broad range of language-related tasks.15–18 Beyond the integration of AI into routine diagnostic workflows, it is also important to recognize that linguistic features are also highly task-dependent. For example, the use of referential language (such as personal pronouns) and the structure of sentences will change significantly based on the cognitive load or the nature of the task.14,15 For instance, picture description tasks, such as the Boston Cookie Theft illustration, have shown to provide a unique balance between standardized assessment and ecological validity to elicit structured naturalistic speech compared to other narrative contexts such as storytelling or procedural tasks.19–21
Despite the well-established link between language and cognitive impairment, there are still major gaps in the identification of additional linguistic markers that indicate the onset of impairment. To address this gap, this study uses NLP libraries, such as SpaCy and NLTK, as well as unsupervised machine learning techniques such as K-means and hierarchical clustering, to analyze 53 linguistic features across syntactic, lexical, and semantic domains specifically focused on distinguishing cognitively unimpaired (CU), MCI, and AD groups. Linguistic features were selected based on their theoretical relevance to cognitive impairment, encompassing markers such as pronoun usage, verb tense, syntactic complexity, lexical sophistication, discourse cohesion, and sentiment polarity. Using tokenization, sentence segmentation, part-of-speech tagging, dependency parsing, and sentiment analysis, we systematically evaluated 336 speech transcripts derived from DementiaBank participants performing structured picture description tasks such as the Boston Diagnostics Cookie Theft, Cat Rescue, and Coming & Going stimuli.22,23 While large language models (LLMs) provide comprehensive NLP capabilities, this study deliberately employs modular NLP techniques to prioritize computational efficiency, transparency, and replicability. These attributes are particularly critical in clinical research, where interpretability of methods and resource accessibility are essential for broad application and reproducibility across diverse settings. We examined both spontaneous and task-specific linguistic changes and to validate their predictive value, we correlated these features with the MMSE and MoCA. We also evaluated how cognitive and linguistic performance can be confounded by demographic factors including age and education. With MCI participants displaying linguistic traits that span the spectrum between CU and AD, we hypothesised that important linguistic markers, such as increased pronoun usage, reduced syntactic complexity, and decreased content density, would significantly differentiate CU, MCI, and AD groups. These results seek to provide a structure for including speech-based analysis into frameworks for scalable, early cognitive impairment diagnostics.
Methods
Participants and tasks
Data used in this study were made available by the University of Pittsburgh (‘Pitt’), the University of Delaware (‘Delaware’), and the Baycrest Health Sciences (‘Baycrest’) corpora within DementiaBank, a shared, open-access database designed to support research on communication and cognition in dementia and healthy aging populations.22,23 Designed with a standardized approach to guarantee uniformity across data collecting sites, the DementiaBank enabled comparison and reproducibility with best practices developed guided by other clinical banks and included knowledge from professionals in connected speech and dementia research. 22 Participants in each dataset were drawn from a mix of individuals from both community and clinical settings within the database. Recruitment was primarily done through the Wisconsin Registry for Alzheimer's Prevention study (WRAP) and the Alzheimer's Research Program (ARP) at the University of Pittsburgh Medical Center (UPMC).22,23 Therefore, it is important to note that these findings may not depict the linguistic traits of people from various socioeconomic or demographic backgrounds or with limited access to healthcare. Inclusion criteria required participants to be aged 60 years or older, fluent in English to complete verbal tasks, had adequate hearing and vision to engage in picture description and narrative tasks, were stable on or not using nootropic medications, and did not have significant psychiatric conditions (e.g., major depression, psychosis) or systemic medical conditions (e.g., uncontrolled diabetes) known to impair cognition. Exclusion criteria included a diagnosis of mixed dementia (e.g., vascular dementia, Lewy body dementia), a history of neurological conditions such as traumatic brain injury, stroke, or Parkinson's disease, and motor or sensory impairments that could affect speech performance.
A total of 336 participants were classified into three diagnostic groups: cognitively unimpaired (CU), mild cognitive impairment (MCI), and Alzheimer's disease (AD). Supported by clinical and cognitive data provided in the corpora, diagnostic classifications followed the National Institute on Aging-Alzheimer's Association (NIA-AA) criteria for MCI related to Alzheimer's disease 24 and Alzheimer's dementia. 25 Among several discourse assignments, participants completed picture descriptions, narrative storytelling, and procedural discourse. However, only picture description tasks were considered for this analysis and each participant completed at least one picture description task. This included the “Cookie Theft” assignment (Figure 1(a)) which shows a scene depicting children trying to grab cookies out of a jar with a mother in a kitchen, 26 the “Cat Rescue” scene (Figure 1(b)) which is a multi-event scene involving a cat stuck in a tree trying to get rescued efforts 27 and finally “Coming and Going” (Figure 1(c)) which is a dual-panel Norman Rockwell painting showing family life. 28
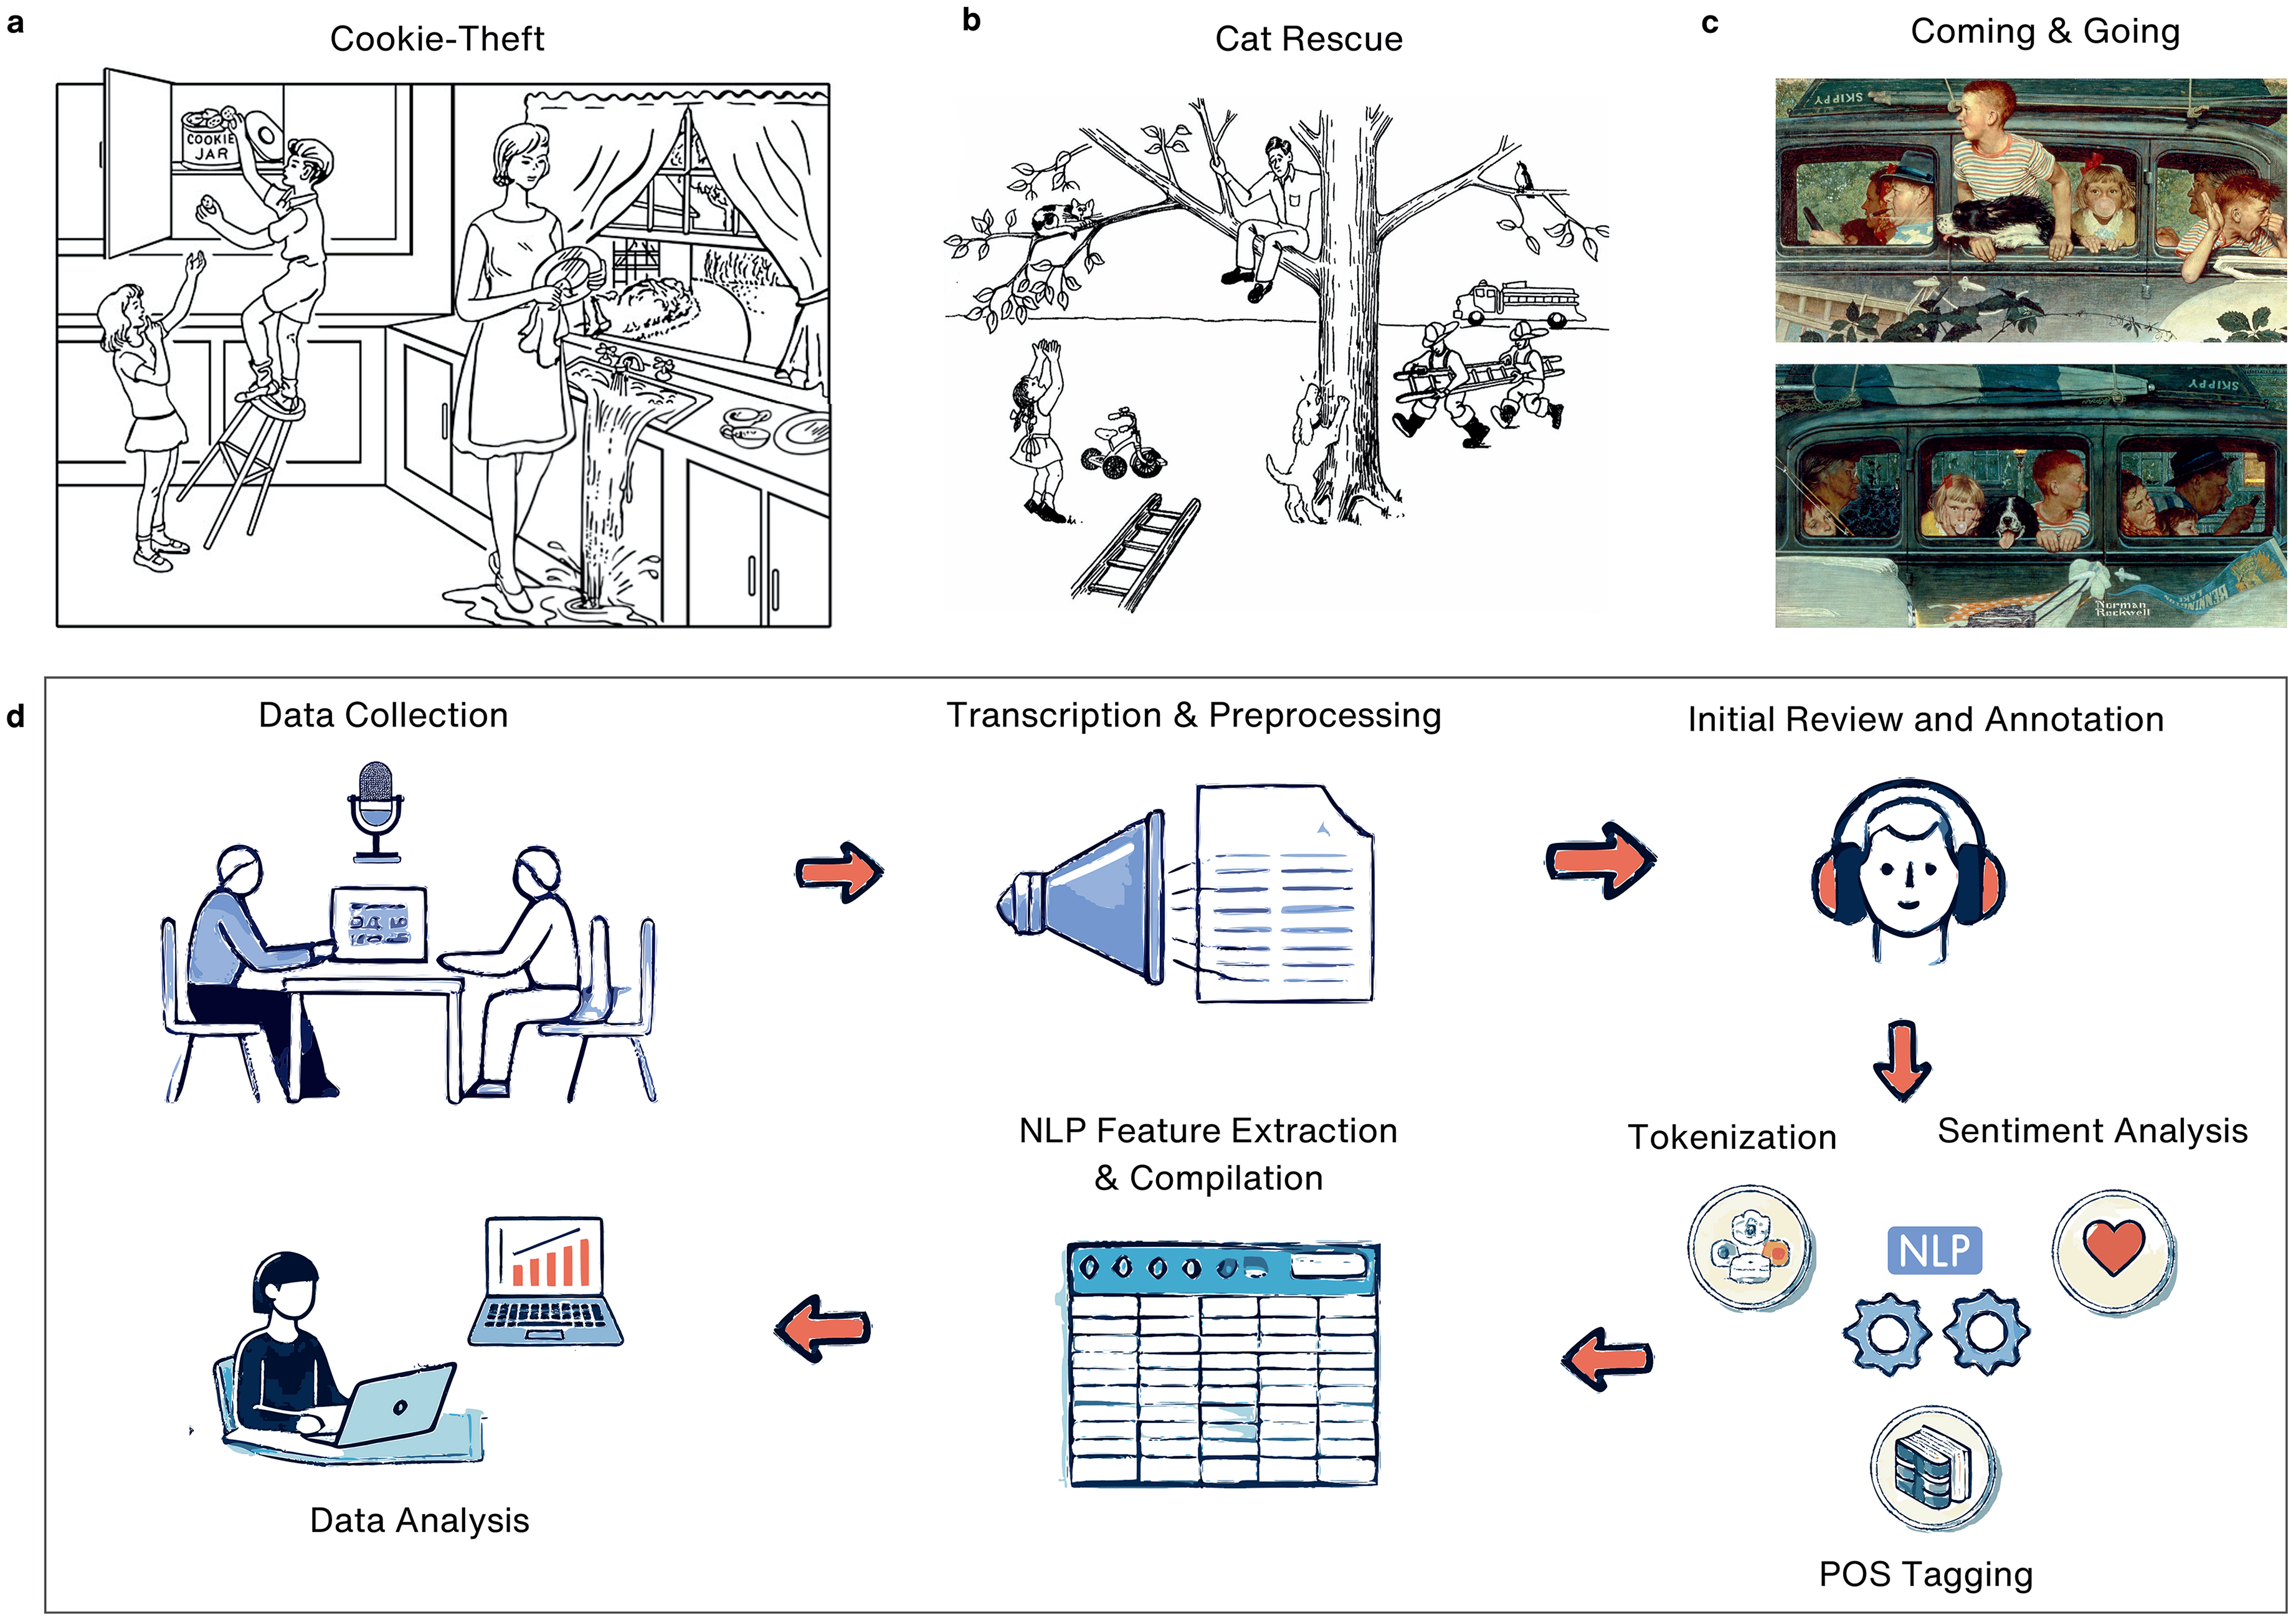
Overview of picture description tasks and NLP analysis workflow. (a) Cookie-Theft Task: A classic picture description task showing children in a kitchen as one reaches for a cookie jar while a distracted woman overlooks an overflowing sink. (b) Cat Rescue Task: A scene showing a cat rescue effort several action-oriented events. (c) Coming and Going Task: A two-panel depiction of a family's departure and return in a car. (d) NLP Analysis Workflow including data collection, transcription and preprocessing, human annotation, tokenization, and advanced NLP feature extraction.
Each task adhered to strict time limits (approximately 3–5 min per task) to reduce participant burden while maximizing data capture. If participants provided incomplete responses or hesitated for more than 10 s, standardized prompts and nonverbal encouragement (e.g., nodding, smiling) were used to elicit further responses while maintaining consistency across examiners. Demographic data, including age, sex, and education level (binary-coded for years of schooling), were included in the analysis to control for potential confounders and only baseline data was used for participants with multiple visits. Diagnostic distributions consisted of CU (n = 113), MCI (n = 68), and AD (n = 155).
Code disclosure
All scripts and code used for preprocessing, feature extraction, and statistical analysis are publicly available on GitHub at github.com/cynthianyongesa/speech. The repository includes documentation for reproducing all analyses described in this study, python and R scripts for data extraction, cleaning, and feature computation and finally examples of input and output formats to facilitate reproducibility.
The following software tools and libraries were used:
Python (v3.10): Primary environment for preprocessing and feature extraction. R (v4.3.0): Statistical analyses and clustering models. NLTK (v3.8.1): Tokenization, sentence segmentation, and linguistic analysis. SpaCy (v3.5): Part-of-speech tagging and dependency parsing. TextStat (v0.7.1): Readability metrics. Pandas (v1.5.3) and NumPy (v1.24.3): Data management and numerical computations. Matplotlib (v3.6.1) and Seaborn (v0.12.2): Visualization tools for data summaries and validation.
The use of publicly available corpora, coupled with open-source tools, ensures that the methods are replicable and accessible to the research community. All data preprocessing steps strictly adhered to DementiaBank's ethical guidelines for transcript handling and participant confidentiality. 22
Preprocessing
Preprocessing was conducted using a combination of Python and R scripts with a pipeline that was specifically designed to prepare transcripts for linguistic analysis and maintain consistency with the DementiaBank protocol. As a result of rigorous dataset protocols, no missing values were present in the available dataset in the data repository, and all participants had complete linguistic and demographic information hence, no imputation or data exclusion was necessary. Additionally, the DementiaBank also employed strict protocols to ensure transcription accuracy and inter-rater reliability, specifically, audio files underwent both manual and automatic speech recognition (ASR) transcription methods, achieving a mean point-to-point reliability of 97%, with a range between 96% and 100%. 23 The workflow, summarized in Figure 1(d), highlights the sequential steps from data collection and transcription to preprocessing and feature extraction. Key steps in this pipeline included file conversion, text cleaning, segmentation, filtering, and standardization. The original discourse samples were manually transcribed by a trained researcher with expertise in language and discourse analysis. 22 The researcher listened to the audio recordings and orthographically transcribed the speech into utterances, applying appropriate linguistic codes as per the CHAT transcription conventions capturing linguistic nuances, such as pauses, disfluencies, and syntactic structures. The quality of transcription was periodically reviewed by a second researcher to verify consistency and accuracy, minimizing potential biases or transcription errors. This was further verified during the larger data export file by cross-referencing the manually transcribed utterances with automated linguistic feature extraction outputs.
The pipeline began with the conversion of CHAT-format transcription files (.cha) to plain text while preserving critical metadata such as speaker identifiers and task-specific annotations. Text cleaning and segmentation was then used to remove noise and focus solely on participant responses. For example, non-essential annotations, such as session comments, nonverbal cues (e.g., laughter, pauses), and background noise markers, were also systematically removed. Investigator speech and interruptions were also excluded, retaining only participant-generated text that were further segmented into sentences using the Natural Language Toolkit (NLTK, v3.8.1) and SpaCy (v3.5) to facilitate tokenization and the extraction of sentence-level linguistic features. Demographic variables, including age, sex, and years of education, were also verified and linked to each transcript.
Task filtering was applied to include only picture description tasks and each dataset was separated by task type. Participants contributing multiple tasks were flagged, and only one transcript per participant was retained to prevent overrepresentation across diagnostic and demographic groups and priority was given to Cookie Theft and Cat Rescue transcripts due to their established validity in prior research. For analyses involving the overall task distribution, all picture description transcripts were retained to result in the following distribution: Cookie Theft (N = 310), Cat Rescue (N = 97), and Coming and Going (N = 70). This approach for task-specific analyses allowed for a more nuanced understanding of how task demands influence linguistic features without compromising statistical power and provided additional insights into the overall linguistic variables associated with cognitive impairment across groups.
Additionally, a consistent approach was applied to harmonize education data across datasets, acknowledging the inherent differences in how years of education were reported. For the Delaware dataset, where education levels were reported as binary categories (e.g., “high school graduate,” “bachelor's degree”), each level was mapped to an approximate number of years of education, as follows: 0 years for no schooling, 6 years for elementary education, 9 years for some high school, 12 years for high school graduates, 13 years for some college credit, 14 years for vocational training or an associate's degree, 16 years for a bachelor's degree, 18 years for a master's degree, 20 years for professional degrees, and 21 years for doctorate degrees. In contrast, datasets such as Baycrest and Pitt provided exact years of education, which were retained to preserve granularity and maximize the richness of the data. This decision was driven by the fact that 266 participants had precise years of education reported, while only 70 participants (Delaware dataset) required the binary-to-numeric mapping. It is also important to acknowledge that while mapping Delaware's education levels to approximate years ensures inclusion, it is based on assumptions that may not fully reflect individual participants’ educational experiences and should be considered for further machine learning modeling.
To prepare the corpus for linguistic analysis, sentences were tokenized to represent individual units of text such as words or punctuation each word was assigned a part-of-speech (POS) tag to categorize their grammatical roles (e.g., nouns, verbs, adjectives). This tagging provided the foundation for downstream syntactic and semantic feature extraction by enabling the analysis of sentence structure and the relationships between words. To normalize for variance in individual transcript length, standardization was applied to all features as a function of the total word count. This normalization accounted for verbosity differences among participants, allowing for accurate cross-comparison. Additionally, length-based normalization mitigated potential biases introduced by task complexity or participant verbosity, ensuring that differences in feature values reflected true linguistic patterns rather than disparities in speech length.
Data-preprocessing stages were verified to guarantee the quality of data by: (i) cross-checking the clean transcript with the original CHAT files for accuracy; (ii) manually inspecting the properly segmented sentences and tokenized data for alignment; and (iii) conducting random manual reviews of processed transcripts to resolve any final inconsistencies. The comprehensive preprocessing pipeline adopted here ensured the dataset was well-structured and facilitated in accordance with prior DementiaBank research.
Linguistic feature extraction
A total of 53 linguistic features were extracted to evaluate syntactic, lexical, and semantic properties of participant speech during picture description tasks. Features were selected based on a thorough literature review and their relevance as indicators of cognitive impairment and their robustness across linguistic and cognitive analyses. A complete list of features, including descriptions, computational formulas, and references, is presented in Supplemental Table 1.
Feature categorization and selection
The linguistic features were extracted using a combination of Python-based NLP libraries and custom scripts. Tokenization and part-of-speech (POS) tagging were performed using NLTK and SpaCy, with tokenized words and phrases tagged with syntactic and semantic roles for subsequent analysis. Readability scores were calculated using the TextStat (v0.7.1) library, which computes established indices such as Flesch Reading Ease and Dale-Chall. Sentiment polarity and subjectivity were derived using the TextBlob (v0.16) library, applying rule-based models to identify emotional and subjective content. Syntactic parsing, including dependency parsing, was performed using SpaCy to identify syntactic structures such as dependent clauses, noun phrases, and passive voice constructions. Given that this study exclusively analyzed picture description tasks, specific adjustments were made: features reflecting narrative flow (e.g., cohesion score, deixis rates, disfluencies) were manually tailored to the visual context of the pictures. Overall, features were grouped into three overarching categories shown in Table 1.
Overview of feature categories and linguistic features.
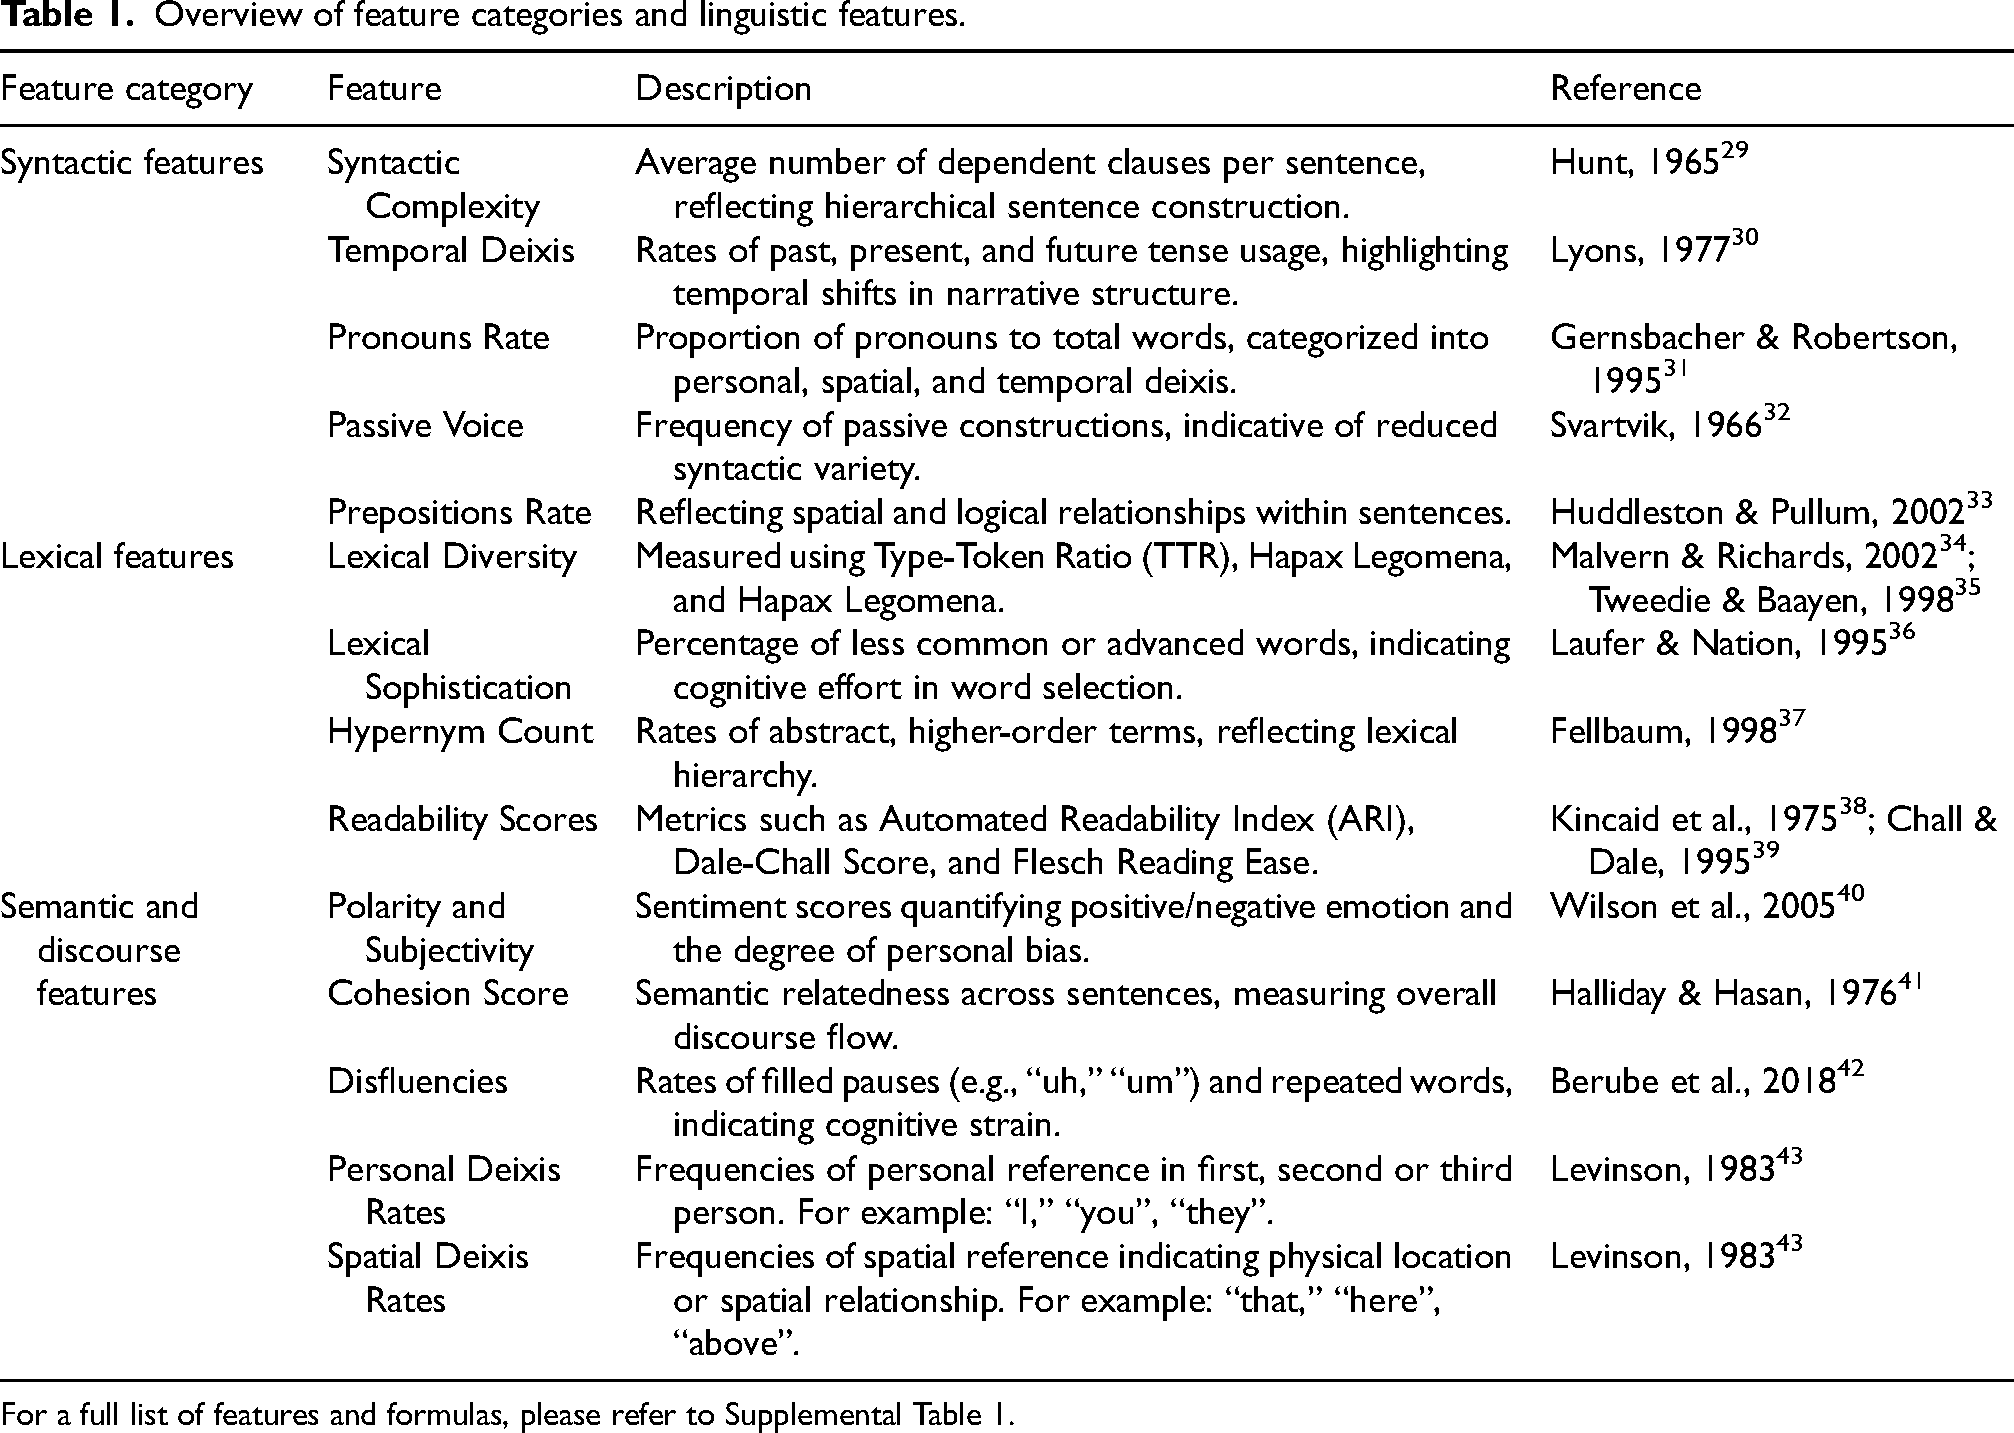
For a full list of features and formulas, please refer to Supplemental Table 1.
Limitations in feature selection
Certain features, such as conjunction rate and determiner usage, were included despite their limited relevance to the specific demands of picture description tasks. These tasks prioritize visual descriptions, reducing the necessity for features like temporal or complex referential language, which may explain their diminished prominence. However, these features were retained for their theoretical importance, as conjunctions contribute to syntactic cohesion and determiners establish referential clarity. Including them ensured alignment with related studies and provided a comprehensive dataset for exploratory analyses and potential future applications in tasks with varying linguistic demands.
Statistical analysis
Statistical analyses were conducted to evaluate the relationships between linguistic features, diagnostic groups (CU, MCI, and AD), and cognitive scores (MMSE and MoCA). Analysis of Variance (ANOVA) was used for features meeting normality and homoscedasticity assumptions whereas, post hoc pairwise comparisons were performed using Tukey's Honest Significant Difference (HSD) test to identify group-level differences. For features not meeting these assumptions, non-parametric Kruskal-Wallis tests were conducted as an alternative, followed by post hoc analyses to explore intergroup variations. Both F-statistics and H-statistics were calculated to quantify group differences, with p-values adjusted for multiple comparisons and mitigate the risk of Type I errors. To account for age and education, a Multivariate Analysis of Covariance (MANCOVA) was conducted, during which Variance Inflation Factors (VIFs) were calculated to identify multicollinearity among predictors. Predictors with high VIF values (>10) were flagged and interpreted cautiously to ensure the robustness of the findings.
Feature clustering and diagnostic utility
To uncover patterns among the 53 linguistic features and assist with dimensionality reduction, K-means clustering was applied using a Pearson correlation-based distance matrix and an average linkage method. This particular method was chosen for its ability to efficiently group linguistic features into distinct domains without requiring predefined assumptions about cluster shape. Some additional methods such as hierarchical clustering and Density-Based Spatial Clustering of Applications with Noise (DBSCAN) were initially explored but proved to be computationally expensive and did not yield significantly better clustering quality. By contrast, K-means clustering grouped features into distinct linguistic domains (e.g., syntactic, lexical, and discourse features), which were visualized through annotated heatmaps to aid interpretability. Cluster validation was conducted using silhouette scores and the elbow method to evaluate internal consistency and ensure the reliability of feature groupings. These methods provided complementary perspectives, with silhouette scores quantifying how well-defined the clusters were, while the elbow method helped confirm an optimal number of clusters based on variability explained.
Following K-means clustering, the diagnostic utility of individual linguistic features was evaluated using a Random Forest (RF) classifier due to its ability to model nonlinear relationships, rank feature importance, and remain robust to small sample sizes compared to parametric classifiers. 44 Alternative models, including support vector machines (SVM) and gradient boosting classifiers, were evaluated, but SVM did not significantly outperform RF in accuracy, and ensemble learning approaches provided only marginal improvements at the cost of increased complexity. Feature importance was ranked in differentiating between diagnostic groups (CU, MCI, AD) based on the mean decrease in Gini impurity, which measures each feature's contribution to separating diagnostic categories. The top 20 features, as ranked by importance, were visualized to highlight the most predictive linguistic markers. Model validation was performed using 10-fold cross-validation to mitigate overfitting and assess generalizability. Sensitivity analyses were further conducted by stratifying results into demographic subgroups, including age and education level and scatter plots were used to visually inspect relationships between linguistic features and cognitive score. Visual inspections also served to confirm assumptions about linear and non-linear relationships in the data. Further details on clustering performance such as silhouette score ranges (Supplemental Figure 5) and linkage distance metrics (Supplemental Figure 4) are included in Supplemental Material.
Group comparisons and post-hoc testing
Individual linguistic features were examined within their respective clusters in order to solve the limitations in general predictive performance. Analysis of Variance (ANOVA) was done in R (version 4.3.0) and for every feature, essential statistics such as sum of squares, mean square, F-values, and p-values were computed between diagnostic groups. Post hoc pairwise comparisons were conducted using Tukey's Honest Significant Difference (HSD) test to pinpoint specific group-level differences while controlling for familywise error rates. Bonferroni-adjusted p-values were applied to further minimize Type I errors and statistical significance was defined with p-values less than 0.05.
For features that did not meet assumptions of normality (evaluated via the Shapiro-Wilk test and Levene's test), Kruskal-Wallis tests were used for robust non-parametric alternatives to ANOVA. In addition to statistical significance, effect sizes were reported to help determine whether statistically significant findings reflected clinically meaningful differences. Partial eta-squared (η²) was used for ANOVA, epsilon-squared (ε²) for Kruskal-Wallis, and Cohen's d for pairwise comparisons.
Correlation analysis with cognitive scores
To examine relationships between linguistic features and cognitive performance (MMSE and MoCA scores), Pearson correlation coefficients were calculated to make sure that observed correlations were specific to cognitive impairment and not attributable to extraneous factors. Spearman's rank correlation was used as a non-parametric alternative for features that violated normality assumptions. Scatter plots with regression lines were used to visually inspect relationships, with R-squared, adjusted R-squared and standardized beta coefficients from linear regression models reported to assess variance and the relative contributions of predictors. Lastly residual plots were inspected and outliers were flagged using Cook's distance and leverage values.
Results
Demographics
The demographic analysis of the 336 participants (Table 2) highlighted significant distinctions across the diagnostic groups. Participants with MCI (72.42 ± 8.65 years) were slightly older than those with AD (mean age 71.65 ± 8.51 years), and both were older than CU (64.91 ± 8.57 years). CU had the highest mean years of education (12.96 ± 3.79) compared to MCI (9.40 ± 4.46) and AD (11.90 ± 2.79) with cognitive performance showing highest performance in CU on the MoCA (28.47 ± 1.59) and MMSE (28.47 ± 1.59), while AD scored significantly lower (MoCA, 19.14 ± 4.70; MMSE, 19.14 ± 4.70). MCI participants displayed intermediate cognitive performance (MoCA, 24.59 ± 2.79; MMSE, 24.85 ± 2.79) and density distributions of MMSE and MoCA scores are visually depicted in Figure 2(a) and (d), respectively. While education had a lesser but significant effect (η² = 0.13, p = 0.0003), effect size analysis revealed significant variations in cognitive scores (η² = 0.60, p < 0.001) while sex distribution did not significantly vary among groups.
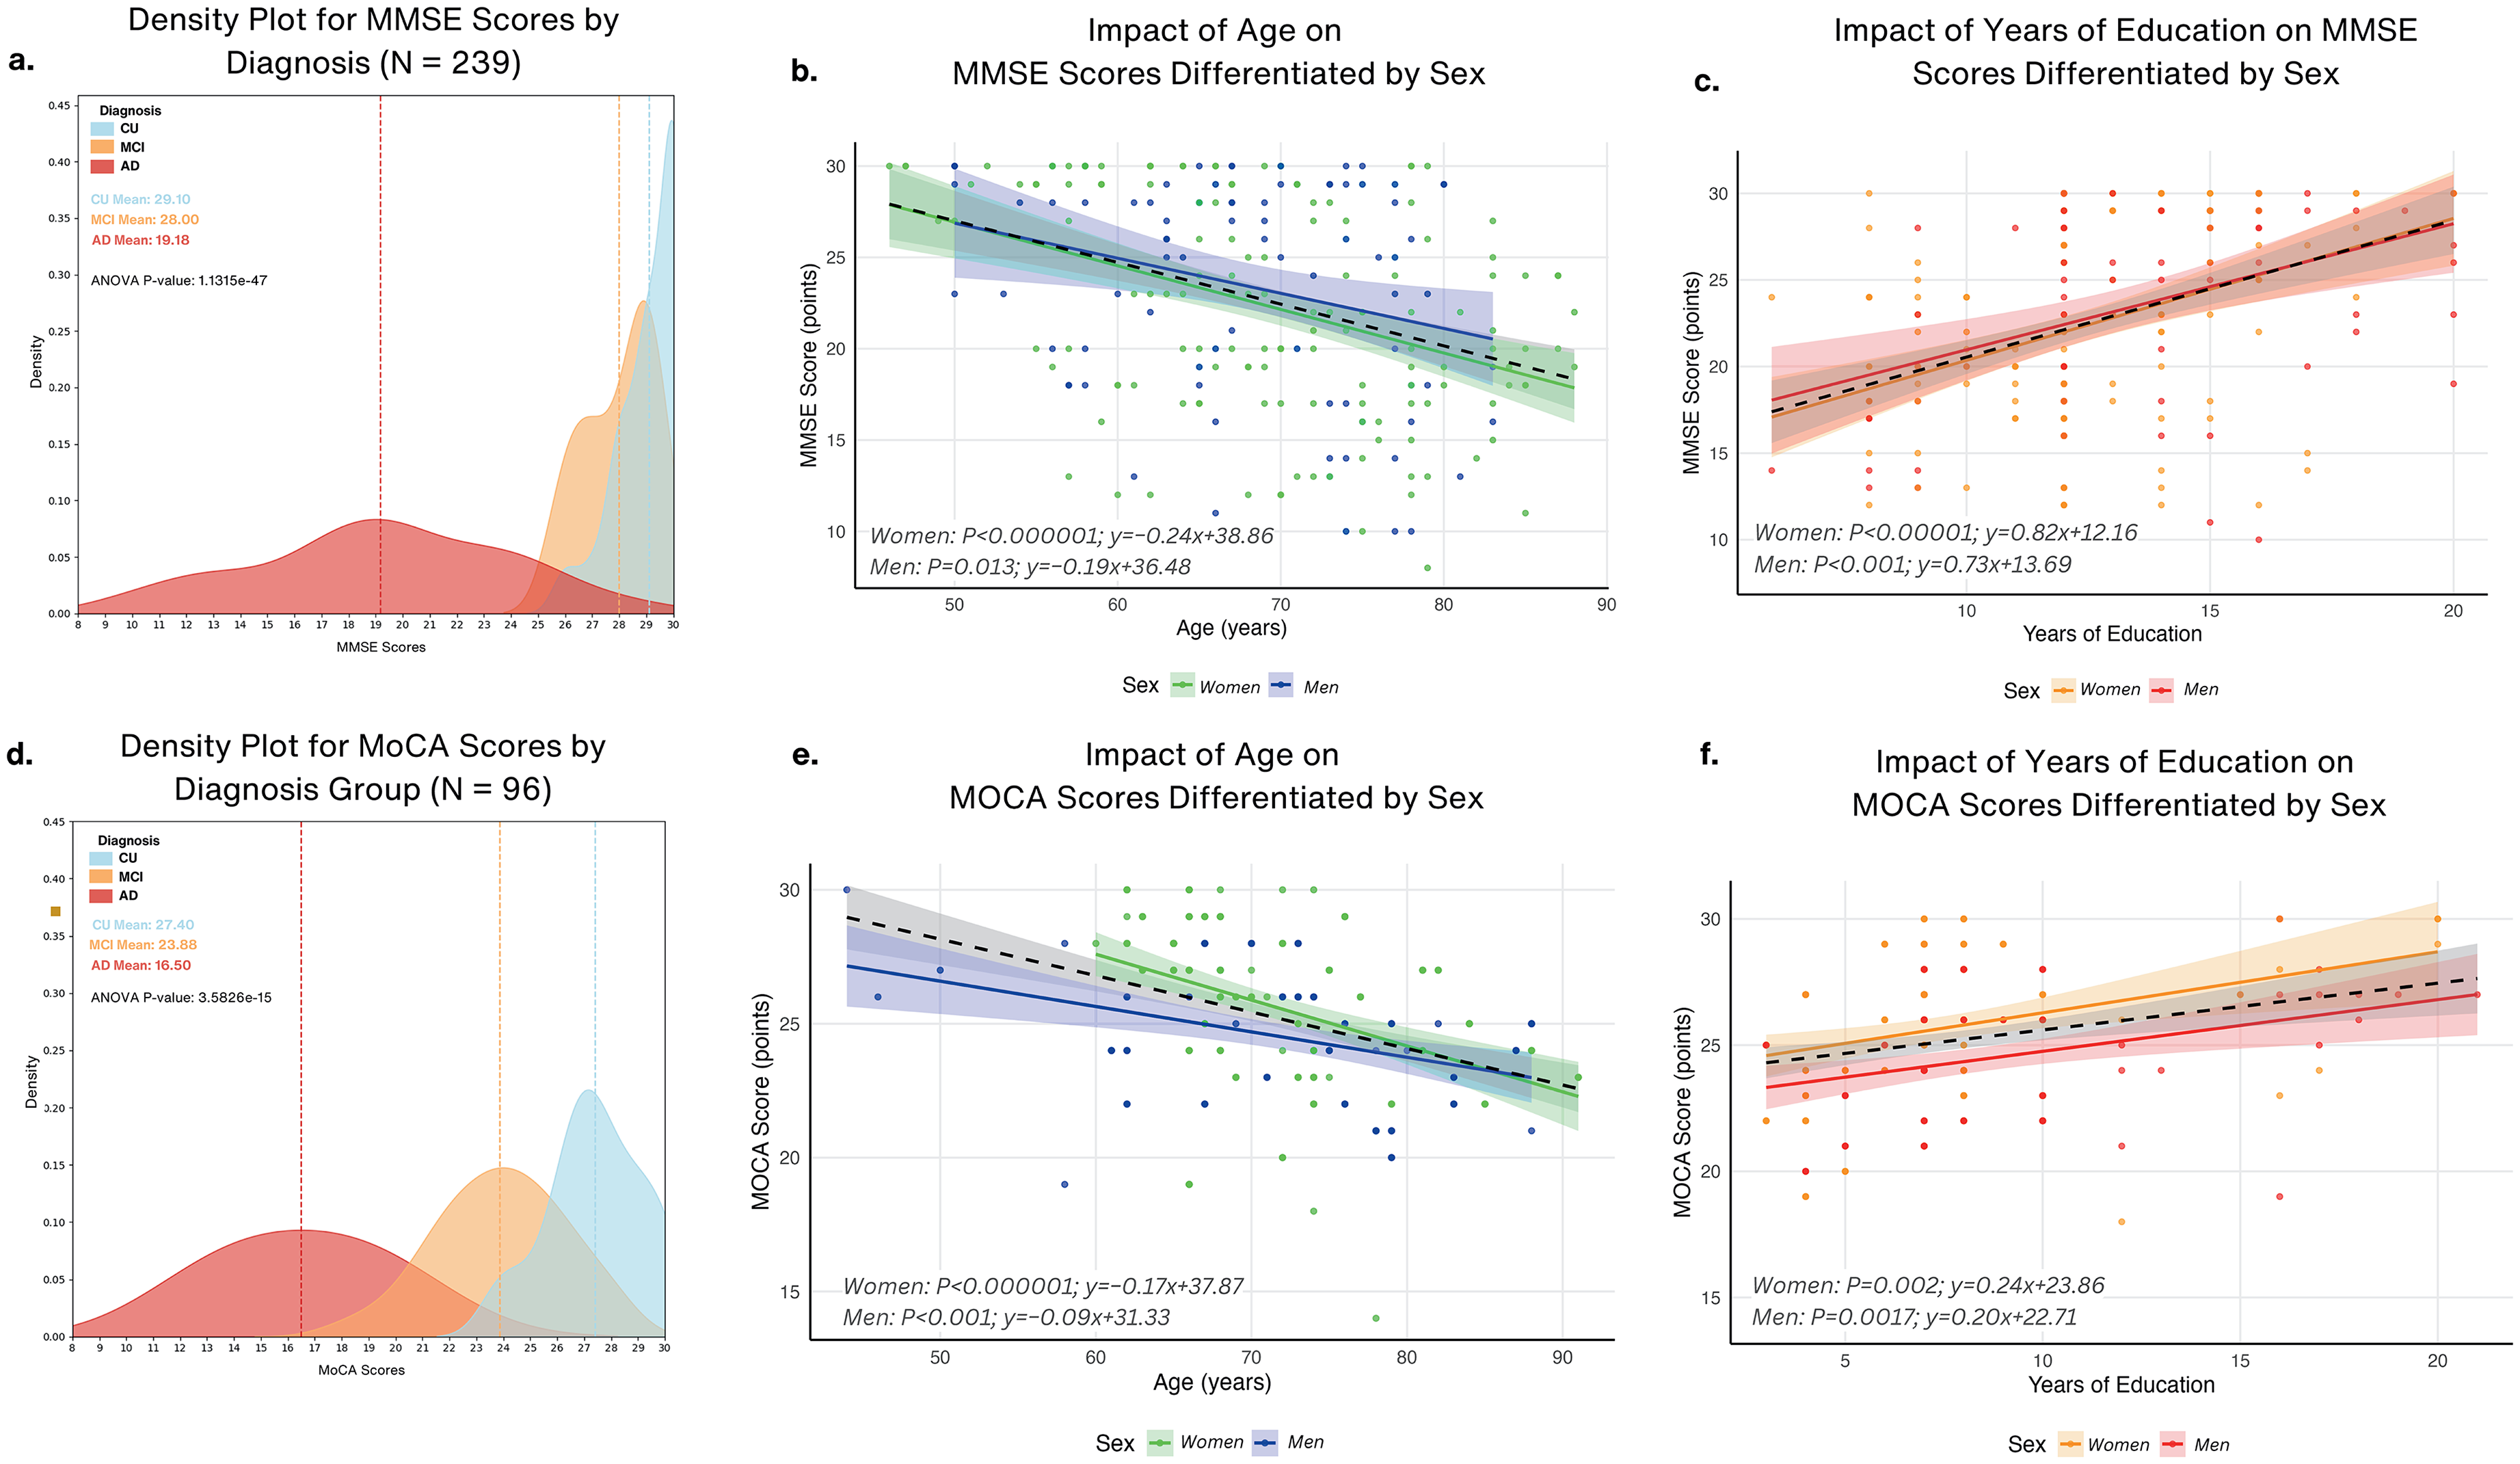
Cognitive performance across diagnosis groups and the influence of age and education differentiated by sex. (a) Density plot for MMSE scores by diagnosis group (N = 239) for cognitively unimpaired (CU), mild cognitive impairment (MCI), and Alzheimer's disease (AD) groups, with group means highlighted and ANOVA results across groups (p < 0.0001). (b) Impact of age on MMSE scores differentiated by sex using regression plots. Slopes indicate a stronger age-related decline for women (B = −0.24) compared to men (B = −0.19). (c) Impact of years of education on MMSE scores differentiated by sex using regression plots showing positive relationships between years of education and MMSE scores for women (B = 0.82) and men (B = 0.73), indicating higher education is associated with better cognitive performance. (d) Density plot for MoCA scores by diagnosis group (N = 96) with group means highlighted and ANOVA results (p < 0.0001). (e) Impact of age on MoCA scores differentiated by sex using regression plots indicating decline in MoCA scores with age for women women (B = −0.17) and men (B = −0.09). (f) Impact of years of education on MoCA scores differentiated by sex showing positive relationships between years of education and MoCA scores for women (B = 0.24) and men (B = 0.20).
Demographic and cognitive characteristics of study participants by diagnostic group.
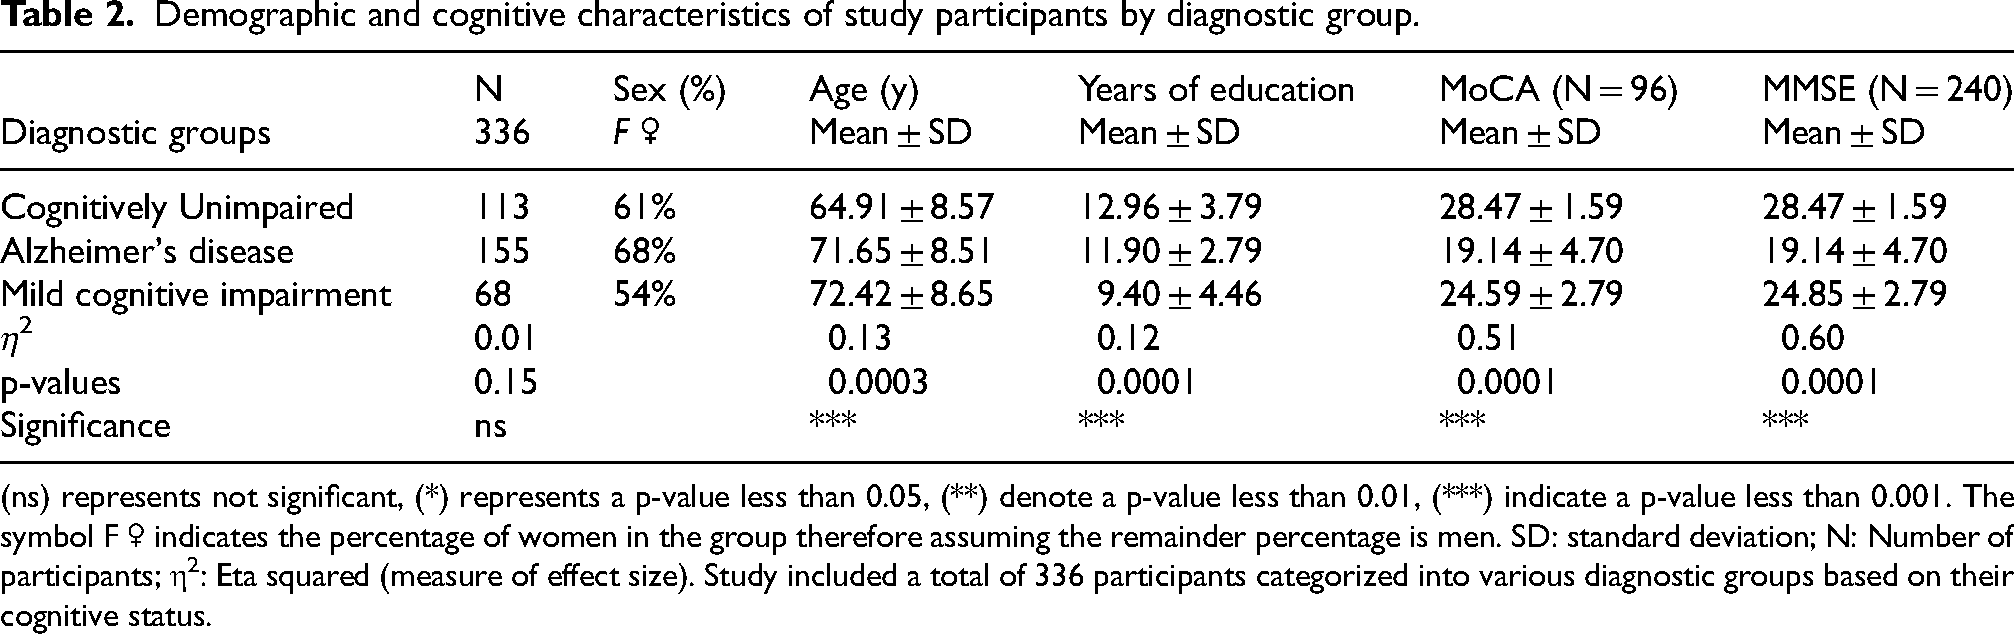
(ns) represents not significant, (*) represents a p-value less than 0.05, (**) denote a p-value less than 0.01, (***) indicate a p-value less than 0.001. The symbol F ♀ indicates the percentage of women in the group therefore assuming the remainder percentage is men. SD: standard deviation; N: Number of participants; η2: Eta squared (measure of effect size). Study included a total of 336 participants categorized into various diagnostic groups based on their cognitive status.
Sex-specific effects of age and education on cognitive performance
MMSE scores revealed that cognitive impairment was observed in both sexes (Figure 2(b)); however, the impairment was steeper in women (B = −0.24, p < 0.0001) than in men (B = −0.19, p = 0.013). For MoCA scores (Figure 2(e)), women also showed a stronger age-related impairment (B = −0.17, p < 0.0001) compared to men (B = −0.09, p = 0.0017). Conversely, cognitive performance in both men and women on the MMSE (Figure 2(c)) was positively correlated with greater years of education; women benefited somewhat more (B = 0.82, p = 0.0001) than men (B = 0.73, p = 0.001). MoCA scores (Figure 2(f)) similarly showed a positive correlation with years of education, where women (B = 0.24, p = 0.002) again exhibited a stronger benefit compared to men (B = 0.20, p = 0.0017). Supplemental Figure 1 illustrates the distributions of linguistic variables pre- and post-adjustment for the effects of age and education.
Model performance and feature clustering show four distinct linguistic domains
Four discrete clusters were produced during machine-learning and reflected different language domains with varying degrees of accuracy and class separability (Figure 3(a)). The optimal number of clusters was determined using the elbow method, as shown in Supplemental Figures 2–4 with a linkage distance of 2.5. The point where the curve bends, or “elbows,” indicated four clusters as the optimal number and further aligned with the silhouette analysis (Supplemental Figure 4(a)–(e)) and hierarchical clustering dendrogram (Supplemental Figure 3). Supplemental Figure 4(a)–(e) also illustrate the iterative K-means clustering process for 2 to 6 clusters where, based on the silhouette coefficients, a 4-cluster solution provided a balance between cluster separation and cohesion, with an average silhouette coefficient of 0.55 (Figure 3(b)).
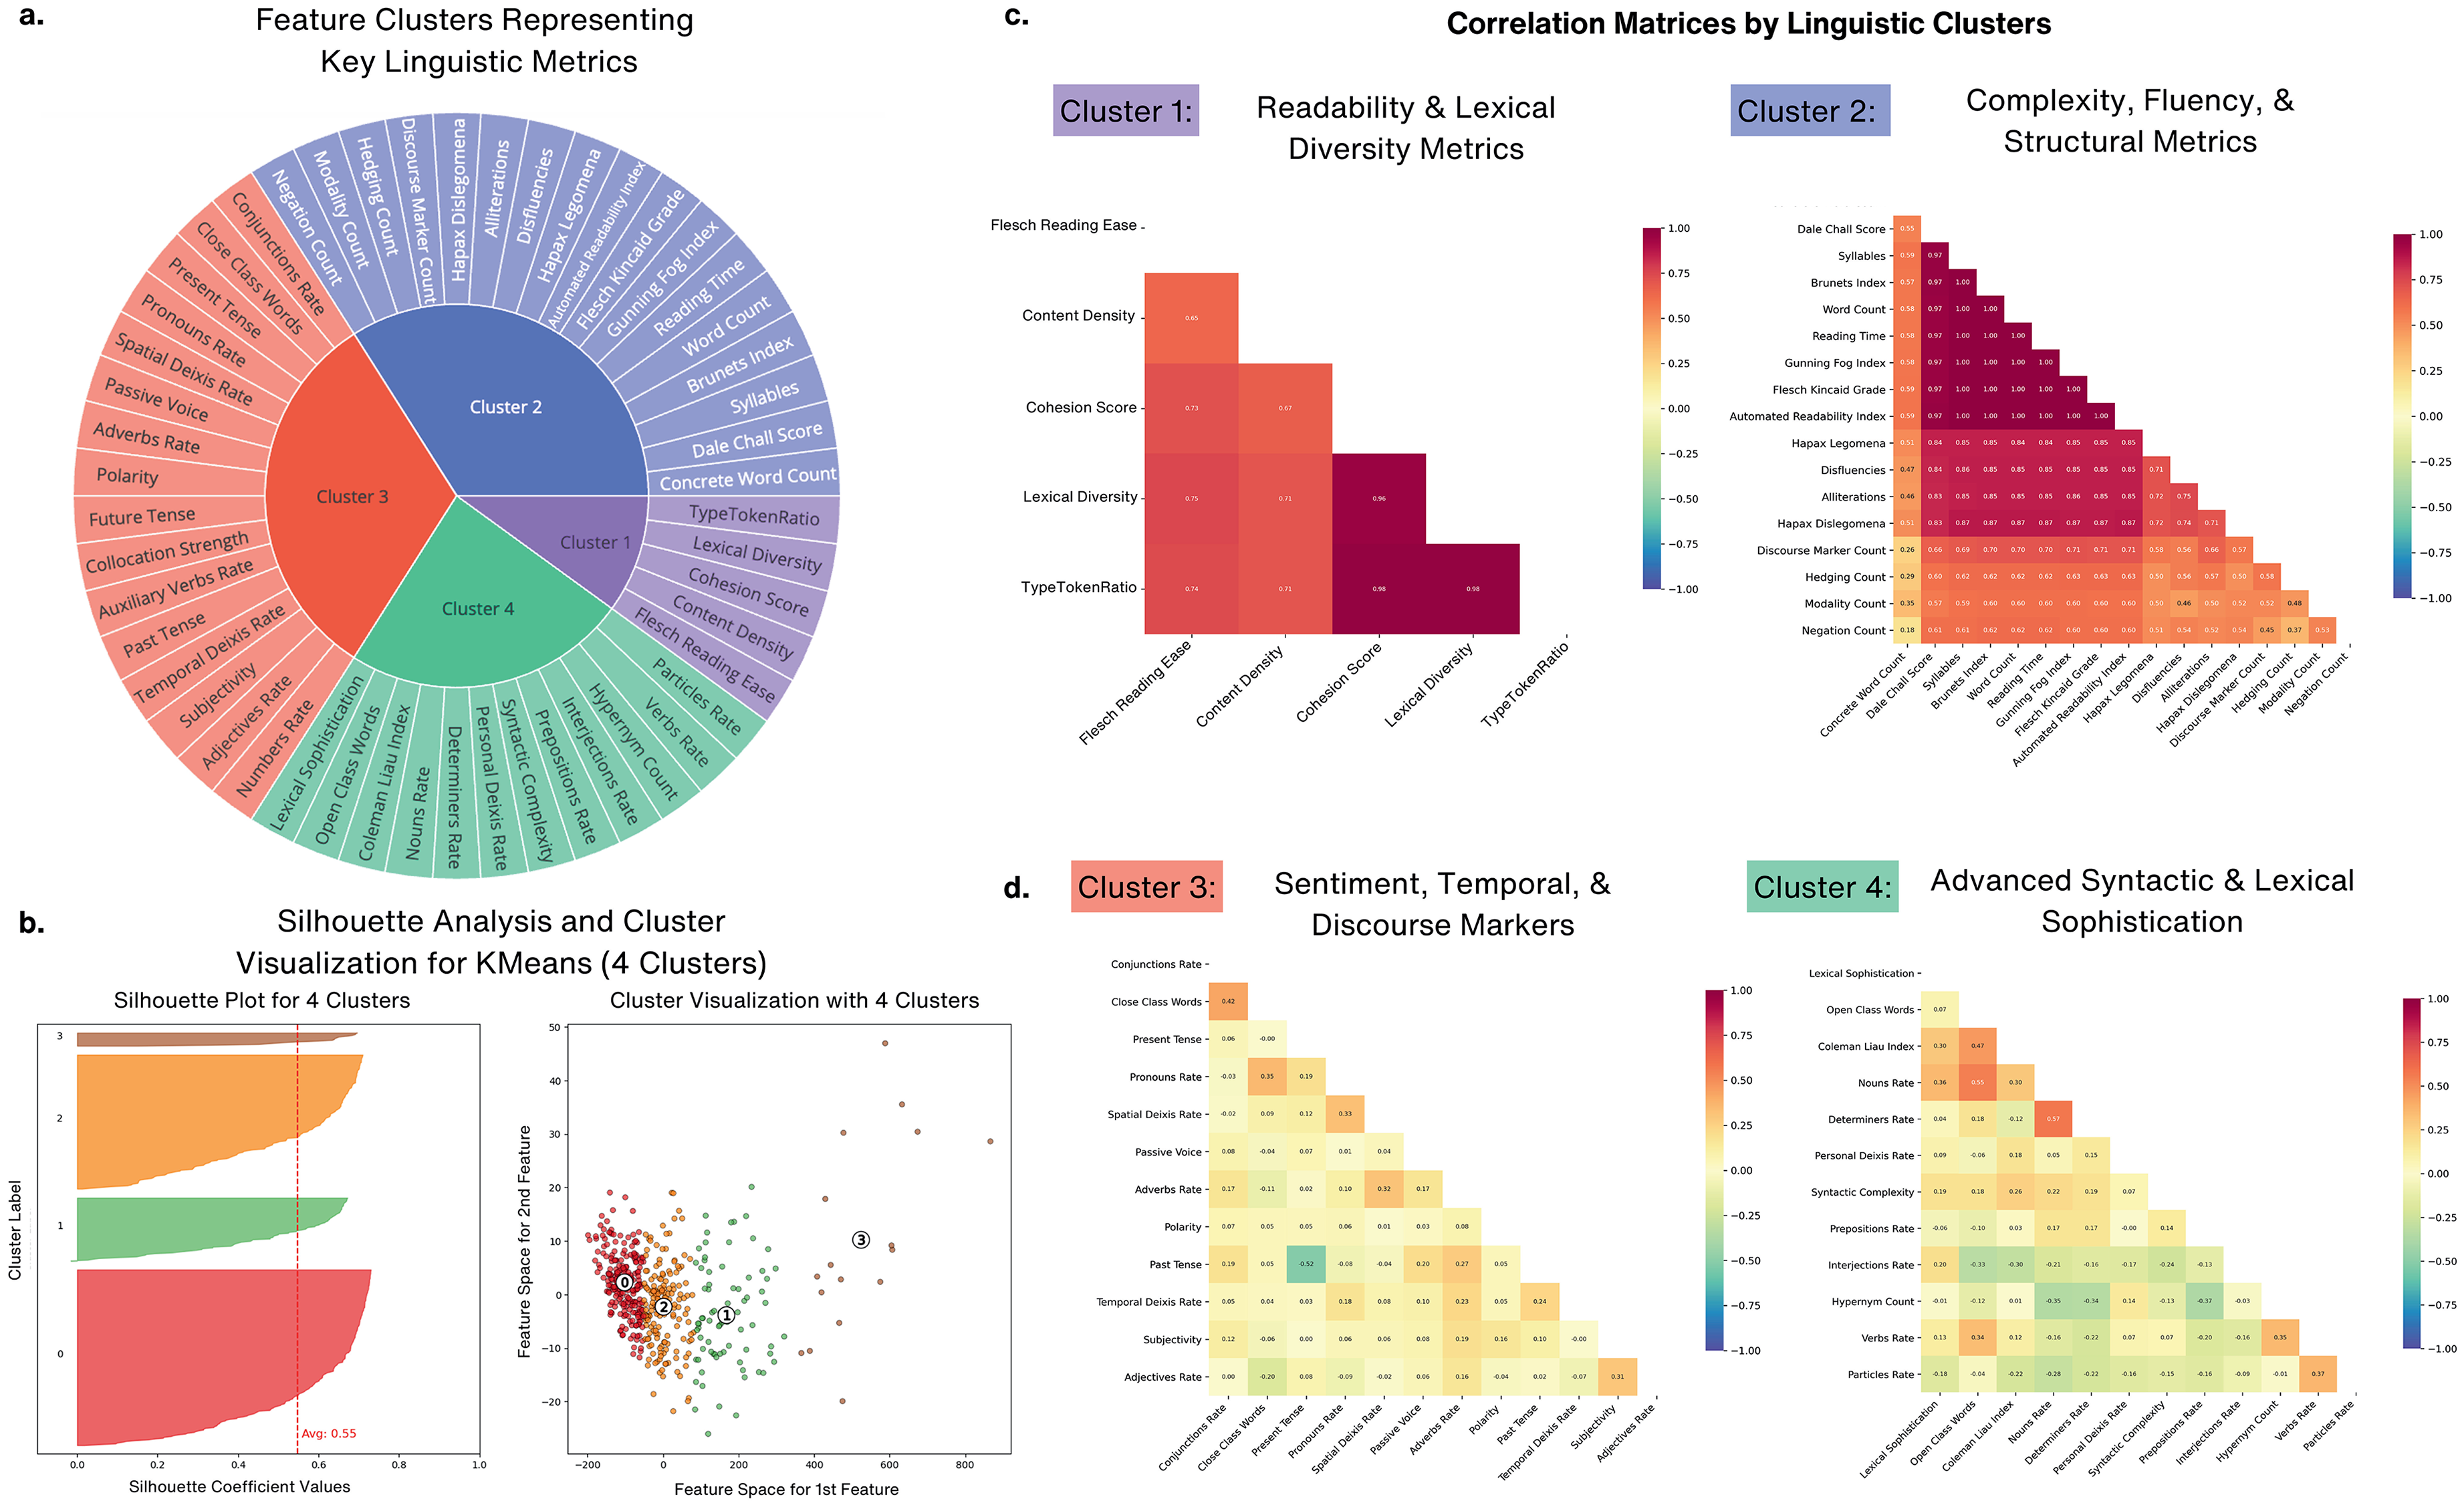
Linguistic feature clustering and correlation analysis. (a) Linguistic features grouped into four distinct clusters based on KMeans clustering. Cluster 1 (Purple): Readability and lexical diversity metrics such as type-token ratio, cohesion score, and lexical diversity. Cluster 2 (Blue): Complexity, fluency, and structural metrics, including Dale-Chall score, word count, and syllables. Cluster 3 (Red): sentiment, temporal, and discourse markers, such as polarity, adverbs rate, and present tense rate. Cluster 4 (Green): Advanced syntactic and lexical sophistication features, including lexical sophistication and syntactic complexity. (b) Silhouette Plot showing the average silhouette coefficient of 0.55 for K-Means (4 Clusters). Cluster Visualization to the right shows a scatter plot of clustered features in a two-dimensional space, highlighting separation between the four clusters. (c) Correlation Matrices by Linguistic Clusters: Cluster 1 (Readability & Lexical Diversity Metrics) showing positive correlations observed between readability measures like Flesch Reading Ease and lexical diversity metrics. To the right is Cluster 2 (Complexity, Fluency & Structural Metrics): High correlations between fluency measures such as word count, Reading time, and structural metrics like Gunning Fog Index. (d) Correlation matrix highlighting interrelations between features in Cluster 3 (Sentiment, Temporal & Discourse Markers) such as polarity, passive voice rate, and temporal deixis. To the right is Cluster 4 (Advanced Syntactic & Lexical Sophistication) showing strong correlations among syntactic and lexical sophistication metrics, such as syntactic complexity and lexical sophistication, emphasizing advanced linguistic capabilities (colors are visible in the online version).
As shown in Figure 3(c) and (d), features were grouped into Cluster 1 (Readability & Lexical Diversity Metrics), Cluster 2 (Complexity, Fluency, & Structural Metrics), Cluster 3 (Sentiment, Temporal, & Discourse Markers), and Cluster 4 (Advanced Syntactic & Lexical Sophistication). Emphasizing their mutual significance to lexical richness and text readability, Cluster 1 comprised elements with strong inter-correlations (r > 0.7), including lexical diversity, type-token ratio, and cohesion score. Reflecting fluency and structural complexity in speech, Cluster 2 included metrics such as the Dale-Chall score, gunning fog index, and syntactic complexity under high correlations (r > 0.8). Focused on sentiment, temporal and discourse-level language patterns, Cluster 3 included pronouns rate and temporal deixis rate, with moderate correlation (r ≈ 0.5–0.7). Cluster 4 highlighted advanced syntactic and lexical complexity, including Coleman Liau index and open class words, with strong inter-correlations (r > 0.75).
Cluster-based differentiation reveals unique linguistic patterns in MCI
Using post hoc pairwise comparisons and ANOVA as additional validation, Figure 4 presents cluster-based analysis showing considerable variations in mean standardized cluster scores among diagnostic groups. Cluster 1, which included readability and lexical diversity metrics, ANOVA revealed overall group differences (F = 9.04, p = 0.000141) with significant differences particularly between AD and MCI (mean difference = −0.4717, p = 0.0001), but no differences between AD and CU (p = 0.0704) and CU and MCI (p = 0.0988). These results imply that linguistic features in Cluster 1 are particularly more sensitive to distinguishing AD from MCI, but less so for CU. Emphasizing complexity, fluency, and structural measures, Cluster 2 further demonstrated strong group-level differences (F = 11.10, p = 0.000019) specifically showing significant differences between AD and MCI (mean difference = 0.4667, p < 0.00001) as well as CU and MCI (mean difference = 0.2647, p = 0.0203). Although no significant difference was observed between AD and CU (p = 0.1050), these results illustrate the potential relevance of Cluster 2 in the detection of intermediate cognitive impairment, having a stronger differentiation of MCI from both AD and CU. As for sentiment, temporal, and discourse markers, Cluster 3's ANOVA confirmed significant group-level effects (F = 5.60, p = 0.003951) with pairwise comparisons showing notable differences between MCI and AD (mean difference = 0.1209, p = 0.0079) as well as MCI and CU (mean difference = 0.1104, p = 0.0160), whereas AD and CU did not significantly differ (p = 0.9633). These findings imply that Cluster 3 records minor, MCI-specific language abnormalities, therefore offering important new perspectives on intermediate cognitive impairment. Finally, Cluster 4, which represents advanced syntactic and lexical sophistication, showed notable group differences (F = 6.24, p = 0.00212) with significant distinctions between MCI and CU (mean difference = −0.1344, p = 0.0033) as well as MCI and AD (mean difference = −0.1154, p = 0.0155). No major differences were observed between AD and CU (p = 0.8912).
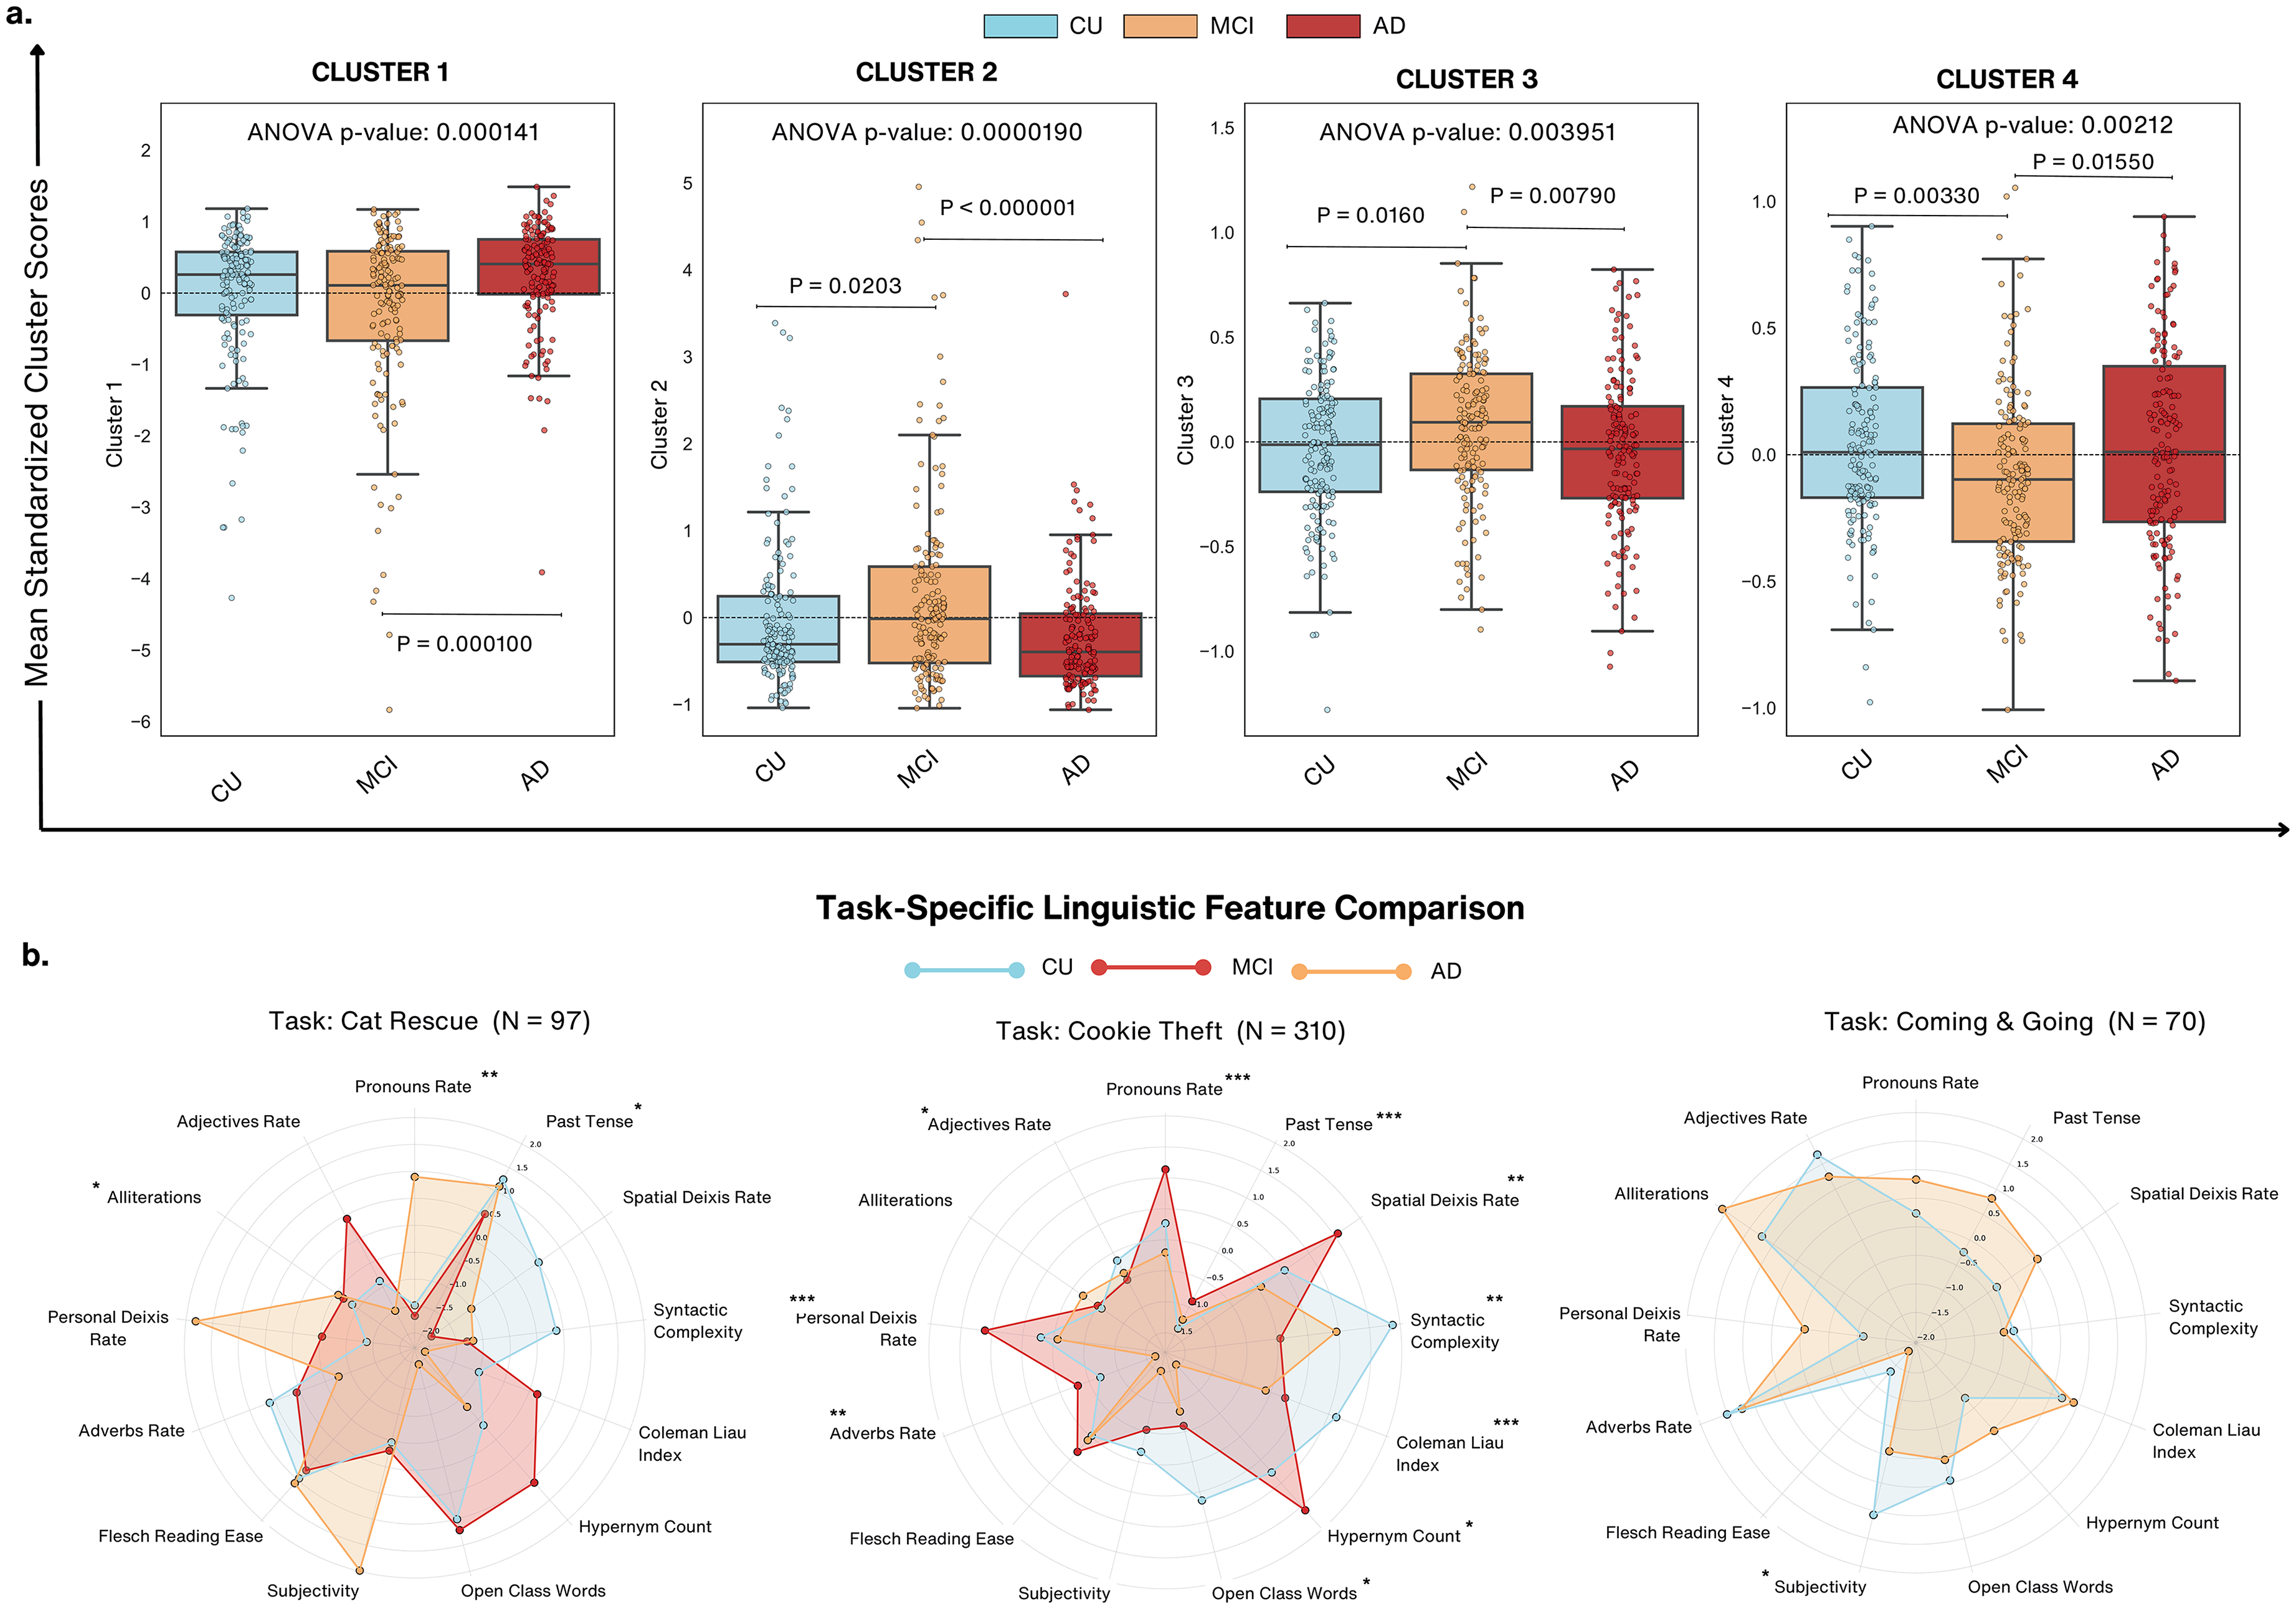
Cluster analysis of linguistic features across diagnostic groups and task-specific comparisons. (a) Boxplots display mean standardized scores for clusters (1–4) across cognitively unimpaired (CU), mild cognitive impairment (MCI), and Alzheimer's disease (AD) groups. Significant differences are observed across groups for all clusters (ANOVA p < 0.005). Post-hoc analyses reveal CU consistently outperforms AD across clusters, with notable differences in Cluster 2 (Complexity & Fluency, p < 0.000001) and Cluster 4 (Syntactic & Lexical Sophistication, p < 0.005). (b) Radar plots illustrate linguistic feature differences across diagnostic groups for Cat Rescue (N = 97), Cookie Theft (N = 310), and Coming & Going (N = 70) tasks. Features such as pronouns rate, spatial deixis, and syntactic complexity distinguish diagnostic groups, with AD participants exhibiting the most pronounced impairments. Cookie Theft task showed the highest diagnostic sensitivity.
Linguistic feature importance analysis
To evaluate the diagnostic utility of linguistic features, a Random Forest classifier was implemented to rank the relative importance of each predictor in differentiating CU, MCI, and AD groups. Using 10-fold cross-valuation to minimize overfitting and evaluate generalizability, the model was trained on 207 samples. The optimal hyperparameter of 2 was determined during resampling, and ultimately the classifier achieved an overall accuracy of 44.43% and a corresponding kappa value of 0.166. Between the CU and MCI groups, misclassification was especially severe, indicating that linguistic markers by themselves might not be able to adequately represent the delicate change from normal aging to early cognitive decline. Showing greater recall for MCI and AD groups, SVM with an Radial Basis Function (RBF) kernel had somewhat increased classification accuracy to 46%, however CU and MCI examples indicated some overlap. Although gradient boosting showed improved recall for AD, it fared somewhat poorly for 43% accuracy in comparison to Random Forest. Therefore, although the general accuracy was moderately low, it provided important perspectives on feature ranking for cognitive differentiation.
Visualized in Supplemental Figure 6 are the top 20 most significant features based on mean decrease in Gini impurity. Among these, content density emerged as the most predictive feature, with an average importance score of 1.63, followed by open-class words at 1.51 and polarity at 1.21. Additional features such as, reading time (1.15), disfluencies (1.02), and syntactic measures including mean sentence length (0.87) and pronoun rate (0.69), demonstrated moderate contributions. Other moderate predictors, but with relatively low predictive scores, also included readability metrics, like the Coleman-Liau index (0.47) and the automated readability index (0.52).
These numerical results show that differences between diagnostic groups are aggressively influenced by linguistic indicators of lexical richness, syntactic organization, and readability. Although class distribution and sample size limited the prediction accuracy of the model, the ranking feature relevance highlights the possibilities of focused language analysis for early cognitive evaluation. The Supplemental Material further contain metric and model performance details including precision, recall, and F1-scores.
Task-specific linguistic feature comparison
The Cookie Theft task outperformed the Cat Rescue as well as the Coming & Going task, likely benefiting from its larger participant pool and ability to elicit critical linguistic markers. By contrast, the other tasks, with smaller sample sizes, showed reduced sensitivity to diagnostic features. Highlighting differences in sensitivity to cognitive states, the radar plots shown in Figure 4(b) illustrate task-specific distributions of linguistic features across the Cat Rescue (N = 97), Cookie Theft (N = 310), and Coming & Going (N = 70) tasks. The statistical analyses revealed significant variability in the diagnostic utility of features influenced by both task demands and sample size. The Cookie Theft task emerged as the most diagnostically sensitive, likely due to its larger sample size (N = 310) with pronoun rate (p < 0.0001), past tense usage (p < 0.0001), and personal deixis rate (p < 0.0001) being highly influential in distinguishing across all cognitive groups. Additionally, syntactic complexity (p = 0.0021) and the Coleman-Liau index (p = 0.0001) provided robust differentiation as well.
On the other hand, the Cat Rescue task (N = 97) showed moderate sensitivity, with significant differences observed in pronoun rate (p = 0.0012), past tense usage (p = 0.0466), and alliterations (p = 0.0466). However, for this task, there were several features including syntactic complexity and the Coleman-Liau index that failed to reach significance. The smaller sample size may contribute to its reduced sensitivity compared to the Cookie Theft task, warranting caution in interpreting results. The Coming & Going task (N = 70) displayed limited diagnostic sensitivity, with only subjectivity (p = 0.0367) reaching statistical significance. The smaller sample size and its narrative complexity may have contributed to the lack of consistent significant markers, underscoring its limited applicability for cognitive assessments.
Declines in lexical richness and structural complexity mark advanced cognitive impairment
MCI participants exhibited higher hypernym counts compared to CU participants (p = 0.0333), suggesting enhanced lexical specificity or compensatory strategies in early impairment stages. However, no significant differences were noted between MCI and AD with a potential convergence in lexical deficits as impairment progresses. AD participants used significantly fewer open-class words compared to CU (p = 0.017), and interestingly, MCI participants did not show significant differences from either CU or AD, suggesting variability in their linguistic profiles that does not follow a straightforward intermediate pattern. A marked decline in syntactic complexity was observed in AD participants compared to CU (p = 0.0014). AD participants had significantly lower readability scores compared to both CU (p = 0.0001) and MCI (p = 0.0113), reflecting reduced sentence complexity while MCI did not significantly differ from CU, suggesting that readability may not capture all nuances of early impairment. These findings reveal that while some features (e.g., syntactic complexity, open class words) exhibit clear declines with cognitive impairment, MCI participants often demonstrate variability, underscoring the heterogeneity of this transitional stage. Additionally, in terms of effect sizes, syntactic complexity (d = 0.43), readability scores (d = 0.55), and open-class words (d = 0.35) showed moderate effect sizes, suggesting they may have clinical relevance in distinguishing cognitive impairment stages. In contrast, hypernym count (d = 0.20) had a small effect size, indicating that while statistically significant, its standalone clinical utility may be limited.
Pronoun usage and deictic language increase while descriptive and temporal markers decline across cognitive impairment groups
Figure 5(b) showcases linguistic changes in pronouns rate, spatial deixis rate, adverbs rate, personal deixis rate, and past tense usage, providing nuanced insights into the progression of language impairments.
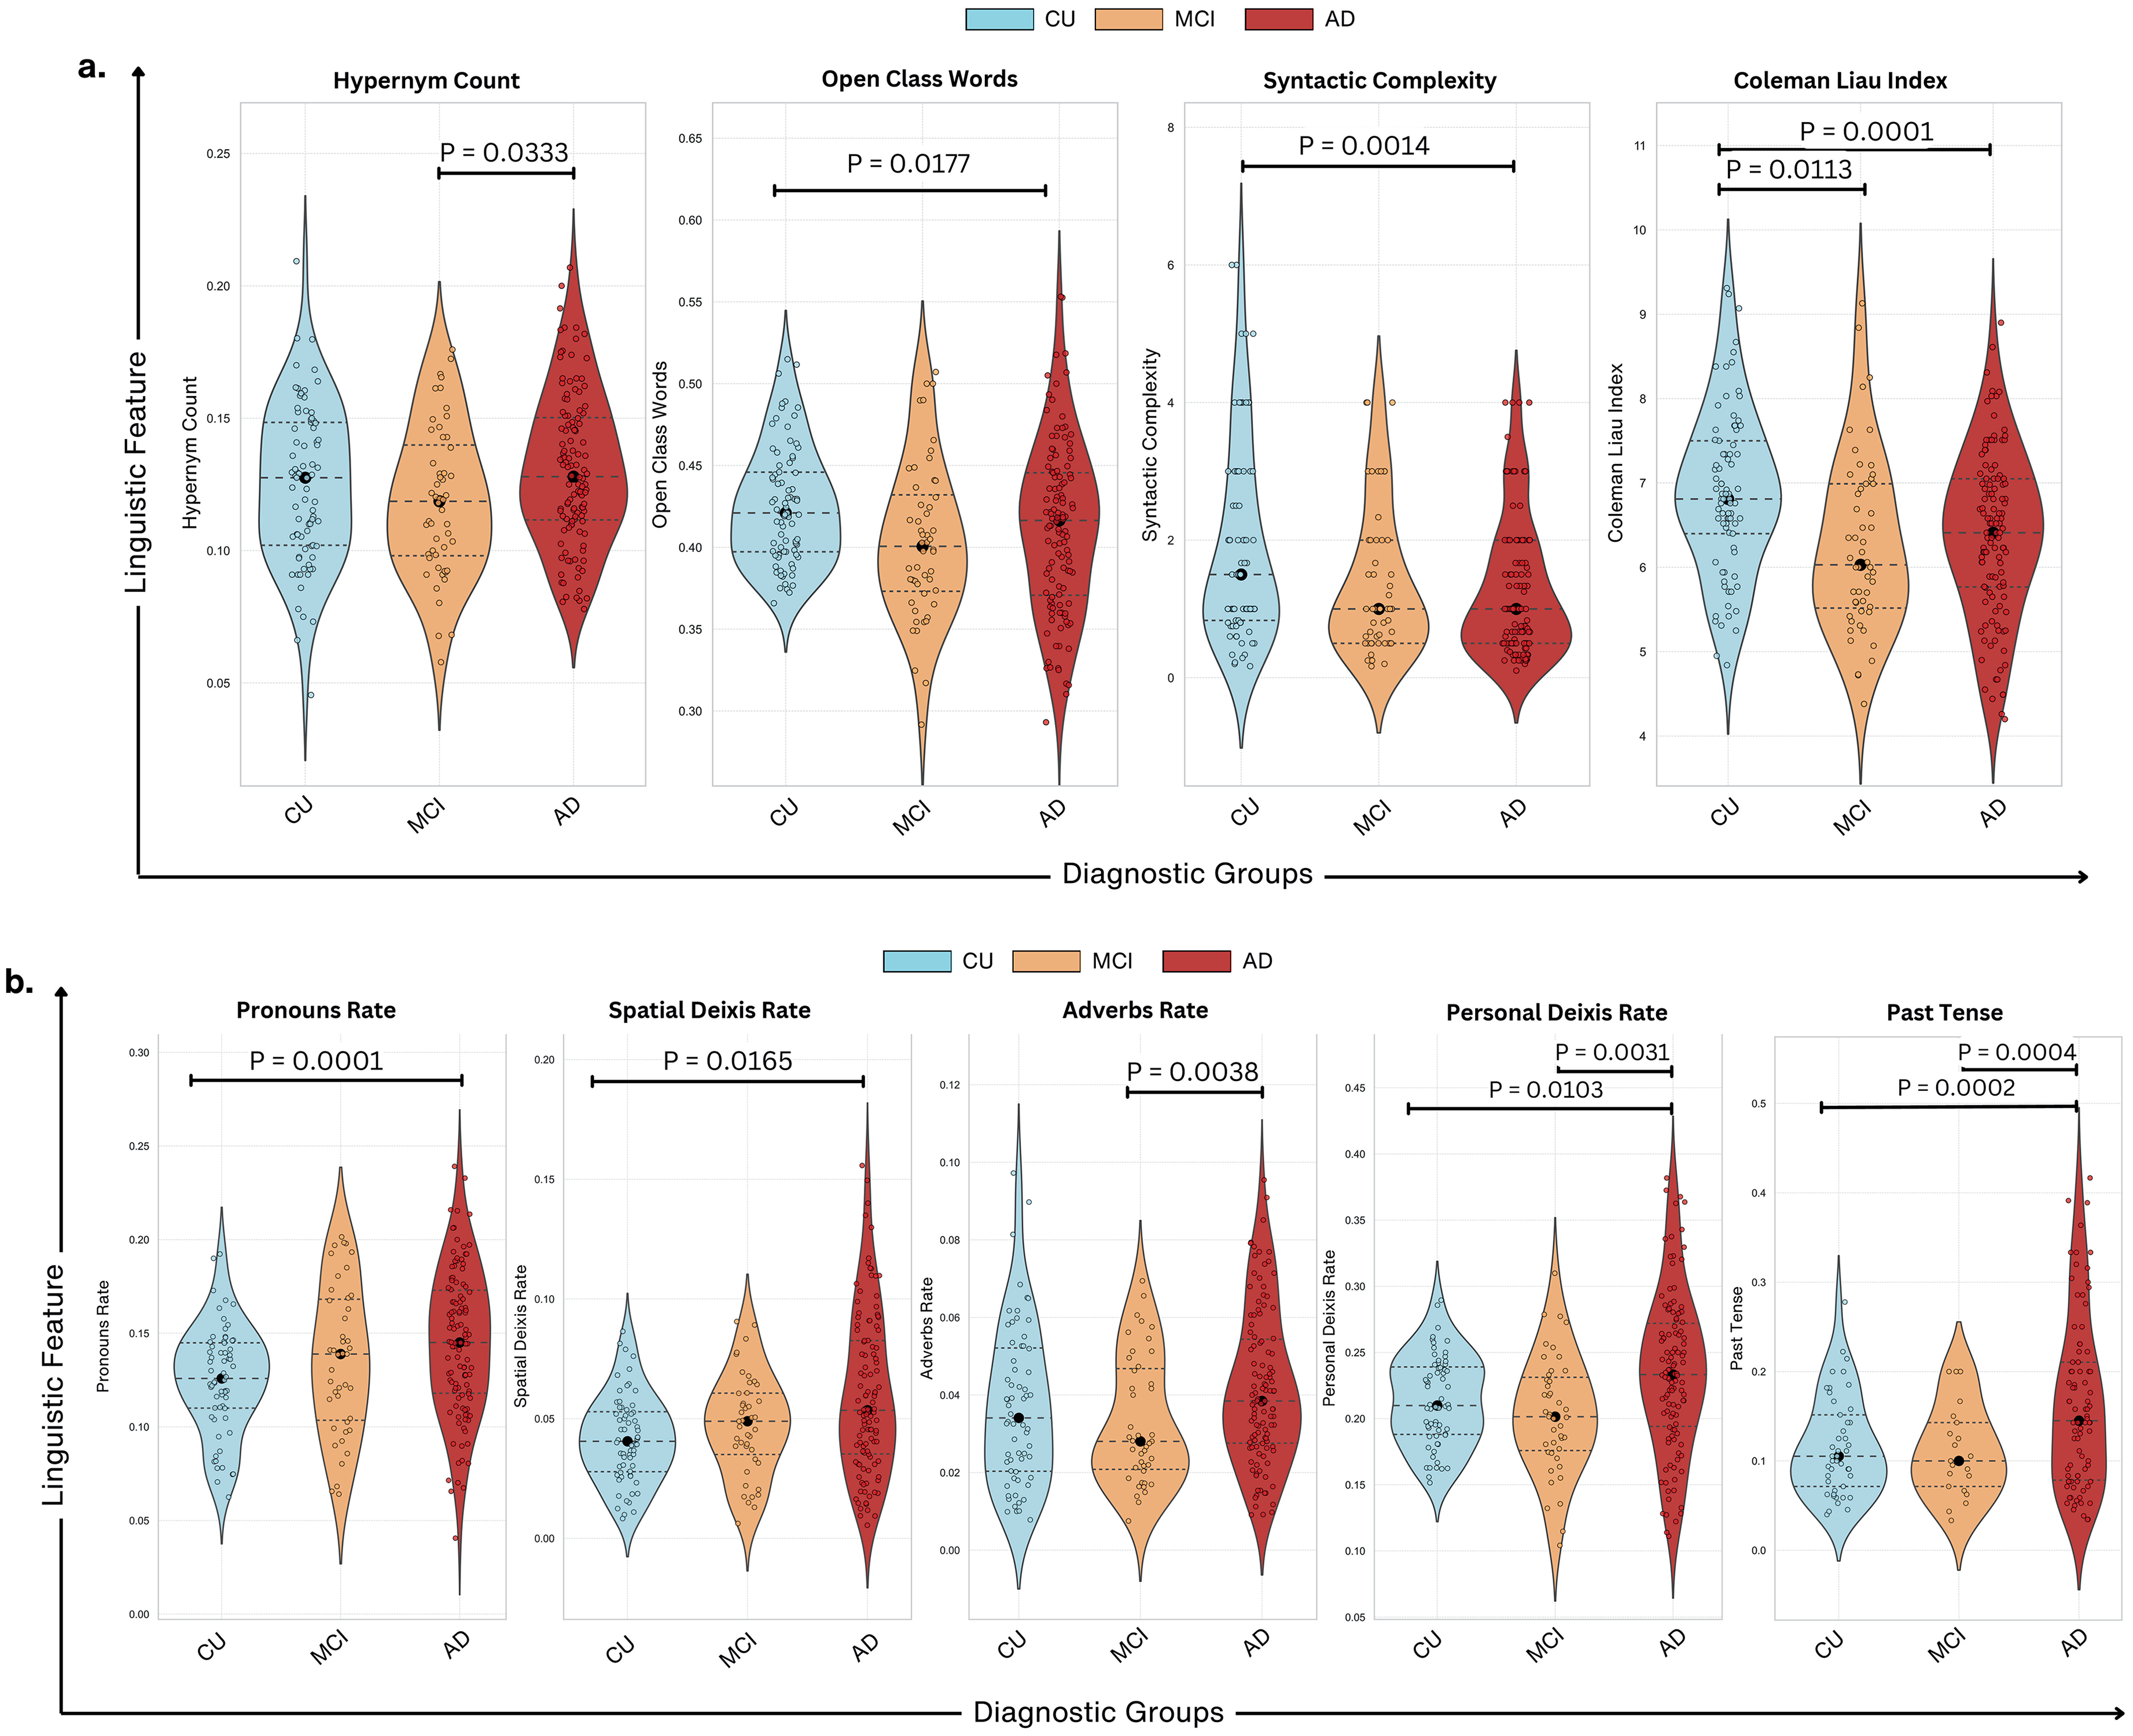
Linguistic feature distributions across diagnostic groups. (a) Violin plots show the distribution of linguistic features across cognitively unimpaired (CU), mild cognitive impairment (MCI), and Alzheimer's disease (AD) groups. Significant group differences are observed for Hypernym Count (p = 0.0333), Open Class Words (p = 0.0177), Syntactic Complexity (p = 0.0014), and Coleman Liau Index (p < 0.001). AD participants consistently exhibit lower scores in lexical diversity and syntactic complexity compared to CU and MCI. (b) Violin plots depict differences in pronouns rate (p = 0.0001), spatial deixis rate (p = 0.0165), adverbs rate (p = 0.0038), personal deixis rate (p = 0.0031), and past tense usage (p = 0.0002). Pronoun rate and past tense demonstrate the greatest divergence, with AD participants showing significant reductions.
AD participants exhibited higher pronoun usage than both MCI (p = 0.0001) and CU groups, highlighting a reliance on referential language. MCI participants also demonstrated a significant increase in pronouns and spatial deixis rates compared to CU (p = 0.0165), however, this feature plateaued in AD, reflecting a non-linear trajectory. AD participants used significantly higher adverbs compared to MCI (p = 0.0038), whereas neither MCI nor AD showed significant differences from CU. Personal deixis usage increased significantly across all groups, with AD showing the highest rates (CU versus AD: p = 0.0031; MCI versus AD: p = 0.0103). However, MCI were more aligned with CU than AD, emphasizing the complex progression of impairment.
AD also exhibited a sharp decline in past tense usage compared to CU (p = 0.0004) and MCI (p = 0.0002). While MCI was intermediate, they showed overlap with both CU and AD, indicating variability in their temporal organization abilities. Additionally, they exhibited characteristics closer to AD than CU, emphasizing the need for individualized assessments when analyzing early cognitive impairment. Past tense usage showed moderate effect size when comparing AD to CU (d = 0.52) and AD to MCI (d = 0.57), as well as pronoun rates (d = 0.57–0.58) across AD versus CU and AD versus MCI. These effect sizes imply that although they may have limited sensitivity in catching more subtle linguistic variations between CU and MCI, these linguistic markers are particularly more efficient in separating AD from CU and MCI.
Positive correlations between cognitive scores and linguistic complexity
Figure 6(a) illustrates the relationship between cognitive performance (as measured by MoCA and MMSE scores) and linguistic complexity features. Syntactic complexity showed a significant positive correlation with both MoCA (R² = 0.14, p = 0.037) and MMSE (R² = 0.05, p = 0.049), suggesting that individuals with higher cognitive scores tend to use more complex sentence structures. Similarly, the Coleman-Liau readability metric was positively associated with cognitive scores (MoCA: R² = 0.19, p = 0.0035; MMSE: R² = 0.08, p = 0.0055), indicating a higher sophistication in written-like speech among participants with better cognitive performance. In contrast, pronoun rates displayed an inverse relationship with cognitive scores. Higher pronoun usage was associated with lower cognitive performance (MoCA: R² = −0.22, p = 0.009; MMSE: R² = −0.17, p = 5.46e-06) suggesting that reliance on general referential terms rather than descriptive language increases as cognitive impairment progresses. These findings collectively highlight the utility of linguistic complexity as a sensitive indicator of cognitive health.
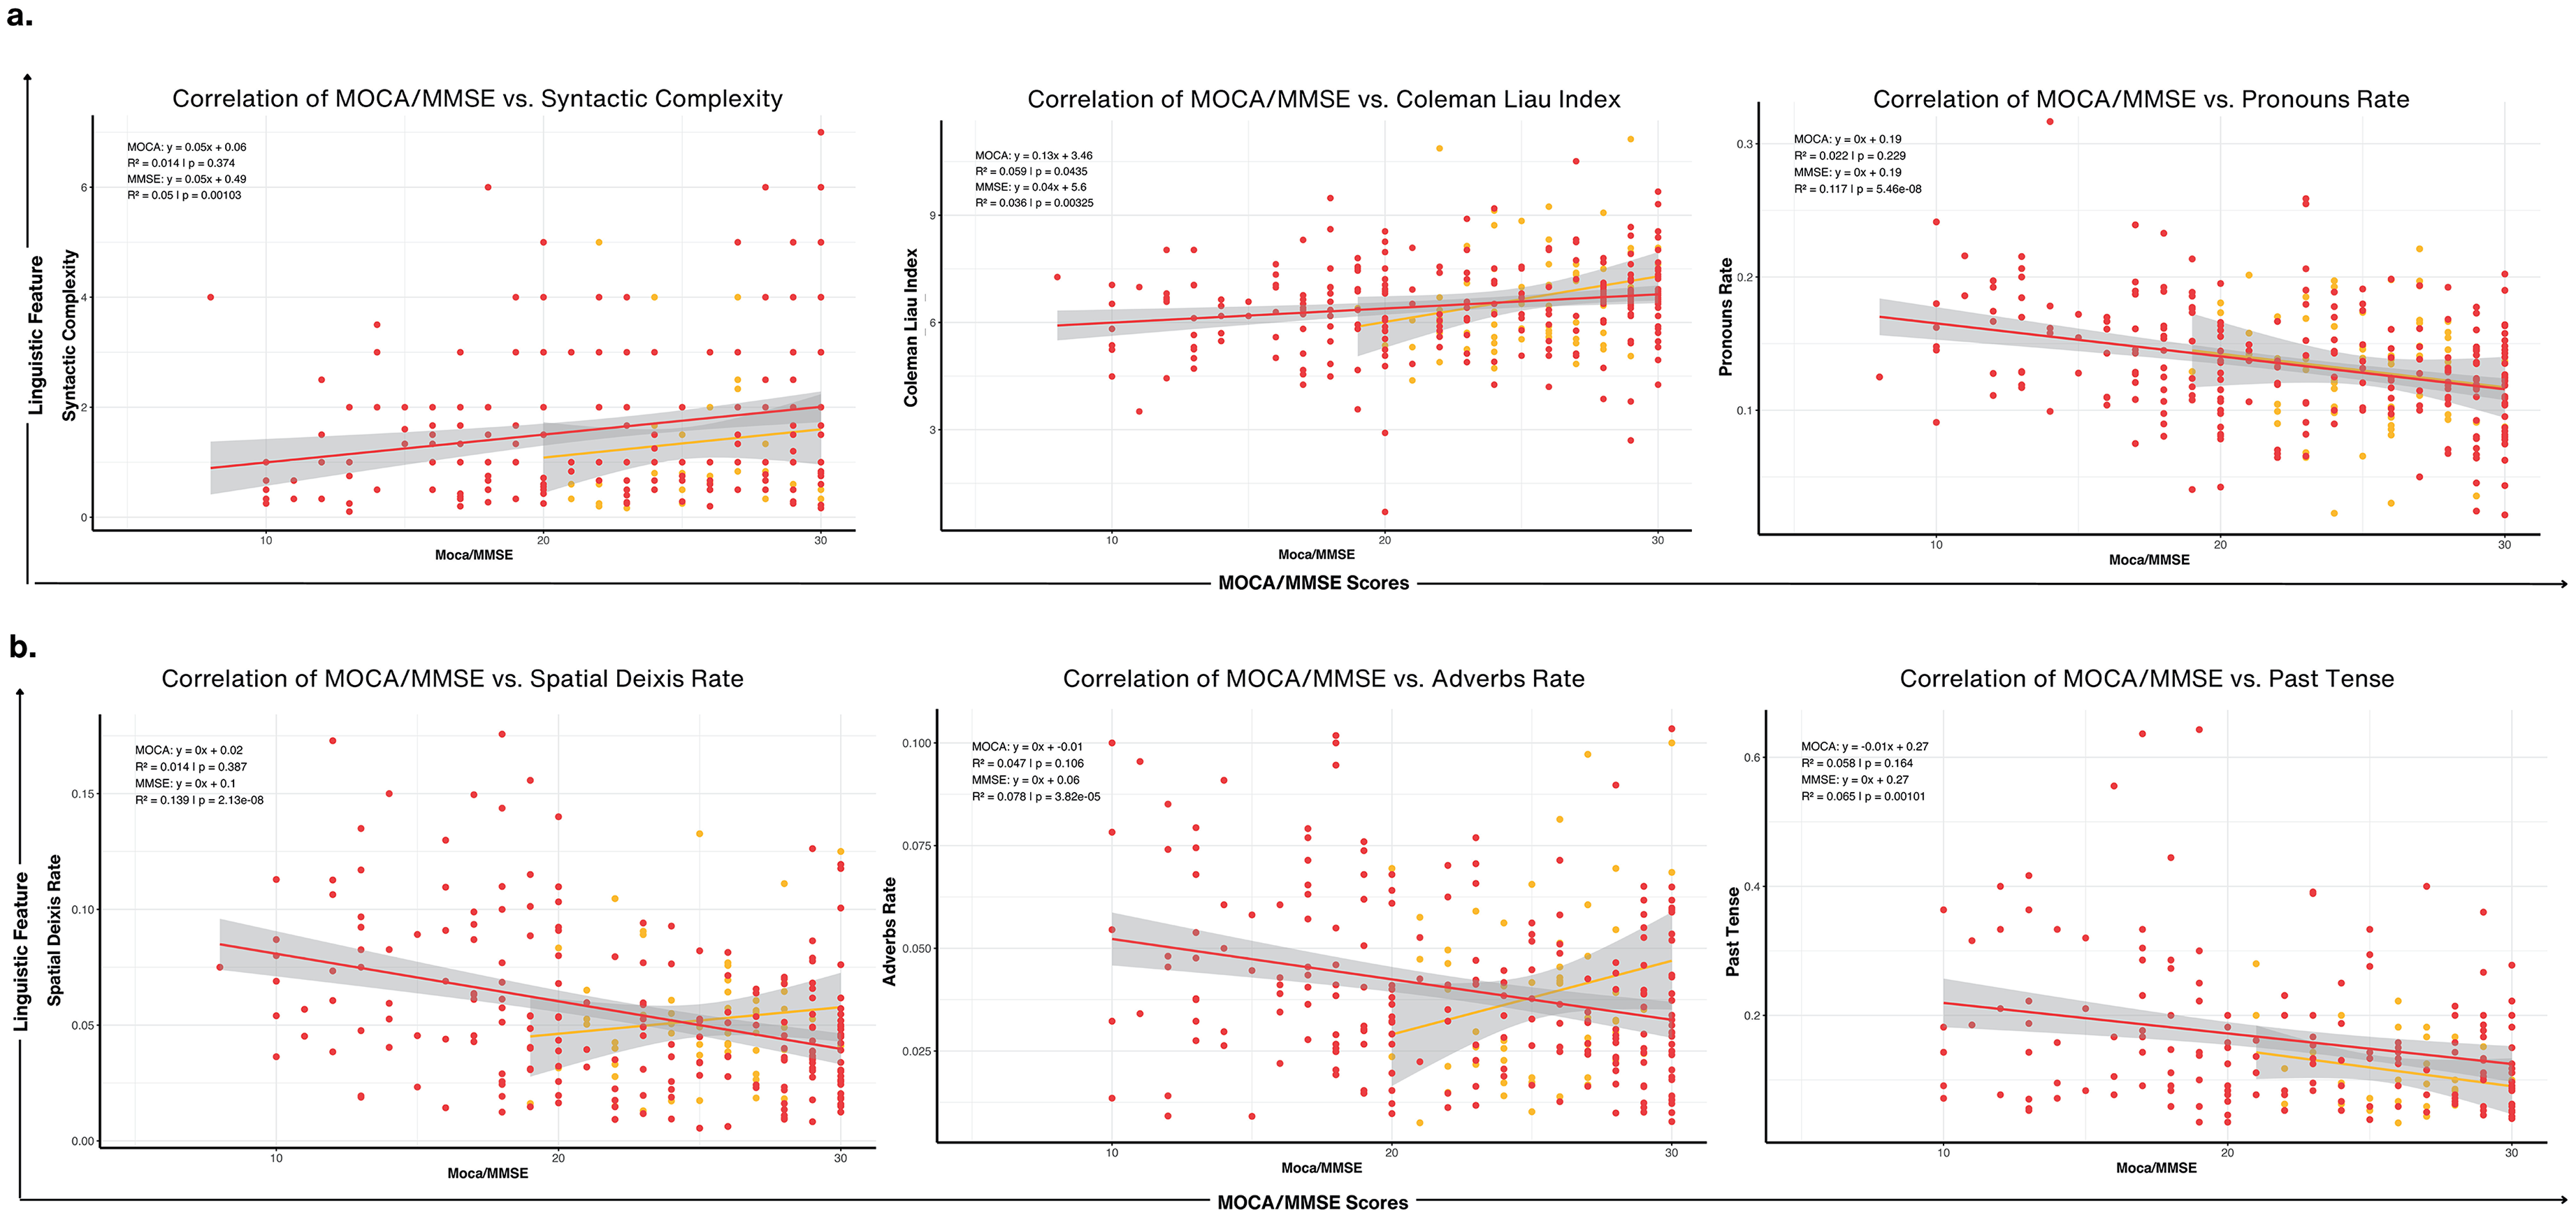
Correlations between linguistic features and cognitive scores (MoCA/MMSE). (a) Cognitive Scores versus Syntactic Complexity, Coleman Liau Index, and Pronouns Rate: Scatter plots display positive correlations of MoCA and MMSE scores with Syntactic Complexity (R = 0.34, p < 0.001) and Coleman Liau Index (R = 0.29, p < 0.001), indicating higher scores are associated with greater syntactic sophistication and readability. A negative correlation with Pronouns Rate (R = −0.22, p < 0.001) suggests reduced pronoun usage as cognitive impairment progresses. (b) Cognitive Scores versus Spatial Deixis, Adverbs Rate, and Past Tense: Cognitive scores show significant negative correlations with Spatial Deixis Rate (R = −0.13, p < 0.001) and Adverbs Rate (R = −0.08, p < 0.001), reflecting difficulties in anchoring narratives spatially and temporally. A strong negative correlation with Past Tense Usage (R = −0.24, p = 0.001) highlights impaired temporal structuring in individuals with lower cognitive scores.
Divergent trends in temporal and referential linguistic features
Figure 6(b) focuses on the correlations between cognitive scores and temporal or referential linguistic markers, including spatial deixis rate, adverbs rate, and past tense usage. Spatial deixis rate, representing the use of spatially anchored terms like “this” or “there,” exhibited a significant negative correlation with both MoCA (R² = −0.11, p = 0.041) and MMSE (R² = −0.13, p = 2.31e-08). Similarly, adverbs showed a slight negative association with MMSE (R² = −0.09, p = 3.80e-05), though this relationship was weaker for MoCA (R² = −0.01, p = 0.185). In contrast, past tense usage demonstrated a significant decline with decreasing cognitive scores (MoCA: R² = −0.16, p = 0.001; MMSE: R² = −0.17, p = 0.0001). These results emphasize how linguistic markers tied to time and space may serve as subtle indicators of cognitive impairment suggesting that participants with lower cognitive scores may rely more on spatially vague or context-dependent language and further affects temporal sequencing and narrative construction.
Discussion
Our study offers important new understanding of the link between linguistic changes and cognitive impairment in different diagnostic categories, therefore guiding early diagnosis and intervention plans for neurodegenerative diseases. We found unique linguistic profiles linked with CU, MCI, and patients with AD by extensively analysing a comprehensive set of features and applying advanced clustering approaches.
Clustering of linguistic features
By clustering 53 linguistic features, we identified four distinct linguistic domains: (1) Readability & Lexical Diversity, (2) Complexity, Fluency, & Structural Metrics, (3) Sentiment, Temporal, & Discourse Markers, and (4) Advanced Syntactic & Lexical Sophistication (Figure 3). Cluster 2 was particularly effective in distinguishing MCI from CU and AD groups and participants with MCI showed notable variations in syntactic complexity and fluency compared to CU individuals (p = 0.0203), thereby hinting at early abnormalities in executive function and working memory required for building ordered sentences.12,45 For instance, MCI participants exhibited reduced syntactic complexity (Figure 5(a)), reflecting subtle grammatical impairments that may precede more apparent cognitive impairment. On the other hand, Clusters 3 and 4 were most successful in capturing flaws in sentiment expression, temporal cohesiveness, and lexical sophistication, therefore separating AD from CU groups. In advanced cognitive impairment stages, AD participants showed notably poorer reading scores (Coleman-Liau Index) than CU (p = 0.0001) and MCI (p = 0.0113), therefore indicating reduced sentence complexity and lexical richness. 46
Furthermore supported by model performance was the fact that some language deficiencies became more noticeable in later disease stages. Although the Random Forest classifier obtained an overall accuracy of 44.43%, significant misclassification between the CU and MCI groups indicates that early-stage cognitive decline remains difficult to identify using language analysis alone and emphasizes the need of more advanced modeling approaches, such deep learning architectures capable of capturing contextual dependencies in speech. Future research should investigate hybrid models including ensemble learning techniques, such RF + SVM combinations can improve prediction robustness.
Compensatory mechanisms in language use
Even with major impairments, AD participants showed clear compensating strategies in their language use. Through an increased reliance on pronouns and spatial deixis, their efforts suggested maintaining fluency despite difficulties retrieving specific nouns or proper names as shown by AD's significantly higher pronoun usage compared to MCI and CU groups (p = 0.0001) which has also been highly evident in prior research.21,46,47 Additionally, the higher use of adverbs among AD participants (compared to MCI, p = 0.0038) may serve to provide context and compensate for lexical retrieval deficits that allow individuals with AD to maintain communicative effectiveness, though at the expense of linguistic specificity. 48 Differentiating between adaptive language use and real linguistic deficits depends highly on being aware of such trends. In clinical environments, for instance, misunderstanding these compensatory language strategies as basic language degradation could cause one to underestimate a patient's communicative capacity. 49 Additionally, even though several characteristics showed statistically significant variations between groups, effect sizes differed reinforcing that statistical significance alone does not ensure therapeutic value. For instance, pronoun usage and past tense, had modest effects, suggesting they may serve as significant indicators of cognitive impairment, however, hypernym count and spatial deixis had minimal effect sizes and consequently may possess no independent diagnostic utility despite their statistical importance. This distinction is especially important in guaranteeing that linguistic results represent not just sample-specific variability but also clinically relevant clinical applications instead of random chance.
Neurocognitive correlations and task-specific variability in linguistic features
We also observed strong correlations between linguistic complexity measures such as syntactic complexity and cognitive scores, as they was positively correlated with both MoCA (R² = 0.14, p = 0.037) and MMSE (R² = 0.05, p = 0.049) scores. This finding suggests that people with higher cognitive scores tend to produce more complex sentences likely to reflect intact executive function and working memory. This feature is essential for constructing grammatically sophisticated and structured speech as sentence complexity often relies on the ability to manage multiple clauses, maintain coherence across longer utterances, and integrate diverse syntactic elements, all of which are cognitively demanding processes. 50 Additionally, the positive correlation of the Coleman-Liau index with cognitive scores (MoCA: R² = 0.19, p = 0.0035), further emphasized the capacity of those who tend to score higher on cognitive tests will produce speech that more closely resembles written language, with a higher readability that is characteristic of more sophisticated, well-organized speech. In contrast, lower cognitive scores suggested that individuals will increasingly rely on more vague language techniques such as increased pronoun usage (MoCA: R² = −0.22, p = 0.009), reinforcing their reliance on less specific language markers to replace key names, objects or locations. Similarly, the negative correlations between spatial deixis (MMSE: R² = −0.13, p < 0.0001) and past tense usage (MoCA: R² = −0.16, p = 0.001) indicate deficits in structuring discourse within space and time and could be indicative of declining visuospatial processing, episodic memory deficits and disorganized temporal discourse, which are critical components of narrative cohesion. These linguistic metrics offer a non-invasive and cost-effective alternative for early detection of cognitive impairment compared to traditional biomarkers like neuroimaging.
Lastly, our analysis revealed that the diagnostic utility of linguistic features varied across different language tasks. The Cookie Theft picture description task was most effective in eliciting critical linguistic markers, likely due to its structured nature and larger sample size (N = 310). Significant differences were observed in pronoun rate, past tense usage, and personal deixis rate among diagnostic groups (p < 0.0001). This task captured nuanced linguistic changes reflective of cognitive impairment, making it a reliable tool for assessments. 10 In contrast, Cat Rescue (N = 97) and Coming & Going (N = 70) exhibited lower sensitivity, with only subjectivity reaching statistical significance in Coming & Going (p = 0.0367). However, attributing the reduced sensitivity solely to sample size may oversimplify their purpose. The inherent differences in cognitive and linguistic demands between tasks likely play a significant role. The Cookie Theft task, being a well-established and highly structured narrative elicitation task, may prompt more detailed descriptions and complex language use, thereby amplifying the detection of linguistic deficits. 43 Unlike open-ended or conversational tasks, it provides a controlled stimulus, reducing response variability while still engaging cognitive processes such as attention, working memory, and syntactic organization. Regardless of this, while the Cookie Theft description appears effective, relying solely on a single task may not capture the full spectrum of language deficits. Different tasks may tap into various cognitive and linguistic domains, and a comprehensive assessment should include multiple tasks to evaluate a range of abilities. 21 For instance, Coming & Going consists of two sequentially related images, which may require narrative planning, inferencing, and event integration. Therefore, this task may be better suited for detecting subtle deficits in discourse coherence rather than core linguistic impairments. On the other hand, Cat Rescue involves multiple concurrent events, which could lead to increased variability in responses based on individual differences in verbal working memory and attentional control.
Most importantly, when expanded to different demographics, there is a need to consider potential cultural and educational biases inherent in specific tasks. The Cookie Theft picture, developed in the 1970s, may not be equally familiar or relevant to all participants, potentially affecting performance. 51 Future research should explore the development and validation of culturally neutral and contextually appropriate tasks that can reliably elicit linguistic markers of cognitive impairment across diverse populations. Additionally, some studies have found that narrative tasks are more sensitive than picture descriptions in detecting early language changes, 51 while others suggest that conversational speech offers the most natural context for observing linguistic deficits. 52 This inconsistency also suggests that no single task is universally superior and that a multifaceted approach may be necessary.
Limitations, implications, and future directions
Several limitations warrant consideration. The cross-sectional design of this study limits our ability to capture the temporal progression of linguistic changes and longitudinal studies are needed to validate the predictive utility of these markers especially over time. Future studies should implement follow-up assessments at regular intervals to monitor changes in linguistic features and correlate them with cognitive trajectories. Additionally, although this study controlled for key demographic variables such as age, sex, and education, critical vascular factors, medical comorbidities, and APOE4 status in brain imaging and dementia progression were not available in these particular DementiaBank datasets. These factors provide further insights into how genetic and vascular risk factors interact with deficits in language, as they play an important role in neurodegeneration and could influence linguistic trajectories. This specific concern is further emphasized by our moderate RF classification performance. That being said, future work would also benefit from integrating prosodic, neurocognitive, and biological markers to improve predictive accuracy.
Differences in sample sizes across our dataset for CU, MCI, and AD groups naturally reflect the prevalence in real world clinical populations, however this discrepancy has a big influence on AI-driven analyses with a heavy bias towards the larger dataset. 53 Effect size reporting did ensure that observed differences were not driven solely by sample size disparities but this measure is considered more statistical rather than predictive modeling-focused. Additional research is needed to explore resampling techniques such as synthetic minority over-sampling (SMOTE), stratified bootstrapping as well as statistical validation to further enhance model robustness and generalizability of machine learning applications. Cultural and linguistic biases may also affect how features manifest in different populations. Differences in language use across populations, dialects, and elicitation tasks could influence model performance and limit generalizability of our findings, therefore, testing these linguistic markers on independent corpora is crucial especially across multilingual participants and using cross-cultural comparisons. 21
Overall in therapeutic practice, essential linguistic biomarkers such as grammatical complexity, readability, and discourse cohesion are not often evaluated. While physicians may identify overt speech impairments in advanced stages of disease progression, subtle alterations such as modified past tense usage or increased dependency on pronouns often go unnoticed. As mentioned, our findings indicate that several linguistic characteristics deteriorate at distinct stages: syntactic and lexical impairments emerge early in MCI, whereas discourse-level disruptions become increasingly apparent in AD. Clustering these linguistic changes can provide a more comprehensive understanding of cognitive decline that is not present in traditional testing. This technique is valuable across diverse languages, as it identifies universal patterns of linguistic decline rather than relying on language-specific markers making it applicable in multilingual clinical settings. For example, AI-powered solutions aligned with smart home assistants or healthcare systems can assess whether a patient's weaknesses align with fluency and structural metrics (Cluster 2) or advanced syntax and lexical discourse fragmentation (Cluster 4) to enable clinicians to tailor treatments and automatically identify these trends over time for risk evaluations.
Incorporating multimodal biomarkers such as neuroimaging, genetic data, and electrophysiological measures could also further enhance diagnostic accuracy and deepen our understanding of underlying neuropathological changes. 54 Advanced NLP models and machine learning techniques could significantly improve sensitivity as deep learning algorithms demonstrate the ability to capture even more nuanced patterns. 55 However, the rapid pace of innovation in NLP, particularly with LLMs, presents both opportunities and challenges. While LLMs offer superior contextual understanding and pattern detection, their computational cost, resource demands, and black-box nature may limit feasibility and interpretability in clinical research. Therefore as previously mentioned, this study purposely employed modular NLP techniques due to their computational efficiency, transparency, and reproducibility. Therefore, as the field advances, hybrid approaches that integrate the strengths of LLMs and modular pipelines may strike a balance between innovation and practicality, especially in the clinical setting to ensure consistency and cross-study comparability.
Conclusion
Ultimately, this work emphasizes the transforming power of linguistic analysis in identifying cognitive impairment at several phases of diagnosis. By clustering linguistic features into interpretable domains, we found patterns of language changes such as structural deficits in sentence complexity emerging as early markers of MCI, while higher-order impairments in sentiment expression and syntactic sophistication characterizing the progression in AD. We also found characteristics that offset these weaknesses, such as increased use in pronouns and adverbs which shed more light on the adaptive techniques used by people with cognitive impairments.
Integrating linguistic markers into routine clinical assessments is a non-invasive, economic approach that highlights how speech analysis software can be beneficial in primary care to screen for early signs of cognitive impairment and enable timely referrals and interventions. 56 To increase diagnostic accuracy and outcomes for those at risk of Alzheimer's disease, future work should prioritize refining these tools and integrating them with multimodal data including neuroimaging and genetic biomarkers. Furthermore, the increasing adoption of ambient AI scribing systems in primary care settings offers a unique opportunity for secondary use of recordings to provide valuable datasets for HIPAA compliant large language models (LLMs) to allow for more accurate and clinically validated tools. Ultimately, studies in this field have the opportunity to accelerate the development of AI-driven diagnostic tools into healthcare environments and transform routine documentation into proactive screening mechanisms.
Supplemental Material
sj-docx-1-alz-10.1177_13872877251339756 - Supplemental material for Artificial intelligence-driven natural language processing for identifying linguistic patterns in Alzheimer's disease and mild cognitive impairment: A study of lexical, syntactic, and cohesive features of speech through picture description tasks
Supplemental material, sj-docx-1-alz-10.1177_13872877251339756 for Artificial intelligence-driven natural language processing for identifying linguistic patterns in Alzheimer's disease and mild cognitive impairment: A study of lexical, syntactic, and cohesive features of speech through picture description tasks by Cynthia A Nyongesa, Mike Hogarth and Judy Pa in Journal of Alzheimer's Disease
Footnotes
Acknowledgments
We gratefully acknowledge the contributions of Francois Boller (Department of Neurology, The George Washington University), James Becker (Alzheimer's Disease Research Center, University of Pittsburgh), Jed Meltzer (Baycrest Hospital and University of Toronto), and Alyssa Lanzi (Department of Communication Sciences and Disorders, University of Delaware) for providing the speech data used in this study and their efforts in data collection and sharing.
Ethical considerations
As mandated by the Institutional Review Board (IRB), all human subjects in each cohort provided informed consent for participation and data sharing. Data was obtained, anonymized and made available through DementiaBank and AphasiaBank in accordance with their ethical guidelines for data sharing and IRB approvals. All data access was restricted to authorized researchers using password protection, ensuring compliance with privacy regulations.
Consent to participate
As mandated by the Institutional Review Board (IRB), all human subjects in each cohort provided informed consent for participation and data sharing.
Author contributions
Cynthia Nyongesa: Conceptualization, Data curation, Formal analysis, Investigation, Methodology, Project administration, Resources, Software, Validation, Visualization, Writing – original draft, Writing – review & editing. Mike Hogarth: Methodology, Writing – review & editing. Judy Pa: Funding acquisition, Investigation, Project administration, Resources, Supervision, Visualization, Writing – review & editing.
Funding
The authors disclosed receipt of the following financial support for the research, authorship, and/or publication of this article: This study was supported by the National Institute on Aging (NIA) grants AG03705 and AG05133 for the Pitt corpus in the DementiaBank, and by the National Institute on Deafness and Other Communication Disorders (NIH-NIDCD) grant R01-DC008524 (2022–2027) for AphasiaBank. We appreciate the invaluable contribution these funding sources have provided in allowing access to important datasets and thereby supporting the methodological framework required for this study.
Declaration of conflicting interests
The authors declared the following potential conflicts of interest with respect to the research, authorship, and/or publication of this article: Mike Hogarth is a paid scientific advisor for Medeloop.ai. This relationship is disclosed in accordance with journal policies and has no bearing on the results or subject matter of this study. Medeloop.ai was not involved in the conception, execution, analysis, or publication of this work.
Data availability statement
The data supporting the findings of this study are derived from the Pitt Corpus, Delaware Corpus, and Baycrest Corpus, available at https://dementia.talkbank.org. These datasets were accessed under the terms and conditions specified by the DementiaBank project. Data that was generated during the study, which includes processed linguistic features and analyses, is available in a public GitHub repository at ![]() .
.
Supplemental material
Supplemental material for this article is available online.
References
Supplementary Material
Please find the following supplemental material available below.
For Open Access articles published under a Creative Commons License, all supplemental material carries the same license as the article it is associated with.
For non-Open Access articles published, all supplemental material carries a non-exclusive license, and permission requests for re-use of supplemental material or any part of supplemental material shall be sent directly to the copyright owner as specified in the copyright notice associated with the article.