
Abstract
Background
18F-fluoro-2-deoxy-2-D-glucose positron emission tomography (18F-FDG PET) is a biomarker of neuronal injury, according to the revised National Institute on Aging-Alzheimer's Association criteria.
Objective
This multicenter prospective cohort study aimed to evaluate the value of 18F-FDG PET for differential diagnosis of Alzheimer's disease (AD) and frontotemporal lobar degeneration (FTLD) in comparison with phosphorylated tau protein (p-tau181) in cerebrospinal fluid (CSF).
Methods
In total, 138 patients (AD, 119; FTLD, 19) from 11 participating institutions underwent clinical and neuropsychological examinations, magnetic resonance imaging (MRI), CSF examination, and 18F-FDG PET at baseline. The cases were visually classified into predefined dementia patterns using 18F-FDG PET by three experts. A region-of-interest (ROI)-based automated analysis of 18F-FDG PET was also performed. The participants were followed up for 12 months, and the clinical diagnosis of dementia was re-evaluated.
Results
The sensitivity, specificity, and accuracy of the visual reading of18 F-FDG PET for differentiating AD from FTLD were 94%, 78%, and 92%, respectively. In contrast, those of p-tau181 in CSF were 62%, 79%, and 65%, respectively. The sensitivity, the primary endpoint, was 32% higher for 18F-FDG PET than for p-tau181 in CSF. Additionally, the accuracy, the secondary endpoint, was 27% higher for 18F-FDG PET than for p-tau181 in CSF. In addition to the visual reading of 18F-FDG PET, the ROI-based automated analysis showed sensitivity, specificity, and accuracy of 81%, 79%, and 81%, respectively.
Conclusions
This study showed that the diagnostic performance of 18F-FDG PET in differential diagnosis of AD and FTLD was higher than that of p-tau181 in CSF.
Trial registration
UMIN-CTR (UMIN 000016427, https://www.umin.ac.jp/ctr/) and Japan Registry of Clinical Trials (jRCTs041180098, https://jrct.mhlw.go.jp/)
Keywords
Introduction
In the diagnosis of Alzheimer's disease (AD), computed tomography (CT), and magnetic resonance imaging (MRI) have been considered essential for excluding dementias such as normal pressure hydrocephalus and chronic subdural hematoma, which can be cured by surgical treatment, as well as for evaluating cerebrovascular disease. In contrast, functional imaging such as positron emission tomography (PET) using [18F] Fluoro-2-deoxy-2-D-glucose (18F-FDG) to evaluate glucose metabolism (hereafter referred to as “FDG-PET”) has been considered an adjunctive diagnostic modality to increase diagnostic confidence. However, with the increasing need for early, precise diagnosis and advances in imaging techniques, such as amyloid imaging, the position of functional imaging in the diagnosis of AD has changed significantly.
In 2011, the National Institute of Neurological and Communicative Disorders and Stroke and the Alzheimer's Disease and Related Disorders Association (NINCDS-ADRDA) revised the clinical diagnostic criteria for AD, and MRI, FDG-PET, and amyloid imaging were added to the diagnostic criteria for AD as biomarkers, along with CSF amyloid-β (Aβ) and tau.1–4 In addition, even as clinical application of amyloid imaging has begun, the utility of FDG-PET in the diagnosis of dementia has been reaffirmed.5,6
Since 2004, FDG-PET has been covered by the public insurance (Medicare) in the United States to differentiate between AD and frontotemporal dementia (FTD). Since FTD, as defined by public insurance, includes progressive non-fluent aphasia and semantic dementia, frontotemporal lobar degeneration (FTLD) will be used hereafter, as it is a more appropriate term than FTD. 7
However, in Japan, FDG-PET is not yet covered by public insurance for the diagnosis of dementia, and it is hoped that public insurance will cover FDG-PET as soon as possible. Therefore, the Japanese Society of Nuclear Medicine applied to expand the coverage of FDG-PET for the diagnosis of AD in preparation for the revision of medical reimbursement in April 2010. However, the application was not approved because it was outside the scope of the approved details of the Pharmaceuticals and Medical Devices Agency (PMDA) in Japan for the automated FDG synthesizer as a medical device.
Subsequently, in November 2011, the study group of Japan's Ministry of Health, Labour and Welfare selected an additional indication for an automated FDG synthesizer for dementia as a medical device with high medical needs and additional scientific evidence was required for the PMDA approval. Therefore, this study aimed to confirm the usefulness of FDG-PET in the diagnosis of dementia.
In this study, phosphorylated tau protein (p-tau) 181 in CSF was selected as a diagnostic control for FDG-PET. This p-tau 181 in CSF was already covered by public insurance for the diagnosis of dementia, but then both Aβ42 and total tau in CSF were not covered in Japan. Therefore, we designed this study to compare the difference in diagnostic performance between FDG-PET and p-tau181 in CSF in the differential diagnosis of AD and FTLD. We believe that if the diagnostic performance of FDG-PET can be shown to be equivalent or superior to that of p-tau181 in CSF, the clinical utility of FDG-PET can be demonstrated.
Methods
Study design
This prospective, multi-institutional study was conducted at 11 facilities (Supplemental Table 1). The study (Study on Diagnosis of Alzheimer's disease with FDG-PET: SDAF-PET) was first reviewed and approved by the Institutional Review Board of the National Center for Geriatrics and Gerontology and registered with UMIN (UMIN 000016427) on February 3, 2015. Subsequently, with the enactment of the Clinical Research Act in Japan, it was again reviewed and approved by the Nagoya University Clinical Research Review Board and registered with JRCT (jRCTs041180098) on March 14, 2019. The study protocol was prepared in agreement with the PMDA in Japan and approved by Japan's Ministry of Health, Labour and Welfare under the advanced healthcare services system.
Participants whose written consent was obtained and who were clinically diagnosed with AD or FTLD by clinical, neuropsychological, and MRI examinations were enrolled in the study. FDG-PET and CSF examinations were performed within 4 weeks of enrollment. The target number of patients at enrollment was 190 (AD group, 150; FTLD group, 40).
In addition, 12 months after enrollment, neuropsychological and MRI examinations were performed to clinically diagnose AD and FTLD; this diagnosis was used as the gold standard (final clinical diagnosis).
The primary endpoint of this study was the difference in sensitivity between FDG-PET and p-tau181 in CSF for differentiating AD from FTLD. The sensitivity was calculated by comparing the results of the image interpretation and the results of p-tau181 in CSF with the gold standard.
Secondary endpoints were as follows: (1) difference in accuracy of FDG-PET and p-tau181 in CSF for the differential diagnosis between AD and FTLD; (2) diagnostic performance of FDG-PET based on clinical diagnosis reflecting CSF Aß42; (3) region of interest (ROI)-based automated analysis for 18F-FDG PET; and (4) group analysis of CSF biomarkers and MRI between AD and FTLD.
The integrity of the data and compliance with the procedures were verified by third-party monitoring at each facility. Subsequently, an overall confirmation was made by a third-party audit.
Participating subjects
The inclusion criteria for the study were as follows: (1) patients with AD or FTLD whose native language is Japanese; (2) participants must sign a written consent form. If the subject is deemed incapable of consenting, a substitute must give his/her consent and sign on his/her behalf; (3) participants must be accompanied by a research assistant who is able to assess and evaluate the subject's situation; (4) they must be between 55 and 84 years of age (at the time of obtaining consent); and (5) they must be able to undergo a PET scan.
The criteria for AD were as follows: (1) Mini-Mental State Examination (MMSE) score between 20 and 26; (2) objective evidence of memory impairment, taking into account age and education; (3) Wechsler Memory Scale-Revised (WMS-R) Logical Memory II subscale (Delayed Replay Task of Logical Memory: maximum score 25) must be below the cutoff value by years of education; (4) Clinical Dementia Rating (CDR) of 0.5 or 1; and (5) the patient must meet the NINCDS-ADRDA Criteria for Probable AD (diseases and causes of dementia other than AD must be excluded). 8
The criteria for FTLD were as follows: (1) MMSE score between 20 and 26 points; (2) CDR of 0.5 or 1; and (3) FTLD clinical diagnostic criteria must be met (diseases and causes of dementia other than FTLD must be excluded). However, FDG-PET is excluded from the clinical diagnostic criteria for FTLD. Details of the FTLD clinical diagnostic criteria were based on the diagnostic criteria for each type. 9
The exclusion criteria for this study were as follows: (1) patients with a history of or undergoing treatment for alcoholism; (2) patients with a history of or undergoing treatment for epilepsy; (3) patients with less than 6 years of education; (4) patients with diabetes and on insulin therapy; (5) patients receiving antidepressants, antipsychotics, or long-term hypnotic sedatives (including anxiolytics); (6) patients who have been diagnosed with major depressive or bipolar disorder within the past year, patients with a history of schizophrenia, or patients with severe psychiatric symptoms such as anxiety or agitation within the last 3 months who are unlikely to be able to complete the protocol; (7) patients with serious complications (malignancy, heart failure, hepatic disorder, renal disorder, endocrine disorder, and so on); and (8) patients whose MRI reveals cerebral infarction or other focal lesions that may affect cognitive function.
Determining the number of cases
With reference to previous studies,10,11 assuming “sensitivity of FDG-PET: 90%, specificity: 70%; sensitivity of p-tau: 75%, specificity: 70%” and α (type 1 error) and β (type 2 error) as 0.05 and 0.2, respectively, the number of AD cases needed to assess sensitivity, the primary endpoint, is 97 cases. Assuming a dropout rate of approximately 20%, the number of cases required would be approximately 125.
Based on the sensitivity and specificity of FDG-PET and p-tau, and the accuracy calculated by assuming an 80%:20% prevalence ratio of AD and FTLD, the number of cases required to assess the accuracy, a secondary endpoint, is 170 cases. The breakdown of the required number of cases is 136 AD cases and 34 FTLD cases.
In addition to the primary endpoint of sensitivity, we set the number of AD and FTLD cases to 150 and 40, respectively, to allow for a dropout rate of approximately 10% for the secondary endpoint of accuracy.
Neuropsychological test battery
Patients were, initially and 12 months after enrollment, assessed using a neuropsychological test battery, including the MMSE, Alzheimer's Disease Assessment Scale-Cognitive Subscale (ADAS), CDR, Frontal Assessment Battery, and WMS-R LM.
FDG-PET
Prior to baseline FDG-PET scanning, all participants fasted for at least 4 h. Intravenous administration of 18F-FDG (185 ± 37 MBq) was followed by a resting period of 30 min in a dimly lit, quiet room. A 3D dynamic scan with six 300-s frames was performed 30 min after 18F-FDG injection. Attenuation was corrected using a CT scan for PET/CT. Supplemental Table 2 lists the PET/CT devices and reconstruction conditions.
The FDG-PET images were processed using the 3-dimensional stereotactic surface projection (3D-SSP) technique to generate z-score maps, using iSSP software version 3.5 (Nihon Medi-Physics Co. Ltd, Tokyo, Japan). The normal database used for generating the z-score maps was constructed based on 50 normal subjects (20 males and 30 females, average age = 67.8 y) from five participating institutions. The healthy subjects in the normal database had no memory complaints and no history of neurological or psychiatric disorders. The results of their neurological and brain imaging examinations (MR or CT) were normal, and their cognitive function was judged to be normal by experienced neurologists (MMSE score, 26–30).
PET image interpretation
Three nuclear medicine experts, blinded to the clinical information, independently evaluated the reconstructed PET images with reference to the 3D-SSP z-score map (tomogram + 3D-SSP) to classify the images into different dementia patterns of AD and FTLD according to the imaging diagnostic criteria of a previous study. 10
This interpretation method attributes frontal and anterior temporal hypometabolism to FTLD and parietal, posterior cingulate, and lateral temporal hypometabolism to AD. It guides the interpreter to imagine a fulcrum in the middle of the brain. If the visible “weight” of the hypometabolism is predominantly anterior, then the scan is classified as showing FTLD, whereas if it is predominantly posterior, then the scan is classified as showing AD. Examples of FDG PET scan patterns are shown in Figure 1. When the evaluation of the three raters was not in complete agreement, the evaluation agreed upon by the two raters was considered the final evaluation, and in cases where the evaluation of all three raters differed, the final evaluation was “undecided”.
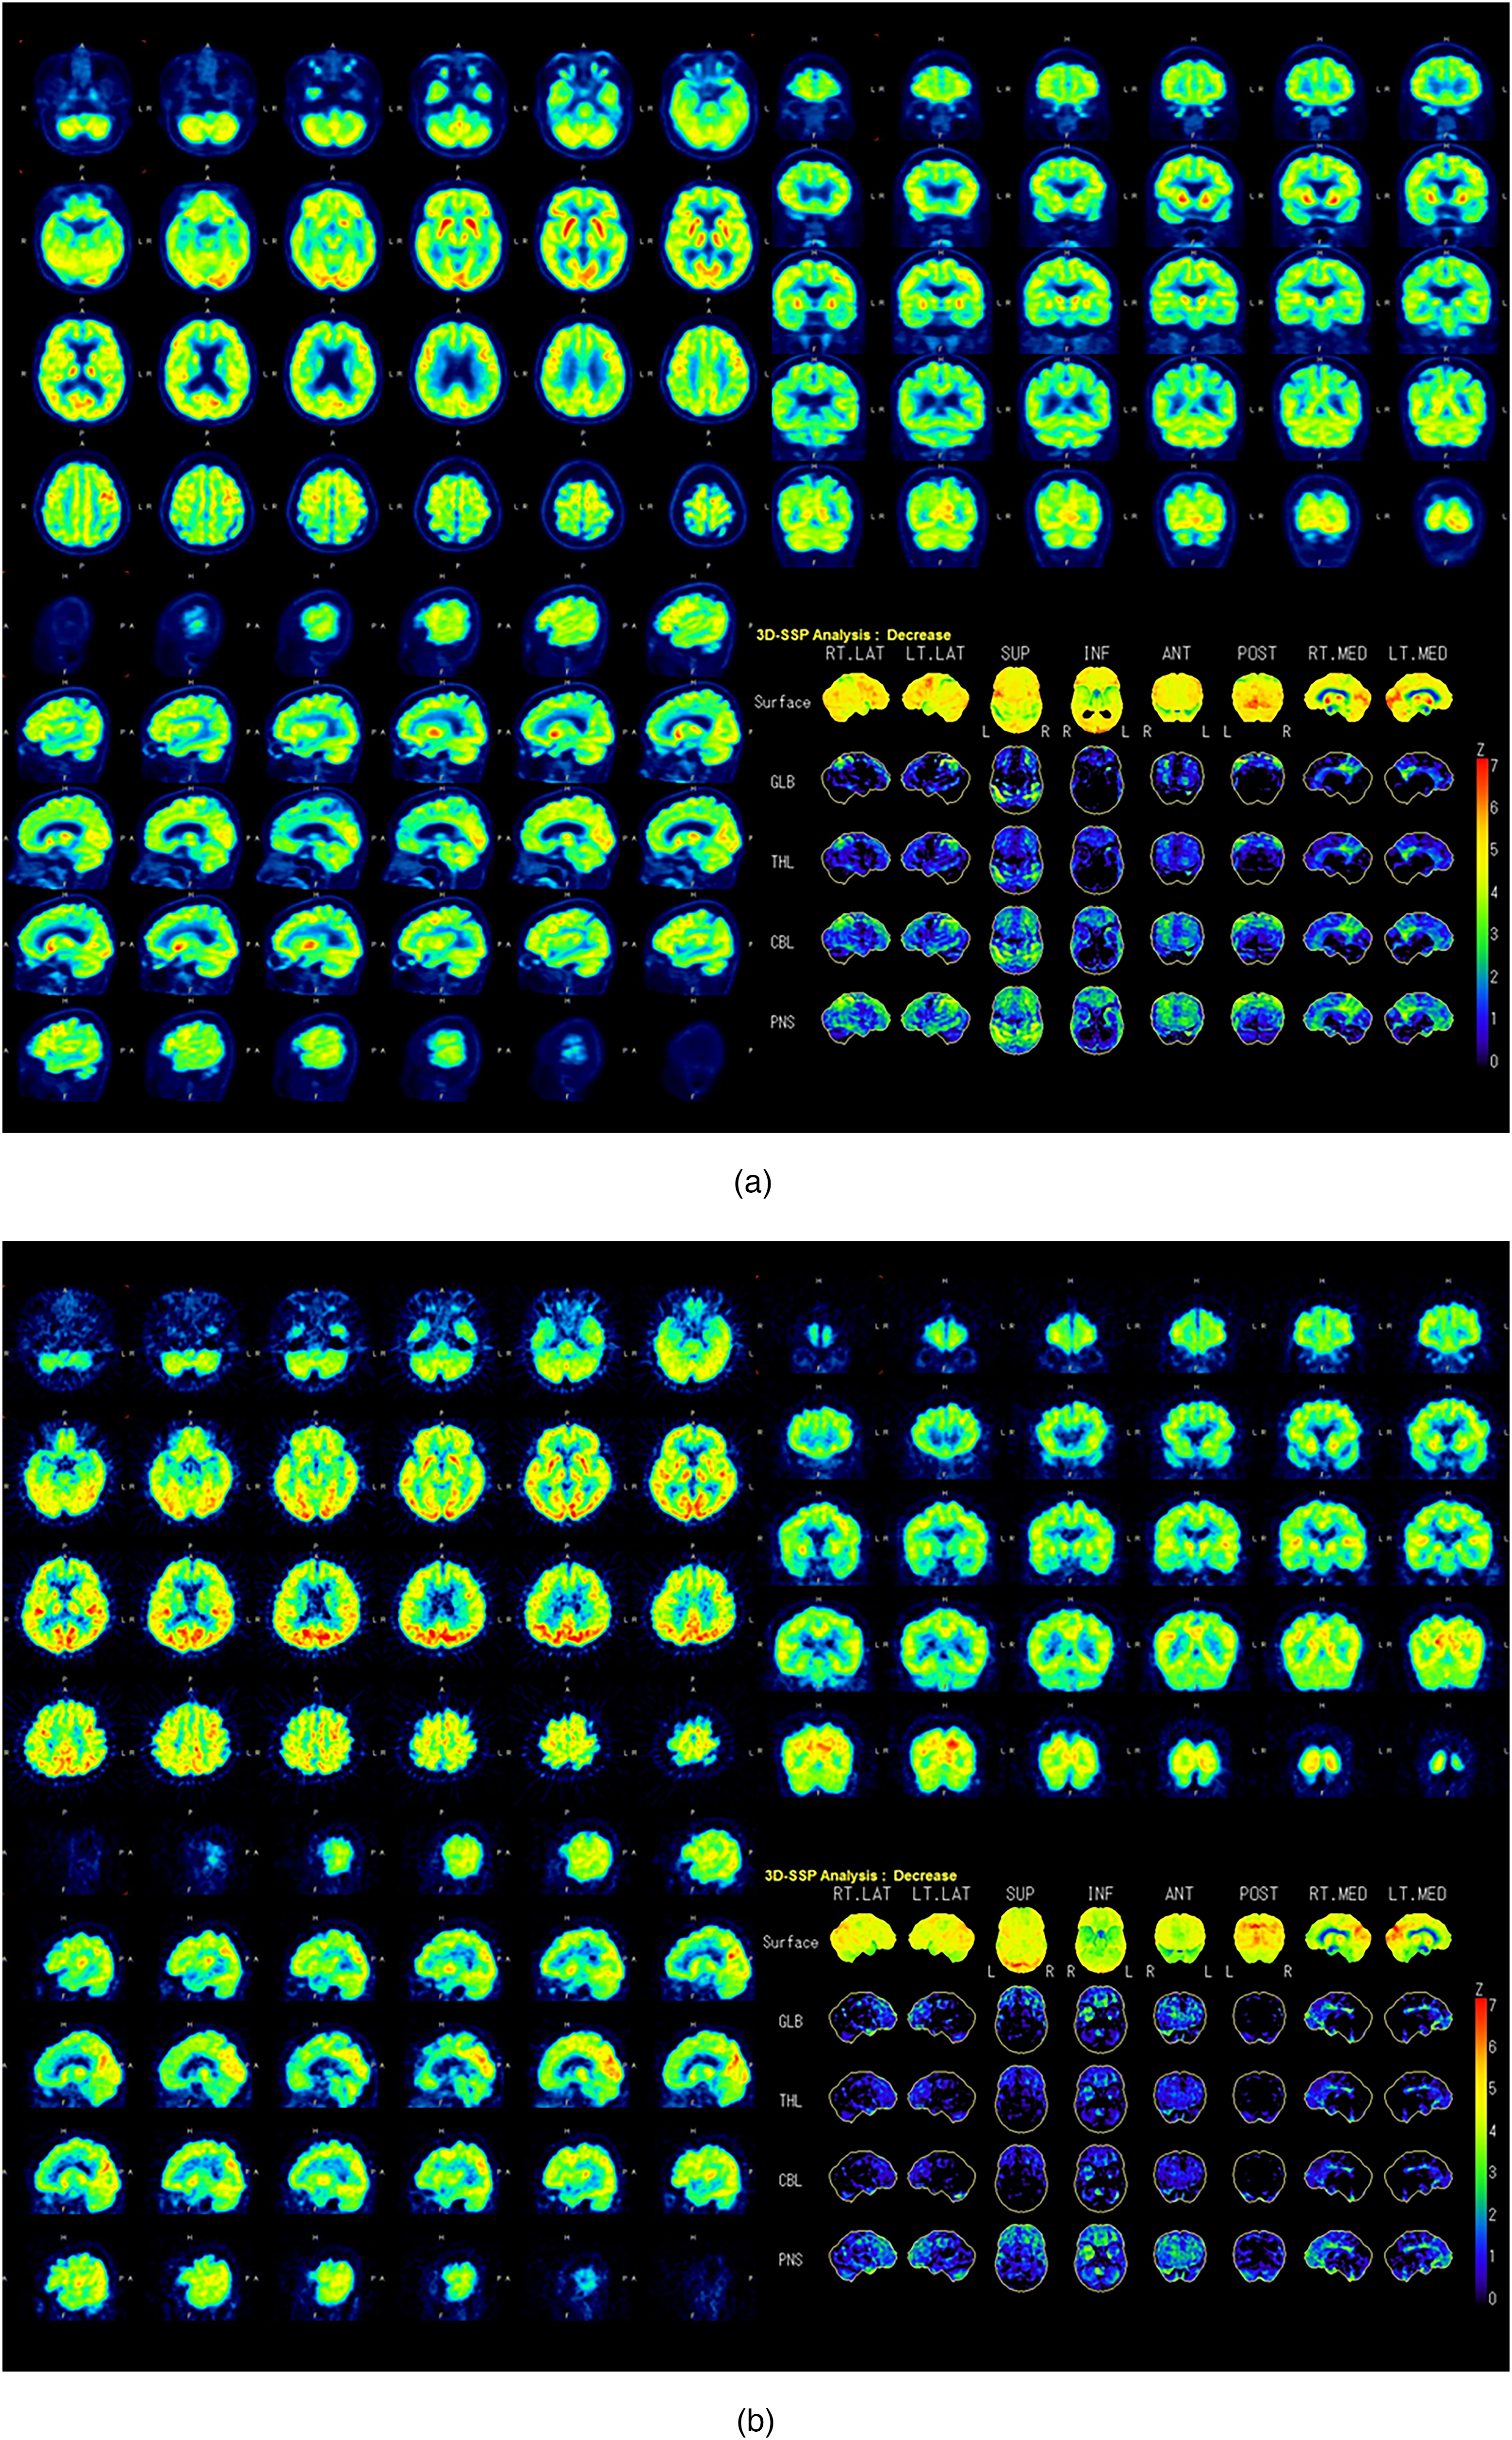
Examples of transaxial, sagittal, coronal, and 3D SSP images from a patient with Alzheimer's disease (A) and a patient with FTLD (B). These images were used to train the raters.
CSF examination
CSF was collected once within 4 weeks of case enrollment during fasting. Total tau, p-tau181 (ELISA assay by Innogenetics), and Aβ42 (ELISA assay by WAKO) were measured centrally at Hirosaki University. The reference values for positive and negative tau, p-tau181, and Aß42 in CSF were 297, 61, and 687 pg/mL, respectively, based on the reference values of the central cerebrospinal fluid assay laboratory.
ZSAM
We investigated the diagnostic performance of FDG-PET using ZSAM12,13 in addition to visual reading.
ZSAM is an ROI-based automated analysis method for FDG PET and includes the following procedures:
The FDG-PET images of normal individuals were analyzed using 3D-SSP to generate Z-score images. Summed positive Z-scores (Z-sum) were obtained from template ROIs (parietal lobe, posterior cingulate gyrus, precuneus, medial surface of the occipital lobe, and lateral surface of the occipital lobe), which are regions of characteristic glucose metabolism reduction in the Z-score images of AD and dementia with Lewy bodies; DLB. This is because each ROI includes negative and positive Z-scores, and reduced glucose metabolism appears as a positive Z-score. The Z-sum of some normal individuals was averaged for each ROI, and the normal threshold of the Z-sum with the mean value and standard deviation was calculated. The Z-sum of patients processed by the same procedure as #1 is compared with the normal threshold calculated above in #2. Glucose metabolism is considered to be reduced if the Z-sum of the patient exceeds the normal threshold.
In this study, when the Z value exceeded the threshold in any one of the four ROIs (bilateral parietal lobe, and bilateral posterior cingulate gyrus/precuneus), the patient was diagnosed with AD.
MRI
All participants were scanned using a 3T or 1.5T MRI system. A T1-weighted fast-field echo sequence was used. Supplemental Table 3 lists the MRI devices and imaging parameters. T1-weighted 3-dimensional sagittal sections of the brains were acquired and analyzed on a PC using a voxel-based specific regional analysis system for Alzheimer's disease (VSRAD® advance, Eisai Co., Ltd, Tokyo, Japan), which was developed based on the voxel-based morphometry method and is now freely available.14–18 First, the equalization of voxel sizes and linear and nonlinear transformations were performed. Next, images of the gray matter, white matter, and cerebrospinal fluid were separated, and the gray matter images were standardized and smoothed onto templates using the DARTEL software (Wellcome Department of Imaging Neuroscience, London, UK). Using the z-score method, a comparative statistical analysis of the voxels was performed using a healthy control database. The database for the healthy controls contained data from 40 men and 40 women, each aged 54–86 (mean 70.2 ± 7.3) years. In this study, the average positive z-score in the target volume of interest for the medial temporal structures, including the entorhinal cortex, head-to-tail of the hippocampus, and amygdala, was used for further analyses.
Statistical analysis
The sensitivities and accuracies of FDG-PET and p-tau181 in CSF were compared using a sign test. CSF biomarkers, MRIs, and neuropsychological tests were compared between the AD and FTLD groups. The mean value was used as the evaluation index for the items on the measurement scale, and a two-sample t-test was used to compare the groups. As a rule, the significance level of the test was 5% two-sided when using the normal, t, hypergeometric, and binomial distributions, and 5% one-sided when using the χ2 distribution and F distribution. In principle, the confidence coefficient for the estimation was two-sided at 95%.
Statistical analysis software, SPSS version 22 or higher and R version 3.4.4 or higher, were used for analysis.
Results
Patients and demographics
Subjects with AD or FTLD were recruited between April 2015 and December 2018 and followed up for 12 months at the memory clinics of 11 centers specializing in AD and other dementias across Japan (Supplemental Table 1).
Informed consent was obtained from 196 subjects, of whom 138 (AD group, 119; FTLD group, 19) were enrolled in the study, and 135 (AD group, 117; FTLD group, 18) underwent FDG-PET. A total of 118 participants completed the 12-month evaluation (AD group, 102; FTLD group, 16). Four participants were diagnosed with AD at baseline and with FTLD at the 12-month evaluation, and one participant was diagnosed with FTLD at baseline and with AD at the 12-month evaluation.
The full analysis set (FAS) for the efficacy analysis included 108 participants (AD group, 89; FTLD group, 19), excluding three participants who did not undergo FDG-PET, 17 participants who discontinued the study before the final clinical diagnosis, and 10 participants who were diagnosed with neither AD nor FTLD at the final clinical diagnosis from the 138 participants enrolled in the study (Figure 2). The demographic and neuropsychological data at baseline are presented in Table 1.
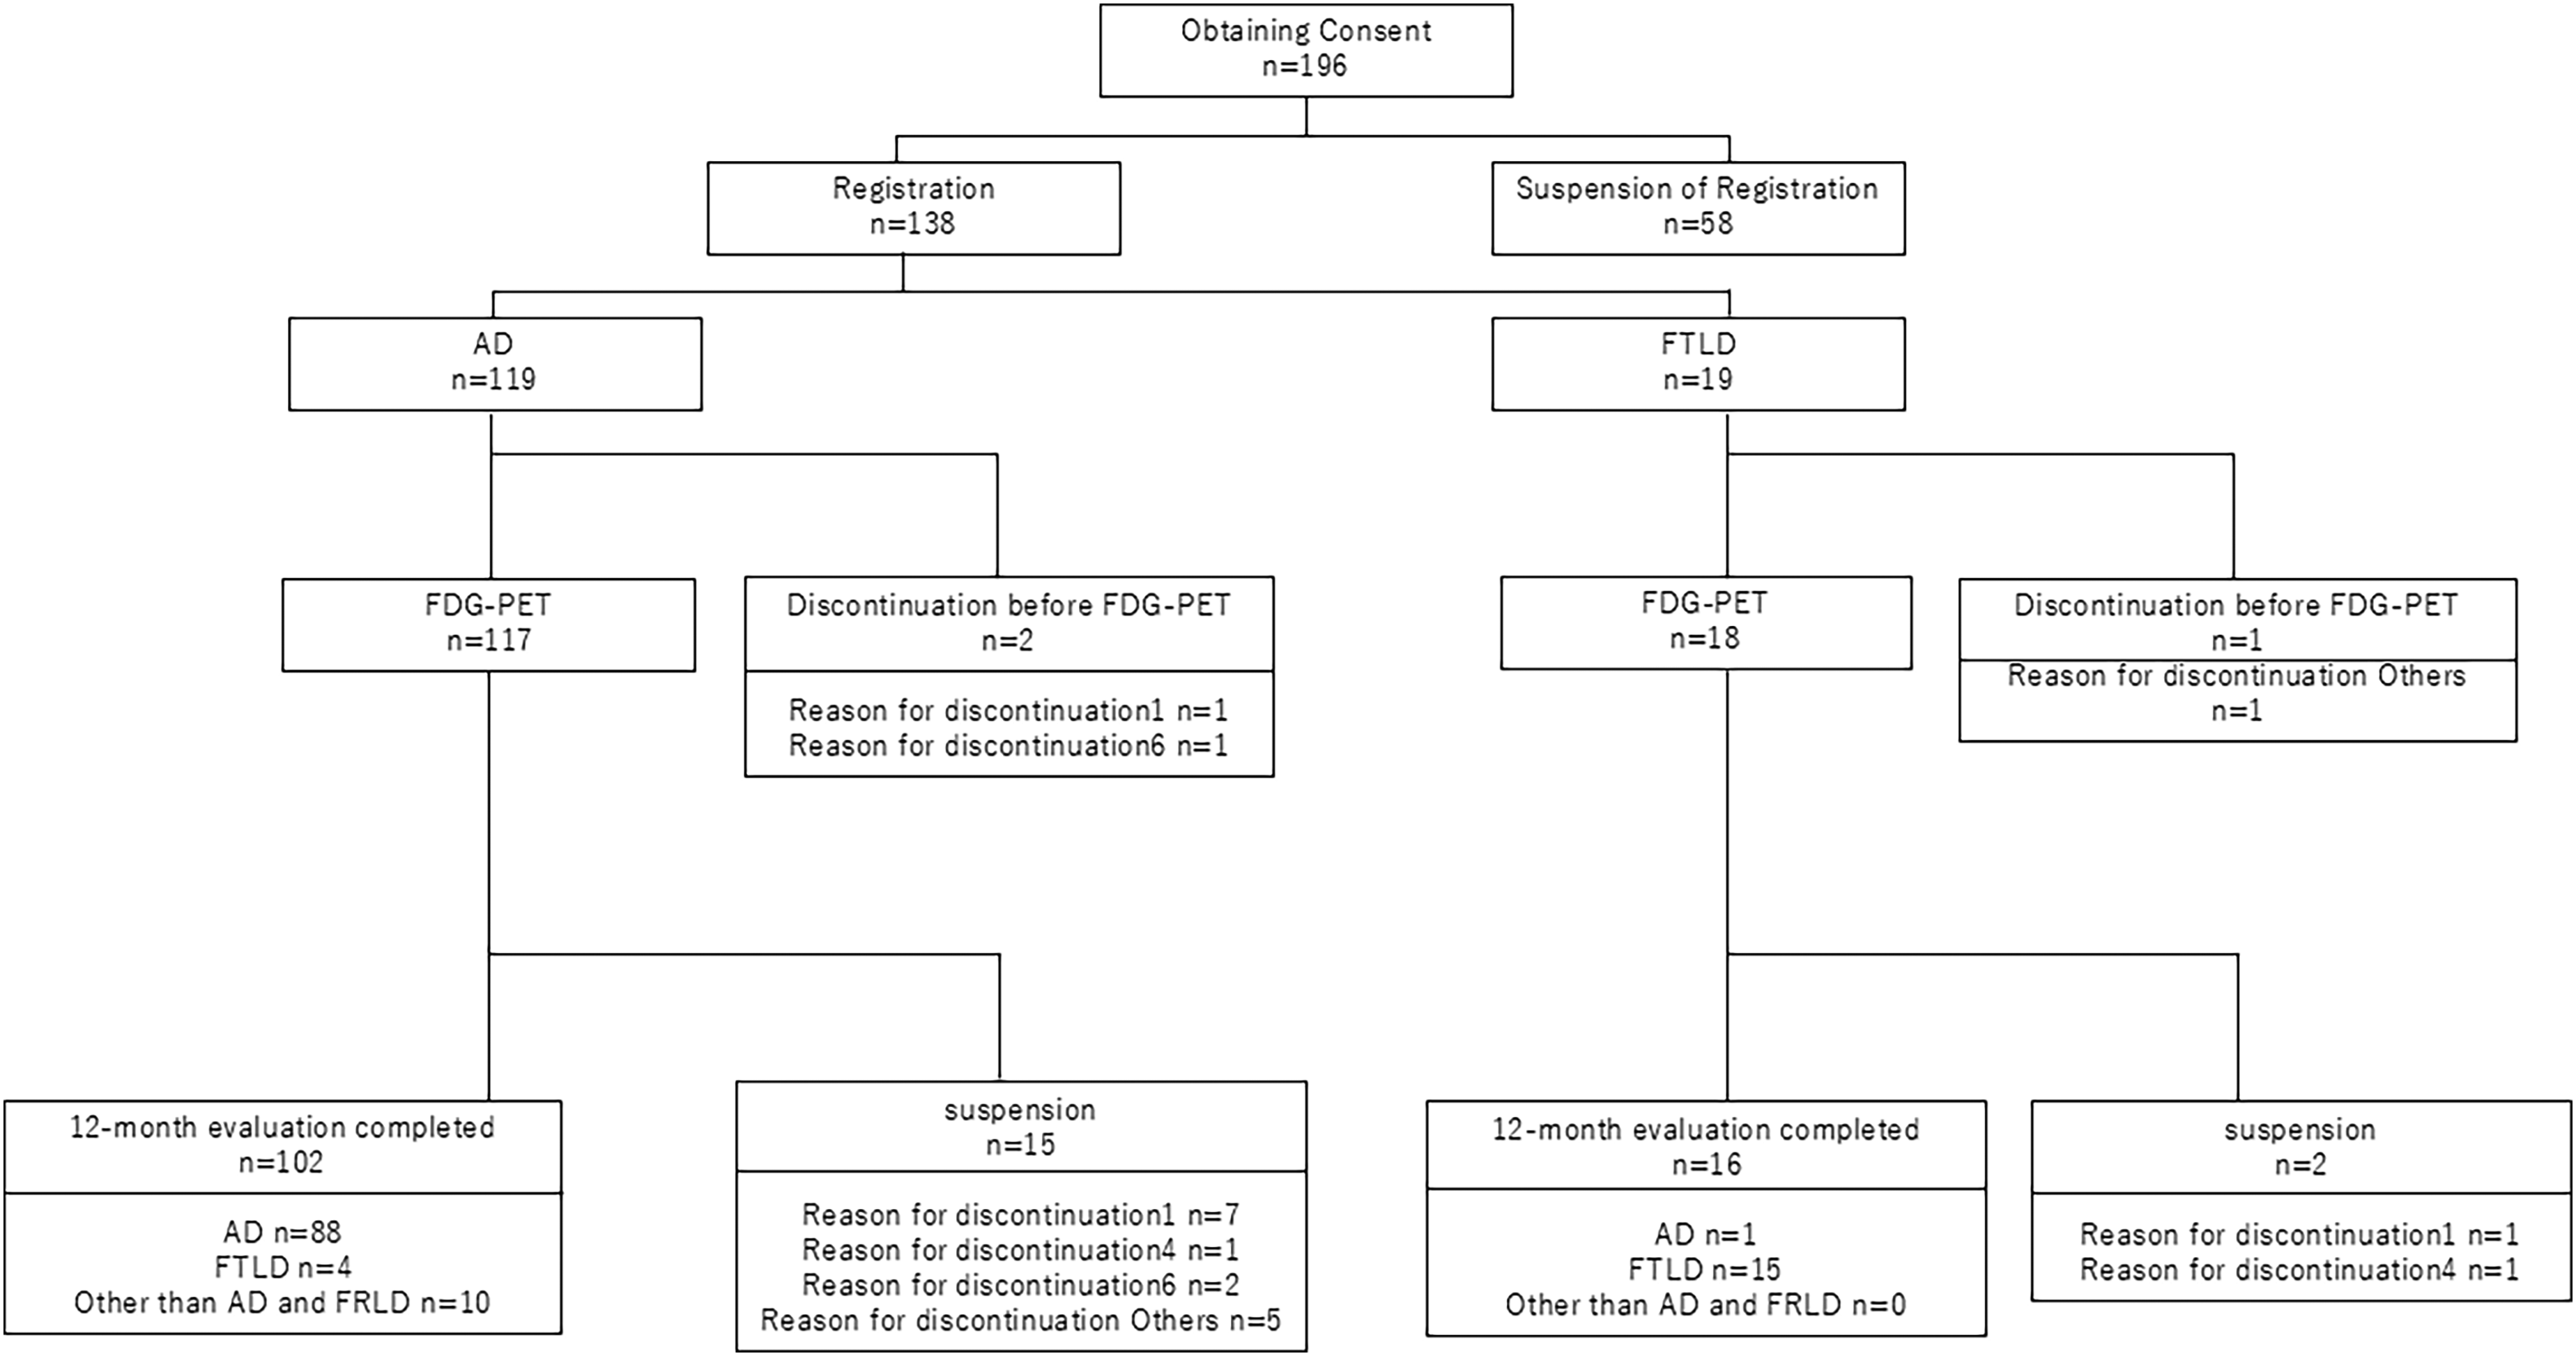
Schematic summary of clinical outcomes in all cases. Originally, 138 patients with AD or FTLD were included. The full analysis set (FAS) for the efficacy analysis included 108 patients (AD group, 89; FTLD group, 19).
Demographic and neuropsychological data at baseline.
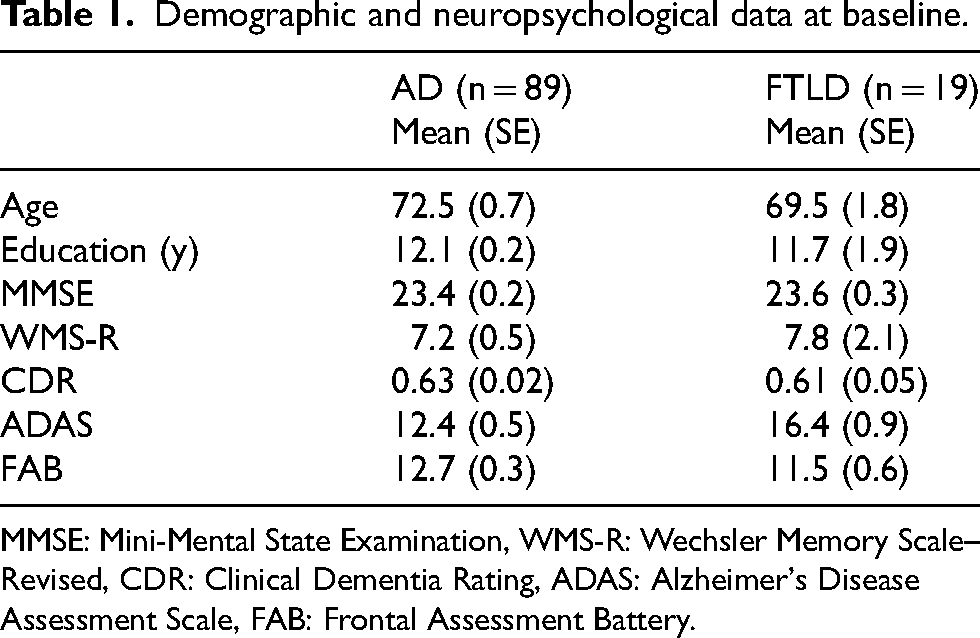
MMSE: Mini-Mental State Examination, WMS-R: Wechsler Memory Scale–Revised, CDR: Clinical Dementia Rating, ADAS: Alzheimer's Disease Assessment Scale, FAB: Frontal Assessment Battery.
The ADAS total score exhibited significant differences between the AD and FTLD groups. The mean ± SE of the ADAS total score was 12.4 ± 0.5 in the AD group and 16.4 ± 0.9 in the FTLD group, with a mean difference (95% CI) of −4.0 (−6.5 to −1.5).
The difference in sensitivity and accuracy between FDG-PET and p-tau181
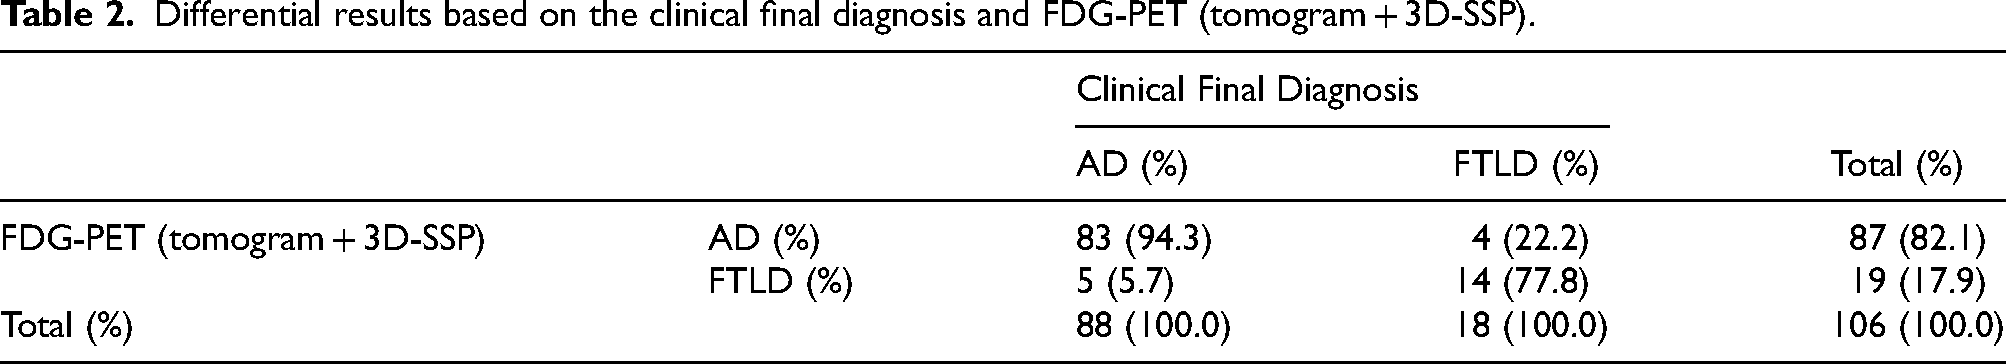
The cross-tabulations of the results of differentiation based on the final clinical diagnosis and FDG-PET (tomogram + 3D-SSP) versus p-tau181 are shown in Tables 2 and 3. The sensitivity (95% CI), specificity, and accuracy of FDG-PET (tomogram + 3D-SSP) were 94% (87%–98%), 78% (52%–94%), and 92% (84%–96%), respectively. Those of p-tau181 were 62% (51%–72%), 79% (54%–94%), and 65% (55%–74%), respectively.
Differential results based on the clinical final diagnosis and FDG-PET (tomogram + 3D-SSP).
Differential results based on the clinical final diagnosis and p-tau 181 in CSF.
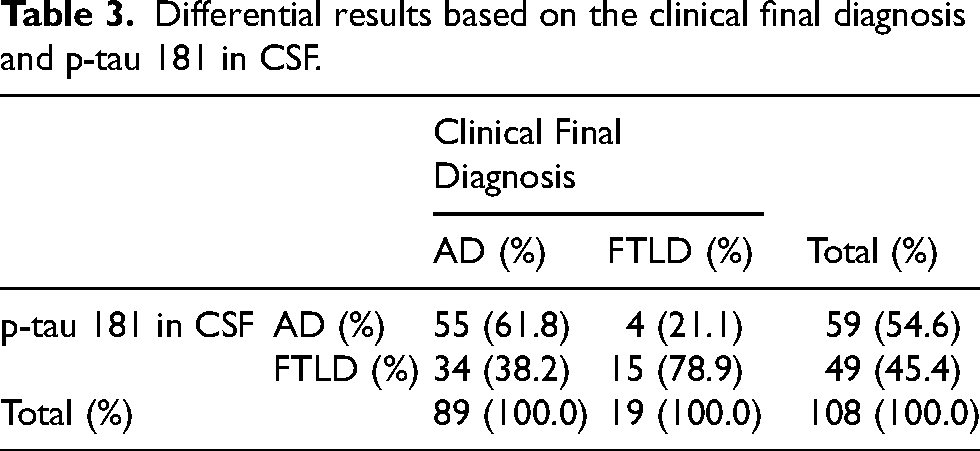
Both the sensitivity and accuracy of FDG-PET (tomogram + 3D-SSP) were significantly higher (p < 0.05) than those of p-tau181.
Diagnostic performance of FDG-PET based on clinical diagnosis reflecting CSF Aβ42
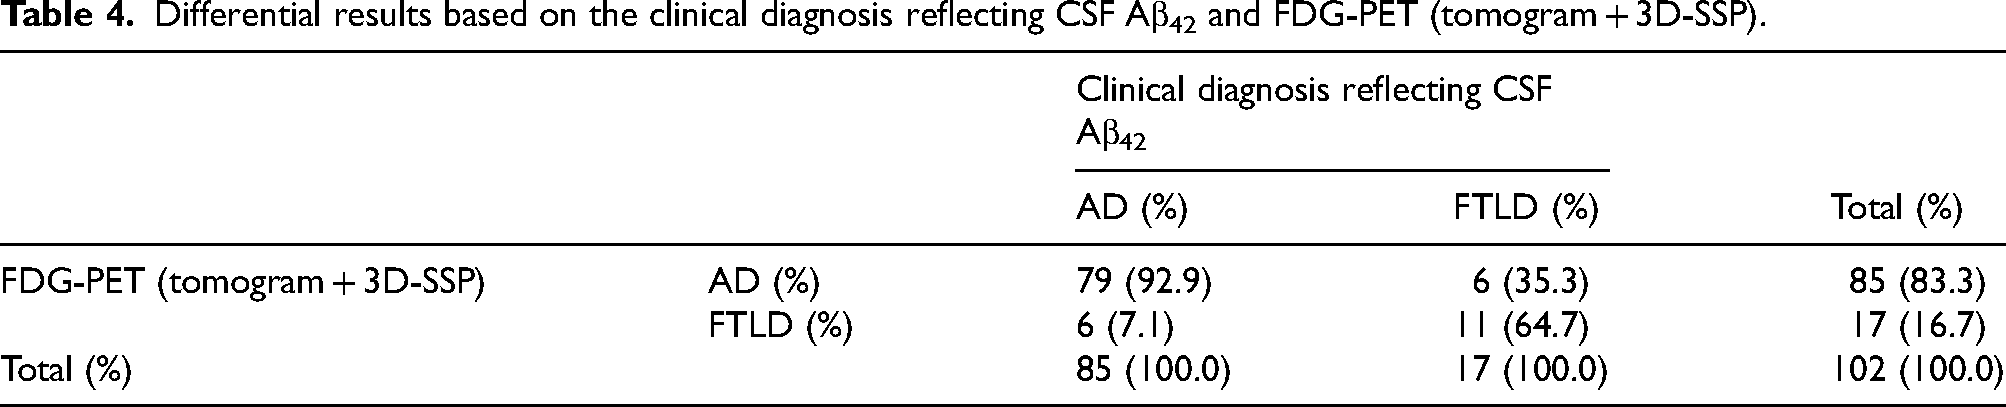
To examine the diagnostic performance of FDG-PET based on clinical diagnosis reflecting CSF Aβ42, we excluded cases that did not have decreased CSF Aβ42 in the AD group at the time of enrollment but did not exclude cases that had decreased CSF Aβ42 in the FTLD group, considering the possibility of mixed pathology.
The cross-tabulation of differential results based on clinical diagnosis reflecting CSF Aβ42 and FDG-PET (tomogram + 3D-SSP) is shown in Table 4. The sensitivity (95% CI), specificity, and accuracy of FDG-PET (tomogram + 3D-SSP) were 93% (85%–97%), 65% (38%–86%), and 88% (80%–94%), respectively.
Differential results based on the clinical diagnosis reflecting CSF Aβ42 and FDG-PET (tomogram + 3D-SSP).
ZSAM
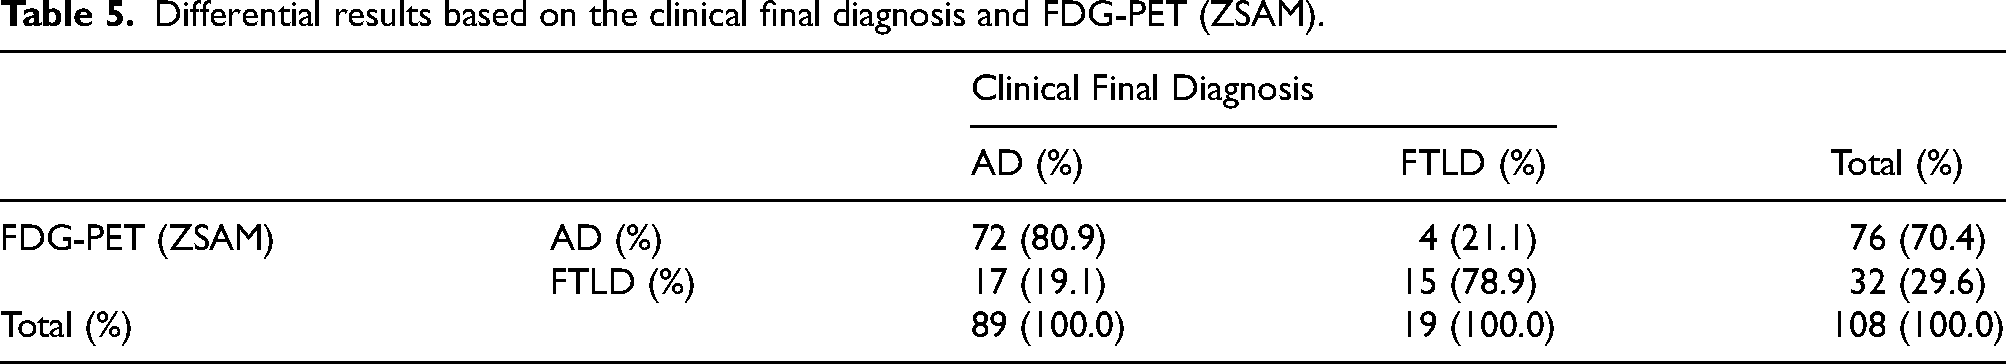
The cross-tabulation of the results of differentiation based on the final clinical diagnosis and FDG-PET (ZSAM) is shown in Table 5. The sensitivity (95% CI), specificity, and accuracy of ZSAM based on the final clinical diagnosis were 81% (71%–88%), 79% (54%–94%), and 81% (72%–88%), respectively.
Differential results based on the clinical final diagnosis and FDG-PET (ZSAM).
Group comparisons of CSF biomarkers and MRI
CSF biomarkers
The mean ± SE of tau was 581 ± 35 pg/mL in the AD group and 385 ± 49 pg/mL in the FTLD group, with a mean difference (95% CI) of 196 (74–318) pg/mL. The mean ± SE of p-tau181 was 74 ± 3 pg/mL in the AD group and 52 ± 5 pg/mL in the FTLD group, with a mean difference (95% CI) of 22 (9–36) pg/mL. However, the mean ± SE of Aβ42 was higher in the FTLD group than in the AD group (570 ± 30 pg/mL for AD and 812 ± 31 pg/mL for FTLD), with a mean difference (95% CI) of −241 (−444 to −38) pg/mL. The difference in the means between the AD and FTLD groups was significant in all cases (Table 6).
Mean CSF biomarker values and differences by disease.
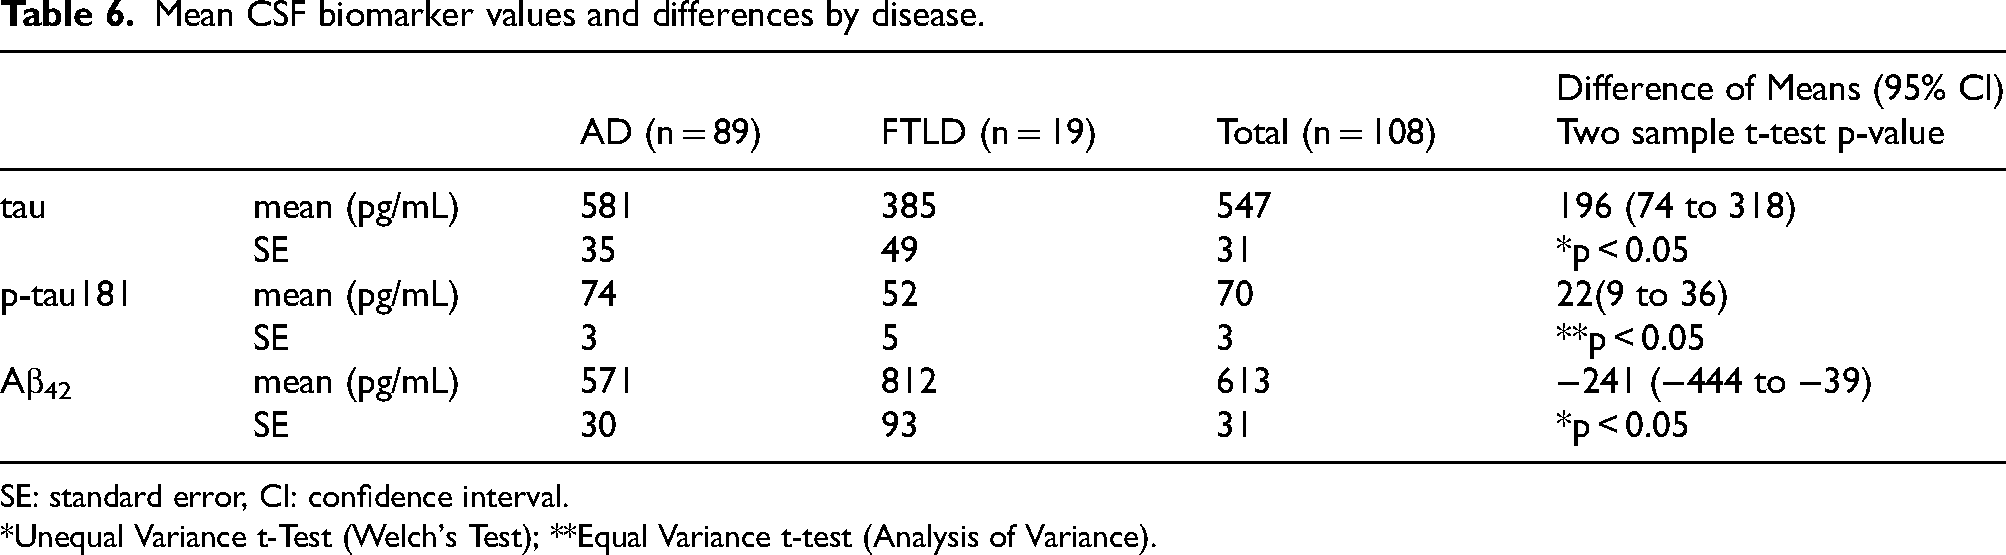
SE: standard error, CI: confidence interval.
*Unequal Variance t-Test (Welch's Test); **Equal Variance t-test (Analysis of Variance).
MRI
The mean Z-score was calculated for each final clinical diagnosis of AD and FTLD. The mean ± SE of the Z-score at baseline was 2.02 ± 0.12 for the AD group and 2.57 ± 0.36 for the FTLD group, with a mean difference (95% CI) of −0.55 (−1.32 to 0.23), which was not significant. However, the mean ± SE of the z-score at re-evaluation after 1 year of inclusion was 2.21 ± 0.13 for the AD group and 2.88 ± 0.37 for the FTLD group, with a mean difference (95% CI) of −0.67 (−1.29 to −0.04), which was significant.
Safety assessment
Nineteen (22 cases) of the 135 patients who underwent FDG-PET developed adverse events; however, there was no causal relationship to the FDG-PET study, except for one case of unknown significance.
When adverse events were analyzed in 108 subjects (89 in the AD group and 19 in the FTLD group) who were diagnosed with either AD or FTLD as the final clinical diagnosis after 12 months of enrollment, 11 (12.4%) in the AD group and 5 (26.3%) in the FTLD group developed adverse events, and the incidence of adverse events was not significantly different.
Serious adverse events occurred in two patients (2 cases, 18.2%) in the AD group, but both were due to CSF collection and were not causally related to the FDG-PET study.
Discussion
Clinical diagnosis
At the time of planning this study, the NINCDS-ADRDA diagnostic criteria 8 in use since 1984 were still widely used in clinical practice in Japan, so they were adopted as the inclusion criteria for AD. However, all patients meeting the criteria for probable AD in the 1984 NINCDS-ADRDA diagnostic criteria would also meet the current criteria for probable AD dementia in the revised version. 2
Progressive cognitive impairment is a clinical diagnostic criterion of AD.2,8 At the time of enrollment in this study, the only way to estimate the progression of cognitive dysfunction was through interviews and other means, and objective information may be lacking. Therefore, it is necessary to reliably capture the progression of cognitive impairment through follow-up observations to make a more accurate diagnosis. Observation for at least 6 months is considered necessary to confirm the progression of cognitive impairment through follow-up, and the Japan Neurological Society's “Treatment Guideline for Dementia 2010” 19 states that it is necessary to confirm the slow progression of symptoms for at least 12 months to improve diagnostic sensitivity. Therefore, 12 months was set as the follow-up period in this study.
Setting of the control diagnosis
In this study, p-tau181 in CSF was selected as the control for FDG-PET. Tau is a microtubule-binding protein consisting of 352–441 amino acids with a molecular weight of 45–50 kDa that stabilizes microtubules and transports intracellular substances within nerve cells. The main component of the neurofibrillary tangles observed in patients with AD is the paired helical filament, in which excess phosphorylated tau protein (p-tau) aggregates and serves as the major component. Normally, p-tau is barely detectable in CSF. However, in AD, p-tau is released into the CSF due to neuronal destruction, resulting in high p-tau levels. Therefore, p-tau in CSF is covered by public insurance for the diagnosis of dementia in Japan. Several reports have been published regarding the diagnostic performance of p-tau. A study on p-tau181, which is phosphorylated at the 181st threonine, showed a sensitivity of 68%, a specificity of 73%, and an accuracy of 70% in 56 pathologically confirmed AD cases and 52 healthy elderly participants. 11 As p-tau181 is rarely elevated in FTLD, as in healthy subjects, 20 it is presumed that the differential results between AD and FTLD are equivalent to the above results. Based on the above, p-tau181 in CSF was used as a diagnostic control for FDG-PET.
Patient background
The FAS, efficacy analysis population, and safety analysis population were matched, with 19 patients in the FTLD group and 89 patients in the AD group, for a total of 108 patients in both groups. Although this number is lower than the number of patients included in the analysis set at the time of study design, the power of the study was satisfactory at the set value (80%), and the study is considered to have adequate power.
The differences in patient backgrounds between the FTLD and AD groups were within the statistical margin of error except for the ADAS total score. The mean difference in the ADAS total score between the two groups was 4.0. Because this mean difference was due to differences in the pathophysiology of FTLD and AD, this result did not affect the utility assessment of FDG PET.
Efficacy endpoints
The sensitivity, specificity, and accuracy of FDG-PET (tomogram + 3D-SSP) were 94%, 78%, and 92%, respectively. In contrast, p-tau181 showed a sensitivity, specificity, and accuracy of 62%, 79%, and 65%, respectively. The current results are consistent with previous reports.9,21–27
The primary endpoint of sensitivity was 32% higher for FDG-PET than p-tau181 (tomogram + 3D-SSP), and the secondary endpoint of accuracy was 27% higher for FDG-PET (tomogram + 3D-SSP). At the time of the study design, we assumed a 15% difference in sensitivity and a 12% difference in accuracy, and that any difference greater than this would indicate that the FDG-PET was useful. Therefore, based on the above results, we consider that the diagnostic ability of FDG-PET is higher than that of p-tau181 and that it is clinically useful.
When the clinical diagnosis reflecting CSF Aβ42 was used as the reference diagnosis, the sensitivity, specificity, and accuracy of FDG-PET (tomogram + 3D-SSP) were 93%, 65%, and 88%, respectively, not much different from those when the final clinical diagnosis was used as the reference diagnosis. These results validate the use of the final clinical diagnosis as the reference diagnosis in this study.
In the secondary endpoint, the diagnostic performance of FDG-PET was evaluated using a region-of-interest (ROI)-based automated diagnostic program (ZSAM), in addition to the visual reading of FDG-PET (tomogram + 3D-SSP). The sensitivity, specificity, and accuracy of ZSAM were 81%, 79%, and 81%, respectively, based on the final clinical diagnosis, indicating a good balance between sensitivity and specificity. The significance of obtaining supplementary diagnostic information using ZSAM, in addition to visual reading, for the differential diagnosis of FTLD and AD should continue to be examined.
The mean values of tau, p-tau181, and Aβ42 were different between the AD and FTLD groups. This is a natural finding, as these items are CSF biomarkers for the diagnosis of Alzheimer's disease.
Safety assessment
Adverse events occurred in 5 (26.3%) patients in the FTLD group and 11 (12.4%) patients in the AD group, for a total of 16 (14.8%) patients in both groups. However, none of these adverse events was causally related to the FDG-PET scan, and the safety of the FDG-PET scan was not considered a problem.
Limitations
This study had several limitations. One limitation was the lack of pathological support for the diagnosis of each case. Autopsy data were difficult to obtain because of the relatively early stage of AD and FTLD in the enrolled participants. Amyloid PET was considered but could not be included in the study protocol for advanced medical care because of the limited number of facilities that had access to amyloid PET at the time the study was initiated and because amyloid PET was not covered by public insurance in Japan. CSF Aβ42 was also not covered by public insurance, so it was used only as reference data. Therefore, additional studies incorporating amyloid PET are warranted.
The interpretation of the images was simple by analyzing whether the decrease in FDG uptake was predominantly anterior or posterior. It could ignore the atypical variants of AD, especially the frontal variant, in which the decrease in metabolism can occur in different brain regions. The next step will be the incorporation of advanced image analysis methods, including the use of artificial intelligence, for the interpretation of FDG PET images.
Conclusions
This study showed that the diagnostic performance of FDG-PET in the differential diagnosis of AD and FTLD (sensitivity and accuracy) was higher than that of p-tau181 in CSF, and there were no safety concerns with FDG-PET. The introduction of FDG-PET as an adjunctive diagnostic tool for the differential diagnosis, especially for the differential diagnosis between AD and FTLD, is considered clinically useful for the management of dementia.
Supplemental Material
sj-xlsx-1-alz-10.1177_13872877251338691 - Supplemental material for 18F-FDG PET for the differential diagnosis of Alzheimer's disease and frontotemporal lobar degeneration: A multicenter prospective study in Japan
Supplemental material, sj-xlsx-1-alz-10.1177_13872877251338691 for 18F-FDG PET for the differential diagnosis of Alzheimer's disease and frontotemporal lobar degeneration: A multicenter prospective study in Japan by Kengo Ito, Yukihiko Washimi, Takashi Kato, Keisuke Suzuki, Yasuomi Ouchi, Chigusa Watanabe, Yoshihide Sunada, Yumiko Kutoku, Kazunari Ishii, Kenji Ishii, Michio Kitayama, Etsuro Matsubara, Noriyuki Kimura, Harumasa Takano, Hiroaki Adachi, Kazuhiro Hara, Takeshi Kawarabayashi, Mikio Shoji, Norio Sugimoto and SDAF-PET Study Group in Journal of Alzheimer's Disease
Supplemental Material
sj-xlsx-2-alz-10.1177_13872877251338691 - Supplemental material for 18F-FDG PET for the differential diagnosis of Alzheimer's disease and frontotemporal lobar degeneration: A multicenter prospective study in Japan
Supplemental material, sj-xlsx-2-alz-10.1177_13872877251338691 for 18F-FDG PET for the differential diagnosis of Alzheimer's disease and frontotemporal lobar degeneration: A multicenter prospective study in Japan by Kengo Ito, Yukihiko Washimi, Takashi Kato, Keisuke Suzuki, Yasuomi Ouchi, Chigusa Watanabe, Yoshihide Sunada, Yumiko Kutoku, Kazunari Ishii, Kenji Ishii, Michio Kitayama, Etsuro Matsubara, Noriyuki Kimura, Harumasa Takano, Hiroaki Adachi, Kazuhiro Hara, Takeshi Kawarabayashi, Mikio Shoji, Norio Sugimoto and SDAF-PET Study Group in Journal of Alzheimer's Disease
Supplemental Material
sj-xlsx-3-alz-10.1177_13872877251338691 - Supplemental material for 18F-FDG PET for the differential diagnosis of Alzheimer's disease and frontotemporal lobar degeneration: A multicenter prospective study in Japan
Supplemental material, sj-xlsx-3-alz-10.1177_13872877251338691 for 18F-FDG PET for the differential diagnosis of Alzheimer's disease and frontotemporal lobar degeneration: A multicenter prospective study in Japan by Kengo Ito, Yukihiko Washimi, Takashi Kato, Keisuke Suzuki, Yasuomi Ouchi, Chigusa Watanabe, Yoshihide Sunada, Yumiko Kutoku, Kazunari Ishii, Kenji Ishii, Michio Kitayama, Etsuro Matsubara, Noriyuki Kimura, Harumasa Takano, Hiroaki Adachi, Kazuhiro Hara, Takeshi Kawarabayashi, Mikio Shoji, Norio Sugimoto and SDAF-PET Study Group in Journal of Alzheimer's Disease
Footnotes
Acknowledgments
The authors thank the participants of SDAF-PET and their partners for their contributions to this study. We thank Ms. Mayumi Meda, Ms. Maiko Asa, and Ms. Kaori Iwata for technical assistance. We thank those who contributed to the subjects’ care and performed the PET, MRI, CSF examinations, and clinical evaluations. We thank Editage (![]() ) for English language editing.
) for English language editing.
Ethical considerations
This study was first reviewed and approved by the Institutional Review Board of the National Center for Geriatrics and Gerontology and registered with UMIN (UMIN 000016427) on February 3, 2015. Subsequently, with the enactment of the Clinical Research Act in Japan, it was again reviewed and approved by the Nagoya University Clinical Research Review Board and registered with JRCT (jRCTs041180098) on March 14, 2019.
Consent to participate
Written informed consent was obtained from all individual participants included in the study.
Consent for publication
Not applicable.
Author contributions
Kengo Ito: Conceptualization, Funding acquisition, Investigation, Project administration, Writing – original draft. Yukihiko Washimi: Conceptualization, Investigation, Project administration, Writing – review & editing. Takashi Kato: Formal analysis, Investigation, Writing – review & editing. Keisuke Suzuki: Data curation, Formal analysis, Investigation, Project administration, Writing – review & editing. Yasuomi Ouchi: Investigation, Writing – review & editing. Chigusa Watanabe: Investigation, Writing – review & editing. Yoshihide Sunada: Investigation, Writing – review & editing. Yumiko Kutoku: Investigation, Writing – review & editing. Kazunari Ishii: Investigation, Writing – review & editing. Kenji Ishii: Investigation, Writing – review & editing. Michio Kitayama: Investigation, Writing – review & editing. Etsuro Matsubara: Investigation, Writing – review & editing. Noriyuki Kimura: Investigation, Writing – review & editing. Harumasa Takano: Investigation, Writing – review & editing. Hiroaki Adachi: Investigation, Writing – review & editing. Kazuhiro Hara: Investigation, Writing – review & editing. Takeshi Kawarabayashi: Formal analysis, Investigation, Writing – review & editing. Mikio Shoji: Formal analysis, Investigation, Writing – review & editing. Norio Sugimoto: Formal analysis, Writing – review & editing.
Funding
The authors disclosed receipt of the following financial support for the research, authorship, and/or publication of this article: This work was supported by the Research Funding for Longevity Sciences from the National Center for Geriatrics and Gerontology, Japan (26-3, 29-43) and by Nihon Medi-Physics Co., Ltd The funding sources had no role in the study design, data collection, analyses, or interpretation.
Declaration of conflicting interests
The authors declared the following potential conflicts of interest with respect to the research, authorship, and/or publication of this article: KI has received consultancy/speaker fees from Nihon Medi-physics, Shimadzu, Eisai, and Eli Lilly and Company. TK has received speaker fees from Nihon Medi-physics, PDR Pharma, and Eisai. KaIs has received consultancy/speaker fees from Nihon Medi-Physics, and Eisai, and research grant from Shimadzu. KeIs has received consultancy/speaker fees from Nihon Medi-physics, PDR Pharma, Eisai, and Eli Lilly and Company. NK has received consultancy/speaker fees from Takeda Pharmaceuticals, Daiichi Sankyo, Eisai, Sumitomo Pharma, PDR Pharma, and Otsuka Pharmaceutical, and Eli Lilly and Company.
Data availability statement
The data that support the findings of this study are available from the corresponding author upon reasonable request.
Supplemental material
Supplemental material for this article is available online.
References
Supplementary Material
Please find the following supplemental material available below.
For Open Access articles published under a Creative Commons License, all supplemental material carries the same license as the article it is associated with.
For non-Open Access articles published, all supplemental material carries a non-exclusive license, and permission requests for re-use of supplemental material or any part of supplemental material shall be sent directly to the copyright owner as specified in the copyright notice associated with the article.