
Abstract
Background
Depressive comorbidity in neurodegeneration has been shown to predict conversion from mild cognitive impairment (MCI) to Alzheimer's disease (AD). However, its pathophysiology is not completely understood.
Objective
Here, we characterize aberrant functional resting state networks (RSNs) characterizing depressive comorbidity in both AD and MCI.
Methods
We conducted a systematic literature review on Scopus, PubMed, and Web of Science to extract experiments that compared resting state scans of depressed and non-depressed MCI or AD patients. We employed Activation Likelihood Estimation (ALE) meta-analysis on eligible studies resulting from the search, to describe regions of significant co-activation across studies.
Results
The systematic search resulted in 17 experiments, with 303 participants in total. The ALE yielded 10 clusters of significant co-activation distributed in the five major RSNs and across cortico-basal ganglia-thalamic circuits.
Conclusions
Depressive comorbidity in neurodegeneration presents signature aberrant resting-state fluctuations. Understanding these within- and between-network alterations may be useful for future diagnostic and therapeutic applications.
Keywords
Introduction
The World Health Organization estimates that 55 million people around the world suffer from dementia. There are 10 million new cases yearly, meaning one new case every three seconds. Alzheimer's disease (AD) is the most common form, impacting 60–70% of cases,1,2 with approximately one in three individuals above 85 years expected to develop this form of dementia in the near future. 3 According to demographic projections, a significant rise is expected, with the number of cases projected to triple by 2050, reaching 131.5 million. 1
On the other hand, data regarding depression is also disheartening: currently, approximately 280 million people worldwide suffer from depression, projecting it to become the most globally widespread illness by 2030. 2
Depression and cognitive impairment are prevalent among the elderly and often coexist. 4 The exact relationship between the two, particularly in terms of cognitive decline, remains unclear. Despite widespread speculation about late-life depression being a potential risk factor for dementia, the connection has not been definitively established. 5
Both conditions have significant economic implications. Global costs related to these conditions are estimated to become unsustainable.1,2
To understand the link between dementia and depression, we need to examine the risk factors and underlying mechanisms that contribute to these conditions. This will help us identify points where they overlap and find ways to address them effectively.
Comorbidity between Alzheimer's disease and depression
The relationship between late-life depression (LLD) and neurodegenerative diseases is a highly compelling subject in neuroscience research and has been widely documented. In the population affected by AD, the rate of depression can reach 90%. 6 This occurrence seems to be quite common in patients with mild cognitive impairment (MCI) as well, although to a lesser extent, with the incidence rate reaching as high as 40%.7–9 Although the statistical consistency of MCI evolving into AD is not always upheld, the neuropathological, neurobiological, and neuropsychological similarities between the two diseases cannot be underestimated.10,11 Indeed, evidence suggests that MCI patients combined with depression symptoms progress more rapidly from MCI to AD along the neurodegenerative spectrum, with a reported prevalence of 32%.7,12 These findings suggest several possible hypotheses regarding the connection between depression and neurodegenerative diseases. One hypothesis is that depression may predispose individuals to the development of neurodegenerative diseases. Another possibility is that depression could be an early symptom or even a result of these diseases. Alternatively, the observed relationship might be spurious, stemming from shared underlying variables.
Mistaking the signs and symptoms of a neurodegenerative disorder for those of depression could lead to underestimating a disease that, if treated promptly, may at least slow down the neurodegenerative process. This could ultimately lead to a poorer prognosis and a decline in health and quality of life. 6
Functional networks involved in depression and AD/MCI
A large body of literature in neuroimaging research has attempted to unveil the functional signatures related to both mood and neurodegenerative disorders. Specifically, changes in connectivity have been observed in both AD and MCI 13 among several functional networks.14,15
The default mode network (DMN) is so called because it is active at rest, when one is not engaged in cognitively demanding tasks or activities that require external attention. It is no coincidence that this network is also known as a “task-negative network” as it is promptly deactivated at the precise moment in which one reacts to stimuli. It is primarily implicated in various self-referential aspects, including mind wandering, autobiographical processing, prospective memory, and the construction of a coherent self-representation.3,16–20
This network has sparked considerable interest in depression research, with numerous pieces of evidence indicating its involvement in depressive disorders, especially in LLD.21–24 Studies on patients with LLD have detected hyperactivation and hyperconnectivity of the DMN, along with structural impairments in some regions of the network.3,22,24–27 Specifically, it has been observed that the DMN remains active during cognitive activities that normally require its deactivation,28,29 suggesting an insufficiency of DMN components to quiet self-referential thoughts and negative emotions, characteristic of depression. 30
Furthermore, a dissociation between anterior and posterior regions of the DMN has been observed in individuals with LLD, restored after antidepressant treatment, highlighting the involvement of this network in altered thinking patterns in depression. 3
Other studies have found a strong correlation between DMN activity and rumination processes in depressive disorders.31,32 In particular, the dissociation between anterior and posterior DMN suggests a differential involvement in self-referred, present- and future-oriented thoughts, respectively. 33 These pieces of evidence support the hypothesis of a robust involvement of the DMN in thinking patterns typically altered in depressed individuals.
Moreover, it is widely known that DMN exhibits anti-correlated activity with task-positive networks, such as the executive central (ECN) and the dorsal attention (DAN) networks. While the ECN is involved in executive control to orient oneself to the external world and perform complex cognitive tasks, the DAN is responsible for the attentional system, conducting top-down analysis of stimuli to process appropriate responses.20,34 This framework aligns with depression symptomatology, as the hyperactivity of the DMN and hypoactivation of executive and attentional networks can account for typical cognitive deficits, as observed in depressive pseudodementia. The strongly interconnected executive and attentional deficits may stem from the hypoactivation of executive and attentional networks in favor of dominant DMN hyperactivity, thereby reducing resources necessary for balanced cognitive functioning. 35
As in depression, dysfunction of the DMN has been widely observed in AD and MCI.3,36–41 Kim and Kim's review 3 reported a decrease in connectivity within the DMN involving central nodes such as the posterior cingulate cortex (PCC) and precuneus (PCUN). Conversely, others have found a dissociation within the network, with increased functional connectivity in the anterior DMN and reduced functional connectivity in the posterior section. It has also been discovered that brain networks normally exhibit connections between different regions, allowing effective communication between them; however, a reduction or loss of these connections has been observed in individuals with AD, compared to healthy controls, resulting in reduced communicative efficiency between brain areas. Particularly, it was observed that as the severity of AD increased, the optimal organization of brain networks decreased. Moreover, likewise to depression, treatment with Donepezil in these patients led to a restoration of DMN connectivity. 3
Analogously, similar dysfunctions have been observed in MCI patients: Garcés et al. 36 found functional and structural disruptions in the DMN; Wang and colleagues 42 reported a decrease in DMN connectivity in patients with MCI compared to healthy controls, while Cao et al. 43 found alterations in DMN network homogeneity.
As for depression, dysfunctional interactions between DMN and DAN were also highlighted in patients with amnestic MCI, indicating possible changes in this interaction during the progression toward AD. 44 These findings were further confirmed, emphasizing the high predictive capacity that such markers could have for the early diagnosis of AD. 45
Finally, Yuan et al. 46 conducted an activation likelihood estimation (ALE) meta-analysis identifying specific brain regions within the DMN showing abnormal function in patients with MCI. These results collectively suggest that DMN disruption is a feature of not only AD but also MCI, and it is not excluded that this network could represent a common denominator capable of explaining both the deficits associated with AD and MCI and those related to depression.
Regarding the ECN, studies such as Zhao et al. 47 confirm alterations in functional connectivity in individuals with depression. A consistent disruption of the ECN, compared to healthy controls, has been demonstrated in LLD, 48 tending to normalize after the remission of the disease. Additionally, in the same patient category, other seed-based analyses indicate a reduction in functional connectivity in the dorsolateral prefrontal cortex (dlPFC) and parietal regions, key hubs of the ECN. 3 Brzezicka 49 also highlighted the association between ECN dysfunctions and cognitive problems related to depression, especially executive functions, emphasizing ineffective information transmission between prefrontal and parietal regions. In addition, a substantial number of studies have found a significant difference in the connectivity of the ECN in patients with AD/MCI compared to healthy controls. In Zhao et al.'s work, 47 clear alterations in functional connectivity within the ECN regions were identified, suggesting that, along with DMN dysfunction, changes in the ECN could serve as a potential non-invasive biomarker for early AD diagnosis. Similarly, a longitudinal study on MCI patients identified differences in ECN connectivity among those returning to a normal state over time, those remaining stable, and those progressing to AD. 50 These results suggest that differentiated ECN connectivity could be a potential biomarker for early identification of the transition from MCI to AD, allowing distinct approaches for patients with different disease trajectories. Notably, given the early degeneration of the hippocampus in both AD 51 and MCI, 52 seed-based analyses have highlighted abnormal connectivity between the hippocampus and key ECN nodes, such as the middle and superior frontal gyri, both belonging to the dlPFC, which, as mentioned earlier, represents a central area within the ECN.
Lastly, the salience network (SN) or “midcingulo-insular network” plays a crucial role in affective, cognitive, and regulatory functions, being pivotal in regulating attention and responding to salient or emotionally relevant stimuli, both internal and external. Its main function is to recruit functionally relevant networks, selecting and prioritizing information that is most significant to the individual in a given context. It acts as a “switch” in transitioning between the DMN and the ECN, and vice versa, playing a key role in shifting from a state of internal and self-referential thinking to a state of external attention and executive control, or vice versa.53,54 This insular function is relevant in both depression and AD/MCI. Impairment of the insula could disrupt the balance between DMN and ECN, justifying the emotional and cognitive deficits present in both conditions.
Regarding depression, a disrupted connectivity pattern emerges in patients with depression primarily involving the insula. 3 A study conducted by Manoliu et al. 55 highlighted a relationship between malfunctioning right anterior insula and the severity of symptoms in depressed patients. Consistently, a disruption of the SN has been associated with a poorer treatment response. Moreover, aberrant connectivity was highlighted both between SN-DMN3,56 and SN-ECN 57 in depressive patients. At the same time, the SN seems to be involved not only in depression but also in AD and MCI. Regarding AD, studies conducted using Independent Component Analysis (ICA) have shown an increase in SN activity in subjects with AD compared to controls. 3
An ALE meta-analysis conducted on subjects with MCI (amnestic and non-amnestic) has shown internal compromises in the SN and alterations in its connectivity with other networks, such as the DMN and the ECN, suggesting these anomalies as potential biomarkers for MCI.58,59 A pioneering study examining both anatomical and molecular alterations in MCI patients found that, while the former markers appeared reduced in nodal regions of the SN, molecular markers were significantly elevated. However, the integration of both types of markers proved to be a stronger predictor of cognitive decline in MCI compared to the use of a single diagnostic marker. 60
In conclusion, the evidence presented strongly suggests that these networks (DMN, ECN, SN, and DAN) are integral to both depressive disorders and neurodegenerative diseases such as AD and MCI. These networks exhibit functional disruptions in both conditions, indicating a shared neuropathological basis that could underlie depressive comorbidity in neurodegeneration. The observed hyperconnectivity, hypoactivation, and dysfunctional interactions among these networks across both depression and neurodegenerative disorders suggest that they may play a critical role in the cognitive and emotional disturbances characteristic of these conditions. Therefore, these networks are promising candidates for further investigation into the mechanisms of depressive comorbidity in neurodegenerative diseases, potentially offering insights for early diagnosis and targeted interventions.
Aims
The primary goal of the present meta-analysis is to enhance our understanding of the association between neurodegeneration and depression, particularly considering the high rates of co-occurrence with conditions such as AD and MCI.
Our aim is to analyze differences in intrinsic functional connectivity among patients affected by AD and MCI, with and without a diagnosis of comorbid depression, in order to gain a better understanding of these variations and to investigate whether similar changes exist, possibly indicating a common ground between the conditions. The presence of depression alongside neurodegeneration may result in unique neurofunctional abnormalities that differ from those caused by neurodegeneration alone; suggesting that these three conditions—neurodegeneration, depression, and their comorbidity—should be considered as separate diagnostic entities. Indeed, we hypothesize circumscribed areas and specific dysfunctional networks to differentiate depressed patients with AD and MCI from those without comorbid depression. Based on the previously discussed evidence on the involvement of the main functional networks in neurodegeneration and depression, we expect that such functional signatures would be distributed across the main resting state networks (RSN), particularly the DMN, SN and ECN.
To test these hypotheses, we employed an ALE meta-analysis on significant foci resulting from resting-state fMRI studies comparing patients with AD and MCI, both with and without comorbid depression, thus distinguishing between samples with “pure” neurodegeneration and those with comorbidity.
Specifically, the resting state methods used to assess differences in spontaneous fluctuations can vary widely and differently estimate local or global neural activity. Indeed, Amplitude of Low Frequency Fluctuations (ALFF) consists of a local approach and estimates the intensity of low-frequencies fluctuations in the blood-oxygen-level-dependent (BOLD) signal. Regional homogeneity (ReHo) also consists of a widely used regional method that assesses the voxel's signal similarity with the nearest voxels within a cluster. Conversely, methods based on graph analyses like Graph Theory Analysis (GTA) estimate the whole-brain topological organization of the brain as a network composed of nodes and edges. 61 Similarly, functional connectivity density (FCD) consists of a voxel-based whole-brain correlation analysis estimating global connectivity. 62 The variety of methodologies yield different results leading to fragmented and possibly incomplete results characterizing aberrant fluctuations of depressive comorbidity in neurodegeneration. As such, our study aims at unveiling significant convergence among different resting state approaches to provide a comprehensive whole-brain assessment of aberrant fluctuations 63 that characterize depressive comorbidity in AD and MCI.
Methods
Systematic review and data extraction
The current study was preregistered at https://doi.org/10.17605/OSF.IO/NUWSE, where data, analyses, and results are also available along with the checklist for neuroimaging meta-analyses that we followed throughout the study. 64 We conducted a systematic review to identify papers investigating resting-state functional differences between MCI or AD patients with and without depression, following the Preferred Reporting Items for Systematic Reviews and Meta-Analyses (PRISMA) guidelines. 65 The search for relevant papers was conducted on PubMed, Scopus, and Web of Knowledge (Web of Science) in February 2023, in which we employed two separate queries. One related to Alzheimer's disease and depression: (Alzheimer* OR “Alzheimer's disease” OR “AD” OR “dementia”) AND (“depression” OR “unipolar depression” OR “MDD” OR “major depressive disorder” OR “dAD” OR “d-AD”) AND (“fMRI” OR “functional magnetic resonance imaging” OR “functional MRI” OR “rs-fMRI” OR “rs-fmri”), and the second related to Mild Cognitive Impairment and depression: (“Mild Cognitive Impairment” OR “MCI”) AND (“depression” OR “unipolar depression” OR “MDD” OR “major depressive disorder”) AND (“fMRI” OR “functional magnetic resonance imaging” OR “functional MRI” OR “rs-fMRI” OR “rs-fmri”). The search resulted in a total of 535 studies, from which duplicates were removed, leaving 342 records.
Following our research question, only the records that met the following a priori inclusion criteria were further analyzed: (1) studies employing whole-brain analyses using resting-state functional magnetic resonance imaging (rs-fMRI); (2) studies had to provide foci representing differences in spontaneous fluctuations either in the Montreal Neurological Institute (MNI) 66 or Talairach-Tournoux 67 reference spaces; (3) records had to compare functional differences between participants diagnosed with AD or MCI and comorbid depression (D) and participants with the same neurodegenerative disorder but without depression (ND), matched for age and sex (4) studies with a sample size larger than 7.
Two independent investigators (D.P. and M.D.) conducted the screening and the coordinate extraction, while a double-check was performed by a third investigator (A.v.G.), resulting in 8 papers considered for the analysis, 5 conducted on AD patients and 3 on MCI patients. A total of 17 contrasts were included in the ALE meta-analysis. The flowchart in Figure 1 summarizes the systematic selection process, while Table 1 shows information extracted from the selected papers.
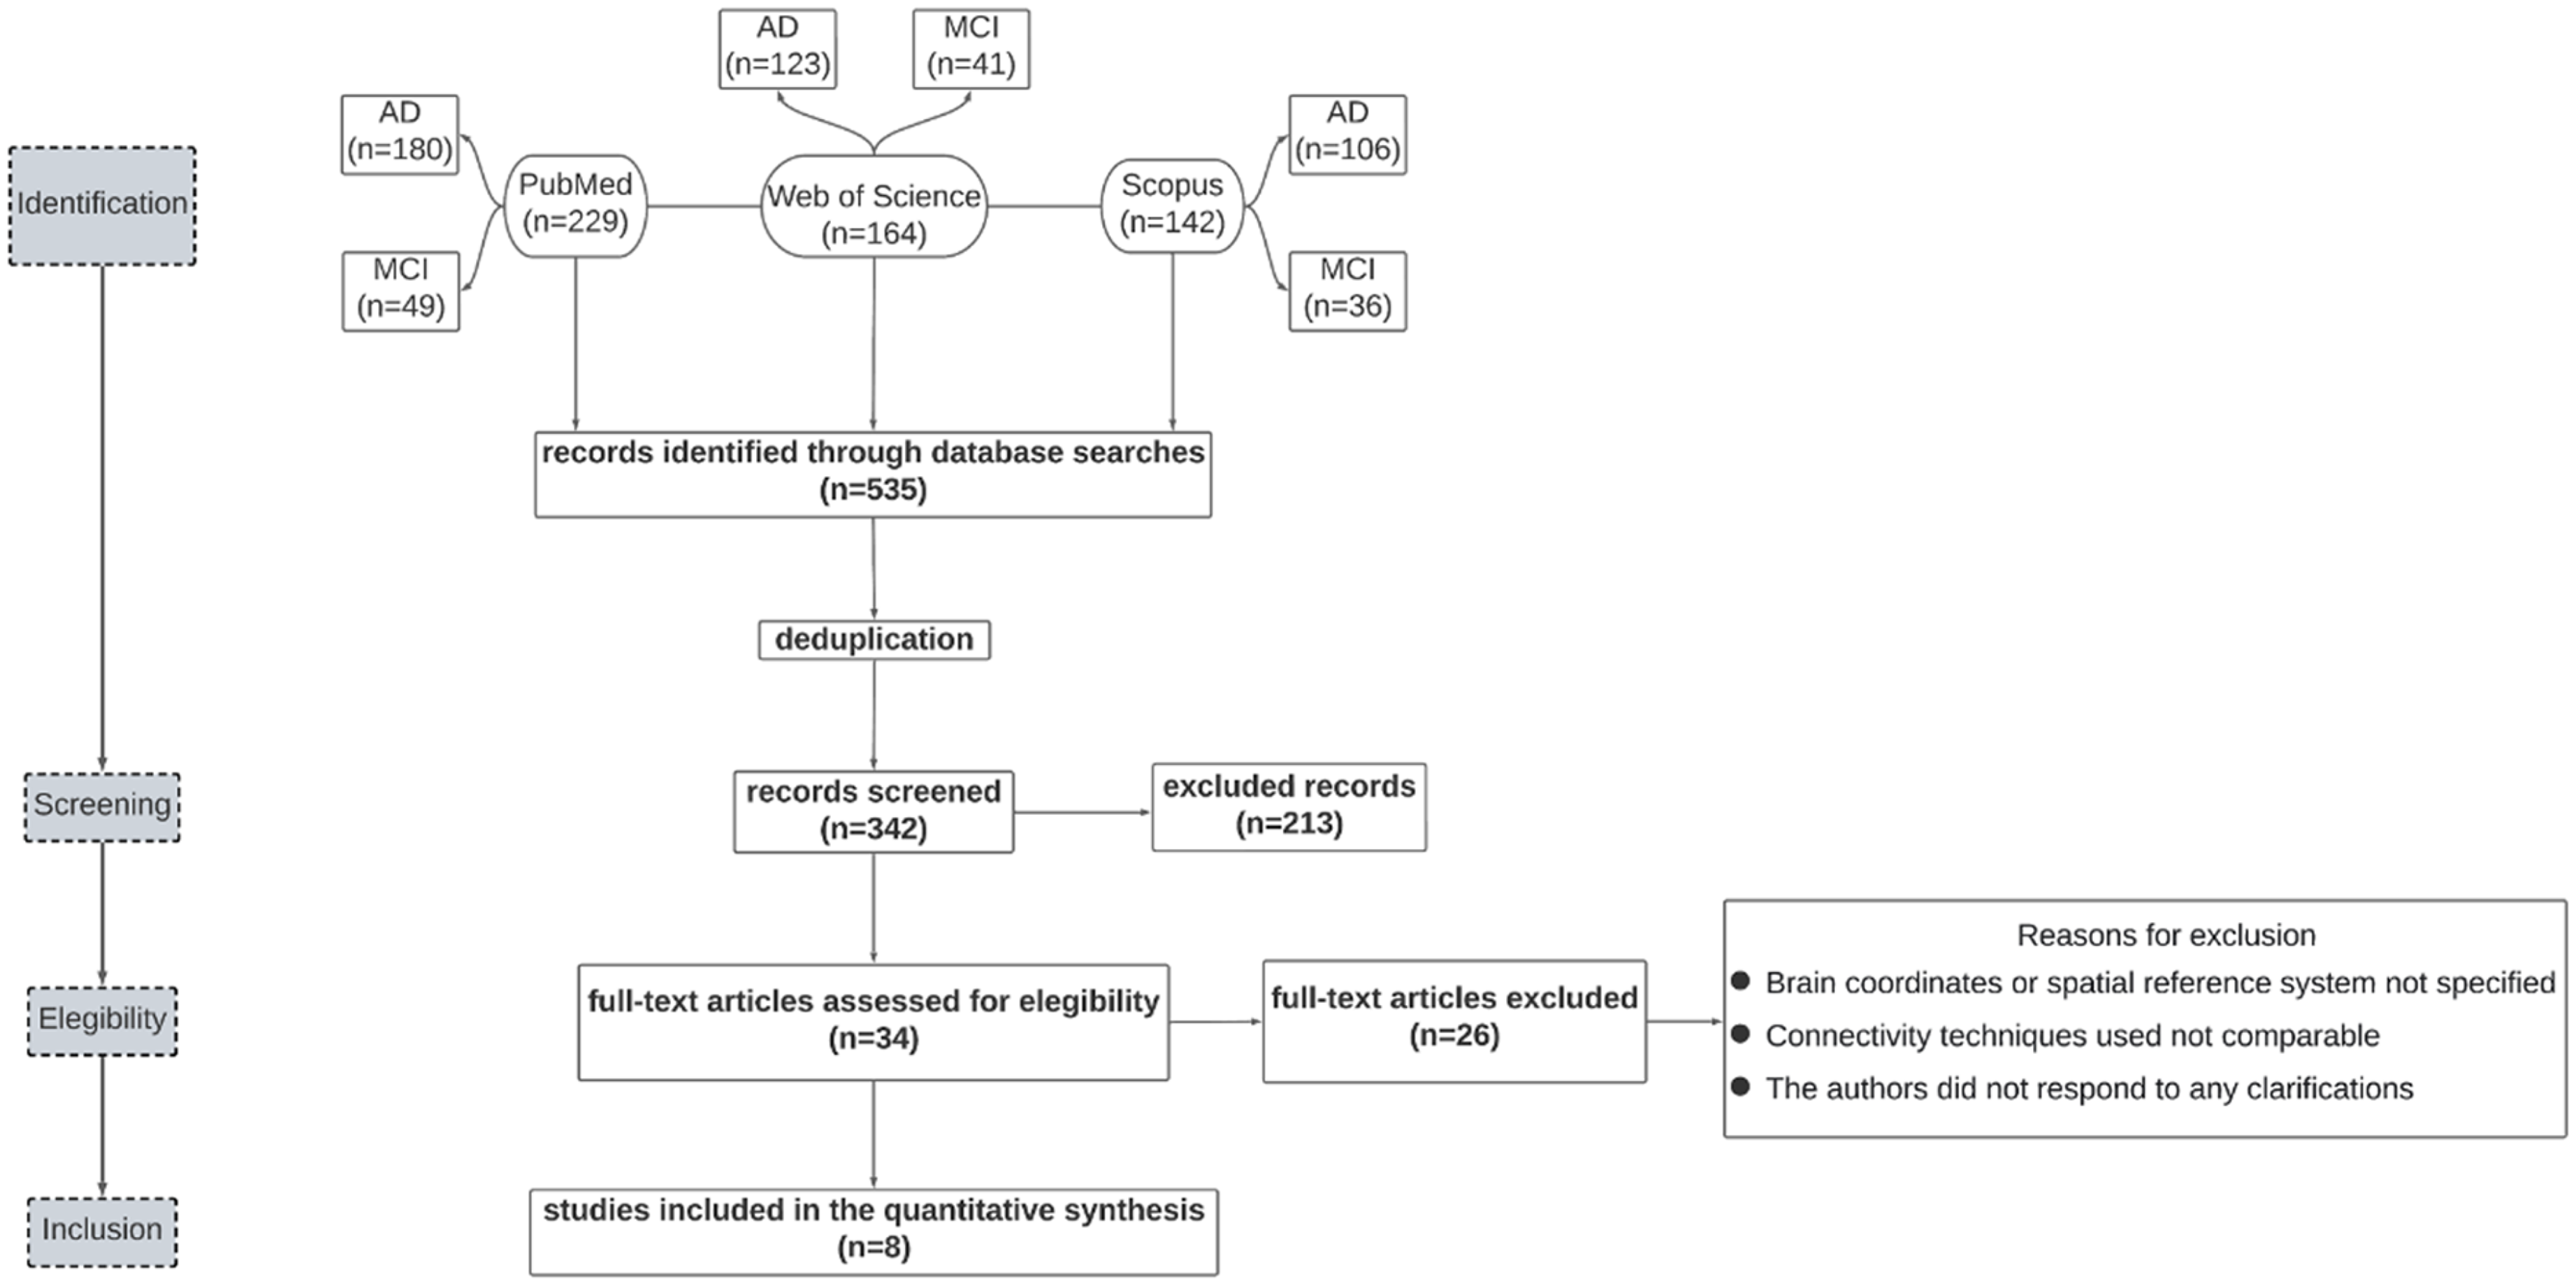
Flowchart describing the paper selection process.
Articles included in the meta-analysis. Details about the number (N) of male and female (M/F) depressed (D) and non-depressed (ND) patients involved in each study, their age, diagnosis (AD or MCI), diagnostic tests used to categorize patients, number and type of contrasts included in the analysis and resting-state methodology employed in each study are reported.
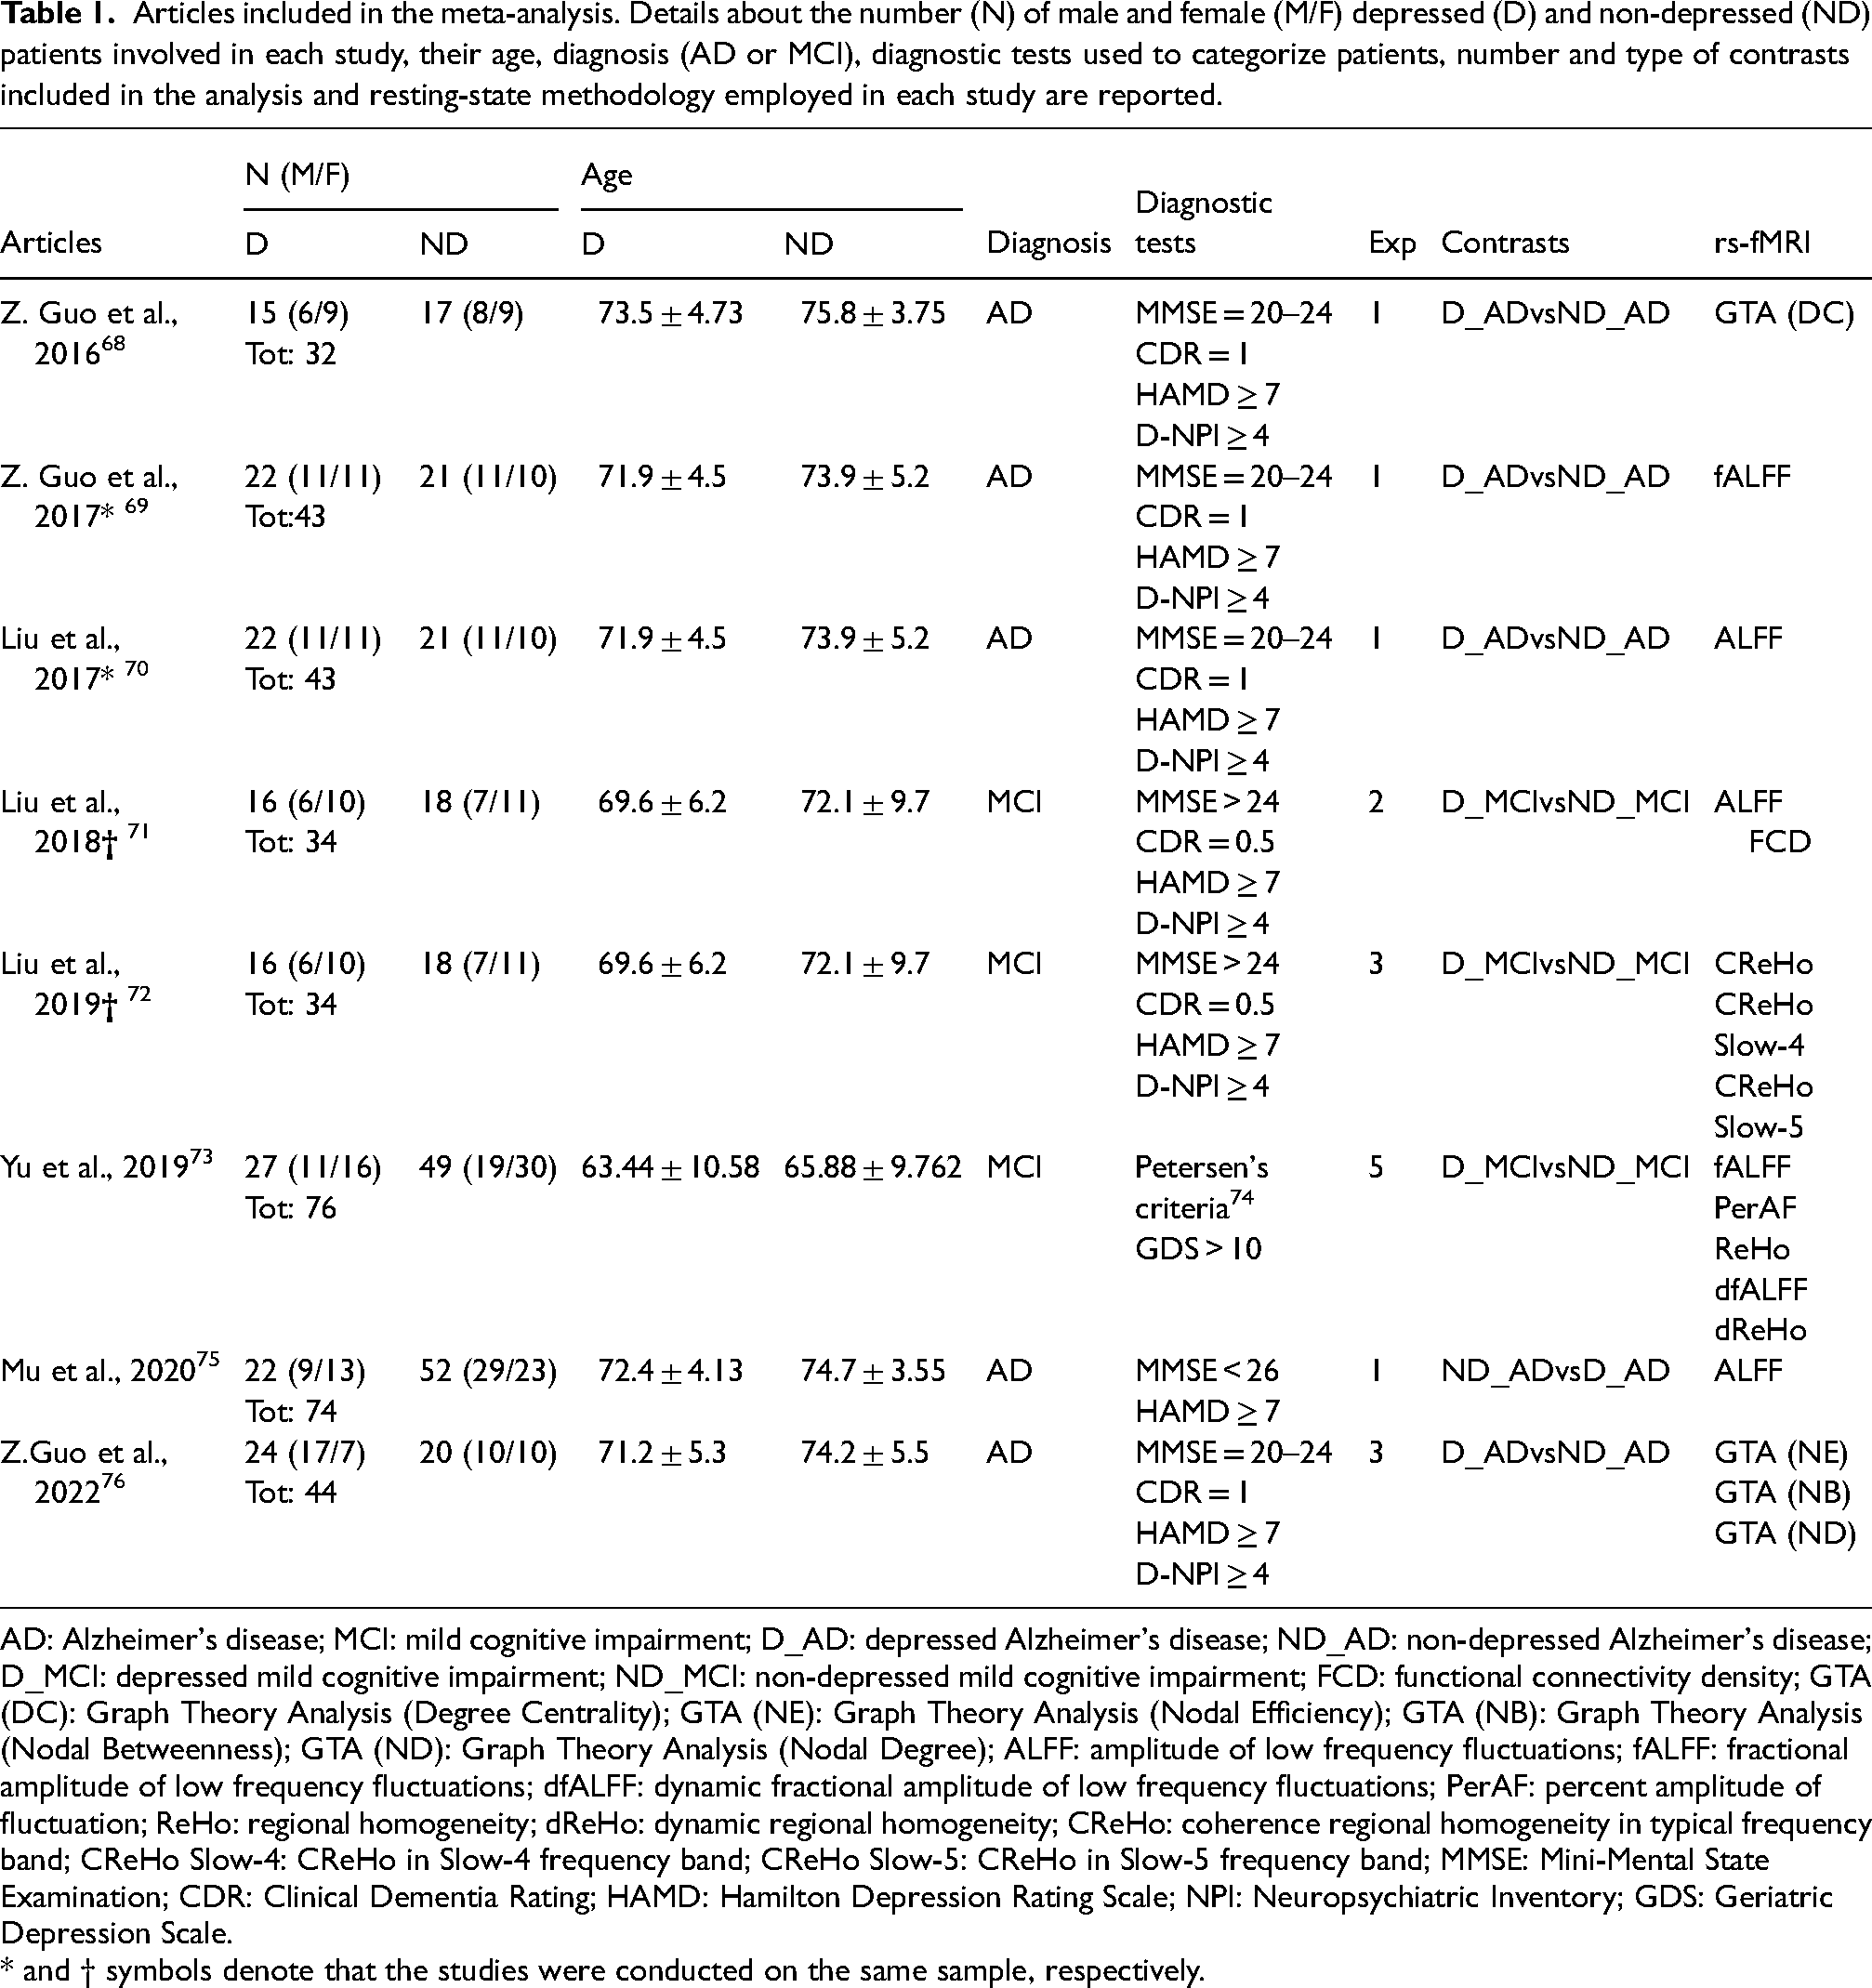
AD: Alzheimer's disease; MCI: mild cognitive impairment; D_AD: depressed Alzheimer's disease; ND_AD: non-depressed Alzheimer's disease; D_MCI: depressed mild cognitive impairment; ND_MCI: non-depressed mild cognitive impairment; FCD: functional connectivity density; GTA (DC): Graph Theory Analysis (Degree Centrality); GTA (NE): Graph Theory Analysis (Nodal Efficiency); GTA (NB): Graph Theory Analysis (Nodal Betweenness); GTA (ND): Graph Theory Analysis (Nodal Degree); ALFF: amplitude of low frequency fluctuations; fALFF: fractional amplitude of low frequency fluctuations; dfALFF: dynamic fractional amplitude of low frequency fluctuations; PerAF: percent amplitude of fluctuation; ReHo: regional homogeneity; dReHo: dynamic regional homogeneity; CReHo: coherence regional homogeneity in typical frequency band; CReHo Slow-4: CReHo in Slow-4 frequency band; CReHo Slow-5: CReHo in Slow-5 frequency band; MMSE: Mini-Mental State Examination; CDR: Clinical Dementia Rating; HAMD: Hamilton Depression Rating Scale; NPI: Neuropsychiatric Inventory; GDS: Geriatric Depression Scale.
* and † symbols denote that the studies were conducted on the same sample, respectively.
Notably, after analyzing the papers to be included, we noticed that sample demographic characteristics (N and Age) for two couples of studies, namely Z. Guo et al., 2017 and Liu et al., 2017 as well as Liu et al., 2018 and 2019, were overlapping (see Table 1). This suggested that they were based on the same participants, which was later confirmed by the authors. To avoid biasing the results by treating these studies as independent, we pooled their contrasts, ensuring that the ALE estimation was not disproportionately influenced by single sample groups (see below). Importantly, none of the pooled contrasts came from the same resting-state methodology.
About the first inclusion criterion, we note that only studies employing whole-brain resting state analyses were considered as thoroughly indicated in the literature on ALE analyses.77–79 Therefore, experiments that employed seed-based functional connectivity analyses had to be excluded to avoid biasing the analysis towards the areas chosen as seeds. Indeed, in seed- or ROI-based studies, the necessary assumption that each voxel has the same a priori chance of being activated is not met, and adding these results would lead to an inflated significance for the regions emerging from the studies employing this method. Conversely, we considered studies that applied resting-state methodologies operating at the whole brain level, including ALFF, ReHo, GTA, and FCD. Specifically, we also included any of the specific sub-measures reported in each study (e.g., functional ALFF, dynamical ReHo, or GTA's degree centrality) as separate contrasts.
Despite being all whole brain, these methods differ in representing local and global spontaneous fluctuations. Indeed, records comparing the same populations or conditions may yield contrasting results and be differently effective in representing the fundamental features characterizing pathological signatures.
By combining the foci resulting from separate methodologies and analyze them in a single ALE analysis we expect to observe a comprehensive and generalized overview of the central nodes expressing aberrant fluctuations. This approach allows us to characterize and locate the collection of regions specifically involved in depressive comorbidity in both AD and MCI, reducing the influence of the specific resting-state methods used in single studies.
Activation likelihood estimation
We used ALE80,81 to identify the regions showing differential activation during the resting-state of AD and MCI patients with or without depression or depressive symptoms. ALE is a coordinate-based meta-analysis and tests the hypothesis for which activation foci significantly converge against the null hypothesis under which foci are randomly distributed. To do so, activation foci are extracted from the records of interest, and probability distributions are created around the reported peaks. Then, ALE maps are generated by testing the null hypothesis that activation foci are uniformly spread across the whole brain, assuming that each voxel has the same probability of being activated. Lastly, by computing the union of activation probabilities for each voxel, the analysis returns the corresponding ALE maps, which represent maps of significant spatial convergence among the contrasts of interest. As such, the resulting ALE values are interpreted as stronger or weaker spatial convergence of evidence and do not inform about changes in activation intensity or directionality among groups.
The ALE analysis was conducted using the GingerALE 3.0.2 software (http://brainmap.org/ale). All extracted coordinates were in the MNI152 linear reference space, so we did not apply any type of conversion. Therefore, the full width at half maximum (FWHM), describing the uncertainty of spatial location (i.e., the probability distribution) of each focus for each experiment, was computed. Afterward, model activation (MA) maps are computed by taking the maximum across each focus's Gaussian, thus limiting the effect of single subject groups with multiple experiments in influencing the ALE values more than others. 82 These MA maps summarize the results reported in a specific study considering the spatial uncertainty associated with the reported foci coordinates. ALE scores are then computed as the union of these probabilities across experiments for each voxel. These scores are tested against the null distribution calculated for each voxel, reflecting a random spatial association of the MA across experiments.77,78 The resulting thresholded ALE map was then computed using a cluster forming threshold of p < 0.001 and a cluster-level threshold of p < 0.05 Family Wise Error (FWE) corrected. 79 AAL3 83 and AICHA 84 atlases were used to label the functional areas resulting from the present analysis. Additionally, we used two more atlases to characterize the main RSNs the activation foci belonged to. Yeo et al.'s atlas 15 is based on functional resting state scans from 1000 subjects and describes 7 main functionally coupled networks (Visual, Somatomotor, Dorsal Attention, Ventral Attention, Limbic, Frontoparietal, Default); widely used in the connectivity analyses. Atlas55+ 85 comprehends 5 major RSNs (Salience, Executive Central, Sensorimotor, Default, Visual) and is particularly suited for our current aim, given that it was specifically developed based on 563 older (age range: 55–95 years) healthy adults’ resting state scans; to better account for networks’ functional reconfiguration happening throughout the lifespan. 85
Results
The activation likelihood estimation meta-analysis, conducted on all the included contrasts, revealed 10 clusters distributed in both hemispheres (Table 2, Figure 2). All these clusters were limited in volume size and centered around one peak per cluster only. The unthresholded results are available at the OSF project page (https://osf.io/9fsnp/). In the left hemisphere, two clusters showed the greatest volume in terms of size. The first was located in the lenticular nucleus, centered around a peak located in the antero-medial portion of the putamen, which extended inferiorly and medially, reaching the anterior aspect of the globus pallidus (see Z = 2 in Figure 2). A second cluster was located medially in the lateral and posterior portions of the left thalamus. Particularly, overlapping activation was mainly found around the medial Pulvinar, extending laterally to the lateral posterior portion of the thalamus. A third cluster was centered in the posterior insula, extending laterally to Heschl's gyrus and Rolandic operculum, according to the AAL atlas. The last cluster of the left hemisphere was in the middle temporal gyrus (MTG), located in its lower, posterior portion. In the right hemisphere, two clusters were in the parietal lobe. Indeed, the cluster with the highest ALE value was found in the superior part of the inferior parietal gyrus, close to the intraparietal sulcus, while the second one was found in the superior parietal lobule extending in the intraparietal sulcus.
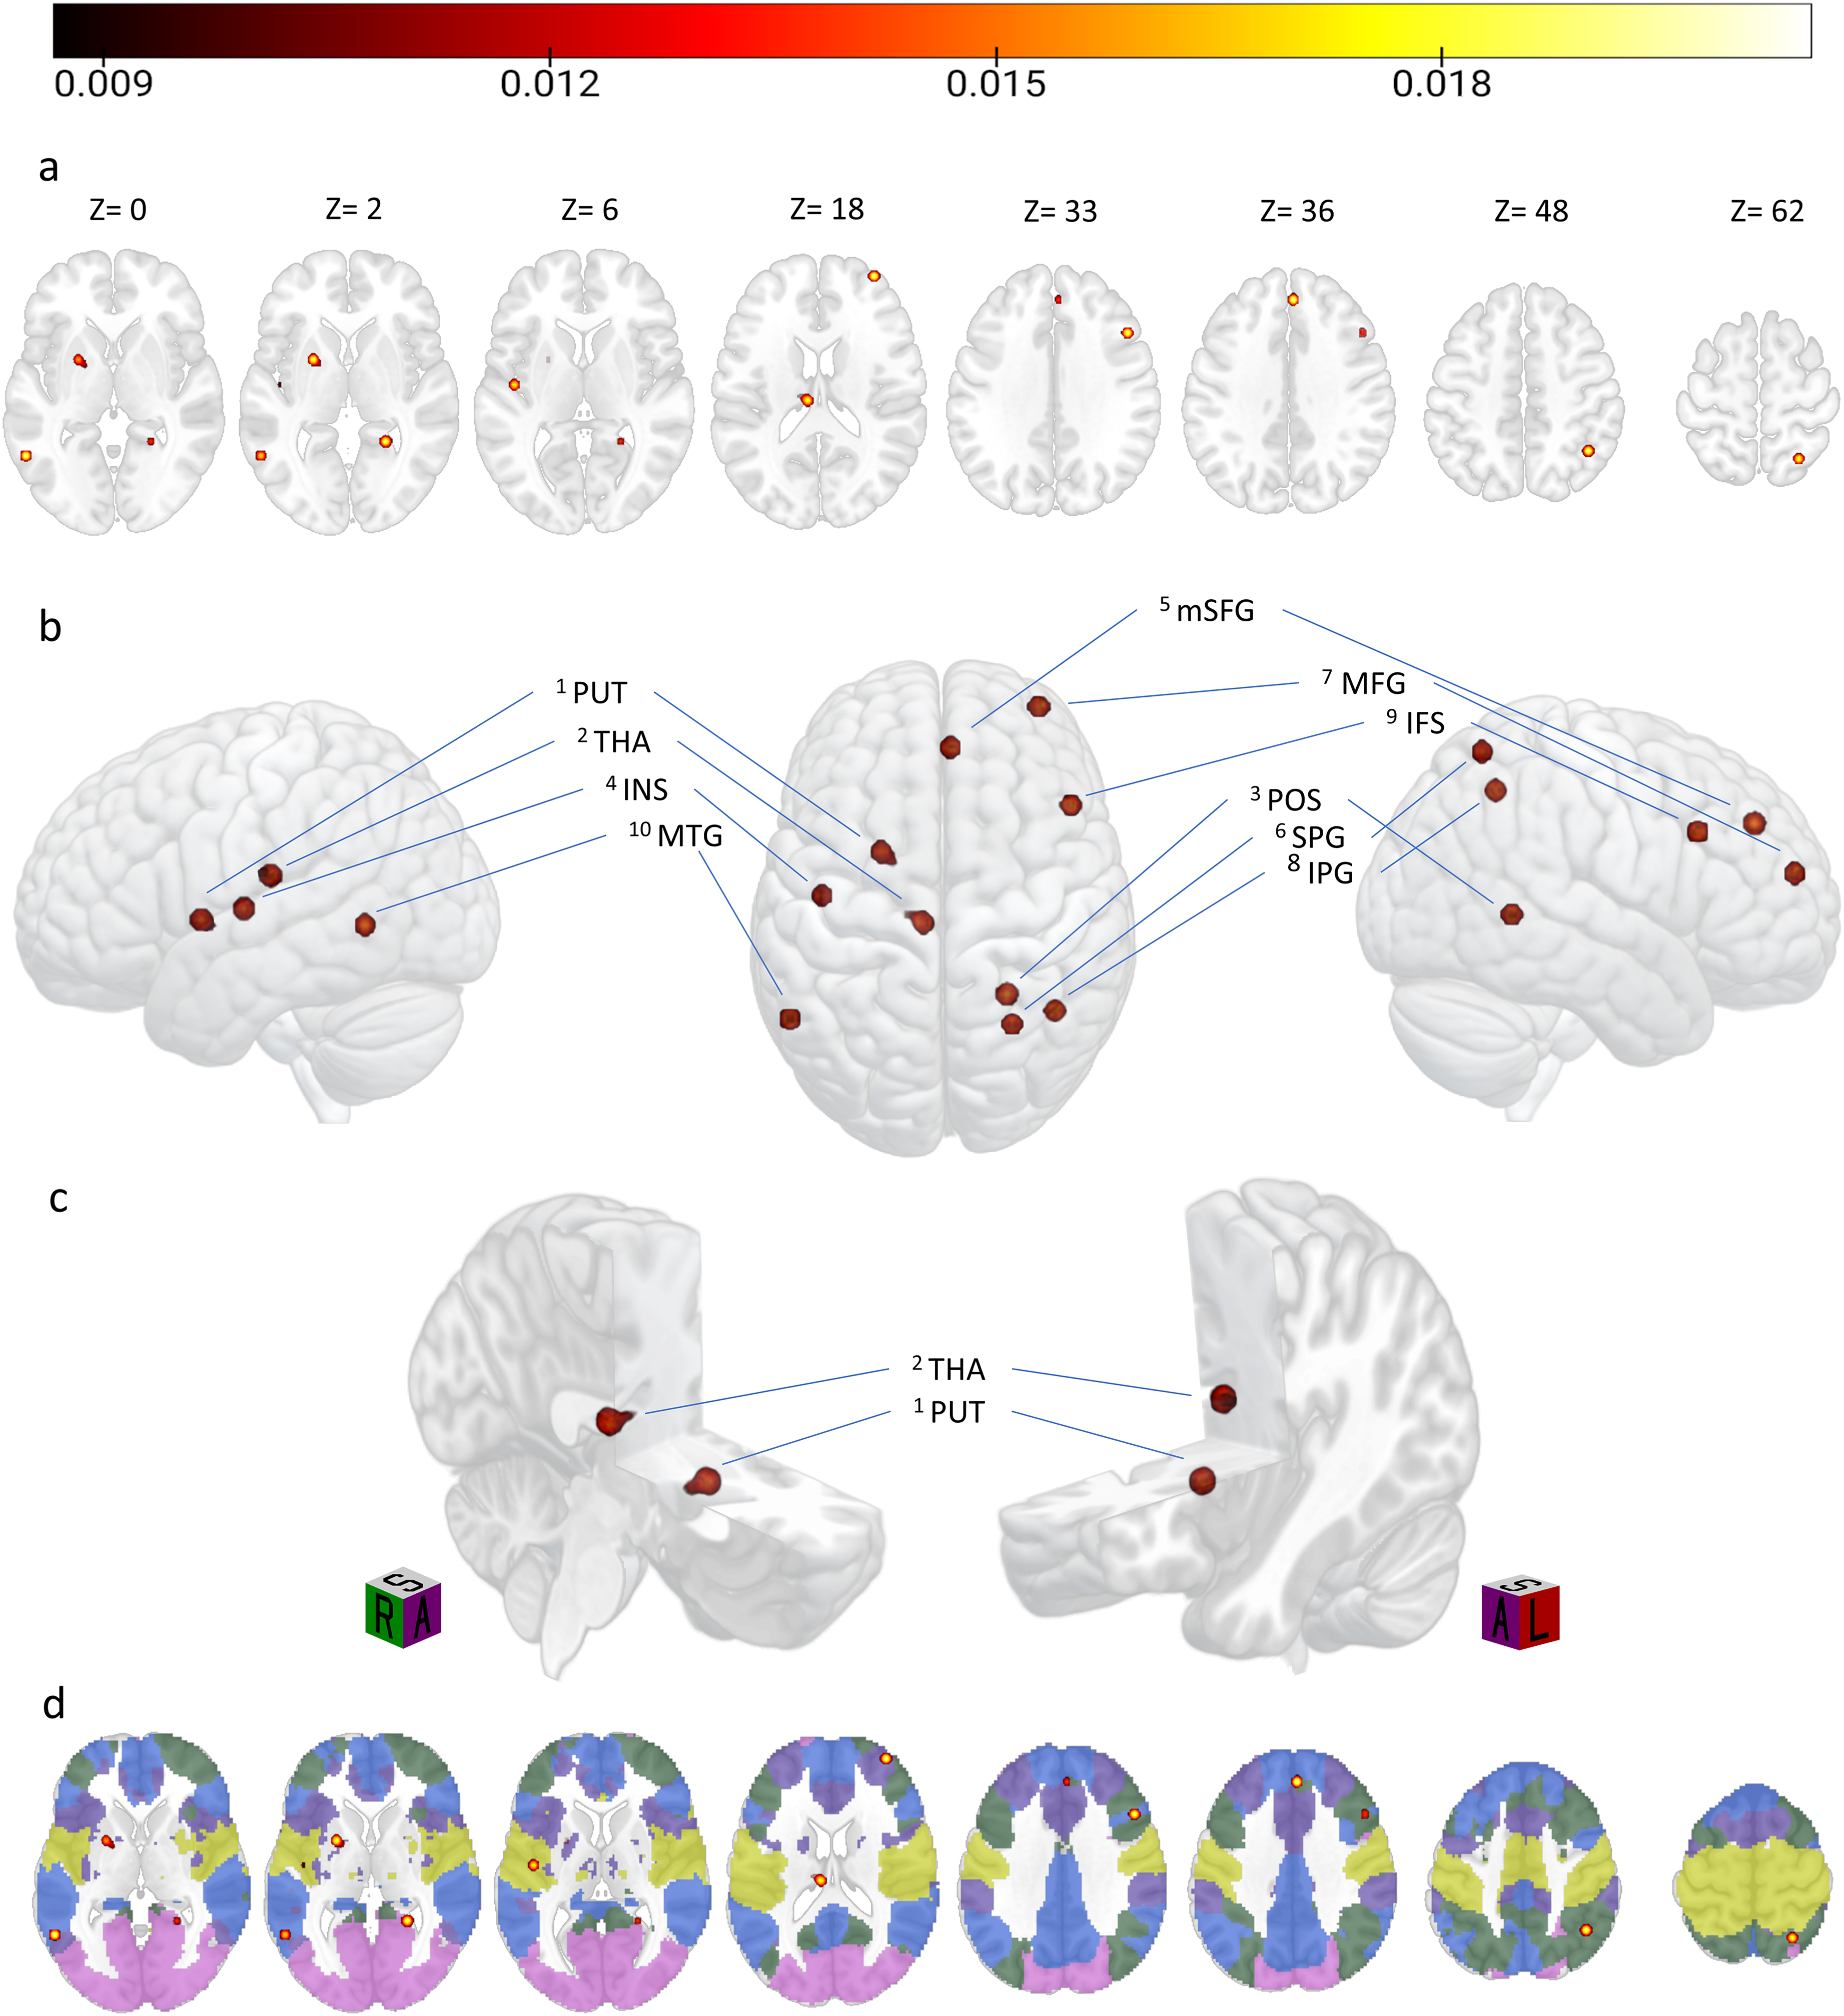
Thresholded ALE results showing the network of regions characterizing depressive comorbidity in neurodegeneration, overlayed on a MNI152 template. (a) Axial view of the overlapping clusters of activations at the corresponding Z coordinate. (b) Rendered 3D view images of the lateral view of the left hemisphere, superior view of both hemispheres, and lateral view of the right hemisphere. Areas of overlapping activation are labeled as in Table 1, with the apex number indicating the corresponding cluster number. (c) Left hemisphere section cutouts focusing on the two subcortical clusters of overlapping activations, orientation cubes are provided (R: right, L: left; S: superior, A: anterior). (d) Axial view showing the same overlapping clusters falling in the 5 Atlas55+ networks, overlayed onto the MNI template at the same Z coordinates reported in panel a. Networks’ color coding: Purple = Salience; Green = Central executive; Yellow = Sensorimotor; Blue = Default mode; Magenta = Visual. The colorbar indicates the ALE value (colors are visible in the online version).
ALE results. For each cluster, the functional areas are identified by the AICHA and AAL atlases. Similarly, resting-state network labels are provided according to Atlas55+ and Yeo et al.'s atlases (one region/network only means the two atlases returned the same region/network). The table also provides hemisphere, cluster size (expressed in mm3), ALE value and the corresponding standardized Z value quantifying spatial convergence among included experiments. MNI coordinates are reported for each cluster peak.
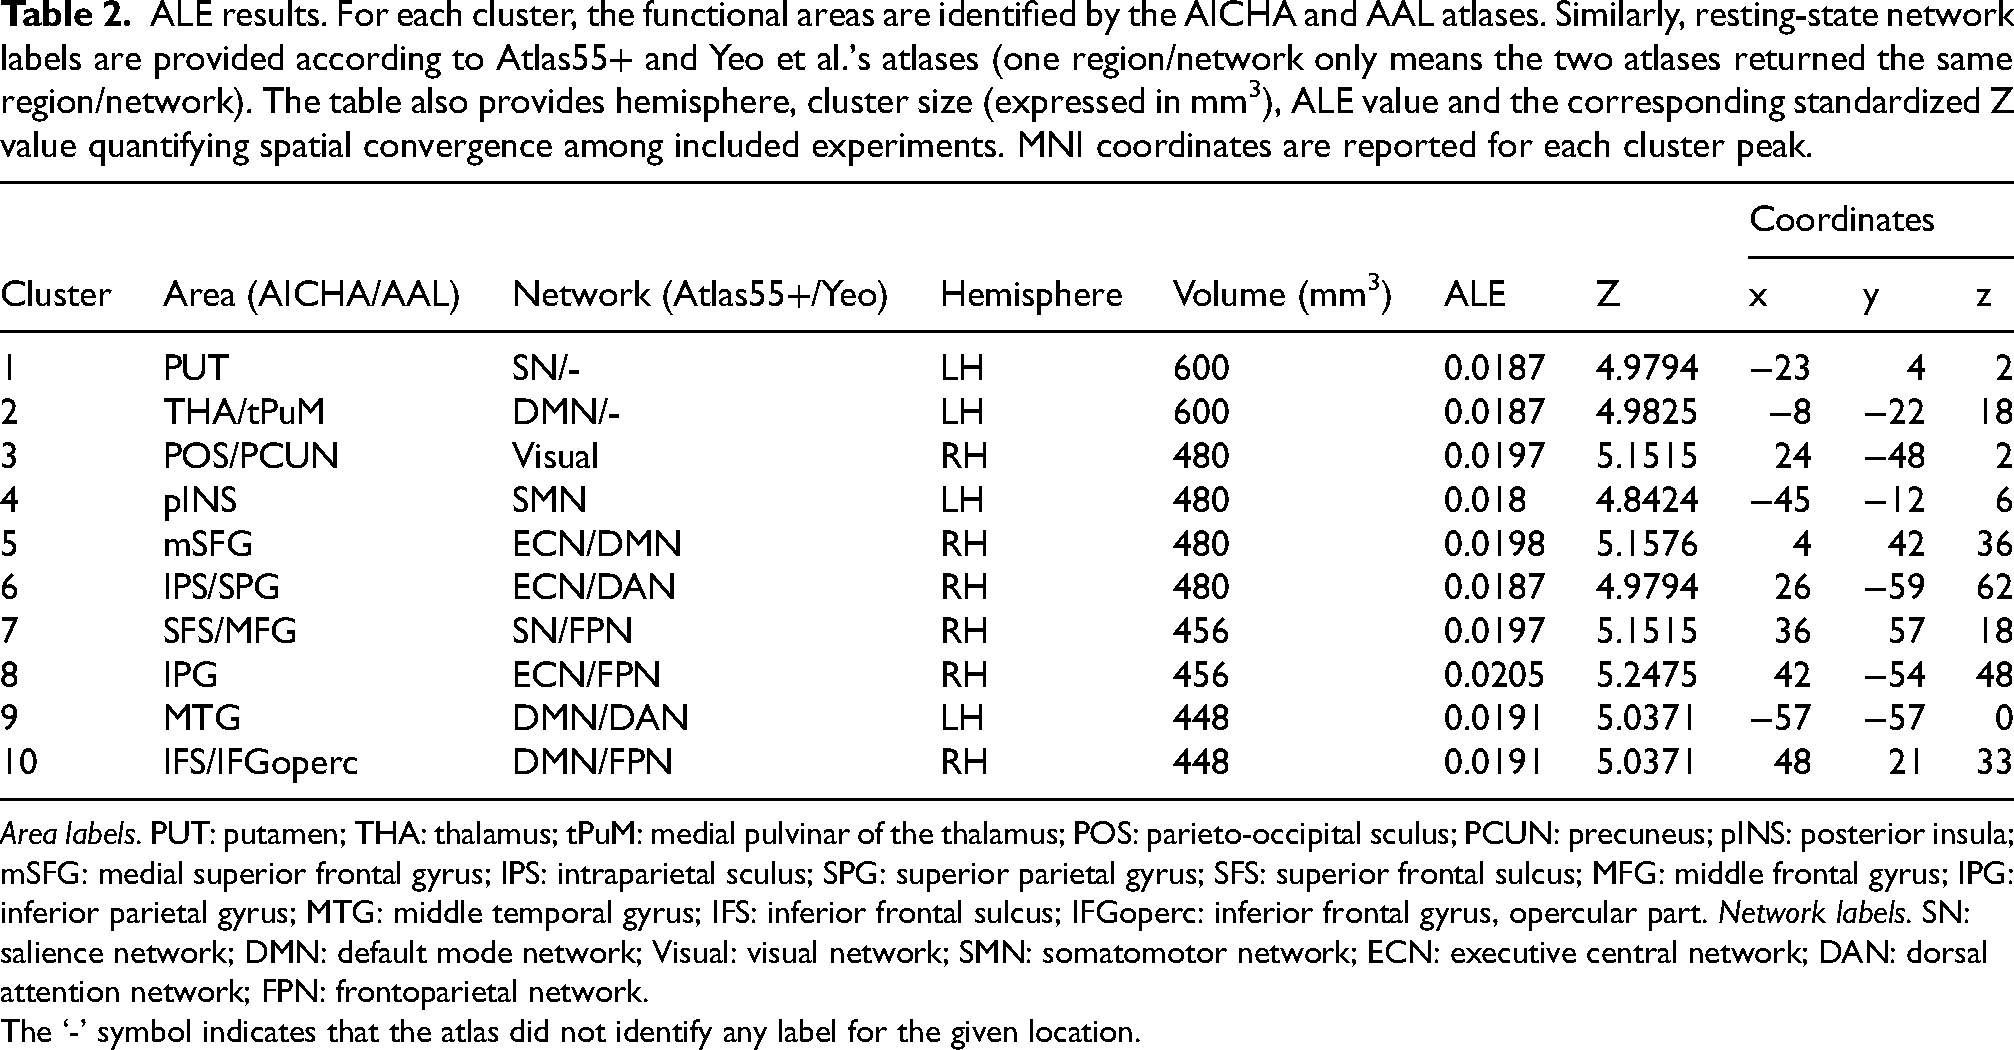
Area labels. PUT: putamen; THA: thalamus; tPuM: medial pulvinar of the thalamus; POS: parieto-occipital sculus; PCUN: precuneus; pINS: posterior insula; mSFG: medial superior frontal gyrus; IPS: intraparietal sculus; SPG: superior parietal gyrus; SFS: superior frontal sulcus; MFG: middle frontal gyrus; IPG: inferior parietal gyrus; MTG: middle temporal gyrus; IFS: inferior frontal sulcus; IFGoperc: inferior frontal gyrus, opercular part. Network labels. SN: salience network; DMN: default mode network; Visual: visual network; SMN: somatomotor network; ECN: executive central network; DAN: dorsal attention network; FPN: frontoparietal network.
The ‘-’ symbol indicates that the atlas did not identify any label for the given location.
Another cluster was located in the ventral-most portion of the PCUN, namely, in correspondence with the antero-ventral part of the parieto-occipital sulcus in the vicinity of the area Prostriata,86,87 extending in the medial cortex surrounding the calcarine fissure.
Three more clusters were identified in the right frontal lobe. One was identified on the medial aspect of the right hemisphere; specifically, it was located on the inferior portion of the medial superior frontal gyrus (mSFG), just in front of the anterior portion of the medial cingulate cortex. The second cluster of activation was located in the anterior part of the dlPFC, in the depths of the anterior portion of the superior frontal sulcus. The last cluster was found in the superior portion of the pars opercularis of the inferior frontal gyrus (IFG), according to the AAL atlas, and extending into the inferior frontal sulcus, according to AICHA.
Discussion
The current study is the first to meta-analytically identify the intrinsic networks characterizing depressive comorbidity in neurodegenerative disorders such as AD and MCI, expressed by aberrant spontaneous fluctuations across different whole-brain, resting state methods.
In 2015, Boccia and colleagues 88 conducted a coordinate-based meta-analysis of voxel-based morphometry studies in AD and LLD to compare the neural substrates of these conditions and to better clarify their relationship. The authors found that AD causes widespread cortical atrophy, affecting parietal, frontal, and temporal areas. On the other hand, LLD is primarily linked to atrophy of the bilateral PCUN and anterior frontal regions. Both AD and LLD are connected to hippocampal atrophy, as evidenced by the conjunction analysis. They also emphasized the need for further studies focusing on the relationship between LLD, MCI, and AD. This could help better understand whether these clinical cases may be considered as a continuum or separate clinical entities. The overlapping regions we identified may represent areas where the DMN disruption occurs in AD and LLD. These areas showed both in Boccia et al.'s study 88 and in the present study could serve as potential targets for diagnosis and treatment of both AD and LLD.
Additional evidence put forward the need to consider large-scale resting state networks to disclose the characterization of both neurodegeneration, depression, and their comorbidity. Specifically, although many of the major RSN have been linked to several pathologies, other accounts underline the need to consider the dynamic interplay between such networks as possible disease biomarkers. 89 In this vein, it has been proposed that disruptive network connectors, intended as the nodes that densely connect with distinct modules and serve critical roles in coordinating network integrity,90,91 may be crucial in interrupting between-network information flow, both on a cortical and subcortical level, thus explaining the disease progression. 92
The present study aims to better understand the brain mechanisms of depressive comorbidity in neurodegeneration, by disclosing the spatial distribution of functional nodes that putatively characterize inter-network disruptive communication.
Indeed, the ALE analysis revealed ten significant clusters distributed across the two hemispheres in regions such as putamen, thalamus, posterior insula, parietal lobe, parieto-occipital sulcus, temporal and frontal lobes.
Based on previous evidence, we expected to find regions of overlapping dysfunctional activity mainly involving the DMN, the ECN and, possibly, the SN. Interestingly, although our results confirm a significant involvement of such networks, the present evidence demonstrates that regions showing aberrant activation reflecting depressive comorbidity in neurodegeneration are spread across all five major RSNs.
Our analysis revealed four regions of overlapping spontaneous activity putatively belonging to the DMN. The first was identified as the medial Pulvinar, in the left lateral posterior portion of the thalamus; the second was the inferior portion of the mSFG near the medial cingulate cortex. Particularly, this region was located at the border between the ECN and DMN, indeed being categorized as part of the former according to Atlas55+ and the latter according to Yeo's atlas. Another region was found in the right PFC, specifically in the superior portion of the pars opercularis, while the last was located in the posterior portion of the middle temporal gyrus. These were classified as belonging to the FPN and DAN, respectively, according to Yeo's atlas. Two other regions were identified as being part of the ECN, namely both the inferior and superior parietal gyri. Again, according to Yeo's atlas these two belonged to the FPN and the DAN, respectively.
Notably, most of the network labeling discrepancies involved the DMN, highlighting the importance of using age-matched atlases and reinforcing the notion that the DMN and ECN undergo the most significant age-related spatial reorganization. 85
Confirming our expectations, two regions of overlapping activations were identified as nodes of the SN, namely the putamen and the middle frontal gyrus in the dorsomedial PFC, two central regions in the cortico-limbic connectivity of the SN. 93
Lastly, two more clusters were individuated as belonging to the remaining sensorimotor and visual networks, for which we did not have specific expectations. Specifically, a cluster extending across the posterior insula, Heschl's gyrus, and Rolandic operculum and another in the anteroventral portion of the parieto-occipital sulcus, respectively.
The following paragraphs will compare our findings with previous evidence, starting from the discussion of single regions that show both functional and structural changes related to AD, MCI and depression. Then, the involvement of these regions across the major RSNs will be discussed separately, before accounting for the results in an integrated, between-network fashion.
Structural and functional correlates characterizing depressive comorbidity in neurodegeneration
Convergent evidence has demonstrated the involvement of the medial and superior frontal cortex in depressive symptomatology related to AD patients. Particularly, studies employing single-photon emission computed tomography (SPECT) revealed hypoperfusion of the superior PFC, the middle frontal gyrus, 94 the left anterior cingulate cortex, 95 the left middle frontal regions,96,97 and the left inferior frontal cortex 98 in AD patients with depressive symptoms, compared to those without.
Similarly, PET studies found hypoperfusion of various frontal regions, such as the middle frontal cortex and dlPFC, 99 right superior PFC, 100 and bilateral superior frontal cortices 101 in D-AD compared to ND-AD.
The emerging pattern of evidence demonstrates a consistent involvement of frontal regions, although specific areas reported in previous studies may vary considerably, being distributed in both hemispheres and in different portions of the PFC. The contribution of these areas in neurodegenerative depression has been discussed for decades, with early evidence suggesting that the hypoperfusion of the frontal lobe was associated with the severity of negative dementia-related symptoms but not with depressive symptoms in patients with AD 102 ; while more recent evidence suggesting depression score to be associated with left middle frontal cortex gray matter atrophy in both MCI and AD. 103
Increased cortical atrophy in MCI patients with depressive symptoms has also been found in the anterior cingulate, dorsal cingulate, and frontal regions, such as the orbitofrontal cortex and the ventromedial prefrontal cortex.104–106
Indeed, not only frontal areas have been found to characterize depressive symptomatology in neurodegenerative disorders: reduced gray matter volume was reported in temporal and parietal lobes in D-AD compared to ND-AD.107,108 Similarly, depressive symptoms in MCI were found to be related to grey matter volume loss in regions like the dorsal cingulate cortex, posterior MTG, and insula. 106 Comparable regions also show white matter atrophy and microstructural disruptions in D-MCI, as opposed to ND-MCI; specifically in frontal, parietal, and temporal brain regions, especially in the hippocampal cingulum and fornix tracts.109,110
Taken together, the results emerging from the current meta-analysis confirm the involvement of crucial nodes individuated by previous evidence, underlining the accordance between structural and functional findings for some specific areas. Such evidence confirms the adequacy of resting-state functional methods to investigate and assess the progress of neurodegeneration and depression.
As previously discussed by Yu and colleagues, 73 whose results were included in the current analysis, the regions emerging from our analysis, thus showing significant convergence among studies, represent a putative shared pathophysiology among AD, MCI, and depression.111,112 Other studies found that depressive symptoms in AD had biochemical manifestations similar to depression, suggesting that they might share a common pathway at the biochemical level; this phenomenon may be the same in MCI.106,109,113–116
Resting state networks abnormalities in neurodegeneration and depression
The analysis of intrinsic fluctuations during resting state scans started to gain increasing attention in the study of both neurodegenerative disorders and depression, and it has been proposed as a valuable clinical biomarker for the pathophysiology and treatment response of depression and depressive subtypes in neurodegenerative disorders.117–121 Analyses of this type confirm functional and structural findings in describing the disorders’ course and allow for the understanding of it on a network, integrated level. As such, several resting state networks have been linked to both neurodegeneration and depression as well as to their co-occurrence.
Default mode network
The DMN is indeed the most discussed network in depressive neurodegeneration. Previous neuroimaging evidence argued for a differentiation of the DMN into anterior (aDMN) and posterior (pDMN) subnetworks. The former is related to self-referential thought, and the latter is related to episodic memory retrieval and scene construction.122,123 The aDMN mostly consists of the medial prefrontal cortex (mPFC), anterior cingulate cortex, anterior temporal lobe, and IFG, whereas the pDMN mostly includes the PCC, PCUN, angular gyrus, hippocampus, and temporal lobe.
Indeed, consistent evidence showed disruptions of the DMN in MCI, 124 AD,17,125 and depression. Furthermore, reduced connectivity between the hippocampus and the PCUN has been found in individuals with AD as an early sign of the disease. In fact, this impaired connectivity may occur before cortical atrophy. 126 Specifically, disrupted effective connectivity assessed using ICA and Granger causality was found among regions of the DMN, including PCC, PCUN, mPFC, inferior parietal cortex, medial temporal cortex of AD patients compared to healthy controls. 41 Other papers further confirmed the abnormal resting-state activity in areas like the right medial frontal cortex, right IFG, right postcentral gyrus, and left anterior cingulate using ALFF. 127 Similar findings were found in MCI, with previous evidence reporting aberrant connectivity in the pDMN, particularly in the PPC 128 ; however, a recent meta-analysis revealed relevant heterogeneous findings on the DMN disruption characterizing MCI, with the only strongest marker being the posterior cingulate reduced connectivity, thus indicating the high variability of the DMN connectivity in MCI and leading the authors to propose that DMN connectivity may yet to be considered as a sensitive biomarker in predicting the risk of conversion to AD. 129
On the other hand, major depressive disorder (MDD) has been associated with low-frequency oscillations in the left ventromedial PFC, left IFG, left precentral gyrus and the bilateral posterior cingulate and PCUN, 130 with depressive symptoms severity being positively correlated with low-frequency fALFF in the right anterior cingulate cortex as well as higher frequency fALFF in the left somatosensory region and right thalamus in unmedicated depression. 131
Crucially for our scope, successive evidence individuated abnormal resting state connectivity characterizing neurodegenerative depression, expressed as decreased ReHo in the right precentral, superior, and middle frontal gyri as well as the right inferior frontal cortex. 132 Similarly, abnormal ALFF values in the left IFG and left PCUN were found to differentiate ND-MCI from D-MCI effectively, 133 and to be correlated with emotional states, measured by the Geriatric Depression Scale, in PCC and PCUN in both MCI and AD. 134
In light of the variety of regions characterizing abnormal resting-state functional activity across the DMN, our analysis outlines a cortico-thalamic link between the thalamus the mSFG, IFG, and MTG as a signature of DMN involvement that characterizes depressive comorbidity in neurodegeneration, although we did not find convergence between the two resting state networks atlases in defining the location of the three regions.
Executive central network
The ECN is often considered complementary to the DMN, being a task-positive network underlying cognitive control and executive functions. 135 Indeed, clinical features of depressive symptoms have been associated with the hyperactivity of the DMN as opposed to the hypoactivity of the ECN found in LLD patients. Specifically, the first is linked to increased rumination and defective cognition, while the second is associated with low cognitive control, influencing emotional response.136,137 Interestingly, previous evidence found the superior parietal lobule to show decreased functional connectivity, like most areas of the DMN and the ECN, while the inferior parietal lobule was the only node of the ECN to show increased positive functional connectivity in LLD patients compared to controls. 138 On the other hand, functional connectivity reduction within the ECN has been linked to selective functional abnormalities in early-onset AD.139–142 Across the ECN, our results demonstrate consistent convergence in the right parietal lobe, both in the SPG and IPG. These regions have been found to differentiate amnesic MCI as well as early stages of AD 143 and, in light of our results are likely to be also crucial in the pathophysiology of depressive neurodegeneration.
Salience network
The SN is closely related to the DMN and ECN, since it is argued to act as a neural switch between these two. Coherently, the SN was found to be involved in interoceptive awareness and emotional experiences. 54 Indeed, disrupted connectivity within this network, specifically related to the insular region, has been detected in MDD, possibly indicating disease severity.55,144 In line with the present results, decreased functional connectivity in the right dlPFC has been found as one of the main characteristics of SN disruption in LLD compared to controls. 138 Indeed, the evidence demonstrated the involvement of the SN in Parkinson's disease with depression,145,146 suggesting an increased vulnerability of overlapping cortico-limbic regions involved in major depression and PD, explaining the prevalence of depressive symptomatology in PD. 147 Analogously, prefrontal-limbic connectivity, like the one we found characterizing SN, has been also proposed as a possible disease biomarker in depressed AD patients. 68
Sensorimotor network
The ALE results revealed only one cluster of overlapping intrinsic functional activation belonging to the SMN, namely the posterior insular region, extending in the Heschl's gyrus. The insular cortex has been shown to comprise different subsystems, with the pINS being functionally connected to the primary and secondary motor and somatosensory cortex, closely resembling the bilateral SMN. 148
Analogous to the relationship between the DMN and ECN, it has been proposed that the topographical balance between the DMN and the SMN significantly increased in depression and was positively correlated with depressive symptomatology. 149 Similarly, the evidence demonstrated how MDD patients suffer from sensorimotor abnormalities manifested as psychomotor agitation or retardation. 150 Indeed, previous studies identified the SMN as a common intrinsic network between neurodegeneration and depression. 151 Specifically, Chen and colleagues 152 went on to propose that the SMN is particularly crucial in defining the pathophysiology of amnesic MCI (aMCI), identifying the SMN as a crossroad between remissive LLD and aMCI, pointing toward a central role of the SMN disconnection in linking LLD and MCI to AD. Specifically, the SMN has been proposed to reflect the dysregulation of emotion processing in D-MCI patients, which is one of the main pathophysiological factors in D-MCI. 72
Visual network
Lastly, alteration related to the visual network (VN) has been associated with cognitive decline and visual impairments, often occurring in dementia; 153 indeed, changes in the visual system were also proposed as early indicators of cognitive decline154,155 and MCI. 156 For example, VN alterations are associated with specific visual symptoms in AD 157 and decreased connectivity within the VN has been correlated with visual attention and memory-related deficits, 158 leading to the proposal that dynamic properties of the VN may be altered in both AD and MCI. 159
Our results show only one region belonging to the VN, located in the ventral-most portion of the parieto-occipital sulcus, possibly in the vicinity of the recently defined area prostriata,86,87 not present in the two atlases we used. Interestingly, although area prostriata has been defined based on its selectivity for eccentric vision, it has been argued that focal lesions in this region include deficits in affective behaviors, typically associated with limbic functions. 160 Thus, the present results may prompt future research in disentangling the contribution of this area in neurodegeneration, depression, and, most importantly, their comorbidity.
Inter-network alterations
Beyond the analysis of intra-network alterations, research has been moving towards the analysis of between-network connectivity to characterize neurodegeneration and depression accurately; as it may serve as a reliable biomarker for the early detection of AD, linking such inter-network differences to reduced specificity of neuronal responses or compensatory mechanisms. 89 For example, research concentrated on the interplay between DMN, ECN, and SN, referred to as the triple-network, finding alterations in their dynamic connectivity related to both MCI and AD161,162 as well as LLD.48,138 Liang and colleagues 163 observed restored effective connectivity between the DMN and ECN after rTMS treatment on the PCUN, reflecting cognitive improvement in preclinical AD patients. On the other hand, using a co-activation pattern (CAP) approach, which individuates patterns of repeated co-activation or deactivation of different brain regions, allowed for the characterization of inter-network differences outside the triple-network, for example finding significant CAP alterations between the DMN and VN and FPN in both MCI and AD,159,164 supporting the view that AD is characterized by a widespread loss of RSN integrity throughout the brain, occurring in a particular spatio-temporal sequence. 165
In this vein, Sha and colleagues 92 conducted a meta-connectomic analysis to disclose the functional networks commonly active across 11 disorders, including AD, MCI, and MDD. Specifically, they argue that disruptive network connectors, may considerably impact information coordination flow across functional modules and they go on discussing their results in light of the “radar-like” cortico-subcortical dysfunction model, for which cortical connectors communicate with subcortical modules in a “radar-like” manner, in networks identified as cortical-basal ganglia-thalamic circuits. 166 Indeed, when disorders target cortical connectors, subcortical nodes serve as receptors of the “radar”, resulting in overall decreased efficiency of inter-modular information transfer, leading to compensatory mechanisms of the unaffected connectors. Following this hypothesis, compensation would eventually break down in later stages of the disease, resulting in clinical deficits. Our results describe a diffuse involvement of cortical regions, left putamen in the basal ganglia, and the left portion of the posterior thalamus; reflecting the cortico-basal ganglia-thalamic disruptive architecture described above, possibly indicating that the proposed relationship between subcortical hub pathology and neurodegeneration also characterizes depressive AD and MCI. Because of this, the regions highlighted by our analysis may serve as a basis for future studies to test depressive comorbidity following this framework and highlight vulnerable nodes possibly constituting markers of disease progression.
Clinical relevance
Several studies demonstrate the critical involvement of the regions that emerged in the current study in response to different types of therapeutic interventions. Indeed, activity in the mPFC during memory encoding was found to be positively correlated with symptomatic improvements in depression following citalopram treatment. 167 Similarly, the same region was found to be involved in normalization of brain activity patterns following antidepressant treatment, underlining its role in emotional processing and treatment response. 168 These findings are in line with the proposed involvement of the DMN, in response to pharmacological therapies in MDD. Indeed, regions such as the left MTG and PCUN, together with other regions of the posterior DMN like the supramarginal and right angular gyri, exhibit significant correlations with clinical responses of MDD patients following medication. 169 Conversely, frontal dysfunction normalizes after pharmacological treatment170–172 and intrinsic functional connectivity of multiple frontal regions, including the right dorsolateral and dorsomedial PFCs, predict treatment response after electroconvulsive therapy. 173
Similarly, the same regions are responsible for improvements in several cognitive tasks following neurostimulation in AD and MCI patients. Recently, Lanni and colleagues 174 reviewed the effectiveness of different non-invasive stimulation treatments in improving AD patients’ cognitive performance. Indeed, they report how rTMS treatment, of varying frequencies and treatment duration, leads to significant improvements in a variety of both cognitive tasks and neuropsychological tests (e.g., Trail Making Test, Mini-Mental State Examination (MMSE), object naming, auditory learning, Alzheimer's Disease Assessment Scale-Cognitive Subscale) when applied to regions including the IFG, 175 posterior temporal and parietal cortices, 176 and dlPFC.177–182 Furthermore, atDCS applied to the left temporal cortex improved memory performance of patients with mild neurocognitive disorder due to AD, 183 and tACS gamma band stimulation over the dorsolateral and dorsomedial PFCs partially improved cognitive performance in MCI patients; interestingly, the 2-year-follow-up demonstrated that the MCI patients for which the treatment was ineffective eventually converted to AD. 184
Taken together, the partial overlap between regions sensitive to treatment for both depression and MCI/AD and the nodes that characterize depressive comorbidity in neurodegeneration highlighted in this paper support the potential clinical significance of these regions. This convergence suggests that the regions identified in our analysis should be further investigated as potential biomarkers or therapeutic targets for treatment. Given the advanced state of research on biomarkers for MCI and AD, but the relative lack of equally effective treatment options, further exploration of resting-state networks involvement could provide valuable insight into therapeutic strategies, particularly when cognitive decline is accompanied by depression. Examining these networks may offer a more comprehensive approach to both diagnosis and intervention, potentially guiding the development of targeted treatments for patients with overlapping neuropsychiatric and neurodegenerative conditions.
Limitations and future perspectives
The current study is not free of limitations. The ALE analysis only yields clusters of significant spatial convergence; therefore, no conclusions can be drawn on nodes’ activity direction. Indeed, the discussion on networks’ hypo- and hyper-activity is carried out solely based on the conclusions of previous findings, although disruption within cortical-subcortical crosstalk among disorders has been linked to abnormal network connectors, regardless of lower or higher activity patterns. 92
Moreover, the choice of including contrasts resulting from different whole-brain resting-state methodologies could be seen as a limitation. However, given the balanced collection of resting-state methodologies, the current results reflect converging evidence independently of the specific resting-state analyses employed by the single studies. Indeed, although the different methodologies considered here represent both global and local spontaneous fluctuations, most of the included studies employed ReHo and ALFF methodologies which reflect local neural activity alterations. Therefore, despite our conclusions on the involvement of significantly overlapping foci in wide-scale resting-state networks is based on meta-analytic evidence, future studies including more global measures could yield more solid results on the wide-ranging network alterations reflecting depressive comorbidity.
One important consideration to be made is about the samples of the included studies. Specifically, some of the records originate from the same research groups; as such, there is a chance that participants across different publications of the same research group might be partially overlapping. Outside the two pairs of studies (Guo et al., 2017-Liu et al., 2017 and Liu et al., 2018–2019) each presenting perfect sample overlap, and that were dealt with accordingly as explained earlier, we could not explicitly determine the extent to which the samples partially overlapped across the other ones. However, integrating future contributions on this topic will increase the generalizability and overall reliability of our findings. About this, the analysis was conducted on 17 contrasts, which is the minimum number of experiments needed to control for the excessive contribution of single experiments to the significant clusters, and to ensure an acceptable statistical power. 79 Specifically, analyses with this experiments’ sample size are argued to only yield trivial effects. While future analyses that include a higher number of experiments may return novel clusters of significant overlap, the current results still yield 10 significant clusters across the two hemispheres. They can, therefore, be considered as the core nodes involved in depressive comorbidity in neurodegeneration.
As such, future research on this topic will benefit from considering the between-network patterns outlined in our meta-analysis, for both diagnostic and therapeutic applications. Specifically, recent applications of network decomposition using machine learning and deep learning on large-scale network patterns confirmed the diffused between-network interplay across RSN associated with cognitive impairments; opening the perspective to predict cognitive performance and conversion from AD to MCI.185–189 In light of these advancements, future studies may benefit from the current results and consider the nodes and networks described here as a reference in supporting early diagnosis as well as targets for non-invasive brain stimulation treatment.163,190
Conclusion
This study is the first to define the main functional abnormalities characterizing depressive comorbidity in MCI and AD and to assess the differential involvement of the main intrinsic resting state networks using an ALE meta-analysis. By including regions emerging from functional studies that compared resting state scans between AD and MCI patients with and without clinically assessed depressive comorbidity, we defined 10 clusters of significant convergence belonging to the 5 major resting state networks and distributed in both hemispheres. Specifically, overlapping regions were diffused across cortical regions, the putamen, and the left thalamus, suggesting that disruptive information flow in cortico-basal ganglia-thalamic circuits may describe depressive comorbidity in neurodegeneration, confirming previous accounts. Taken together, our results contribute to a better understanding geared towards more accurate diagnosis, based not only on symptomatic but also neurophysiological differences, promoting early diagnosis through methods employing decoding of large scale-between-network patterns. Understanding the neural differences between these conditions could help develop targeted, personalized therapies, like non-invasive brain stimulation, improving patients’ and families’ quality of life.
Footnotes
Author contributions
Alessandro von Gal: Conceptualization, Data curation, Formal analysis, Methodology, Supervision, Visualization, Writing – original draft, Writing – review & editing. Dario Papa: Conceptualization, Data curation, Investigation, Visualization, Writing – original draft, Writing – review & editing. Marco D’Auria: Data curation, Investigation, Writing – review & editing. Laura Piccardi: Conceptualization, Supervision, Writing – review & editing.
Funding
The present research was funded by the Ateneo Grant 2022 (ref. RG1221816BE8DDFE) from Sapienza University of Rome.
Declaration of conflicting interests
The authors declared no potential conflicts of interest with respect to the research, authorship, and/or publication of this article.