
Abstract
Background
Recent studies have explored optical coherence tomography (OCT) and OCT-angiography (OCT-A) as biomarkers for Alzheimer's disease (AD). However, correlations between OCT/OCT-A and neurodegeneration metrics remain underexplored.
Objective
We performed a systematic review of OCT/OCT-A and structural brain imaging using MRI across various neurodegenerative disorders.
Methods
We searched Medline, Embase, and various other databases from January to June 2023 using keywords regarding neurodegenerative conditions and OCT/OCT-A. Out of 2962 citations. 93 articles were reviewed, and 28 met our inclusion criteria.
Results
Layer-or-region-specific retinal metrics were the most promising for non-vascular neurodegeneration, while vascular retinal parameters had the unique capacity to reflect vascular lesions. Both types of biomarkers correlated with global brain atrophy. Microstructural brain alterations best correlated with layer-specific thinning of retina.
Conclusions
A better understanding of associations between retinal and brain lesions could eventually lead to the clinical application of retinal biomarkers for the early diagnosis of neurodegenerative conditions.
Keywords
Introduction
According to recent estimations, 47 million people worldwide live with dementia. This number is expected to raise up to 131 million by 2050. 1 Dementia is therefore one of the most threatening global health issues with heavy burden on health care systems.
Accurately diagnosing neurodegenerative disorders remains arduous, since these diseases have complex overlaps with genetic, pathologic, anatomic, and clinical factors. For example, the language variant of AD (logopenic variant of primary progressive aphasia) has a distinct clinical portrait compared to the classic amnestic variant of AD. Yet, the underlying pathology of both conditions is amyloidosis. 2 Meanwhile, frontotemporal dementia shares similar symptoms with AD but is caused by tau, TDP43, or FUS protein aggregations. 3
Given the heterogeneous nature of neurodegenerative disorders, in order to enhance the clinical diagnostic confidence, multiple biomarkers, either genetic, imaging or fluid-based, have been introduced. As research on AD and other forms of dementia progresses into the dawn of new treatments,4–6 whether it is to reinforce the reliability of diagnosis, or to better perform presymptomatic screening or treatment monitoring, development of efficient biomarkers become increasingly critical. 7
Current biomarkers for dementing conditions are suboptimal. Genetic testing fails to detect sporadic forms of dementia which account for the vast majority of cases. 8 Magnetic resonance imaging (MRI) is highly sensitive to neurodegeneration, but not specific to the underlying etiology. 9 Fluorodeoxyglucose positron emission tomography (FDG-PET) is more of an indication of regional hypometabolism than the disease process. 10 Aβ-PET scan visualizes the presence of amyloid, yet it is expensive and less accessible. Finally, cerebrospinal fluid (CSF) analysis is invasive and contraindicated for certain patients. More recently, the development of blood-based biomarkers for AD yields encouraging results: markers such as plasma Aβ42/Aβ40, T-tau, and P-tau 181 have been shown to have good performance differentiating disease status (e.g., differentiate amnestic mild cognitive impairment (MCI) versus AD).11,12 Nonetheless, due to the impermeability of blood-brain barrier, an important limitation of blood-based markers is their relatively low concentrations in the blood. 13 Thus, there is continuing necessity for the development of new, accessible, non-invasive, and cost-effective biomarkers.
From a developmental standpoint, the retina and the central nervous system (CNS) both originate from the diencephalon. 14 Due to their similar histological and functional properties, retinal tissues are affected by CNS pathologies in very similar ways.15,16 Consequently, in the last thirty years, there was an increasing trend of research examining the potential of retinal imaging in the early diagnosis of neurodegenerative conditions, especially following the arrival of optical coherent tomography (OCT). 17
Developed in 1991, 18 OCT is now a broadly used tool in ophthalmology. Using retroreflected light, OCT characterizes different layers of the retina with micrometric resolution. Sectioning the retina into thin cross-sectional layers offers the possibility to precisely visualize retinal structural changes. 19 OCT-angiography (OCT-A) is a recent technique coupled to the OCT system and has multiple advantages compared to traditional retinal angiography (fluorescein angiography). OCT-A allows for high-resolution imaging of retinal microcirculation, without requiring contrast injection. 20 The non-invasive nature and high resolution of OCT-A make it an ideal imaging modality for retinal vascular diseases. 21
Combining the observation that retina is the extension of CNS with the fact that OCT is a modality of choice for studying retinal structures, numerous studies have examined the utility of OCT and OCT-A in neurodegenerative diseases. Among studies applying OCT to AD, the most observed retinal changes are the thinning of retinal nerve fiber layer (RNFL), macular thickness, and ganglion cell–inner plexiform layer (GC-IPL). 20 Studies applying OCT to other neurodegenerative diseases are less in number, yet they provided significant contributions to the field by identifying, for example, RNFL thinning in Parkinson's disease (PD) 22 and total macular volume decrease in progressive supranuclear palsy (PSP). 23 The development of OCT-A as a dementia biomarker is more recent, thus the available literature is less abundant. Frequently reported OCT-A measurements in AD, compared to healthy controls, include decreased retinal vessel density 24 and structural alterations of retinal vessels such as changes in vessel caliber and increased vessel tortuosity. 15 OCT-A studies also reported microvascular alterations in other neurodegenerative diseases such as PD 25 and Lewy body dementia (LBD), 26 the main finding being decreased retinal perfusion density in both conditions.
In comparison to the increasing number of studies on the OCT manifestations of various neurodegenerative diseases, only a few studies focused on the correlations between OCT-/OCT-A and neuroimaging findings in neurodegeneration. 27 Even among studies which reported correlations between retinal and MRI findings, it is difficult to draw clear conclusions, since these studies yield highly heterogeneous results. 28 In order to provide a more reliable reference for future studies, there is a growing need for a global portrait of the current knowledge in these brain-eye correlations. Here, we present a systematic review of the correlations between OCT/OCT-A and structural neuroimaging findings in neurodegenerative diseases associated with cognitive decline.
Methods
Eligibility criteria
Studies were included in this review if they collected both OCT/OCT-A and brain MRI data in individuals diagnosed with neurodegenerative conditions associated with cognitive decline. More specifically, studies had to meet the following criteria:
be an original study; must report on older adult human participants (defined as individuals of 65 years of age and older for at least 80% of the study population) with a clinical diagnosis of one of the following neurodegenerative conditions associated with cognitive decline: sporadic AD and its variants, vascular cognitive impairment and vascular dementia, LBD, and frontotemporal lobar degeneration (including corticobasal syndrome, PSP, behavioral variant frontotemporal dementia, and primary progressive aphasias (PPA)); study populations of either or both early stage (MCI) and late stage (dementia) cognitive decline; must report data from OCT and/or OCT-A and or fundus photography; must report structural MRI data, including various structural MRI techniques such as diffusion tensor imaging (DTI); MRI data must be of clinical resolution (1.5 T to 3 T; 7 T MRI data were not considered); OCT, OCT-A, and MRI data must have been acquired in vivo; relying on either clinical or pathological (postmortem) diagnosis of the dementing neurodegenerative disease.
All animal studies and studies presenting only functional MRI (fMRI) data were excluded.
We decided to not include fMRI for two reasons. First, the literature on correlations between OCT data and fMRI in neurocognitive diseases is lacking. Second, most hypothesized mechanisms of degeneration underlying retina-brain correlations are tissular atrophy mechanisms (e.g., amyloid-induced degeneration). Although functional changes (hypometabolism) usually follow tissular degeneration, there are more theoretical explanations and evidence to support a focus on anatomical brain changes. Furthermore, we would exceptionally include retinal findings from fundus photography for the following reasons. Unlike OCT, OCT-A is a newly introduced technology. Due to the lack of consensual guidelines, standardized interpretation of OCT-A results remains a considerable challenge even among ophthalmologists. Fundus photography has considerable advantages when it comes to capturing findings such as retinal microhemorrhages, which are less visible on OCT-A. Fundus photography also provides a wider field of view of the retina than OCT-A. 29 Thus, as summarized by Midena et al., 30 OCT-A and fundus should be considered as complementary techniques.
Search strategy
Our search strategy was developed with the support of a health information specialist (F.B.). A general free vocabulary strategy was developed based on articles of interest and expert opinion of researchers and physicians working in a dementia-related field. This strategy was applied to each selected database, including Medline, Embase, CINAHL Plus, PsycINFO, Cochrane Controlled Register of Trials (CENTRAL) and Web of Science. In addition, for each database, a unique search strategy adapted to the specific indexing method of that database was used. Gray literature was searched using International Clinical Trials Registry Platform and ClinicalTrials.gov, as well as the search engines Google and Google Scholar. As a final verification, a screening of the reference lists of eligible articles was performed to ensure that all relevant literature was considered. All searches were realized between January 4, 2023, and June 30, 2023.
Study selection and data extraction
Literature search results were uploaded to the online Covidence Software, in which duplicates were automatically detected and removed. All reviewers (F.W., C.D.T., E.M.) performed the screening simultaneously. For each citation, two of the three reviewers assessed its eligibility independently. Disagreements were resolved through discussion. Data extraction was performed as per a preestablished list of data items and outcomes. Extracted data included information on the study (authors, year of publication, journal, institution, funding source, country, setting, study design, objectives, hypotheses, populations, and controls), participant characteristics (sample size, mean age and standard deviation, sex, cognitive status, education, ethnic group and socioeconomic status if available), OCT/OCT-A imaging characteristics (manufacturer, parameters, and algorithms if applicable), MRI imaging characteristics (manufacturer, field strength, sequences, and scales if applicable), and OCT-MRI correlations.
Outcomes
The main outcomes were the correlations between: (1) changes on imaging patterns of structural MRI [brain volume loss (global brain volume OR ventricle enlargement OR atrophy in targeted regions of interest), white matter hyperintensities (WMH), microstructural alterations (white matter diffusivity OR anisotropy), or any other reported structural alterations on MRI deemed relevant by reviewers], compared to a control group or normative data;
Risk of bias assessment
Unlike widely recognized methods (e.g., Cochrane Risk of Bias Tool) that exist to evaluate the quality of evidence for randomized controlled trials, few tools are available for the assessment of risk of bias in individual transversal studies which account for most of studies targeted by our review. Here, we chose the Joanna Briggs Institute (JBI) Critical Appraisal Checklist For Analytical Cross-Sectional Study (last amended in 2017).31,32 This tool appraises the quality of individual transversal study, although it does not allow specific assessment of their risk of bias. Two of the three reviewers performed the assessment independently (either F.W., C.D.T., or E.M.). Disagreements were resolved by discussion.
Data synthesis
We performed a systematic qualitative and semi-quantitative synthesis. The characteristics and the extracted outcomes of included studies were presented in the text and tables. Due to substantial heterogeneity of methodology and results among studies, meta-analysis, and assessment of confidence in cumulative evidence were not performed.
Results
Characteristics of included studies
Our search yielded 3960 results. After removing 998 duplicates, we excluded 2869 studies during screening process. Full-text assessment resulted in exclusion of 65 additional studies. In total, 28 studies published between 2015 and 2023 were included in this review (Figure 1 and Supplemental Table 1).
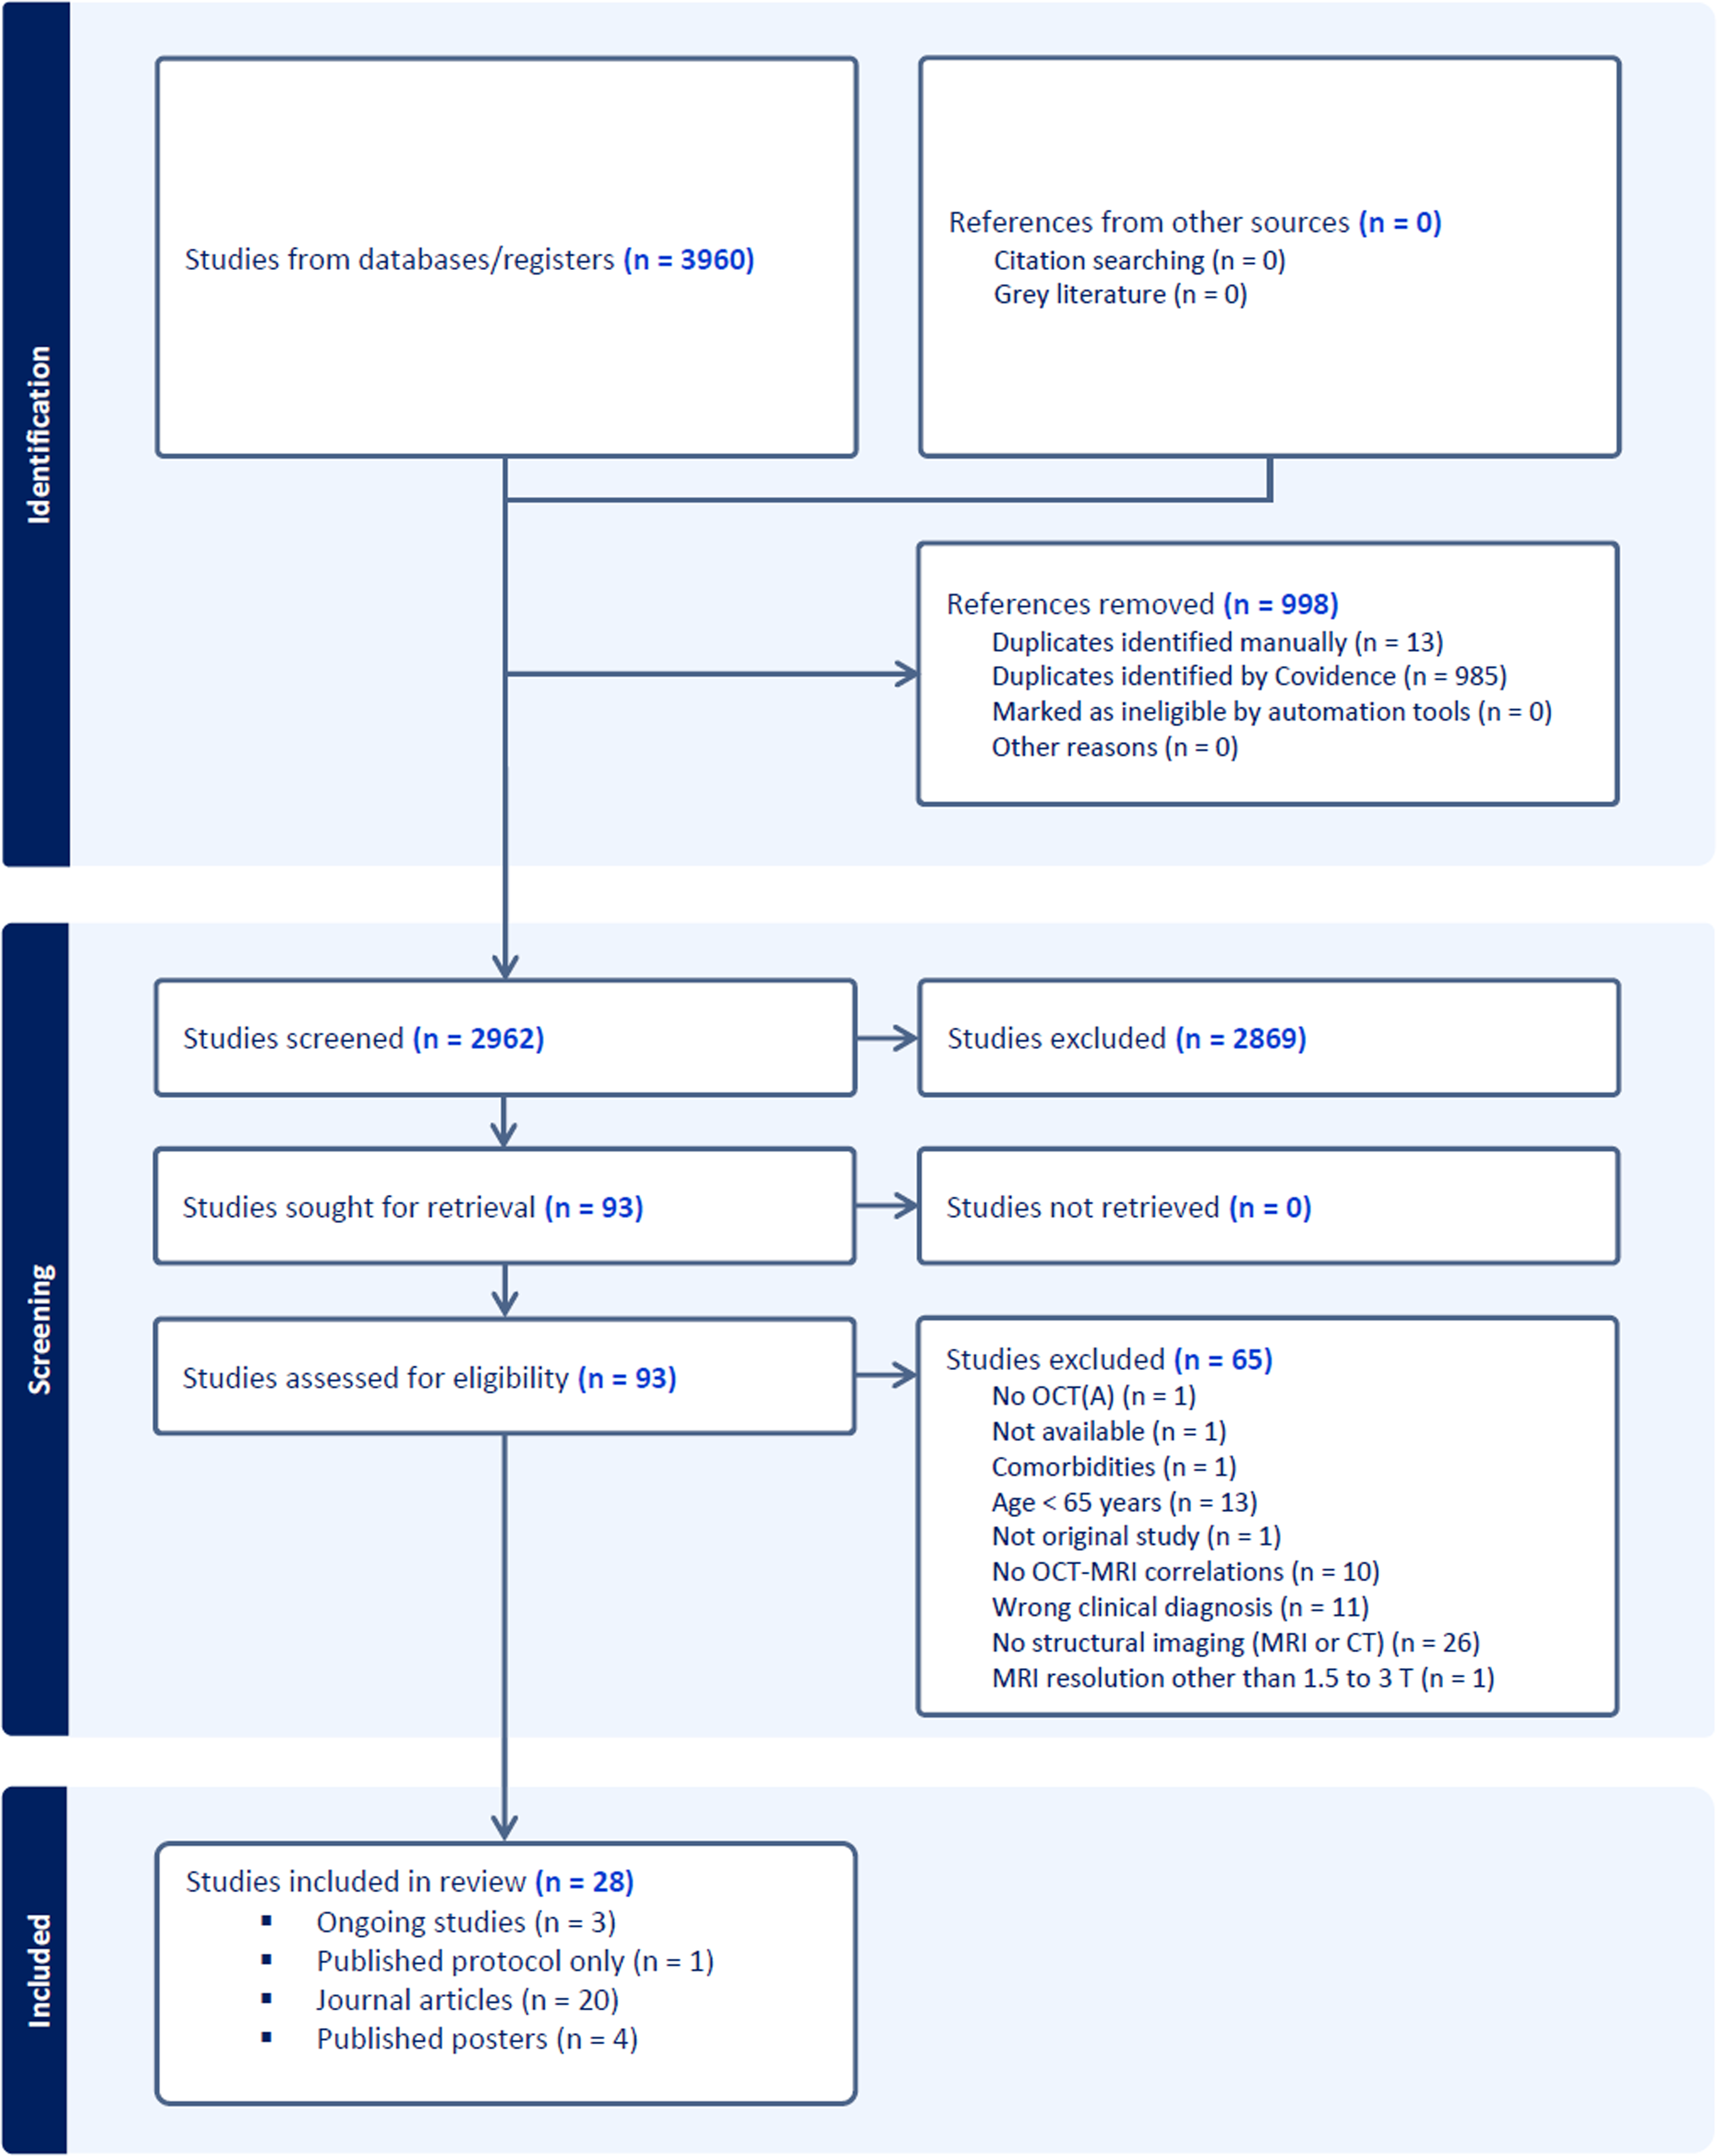
PRISMA flow diagram representing different phases of this systematic review (automatically generated by Covidence).
All included studies were published in English. Eleven of the twenty-eight studies were conducted in the US,33–43 four in China,44–47 three in Germany,48–50 three in Singapore,51–53 two in Korea,54,55 one in Belgium, 56 one in Canada, 57 one in the Netherlands, 58 one in Portugal 59 and one in Spain. 27 Among included studies, one is a published protocol 42 and three are ongoing studies without published results.43,56,57 Four of the remaining twenty-four studies are published posters, the twenty others being journal articles (Figure 1). Among these twenty articles, two did not report any significant correlations (Supplemental Table 1).47,55 Results from four published posters were also included.35,38,45,59 Twenty-three of the twenty-four studies with published results are cross-sectional. The only exception 39 is a clinical trial from which we extracted data from baseline for all participants and follow-up of the group receiving placebo. Given that the objective of this study is to provide a comprehensive overview of the existing knowledge in this exploratory field, we made the decision to include ongoing studies with forthcoming results, research protocols, and published posters.
In terms of enrolled participants, all studies except one 36 had a defined cohort of healthy subjects as control group. The most commonly reported diagnoses were AD and MCI related to AD,27,38,39,41,44–47,49,50,53,58,59 followed by vascular dementias33–36 and other etiologies (FTD, LBD, PSP, PPA, Creutzfeldt-Jakob disease).33,37,55 Multiple studies include more than one type of dementia.37,51,52 By excluding the clinical trial, the total sample size (sum of the n of all subgroups) of the twenty-three included studies varies between 23 and 538, with a median n of 60 participants. Since each study defines their subgroups in a slightly different manner, please refer to Supplemental Table 1 for additional information.
Nine of the twenty-four studies with published results reported OCT-A data.34–36,38,41,45,47,50,54 The models of OCT/OCT-A systems included spectral-domain OCT (the most commonly used nowadays), swept-source OCT (a newer generation of higher definition OCT), 60 time-domain OCT (a less performant older generation of OCT), and speckle-variance OCT (another type of OCT-A). The manufacturers of OCT/OCT-A were Heidelberg, Optovue, Carl Zeiss and Topcon. In one study, retinal bleeds were imaged by scanning laser ophthalmoscopy. 34 Fundus photography was used to perform retinal vascular imaging in one study. 51
MRI field strengths of 1.5 or 3.0 Tesla were used in most studies, while few of them did not mention explicitly their scanner resolution.27,33,37,38,45,58,59 The sequences used were T1, T2, FLAIR, proton density, gradient echo and diffusion-weighted. Diffusion metrics were reported by two studies.53,59 The manufacturers of MRI systems included Siemens, Philips and GE (Supplemental Table 1).
Most correlation parameters were either Pearson's r or Spearman's rank (Rs, or ρ), followed by unstandardized beta and standardized beta. Two studies presented correlations in a less common way: the variation of dependent variable (cortical layer thickness, rate ratios of pathological findings) by standard deviation increase/decrease of independent variable (retinal parameters).51,52 Two studies did not report the effect size data, yet the statistical significance was reached.53,59 For each correlation reported, we presented its statistical significance (p-value, Cohen's f2 for effect size, confidence interval) and the statistical correction the correlation survived, if this information was available (Supplemental Table 1).
Risk of bias assessment
The risk of bias assessment for each study was summarized in Supplemental Table 2. Most of included studies had clearly defined selection criteria, participants, objectives, valid measurement of outcomes, and appropriate statistical analyses. Since almost all these studies, except one, 39 were cross-sectional, the criteria for exposure was not applicable. Posters usually lacked detailed description of included participants, clear identification of confounding factors and detailed statistical tools to deal with these confounders. Nevertheless, due to the exploratory nature of this field, a consensus was made to include all the 28 studies while specifying that the study was a poster when applicable (Supplemental Table 1).
OCT-MRI correlation findings
OCT-MRI correlations will be presented in the following way. The first part presents MRI metrics which correlate with vascular retinal parameters. The second and third parts exhibit MRI findings correlating with non-vascular retinal parameters. While the second part focuses on different retinal layers, the third part focuses on two key regions of interest of the retina: the macula and the central subfield. For each layer of the retina, we briefly describe its anatomy and functions by referring to a cross-sectional diagram of retina (Figure 2). Unless stated otherwise, the correlations presented below are statistically significant.
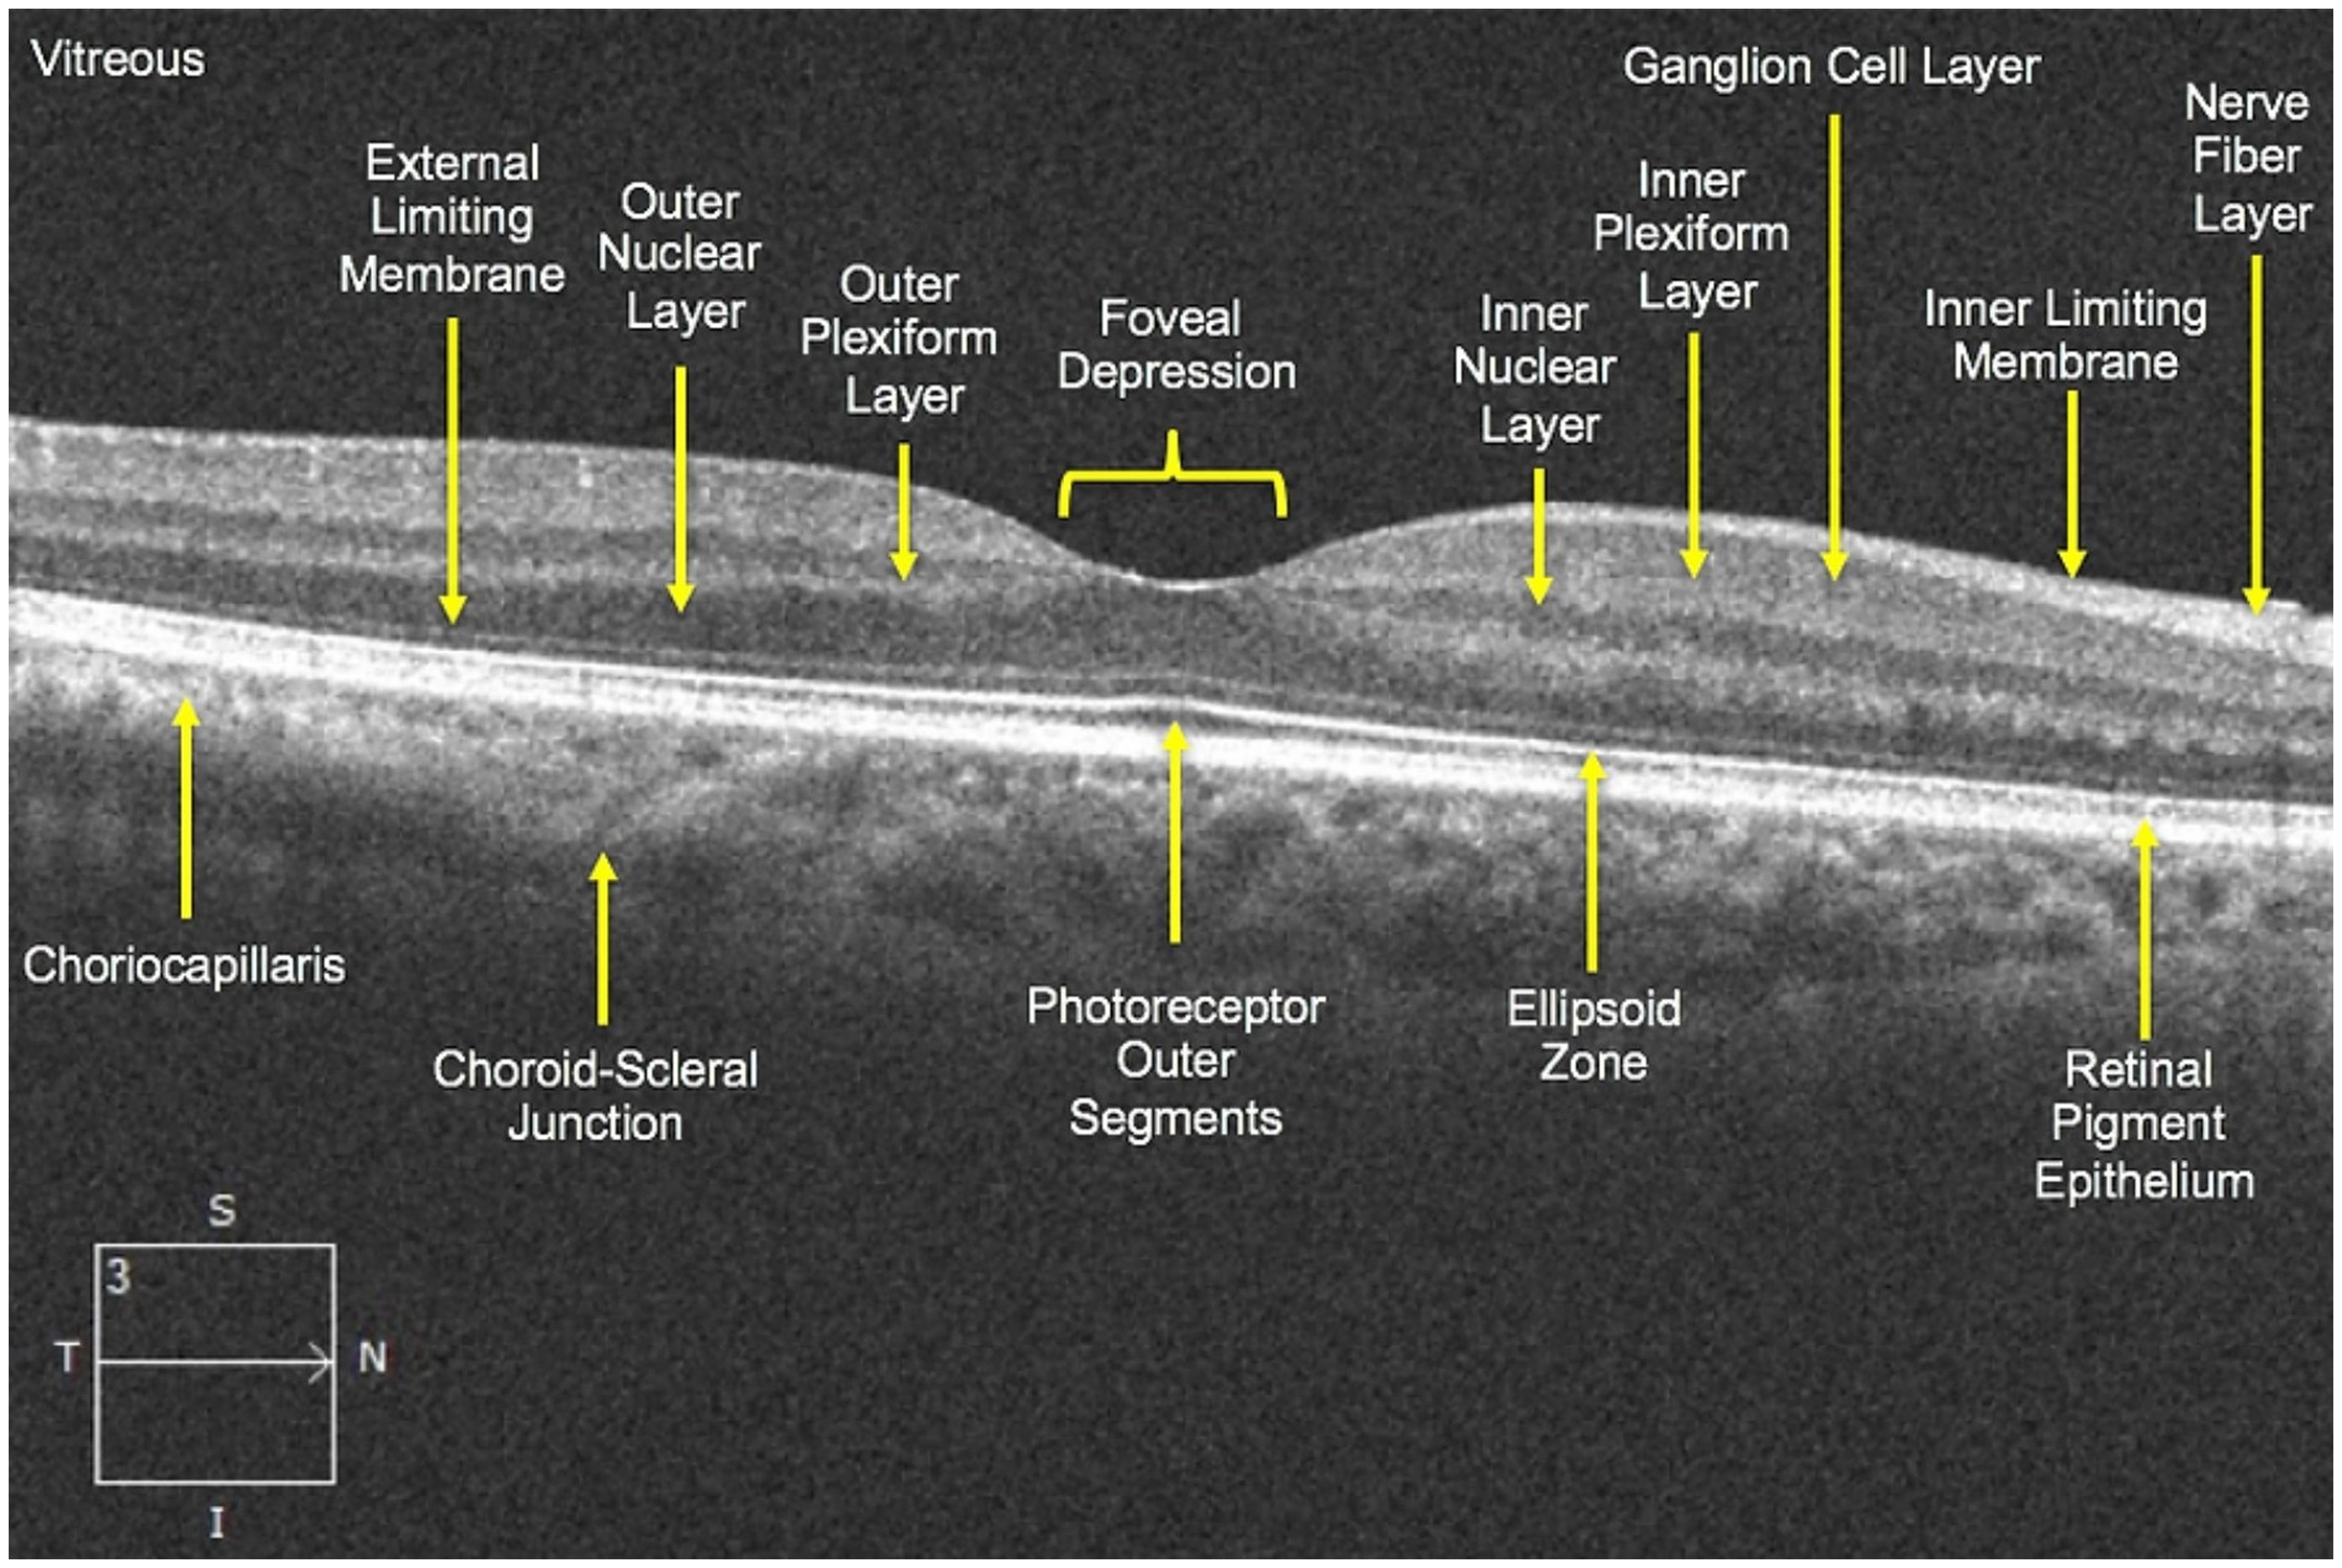
Schematic representation of retinal layers.
Vascular retinal parameters
Retinal capillary density and retinal perfusion density
Defined as the ratio of perfused skeletonized vessel length to the total area of an angiographic image, vessel skeleton density is considered as a fairly sensitive marker of retinal perfusion changes at the capillary level. 61 In a cohort Latinx participants, epidemiologically at higher risk of vascular cognitive impairment and dementia, Ashimatey et al. 36 described that vessel skeleton density of the superficial retinal vasculature is positively associated with cerebral perfusion and cerebrovascular reactivity, defined as the ability of the cerebral blood vessels to dilate and constrict. 62
In AD and amnestic MCI patients, Robbins et al. 38 reported that superficial retinal vessel and perfusion densities are negatively correlated with ventricular enlargement. These findings were corroborated by Yoon et al. 41 The latter showed that three parameters of the superficial retinal capillary plexus, the vessel density in a 6-mm circle, as well as both vessel and perfusion densities in a 3-mm ring, correlate negatively with the inferolateral ventricle volume. The 6-mm circle and 3-mm ring are regions of a standardized OCT-A grid, as defined by the Early Treatment Diabetic Retinopathy Study (ETDRS). 63 The grid being centered on the fovea, the 3-mm ring represents the closest region surrounding the fovea, and the 6-mm circle surrounds the 3-mm central region. Furthermore, Shen et al. 45 reported a negative association between macular capillary density and medial temporal atrophy score in AD patients.
Radial peripapillary capillary is a network of vessels located within the nerve fiber layer of retina, reflecting thus the neurovascular state of the retina. 64 In a mixed cohort of patients with AD-related and vascular cognitive impairment, Lee et al. 54 reported a negative correlation between retinal capillary density in the temporal quadrant of radial peripapillary capillary network and the volume of WMH in the brain. They also found that the radial peripapillary capillary density negatively correlated with the cerebral small vessel disease (CSVD) score, where a higher score indicates higher burden of lacunes, microbleeds or WMH. 65 Finally, Lahme et al. 50 described a negative association between macular blood flow density and Fazekas scale, a frequently used scale to quantify white matter lesions, or WMH, usually attributed to chronic small vessel ischemia.
It is also worth mentioning that Wang et al. 47 conducted a study on AD, MCI and healthy controls and found no significant correlations between retinal vascular density parameters and Fazekas's score (Supplemental Table 1).
Retinal vessels morphology (caliber, fractal dimension, tortuosity, wall-to-lumen ratio, mean wall thickness)
Hilal et al. 51 studied a mixed cohort composed of no cognitive impairment (NCI) controls, patients with cognitive impairment without dementia (CIND) and patients with dementia due to unspecified etiologies. They described four quantifiable morphologic parameters of retinal vessels positively correlated with cortical cerebral microinfarcts counts rate ratios: venular caliber, arteriolar fractal dimension, venular fractal dimension and venular tortuosity. These correlations survived correction for multiple confounders. Fractal dimension is a measurement of the branching pattern of retinal vasculature. Tortuosity measures how vessels are curled and twisted.
Abdelhak et al. 48 studied the wall-to-lumen ratio as a marker of cerebrovascular diseases. Wall-to-lumen ratio is calculated by dividing the mean wall thickness of the superior temporal branch of the retinal artery by the lumen diameter. Since the typical pathogenesis of most cerebrovascular diseases involves systemic hypertension, this chronically elevated pressure and vasoconstriction in retinal small vessels are believed to cause structural adaptations such as vascular wall thickening, lumen reduction, and in consequence increased wall-to-lumen ratio. Thus, the authors hypothesized that the wall-to-lumen ratio would increase in correlation with increased WMH burden in symptomatic and sporadic CSVD cases. However, the results showed a negative correlation between these two OCT and MRI metrics. Thus, a model of wall thinning (due hyalinosis, lipohyalinosis, and fibrinoid necrosis) in advanced CSVD has been proposed by the authors to explain these findings. 66 In another study conducted in a mixed cohort of CSVD and non-vascular neurodegenerative diseases, Abdelhak et al. 33 reported that retinal wall-to-lumen ratio is negatively correlated with white matter (WM) and gray matter (GM) volumes. Furthermore, mean wall thickness and wall-to-lumen ratio are both positively correlated with Fazekas scale, and with in-vivo arteriolosclerosis score (ARTS), a novel MRI based score for in-vivo arteriolosclerosis classification where a higher score indicates higher likelihood of arteriolosclerosis. 67
Retinal bleeds
In cerebral amyloid angiopathy (CAA) patients, Alber et al.34,35 reported positive associations between the number of retinal microbleeds and the WMH severity as per Fazekas score. Furthermore, retinal bleedings are associated with lobar microhemorrhages quantified radiologically from MRI scans.
Non-vascular retinal parameters: retinal layers
RNFL thickness
RNFL is a layer of axons of retinal ganglion cells (Figure 2). The coalescence of these axons form the optic nerve which then projects to the brain. 68 In AD patients, Sergott et al. 39 reported positive correlations between the mean macular grid RNFL thickness of both eyes and the following neuroimaging parameters: the whole brain volume, the total hippocampal volume, and the thalamic volume. Also, they found a positive relationship between mean macular grid RNFL thickness of the right eye and the Mayo cortical thickness index, 69 as defined by a group of radiologists and neurologists at Mayo Clinic in 2015. 70 The macular grid is a circular OCT diagram separating the macular region into nine standard subfields of the ETDRS grid (center, inner superior, inner temporal, inner inferior, inner nasal, outer superior, outer temporal, outer inferior and outer nasal). 63 Additionally, Ong et al. 52 reported significant thinning of RFNL layers associated with decreased thickness of different GM and WM parameters (Supplemental Table 1). The correlation between RNFL thickness and temporal GM volume survived multivariate adjustment.
Among studies which focused on the hippocampal regions, Zhao et al. 46 reported positive correlation between the macular RNFL thickness and the hippocampal volumes in AD and MCI patients. Donix et al. 49 also reported positive correlations between retinal regions and the hippocampal thickness parameters. Similar results were found by Galvin et al. 37 in both patients with MCI and dementia due to different etiologies and a sub-cohort of AD-related dementia.
From the cerebrovascular perspective, in an AD cohort, Carazo-Barrios et al. 27 showed that the RNFL thickness in the temporal quadrant of the left eye is significantly and negatively correlated with the number of WM lesions in the occipital lobes. Nonetheless, this correlation appears to be only trend-level for the right eye. This study is the only included study reporting significant inverse relationship between RNFL thickness and WMH.
Among studies included in this study, one reported trend-level correlations between peripapillary RNFL thickness and volumetric MRI parameters. Nevertheless, these results are not statistically significant. 55
GC-IPL thickness
GC-IPL thickness represents the total measure of ganglion cell layer (GC) and IPL (inner plexiform layer) thicknesses (Figure 2). The GC consists of cell bodies of neurons whose axons project to the brain. These projecting nerves form the RNFL layer. The IPL is mainly composed of interneurons. 71
Ong et al. 52 reported positive correlations between GC-IPL thickness and brain volumes. Among these associations, the correlations between GC-IPL thickness and occipital GM volume, temporal GM plus WM volume, and temporal GM volume survived multivariate adjustments. In the two cohorts previously described, Galvin et al. 37 reported positive correlations between the GC-IPL thickness, and the hippocampal volume, as well as the hippocampal occupancy score. Interestingly, Castelo-Branco et al. 59 reported a positive significant correlation between IPL thickness and cortical thickness in V1 region (primary visual cortex) of the brain in a cohort of AD patients. However, the effect size data was not available.
In the previously described study by Hilal et al., 51 the authors reported inverse correlations between GC-IPL thickness and cortical microinfarcts counts rate ratios, suggesting a link between GC-IPL integrity and cerebrovascular lesions. These correlations survived multivariate adjustments.
In a cohort of NCI participants, Siwei et al. 53 reported associations between retinal parameters and WM microstructure in the brain using DTI. In frontal, parietal, frontal-occipital and cingulum regions, they reported that thinner GC-IPL layer thickness is associated with lower fractional anisotropy and higher mean diffusivity, a sign that could represent loss of myelin in AD. 72 Nevertheless, all these significant correlations do not have effect size data (Supplemental Table 1). It is worth noting that their study found no significant correlations in AD and CIND patients.
Inner nuclear layer thickness
The INL consists of three types of retinal interneurons: amacrine, bipolar and horizontal cells (Figure 2). In the previously described study by Castelo-Branco et al., 59 they reported a positive correlation, without effect size data presented, between INL thickness and fractional anisotropy in participants with AD.
Ellipsoid zone – retinal pigmental epithelium volume
EZ-RPE represents a layer, mainly composed of photoreceptors, enclosed between the ellipsoid zone and the interdigitation zone of the retina (Figure 2). In other words, EZ-RPE could be interpreted as a biomarker for photoreceptors integrity. Uchida et al. 40 conducted a study over four different cohorts: healthy controls, AD, PD and one mixed cohort combining the previous three. They reported positives correlations between EZ-RPE volume and mean total brain volume in all cohorts.
Choroidal thickness
The choroid's main function is to provide oxygen to the outer retina up to the level of the inner membrane (Figure 2). 73 In a cohort of AD patients and HC, Li et al. 44 reported positive correlations between the subfoveal choroidal thickness (the region of retina with the highest density of cones, located beneath the fovea) and the adjusted left, right and total hippocampal volumes. Given that choroid encompasses various anatomical structures which are not solely vessels (e.g., Bruch's membrane), and that the choroid thickness is calculated using OCT scans, we classified choroidal thickness as a non-vascular parameter.
Non-vascular retinal parameters: retinal regions
Macular region
Macular volume and thickness are important parameters of interest in OCT studies applied to neurodegenerative diseases. 20 In patients with MCI, dementia due to all etiologies, and healthy controls, Galvin et al. 37 reported significant positive correlations between the hippocampal volume and both macular volume and macular thickness. In early-onset and late-onset AD participants, Haan et al. 58 reported significant negative correlations between the perifoveal macular thickness, and both parietal cortical atrophy and global cortical atrophy, two MRI rating scores of brain parenchymal volume loss where a higher score means more severe atrophy. 74 These findings remain significant after stratifying for AD subtypes.
Central subfield thickness
The central subfield is the central region of the macula. Sergott et al. 39 reported positive correlations between the mean central subfield thickness and five brain volumetric parameters, namely the whole brain volume, the total hippocampal volume, the parietal volume, the thalamic volume and the occipital volume. Longitudinal data (Supplemental Table 1) from this study are not presented in this section since our study design focuses on cross-sectional results. Nevertheless, the value of longitudinal correlations between OCT and MRI will be discussed further in this review.
Sectorial analysis of OCT/OCT-A: MRI correlations
Figure 3 presents a visual sectorial overview of previously presented OCT/OCT-A – MRI correlations. Retinal and MRI findings are grouped into clusters. Each intersection of OCT/OCT-A and MRI parameters represents a statistically significant retinal-brain correlation. Negative and positive correlations are colored in red and green, respectively. This representation helps to visualize the contribution of each study to the current knowledge of retina-brain correlations in neurodegenerative diseases, allowing for an overall appraisal of the potential and efficiency of each biomarker.
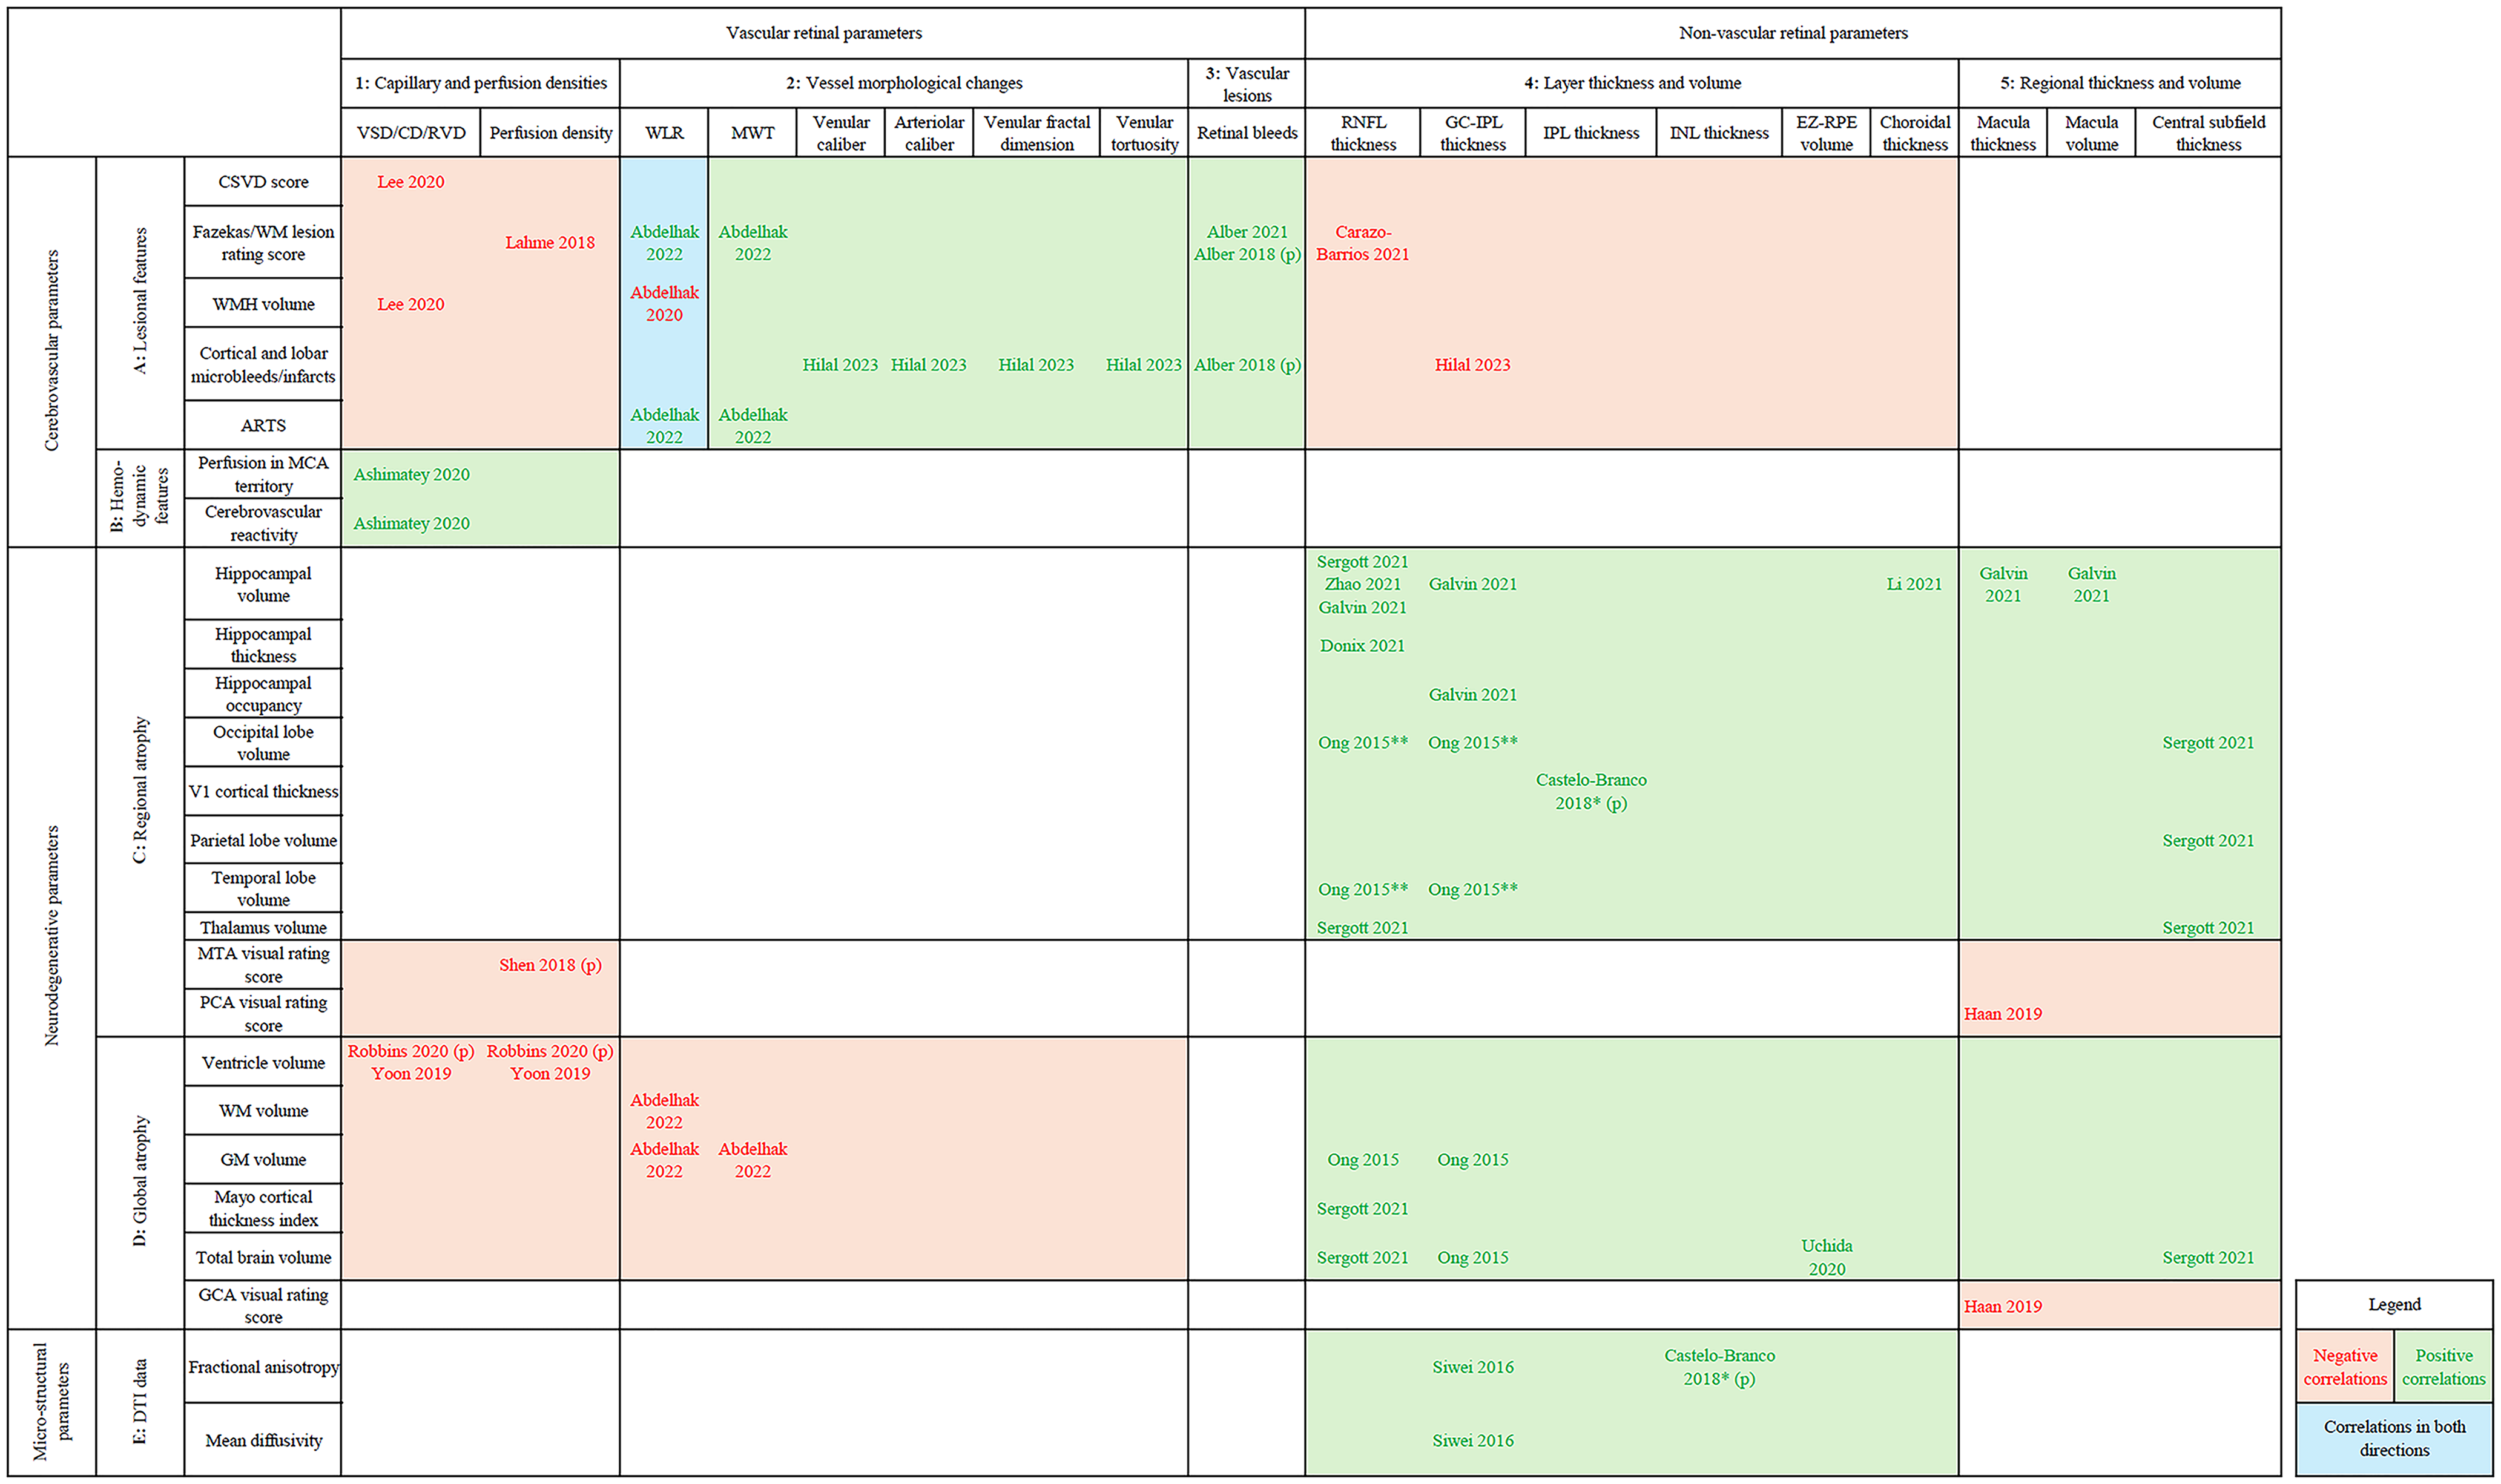
Sectorial representation of OCT/OCTA – MRI correlations†.
Retinal markers for cerebrovascular lesions
The radiological features of cerebrovascular lesions are associated with the following retinal features: decreased retinal vessel and perfusion densities (intersection
Retinal markers for brain hemodynamics
Retinal vessel densities are positively associated with better brain perfusion and cerebrovascular reactivity (
Retinal markers for regional brain atrophy
No correlation except one
45
have been reported between vascular retinal parameters and regional atrophy of the brain (
Note that sectors
Medial temporal and parietal atrophy are associated with decreased retinal perfusion 45 and macula thickness, 58 respectively. Yet, these results are coherent with other findings, since atrophy scores follow an inverse logic compared to brain volume and thickness metrics.
Retinal markers for global brain atrophy
Ventricle enlargement is associated with decreased retinal vessel and perfusion densities (
Retinal biomarkers for cerebral microstructural parameters
There are no reported correlations between micro-structural parameters of brain parenchyma and retinal features (
Discussion
The discussion will follow the structure of Figure 3. For each intersection of OCT/OCT-A-MRI correlations in the figure, main hypothesized mechanisms would be reviewed. Finally, a general interpretation of findings, as well as the critics and recommendations for future studies in this field will be provided.
Retinal biomarkers for cerebrovascular parameters
Mechanisms
First, the most common vascular alteration in CSVD and aging brain is arteriolosclerosis. Through mechanisms such as deposit of fibro-hyaline material and loss of tunica media smooth muscle cells, affected vessels gradually lose their capacity to autoregulate blood flow. Arteriolosclerosis eventually leads to occlusion of brain vessels, as well as chronic hypoperfusion of cerebral tissue. While arterial occlusion induces micro- and lacunar infarcts, hypoperfusion is thought to cause deep WM ischemia and the formation of WMH. 75 Furthermore, periventricular and deep WMH are histologically accompanied by brain vessel wall thickening, decreased vascular density, and increased vessel tortuosity. 76 Since retinal vessels share substantial similarities (autoregulation, barrier function, relatively low-flow, and high oxygen extraction 15 ) with small-caliber brain vessels, these arteriolosclerotic alterations could occur in retinal vasculature. It is worth noting that lower, instead of higher, fractal dimensions of retinal vessels have previously been reported in CSVD. 77 Nevertheless, Hilal et al. found a positive correlation between fractal dimension and microinfarct counts, 51 which was not coherent with the existing literature. They further hypothesized that higher fractal dimension could be a marker of abnormal angiogenesis, which could be a response to hypoxic conditions in CSVD.
Second, another common mechanism of CSVD is CAA. 75 The pathological hallmark finding for CAA is Aβ deposits in vessel walls. CAA could also induce vessel wall thickening, fibrinoid necrosis, and perivascular exudates. Furthermore, amyloid deposits within the walls of cerebral vessels are thought to directly cause microbleeds. 78 This mechanism, equally affecting the retinal vessels, could explain the retinal bleeds reported in studies conducted over CAA patients.
Third, the two key mechanisms regulating cerebral blood flow are cerebrovascular reactivity and cerebral autoregulation. 79 CAA and arteriolosclerotic mechanisms cause impaired autoregulation of small vessels. 75 Furthermore, evidence showed that cerebrovascular impairments are correlated with autoregulation abnormalities, and that these dysregulations might originate from a common pathway. 80 Thus, the pathological changes underlying structural vascular degeneration are equally inducing the dysregulation of both retinal and cerebral perfusion, resulting in the correlations seen above.
Linking mechanisms to findings
Arteriosclerosis is a main mechanism which could explain the findings of the intersections
Key remarks
Retinal vessel, and perfusion densities, as well as morphological parameters of retinal vessels efficiently reflect cerebrovascular lesions (
Retinal biomarkers for neurodegeneration
Mechanisms
Major hypothesized mechanisms for the above-mentioned non-vascular correlations include retrograde degeneration, Aβ deposits, and inflammation processes. To begin with, the model of transneuronal retrograde degeneration advances that, when brain degeneration occurs, the retinal neurons secondarily degenerate since they lose their postsynaptic target 81 and trophic support. 82 In patients with dementia, it is generally believed that atrophy of cerebral regions which contain visual pathways (e.g., optic tract) induces retrograde degeneration. This first affects the axons of retinal nerve cells (RNFL), followed by the cell bodies (GC-IPL). 83 Previous evidence showed that GC-IPL thinning correlates with longitudinal progression of dementia symptoms, further confirming this progressive degeneration. 84 Neuropathological evidence could also corroborate this theory. Leuba et al. found senile plaques in the lateral geniculate nucleus, lateral inferior pulvinar nucleus, superior colliculus and primary visual cortex in postmortem AD brain. 85 Sadun et al. examined optic nerve from AD patients and found decreased optic nerve axon density and diameter compared to matched controls. 86 This retrograde pathophysiology is not exclusive to AD-related degeneration, and could also be secondary to cerebrovascular events. Previous studies reported thinner RNFL in stroke patients. 87
Second, most participants included in these studies have an AD diagnosis (Supplemental Table 1). Along with tau-induced, microtubule-mediated mechanisms of neuronal loss, Aβ is thought to be one of the major causes inducing brain atrophy in AD. 15 Involved mechanisms include Aβ-induced synaptotoxicity and neurotoxicity. 88 Thus, Aβ deposits may be another important mechanism for the above-mentioned correlations. A large number of studies confirmed the presence of Aβ plaques in AD retina, especially inner retinal layers such as RNFL and GCL. Immunopathological evidence showed the layers and regions where these proteinaceous deposits are present are also those undergoing loss of retinal cells. 89
Third, the AD neuropathology is characterized by the presence of a low-grade neuroinflammation. Multiple mechanisms underlie this inflammation, including increased microglia and astrocyte activity, microglia-mediated synaptic pruning and Aβ and tau propagation. 90 These processes could also induce brain and retinal neuronal degeneration. 91
Linking mechanisms to findings
The mechanism of transneuronal retrograde degeneration accounts for the majority of findings in
Key remarks
RNFL and GC-IPL layers are the most frequently significant parameters reported in studies examining OCT and OCT-A as biomarkers for neurodegenerative diseases. This finding is consistent with the literature.
20
Furthermore, the OCT-MRI correlations involving regional brain atrophy (
Retinal biomarkers for cerebral microstructural parameters
Since significant correlations from Siwei et al. originate from NCI participants, 53 and that Castelo-Branco et al. reported no effect size data, 59 we do not discuss the possible mechanisms connecting microstructural neurodegeneration and retinal manifestations for these findings. Nevertheless, microstructural alterations detected by DTI were found in early stages of AD. 93 Retina-DTI correlations in neurodegenerative diseases could thus be a potential direction of research in the future.
Limitations
We identified several limitations in this field of research which may affect the quality of our conclusions: the heterogeneity of methods and results, the complex interactions between mechanisms, confounders from other medical conditions, preponderance of findings in AD compared to other forms of dementia, small sample size, positive publication bias, and the lack of longitudinal data.
As presented in Supplemental Tables 1 and 2, there is currently a significant heterogeneity in the methods used by studies exploring OCT/OCT-A – MRI correlations. To begin with, OCT and MRI manufacturers and models vary across studies. Different OCT machines have different ways to sectorize the retina, thus affecting the comparability between the studies. Different models of OCT system also exhibit significant differences in their positive and negative likelihood ratios.94,95 The comparability between distinct OCT systems has not been sufficiently studied. Among studies which addressed this aspect, Polo et al. found in 2014 that both Spectralis (Heidelberg) and Cirrus (Zeiss) detected RNFL thinning in AD patients. Results from both systems were correlated but significant differences were found for several parameters. 99 The MRI spatial resolution varies from 1.5 T to 3.0 T, whereas the MRI manufacturer and sequences used vary more markedly. Previous evidence suggests these differences could have minor but significant impact on the measurements, especially considering that OCT-MRI correlations are themselves often weakly or moderately significant results.96,97 For instance, as illustrated by Buchanan et al., 97 GM and WM tissue volumes appear larger at 3.0 T than at 1.5 T. For DTI measurements, they showed that fractional anisotropy is higher at 3.0 T as compared to 1.5 T. The accumulation of these minor differences could result in significant bias when we attempt to compared OCT-MRI correlations. There were also studies which omitted clarifying explicitly their MRI resolution,27,33,37,38,45,58,59 affecting the reliability of their results. Additionally, as detailed in Supplemental Table 1, substantial heterogeneity also exists among study participants. The comparability of correlations from participants with different diagnoses is questionable. Moreover, statistical tools vary considerably across studies, thus making a reliable meta-analysis difficult to perform. Furthermore, the quality of results is also highly heterogeneous among studies. Siwei et al. and Castelo-Branco et al. did not report effect size data for their significant correlations,53,59 affecting the reliability of their conclusions. Also, note that two included studies47,55 did not report any significant OCT-MRI correlations. Indeed, most of the reported OCT-MRI correlations are moderately significant (Supplemental Table 1) and should be interpreted with caution. Finally, multiple included studies reported results specific to a retinal sector.27,39,41,44,46,49,54,58 This phenomenon of results heterogeneity across retinal sectors has been more extensively studied by Wang et al. 98
Another major consideration is the fact that the mechanisms underlying retinal findings that we detailed above are closely interrelated. Thus, these retinal markers are less likely to be specific. For vascular findings, arteriolosclerosis changes and amyloid deposits within small vessels induce loss of blood flow regulatory mechanisms, hypoperfusion and/or microhemorrhages, eventually leading to cerebral and/or retinal neurodegeneration.75,99 For non-vascular findings, Aβ- and tau-induced brain atrophy can affect retina via their direct effect on retinal tissue, retrograde degeneration, and microglia-and-astrocyte-mediated inflammatory mechanisms.83,89,91 Non-vascular and vascular findings also share common mechanisms. Abnormal proteinaceous deposits could induce both neurodegeneration and vascular degeneration. 90 Cerebrovascular lesions could also be the starting point of retrograde degeneration.81,82 These mechanisms are often common to different forms of dementia-induced-neurodegeneration. 100 Consequently, the interrelated nature of mechanisms makes the retinal markers less discriminative and less specific to one precise diagnosis of dementia.
Following the same line of thinking, although most included studies (Supplemental Table 1) made efforts to exclude confounders, there is a large disparity between studies in the severity of exclusion criteria, resulting in significant potential bias. Whether these contributing confounders are of retinal (e.g., age-related macular degeneration), neurological (e.g., head trauma), or systemic origin (e.g., hypertension, dyslipidemia), they often share similar inflammatory or degenerative mechanisms to neurocognitive diseases. These factors not only affect the reliability of OCT-MRI correlations, they also represent a huge barrier in the eventual clinical application of retinal biomarkers. Since these retinal findings could occur in both dementia and non-neurocognitive conditions, then it becomes challenging to apply these markers to a larger scale of population, which often suffer from these confounding conditions.
We also note a disproportionate dominance of AD-related findings in our results. The scarcity, even absence, of evidence of other neurodegenerative diseases with cognitive presentation, such as LBD and FTD, is detrimental, as the specificity of retinal features in different conditions cannot be assessed. A possible explanation is that these diseases usually cause more behavioral manifestations, making patient recruitment and imaging acquisition more challenging.
Other limitations are small-size samples, positive publication bias, and the scarcity of longitudinal data. To begin with, by examining the Supplemental Table 1, we realize the sample size of most studies varies in the range of a few dozen participants. Since retinal changes are already relatively small-scale, the sample size has a substantial impact on the quality of evidence. Furthermore, we should be aware of positive publication bias, 101 which could lead to an overestimation of the potential of these retinal markers. We attempted to palliate this bias by including grey literature. Finally, it is worth remembering that different stages of neurodegeneration exhibit different degrees of atrophy severity. As shown by Leung et al., 102 hippocampal atrophy and ventricle enlargement in MCI patients were halfway between AD patients and controls. Thus, disease stages significantly impact OCT-MRI correlations. In order to examine the ability of retinal markers to monitor the progression of neurodegenerative diseases, longitudinal data is essential. However, most studies in this field are currently cross-sectional.
Recommendations for future studies
In response to the limitations previously detailed, we propound the following recommendations for future OCT-MRI studies. First, we recommend the development of more standardized protocols via guidelines from joint research initiatives, as well as studies to specifically assess the comparability of OCT/OCT-A results from different imaging systems. Second, we recommend future studies to focus on these complex interrelated mechanisms, instead of simple, one-way mechanisms. We also believe that this field requires more post-mortem analysis of retina in different neurodegenerative diseases since these cellular-level findings constitute the basis for OCT/OCT-A findings which are more morphological. Third, to address the challenge of confounding conditions, we propose two approaches. The first is using rigorous study protocols to exclude confounders, as well as using statistical tools such as structural equation modeling 103 to better investigation the causal relationships between retinal manifestations, systemic and neurological conditions. The second approach would be to integrate the power of artificial intelligence (AI) based machine learning algorithms. This is worth noting that this approach does not directly identify the impact of confounders. The essence of AI is its ability to classify a given pattern of retinal features into the appropriate category, such as identifying whether the pattern in question is associated with AD or not. AI cannot understand the diagnostic process. 104 AI performance also relies on the size and diversity of its datasets. Thus, although AI utilization has already yielded promising results in the development of retinal biomarkers (see the systematic review by Bahr et al. 105 for more details), its implementation should be done with caution. Fourth, we encourage more prospective studies to study more than one neurodegenerative condition to assess the discriminative capacity and specificity of these retinal markers. Fifth, the problem of small sample size could be palliated by encouraging multicentric research initiatives. Sixth, longitudinal studies should be favored. Among included studies in this review, the clinical trial by Sergott et al. is the only one reporting longitudinal data (Supplemental Table 1). 39 We recommend the unique design of this study: by incorporating longitudinal data on the correlations between the progressive retinal degeneration and brain degeneration into large clinical trial, researchers could generate precious longitudinal data about the complex brain-eye interactions in neurodegenerative diseases. Seventh, as publications in this field become more numerous, we recommend future studies to compare different retinal biomarkers in terms of their sensitivity, specificity, positive and negative predictive values. Finally, we believe that future works could benefit from expanding the scope of research to other neurological and neuroinflammatory conditions with significant retinal manifestations, such as multiple sclerosis. For instance, the work by Cellerino et al. 106 showed that OCT imaging was capable of identifying a precise subset of progressive MS patients who had best response to disease-modifying treatment. Such potential applications have measureless clinical future possibilities.
Final comments
We performed a systematic review of OCT/OCT-A – MRI correlations in different neurodegenerative disorders associated with cognitive decline. Our results showed that, for vascular neurodegenerative conditions, vascular retinal biomarkers have the relatively unique capacity to reflect cerebrovascular lesions compared to non-vascular retinal markers, while also correlating with global brain atrophy. For non-vascular neurodegenerative diseases, especially AD, layer-and-region-specific retinal biomarkers are the most promising. These lasts can reflect region-specific neurodegeneration as well as global brain atrophy, whereas retinal vascular markers can only reflect a global neurodegeneration as in non-vascular dementia. Finally, microstructural alterations of the brain parenchyma are primarily associated with layer-specific thinning of retina.
To the best of our knowledge, this is the first systematic review summarizing the correlations between retinal parameters and neurodegeneration parameters. We provided a visual overview of our current knowledge with valuable insights on the strengths of each retinal marker. We also performed an extensive discussion of challenges existing in this field of research and put forth recommendations for future research, leading eventually to clinically useful retinal biomarkers for early diagnosis of neurodegenerative diseases. A possible futuristic vision of the role of retinal biomarkers in the assessment of neurocognitive diseases, although still unlikely at the level of feasibility with our current level of knowledge, would be an AI-assisted algorithm with discriminative power, as discussed previously, integrated into routine ophthalmologist examinations. Since patients with risk factors for retinal diseases, such as poorly controlled hypertension, are often also at risk of neurocognitive diseases, this type of algorithm would have enormous clinical potential for first-line screening before referrals to second-or-third-line neurology or memory clinics.
Supplemental Material
sj-docx-1-alz-10.1177_13872877251331231 - Supplemental material for Diagnosing neurodegenerative disorders using retina as an external window: A systematic review of OCT-MRI correlations
Supplemental material, sj-docx-1-alz-10.1177_13872877251331231 for Diagnosing neurodegenerative disorders using retina as an external window: A systematic review of OCT-MRI correlations by Fei Wu, Caroline Dallaire-Théroux, Élodie Michaud, Frédéric Bergeron, Monica Lavoie, Jean-Paul Soucy, Ali Dirani and Robert Jr Laforce in Journal of Alzheimer's Disease
Footnotes
Acknowledgments
The authors want to express their sincere gratitude towards Dr Émilie Bergeron, neuro-ophthalmologist at Hôpital Saint-Sacrement, CHU de Québec – Université Laval, without the help of whom this work would not be possible.
ORCID iDs
Author contributions
Fei Wu (Conceptualization; Investigation; Methodology; Writing – original draft); Caroline Dallaire-Théroux (Conceptualization; Investigation; Methodology; Supervision; Writing – review & editing); Élodie Michaud (Investigation); Frédéric Bergeron (Methodology); Monica Lavoie (Writing – review & editing); Jean-Paul Soucy (Writing – review & editing); Ali Dirani (Writing – review & editing); Robert Jr Laforce (Conceptualization; Funding acquisition; Methodology; Supervision; Writing – review & editing).
Funding
The author(s) disclosed receipt of the following financial support for the research, authorship, and/or publication of this article: This work is financially supported by the Research Chair on Primary Progressive Aphasia - Fondation de la famille Lemaire, Centre Hospitalier Universitaire (CHU) de Québec – Université Laval, Québec City, QC, Canada. The funding source was not involved in the design or redaction of this study.
Declaration of conflicting interests
The author(s) declared the following potential conflicts of interest with respect to the research, authorship, and/or publication of this article: Caroline Dallaire-Théroux is an Editorial Board Member of this journal but was not involved in the peer-review process of this article nor had access to any information regarding its peer-review
Jean-Paul Soucy collaborated on the preclinical studies at Optina Diagnostics from 2015 to July 2024. This company manufactures a retinal scanner that detects the presence of amyloid in the retina through reflectance. The technique is not the same as OCT but aims to achieve the same clinical goals. The company has no rights to review or restrict his publications on this topic or any other topic. He was previously compensated by the company for interpreting PET scans of amyloid plaques, but that contract has now ended.
The remaining authors declared no potential conflicts of interest with respect to the research, authorship, and/or publication of this article.
Data availability
The data supporting the findings of this study are available within the article and/or its supplemental material.
Supplemental material
Supplemental material for this article is available online.
References
Supplementary Material
Please find the following supplemental material available below.
For Open Access articles published under a Creative Commons License, all supplemental material carries the same license as the article it is associated with.
For non-Open Access articles published, all supplemental material carries a non-exclusive license, and permission requests for re-use of supplemental material or any part of supplemental material shall be sent directly to the copyright owner as specified in the copyright notice associated with the article.