
Abstract
Background
Alzheimer's disease (AD) is a neurodegenerative disorder that profoundly alters brain function and organization. Currently, there is a lack of validated functional biomarkers to aid in diagnosing and classifying AD. Therefore, there is a pressing need for early, accurate, non-invasive, and accessible methods to detect and characterize disease progression. Electroencephalography (EEG) has emerged as a minimally invasive technique to quantify functional changes in neural activity associated with AD. However, challenges such as poor signal-to-noise ratio—particularly for resting-state (rsEEG) recordings—and issues with standardization have hindered its broader application.
Objective
To conduct a pilot analysis of our custom automated preprocessing and feature extraction pipeline to identify indicators of AD and correlates of disease progression.
Methods
We analyzed data from 36 individuals with AD and 29 healthy participants recorded using a standard 19-channel EEG and features were processed using our custom end-t-end pipeline. Various features encompassing amplitude, power, connectivity, complexity, and microstates were extracted. Unsupervised machine learning (uniform manifold approximation and projection) and supervised learning (random forest classifiers with nested cross-validation) were used to characterize the dataset and identify differences between AD and healthy groups.
Results
Our pipeline successfully detected several new and previously established EEG-based measures indicative of AD status and progression, demonstrating strong external validity.
Conclusions
Our findings suggest that this automated approach provides a promising initial framework for implementing EEG biomarkers in the AD patient population, paving the way for improved diagnostic and monitoring strategies.
Introduction
Alzheimer's disease (AD) is the leading cause of dementia, comprising an estimated 60–80% of dementia cases. 1 As of 2019, it has been estimated that AD affects 55 million people worldwide, and this is projected to increase to 139 million people by 2050. 2 The burden of disease is expected to lead to further increases in the healthcare system costs, which already stand at USD 240 billion 3 for the 5.8 million people affected in the United States alone. Despite the immense personal and societal impact, viable treatments or disease-modifying therapies are severely lacking. Current FDA-approved pharmacological treatments for AD have shown modest benefits in symptom management and are insufficient in preventing neuronal loss, brain atrophy, and cognitive decline. As a result, developing disease-modifying therapies that can alter AD progression has become a priority. 4 Multiple anti-amyloid therapies for AD have been approved recently, such as lecanemab, which is intended to block the formation of amyloid plaques. 5 However, the development of these therapies has also come with challenges. For example, aducanumab, intended to remove amyloid plaques post-formation, failed to launch after undergoing accelerated approval. 6 Several factors have likely contributed to the ongoing challenges encountered in AD clinical trials and therapeutics development, such as disease heterogeneity and the presence of disease subtypes. 7
Identifying novel biomarkers for AD is poised to revolutionize the development of new treatments and the clinical care of patients with AD. In the past 10–20 years, substantial progress has been made in identifying potential disease-related factors in AD that may be either amenable to treatment or valid indicators of treatment response. Biomarkers such as Aβ42 and hyperphosphorylated tau 8 have recently been incorporated into AD diagnostic criteria. 9 Additional modalities provide further information on the macrostructure of the brain, which is an important factor for establishing AD disease severity. This includes structural and functional biomarkers based on magnetic resonance imaging (MRI), which have been developed recently as well. 10
Functional analysis of brain activity using electroencephalography (EEG) is another promising avenue for AD biomarker development. Unlike invasive measurements like cerebrospinal fluid (CSF) sampling or expensive modalities like MRI, EEG is affordable, safe, portable, and relatively easy to use. EEG boasts high temporal resolution, which is particularly useful in detecting dynamic changes in neural activity.11–13 Moreover, a global increase in computational and programming resources has sparked a revival in EEG research for clinical and research purposes. 14 In AD, EEG-based biomarkers have demonstrated considerable promise for disease detection and tracking.15,16 For example, EEG has been used to identify characteristic alterations in brain activity that precede and accompany cognitive decline, including generalized slowing, changes in connectivity, reduced power in higher frequency bands, and increased synchronization in lower frequency bands. These markers provide insights into the neural mechanisms underlying cognitive impairment and help distinguish between normal aging and pathological processes.17–19
Given the urgent need for scalable and robust systems to detect and track AD, EEG-based biomarkers may dramatically shift current approaches to research and clinical care in this population. To support this, we have developed a novel, end-to-end EEG analysis pipeline, building on efforts to identify optimal preprocessing and feature extraction methods in individuals with depression 20 and AD. 21 Our goal was to perform an initial clinical validation of this pipeline using a recently published open-source dataset of individuals with AD. 22 We specifically examined the effectiveness of our automated method in detecting AD and whether the features extracted would align with established clinical indicators of disease severity. Our automated, end-to-end approach could accurately distinguish between AD and healthy control (HC) groups and EEG-derived features correlated with disease severity assessed using the Mini-Mental State Examination (MMSE).
Methods
Participants and data collection
This study utilized a retrospective, cross-sectional, case-control dataset of resting-state/eyes-closed EEG recordings from 36 individuals with AD and 29 HC, sourced from a public dataset originally published by. 22 Table 1 provides a summary of clinical and demographic information.
Demographic and clinical characteristics.
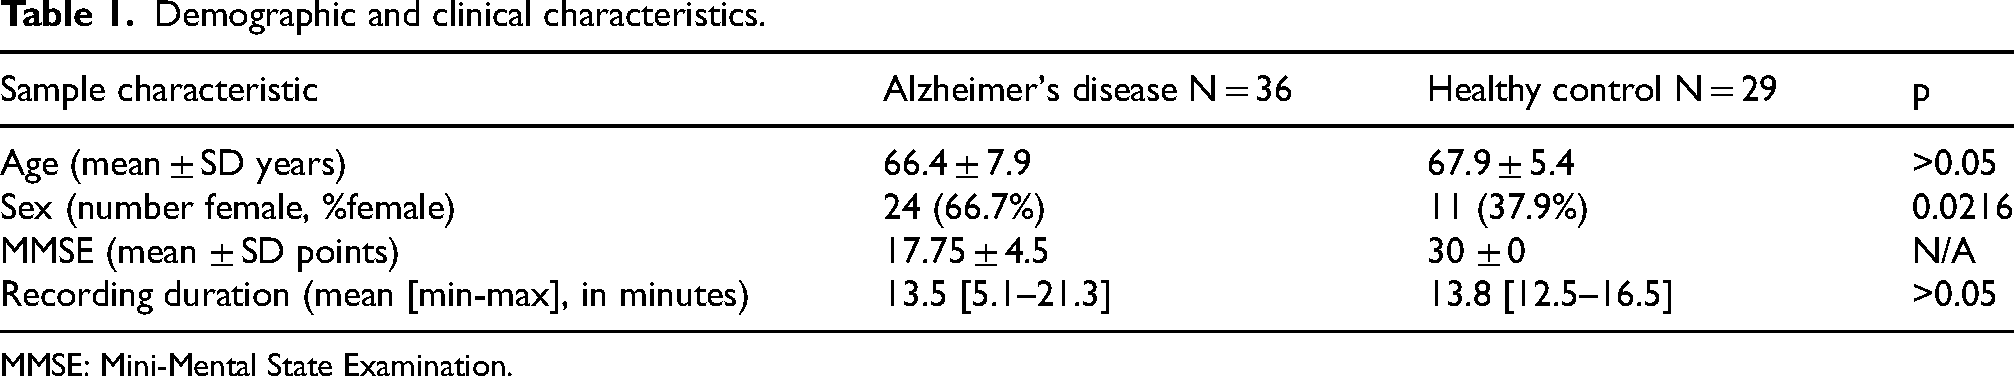
MMSE: Mini-Mental State Examination.
Participants underwent standard cognitive evaluation using the MMSE. 23 The AD group had an average MMSE score of 17.8 ± 4.5, consistent with mild to moderate AD disease severity, while the HC group scored 30 ± 0. The median disease duration for the AD group was 25 months, with an interquartile range (IQR) of [24.0–28.5] months. No additional dementia-related comorbidities were reported for the AD group.
EEG recordings were obtained at a sampling frequency of 500 Hz using a clinical EEG device (Neurofax EEG-2100, Nihon Kohden, Tokyo, Japan) with 19 scalp electrodes and two reference electrodes placed on the mastoids, following the conventional international 10–20 system of electrode placement. Each recording session lasted a median of 13.5 min (range: 5.1–21.3 min) for the AD group and 13.8 min (range: 12.5–16.5 min) for the HC group.
Preprocessing
EEG data are often affected by physiological and environmental noise, which requires careful processing to refine the data and remove artifacts. To address this, we employed an automated series of established preprocessing steps as part of our end-to-end pipeline, integrating established methods24,25 and novel algorithms as detailed herein.
Initial preprocessing involved bandpass filtering, re-referencing, detrending, and segmenting the data into epochs. ‘Bad epochs’ were identified by estimating rejection thresholds for each sensor. If the number was sufficiently low, interpolation was performed using a spherical spline. 25
Feature extraction
After preprocessing EEG signals, multidimensional features were extracted to distill the complex neurophysiological data into interpretable representations. EEG signals were categorized into seven coarse subsets, with all analyses performed in sensor rather than source space. Table 2 summarizes the feature categories extracted.
Summary of features extracted from EEG data.
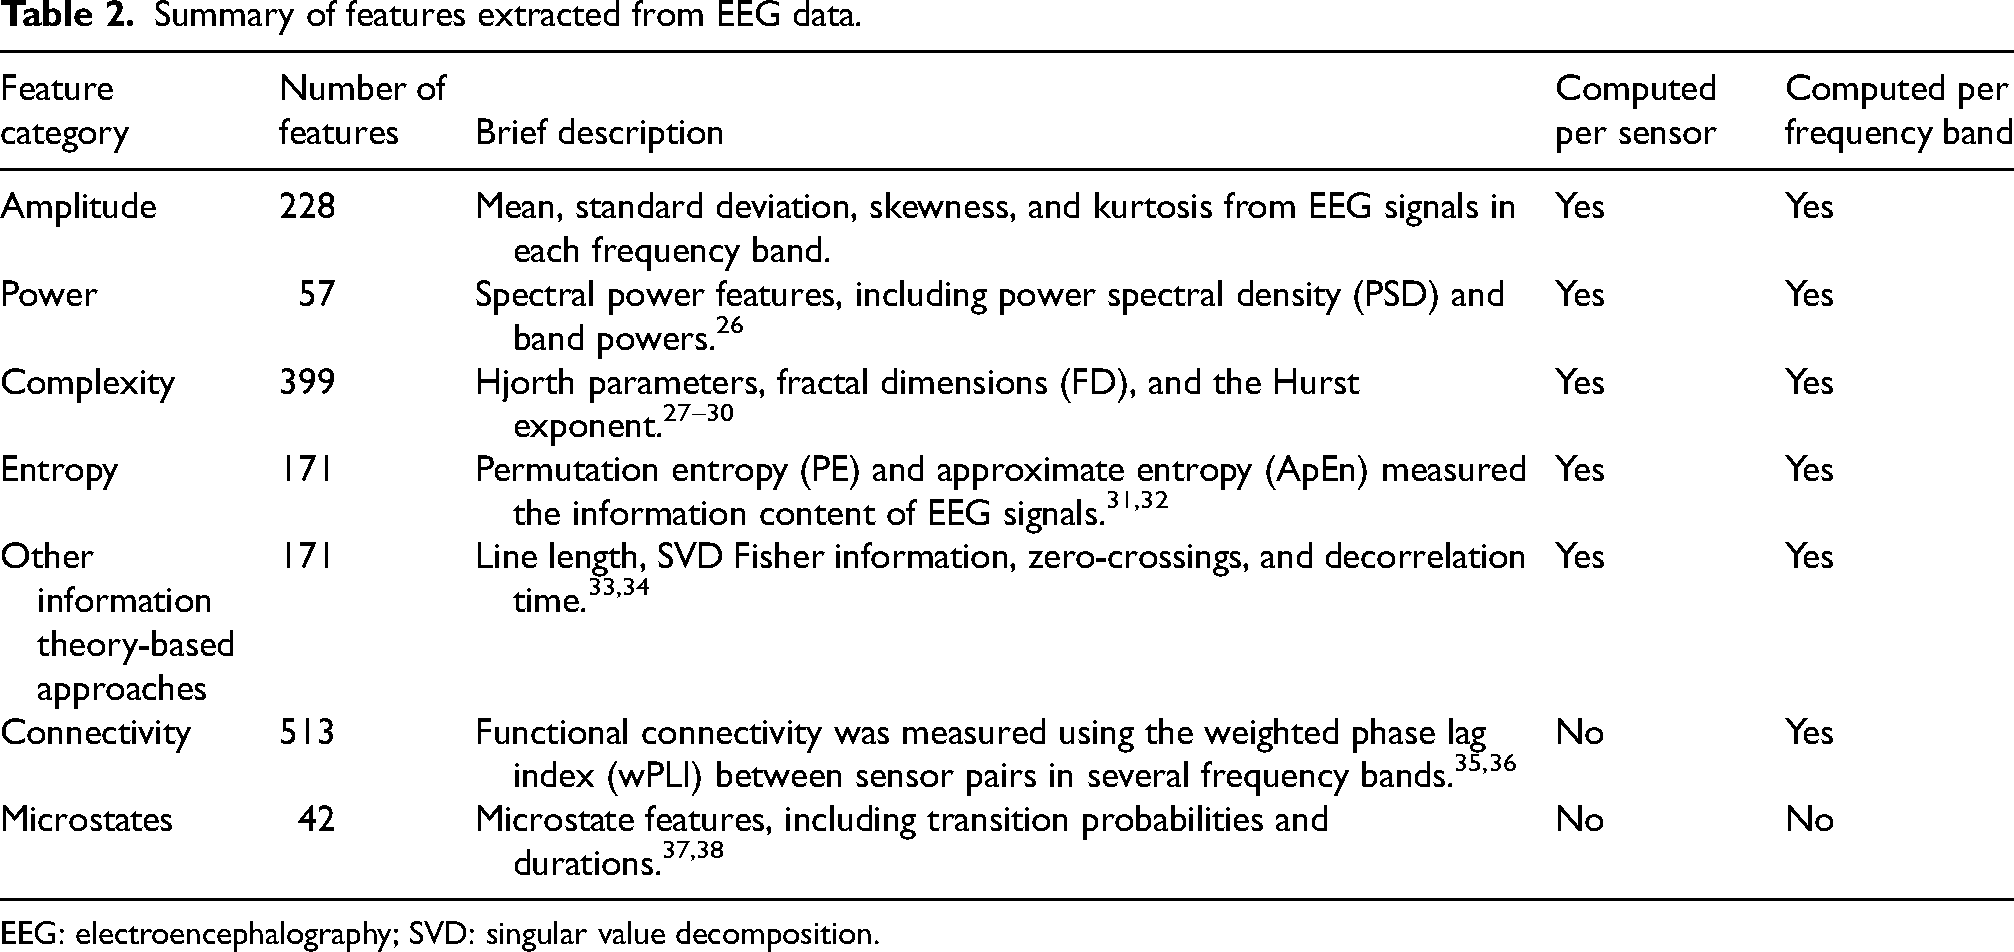
EEG: electroencephalography; SVD: singular value decomposition.
We extracted sensor-wise measures based on signal amplitude and power to quantify the distributional characteristics of the EEG signals, which may be affected in AD.39–41 Additionally, measures based on information theory, such as complexity and entropy, were included to capture nonlinear patterns at each sensor, which have been shown to differentiate AD from healthy individuals.20,27–32,35,42
Standard and advanced connectivity features were employed to identify pairwise interactions between sensors.36,37 Furthermore, microstate analysis was conducted using six microstates extracted through modified k-means clustering, offering a higher-level overview of dynamic activity patterns throughout the brain.26,38
Features related to amplitude, power, connectivity, and complexity were analyzed within individual frequency bands: theta (4–8 Hz), alpha (8–12 Hz), and beta (12–25 Hz), as well as broadband (1–40 Hz), resulting in four additional feature subsets. Collectively, these features served as inputs for subsequent machine-learning algorithms.
Univariate statistical analysis
To assess how individual features (1) differed between the AD and HC groups, and (2) tracked changes in disease severity, we performed two sets of univariate statistical analyses. Independent-sample, two-tailed t-tests were conducted to differentiate between AD and HC groups. Spearman correlations were computed for AD patients to evaluate the relationship between individual features and disease severity, comparing feature values for individual features to the MMSE scores.
Given the many pairwise comparisons, we adjusted for the false discovery rate (FDR) with a significance threshold of alpha = 0.05. This method was chosen over more conservative approaches (i.e., Bonferroni family-wise error rate (FWER)) since it is less stringent in p-value adjustments when handling numerous comparisons. 43 As with the t-tests, FDR correction on p-values was applied (alpha = 0.05) prior to inferring statistical significance.
Unsupervised machine learning
To assess the ability of our extracted features to distinguish between AD and HC groups, we utilized unsupervised machine learning (ML). Using unsupervised methods for data exploration provides important insight into the data structure, enabling us to evaluate whether or not groups are separable, thus informing subsequent supervised machine learning analysis. To perform unsupervised dimensionality reduction, we chose uniform manifold approximation and projection (UMAP), 44 and embedded data from the feature sets into two dimensions for easier visualization and to provide a straightforward, high-level overview of the data structure. UMAP is a method for preserving local and, as much as possible, global distances between points in a low-dimensional space. By capturing nonlinear interactions between data points, UMAP retains a more high-level structure than linear methods such as principal components analysis. Individual feature subsets (complexity, power, etc.) were embedded using UMAP and the overall dataset to evaluate subjective differences between AD and HC groups.
Supervised machine learning
To capture differences between the AD and HC groups across our high-dimensional feature set, we used supervised ML. EEG-derived features were the sole inputs, with ‘AD’ or ‘HC’ as the predicted class labels. The dataset was divided into two subsets: a development set and a testing set. The development set was utilized for model training, feature standardization, and selection, while the testing set remained external to prevent data leakage.
We employed five-fold nested cross-validation to minimize bias and variance in test set estimates. 45 Classification and feature selection were conducted using sequential Random Forests 46 in the inner loop for feature selection, followed by classification in the outer loop. The feature set was optimized during the inner loop (training subset of the development set) and evaluated in the outer loop (validation subset of the development set) using an additional round of cross-validation. We ensured that data from the test folds were entirely external to the training and internal validation loops during this process to ensure that performance estimates were minimally biased.
Model performance was evaluated using the area under the receiver operating characteristic curve (AUROC) derived from predictions in the external test set. The average model performance across all five test folds was calculated to provide an overall output. The entire process was repeated 20 times using fixed random seeds for reproducibility, yielding estimates of the overall generalization error on external data.
Supervised ML was applied to all features collectively and from individual categories, such as microstates, frontal electrodes, parietal electrodes, individual complexity, and connectivity measures. Additionally, features quantifying inter-epoch variability (e.g., the standard deviation of average amplitudes across epochs rather than their grand mean) were included. This allowed us to independently test the performance of each feature group cross-validation and compare their detection capabilities.
We additionally performed an error analysis on the AD patients who were misclassified in the test folds of the supervised ML models. T-tests indicated that there were no differences in the MMSE of misclassified patients across the combinations of feature groups and test folds. There were some differences in test folds in the age of participants that were misclassified (e.g., 16/20 test folds for the decorrelation feature set, but 0/20 in most other feature groups). There were infrequent (fewer than 5 across all combinations of features and test folds) differences in the sex of participants that were misclassified (encoding “male” as 0 and “female” as 1 for this latter analysis).
Code for the present analyses is available on GitHub at the following link: https://github.com/Cove-Neurosciences-Inc/JAD-paper-analysis-code
Results
Statistical analysis
To assess differences between AD and HC groups at an individual-feature level, univariate t-tests were conducted. A summary of the features ranked by statistical significance is provided in Table 3. Across all features analyzed, 1111 out of 3671 showed significant differences between the AD and HC groups (p < 0.05). After applying FDR correction for multiple comparisons, 629 of these features remained significant with a threshold of p = 0.05. The top five most significant features included a mix of amplitude and complexity metrics (Table 3).
Significant correlations between EEG-extracted features and Mini-Mental State Exam (MMSE).
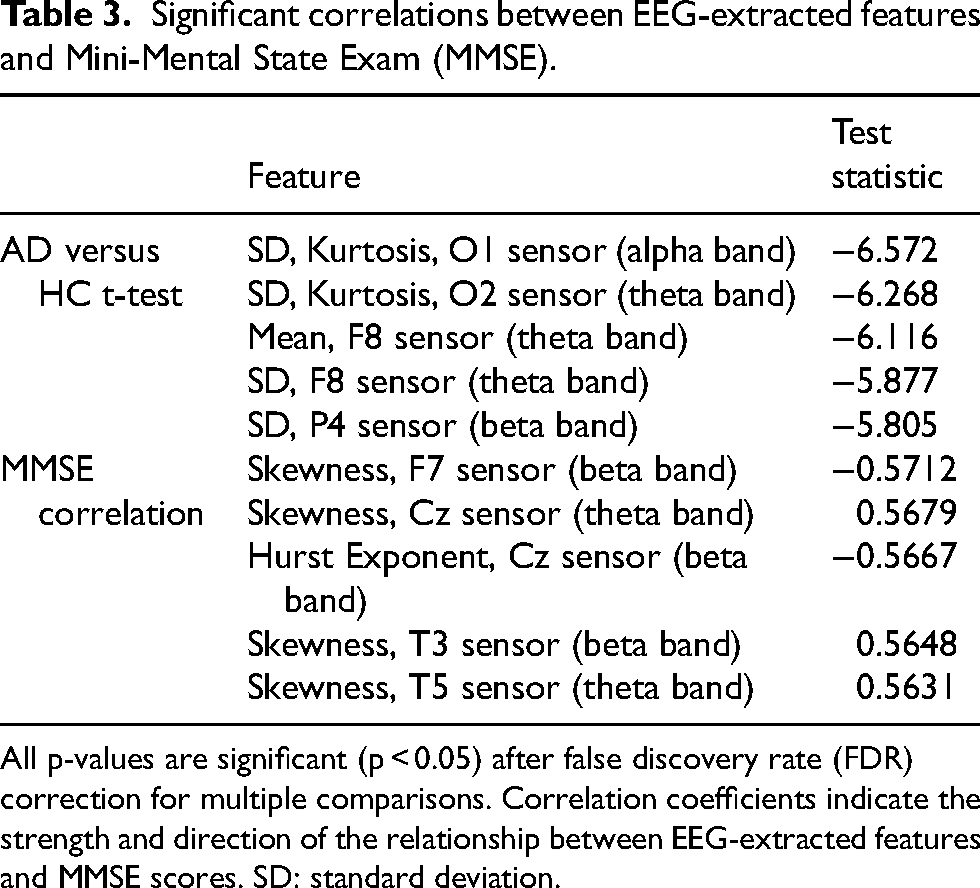
All p-values are significant (p < 0.05) after false discovery rate (FDR) correction for multiple comparisons. Correlation coefficients indicate the strength and direction of the relationship between EEG-extracted features and MMSE scores. SD: standard deviation.
Differences between AD and HC groups were evident across a broad spectrum of features. For instance, signal complexity differed significantly, with AD patients exhibiting reduced complexity, notably in the alpha band at the F4 electrode (p = 0.00016). Additionally, signal power analyses revealed significant differences: frontal theta power was elevated in patients with AD compared to controls (p = 0.00002). In contrast, frontal alpha power was significantly decreased in patients with AD compared to controls (p = 0.00338).
We further explored the relationships between MMSE and EEG-derived features within the AD group using Spearman correlations. Seventy features showed significant correlations with the MMSE (after FDR adjustment, p < 0.05), primarily involving amplitude-based statistics and entropy/complexity measures. Before FDR correction, 206 features exhibited significant correlations, largely reflecting similar categories. Among the features with significant correlations post-correction, correlation magnitudes ranged from |0.45| to |0.57|. The electrodes most frequently implicated were located in the frontal and temporal regions, including posterior frontal electrodes such as C3 and C4.
Machine learning
UMAP embeddings reveal distinct differences between AD and HC groups. As illustrated in Figure 1, Hjorth feature embeddings show clear separations between the subspaces occupied by data from AD and HC participants.
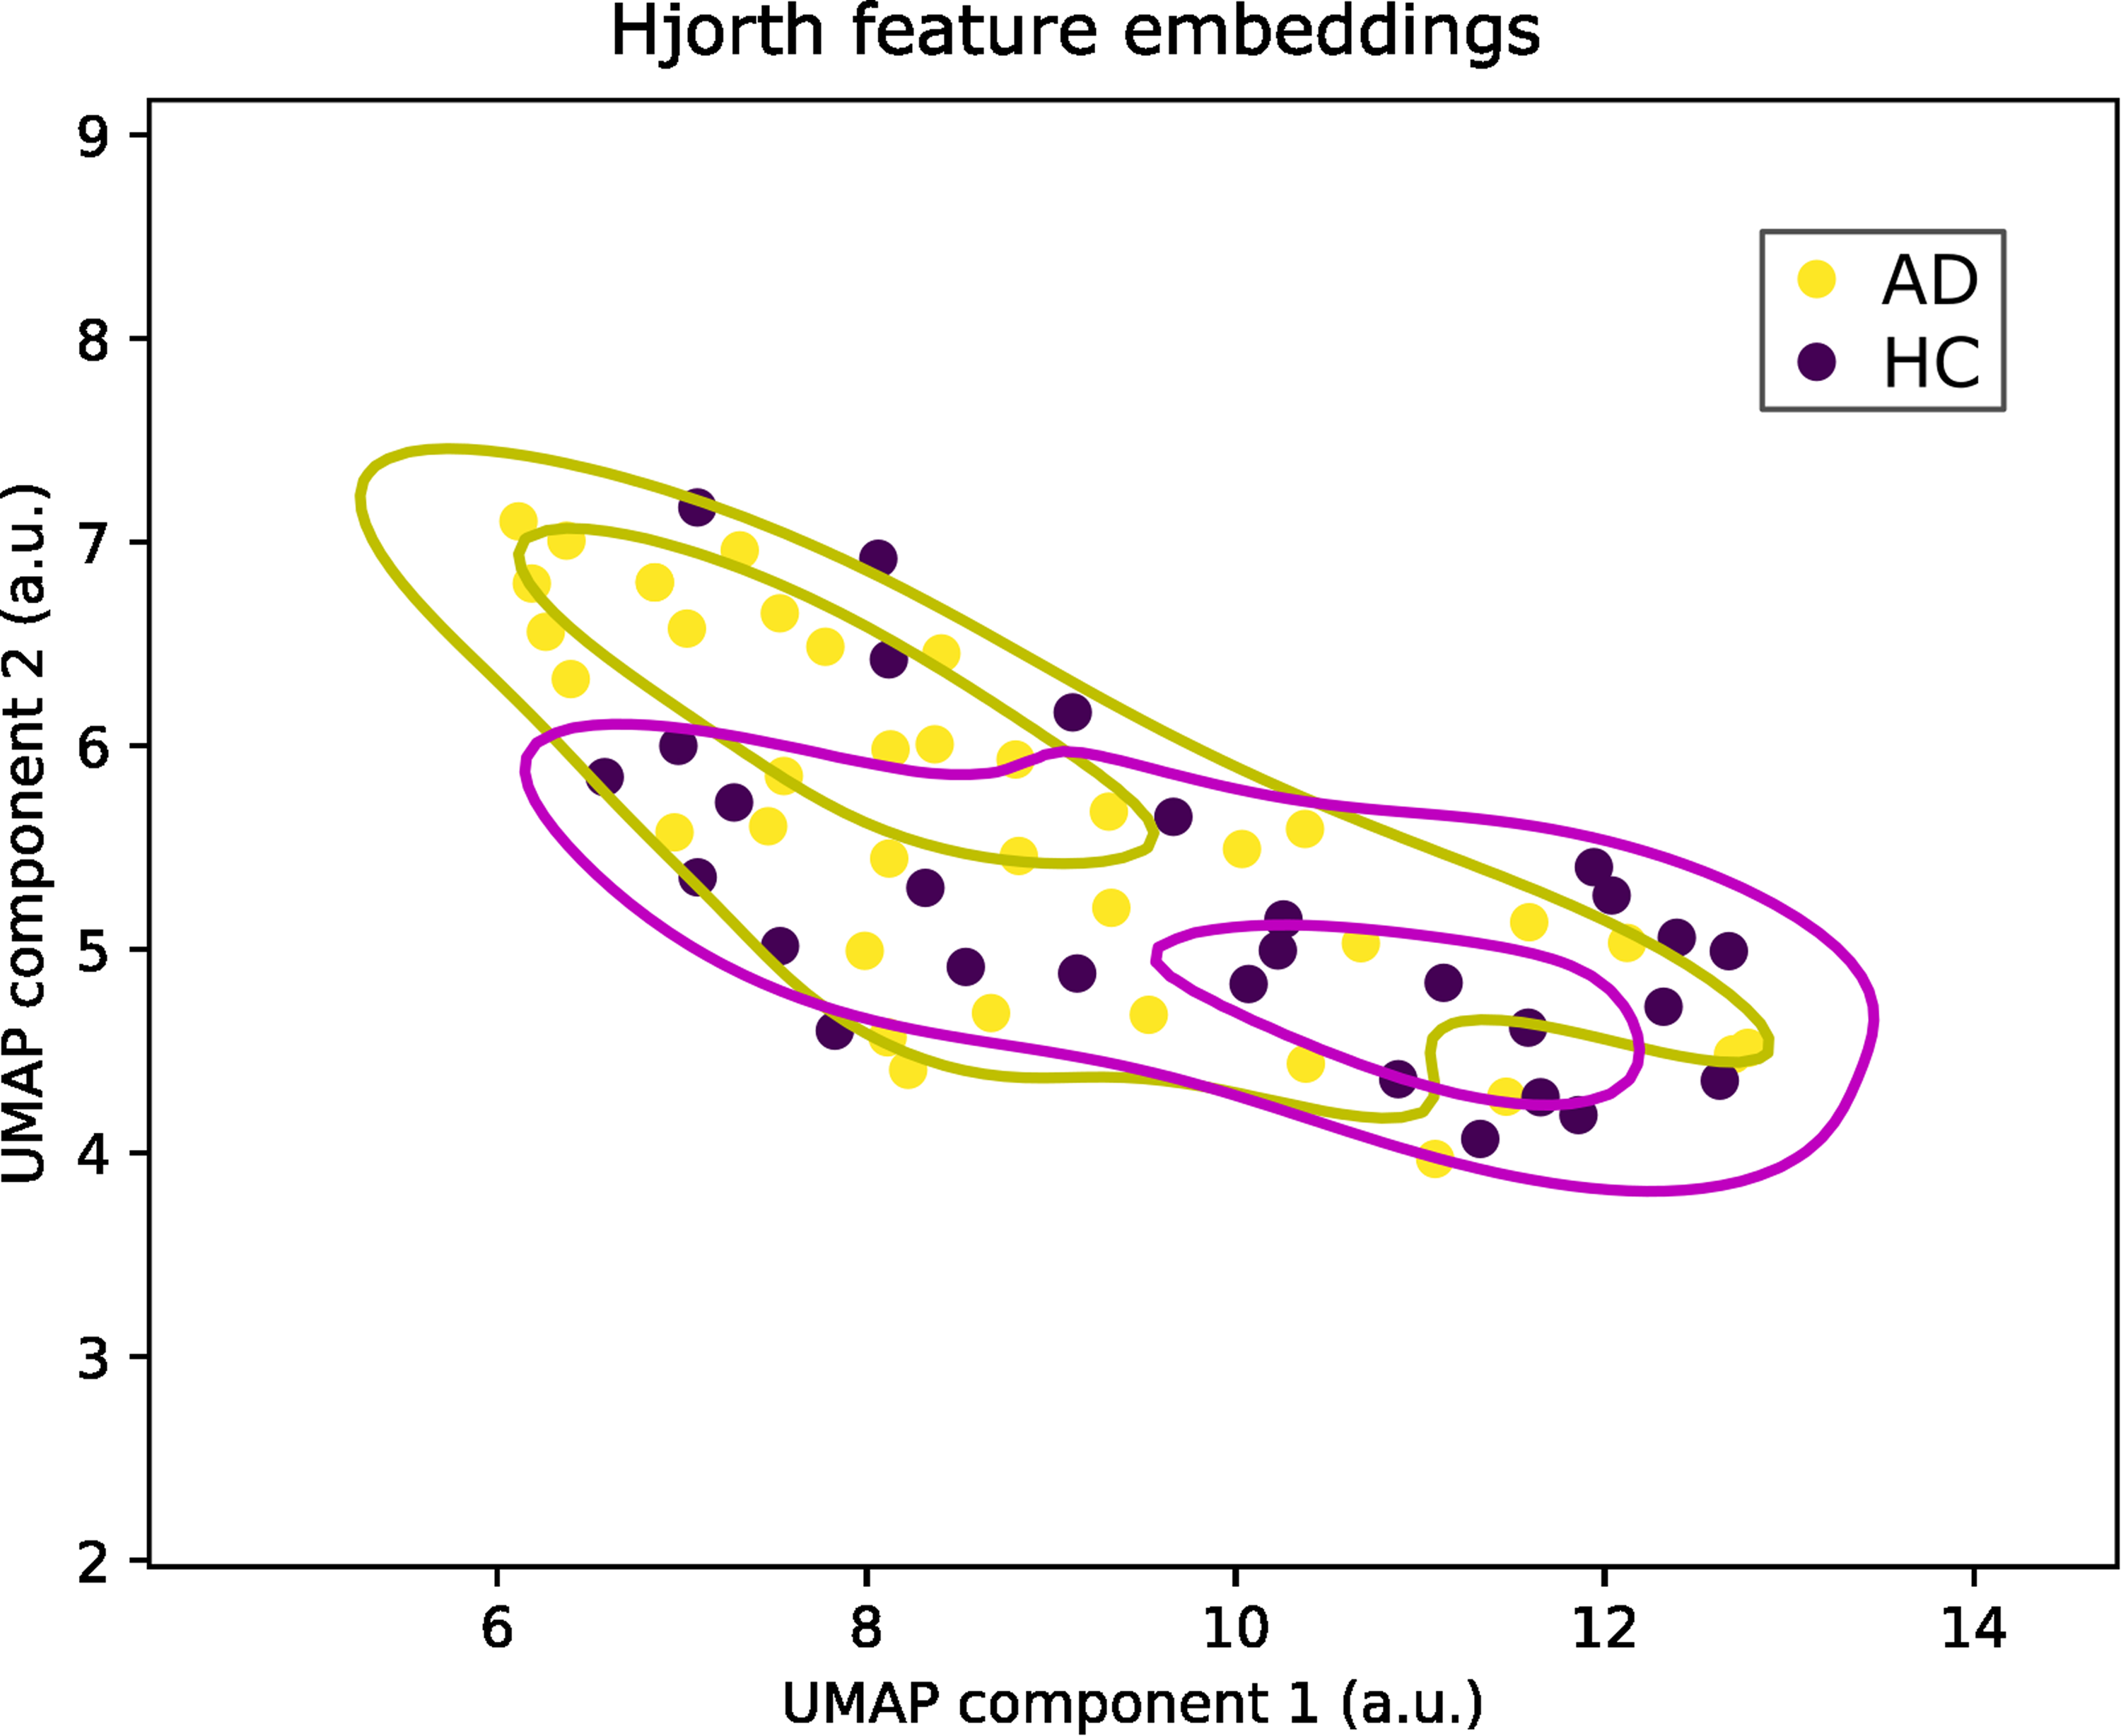
Hjorth feature embeddings. Unsupervised embeddings of Hjorth features for Alzheimer's disease (AD) and healthy control (HC) groups demonstrate the data's separability. Axes represent each of the two uniform manifold approximation and projection (UMAP) components and are indexed in arbitrary units (a.u.). Lighter points represent the AD group, and darker points represent the HC group. Contour lines are kernel density estimates fitted to points for each corresponding colour. AD: Alzheimer's disease; HC: healthy control.
Using supervised ML, we quantified the differences between AD and HC groups. The ML classification performance achieved by our automated pipeline was robust, reaching an AUROC of up to 0.86, with a sensitivity of 88% and a specificity of 82%. The confusion matrix displayed in Figure 2 illustrates the classifier's balanced performance in detecting HC and patients with AD. True labels were evenly distributed between HC and AD categories in the analysis. Specifically, the automated platform accurately classified 29 out of 36 patients with AD and 22 out of 29 HC participants in an example derived from the external test set (Figure 2). Misclassifications were also balanced, with seven misclassifications occurring for each group (Figure 2).
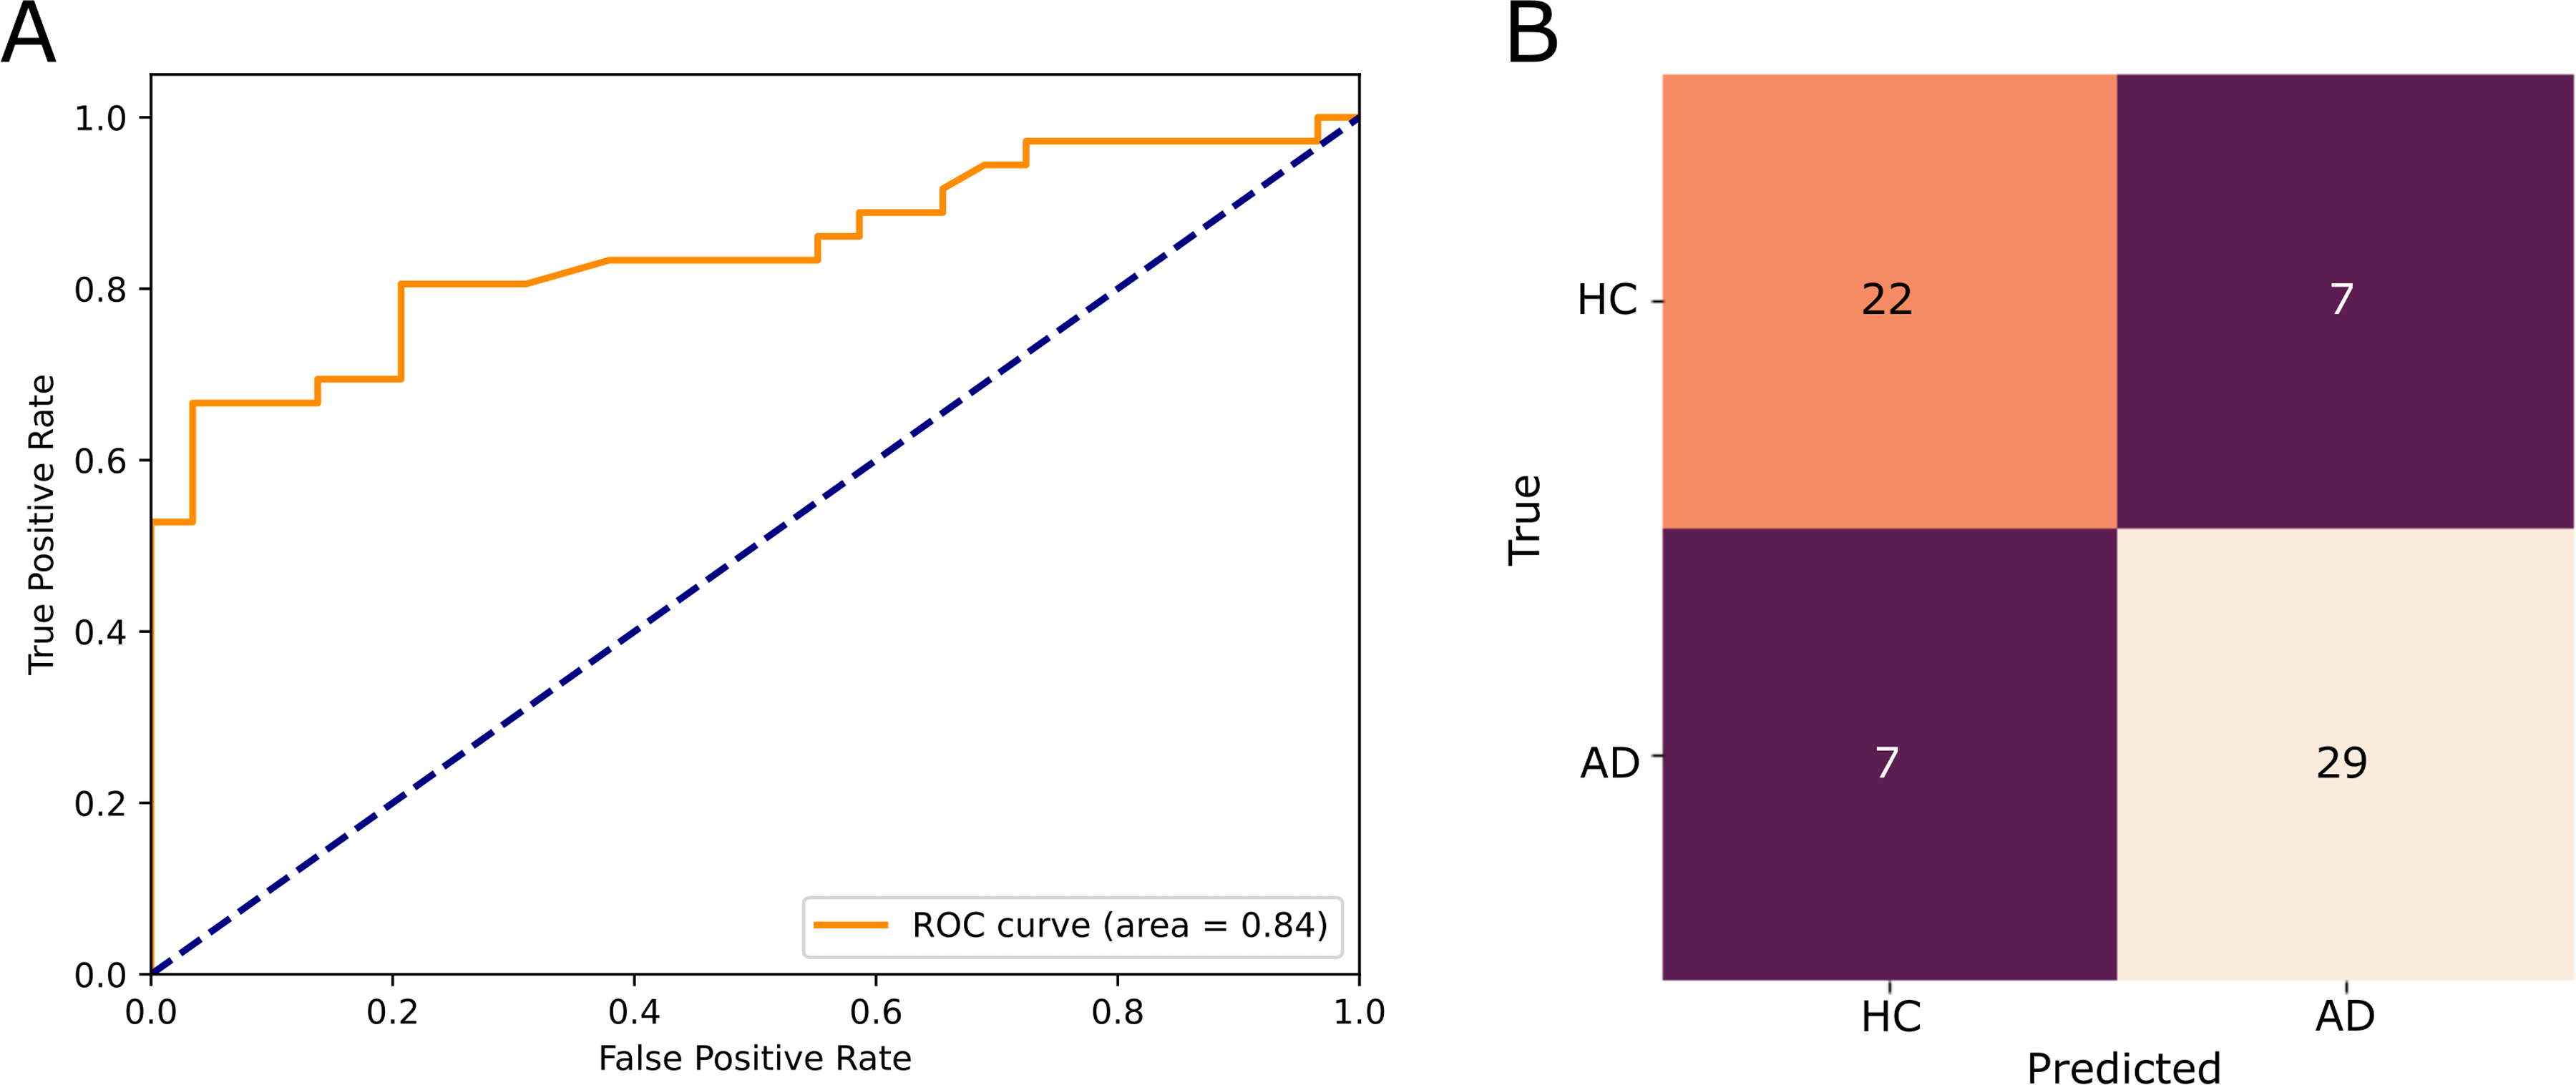
Example classification results from our supervised ML experiments derived from Hjorth features. (A) An example receiver operating characteristic (ROC) curve showing separability between Alzheimer's disease (AD) and healthy control (HC) groups. (B) A confusion matrix depicting classification results (vertical axis: true label; horizontal axis: predicted label). Misclassifications were balanced between AD and HC groups, suggesting minimal overfitting in our final prediction models. AD: Alzheimer's disease; HC: healthy control; ROC: receiver operating characteristic.
Classification performance varied considerably across different feature subsets, as depicted in Figure 3. The strongest performance was observed when the entire feature set was utilized (0.86 ± 0.02), while microstate durations yielded the weakest performance (0.52 ± 0.05). Feature groups derived from frontal electrodes F3 and F4 performed particularly well, achieving AUROCs of 0.85 ± 0.04 and 0.84 ± 0.03, respectively. Complexity features, including Hjorth parameters, also distinguished between groups effectively, with an AUROC of 0.85 ± 0.02, and Higuchi fractal dimension features reaching an AUROC of 0.80 ± 0.02. Among the connectivity features analyzed, alpha band connectivity emerged as the strongest predictor, yielding an AUROC of 0.75 ± 0.03.
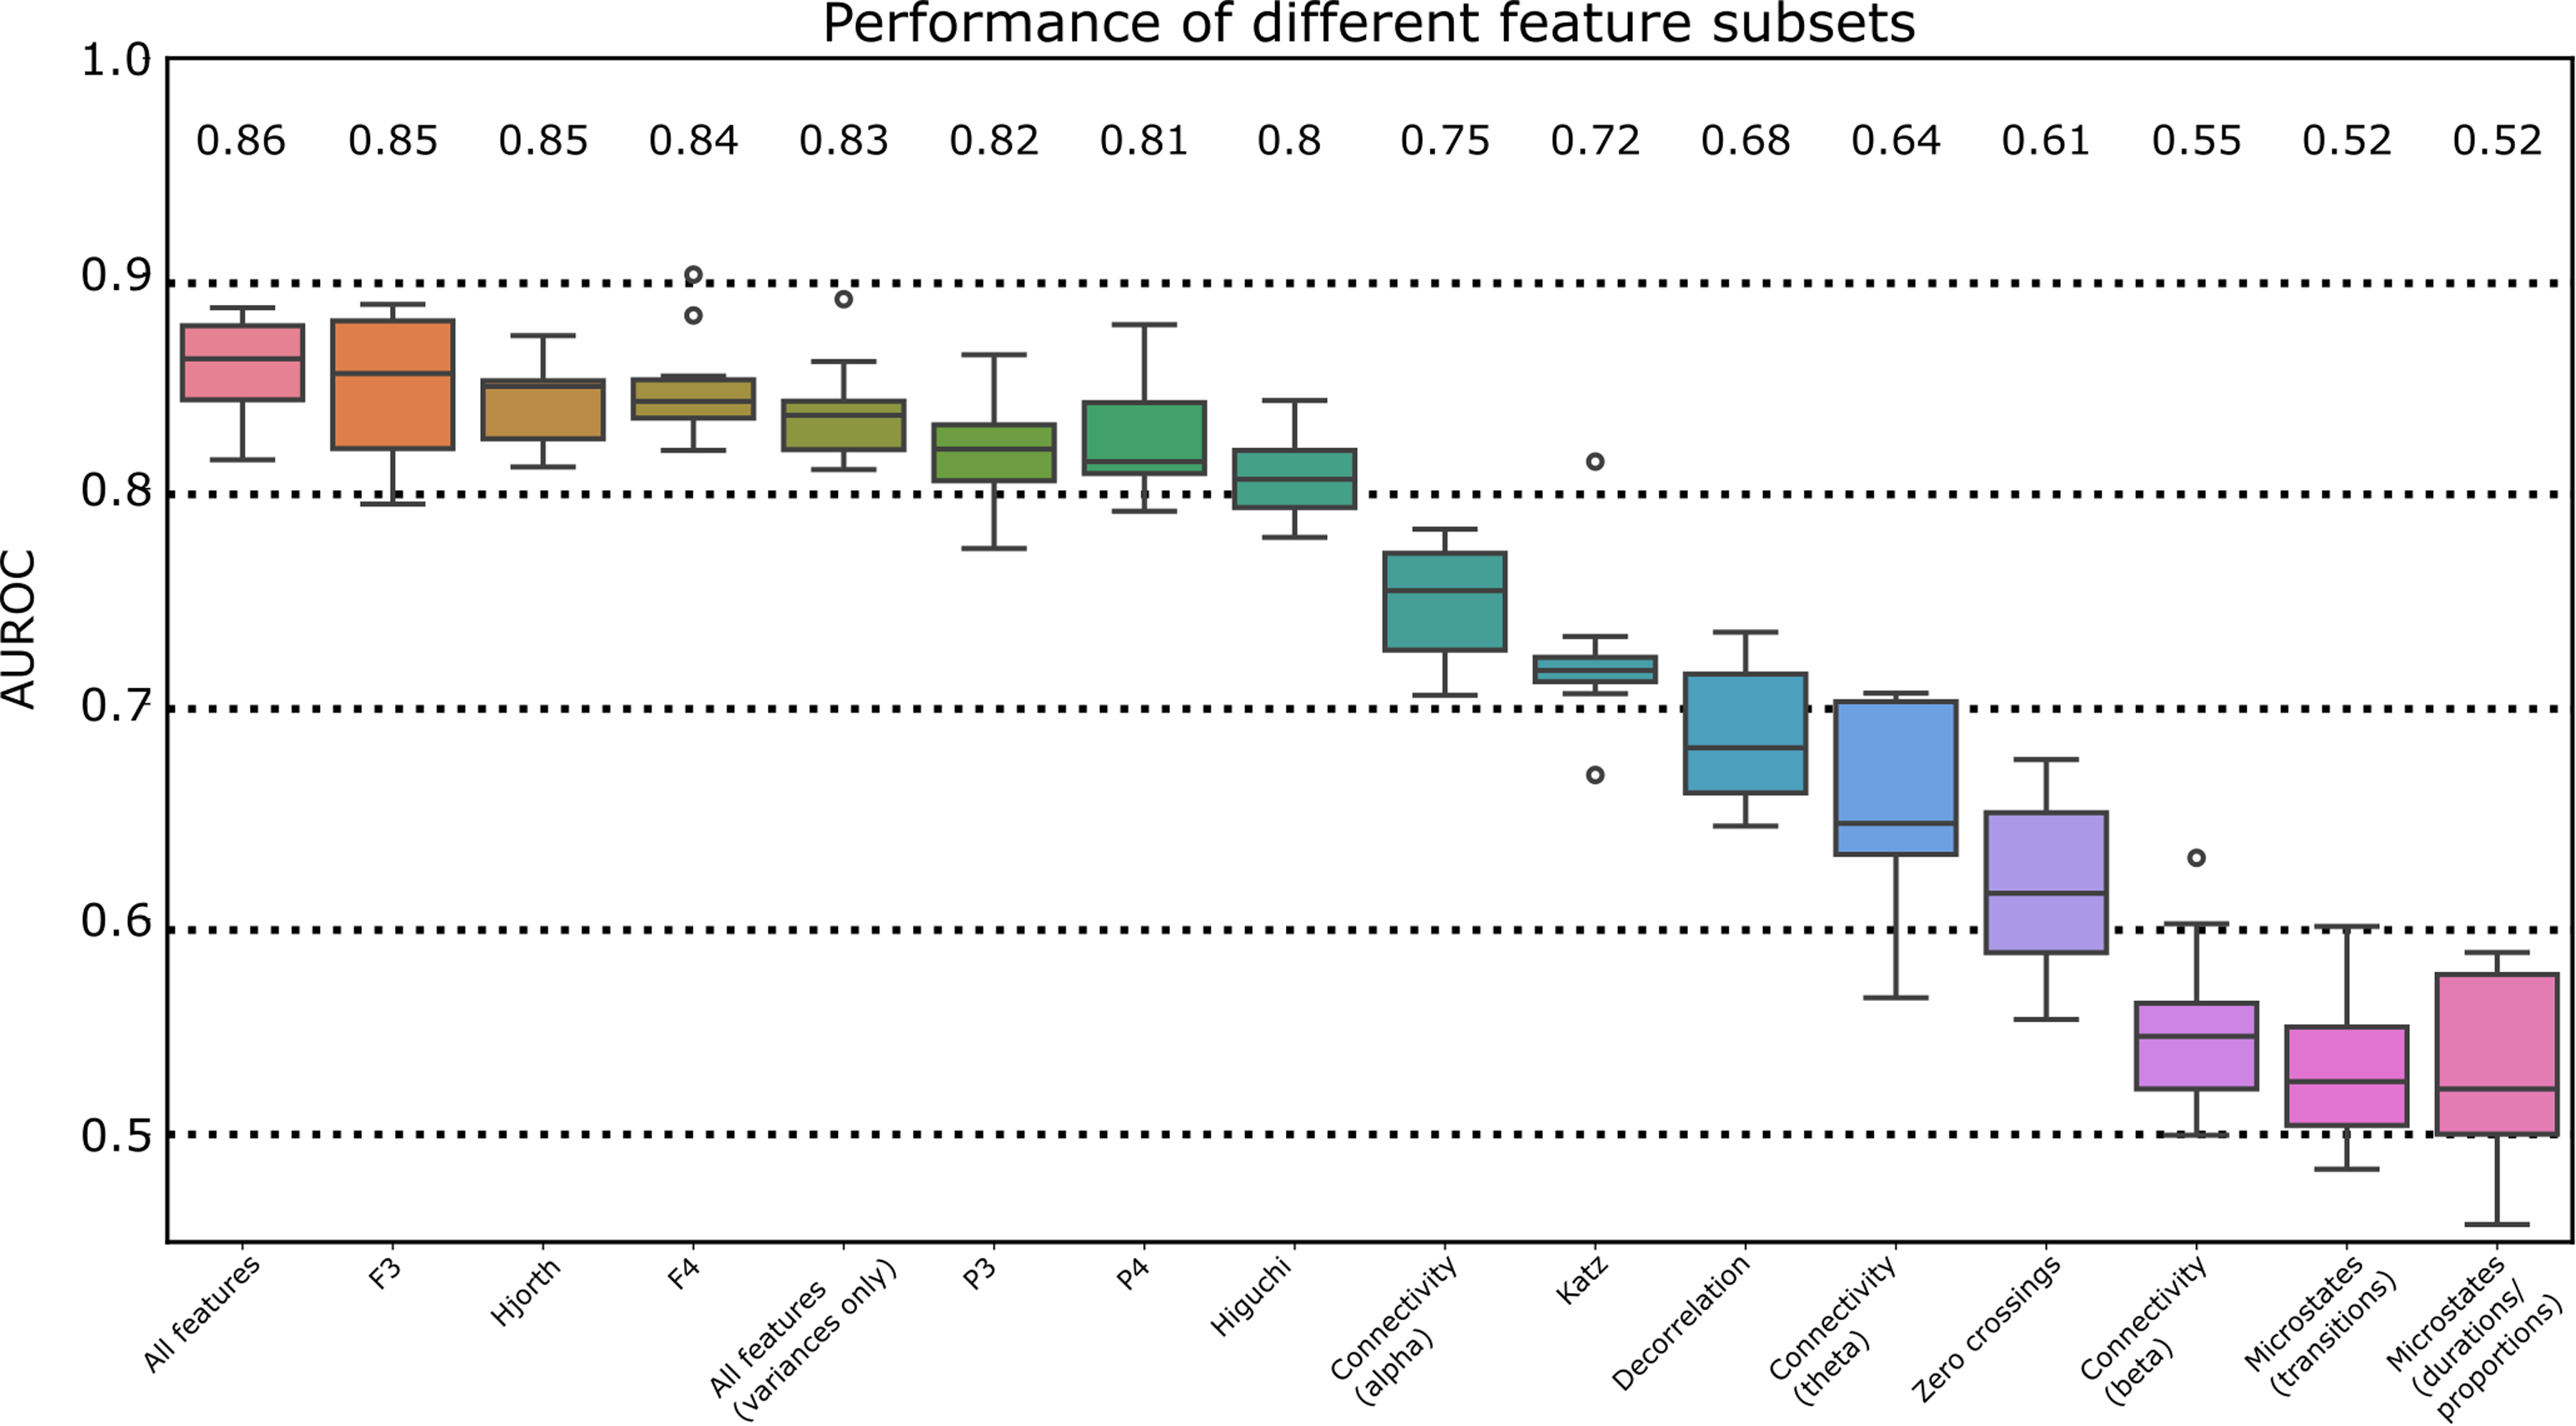
Performance of different feature subsets. Feature subset classification performances were compared based on the area under the receiver operating characteristic curve (AUROC). Individual feature subsets are indicated along the horizontal axis. F3, F4, P3, and P4 refer to the corresponding EEG electrodes. Hjorth refers to Hjorth complexity and Hjorth mobility. Higuchi refers to Higuchi fractal dimension features. Connectivity refers to pairwise connectivity between sensors in specific frequency bands (theta: 4–8 Hz, alpha: 8–12 Hz, beta: 12–25 Hz). Katz refers to Katz fractal dimension. Decorrelation refers to decorrelation time. Microstates (transitions) refer to pairwise microstate transition probabilities. Microstates (durations/proportions) refer to microstate-wise durations and proportions of the overall sample (as a percent). AUROC: area under the receiver operating characteristic curve.
Discussion
In this study, we evaluated our novel end-to-end pipeline to detect changes in EEG activity associated with AD and its severity. Our findings indicate that we can effectively distinguish between AD and HC groups, achieving AUROC values greater than 0.80 across multiple feature subsets. This level of performance is competitive with other approaches and is considered a strong detection capability. 47 Additionally, we found moderate correlations between individual EEG features and MMSE scores, suggesting a meaningful relationship between EEG-derived metrics and cognitive functioning in AD.
Our goal was to assess the efficacy of our approach in differentiating EEG-derived features in individuals with AD compared to HC participants. Our results are comparable to previous studies, including the work by Miltiadous et al. (2024), which reported an AUROC of 0.84 using feature-based methods and tree-based classifiers such as CatBoost, XGBoost, and LightGBM on the same dataset. 22 They also achieved an AUC of 0.90 using a novel neural network architecture called the Dual-Input Convolutional Encoder Network (DICE-net). 48 While deep learning models like DICE-net may provide superior performance, they often lack interpretability compared to feature-based approaches. However, the authors did conduct an explainability analysis of the extracted features.
Additionally, Chedid et al. (2022) 49 utilized a feature-based machine-learning approach for identifying potential AD biomarkers, achieving an AUC of 0.86 on a different dataset. Other studies employing specific feature subsets from EEG data have reported accuracies ranging from 0.75 to 0.95, depending on the dataset and features used. 21 Collectively, these results highlight the presence of characteristic changes in brain activity associated with AD, with performance differences being minor and possibly attributable to intrinsic variations in the datasets analyzed.
In addition to assessing pure classification performance, we aimed to explore the ability of different feature types to detect AD and evaluate their differential classification efficacy. Notably, some of the strongest individual feature subsets we identified, excluding the “all features” and “all inter-epoch variability features” categories, fell within signal complexity. Previous studies have consistently demonstrated that signal complexity is a robust AD detector across various samples and recording conditions. 21 This aligns with the findings of Zúñiga et al. (2024), 50 which highlighted the relationship between reduced signal complexity and disease progression in patients with AD.
Several parameters related to signal complexity have been observed to decrease the alpha band among patients with AD compared to healthy elderly individuals. Specifically, multiscale fuzzy entropy, 31 spectral entropy, 32 and sample entropy 42 have all shown significant reductions. This decline in complexity may reflect a loss of connectivity within active neural networks, impairing information processing and cortical activity, contributing to the cognitive decline seen in patients with AD. 51 Our findings of correlations between MMSE scores and individual EEG features further support the notion that complexity and entropy-related features could serve as valuable indicators of AD progression.
Beyond signal complexity, we observed increased frontal theta power and decreased frontal alpha power in patients with AD. These findings align with the literature, which recognizes a general slowing of EEG rhythms in individuals with AD, as discussed in reviews by Jeong (2004), 26 Özbek (2021), 52 and Dauwels et al. (2009). 53 Our results reinforce this observation, indicating a shift toward slow-wave EEG activity and suggesting that frontal regions are particularly sensitive to the onset of neurodegenerative diseases. The reduced activation of cortical networks in the frontal lobes is hypothesized to arise from dysfunction in cholinergic systems, which play a crucial role in modulating neural activity. Specifically, these cholinergic systems can induce low-frequency rhythms while suppressing higher-frequency ones. 54 Pathological impairments of cholinergic pathways in patients with AD may lead to observable changes in EEG rhythms.
Additionally, the deterioration and neural atrophy typically seen in the hippocampus have been associated with increased low-frequency activity, although this is usually expected in temporoparietal regions. 55 Babiloni et al. (2009) 56 suggested a positive correlation between hippocampal grey matter and alpha rhythms, potentially due to regulatory mechanisms involving cholinergic pathways projecting to the hippocampus. While the “cholinergic hypothesis” does not fully encapsulate the complexities of these neurological changes, 57 the observed shift toward slow-wave activity may relate to impairments in executive function and contribute to the cognitive decline experienced by individuals with AD.
These findings enhance our understanding of AD and its clinical diagnosis, emphasizing the potential of EEG-based analyses, like our automated pipeline, to provide interpretable measures of brain function. Such analyses can complement clinical research and trials, offering valuable insights into the neurophysiological underpinnings of AD.
Various automated EEG preprocessing systems are available, each optimized for specific EEG configurations and properties, as well as different stages of the analytical process. Key differences often arise from whether source-space analysis, projecting EEG signals onto a model of the brain to infer the location of neural activity, or sensor-space analysis is employed. Notable source-space analysis methods include Discover-EEG, FieldTrip, and the recently introduced CiftiStorm.58–60 However, these approaches can introduce variability at several points along the analytical pipeline, particularly during head model creation, and depend on the chosen inverse algorithms and software packages. 61
Low-density EEG systems, such as those with only 19 electrodes, may not be compatible with source-space analysis techniques, 58 necessitating alternative analytical methods. For instance, Brodbeck et al. (2011) 62 demonstrated that electric source imaging sensitivity and specificity were reduced when utilizing a low-density montage (e.g., 19–20 electrodes) compared to high-density setups with 128–256 electrodes. Given that the dataset from Miltiadous et al. (2024) 22 was recorded using a 19-electrode configuration, we opted for sensor-space analysis. This choice addressed the limitations associated with source-space analysis for low-density EEG data. It proved effective, suggesting broader applicability in clinical settings where low-to-mid-density montages are common. 63
The application of EEG in detecting and diagnosing AD holds substantial promise. Its non-invasive nature allows for the identification of functional changes in the brain, enabling early detection of individuals at risk of developing AD before overt symptoms manifest.64,65 This positions EEG as a valuable tool in the broader context of AD research and clinical applications. Recent interest has centered on developing EEG-based biomarkers for AD,16,64 indicating we may be at a pivotal moment for integrating EEG into clinical practice.
It is also possible that the direct applicability of EEG analytics in clinical practice, clinical trials, and research contexts can be aided by the use of tools like normative databases. This enables more detailed comparisons to large, representative samples of controls for individual patients and alleviates the need to collect matched control participants for each new series of clinical participants. There are limitations to overcome regarding matching the characteristics of recording systems and addressing challenges imposed by different recording environments.
Moreover, recent research supports the potential for early diagnosis using EEGs. 66 Timely interventions are crucial in AD management, as they can slow disease progression and enhance patient outcomes. Existing therapies for AD are often more effective when administered early.67–69 However, this emphasis on early treatment comes with the challenge of increased upfront costs for patients and healthcare systems, particularly given the high expenses associated with current AD therapeutics. 70
Incorporating more sensitive biomarkers and innovative disease evaluation technologies may improve efficiencies in clinical trials, potentially reducing the costs of developing novel therapies. Additionally, portable EEG recording technologies are on the rise, 71 which could enhance accessibility and applicability in diverse clinic settings.
Large, representative study populations are essential to ensure the successful implementation of these advancements. This can help mitigate the harmful effects of stigma that may disproportionately impact individuals from different demographic backgrounds. 72 Furthermore, variability in diagnostic confidence and the specifics of tests performed must be considered, as these factors can influence the early diagnosis of AD. 73 It is important to evaluate the potential biases of ML methods to mitigate age- or sex-related risk factors influencing disease detection. Notably, in our present study, we analyzed misclassification proportions as a function of age and sex, and we did not observe consistent differences across test-set folds on average. This demonstrates the potential of approaches such as ours for developing generalizable ML detection systems for AD. Overall, integrating EEG into clinical practice for AD diagnosis and management represents a promising frontier in neurodegenerative disease research.
Limitations
Several limitations should be acknowledged in this study. First, the sample size may limit the generalizability of our findings and may not capture the full variability in the broader population of healthy individuals and patients with AD. Nonetheless, our unsupervised UMAP embedding showed good separability between groups, indicating a high signal-to-noise ratio for classification within the dataset. Future work will require an exploration of the external validity of the present modeling results using separate datasets to further mitigate the risk of bias in extensions of our present results. Another limitation is the sex distribution; the AD group comprised 24 females and 12 males, while the HC group included 11 females and 18 males. This unequal representation may introduce biases and limit our ability to perform subgroup analysis to assess whether AD affects male and female participants differently. It is known that AD affects females more than males, with women at higher risk and experiencing faster progression due to factors like hormonal influences, differences in brain structure, and longer life expectancy. 74 This could be further explored with larger, more-representative datasets. Our misclassification demographics analysis, however, did not indicate differences in the sex distribution of misclassified participants. Additionally, we aimed to evaluate our pipeline's capability to capture changes in brain activity across the AD severity spectrum, but we were limited to a cross-sectional analysis rather than a longitudinal one, which would provide deeper insights into the pathological changes associated with AD progression.
Conclusions
This study demonstrated that a novel, end-to-end EEG processing and analysis pipeline can effectively distinguish between patients with AD and control participants while capturing cross-sectional indicators of disease progression. These findings support the potential use of EEG for biomarker generation and clinical applications in AD, including within clinical trials. Continued research in larger, representative samples could enhance the utility of digital biomarkers like EEG in neurology, ultimately advancing diagnostics and therapeutics in AD.
Footnotes
Acknowledgements
The authors have no acknowledgments to report.
ORCID iDs
Ethical considerations
Not applicable
Consent to participate
Not applicable
Consent for publication
Not applicable
Funding
The authors received no financial support for the research, authorship, and/or publication of this article.
Declaration of conflicting interests
The authors declared the following potential conflicts of interest with respect to the research, authorship, and/or publication of this article: N.S. and I.E.H. are Co-Founders of Cove Neurosciences Inc., a company that commercializes EEG analyses related to that described in this article. They have financial interests in the company. L.E.R.S. is the Chief Data Scientist and Director of R&D at Cove Neurosciences Inc. and has a financial interest in the company. E.E.R. is a Senior Neuroscience Liaison at Cove Neurosciences Inc. and has a financial interest in the company.
Data availability
Data are available from doi:10.18112/openneuro.ds004504.v1.0.8.