
Abstract
Background
Lipopolysaccharides from Porphyromonas gingivalis (P.gLPS) are involved in the pathology of Alzheimer's disease (AD). However, the effect of P.gLPS on synaptic defects remains unclear.
Objective
In this study, we tested our hypothesis that P.gLPS induces synaptic defects in a low-amyloid-beta (Aβ)-concentration environment.
Methods
MG6 microglia or N2a neurons was treated with P.gLPS (0.1 μg/mL), soluble Aβ42 (0.1 μM) or AL (combined P.gLPS and soluble Aβ42 at 0.1 μM).
Results
In cultured MG6 microglia, increased the mRNA expression of TNF-α, IL-1β and IL-6 and the TNF-α release in parallel with increased NF-κB activation. In cultured N2a neurons, treatment with Aβ42, P.gLPS, and AL did not affect the mRNA expression of synapsin1 (SYN1) or post-synaptic density protein-95 (PSD-95). However, the treatment with conditioned medium from AL-exposed MG6 microglia (AL-MCM) significantly reduced the mRNA and protein expression of SYN1, PSD-95, and nuclear translocation of repressor element-1 silencing transcription factor (REST) but significantly increased the mRNA expression of TNF receptor type I (at 48 h) and glycogen synthase kinase (GSK)3β (at 24 h). TWS119 pretreatment (5 μM), a GSK3β specific inhibitor, significantly reversed the AL-MCM-induced reduction in the mRNA expression of SYN1 and PSD-95 and nuclear translocation of REST in cultured N2a neurons. In APPNL-F/NL-F mice, the immunofluorescence intensity of SYN1 and PSD-95 in cortical neurons was positively correlated with the index of the memory test but negatively correlated with that of TNF-α-positive microglia.
Conclusions
These observations demonstrate that P.gLPS induces neuronal GSK3β-dependent synaptic defects in a low-Aβ concentration environment via microglial activation.
Keywords
Introduction
Alzheimer's disease (AD) is the most common type of dementia1,2 and over 95% of patients with AD acquire a late-onset or sporadic form later in life.3,4 With the global increase in ageing populations, the prevention of AD to delay its onset or slow pathological progression has become an urgent priority.
The two neuropathological hallmarks that characterize AD are amyloid-β (Aβ)-aggregated senile plaques and hyperphosphorylated tau-aggregated neurofibrillary tangles.5,6 Aβ accumulation occurs earlier than tau hyperphosphorylation, which begins 15–20 years before clinical symptoms occur in AD patients. 7 In addition, neuroinflammation, which is initiated by pro-inflammatory factors such as tumor necrosis factor-alpha (TNF-α), interleukin (IL)-1β, and IL-6, all promote Aβ accumulation and tau hyperphosphorylation,5,6 resulting in neuronal damage in the AD brain.8,9
Previous studies have shown that a high concentration of soluble Aβ42 (>5 μM) induces the production of pro-inflammatory mediators, including IL-6, from microglia, suggesting that soluble Aβ is responsible for microglial activation before Aβ senile plaque formation.10,11 However, a low amount of soluble Aβ42 (1 μM) fails to provoke neurotoxic responses of microglia.11,12 Notably, lipopolysaccharides (LPS) from Porphyromonas gingivalis (P.g), the keystone pathogen of periodontitis, 13 was discovered in AD brains, which promotes microglial activation by binding to toll-like receptor (TLR) 2 and TLR4.14–17
Synapses comprise pre-synaptic and post-synaptic terminals that are sustained by synaptic proteins.18,19 Synapsin1 (SYN1), a pre-synaptic marker, is associated with synaptic vesicle fusion, which is critical for pre-synaptic synapse formation and modulation of neurotransmitter release, 20 while post-synaptic density protein-95 (PSD-95), a post-synaptic marker, is specifically enriched at post-synaptic terminals to maintain the post-synaptic structures and functions. 21 Furthermore, SYN1 and PSD-95 regulate the maturation of pre- and post-synaptic terminals.22,23 Clinically, a reduction in SYN1 and PSD-95 expression has been detected in the patients with mild cognitive impairment (MCI).24,25 Synaptic loss is closely related to cognitive decline even before AD onset. 26 We previously found that LPS from P.g (P.gLPS) induces microglia-related neuronal Aβ accumulation and tau hyperphosphorylation.8,17 However, the impact of P.gLPS treatment on synaptic defects in a low-Aβ-concentration environment is unclear.
The nuclear translocation of repressor element-1 silencing transcription factor (REST) is reported to play a neuroprotective role, whereas the loss of REST nuclear translocation is associated with the onset of AD in humans.27,28 In addition, REST is involved in regulating PSD-95 expression and synaptic function. 29 Conversely, glycogen synthase kinase (GSK)3β is involved in accelerating both tau pathology and neuroinflammation; hence, it is considered as an AD promoting kinase.8,30 Furthermore, GSK3β is highly enriched in synapses and is known as an important regulator of synaptic functions. 31 GSK3β activation also reduces the nuclear translocation of REST in neurons after exposure to neurotoxic prion peptides.32,33
The physiological concentration of Aβ42 in the brain is approximately 0.1 to 10 nM, which is known to increase 10,000 times following AD pathogenesis,34–36 0.1 μM Aβ42 is considered a suitable concentration to mimic the amount of Aβ42 in the brain before or during AD onset. In this study, we tested our hypothesis that P.gLPS induces synaptic defects in a low-Aβ-concentration environment. In this study, we used cultured microglial cells, cultured neuronal cells, and amyloid precursor protein knock-in mice carrying the Swedish and Beyreuther/Iberian mutation (APPNL-F/NL-F), in which Aβ was detected in the brain.8,37
Methods
Animals
APPNL-F/NL-F mice with a C57BL/6 background were purchased from Riken (Japan) 37 and were maintained under specific pathogen-free conditions. The animals were treated according to methods approved by the Institutional Animal Care and Use Committee of Kyushu University (A29-219-0). Ten-month-old APPNL-F/NL-F mice carrying Swedish and Beyreuther/Iberian mutations (n = 6) were intraperitoneally administered with P.gLPS (1 mg/kg/day; InvivoGen) for 7 days. Age-matched APPNL-F/NL-F mice (n = 6) without P.gLPS administration were used as controls.
Step-through passive avoidance test
The step-through avoidance test was performed as previously described.8,17 Briefly, mice were subjected to electric shocks in the feet (0.8 mA, 16 s, twice) when they entered the dark room from the light room. The memory test was performed on day 7 after systemic exposure to P.gLPS, and non-exposed mice were used as controls. Latency was recorded within 300 s when the mice entered the dark room from the light room. Six mice from each group were used in this study (n = 6).
Cell culture
The mouse microglial cell line MG6 (RIKEN Cell Bank) and mouse neuroblastoma cell line N2a (CCL-131) neurons (ATCC) were cultured in Dulbecco's modified Eagle's medium (Nissui) containing 10% fetal bovine serum (Gibco) supplemented with 100 µM β-mercaptoethanol (Sigma), 10 µg/mL insulin (Sigma), and 1% penicillin-streptomycin (Gibco), according to previously described protocols.8,17 The cells were incubated in 5% CO2 at 37 °C.
Cell treatment
MG6 microglia and N2a neurons were treated with soluble Aβ42 (0. 1 μM; Peptide Institute), P.gLPS (0.1 µg/mL; invivoGen) or AL (combined Aβ42 at 0.1 μM with P.gLPS at 0.1 µg/mL) for 72 h. N2a neurons were treated with conditioned media from Aβ42-, P.gLPS-, or AL-exposed MG6 microglia (Aβ-MCM, P.gLPS-MCM, or AL-MCM) for 48 or 72 h. Untreated MCM (MCM) was used as a control medium.
Cell viability assay
MG6 microglia and N2a neurons were seeded into 96-well plates. The cells were treated with soluble Aβ42, P.gLPS, or AL for 24–72 h. Cell viability was examined using a Cell Counting Kit-8 (Dojindo Molecular Technologies) in accordance with the manufacturer's protocol.
Quantitative polymerase chain reaction (qPCR) validation
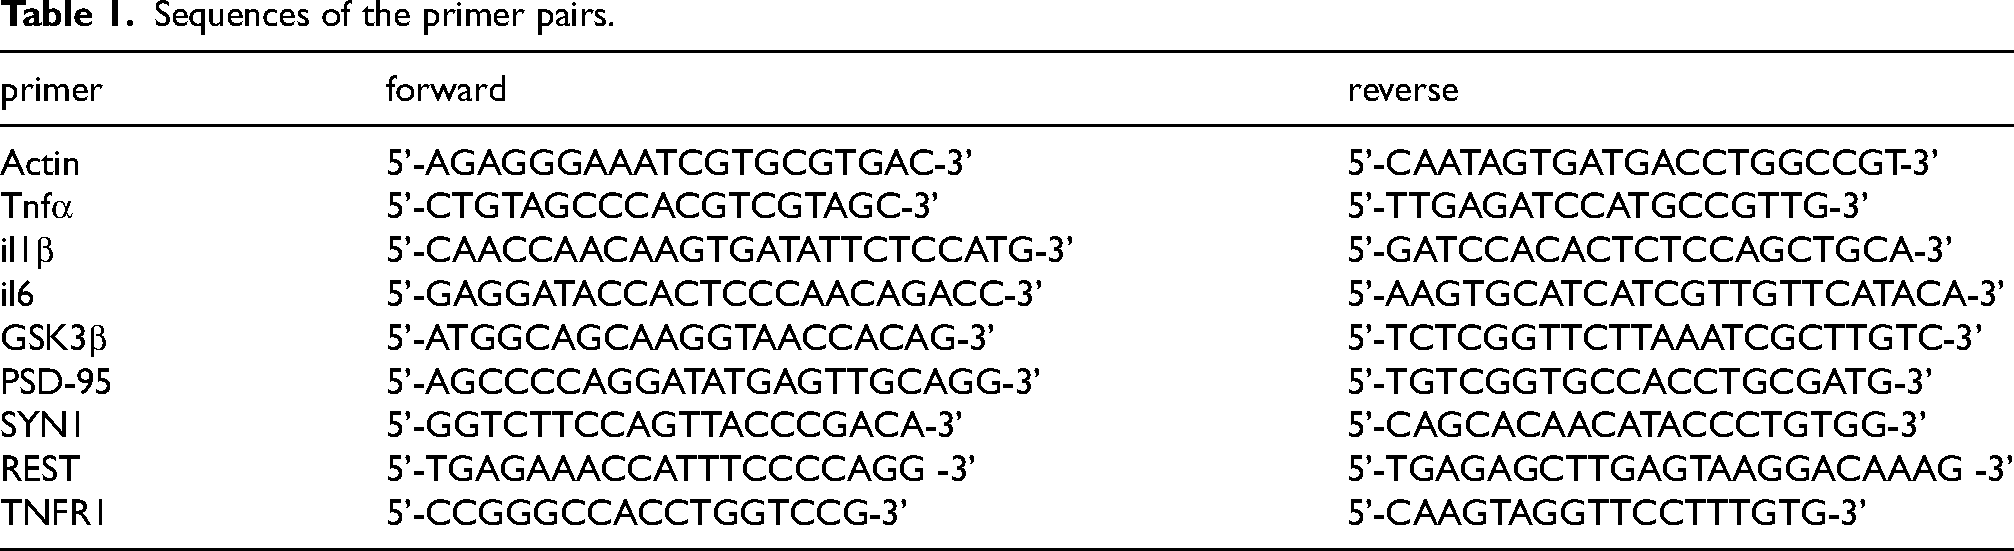
N2a neurons and MG6 microglia were treated with Aβ42, P.gLPS, or AL. N2a neurons were treated with Aβ42-, P.gLPS-, or AL-MCM or pre-treated with TWS119 (specific GSK3β inhibitor; 5 μM; SEKKECKCHEM) for 1 h before treatment with AL-MCM for 48 h, 60 h, or 72 h. Total RNA from the control and treated N2a neurons or MG6 microglia was extracted using RNAiso Plus (Takara Bio.) according to the manufacturer's instructions. A total of 1 μg of extracted RNA was reverse-transcribed to cDNA using ReverTra Ace qPCR RT Master Mix (TOYOBO). cDNA was amplified in duplicate using the THUNDERBIRD SYBR qPCR Mix (TOYOBO) with a StepOnePlus™ Real-Time PCR System. The primer pair sequences are listed in Table 1. The expression levels determined by qPCR were based on the relative quantification of the reference gene β-actin, and the data were evaluated using 2−ΔΔCT.
Sequences of the primer pairs.
Western blot
Immunoblotting analysis of MG6 microglia and N2a neurons was conducted as described previously.10,21 For nuclear immunoblotting analyses, cells were harvested, and nuclei were isolated using a Nuclear Extraction Kit (Abcam). Briefly, each sample was separated on 8%, 10%, or 12% sodium dodecyl sulfate-polyacrylamide gels. Proteins on sodium dodecyl sulfate-polyacrylamide gels were transferred onto polyvinylidene difluoride membranes. After blocking with 5% skim milk in Tris-buffered saline/Tween 20, membranes were incubated with primary antibodies at 4 °C overnight. The primary antibodies included mouse anti-phospho-IκBα, rabbit anti-IκBα, rabbit anti-p65, mouse anti-Lamin B1, rabbit anti-SYN1, rabbit anti-PSD-95, rabbit anti-REST, rabbit anti-phospho S396, and mouse anti-actin antibodies. After gentle washing, the membranes were incubated with horseradish peroxidase (HRP)-linked anti-mouse or anti-rabbit antibody for 2 h at room temperature. Subsequently, membrane-bound HRP-linked antibodies were visualized using ImmunoStar LD (FUJIFILM) with an image analyzer (LAS-4000 Mini). For additional antibody information, see Supplemental Table 1.
Enzyme-linked immunosorbent assay (ELISA)
Cultured MG6 microglia (density, 5 × 10⁵ cells/mL) were exposed to Aβ42, P.gLPS, or AL. The conditioned media were collected from 3 to 48 h after incubation, and the levels of IL-1β, IL-6, and TNF-α released from microglia were measured using ELISA kits (R&D Systems) in accordance with the manufacturer's instructions.
Fluorescence detection of reactive oxygen species (ROS)
Mitochondrial ROS production in MG6 microglia was determined using MitoSOX Red (Invitrogen) 38 and intracellular ROS production in MG6 microglia was determined using the ROS Assay Kit-Highly Sensitive DCFH-DA (Dojindo). Briefly, MG6 microglia in 8-well chamber slides (1 × 10⁵ cells/well) were exposed to Aβ42, P.gLPS, or AL. Mitochondrial ROS fluorescence was detected 3 h after treatment, in accordance with the manufacturer's protocol, and images were collected with a 40× objective lens using a confocal laser scanning microscope (C2si; Nikon). ROS staining was performed 24 h after treatment according to the manufacturer's protocol, and images were collected using a 20× objective lens and a confocal laser scanning microscope (C2si; Nikon).
Immunofluorescence imaging
For immunofluorescence staining of N2a neurons, cells were fixed with 4% PFA (Sigma Aldrich) solution for 10 min and permeabilized with 0.1% Triton X-100 for 5 min at room temperature. After blocking with 3% BSA in phosphate-buffered saline (PBS), the cells were incubated overnight with rabbit anti-REST at 4 °C. After washing thrice with PBS, the cells were incubated with donkey anti-rabbit Alexa Fluor 488 (1:1000) at room temperature for 2 h. After washing three times with PBS, the cell nuclei were stained with Hoechst (1:500, Sigma-Aldrich) for 5 min and mounted with Vectashield anti-fading medium (Vector Laboratories).
For immunofluorescence staining of APPNL-F/NL-F mouse brain tissue, the mice were anaesthetized, and intracardiac perfusion was performed with PBS. Brains were removed from the skull, immersed in 4% PFA overnight at 4 °C, and dehydrated for 2 days in 30% sucrose. Frozen brain slices (14 µm thick) were cut as previously described.8,17 After washing with PBS, the brain slices were incubated with primary antibodies, including MAP-2 with SYN1 or PSD-95, or Iba1 with TNF-α overnight at 4 °C, and subsequently incubated with donkey anti-goat cy3 and donkey anti-rabbit Alexa Fluor 488 or donkey anti-goat Alexa Fluor 488 or donkey anti-rabbit cy3 at room temperature. After each incubation step, the samples were washed three times with PBS, incubated with Hoechst (1:200), and mounted in Vectashield anti-fading medium. Fluorescence images of N2a neurons and APPNL-F/NL-F mouse brains were obtained using a confocal laser microscope (C2si, Nikon). For additional antibody information, see Supplemental Table 1.
Statistical analysis
All the data were generated from at least three replicates of independently prepared samples. Data are presented as the mean ± standard deviation (SD). Statistical analyses were performed using one-way analysis of variance (ANOVA) with Tukey's post hoc test and Student's t – test. The GraphPad Prism software package (GraphPad Software Inc.) was used to determine p-values. Statistical significance was set at p < 0.05. Correlations were examined using Spearman's rank test.
Results
Expression of SYN1 and PSD-95 in N2a neurons post exposure to P.gLPS and Aβ
We first tested the expression of SYN1 (pre-synaptic marker) and PSD-95 (post-synaptic marker) in cultured N2a neurons during exposure to soluble Aβ42, P.gLPS, or AL. In comparison to non-treated (control) N2a neurons, the mRNA expression of SYN1, PSD-95, and GSK3β was not changed in N2a neurons at 24 h or 48 h after exposure to Aβ42, P.gLPS, or AL (Figure 1A-C). In addition, the viability of N2a neurons was not affected by exposure to Aβ42, P.gLPS, or AL from 24 to 72 h compared to that of control N2a neurons (Figure 1D).
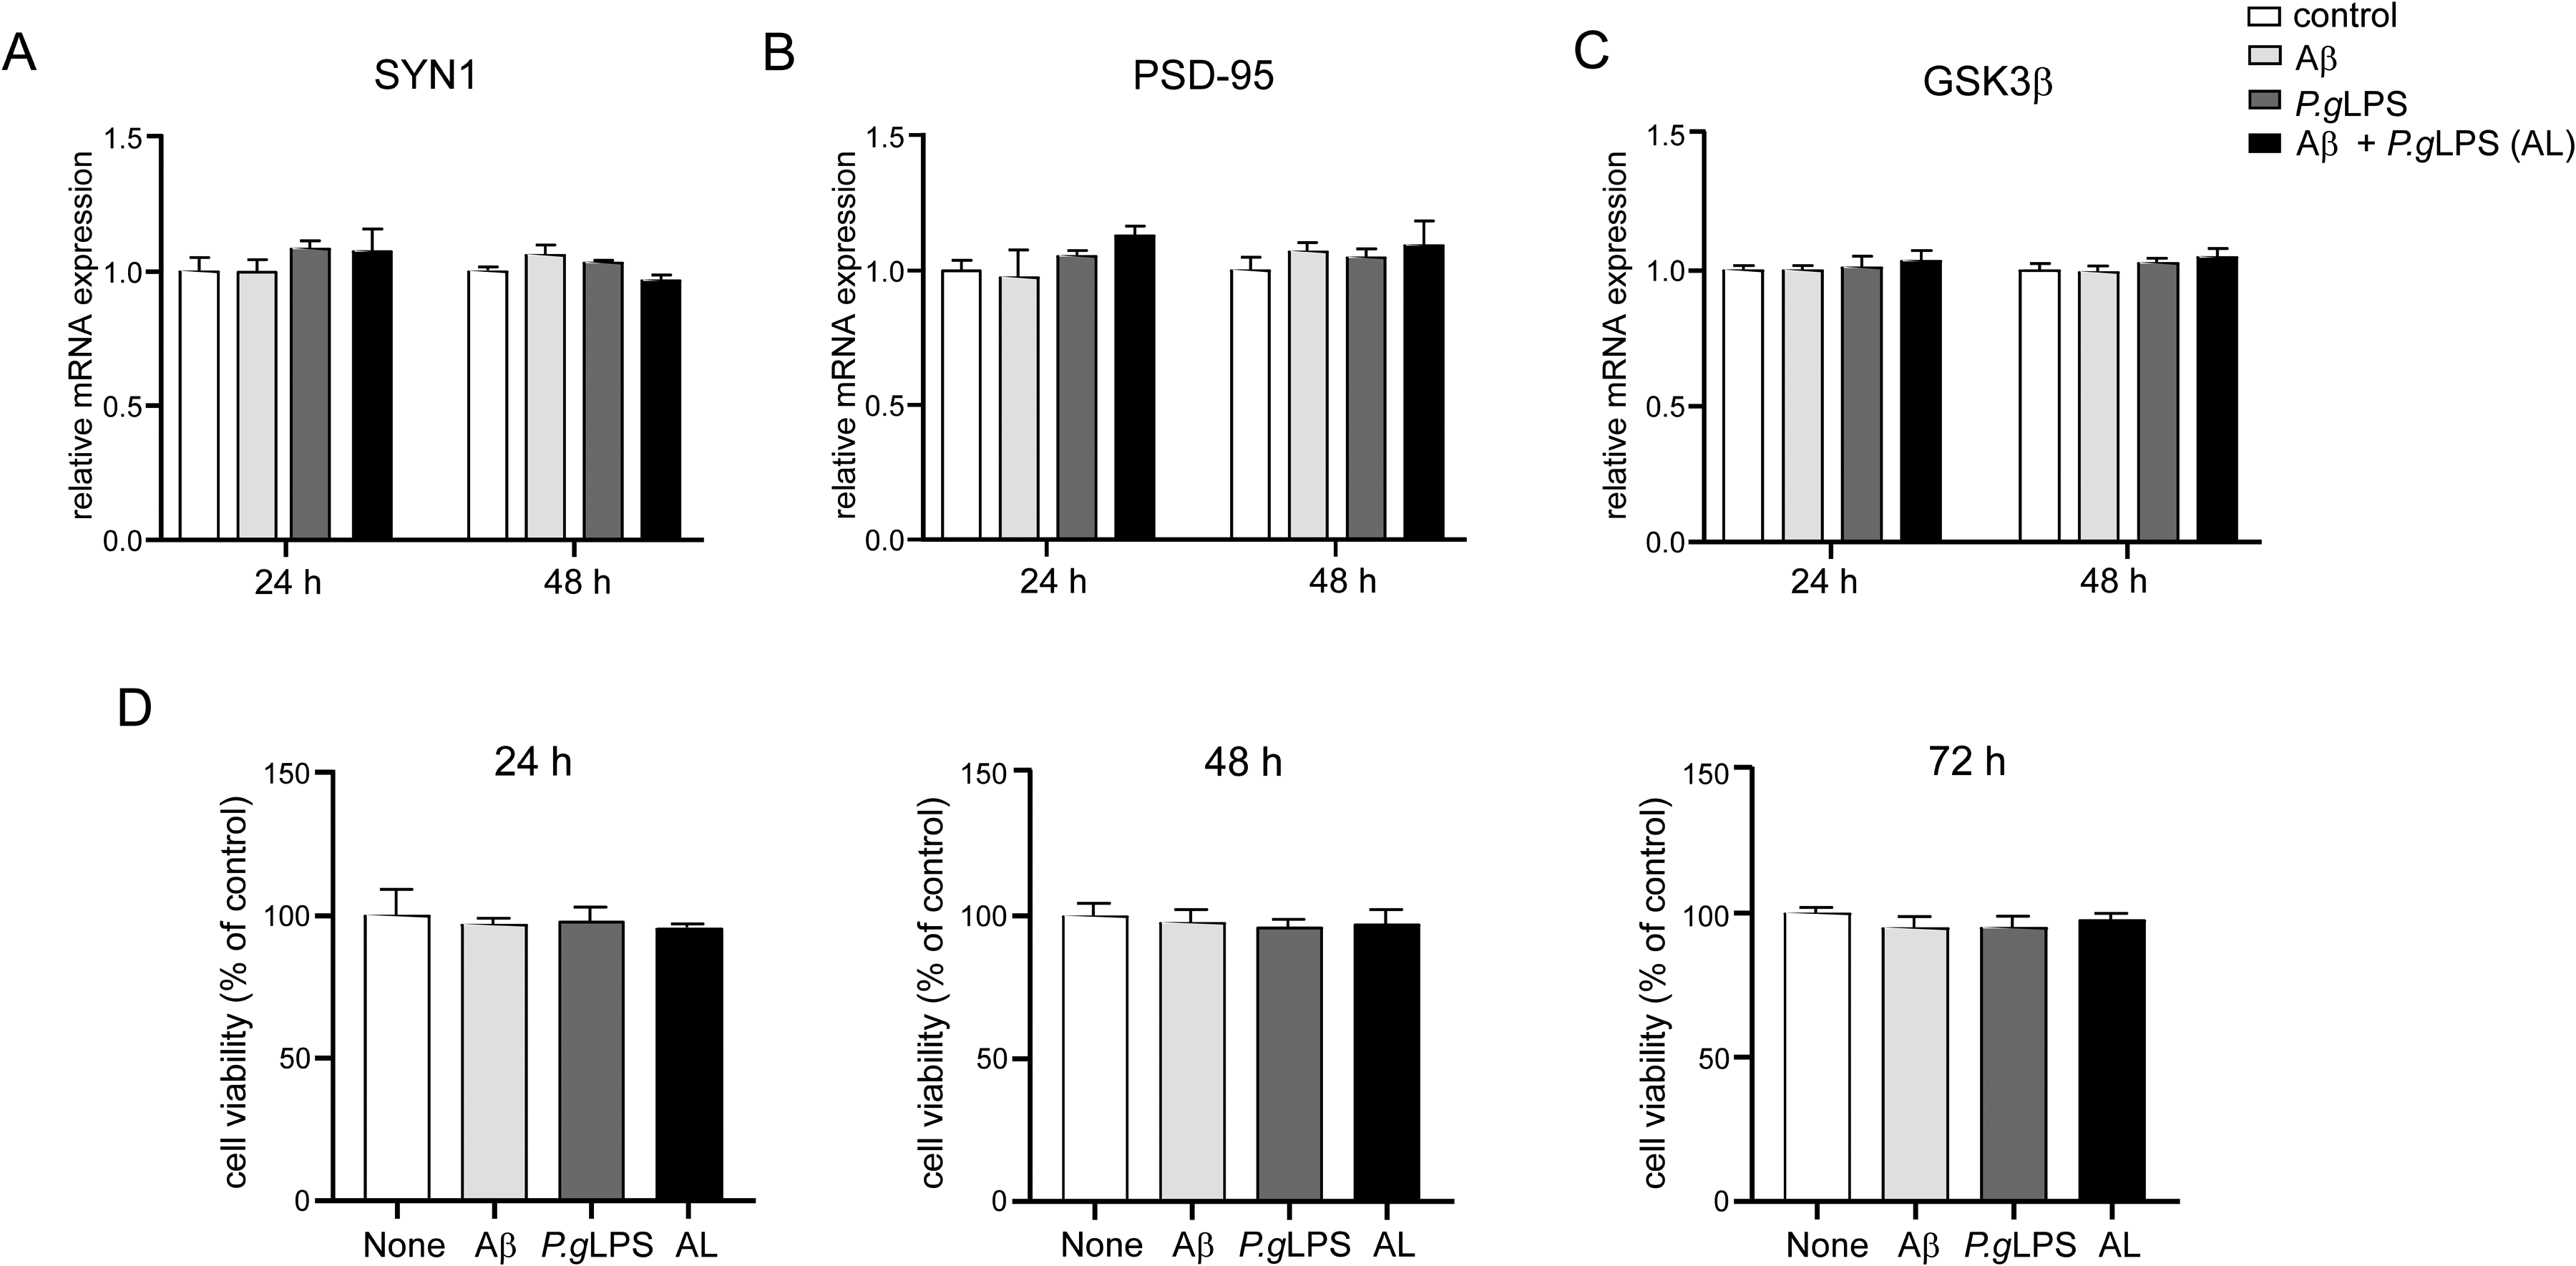
The expression of SYN1 and PSD-95 in N2a neurons post exposure to P.gLPS and Aβ42. The mRNA expression of A) SYN1, B) PSD-95 and C) GSK3β in N2a neurons after exposure at variable time points to Aβ42 (0.1 μM), P.gLPS (0.1 μg/mL) and Aβ42 combined with P.gLPS (0.1 μM, 0.1 μg/mL, AL), compared with the control cells. D) The cell viability of N2a neurons after exposure to all of the above-described treatments for the stated time points, as compared with the controls, showed no statistically significant difference. Each column and bar represent the mean ± SD (n = 3) for each variable.
Microglia activation post exposure to P.gLPS and Aβ
Next, we examined the responses of cultured microglia to the same concentrations of Aβ42, P.gLPS, or AL as those used to treat cultured N2a neurons. Compared to untreated (control) MG6 microglia, significantly increased mRNA expression of IL-1β, IL-6, and TNF-α was found at 3 h in the P.gLPS-exposed MG6 microglia and AL-exposed MG6 microglia, but not in Aβ-exposed cells (Figure 2A-C); the mRNA expression of TLR2, but not TLR4, was highly increased at 3 h in the P.gLPS-exposed MG6 microglia and AL-exposed MG6 microglia (12.1- and 13.1-fold increases; respectively), and the mRNA expression of TLR2 was significantly higher in the AL-exposed MG6 microglia than in the P.gLPS-exposed microglia (8.3% increase; Supplemental Figure 1A). The mRNA expression of TLR4 was significantly higher at 3 h in Aβ-exposed microglia than in control cells (1.20-fold increase; Supplemental Figure 1B). In comparison to control MG6 microglia, a significant and time-dependent increase in TNF-α production and release was detected beginning at 3 h in AL-exposed MG6 microglia and at 12 h in P.gLPS-exposed MG6 microglia, but not in Aβ-exposed microglia (Figure 2D). The amount of TNF-α released from AL-exposed MG6 microglia was significantly higher than that from P.gLPS-exposed microglia after 6 h and reached 1.7-fold higher at 48 h (Figure 2D). However, neither IL-1β nor IL-6 release was detected in Aβ-, P.gLPS-, or AL-exposed MG6 microglia from 3 h to 48 h after treatment (Supplemental Figure 1C, D). No marked difference in cell viability was found in the MG6 microglia after exposure to Aβ42, P.gLPS, or AL for 72 h compared to that of control MG6 microglia (Figure 2E).
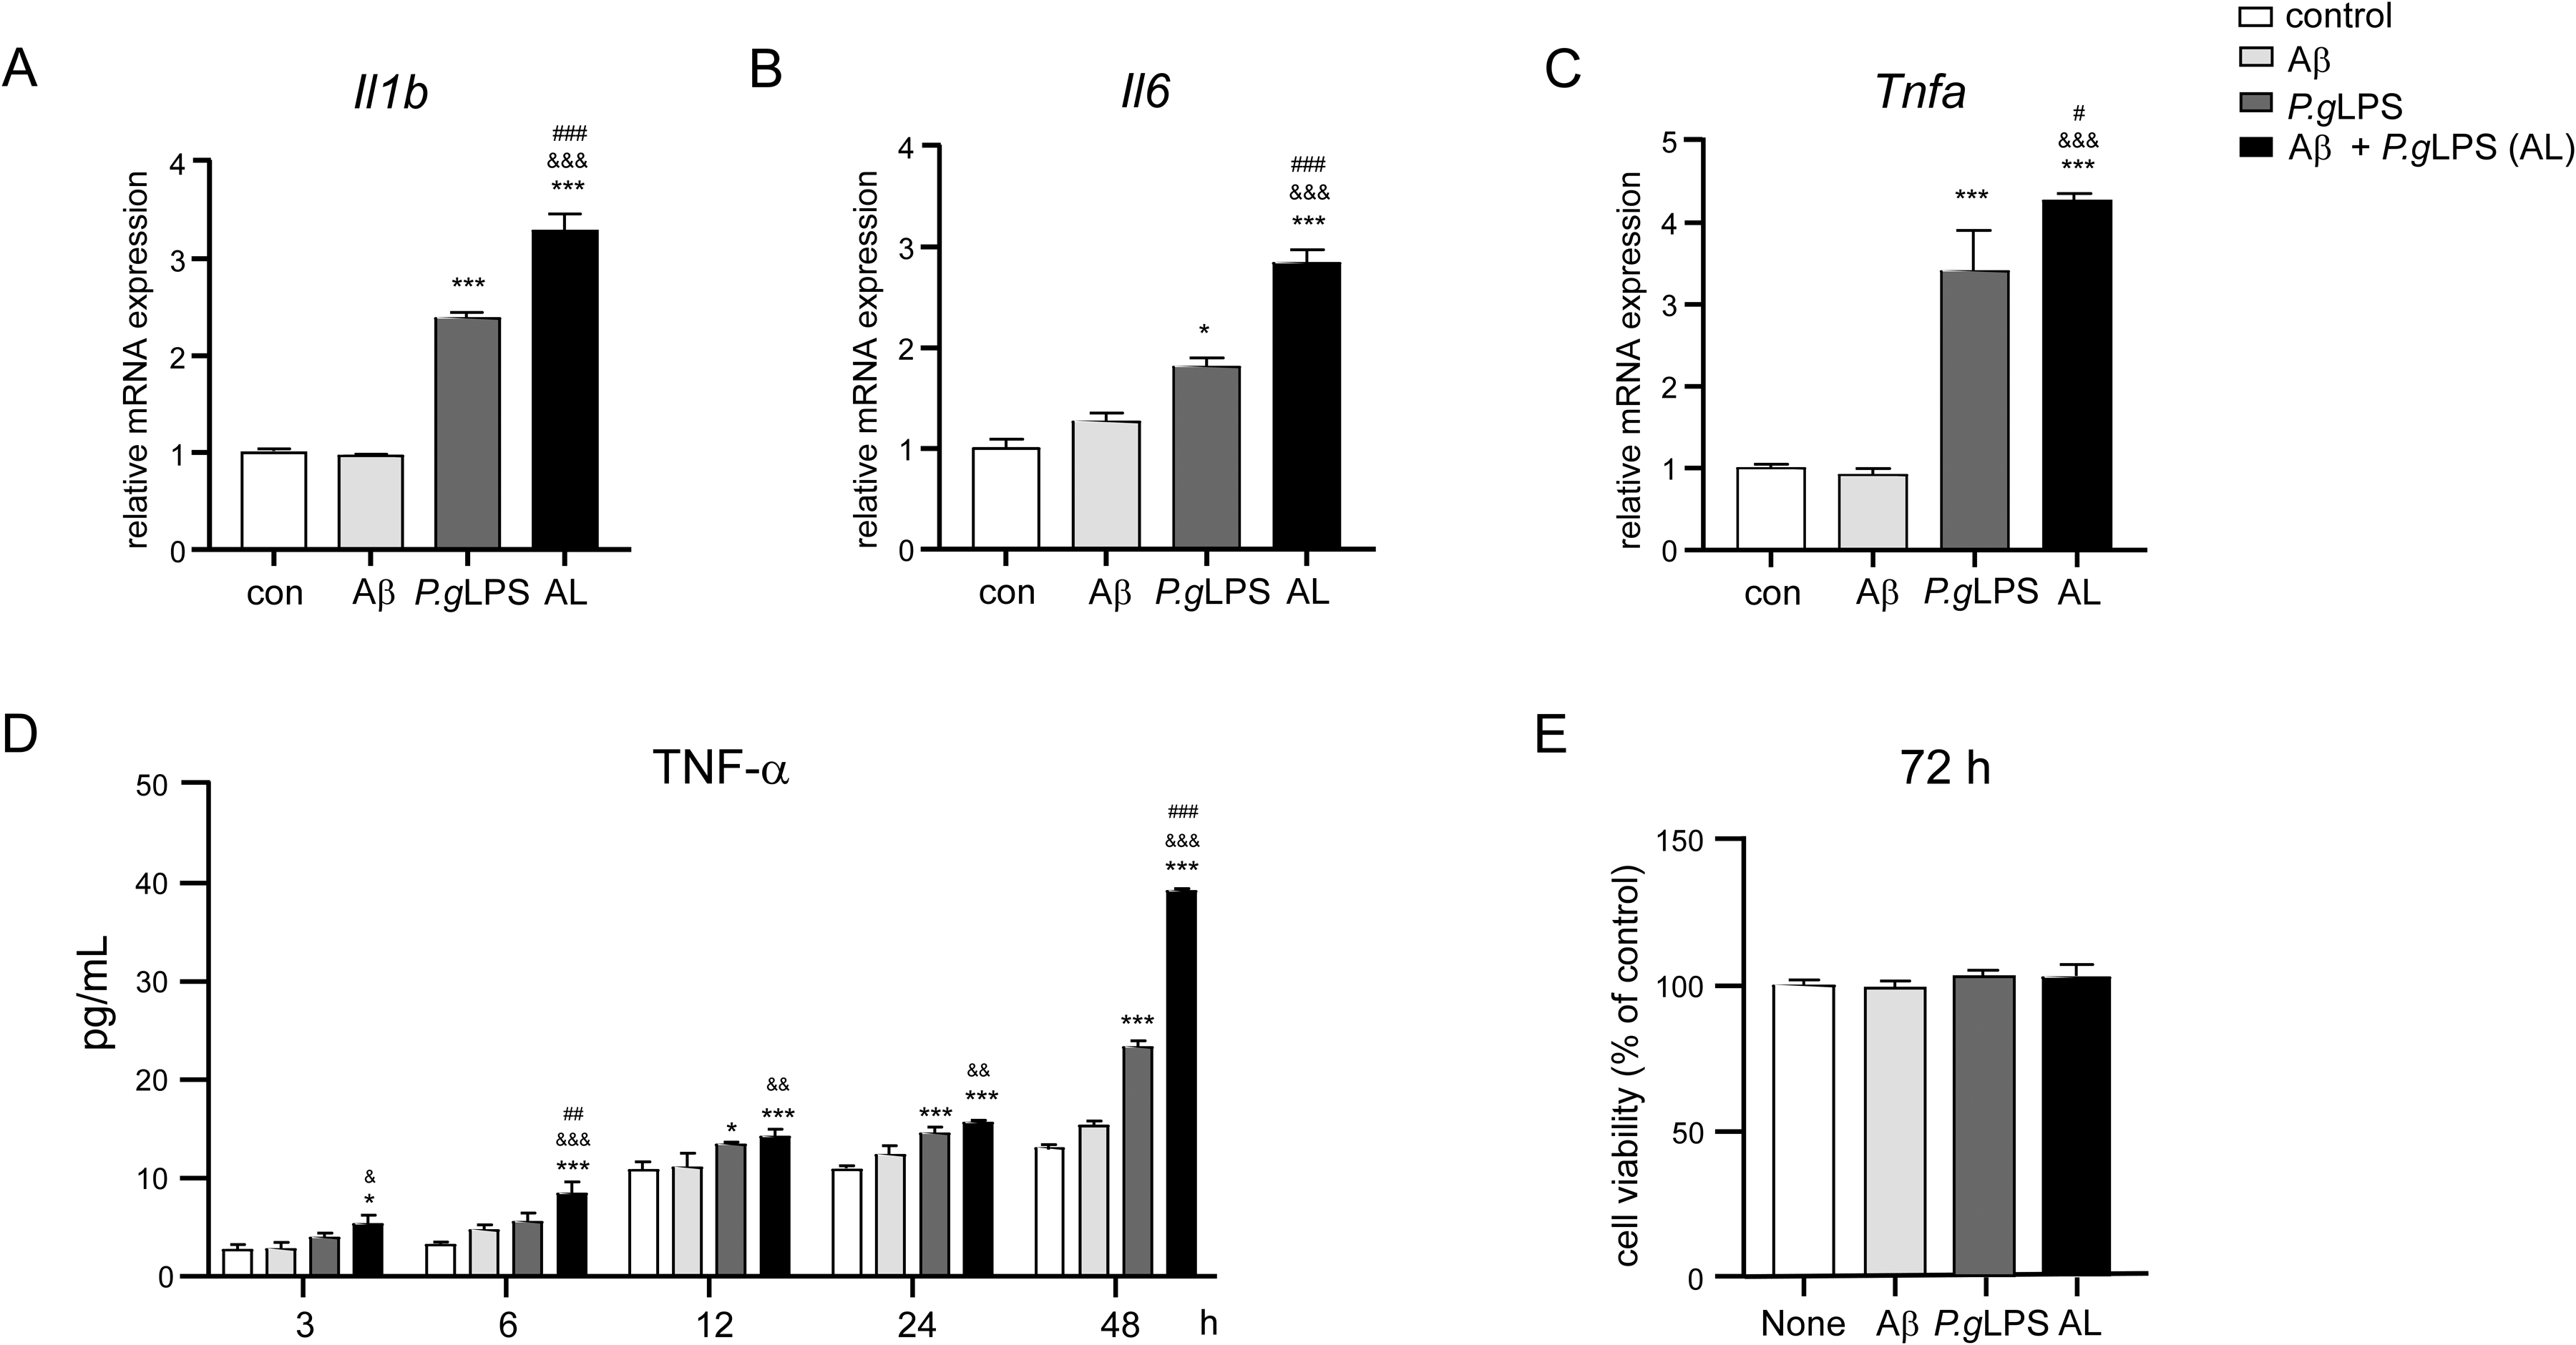
Microglia activation after exposure to P.gLPS and Aβ42. The mRNA expression of A) IL-1β, B) IL-6, and C) TNF-α in MG6 microglia at 3 h post exposure to Aβ42 (0.1 µM), P.gLPS (0.1 µg/mL) and Aβ42 combined with P.gLPS (0.1 µM, 0.1 µg/mL, AL). (D) The time course of TNF-α production post exposure to Aβ42, P.gLPS, AL. (E) The cell viability of MG6 microglia at 72 h post exposure to Aβ42, P.gLPS, AL. Each column and bar represent mean ± SD (n = 3) for each variable. Asterisks indicate a statistically significant difference from the value in the control cells (*p < 0.05, ***p < 0.001, one-way ANOVA). The ampersands indicate a significant difference from the value in the Aβ-exposed cells (&p < 0.05, &&p < 0.01, &&&p < 0.001, one-way ANOVA). The hashtags indicate a statistically significant difference from the value in the P.gLPS-exposed cells (#p < 0.05, ##p < 0.01, ###p < 0.001, one-way ANOVA).
NF-κB activation in MG6 microglia post exposure to P.gLPS and Aβ
We then examined nuclear factor-kappa B (NF-κB) activation in MG6 microglia after exposure to Aβ42, P.gLPS, or AL. Western blotting revealed a significant increase in phosphorylation of IκBα from 15 min (2.2-fold increase), lasted 30 min (2.1-fold increase), and returned to the 0 min levels after 60 min in the P.gLPS-exposed MG6 microglia, whereas phosphorylation of IκBα was significantly increased from 15 min (2.0-fold increase), peaked at 60 min (3.5-fold increase), and prolonged to 120 min (2.2-fold increase) in the AL-exposed MG6 microglia (Figure 3A, B). The protein level of p65 in the nuclear fraction significantly increased from 30 min (2-fold increase), peaked at 60 min (3-fold increase), lasted for 120 min (2.3-fold increase), and reverted to the 0 min level expression at 180 min in P.gLPS-exposed MG6 microglia (Figure 3C, D). Notably, nuclear p65 was significantly higher at 60 min (1.2-fold increase), 120 min (1.2-fold increase), and 180 min (1.7-fold increase) in AL-exposed MG6 microglia than in P.gLPS-exposed MG6 microglia (Figure 3C, D).
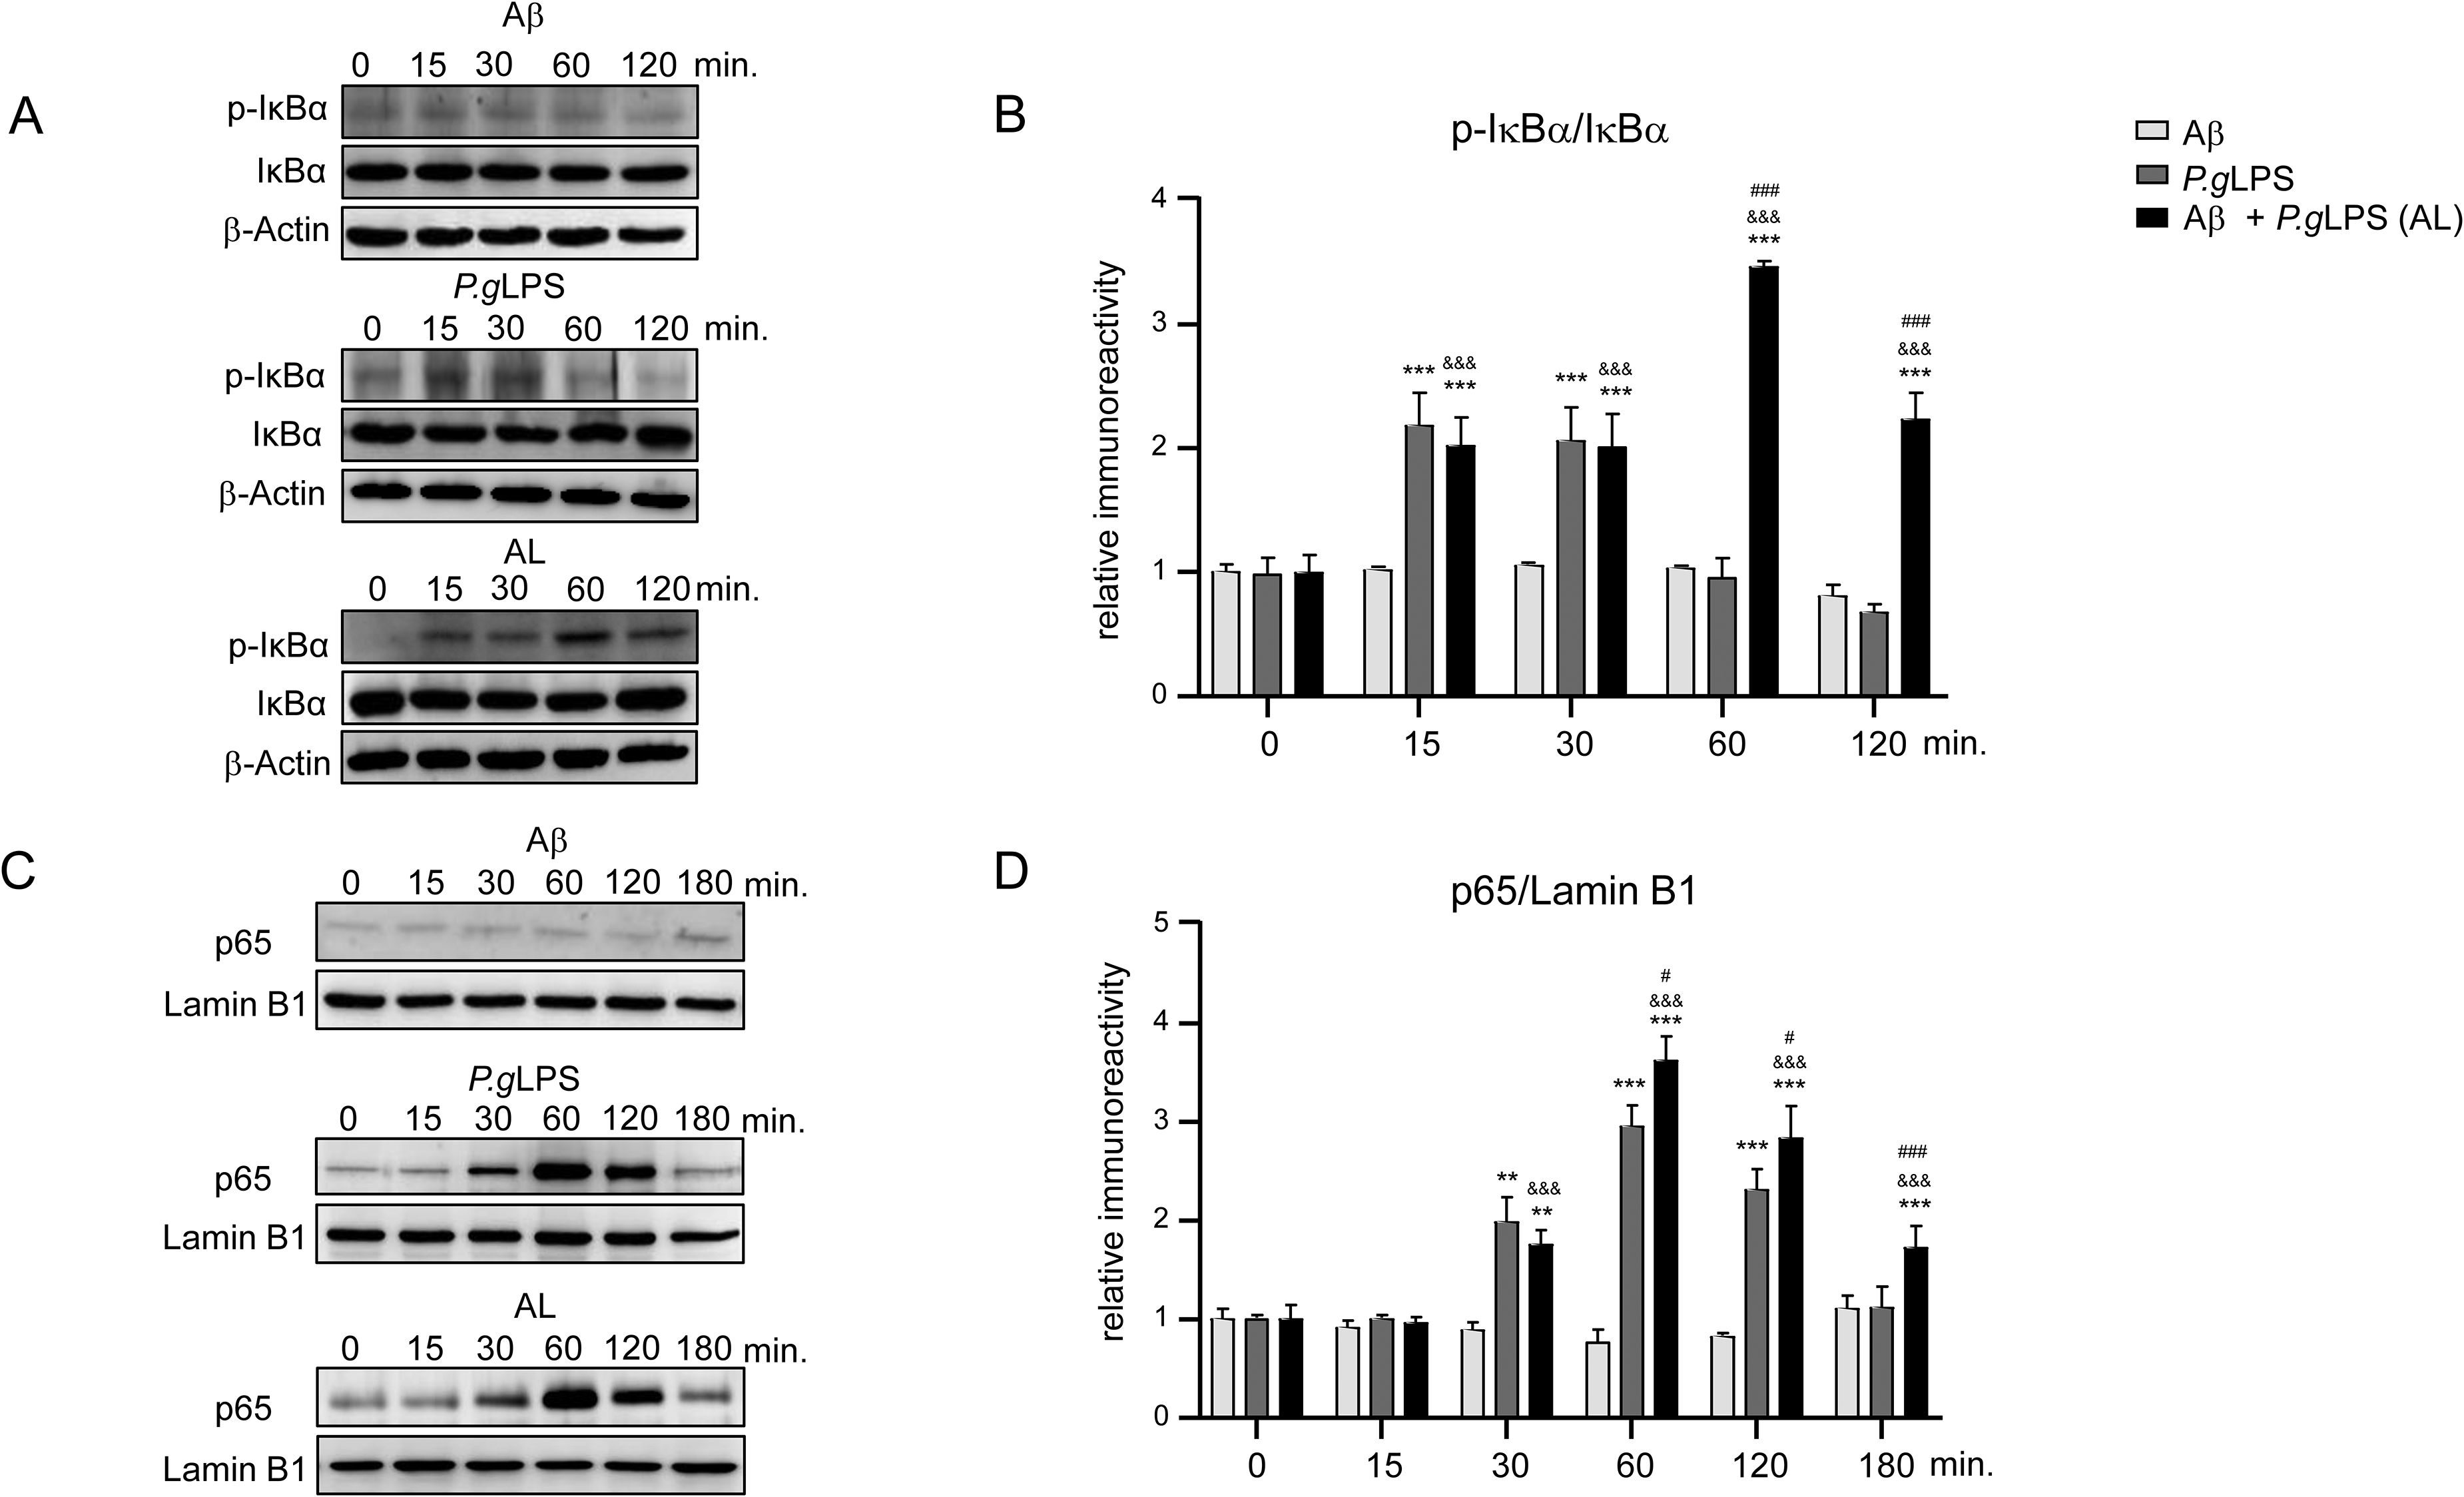
NF-κB activation in MG6 microglia after exposure to P.gLPS and Aβ42. A) Time course of p-IκBα and IκBα protein expression in cytosol extracts of MG6 microglia post exposure to Aβ42, P.gLPS, and AL. B) Quantitative analyses of immunoblots in (A). C) Time course of p65 protein expression in the nuclear extract of MG6 microglia after exposure to Aβ42, P.gLPS and AL. D) The quantitative analysis of immunoblots in (C). Each column and bar represent mean ± SD (n = 3) for each variable. Asterisks indicate a significant difference from the value in the control cells (**p < 0.01, ***p < 0.001, one-way ANOVA). The ampersands indicate a significant difference from the value in the Aβ-exposed cells (&&&p < 0.001, one-way ANOVA). The hashtags indicate a significant difference from the value in the P.gLPS-exposed cells (#p < 0.05, ###p < 0.001, one-way ANOVA).
ROS production in MG6 microglia post exposure to P.gLPS and Aβ
In comparison to control cells, the mean immunofluorescence intensity (IFI) of MitoSOX Red was significantly increased in MG6 microglia 3 h after exposure to Aβ42, P.gLPS, and AL (1.09-, 1.11-, and 1.23-fold increase; Figure 4A, B). The IFI of MitoSOX Red in AL-exposed-MG6 cells was significantly higher than that observed in Aβ- or P.gLPS-exposed MG6 cells (1.13- and 1.11-fold increase, Figure 4A, B). In comparison to control cells, the mean IFI of DCFH-DA was significantly increased in MG6 microglia 24 h after exposure to Aβ42, P.gLPS, and AL (1.57-, 1.62-, and 2.32-fold increase; Figure 4C, D), and the IFI of DCFH-DA in AL-exposed MG6 cells was significantly higher than that in Aβ- and P.gLPS-exposed MG6 cells (1.47- and 1.432-fold increase;Figure 4C, D).
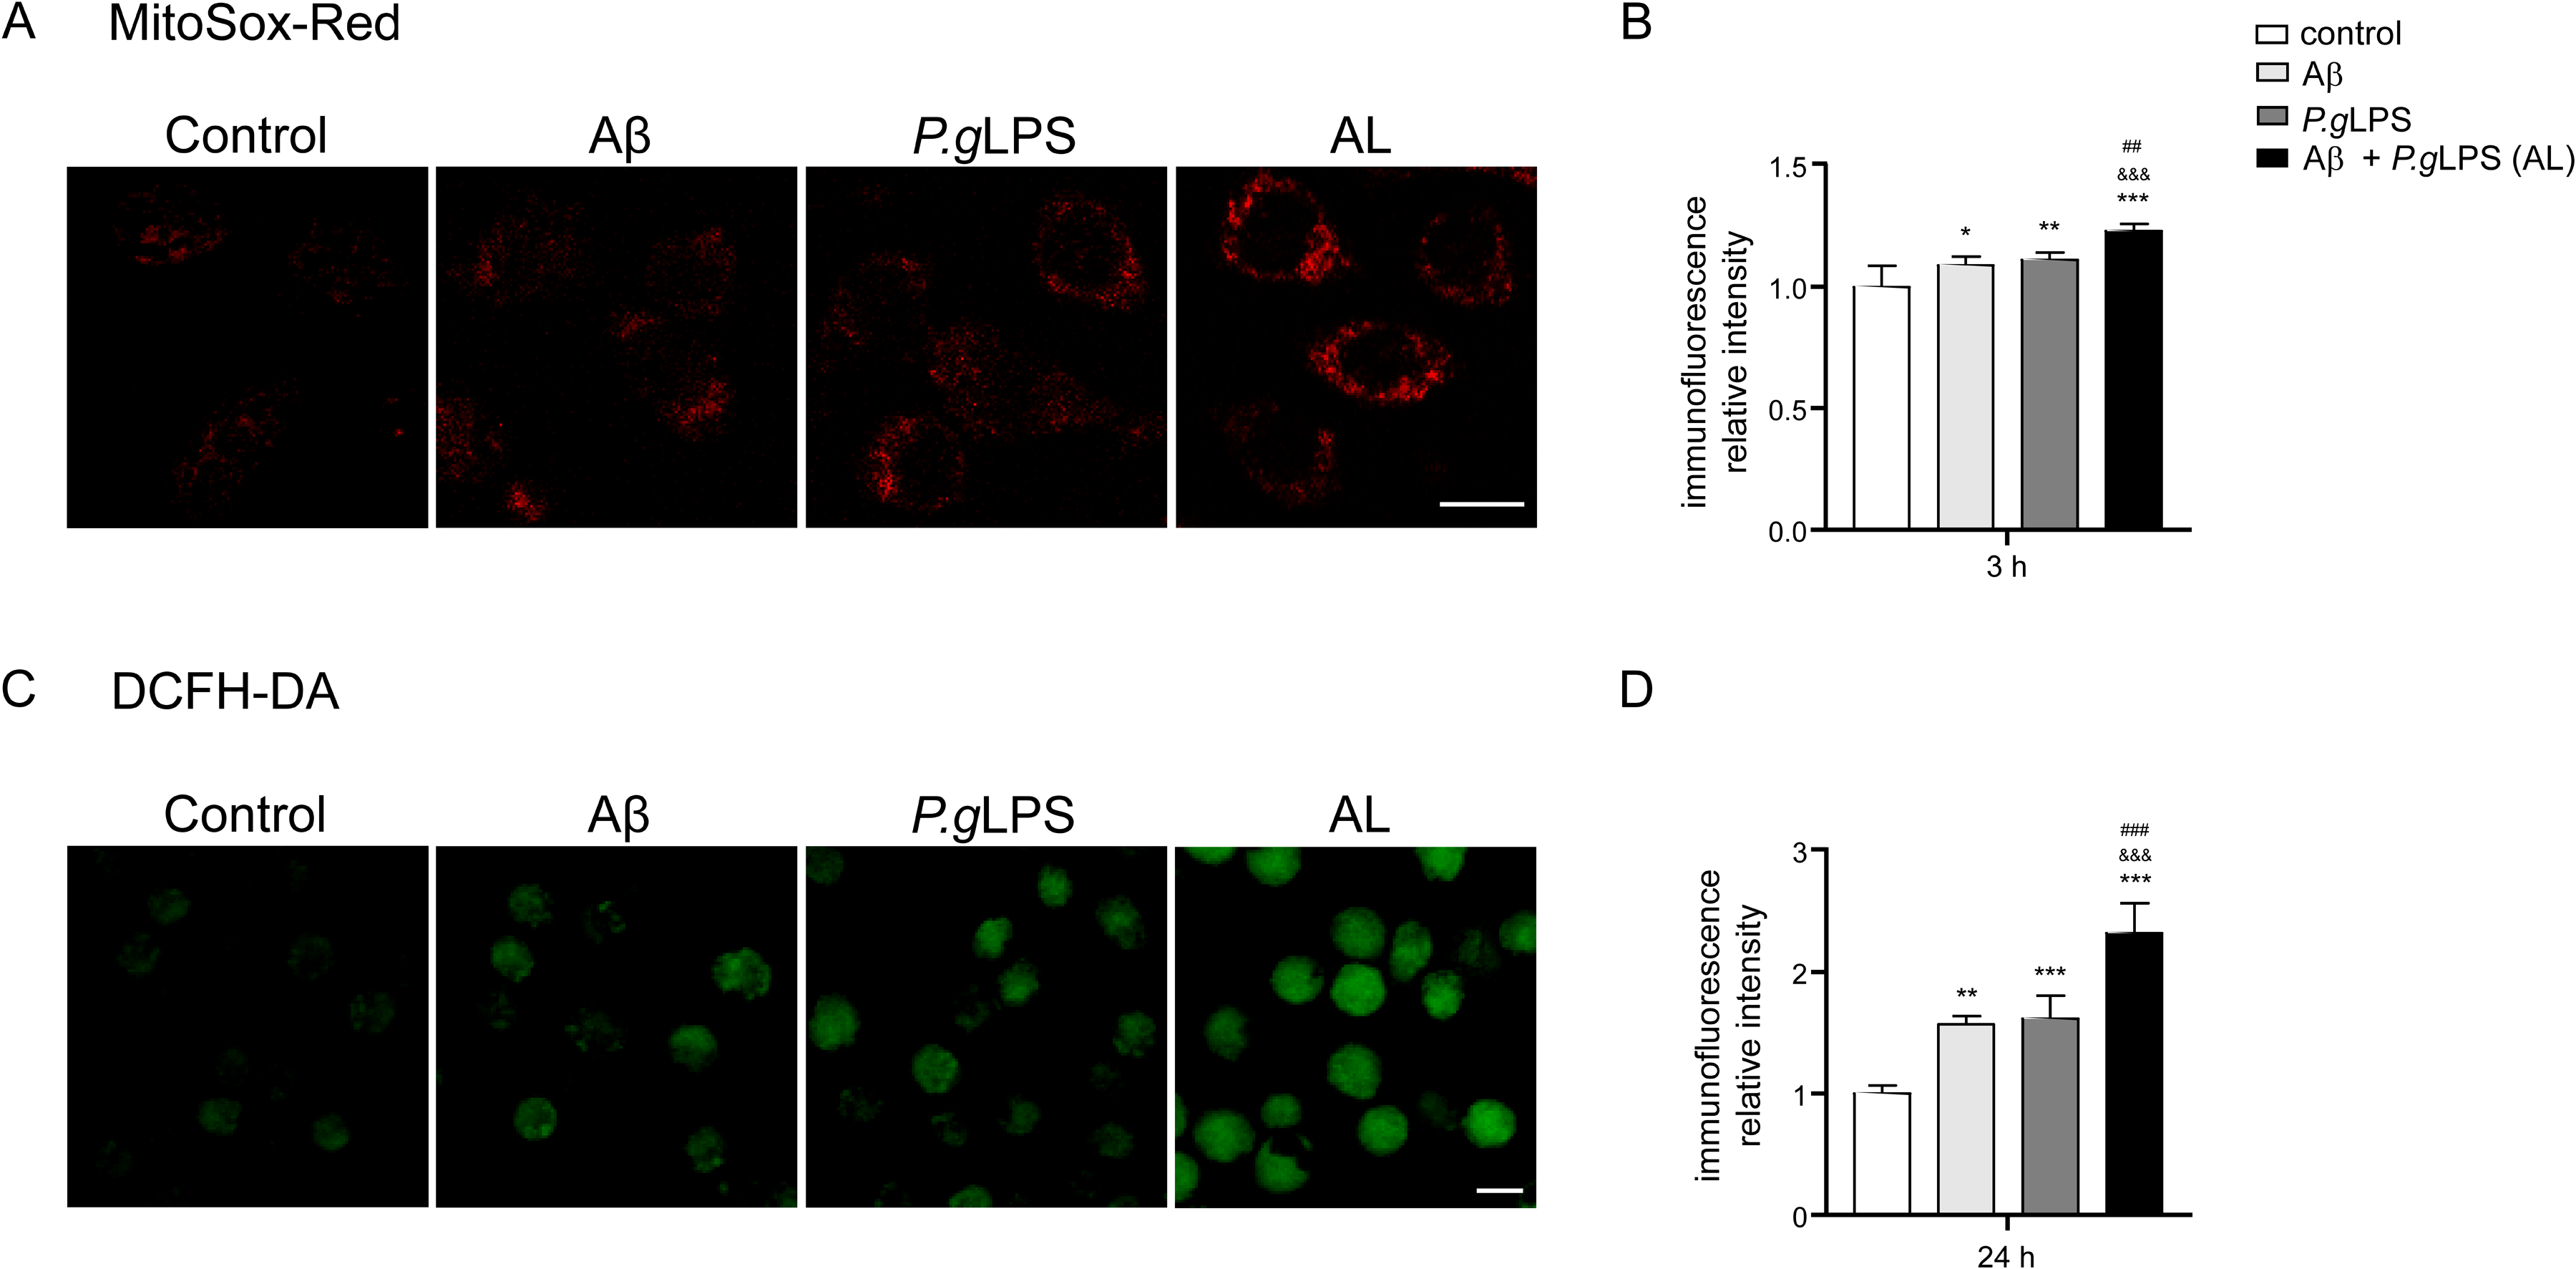
ROS production in MG6 microglia after exposure to P.gLPS and Aβ42. A) Fluorescent images of MitoSOX Red in MG6 cells at 3 h after exposure to Aβ42, P.gLPS and Aβ42 combined with P.gLPS (AL). B) Quantitative analyses of the MitoSOX Red fluorescence signal intensity in (A). C) Fluorescent images of DCFH-DA in MG6 cells at 24 h after exposure to Aβ42, P.gLPS, or AL. D) Quantitative analyses of the DCFH-DA fluorescence signal in C). Scale bar, 10 μm. Each column and bar represent the mean ± SD (n = 4) for each variable. Asterisk indicates a statistically significant difference from the value in the control cells (*p <0.05, **p <0.01, ***p <0.001, one-way ANOVA). Ampersands indicate a statistically significant difference from the value in the Aβ-exposed cells (&&& p <0.001, one-way ANOVA). Hashtags indicate a statistically significant difference from the value in the P.gLPS-exposed cells (##p <0.01, ###p <0.001, one-way ANOVA).
Expression of SYN1 and PSD-95 in N2a neurons post application of MCMs
We then examined the expression of SYN1 and PSD-95 in N2a neurons after adding conditioned media from Aβ42-, P.gLPS-, or AL-exposed MG6 microglia (Aβ-MCM, P.gLPS-MCM, and AL-MCM, respectively). Compared to control N2a neurons (exposed to non-treated MCM), a significant decrease in the mRNA expression of both SYN1 and PSD-95 was detected 48 h after exposure to AL-MCM (35.9% and 22.4%, respectively; Figure 5A, B). However, compared to control N2a neurons, no significant decrease in the mRNA expression of SYN1 or PSD-95 was detected 48 h after exposure to Aβ-MCM- or P.gLPS-MCM-exposed N2a neurons (Figure 5A, B). In addition, the mRNA expression of SYN1 and PSD-95 in AL-MCM-exposed N2a neurons (48 h) was negatively correlated with TNF-α production in AL-MCM (48 h) (r = −0.9986, p < 0.0001, r = −0.9580, p = 0.0026, Figure 5C). Furthermore, SYN1 and PSD-95 protein levels significantly decreased 72 h after exposure to AL-MCM (32.9% and 30.2% decrease, respectively; Figure 5D–F).
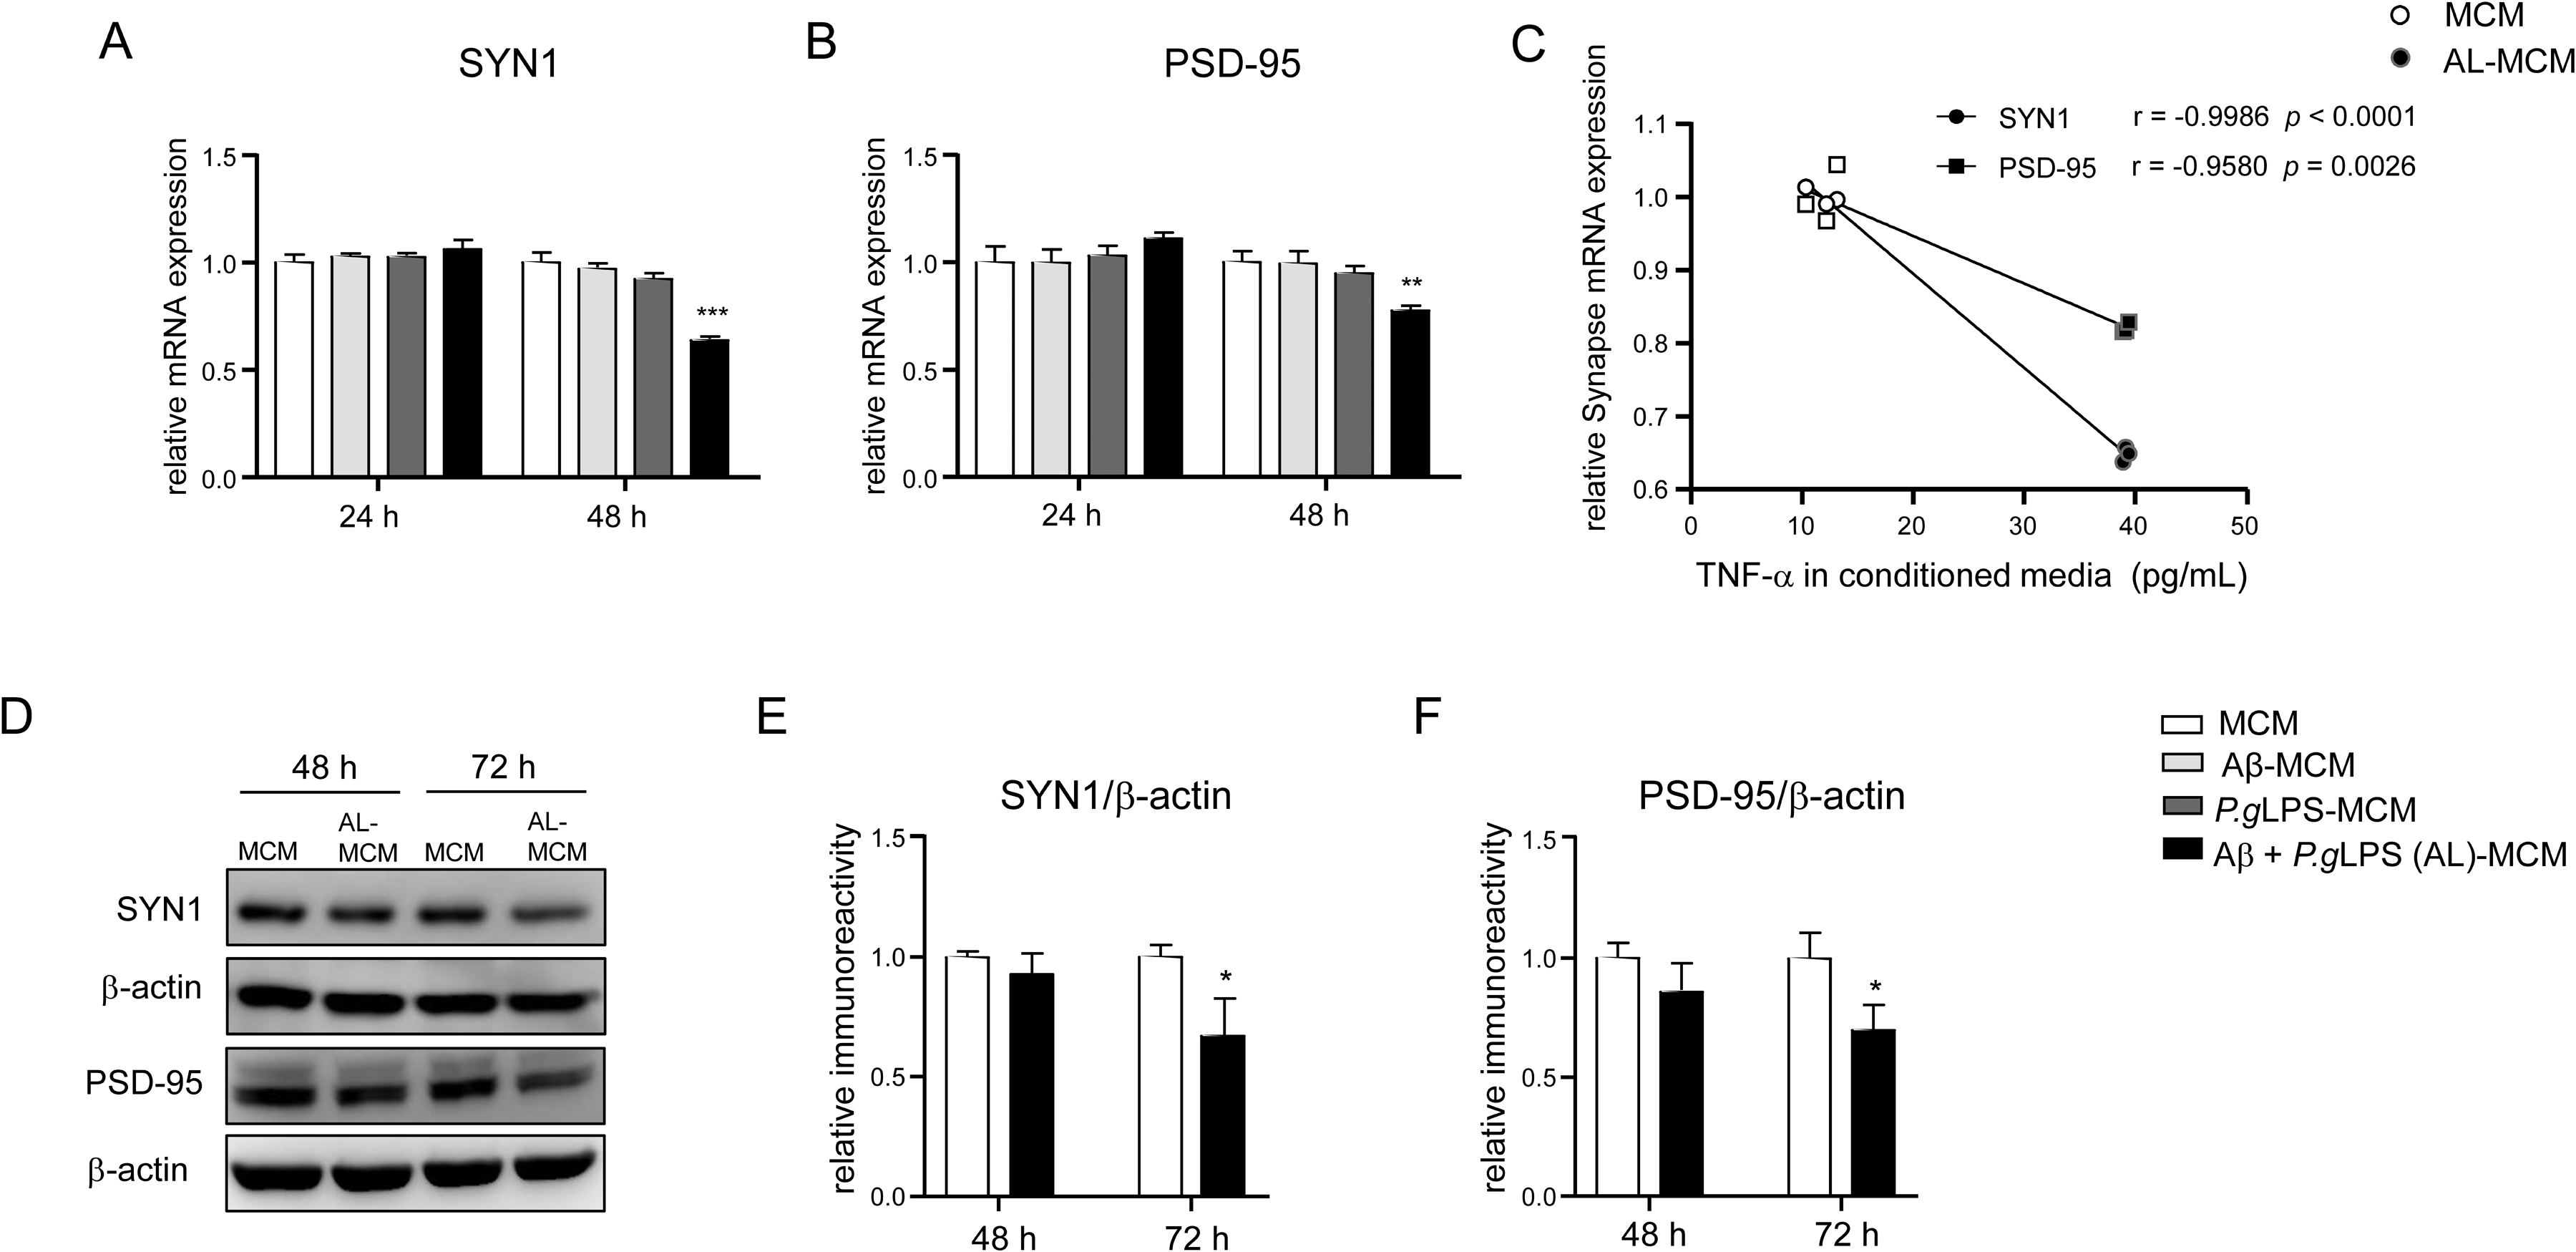
The expression of SYN1 and PSD-95 in N2a neurons after treatment with MCMs. The mRNA expression of A) SYN1 and B) PSD-95 in N2a neurons 24 and 48 h after treatment with Aβ-MCM, P.gLPS-MCM, or AL-MCM. C) Correlation between the mRNA expression of SYN1 and PSD-95 (48 h) and TNF-α production in conditioned media (48 h). D) Protein expression of SYN1 and PSD-95 in N2a neurons after treatment with AL-MCM. A quantitative analysis of SYN1 E) and PSD-95 F) immunoblots (D). Each column and bar represent mean ± SD (n = 3) for each variable. Asterisks indicate a significant difference from the value in the control cells (*p < 0.05, **p <0.01***p < 0.001, A-B analysis with one-way ANOVA, E-F analysis with Student's t- test). The Pearson correlation coefficient (r) was used to analyze the strength of the association between the two variables (0.7≤ | r | < 1 is a highly linear correlation; Pearson correlation coefficient).
Expression of synaptic regulatory molecules in N2a neurons post application of MCMs
Next, we focused on the expression of synaptic regulatory factors in the MCMs-induced N2a neurons. Compared to control N2a neurons, the mRNA expression of GSK3β was significantly increased from 24 to 48 h after exposure to AL-MCM (1.4- and 1.2-fold increase; Figure 6A), and the mRNA expression of TNF receptor type 1 (TNFR1) was significantly increased 48 h after exposure to AL-MCM (1.3-fold increase; Figure 6B). However, the mRNA expression of REST significantly decreased 48 h after exposure to AL-MCM (17.8% decrease; Figure 6C). Compared to control N2a neurons, the mRNA expression of GSK3β, TNFR1, and REST was not changed in Aβ-MCM- or P.gLPS-MCM-exposed N2a neurons (Supplemental Figure 2). In addition, the mRNA expression of GSK3β (24 h) and TNFR1 (48 h) in AL-MCM-exposed N2a neurons was positively correlated with TNF-α production in AL-MCM (48 h) (r = 0.9773, p = 0.0008, r = 0.9824, p = 0.0005; Figure 6D, E). Conversely, REST mRNA expression in AL-MCM-exposed N2a neurons negatively correlated with TNF-α production in AL-MCM (48 h) (r = −0.9501, p = 0.0037; Figure 6F).
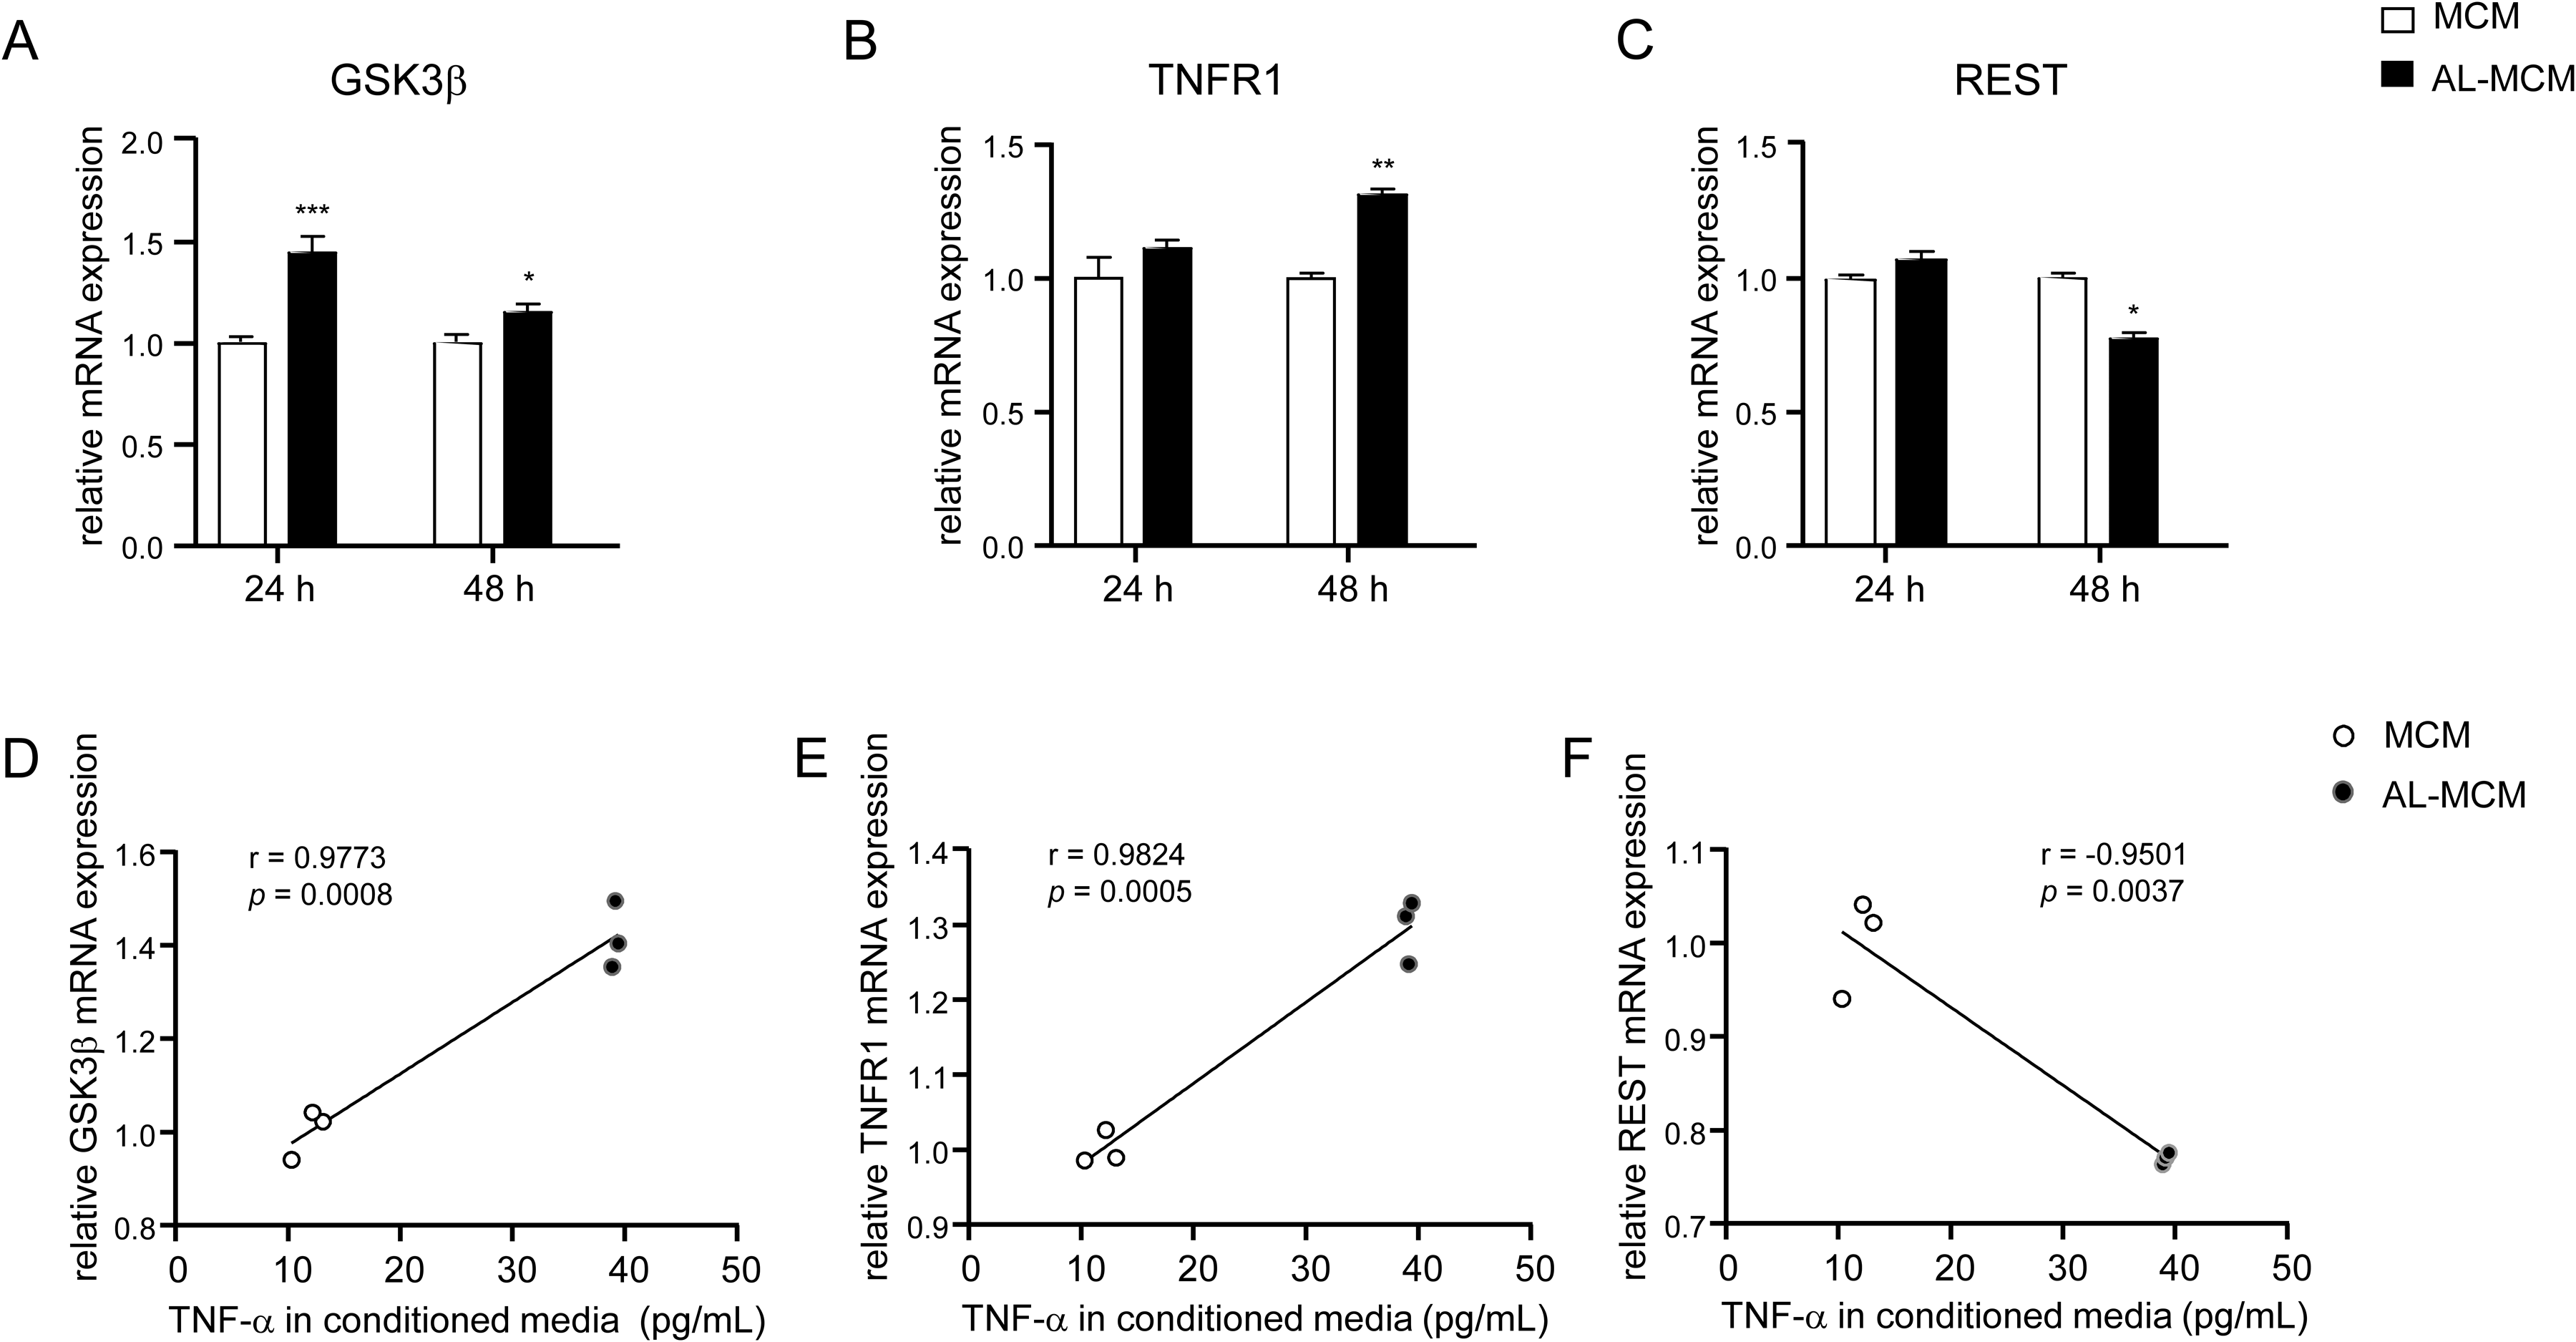
Modulation of synaptic regulatory molecules in N2a neurons post treatment with AL-MCM. The mRNA expression of A) GSK3β, B) TNFR1, and C) REST in N2a neurons after MCM treatment. Correlation between mRNA expression of D) GSK3β (24 h), E) TNFR1 (48 h), F) REST (48 h) and TNF-α production in conditioned media (48 h). Each column and bar represent the mean ± SD (n = 3) for each variable. Asterisks indicate a significant difference from the value in the control cells (*p < 0.05, **p < 0.01, ***p < 0.001, Student's t-test). The Pearson correlation coefficient (r) was used to analyze the strength of the association between two variables (0.7≤ | r | < 1 is a highly linear correlation; Pearson correlation coefficient).
Effects of GSK3β inhibition in modulation of synaptic molecules in neurons post application of AL-MCM
As the increase in the mRNA expression of GSK3β occurred 24 h earlier than that of synaptic molecules and other synaptic regulatory molecules, we next explored the requirement of GSK3β for the mRNA expression of SYN1 and PSD-95 and nuclear translocation of REST in N2a neurons exposed to AL-MCM. Furthermore, the protein levels of S396 significantly increased 48 and 72 h after exposure to AL-MCM (1.76-fold and 2.5-fold increase, respectively; Supplemental Figure 3A, B). The relative immunoreactivity of S396 was negatively correlated with that of SYN1 (r = −0.8676, p = 0.0251; Supplemental Figure 3C) and PSD-95 (r = −0.8646, p = 0.0263; Supplemental Figure 3D).
Compared to AL-MCM-exposed N2a neurons, the mRNA expression of SYN1 and PSD-95 was significantly recovered by pretreatment with TWS119, a specific GSK3β inhibitor, in AL-MCM-exposed N2a neurons (42% and 34.9% increase; Figure 7A, B). Compared with control N2a neurons, the protein level of REST in the nuclear fraction was significantly decreased at 60 h in AL-MCM-exposed N2a neurons (32.3% decrease; Figure 7C, D), and the relative IFI of REST in the nucleus was significantly reduced at 60 h in AL-MCM-exposed N2a neurons (44% decrease; Figure 7E, F). Pretreatment with TWS119 significantly restored the protein level of REST in the nuclear fraction of AL-MCM-exposed N2a neurons at 60 h (43.8% increase; Figure 6C, D) and the immunofluorescence density of REST in the nucleus of AL-MCM-exposed N2a neurons at 60 h (71.4% increase; Figure 7E, F). Furthermore, TWS119 significantly inhibited the protein levels of S396 in AL-MCM-exposed N2a neurons at 48 and 72 h (20.7% and 32% inhibition, respectively; Supplemental Figure 3A, B).
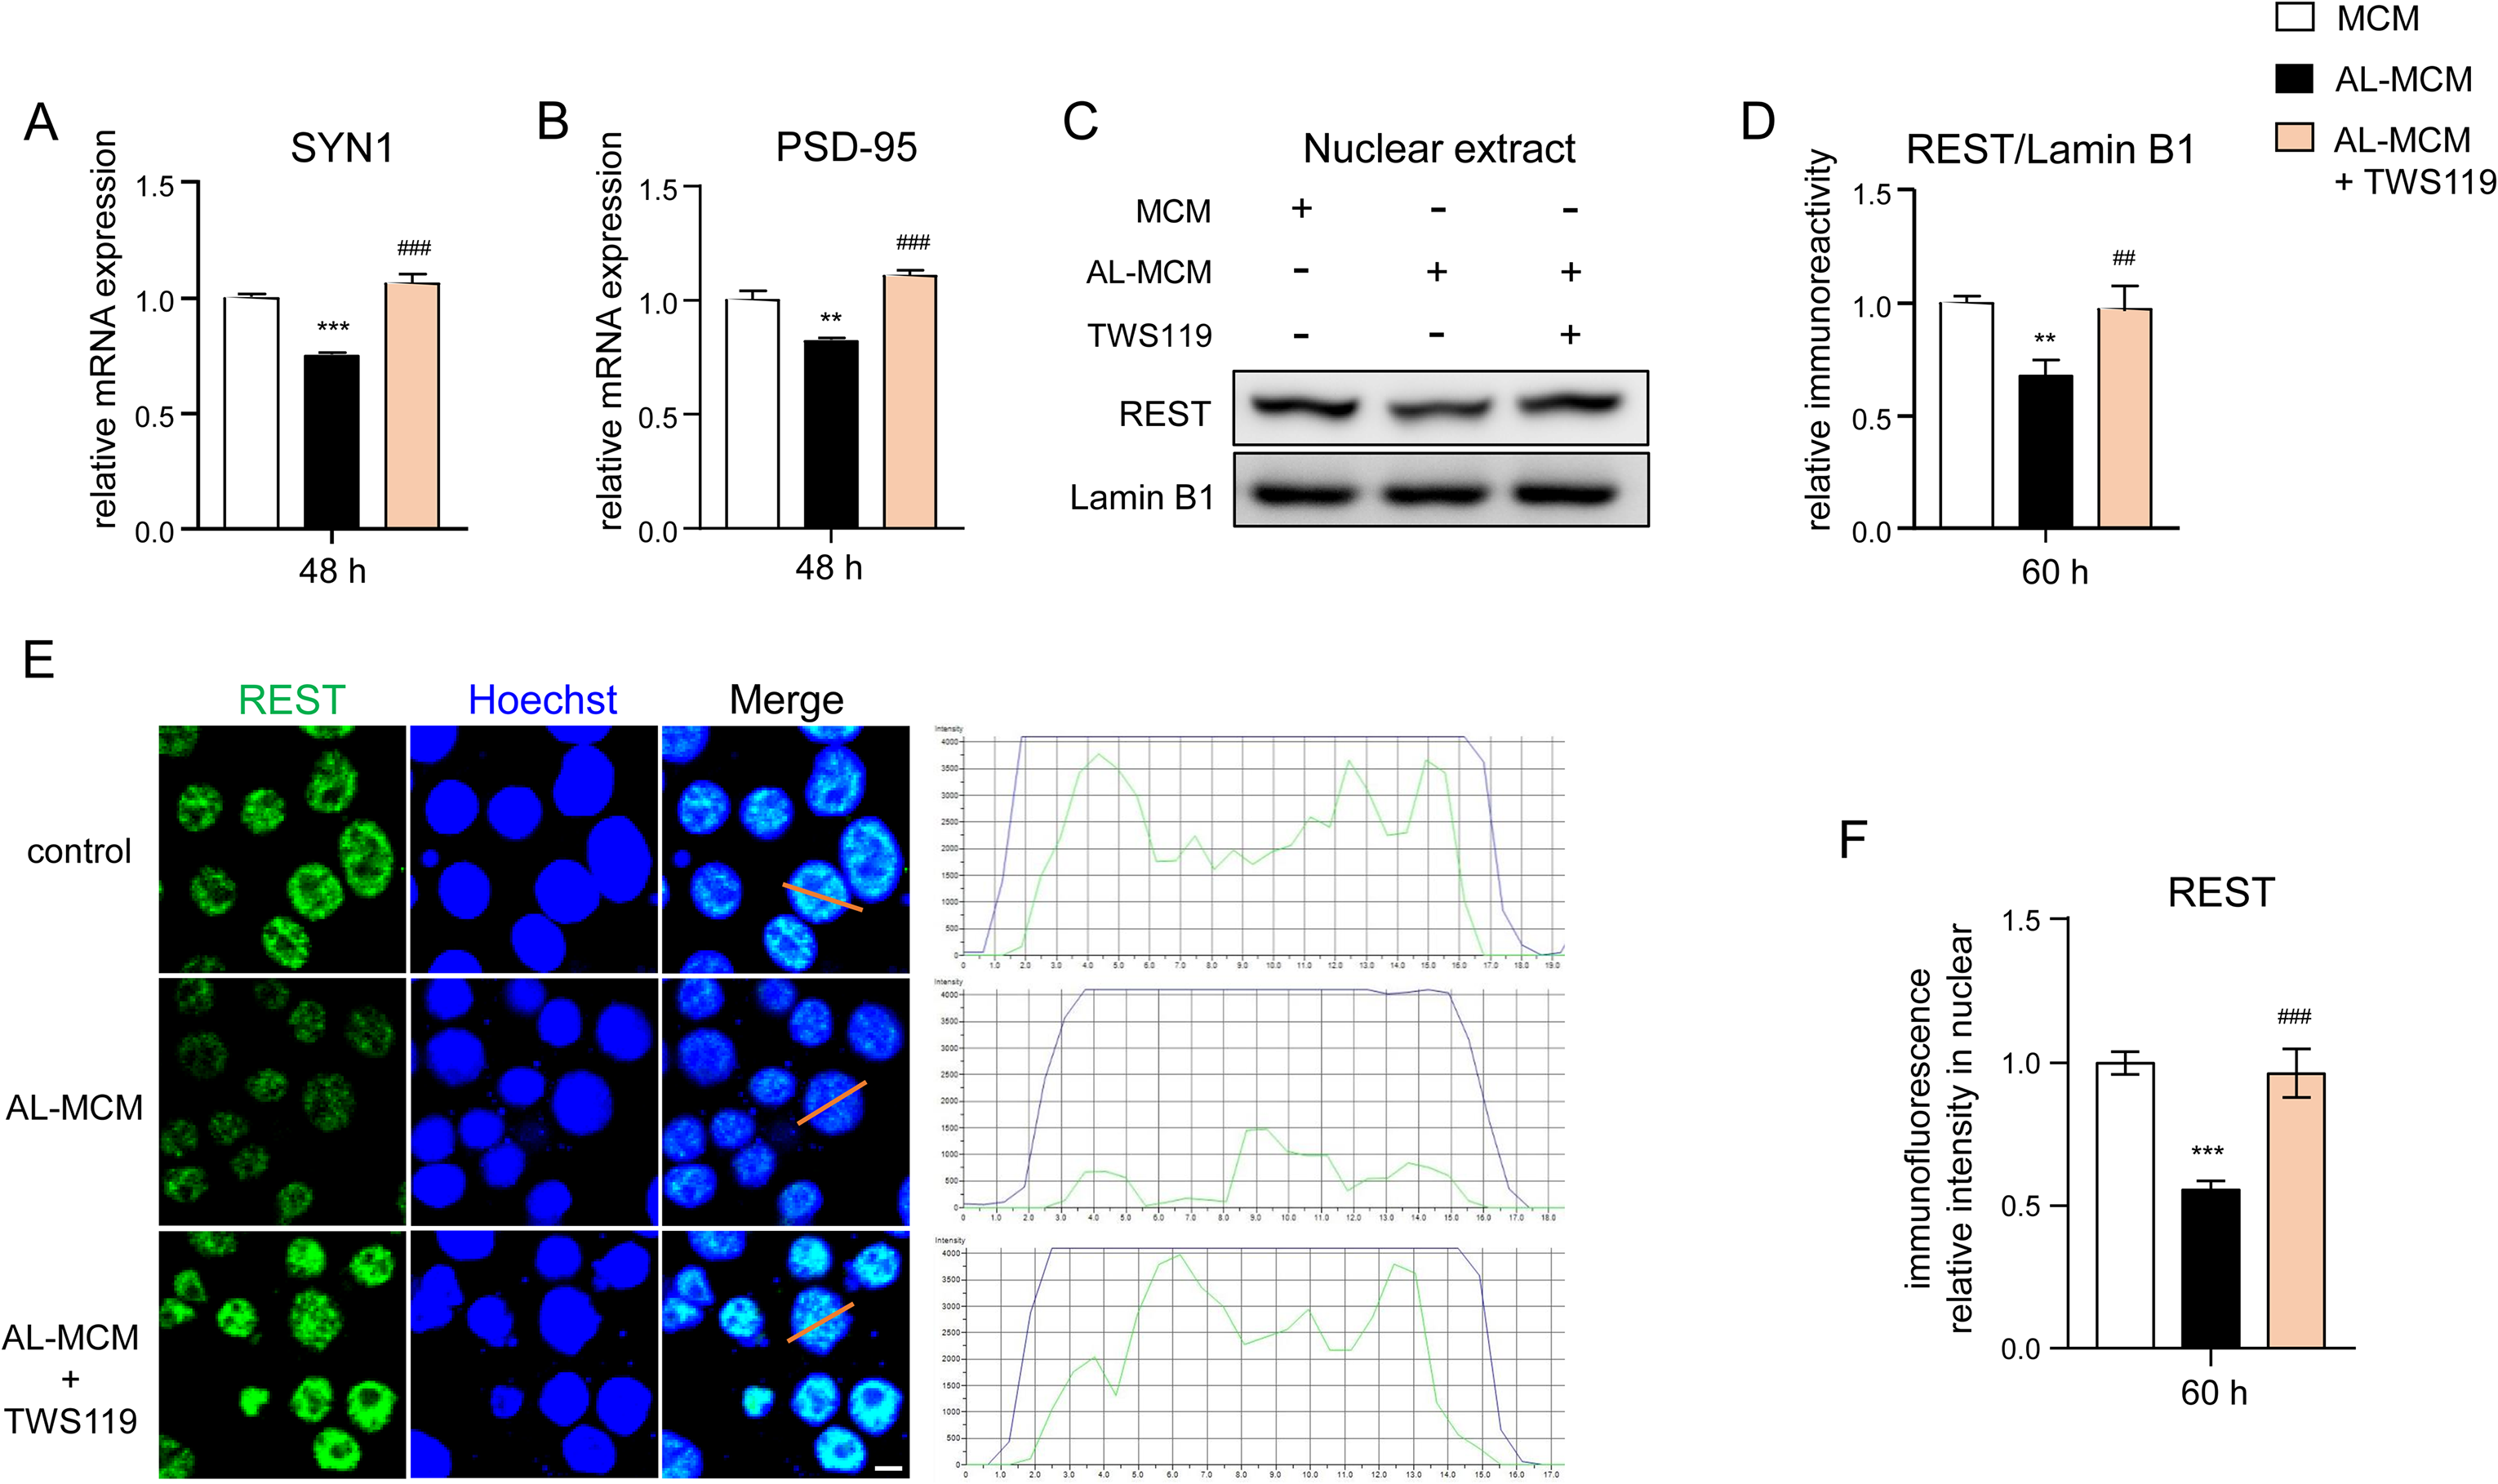
Effects of GSK3β inhibition in the modulation of synaptic molecules in N2a neurons post treatment with AL-MCM. The mRNA expression of A) SYN1 and B) PSD-95 in N2a neurons at 48 h after treatment with MCM supplying or non-supplying of TWS119 (5 µM). REST protein expression in the nuclear extract of N2a neurons at 60 h after treatment with AL-MCM in the presence or absence of TWS119. D) The quantitative analysis of immunoblots in C). E) Immunofluorescent images indicating the nuclear translocation of REST (green) in N2a neurons with Hoechst-stained nuclei (blue) at 60 h after treatment with AL-MCM in the presence or absence of TWS119. F) The quantitative analysis of REST immunofluorescent density in nuclear at 60 h post treatment with AL-MCM when supplying or not supplying of TWS119. Scale bar, 10 μm. Each column and bar represent the mean ± SD (n = 3) for each variable. Asterisks indicate a significant difference from the value in the control cells (**p < 0.01, ***p < 0.001, one-way ANOVA). The hashtags indicate a significant difference from the value in the AL-MCM-exposed cells (##p < 0.01;###p < 0.001, one-way ANOVA).
Expression of synaptic molecules in the cortical neurons of in APPNL - F/Nl-F mice post systemic exposure to P.gLPS
Finally, we examined the expression of SYN1 and PSD-95 in neurons and microglial activation in vivo using 10-month-old APPNL-F/NL-F mice. Compared to the control APPNL-F/NL-F mice, a significant decrease in the IFI of SYN1 (28.1% decrease; Figure 8A, B) and PSD-95 (20.8% decrease; Figure 8A, C) was detected in MAP-2-positive cortical neurons of P.gLPS-exposed APPNL-F/NL-F mice. Furthermore, immunofluorescence intensities of SYN1 and PSD-95 were positively correlated with memory test latency (r = 0.6781, p = 0.0154 and r = 0.5895, p = 0.0437, respectively; Figure 8D, E) in APPNL-F/NL-F mice. In contrast, there was a significant increase in the mean immunofluorescent density of the microglial marker Iba1 (1.23-fold increase; Figure 9A, B), and a significant increase in TNF-α-expressing Iba1-positive microglia (3.15-fold increase; Figure 9A, C) in the cortex of P.gLPS-exposed APPNL-F/NL-F mice compared to that in control APPNL-F/NL-F mice. Furthermore, the IFI of TNF-α was negatively correlated with that of SYN1 and PSD-95 (r = −0.8329, p = 0.0008 and r = −0.7415, p = 0.0058, respectively; Figure 9D) in APPNL-F/NL-F mice.
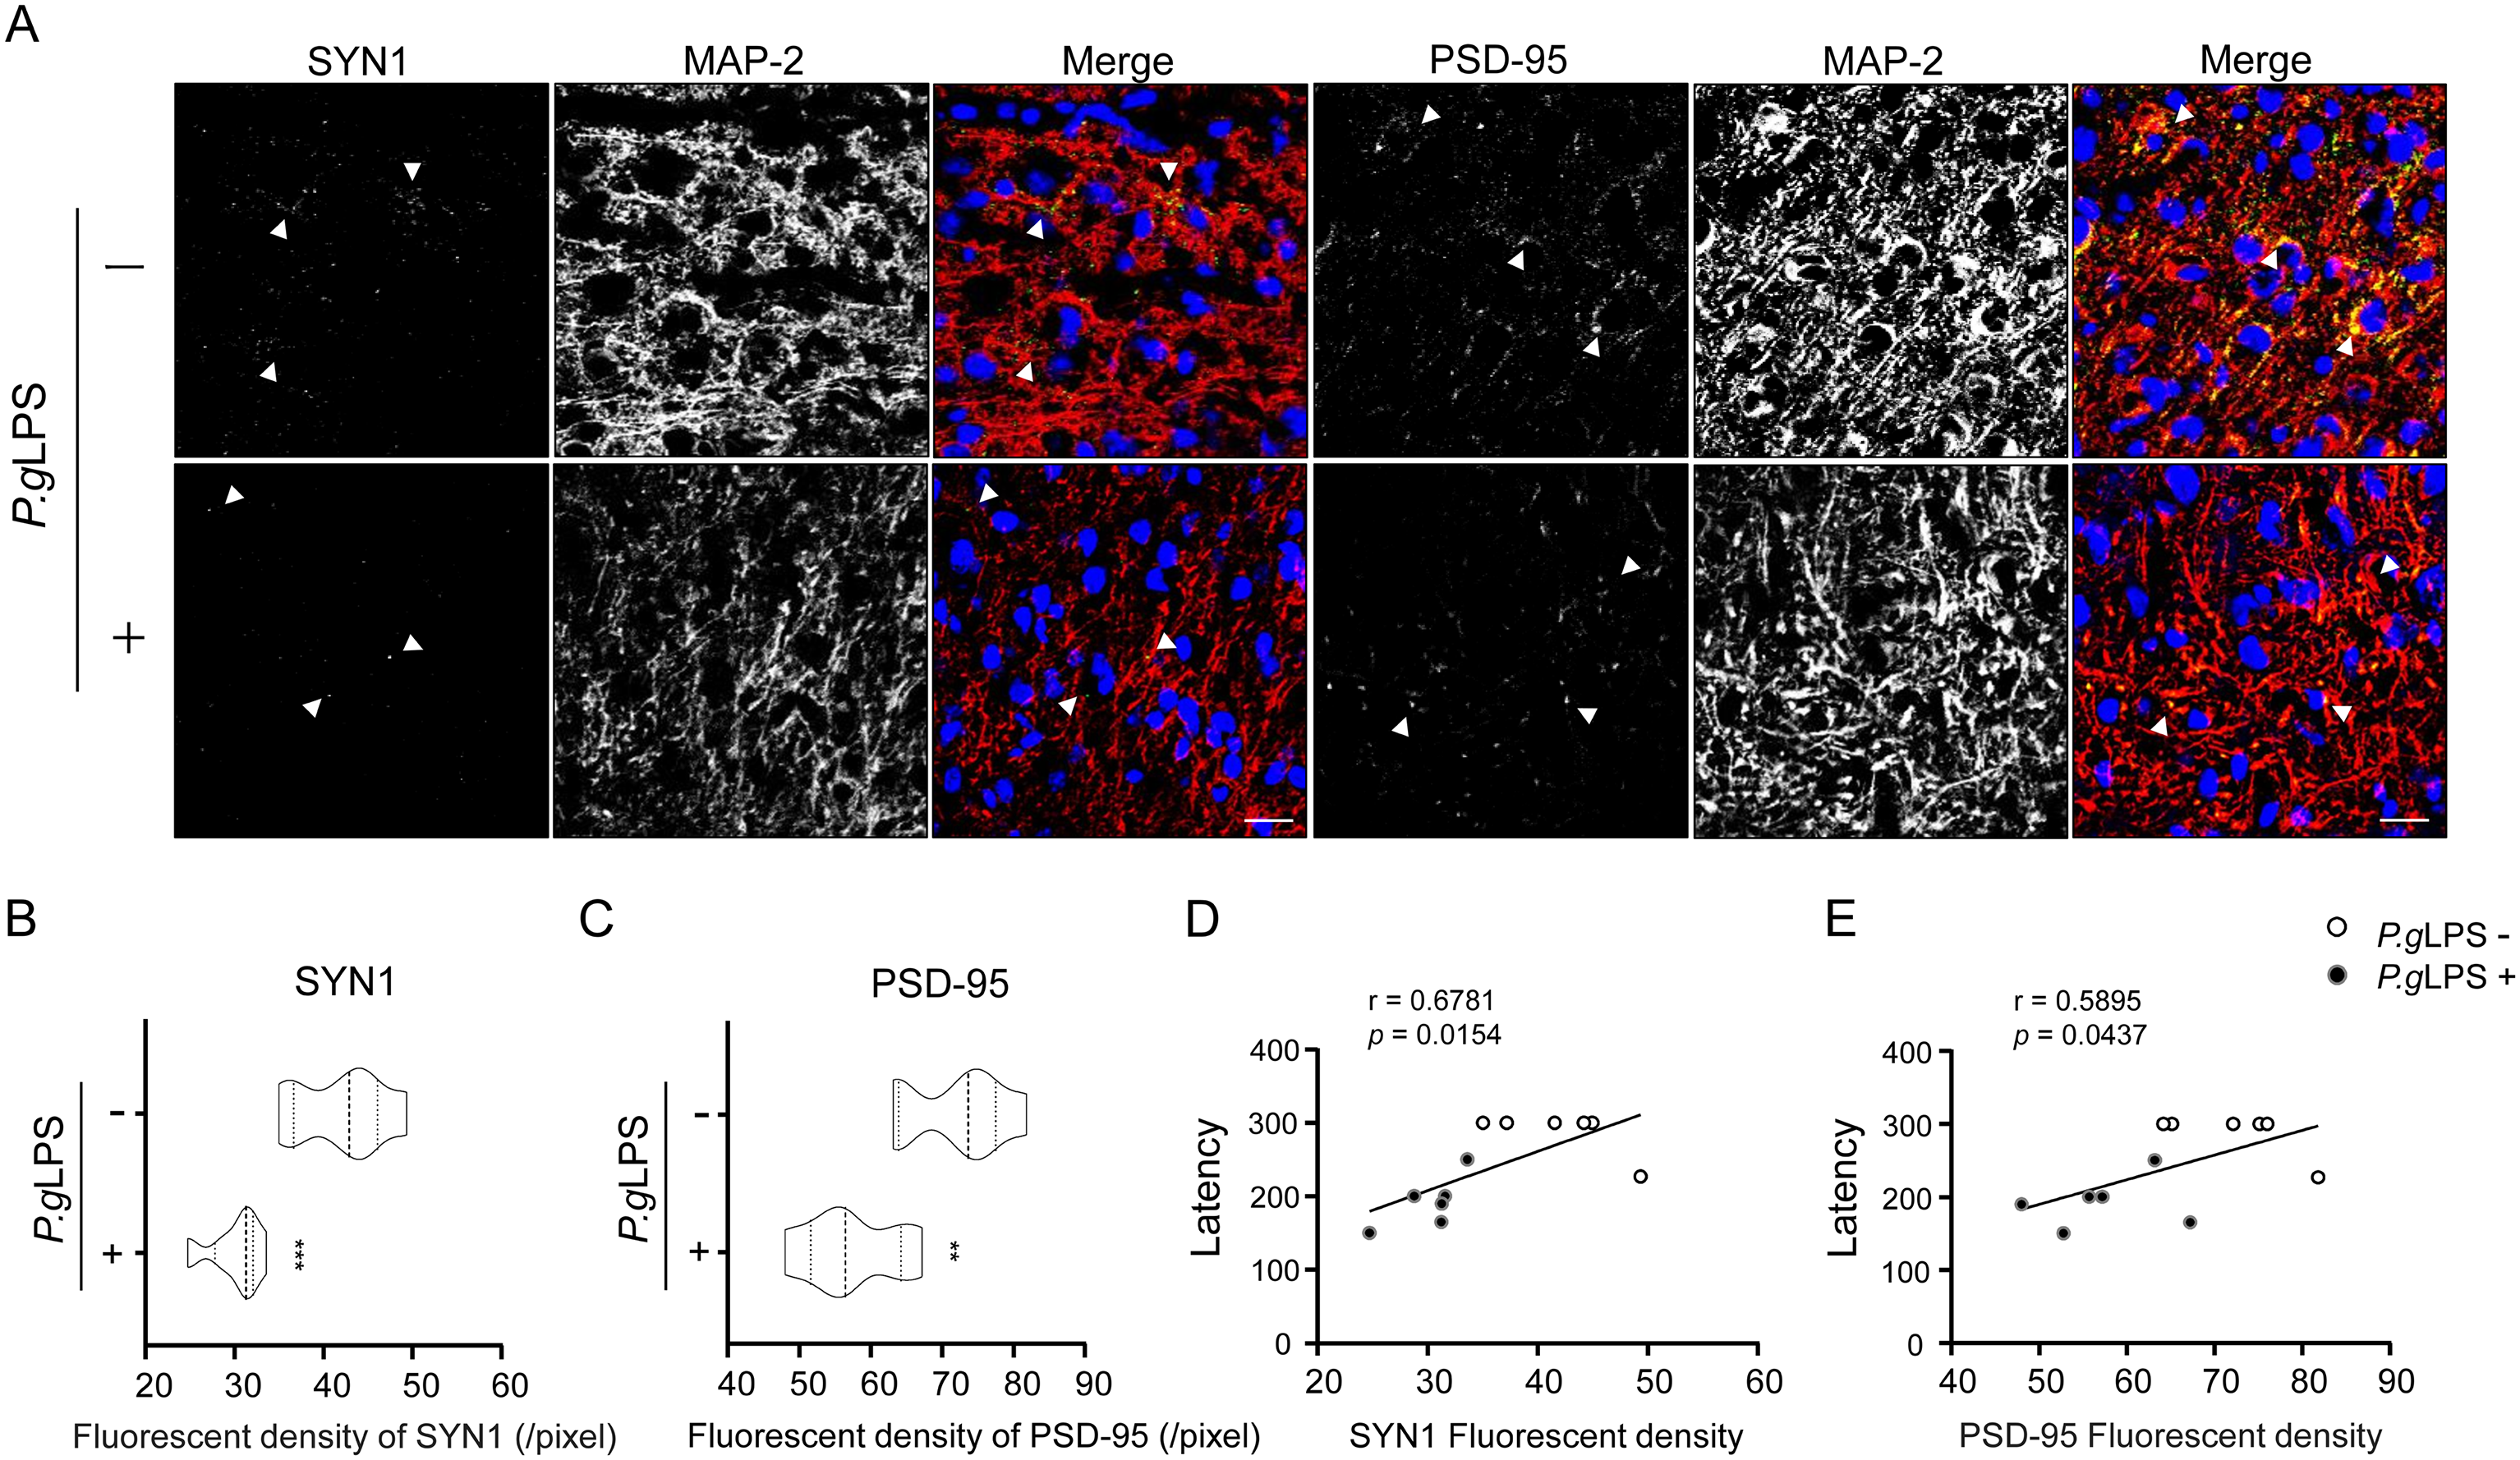
Expression of synaptic molecules in the cortex neurons of APPNL-F/NL-F mice post systemic exposure to P.gLPS. A) Immunofluorescent images of SYN1 (green) or PSD-95 (green) in MAP-2-(+) neurons (red), B) The mean fluorescent density (pixel) of SYN1 in MAP-2-(+) neurons of A). C) The mean fluorescent density (pixel) of PSD-95 in MAP-2-(+) neurons of A). The correlation between the immunofluorescent intensity of SYN1 D) and PSD-95 E) with the memory test latency in APPNL-F/NL-F mice. Scale bar, 20 μm. Each column and bar represent the mean ± SD (n = 6) for each variable. Asterisks indicate a significant difference from the value in the no P.gLPS-exposed mice (**p < 0.01, ***p < 0.001, Student's t-test). The Pearson correlation coefficient (r) was used to analyze the strength of the association between the two variables (0.4 ≤ | r | < 0.7 is a significant correlation, 0.7 ≤ | r | < 1 is a highly linear correlation; Pearson correlation coefficient).
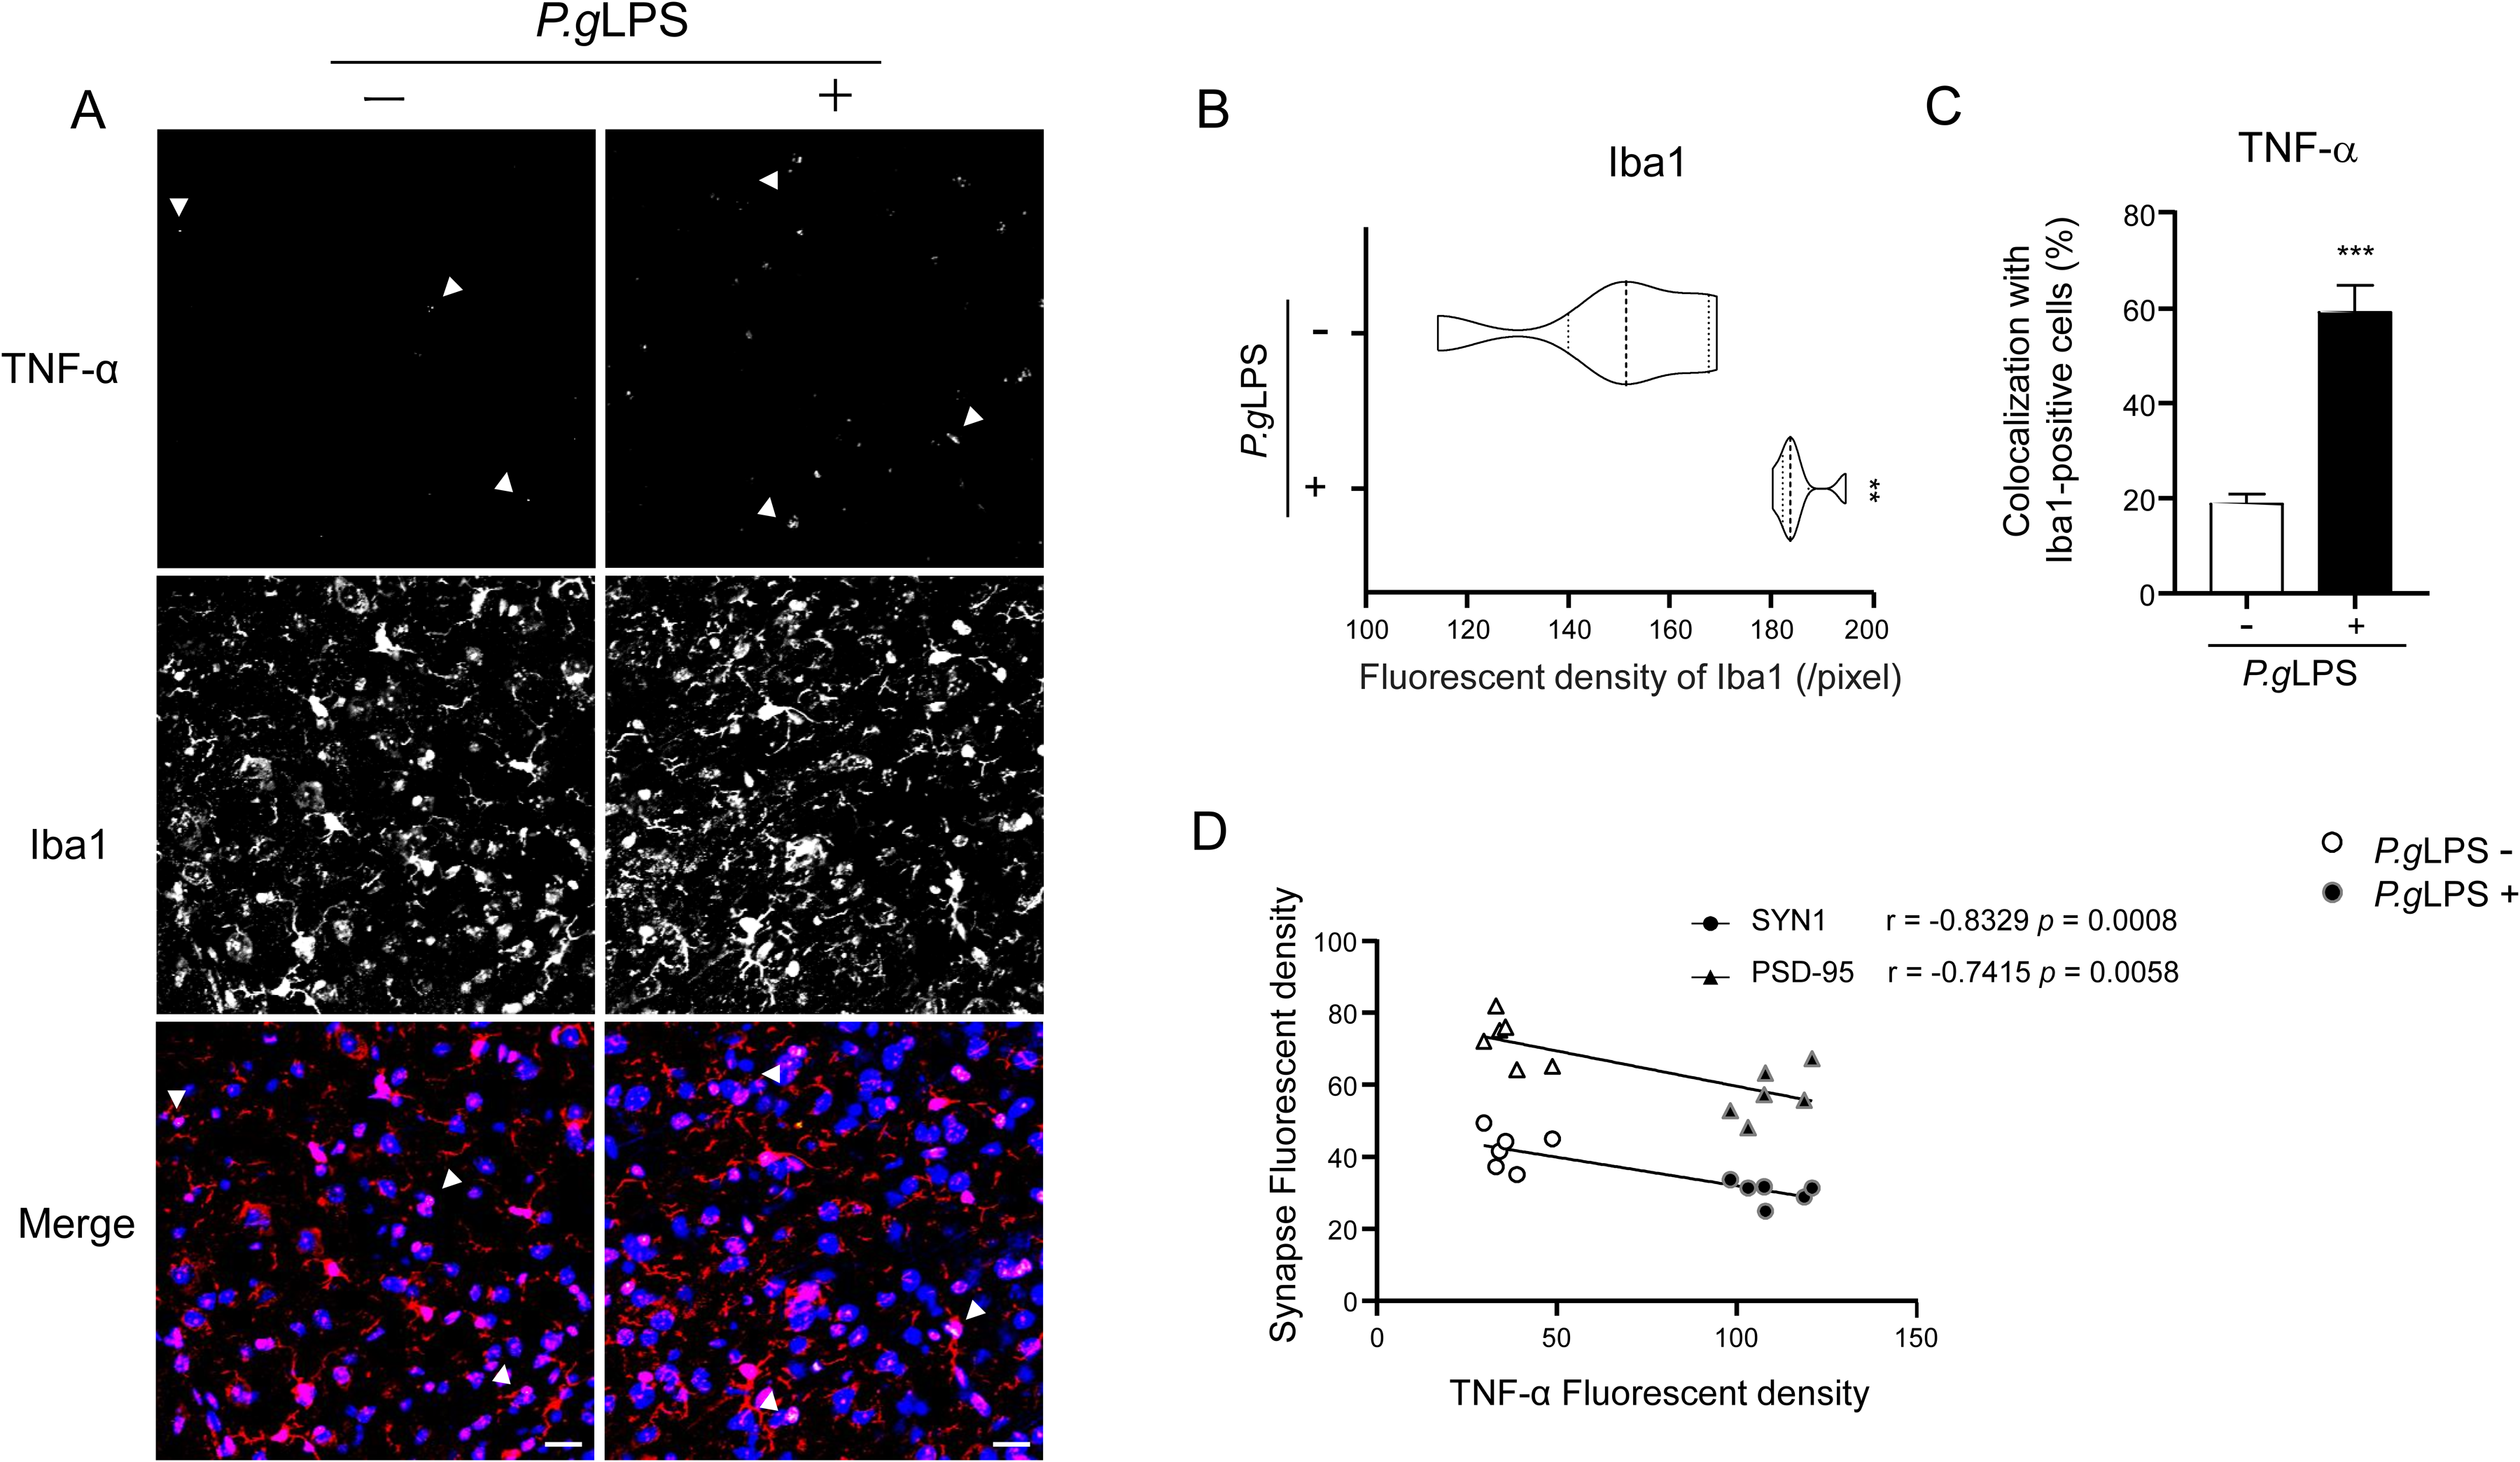
Microglia activation in the cortex of APPNL-F/NL-F mice post systemic exposure to P.gLPS. A) Immunofluorescent images of TNF-α (green) in Iba1(+) microglia (red). B) The mean fluorescent density (pixel) of Iba1. C) The percentage of TNF-α (+) findings among Iba1(+) microglia. D) The correlation between the fluorescent intensity of TNFα and that of SYN1 and PSD-95 in the cortex of APPNL-F/NL-F mice. Scale bar, 20 μm. Each column and bar represent the mean ± SD (n = 6) for each variable. Asterisks indicate a significant difference from the value in the no P.gLPS exposure mice (**p < 0.01, ***p < 0.001, Student's t-test). Pearson's correlation coefficient (r) was used to analyze the strength of the association between the two variables (0.4 ≤ | r | < 0.7 is a significant correlation, 0.7 ≤ | r | < 1 is a highly linear correlation; Pearson's correlation coefficient).
Collectively, microglia exhibited higher sensitivity to combined P.gLPS and Aβ42 treatment compared to neurons. In a low-Aβ concentration environment, P.gLPS indirectly induced synaptic defects through neuronal GSK3β-dependent mechanisms, mediated by microglial activation and neuroinflammation (Figure 10).
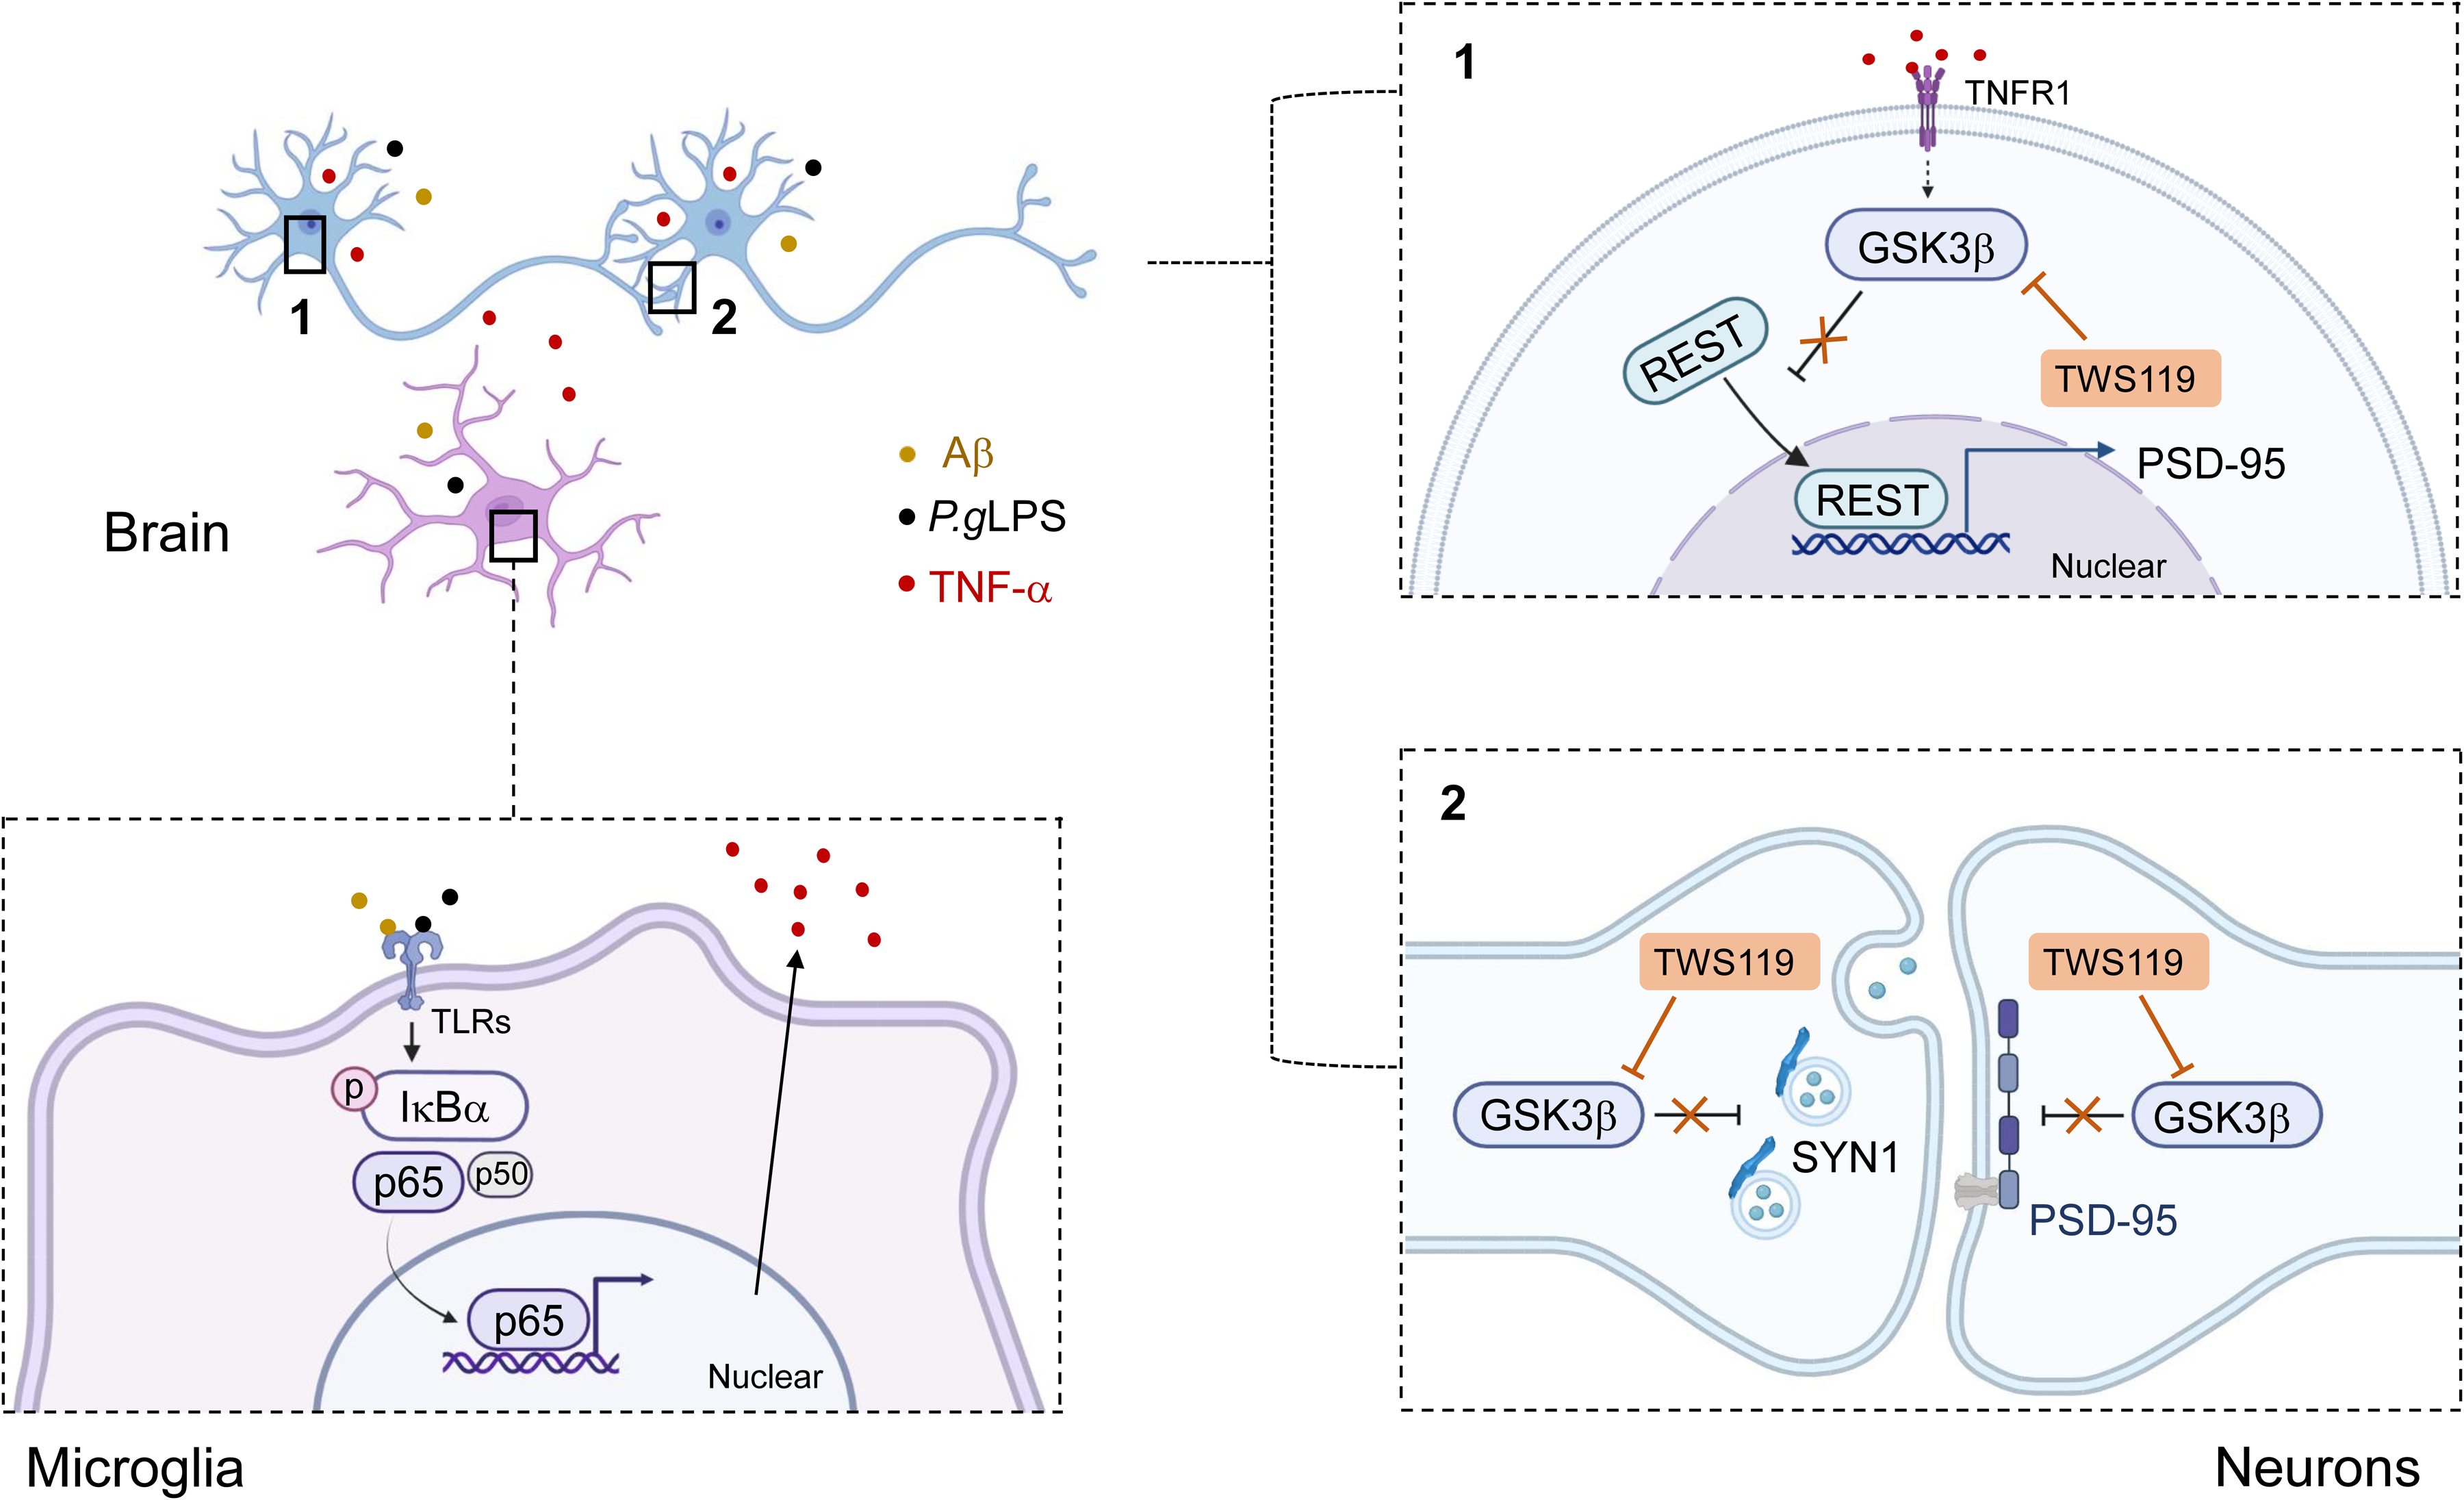
A schematic diagram of the effects and molecular mechanisms of P.gLPS in promoting synaptic defects in a low Aβ-concentration environment (Created in BioRender.com). P.gLPS prompted microglia activation for pro-inflammatory mediators, including TNF-α, by enhancing and prolonging NF-κB activation through low Aβ concentration. The activated microglia promoted GSK3β activation-dependent synaptic defects by decreasing the nuclear translocation of REST as well as pre- and post-synaptic molecules SYN1 and PSD-95 in neurons. This study provided new evidence supporting the hypothesis that periodontitis is involved in the earliest pathologies of AD.
Discussion
This study explored the impact of low levels of P.gLPS and Aβ on neuronal synapses. This study found that P.gLPS indirectly induces neuronal GSK3β-dependent synaptic defects via microglial mediated neuroinflammation.
Utilizing our in vitro models, neither the cell viability nor the expression of SYN1, PSD-95, and GSK3β in N2a neurons was changed after exposure to Aβ42 (0.1 μM) or P.gLPS (0.1 μg/mL) or their combination (AL), suggesting that neurotoxicity is not induced directly by exposure to Aβ42, P.gLPS, or AL at low concentrations. 39 In contrast to N2a neurons, mRNA expression of TNF-α, IL-1β, and IL-6 was elicited as early as 3 h with continuous production of TNF-α by exposure to the same amount of P.gLPS or AL in MG6 microglia without affecting their cell viability. These results suggest that the microglia are activated and respond rapidly to adverse stimuli. 17
The concentration of Aβ42 (0.1 μM) in the present in vitro models was considered to mimic the amount of Aβ in the brain before or at AD onset. The physiological concentration of Aβ in the brain is 10 nM and reach 10,000 times the physiological state post AD onset.34–36 Although treatment with Aβ42 alone at 0.1 μM increased ROS production, it did not increase the expression of pro-inflammatory molecules or NF-κB activation in MG6 microglia, suggesting that low Aβ concentration is insufficient to stimulate microglial cell activation. 40 This finding was supported by recent reports showing that Aβ42 at 1 μM does not induce microglia to produce pro-inflammatory molecules.11,12 Treatment with P.gLPS alone at 0.1 μg/mL induced the expression of pro-inflammatory molecules, NF-κB activation, and ROS production in MG6 cells, indicating that P.gLPS can induce microglial activation even at low concentrations, because P.gLPS is a more potent stimulator of the host innate immune signal transduction pathways than Aβ. The findings regarding P.gLPS align with previous reports demonstrating that LPS alone can shift the transcriptional profile of microglia in an AD model. 41 The microglia activated by P.gLPS at 0.1 μg/mL were not enough to induce synaptic defects. As previously reported, microglia activated by P.gLPS at 1 μg/mL reduced PSD-95 expression and induced intracellular Aβ in cultured N2a neurons,8,17 suggesting that the effects of P.gLPS-activated microglia on neurons may be P.gLPS dose-dependent. Microglia exposed to a low dose of Aβ experienced high and sustained oxidative stress, whilst low levels of P.gLPS stimulation led to an increased expression of TLR2. The oxidative stress and high TLR2 expression contribute to prolong NF-κB activation in microglia.12,17 These results indicate the synergistic effects of P.gLPS and Aβ on microglial activation. 12 Exposure to P.gLPS and Aβ drives microglia into a hyperinflammatory phenotype, subsequently initiating innate immune responses that may compromise the integrity of synapses.
SYN1 and PSD-95 were selected to examine the impacts of adverse stimuli on N2a neurons, as they are markers of early neurodegeneration in preclinical AD patients.24,25,42 The effects of P.gLPS-activated microglia on neurons may be dependent on the dose of P.gLPS. It was found that AL-MCM induced a reduction in SYN1 and PSD-95 expression in N2a neurons at both the mRNA and protein levels. This suggests that a low amount of P.gLPS mediates synaptic defects in pre- and post-synaptic terminals via microglia in a low-Aβ-concentration environment. P.gLPS, even at low concentration, upregulates the Aβ-induced oxidative stress and promotes TNF-α release, thus contributing to synaptic protein modulation along with GSK3β in neurons. This conclusion was supported by the positive correlation between the TNF-α released by microglia and GSK3β activity in neurons. As the most abundant synaptic vesicle protein, a reduction in SYN1 in neurons due to AL-MCM may decrease synapse formation and synaptic contacts, ultimately resulting in cognitive decline. 43 The reduction in PSD-95 expression in neurons due to AL-MCM may delay synapse maturation and stabilization, thus accelerating cognitive impairment. This is because PSD-95 plays a crucial role in the regulation of post-synaptic formation and transmission, serving as the major component of post-synaptic density proteins. 20 In addition, AL-MCM-induced reductions in the expression of SYN1 and PSD-95 may mutually reinforce each other, with decreased expression of one leading to further downregulation of the other.23,44 In APPNL-F/NL-F mice, wherein Aβ is detectable in the brain, 8 a positive correlation between SYN1 and PSD-95 expression in neurons and memory test latency supported their involvement in memory maintenance.20,21 Additionally, a negative correlation between TNF-α-producing microglia and SYN1 and PSD-95 expression in neurons provided in vivo evidence of activated microglia-mediated synapse loss in the presence of Aβ.
TNF-α mediated the AL-MCM-induced reduction in SYN1 and PSD-95 expression in neurons, as it is the soluble factor in MCM that shows a continuously elevated release, which likely underlies the molecular mechanism governing these synaptic defects. In addition, the expression of SYN1 and PSD-95 in N2a neurons was negatively correlated with TNF-α concentration in AL-MCM, indicating that TNF-α mediates synaptic defects in a dose-dependent manner. Furthermore, the expression of TNFR1 in N2a neurons increased after treatment with AL-MCM. As an increase in TNFR1 expression aggravates synapse loss,45,46 AL-MCM-elicited TNFR1 expression enhances sensitivity to TNF-α in neurones.8,47 Second, downregulation of the nuclear translocation of REST in neurons leads to synaptic defects in AL-MCM-exposed neurons. In AL-MCM-exposed N2a neurons, the expression of REST was negatively correlated with TNF-α concentration in AL-MCM, and the reduction in REST nuclear translocation was followed by a decrease in SYN1 and PSD-95 protein levels. Since nuclear translocation of REST in neurons plays a neuroprotective role,27,28,48 and REST controls PSD-95 expression in neurons,29,49 AL-MCM-downregulated REST nuclear translocation in neurons may promote cognitive decline. Third, GSK3β plays a critical role in AL-MCM-induced synaptic defects. As the highest expression of kinases in the brain is observed in synapses, GSK3β is recognized as a key contributor in synaptic plasticity. 31 Unlike previous reports stating that the mRNA expression of GSK3β was upregulated 4.4-fold after treatment with 10 μg/mL P.gLPS 50 and 2.09-fold after treatment with 1 μg/mL P.gLPS 51 in IMR-32 neuronal cells, the mRNA expression of GSK3β showed no upregulation after treatment with 0.1 μg/mL P.gLPS in the present study. The effects of P.gLPS treatment on GSK3β expression in neurons may be dose- or cell-type-dependent. Neuronal GSK3β may play a critical role in synaptic defects that are caused by AL-MCM, because the increase in GSK3β expression precedes the reduction in SYN1 and PSD-95 expression in AL-MCM-exposed N2a neurons. In addition, TW119, a specific inhibitor of GSK3β, completely reversed the AL-MCM-reduced SYN1 and PSD-95 expression in N2a neurons. The increase in neuronal GSK3β expression may directly cause a reduction in synaptic vesicle fusion and phosphorylation of PSD-95.52,53 GSK3β may also cause synaptic defects indirectly by phosphorylation of tau, because phosphorylated tau accelerates synaptic loss.8,54 This possibility is supported by the present study, where AL-MCM exposure in N2a cells upregulated phosphorylated tau (Ser 396) expression, and the level of Ser 396 was negatively correlated with SYN1 and PSD-95 expression in N2a neurons. In addition, complete blockade of AL-MCM reduced the nuclear translocation of REST in neurons through GSK3β inhibition, suggesting that REST is a novel nuclear target of GSK3β.32,33
Taken together, the present study demonstrate that low levels of P.gLPS indirectly induce synaptic defects via microglia-mediated innate immune responses in a low-Aβ-concentration environment. Since synapses remain plastic even during ageing and synapse loss is reversible, therapeutic targeting of GSK3β could support synapse maintenance, potentially preventing cognitive decline and delaying the onset of AD.
Supplemental Material
sj-docx-1-alz-10.1177_13872877251326879 - Supplemental material for Lipopolysaccharides from Porphyromonas gingivalis indirectly induce neuronal GSK3β-dependent synaptic defects and cause cognitive decline in a low-amyloid-β-concentration environment in Alzheimer's disease
Supplemental material, sj-docx-1-alz-10.1177_13872877251326879 for Lipopolysaccharides from Porphyromonas gingivalis indirectly induce neuronal GSK3β-dependent synaptic defects and cause cognitive decline in a low-amyloid-β-concentration environment in Alzheimer's disease by Shuge Gui, Fan Zeng, Zhou Wu, Saori Nonaka, Tomomi Sano, Junjun Ni, Hiroshi Nakanishi, Masafumi Moriyama and Takashi Kanematsu in Journal of Alzheimer's Disease
Footnotes
Acknowledgments
We appreciate the scholarship support from the Otsuka Toshimi Scholarship Foundation for Shuge Gui.
ORCID iDs
Ethical considerations
Not applicable.
Consent to participate
Not applicable.
Consent for publication
Not applicable.
Author contributions
Shuge Gui (Validation; Visualization; Writing – original draft); Fan Zeng (Data curation; Investigation); Zhou Wu (Conceptualization; Funding acquisition; Writing – original draft); Saori Nonaka (Validation); Tomomi Sano (Writing – review & editing); Junjun Ni (Formal analysis; Writing – review & editing); Hiroshi Nakanishi (Methodology; Writing – review & editing); Masafumi Moriyama (Writing – review & editing); Takashi Kanematsu (Methodology; Writing – review & editing).
Funding
The authors disclosed receipt of the following financial support for the research, authorship, and/or publication of this article: This work was supported by the JSPS KAKENHI Grant Numbers JP22K09927 (Grants-in-Aid for Scientific Research to Z.W.).
Declaration of conflicting interests
The author(s) declared the following potential conflicts of interest with respect to the research, authorship, and/or publication of this article: Zhou Wu is an Editorial board member of this journal but was not involved in the peer review process of this article, nor had access to any information regarding its peer review.
The remaining authors declared no potential conflicts of interest with respect to the research, authorship, and/or publication of this article.
Data availability
All data can be retrieved from the authors upon reasonable request.
Supplemental material
Supplemental material for this article is available online.
References
Supplementary Material
Please find the following supplemental material available below.
For Open Access articles published under a Creative Commons License, all supplemental material carries the same license as the article it is associated with.
For non-Open Access articles published, all supplemental material carries a non-exclusive license, and permission requests for re-use of supplemental material or any part of supplemental material shall be sent directly to the copyright owner as specified in the copyright notice associated with the article.