
Abstract
During decades scientists tried to unveil the genetic architecture of Alzheimer's disease (AD), recurring to increasingly larger sample numbers for genome-wide association studies (GWAS) in hope for higher statistical gains. Here, a retrospective look on the most prominent GWAS was performed, focusing on the quality of the diagnosis associated with the used data and databases. Different methods for AD diagnosis (or absence) carry different levels of accuracy and certainty applied to both subsets of cases and controls. Furthermore, the different phenotypes included in these databases were explored, as several incorporate other ageing comorbidities and might be encompassing many confounding agents as well. Age of the samples’ donors and origin populations were also investigated as these could be biasing factors in posterior analyses. A tendency for looser diagnostic methods in more recent GWAS was observed, where greater datasets of individuals are analyzed, which may have been hampering the discovery of associated genetic variants. Specifically for AD, a diagnostic method conveying a clinical outcome may be distinct from the disease neuropathological assessment, since the first has a practical perspective that not necessarily needs a confirmation. Due to its properties and complex diagnosis, this work highlights the importance of the neuropathological confirmation of AD (or its absence) in the subjects considered for research purposes to avoid reaching statistically weak and/or misleading conclusions that may trigger further studies with powerless groundwork.
Introduction
Dementia places an enormous burden, not only on patients, but also on their caregivers, families, and society at large. It is expected that people living with dementia will rise from 55 M in 2019 to 139 M in 2050. 1 Alzheimer's disease (AD) is the most common cause of dementia and is rapidly becoming one of the most lethal and burdensome diseases of this century, both economically and socially. 2 Despite the massive effort from worldwide scientific community (e.g., the National Institutes of Health invested more than $56B in the last 15 years 3 ), there is still no treatment to cure dementia.
Beyond AD, other neurodegenerative diseases can lead to dementia, and although the different causes are associated with different symptom patterns and brain abnormalities, specific diagnosis is still challenging. Clinicians tend to use worldwide developed guidelines to establish normative diagnosis, and in AD two of these are widely applied: the NINCDS-ARDRDA and the Diagnostic and Statistical Manual of Mental Disorders (DSM). The NINCDS-ADRDA were put forward as a joint effort by the National Institute of Neurological and Communicative Disorders and Stroke and the Alzheimer's Disease and Related Disorders Association and focus on the diagnosis of AD considering four stages of AD diagnostic certainty (definite, probable, possible, and unlikely). 4 On the other hand, the DSM is a series of guidelines that are published by the American Psychiatric Association that focus on the classification of mental disorders and can also be applied to the diagnosis of dementia or cognitively compromised individuals. Although, these criteria are applied for the clinical diagnosis of the disease, more recent diagnostic guidelines integrated biomarker data for probable and possible AD for research purposes. 5 It is noteworthy that the latest diagnostic criteria for AD were recently published and include the use of biomarkers for its biological definition. 6 Indeed, the distinction between neuropathologic changes and clinical symptoms may become blurred, as AD terminology is often used to refer to either prototypical clinical syndromes without neuropathologic verification of AD changes. These entities may overlap to some degree but should not be confused, as a syndrome is not an etiology, but rather a clinical consequence of one or more diseases. The difficulty in distinguishing the two entities may have had also consequences in scientific research setting, as we will discuss later.
Brain changes associated with AD that define it as a unique neurodegenerative disease among the various disorders that can lead to dementia are the deposition of amyloid-β (Aβ) plaques due to deficient processing of Aβ peptide and the formation of neurofibrillary tangles composed mainly of abnormally phosphorylated tau (p-tau) protein. 7 The three best-validated neuroimaging biomarkers for AD are medial temporal lobe atrophy on magnetic resonance imaging (MRI) and posterior cingulate and temporoparietal hypometabolism on fluorodeoxyglucose (FDG) - positron emission tomography (PET), respectively; as measures of neurodegeneration, and cortical Aβ deposition on amyloid-PET imaging. Aβ, p-tau, and neurodegeneration can also be determined by cerebrospinal fluid (CSF) biomarkers, with extensive research efforts currently directed towards the development of serum and plasma biomarkers. Several automated platforms have been developed for the analysis of Aβ1–42, p-tau 181, and total tau.8–10
Heritability plays an important role in AD, 11 studies involving twins showed that the risk of developing AD is ∼60–80% dependent on heritable factors. 12 The discovery of AD-associated genes may provide crucial insights for the biological understanding of the disease, and links between risk variant genetics and AD pathophysiology were already established for amyloidogenic pathway, modulation of the immune response, lipid dysfunction, cholesterol, endocytosis, vascular factors, among others – see for example.13–24 Additionally, the presence (or absence) of risk alleles in an individual's genome might allow the assessment of his/her risk of developing the disease.
From the genetic point of view, two subtypes of the disease are generally considered: familial AD, and sporadic AD (∼20 times more prevalent than the first), since the genetic contributions are known to be different in one and another case. The first is characterized by an earlier onset, while the second typically appears in sporadic cases after 65 years old, 25 which has been supporting the designation of late-onset AD (LOAD). The latter designation may however be avoided since it is prone to confusion as sporadic, non-familial, AD may also be diagnosed in younger subjects. The heritability of familial AD is typically explained by the occurrence of rare variants in a few genes, including APP, PSEN1, and PSEN2, with a strong effect; whereas sporadic AD has been associated with common variants, that are expected to have a small influence when analyzed individually, but a high impact when studied together.26–28 In any case, allele ε4 of the APOE gene has been reported as the strongest genetic risk for the disease since the early 1990s. 29 APOE allele ε3 is the most common worldwide despite the allele ε4 being described as the ancestral allele. 30 Alleles ε4 and ε2 showed a variable distribution worldwide and even within Europe, the frequencies of the strongest risk factor for AD—ε4— ranging between 0.045 for some countries in Asia to 0.407 for some others in Africa.29–31 Specifically, APOE allele ε4 has been associated with an estimated 3- to 4-fold increased risk of sporadic AD, whereas the other more than 70 risk alleles identified (which may be only a small fraction of the linked variants 32 ) are presented as being associated with much smaller contributions. 33
The traditional approach for identifying medically actionable population-based information relies in the development of case-control association studies, under which the difference in allele frequency between cases and controls is used to estimate the causal effect that a particular variant may have on the disease or phenotype of interest, taking into account all potential confounders. As a great number of variants are expected to be encountered linked to sporadic AD, genotypic associations have been sought through case-control genome-wide association studies (GWAS). GWAS face the challenge of ultrahigh dimensionality due to the bulk of genetic markers analyzed, which has been expected to be counterbalanced with the analysis of huge datasets of individuals.
International consortia and databases containing genomic data from individuals considering their sporadic AD status have been used by the scientific community in research settings, specifically in GWAS. Focused on AD-related case-control GWAS using data from these international consortia, this work was triggered by the fact that when considering such a complex phenotype as AD, the level of confidence of the status of the subjects differ between the used databases, as the stringency of the criteria for inclusion of subjects varies widely. A recent review sheds light on the caveats of increasing the sample size of some GWAS disregarding the quality of the data that have been feeding the statistical models. 34 The review discusses the decreasing explained heritability in the found loci despite the increased number of samples and pinpoints the decrease of clinically verified cases and increased number of cases-by-proxy. Furthermore, it also identifies a lack of independency among studies as more recent studies englobe the samples from earlier papers, among other issues. 34
Indeed, beyond the difficulties transversal to all the phenotypes, sporadic AD is a remarkably complex disease to study under a case-control framework due to its specificities, which may blur both cases and controls subsets. Examples of these specificities rely 1) on being an age-related condition with a very long preclinical stage, which may lead to the erroneous inclusion of subjects in the control group that are not manifesting the disease but already at a preclinical stage of the disease, and 2) on the difficulty of specific diagnosis, which may lead that patients with other forms of dementia are considered in the subset of cases. Worse, in some of the late studies, subjects whose AD status is established by proxy, i.e., not established directly but considering the one of the family members, have been included33,35,36 which increases even more the blurring between and within both cases and controls subsets. The immediate consequence of this poor assessment of the AD status of the subjects is that statistical inferences regarding correlation between specific genetic variants and the disease are inaccurate, 34 which may bring to light genetic variants falsely correlated, and camouflage others truly associated with the disease.
Aware of these complexities, in this work we provide a systematic review of the sporadic AD case-control GWAS, along with a critical analysis that will provide insights on the strengths and weaknesses of the scientific developments achieved so far. Additionally, we will focus on the standards accomplished by the international databases containing AD-related genomic information that have been used in GWAS, and we will focus on the subjects considered and results obtained by a set of 40 GWAS. Finally, we discuss the results and present the concluding remarks, providing a general overview of the state of the art of the latest AD GWAS.
International databases containing genomic information of AD cases and/or controls used in GWAS
A total of 25 consortia gathering genomic data from both cases and controls were used in GWAS where the phenotype of interest is AD—for more details see Supplemental Table 1. These consortia gathered data from 120 genomic databases, 15 and 1 of which having simultaneously contributed for two and three of them, respectively, increasing the risk of profiles’ repetition. In Table 1, a summary of the data contained in this set of 120 worldwide genomic databases (herein, databases) is presented, based on publicly available information. These databases were gathered according to their characteristics, including the number of sampling times the individuals were subjected to, i.e., cross-sectional (non-recurrent sampling: one subject, one sampling time) and longitudinal databases (recurrent sampling: one subject, several samplings over time – despite genomic information being mostly stable over time, other types of data are collected). Cross-sectional databases were divided into phenotype-oriented studies (n = 42, including others than AD) and others (n = 7, including national biobanks, brain banks and commercial DNA databases). Longitudinal databases were divided into cohort (target populations, n = 58) and panel studies (no target populations, n = 5). For a total of eight databases (n = 8) no information was publicly available.
Summary data concerning 112 out of the 120 genomic databases used in the set of 40 AD case-control GWAS, considering the information publicly available. For more details, see Supplemental Table 1. NA: not applicable. No information was found for 8 databases.
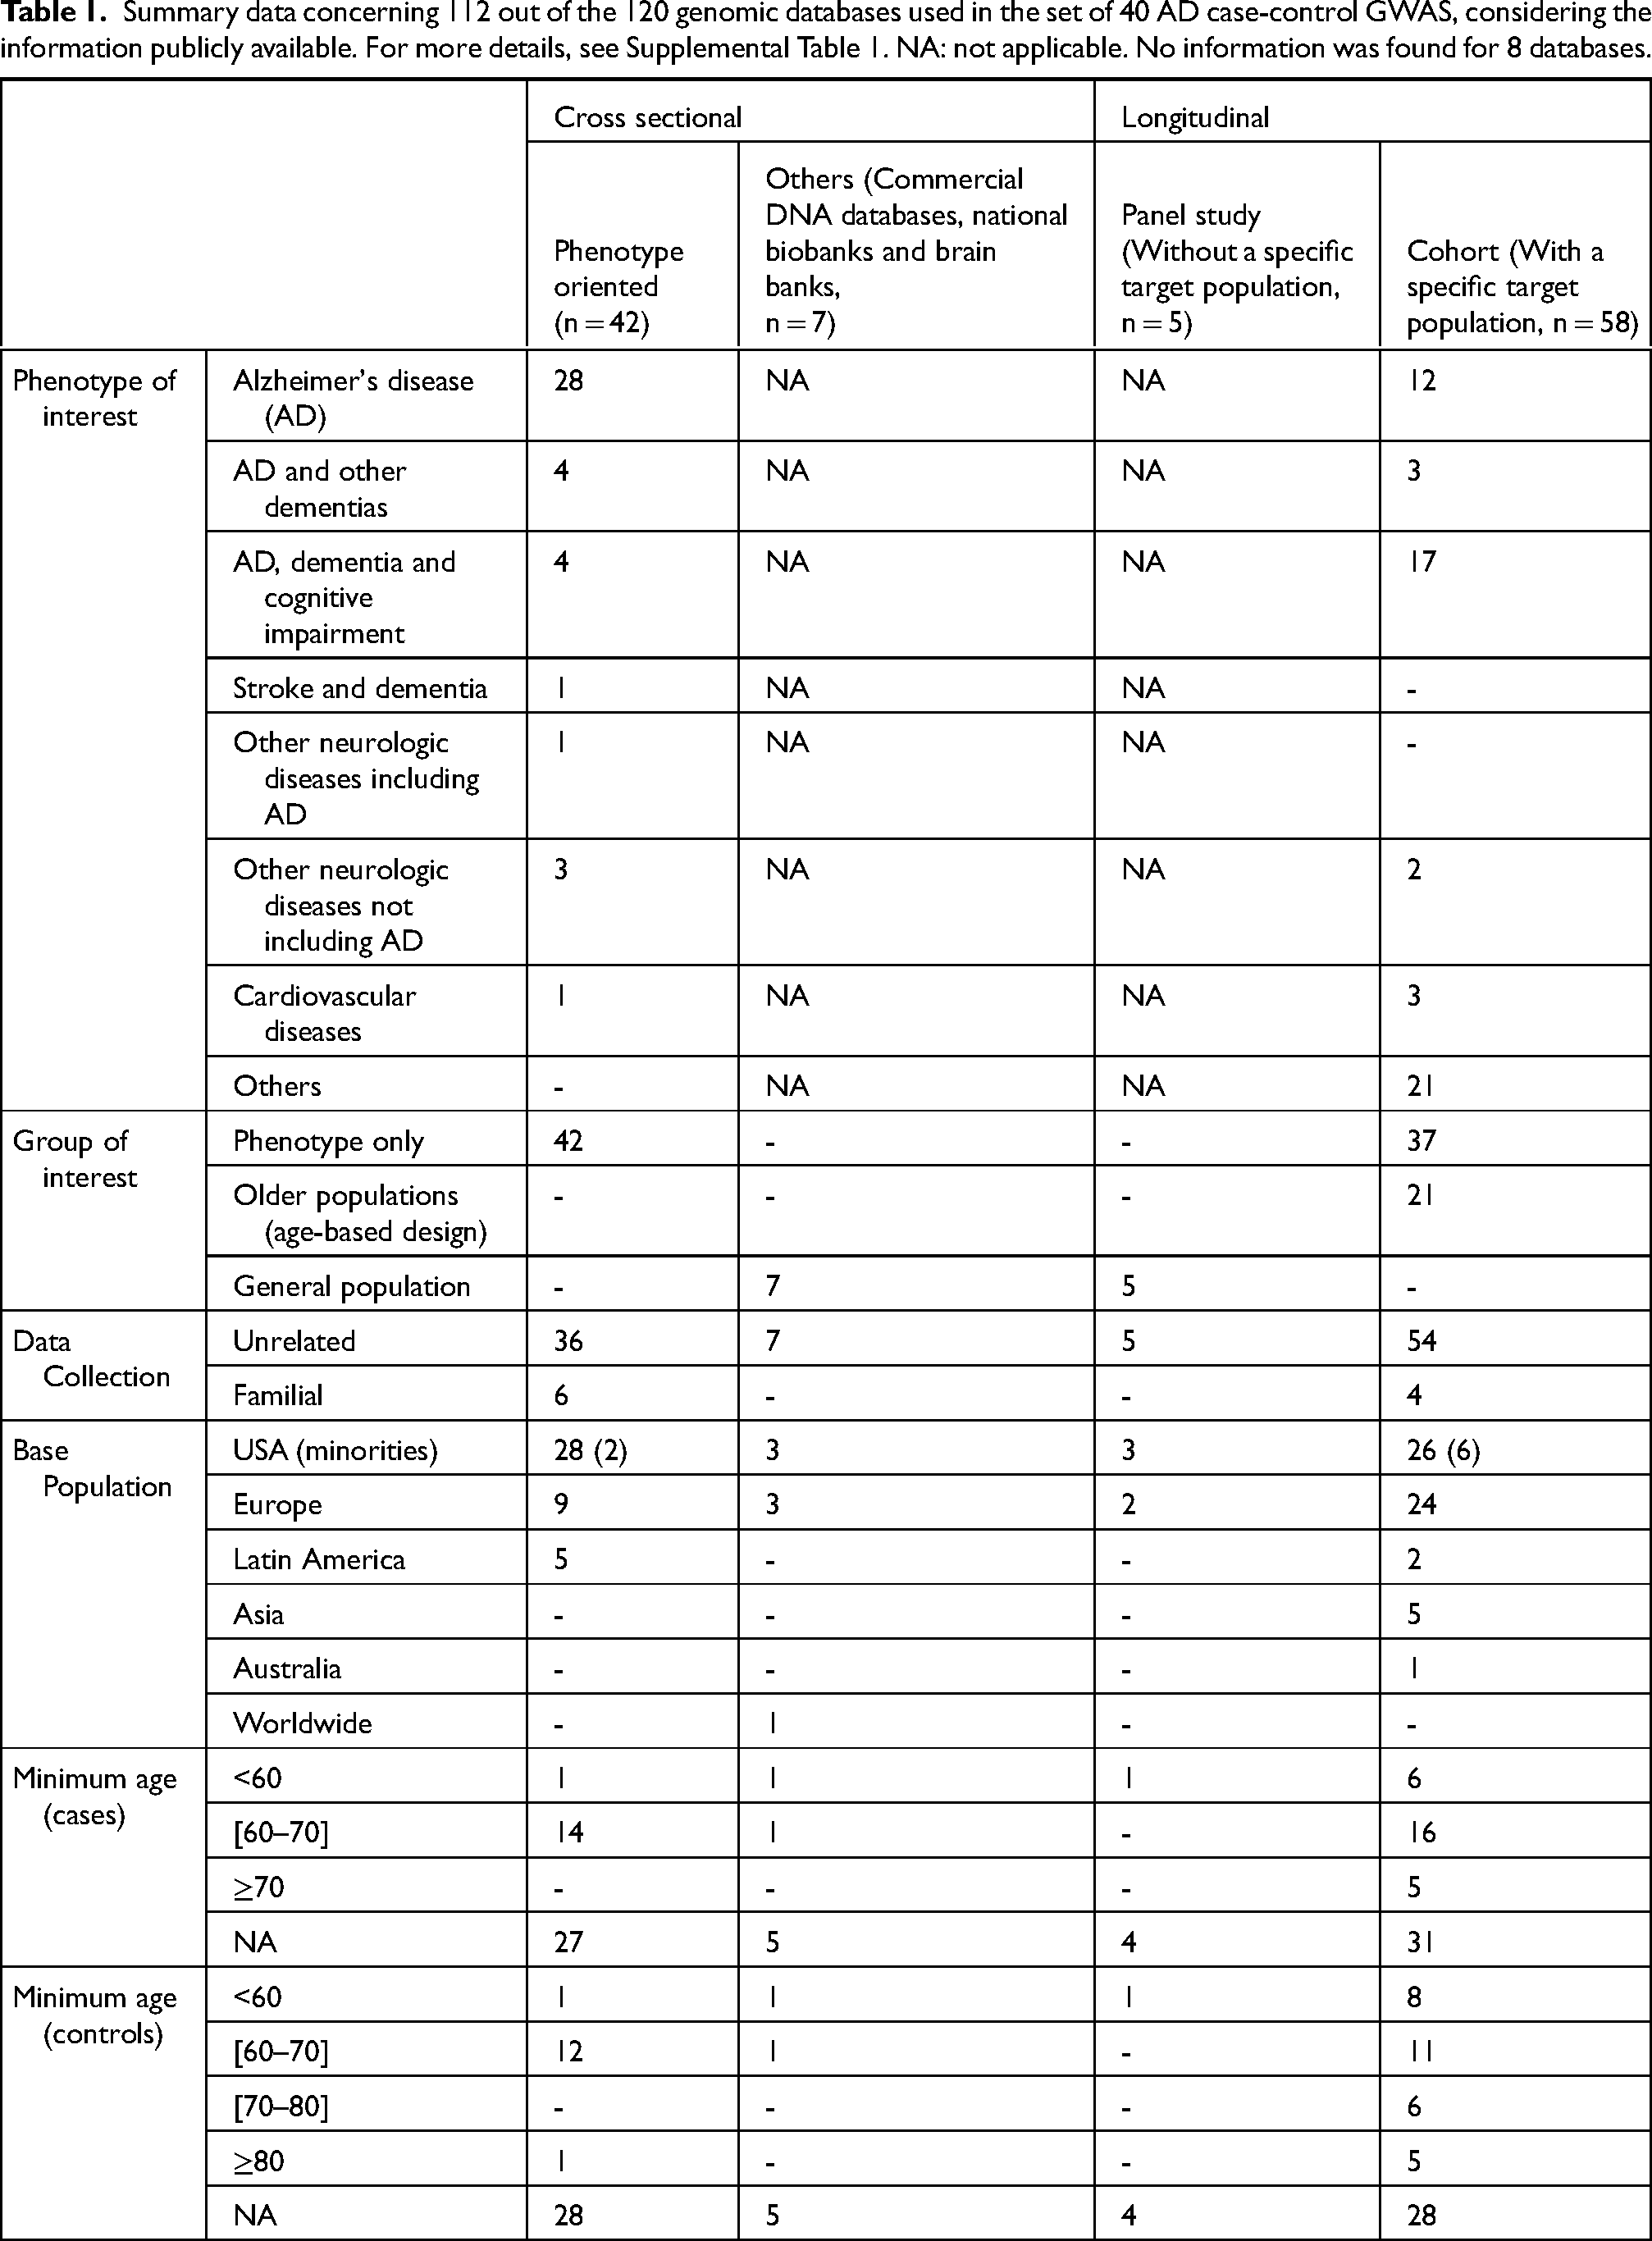
AD is the phenotype targeted in some databases (n = 40, 33.3%), the number increasing when considering other dementias beyond AD and/or cognitive impairments (n = 68, 56.7%). Additionally, databases based in other phenotypes are considered for AD-GWAS, such as strokes or cardiovascular diseases (n = 5, 4.2%), considering the genomic information of these subjects for the subsets of either cases or controls. Although the inclusion of more diverse databases increases undoubtedly the number of available samples, which is normally the limiting factor identified with GWAS, it will also increase the number of confounding factors that will bring noise to the statistical interpretation of the overall results. Groups of interest (specific groups of people that were sampled despite presenting or not a specific phenotype, e.g., “older individuals”) were also explored, particularly for cohort databases since the remaining are either focused on a specific phenotype of interest or do not target a specific group of individuals (general population). The cohort databases targeted either older individuals (n = 21, 17.5%), or specific phenotypes (n = 37, 67.7%).
Another major question that can be posed is if the data that have been gathered for these several GWAS is representative of the worldwide genetic pool. We explored the base populations sampled in all databases and observed that mostly European or European descendants are targeted (n = 98, 81.7%). Other emerging base populations include US minority populations (mostly of African-American descent), Asian, and Latin America countries (Table 1). Since there is a differential frequency of risk alleles in different populations (e.g., APOE ε4 allele, as previously mentioned), the ancestry of the subjects should be considered to more accurately perceive insights into disease associations and risk factors.
Additionally, in some databases, cases and controls by proxy (i.e., subjects whose AD status is not evaluated directly, but inferred considering the one of the family members) are also considered, which increases even more the confounding effects. Ten databases use this familial (and inferring) approach for sampling, four of which are longitudinal and six phenotype-oriented. Little information is made publicly available on how the sampling procedure took place within the families, but in some cases criticizable and conflicting procedures are known. For example, in some databases it is stated that all the members of families with history of sporadic AD in at least two of them are collected as patients without further investigation; inversely, another database mentioned that unaffected siblings of AD subjects were considered as controls. This procedure implies that healthy individuals may be included in the subset of patients, while individuals with genetics of risk, eventually in the preclinical stage of the disease, may be included in the subset of controls. Although the mere presence of an AD-affected person in the family is not deterministic that other relatives will develop the disease, the genetic constellation of these people has a higher probability of sharing risk alleles. The idea of sampling by proxy is very tempting and often used to increase the sample size; however, the risk of introducing unwanted genetic contributions (either by increasing the AD-set with AD-free samples or increasing the number of controls with AD-genetics) will generate a blurred picture of the genetics of the disease.
Unquestionably, the accuracy of the statistical inferences relies on the correct status of the subjects, both cases and controls, that is particularly tricky to establish in a disease like AD, specifically under a genomics framework that is mostly stable during the subjects’ lifetime. Indeed, if a clear description of AD's genetic landscape is sought after, then a clear-cut differentiation between AD patients and others (controls) needs to be obtained. The clinical assessment of AD can be extremely challenging and thus when utilizing the genomic information of AD cases without biomarker's confirmation, individuals with other types of dementia are likely to be included in the subset of cases. Conversely, individuals in the preclinical stage of the disease may be included as controls and considered through the statistical analyses as “protected” genomes.
The assessment of the AD status of the subjects was categorized as mention to either NINDCS-ADRDA or DSM III-IV criteria was done, or otherwise (i.e., no reference to any guidelines or criteria). Within each one of these categories, six subcategories were considered depending on the methods used for establishing the AD status: 1) Autopsy for all – i.e., databases that mention having autopsy data for all the subjects, 2) Imaging for all – i.e., imaging data (e.g., MRI, PET) for all, 3) CSF for all – cerebrospinal fluid biomarkers data for, 4) Mixed biomarkers’ analysis for all – i.e., databases that have either autopsy, imaging or CSF data for all, 5) Unspecified or diverse methods for the different subjects – i.e., databases that present: a) unspecific diagnostic methods (e.g., only clinical interviews), b) neuropsychological tests (e.g., Mini-Mental State Examination), c) mixed diagnostic methods (e.g., autopsy for part of the set and neuropsychological tests for the remaining), 6) Non-clinical interview, self- or third party-assessment – i.e., databases that base the establishment of the AD status of the subjects on self- or third-party-declarations. Additionally, a seventh category was added since for a few databases no publicly available information was found regarding the methodology used for establishing AD status of the subjects.
In what concerns the subset of cases, a total of 44 databases describe following the NINCDS-ADRDA criteria (44/112, 39.2%), not specifying however either possible/probable or probable/definite AD status (Table 2). These guidelines describe the usage of different diagnostic methods to achieve a specific AD status, for example the definite AD status can only be reached using either autopsy confirmation or histopathological data. However, probable and possible AD status are more ambiguous and based on clinical observation and neuropsychological tests. In addition to NINCDS-ADRDA, only four (4/44, 9.1%) databases describe neuroimaging data for the entire dataset and one (1/44, 2.3%) database has mixed biomarkers’ analysis for the entire dataset. Out of these 44, 39 (39/44, 88.6%) databases use unspecific and/or diverse methods for AD assessment (not specified as either possible/probable or probable/definite). A total of 56 databases (56/112, 50%) do not describe following either NINCDS-ADRDA or DSM III/IV criteria, however 14 databases present either autopsy (6/56, 10.7%), imaging (6/56, 10.7%) or mixed biomarkers’ analysis for the entire dataset (2/56, 3.6%). Similarly to the previous category, the majority of databases describe the use of unspecific and/or diverse methods for the entire or parts of the dataset (40/56, 71.4%) with one database basing their AD diagnostic in a non-clinical interview/self- or third party-assessment (1/56, 1.8%). Finally, 12 (12/112, 10.7%) databases did not share any information on AD-assessment. This indicates that different levels of confidence on the AD diagnosis of cases exist not only for subjects from different databases, but also for those included in the same database.
Summary data concerning AD and AD-free assessment methods for the 120 genomic databases used in the set of the 40 GWAS. For a total of eight databases no information was publicly available. For more details, see Supplemental Table 1.
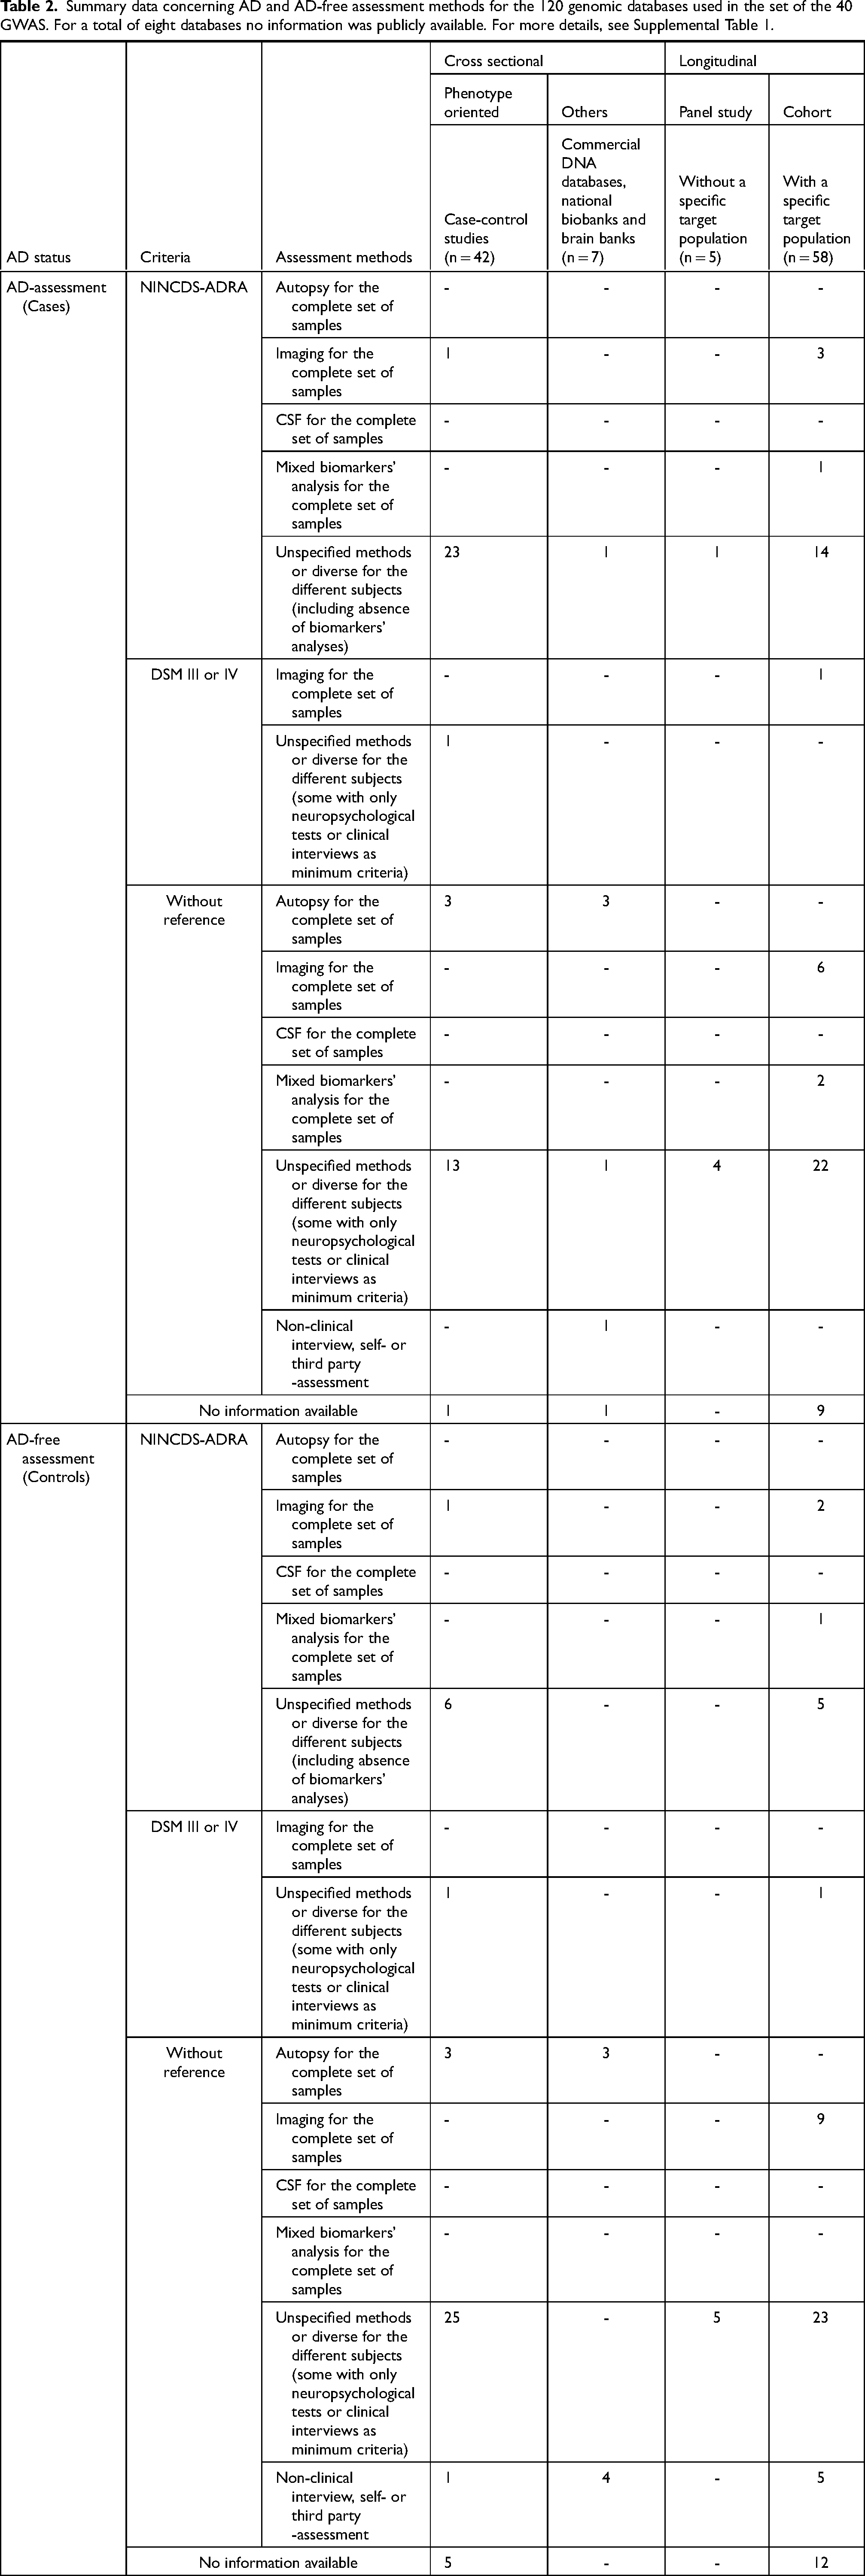
Equally or even more complex is the identification of subjects to be part of the subset of AD controls (Table 2). Considering that AD is a common and very heterogeneous disease, with different degrees of severity and patterns of evolution, the introduction of controls based on limited diagnostic methods could represent adding individuals that have not manifested the disease at the time of sampling but that will develop it later in life. Since AD is an age-related disease, this risk is even greater when using young individuals as subject controls. For this subset of subjects, 15 (15/112, 13.4%) databases declared using NINCDS-ADRDA criteria, and from these three describe imaging data for the entire dataset (3/15, 20%) and one describe mixed biomarkers’ analysis for the entire dataset (1/15, 6.7%). The remaining databases describe unspecific or diverse methods for the different subjects (11/15, 73.3%). Most databases do not declare following a single and specific criteria for control assessment (78/112, 69.6%). From these, most describe unspecified and/or diverse methods (53/78, 67.9%), followed by non clinical /self- or third-party assessment (9/78, 11.5%). Few databases refer either imaging (10/78, 12.8%) or autopsy data (6/78, 7.7%) for the entire set of controls. Finally, it is noteworthy that for seventeen databases (17/112, 15.1%) no publicly available information was found regarding the diagnostic methods used for the recruitment of controls.
Impressively, approximately half of the considered databases do not present any information on age minimum requirements (if any) for either AD-case (67/112, 59.8%), or control subjects (65/112, 58.0%). Among the databases disclosing information on the age of the subjects, most starts in the range 60–70 years old (31/112, 27.7% Table 1) for the subset of cases. When considering the subset of controls or subjects by proxy, minimum age presents more diverse intervals ranging from as early as 20 and 35 years old to >80, presenting the most common interval 60–70 years old as for cases (24/112, 21.4%).
Finally, for a total of 8 databases no descriptive information was found about sampling methods and design. As discussed previously, several databases do not share information on established age thresholds for AD and control samples or do not further explain the methodologies used to establish the AD status of the individuals, jeopardizing the inference of accuracy of the results and the reliability of the AD status of the subjects (Supplemental Table 1).
Genome wide association studies
In this section, we revise 40 AD case-control GWAS that, since 2007, built their subjects’ datasets using the international databases mentioned above, and reported at least one new risk loci to those previously discovered20,33,35–72 (Supplemental Table 2). A special focus will be devoted to the cohorts used in each case, analyzing the criteria considered for establishing the subjects’ status (both AD and AD-free).
Following the theoretical expectation that increasing the number of subjects may be the key to discover markers associated to AD, GWAS have been showing a clear trend to increase the number of analyzed subjects, the most recent including subjects whose AD status was established by proxy (Figure 1A). Indeed, in some cases an impressive number of subjects was analyzed, as is the case of 36 where ∼1.127 M of subjects were considered (∼44k cases, ∼47k cases by proxy, ∼718k controls and ∼318k controls by proxy). Aiming for sample increase, the more recent studies englobed the earlier ones as previously discussed in a recent review that discusses the lack of independency among recent GWAS, 34 to which we include yet another case: Lo et al. and Wang et al.67,70
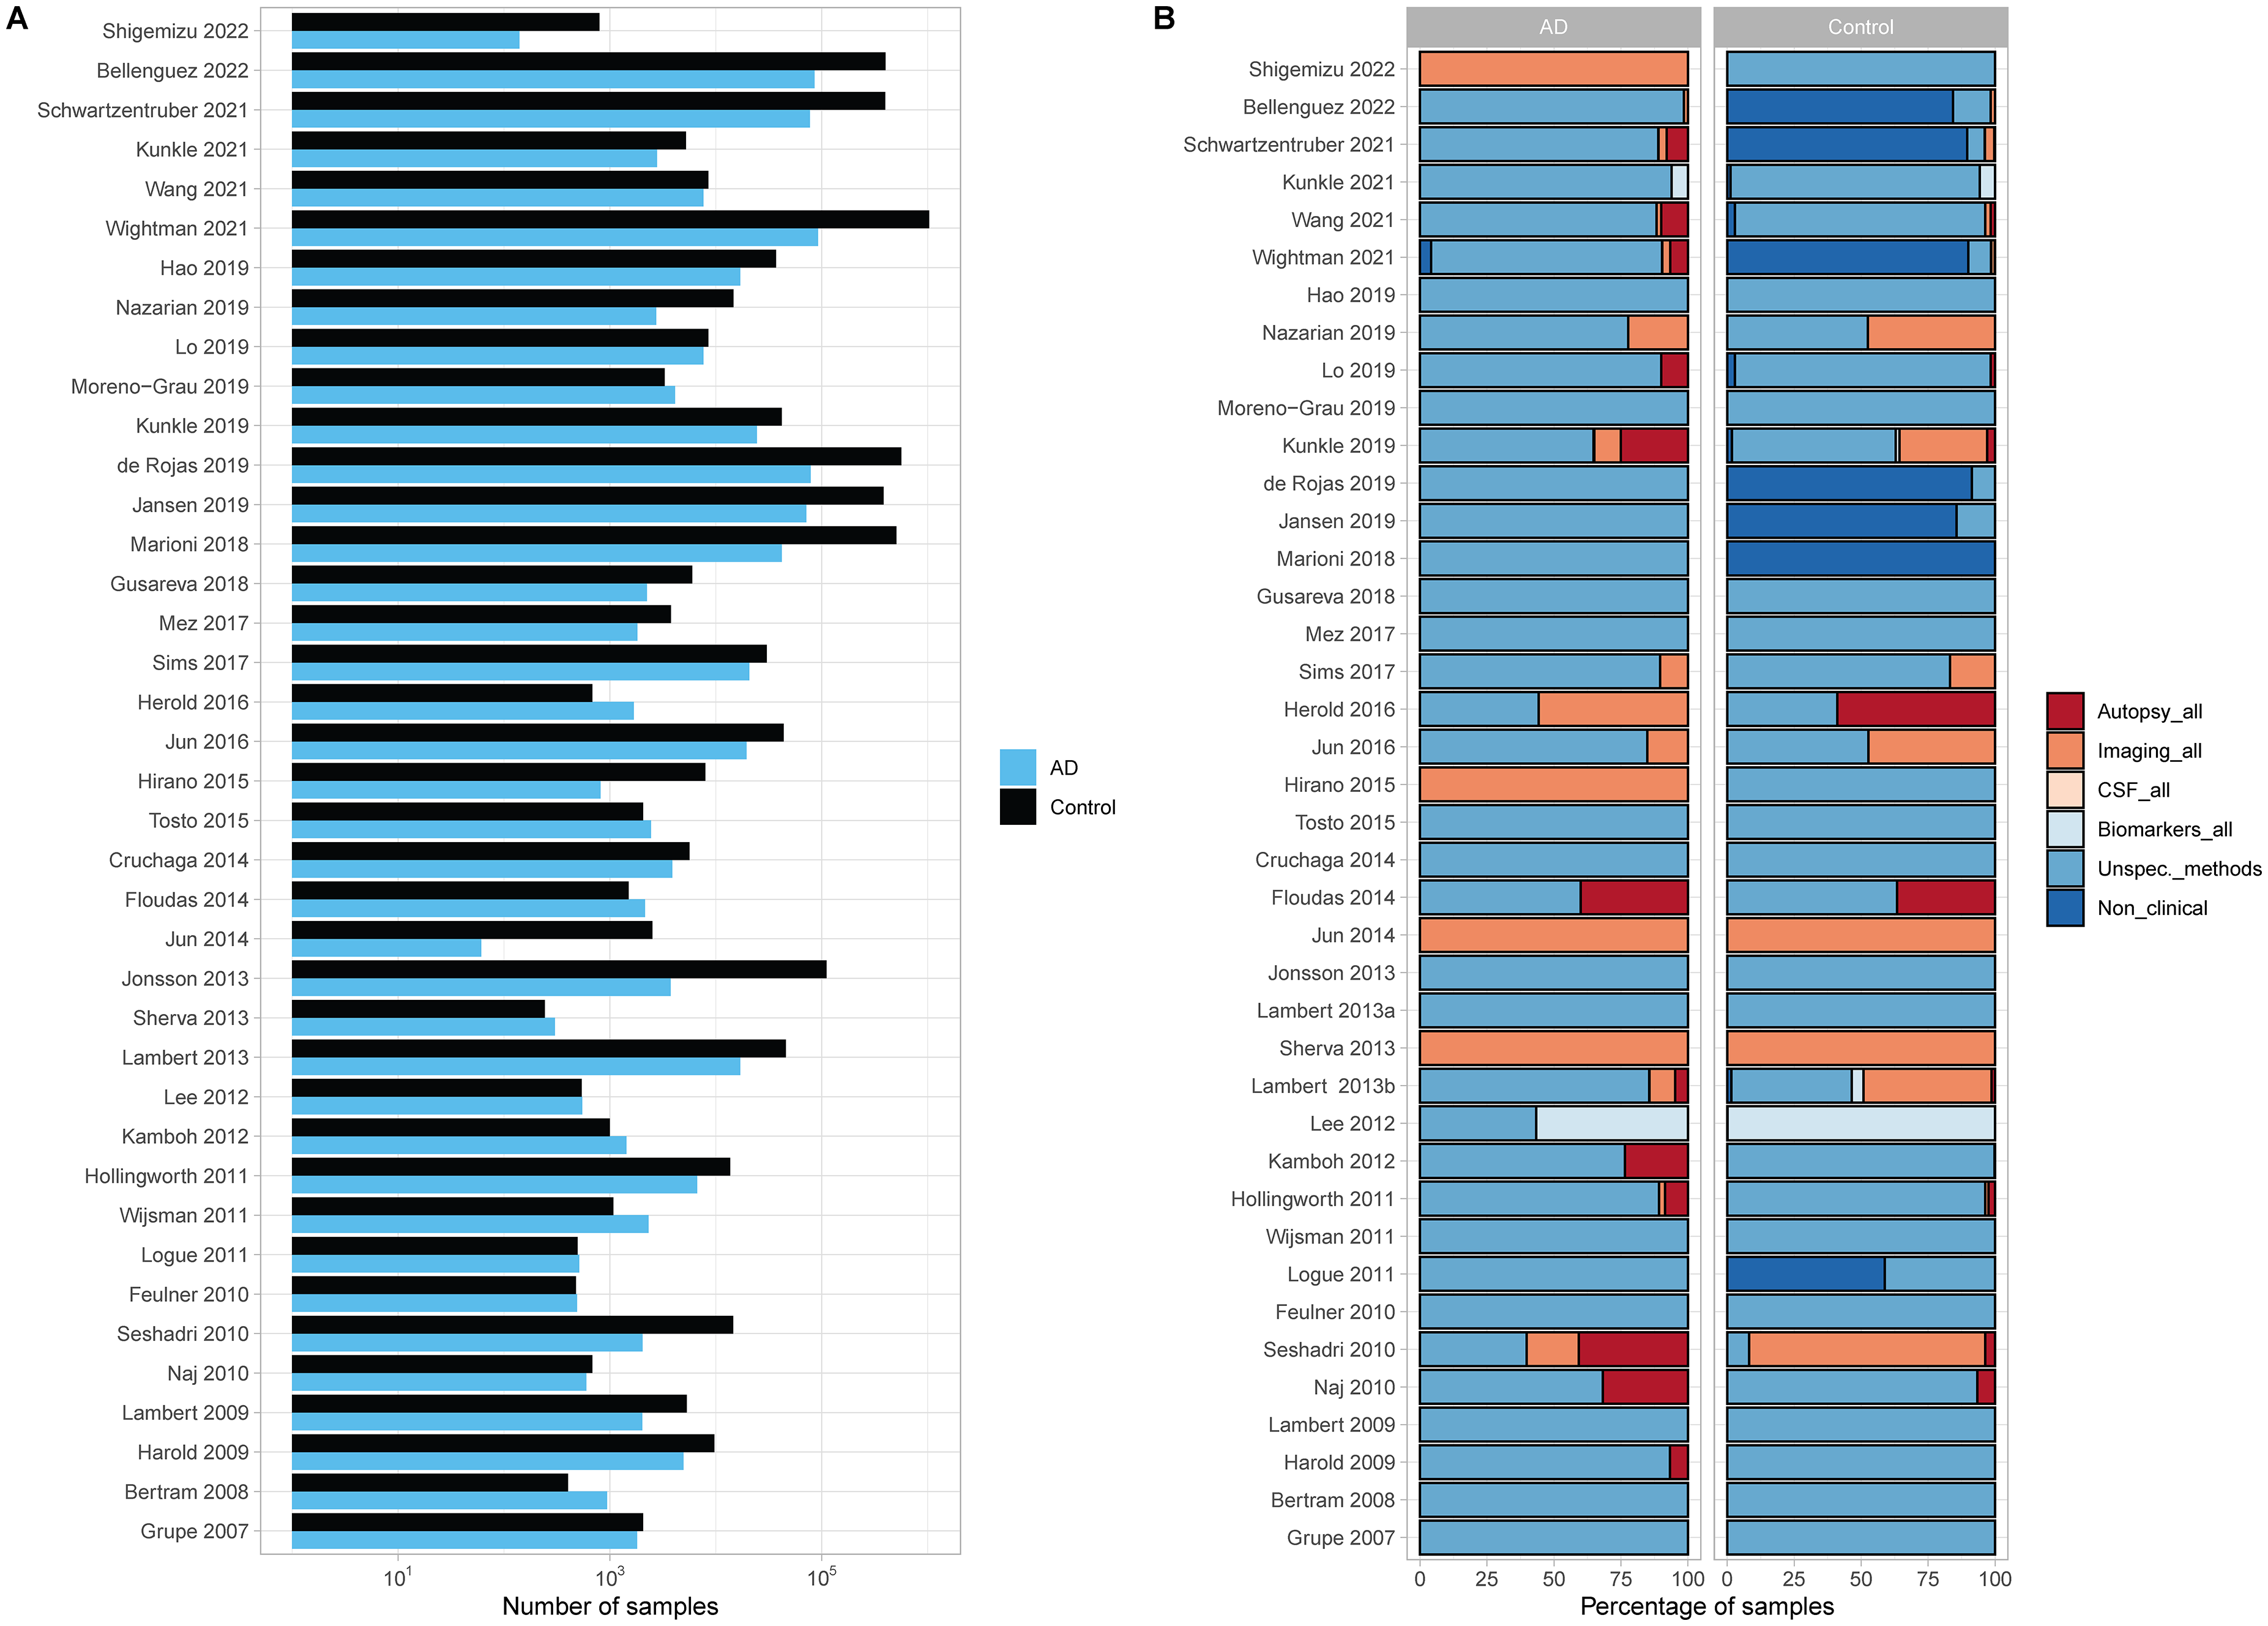
(A) TOTAL number of subjects with AD (cases) and ad-free (controls) status, for each GWAS analyzed. (B) Percentage of samples that are inserted in databases designed using either imaging, autopsy, CSF mixed biomarker analysis, unspecific or several diagnostic methods, or non-clinical and self-/third-party-assessment for AD diagnosis and control AD-free assessment, for the complete set of subjects, for each GWAS.
As previously mentioned, different target phenotypes were allowed to join in these studies (such as other dementias and mild cognitive impairment but also subjects with other diseases or conditions—see Table 1), as well as databases not designed for clinical purposes (such as the commercial DNA database 23andMe, https://www.23andme.com/) that are currently used to find controls (mainly, but also cases). Here, we analyze the composition of the cohorts of subjects considered for the mentioned GWAS, considering the methods for AD and AD-free assessment mentioned in the previous section (Figure 1B, Supplemental Tables 3 and 4).
When considering all samples used for the considered GWAS (Table 3, Figure 1B), the AD assessment method for the majority of the case-subjects analyzed fall in the broader category of unspecific/diverse methods (92.2%), with no information on the proportion of subjects in the different categories regarding the accuracy of the diagnosis. For a small proportion of subjects either autopsy (3.9%), imaging data (3.2%) or a mixed of different biomarkers’ analyses (0.1%) were analyzed for the whole AD dataset. Finally, AD subjects with non-clinical interview/self- third-party-assessment (0.6%) were also considered. Interestingly, we observe a decrease in the percentage of samples coming from databases with imaging for the whole dataset from older to more recent GWAS; however, this trend is inverted for autopsy (but less expressive). Indeed, 5 out of the 40 GWAS (12.5%) present 50% of their sample composition with imaging data, four of these GWAS are within the timespan of 2007–2018 (14.8%). Seventeen GWAS (42.5%) presented 100% of sample composition with AD assessment of unspecific/diverse methods and 33 (82.5%) presented 50%. Of these, 13 (48.1%) were older GWAS (2007–2018) and 4 (30.8%) GWAS from 2019 onwards. Figure 1B represents visually these trends, where a clear decrease in the proportion of samples with imaging for whole the dataset is visible for more recent GWAS, while the bigger proportions of this category show up in GWAS from 2013–2016.
Methods for AD-assessment of subjects of both cases and controls subsets, for the analyzed genome-wide association studies (all the GWAS, n = 40; older GWAS 2007–2018, n = 27 and recent GWAS from 2019 onwards, n = 13) and number of GWAS presenting above 50%, 0% and 100% of samples from databases with a specific AD/control assessment.
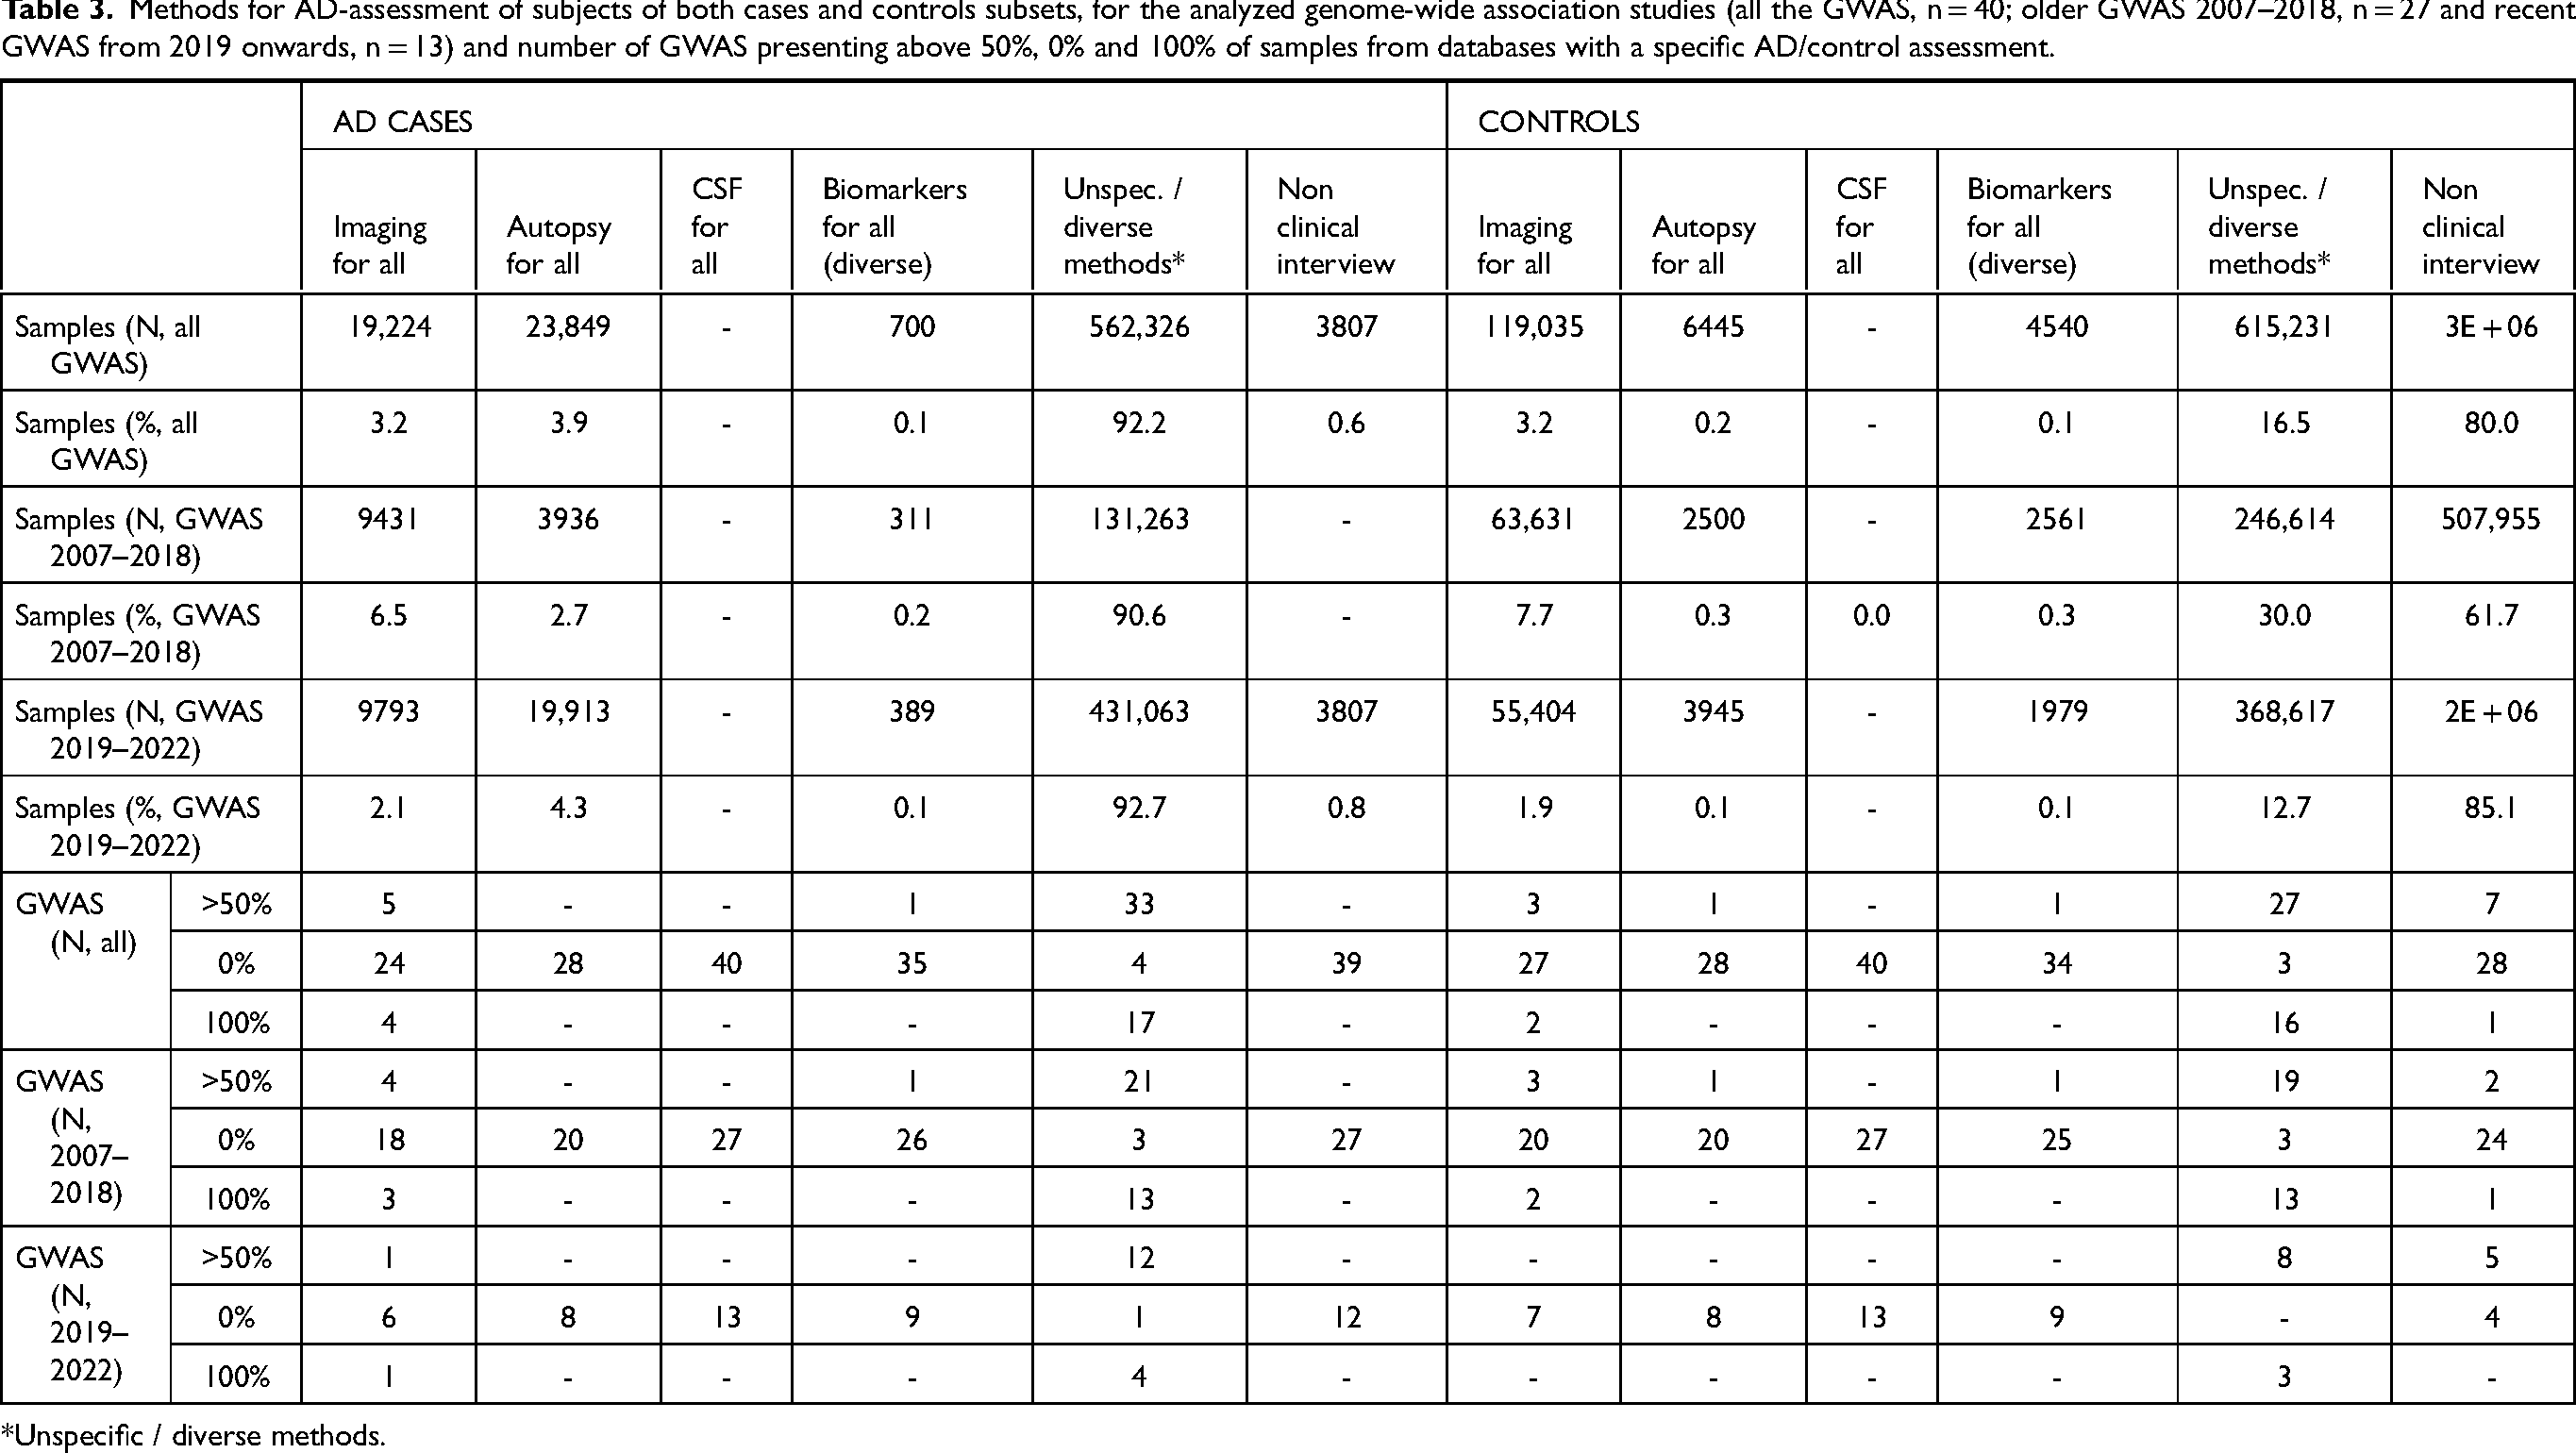
*Unspecific / diverse methods.
Control, or AD-free, assessment was also analyzed for the entire batch of 40 GWAS and was based on the same criteria and categories as mentioned earlier. Table 3 and Figure 1B showcase a descriptive summary of the overall sample composition and the sample composition per GWAS, respectively. Concerning a general picture of the controls, most samples originate from databases that base their AD-free diagnosis on a non-clinical interview /self- or third-party-assessment (80%), followed by unspecific/diverse methods (16.5%). Free AD status based on imaging data for whole dataset was only obtained for few subjects (3.2%). The remaining categories presented only residual representations. Interestingly, more control samples are coming from databases that use non-clinical or self-/third-party assessment for AD diagnosis, 7 GWAS present more than 50% of their sample composition from these databases (17.5%), 5 of these are recent GWAS (38.5%). Furthermore, we observe a decrease in the number of GWAS using either imaging or autopsy data for more than 50% of their sample composition (3 to 0 GWAS and 1 to 0 GWAS from old to recent timespan for imaging and autopsy, respectively).
Despite achieving a higher number of subjects, unfortunately the more recent GWAS are not reflecting the increase in the SNPs’ significance. On this regard, it should be mentioned that the statistical significance of the results is differently reported by the different works, which hampers the direct comparison of the obtained results in the different studies. For example, odd ratios comparing the odds of the events (phenotype of interest or its absence) on the carriers and non-carriers of the variants of interest have been the standard way to quantify and present the strength of the observations in case-control studies. Nevertheless, even this standard measure is neither presented nor information allowing its computation is provided in 9 out of the 40 analyzed papers. In Supplemental Figure 1A is showed the odds ratio (OR) interval found for the set of 31 GWAS that provided this information, ordered by the corresponding median. Noticeably, twelve GWAS presented maximum OR above 2.5, eight of them are related to APOE SNPs or SNPs in linkage disequilibrium with APOE (more details in Supplemental Tables 5 and 6), which may enclose redundancy of the results. Interestingly, for the remaining four GWAS, a relatively low number of samples was used for the discovery phase (5609–115,040). Two studies with high OR values were performed using controls with ages > 70 years old 54 and > 85 years old with intact cognition capacities. 20 These results reinforce the hypothesis that a more careful selection of AD cases (better and uniform diagnosis methods) and controls (older ages and a good assessment of AD absence) aids in the recognition of AD's genetic signals. Furthermore, the remaining two studies with the highest OR values were performed in African American populations.60,71
Supplemental Figure 1B depicts the mean and median OR values plotted against the total number of samples used for the discovery phase in the 31 analyzed GWAS that provided these statistics. Indeed, GWAS reaching close to half a million to one million samples, displayed maximum ORs of 1.06–1.31, clearly contradicting the general tendency of sampling increase to gain statistical power (Supplemental Table 5). Correlation tests were calculated between the total N and the mean and median OR, but were found statistically non-significant. At some extent this result could be explained if more variants with smaller ORs associated had been identified by studies with larger datasets. Nevertheless, for the set of 31 GWAS for which OR results were provided, only a residual positive correlation (R2 = 0.001) between the number of analyzed subjects and the number of identified associated variants was detected.
Aiming for a better understanding of the OR variation between studies, all SNPs found to be associated with the disease in their different GWAS were analyzed both individually and in a per-chromosome basis (Figures 2 and 3, Supplemental Figures 2–4, Supplemental Table 7). Overall, a set of 22 SNPs was found to overlap in at least two GWAS and corresponding ORs were explored individually (Figure 2). Additionally, as some markers were observed in close physical locations in the chromosome, linkage disequilibrium (LD) calculations were performed for all SNPs within the same chromosome using LDmatrix 73 (Supplemental Figure 4) to assess the OR variation of linked markers. A per-chromosome analysis concerning LD was carried out for all the identified variants, and a special attention was devoted to those cases where some AD associated variants were found to be in LD (Supplemental Figure 4). Chromosome 19 showed the highest number of associated SNPs and it is represented as an example in Figure 3, where an absence of correlation between OR and number of samples (N) is visible. Indeed, when investigating specific SNPs unstable patterns of OR appear, as in the two SNP examples in Figure 3 and in several examples in Figure 2. These results corroborate the previous analyses in Supplemental Figure 1 and both reinforce the possibility that increasing datasets does not reflect per se statistical gains and that more deliberation on the quality of diagnosis or AD-absence assessment must be considered. Possibly, the combination of samples with different diseases with similar phenotypes and the introduction of poorly classified controls blurred the overall genetic signal of AD, preventing the clarification of the disease's genetic architecture.
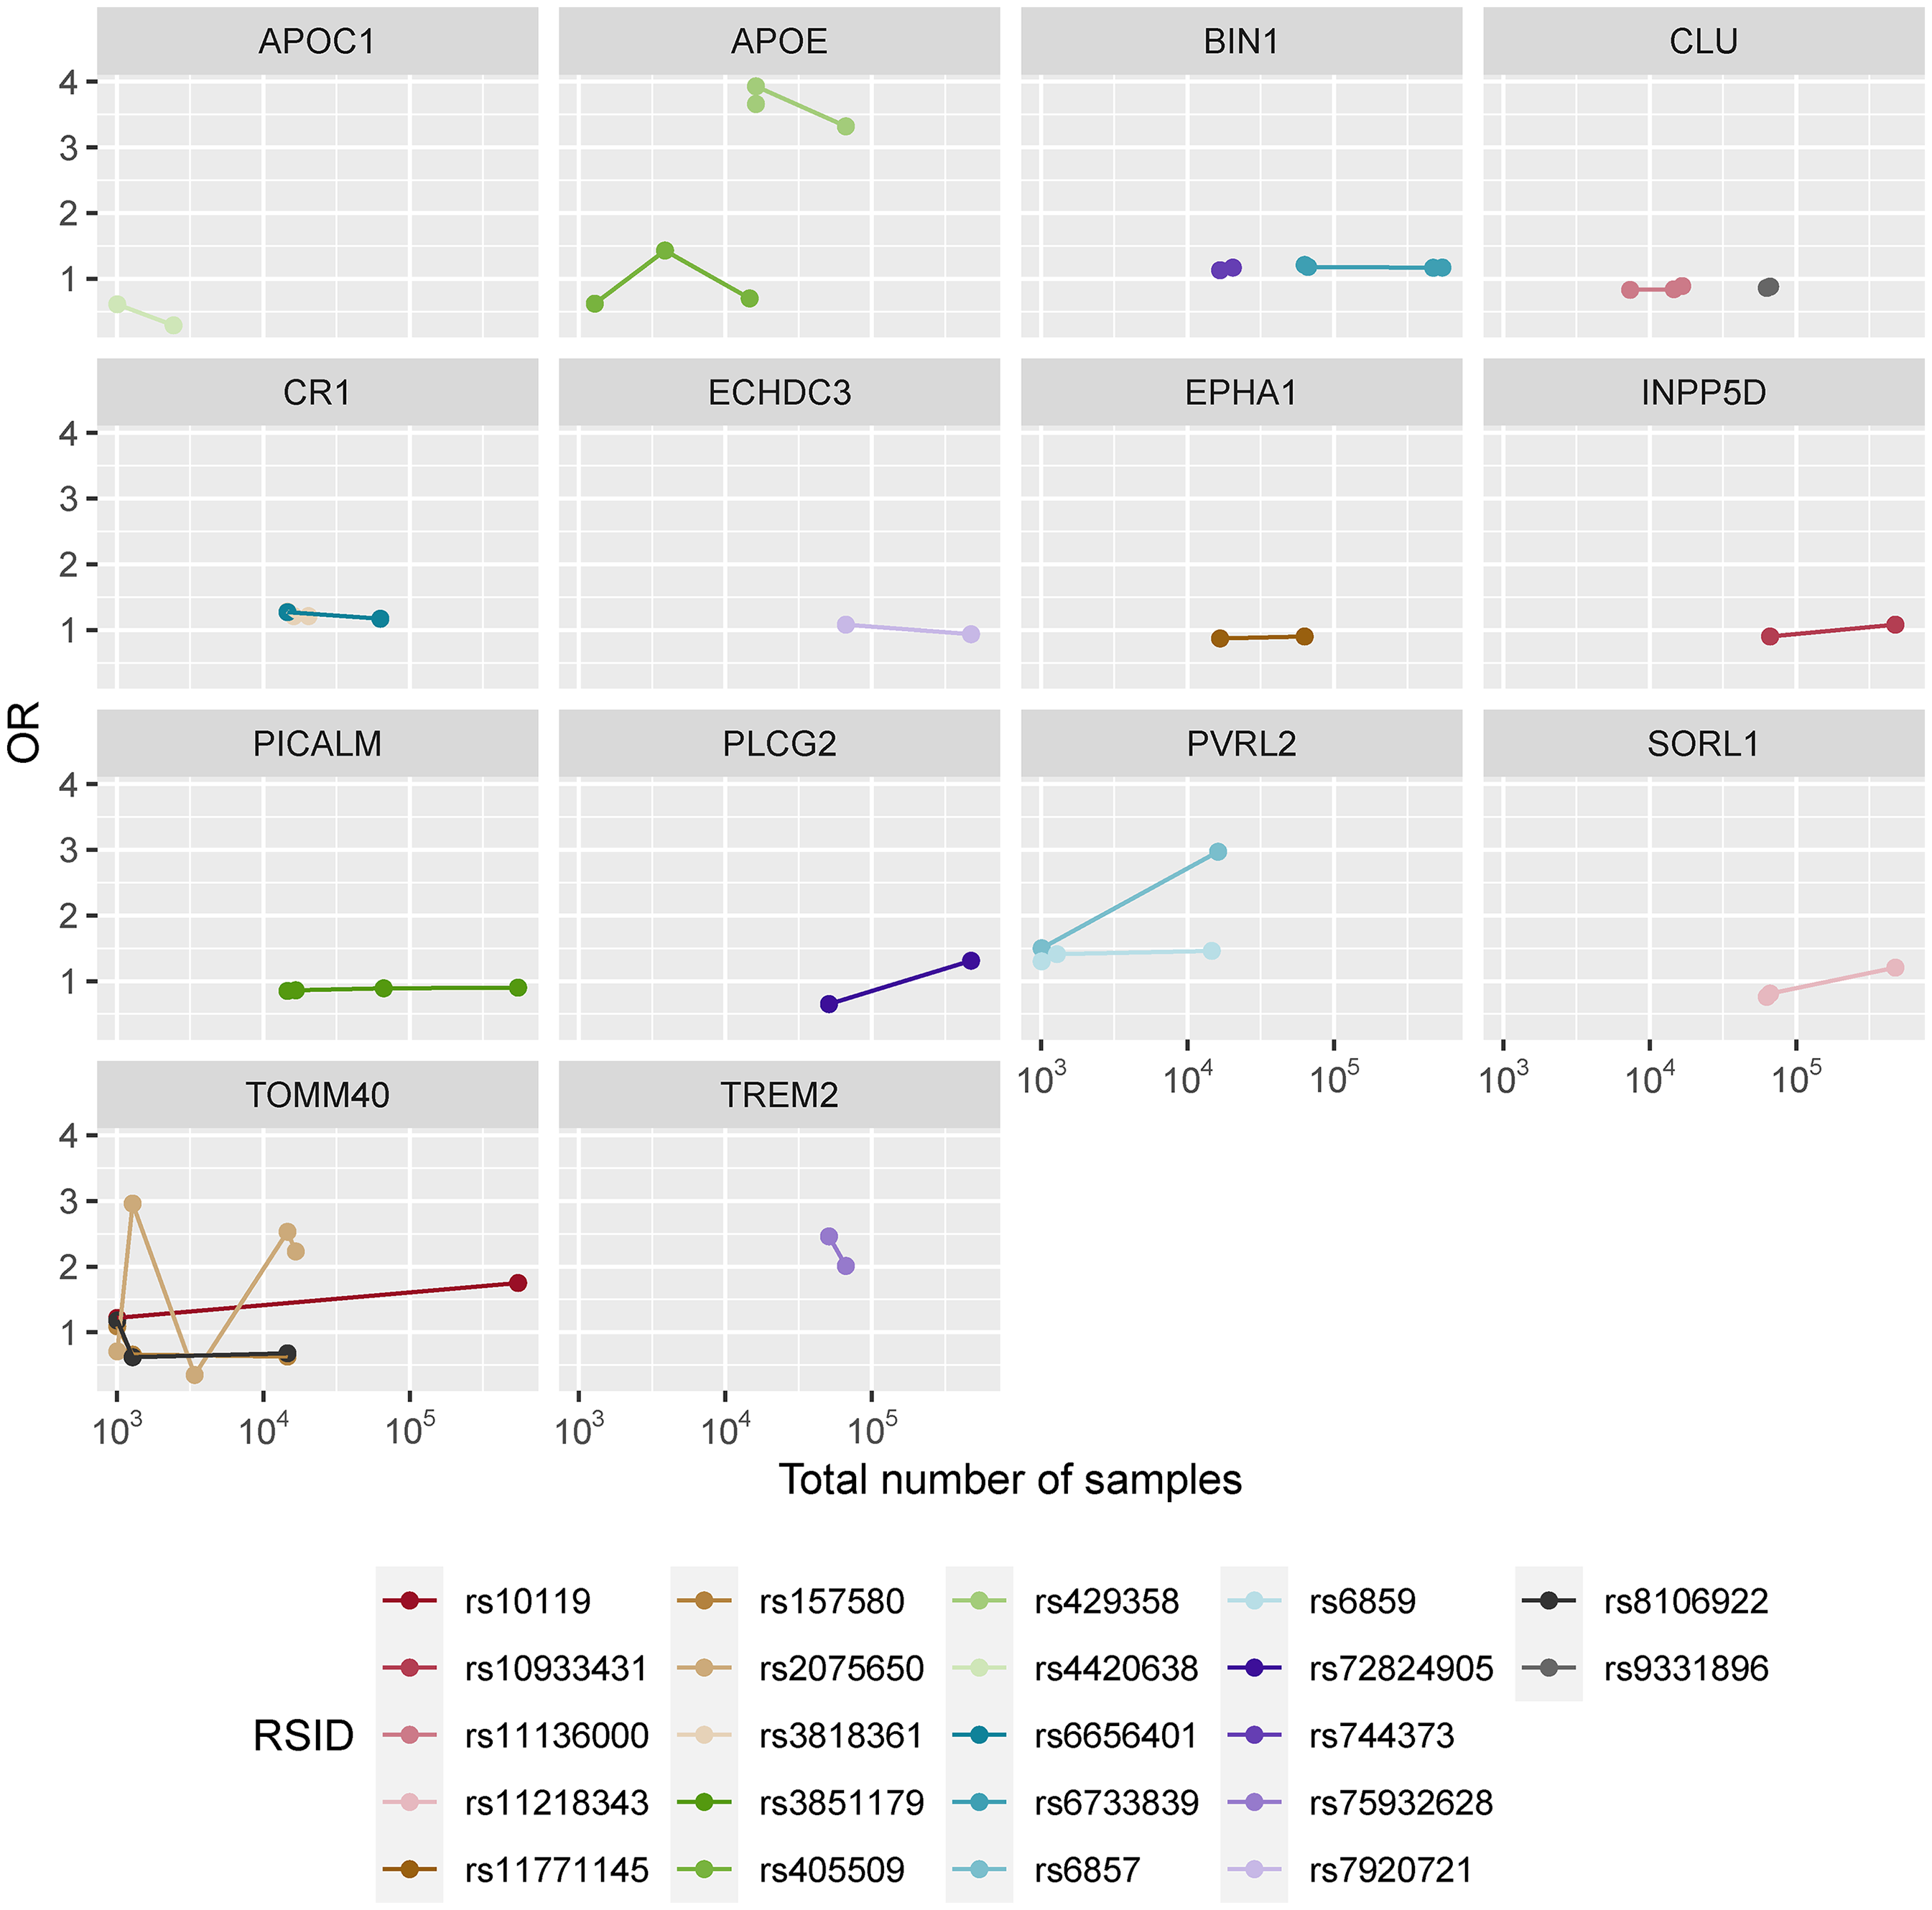
Marker specific odds ratios per the total number of samples for the set of 22 overlapping SNPs found in at least two GWAS, separated by genes. In each case the number of points represent the number of GWAS that identified the corresponding marker as AD-associated.
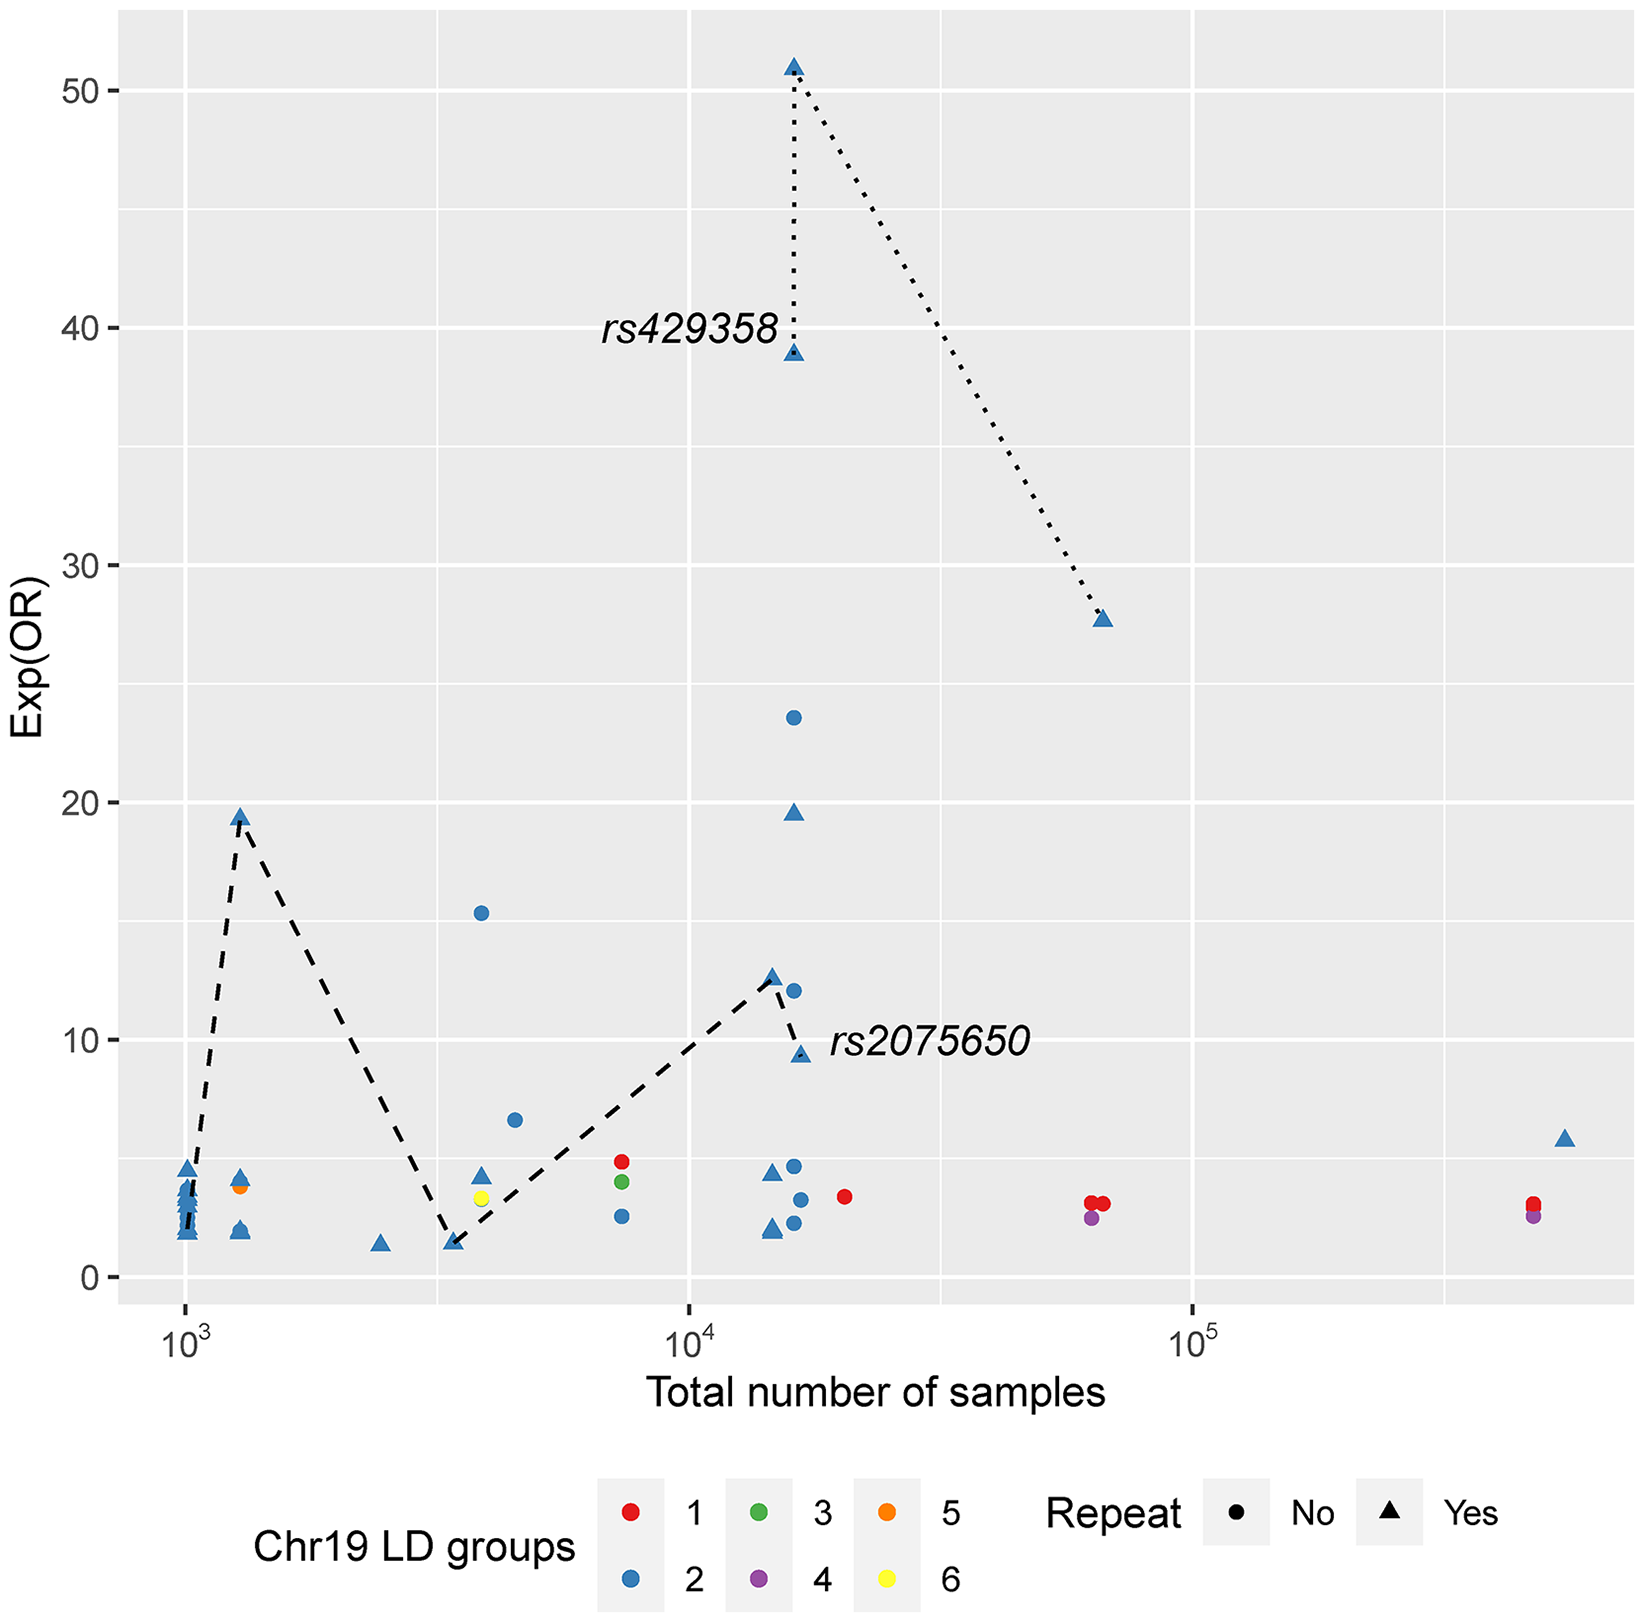
Marker specific odds ratios (exp scale) per total number of samples for all the Chromosome 19 variants found to be AD-associated in at least one of the analyzed GWAS. LD groups were established considering LDmatrix output (Supplemental Figure 2) and two variants are represented by the same color if and only if they belong to the same LD group. Point shapes consider if the SNP was found in more than one GWAS (repeat, triangle) or otherwise (circle). Two SNPs are highlighted as examples.
Discussion and concluding remarks
New sequencing methods have provided high throughput capacity for the analysis of an abundant amount of DNA markers (even full genomes) and a profuse number of samples. Undoubtedly, it has brought impressive scientific progress where big data is needed to solve scientific questions. However, the mishandling of these technologies and particularly of the data analysis that it involves is also increasing. The genetic constellation of AD has sparked the interest of several scientific groups along the years; however, the scientific gain during the last years, despite the amount of produced data, is still limited. This study provides a retrospective view of a collection of GWAS that provided new insights and clues on the genetic composition of sporadic AD. We try to make sense of the little statistical gain that accompanied the gigantic increase in sample size and interpret what caveats we can hopefully overcome. Indeed, we observed a lack of correlation between an increase in sample size and an increase in statistical significance of the described loci. We propose that the choice of collecting more data that satisfy basic requirements not considering the quality of diagnostic assessment will pool together different neurodegenerative diseases that translate in similar behavioral phenotypes, leading to a blurred picture of the genetics of a specific disease. Furthermore, introducing data from various databases that were designed differently brings a heterogeneity to the data that can add more confounding factors, limiting the accuracy of statistical outcomes. Indeed, a more careful selection of these databases should be taken into consideration when defining solid groups of case-control samples for research purposes. With this purpose, scientists should weigh in a uniform diagnosis of the disease and disease-free for all samples. It is, however, bizarre that we are discussing an issue that was clearly addressed 13 years ago in NINCDS-ADRDA guidelines,5,74 where was established the need for biomarkers’ pathological confirmation for subjects of scientific research investigations. These minimum requirements have not been transversally applied neither for the subset of cases nor for the one of controls, and it is noteworthy the apparent lack of information in some databases that prevent a knowledgeable choice of data taking into account solid diagnosis methods and AD-free assessments.
Additionally, when selecting controls, age should be taken into the equation, since AD is strongly age-correlated. Typically, subsets of cases and controls are built matching as much as possible the sex and age of the subjects, the latter lacking rational in the case of AD, at least under the framework of a standard case-control association study. Indeed, a 70 years-old subject, without any AD symptom included in the subset of controls, may be a case if he/she would be re-analyzed one year later, which of course beclouds the statistical analyses since in a first instance his/her (risk) genomic profile would be classified as AD protected. Indeed, the genomic information is (majority) the same during the lifespan of the individual, which implies that under a typical case-control study the same genomic profile may cross from the control subset (considered by the statistical model as AD protected), to the case subset (AD risk) at any point of the life of the individual. This risk is particularly high in a disease as AD that is common in the population, has a complex diagnosis and a long preclinical phase, the first symptoms appearing in old or very old individuals. It may be hypothesized that AD is inevitable as long as the individual live long enough, 75 but if that is the premise the age of the individuals has to be considered as covariate associating the genetic variants with the age of appearing the first symptoms. This approach is not the one that has been carried out, under which protected (controls) and affected (cases) genomic profiles have been compared.
Another factor that can introduce variability and bias the results is the choice of populations from where the data is being gathered from, as AD genetics might manifest differently among populations as previously observed for the APOE ɛ4 allele.29–31 It is well known that APOE genotype affect the risk factor for developing the disease and therefore, should be taken into equation when recalculating risk factors of the remaining markers. Ideally, parallel research in different biogeographic populations should take place to minimize the possibility of risk allele dilution, whilst still capturing worldwide diversity.
Furthermore, the more recent GWAS utilize data that originate from the same databases and thus, one might question the independency of their results (e.g.,36,65,67,70). Also noteworthy is that statistical analyses are not standardized, and provided data frequently not allow the computation of alternative statistics. This makes the comparison between papers difficult and blocks testing the assay for reproducibility.
AD genetics is a very complex issue that will continue to awe researchers worldwide as we carry on with this challenge that might have multiple answers. Instead of bulging sample numbers irrespectively of data quality, we hypothesize that lower sample sizes but with highly curated data would provide more fruitful insights regarding the true genetic portrait of the disease. With highly curated data we mean both AD and control subjects with neuropathological verification from worldwide populations. Indeed, the boundary between neuropathologic changes and clinical symptoms in AD has become increasingly unclear, as its terminology may be applied to typical clinical syndromes even without neuropathologic confirmation. These concepts may partially overlap but should not be conflated; however, a syndrome is a clinical outcome resulting from one or more diseases, not the cause itself. The ongoing challenge of differentiating these two aspects may not be of an extreme importance in the clinical setting, but can tremendously impact AD-related scientific research, specifically in the search of associated genetic variants.
Supplemental Material
sj-docx-2-alz-10.1177_13872877251317543 - Supplemental material for Navigating the blurred boundary: Neuropathologic changes versus clinical symptoms in Alzheimer’s disease, and its consequences for research in genetics
Supplemental material, sj-docx-2-alz-10.1177_13872877251317543 for Navigating the blurred boundary: Neuropathologic changes versus clinical symptoms in Alzheimer’s disease, and its consequences for research in genetics by Catarina Xavier and Nádia Pinto in Journal of Alzheimer's Disease
Supplemental Material
sj-xlsx-3-alz-10.1177_13872877251317543 - Supplemental material for Navigating the blurred boundary: Neuropathologic changes versus clinical symptoms in Alzheimer’s disease, and its consequences for research in genetics
Supplemental material, sj-xlsx-3-alz-10.1177_13872877251317543 for Navigating the blurred boundary: Neuropathologic changes versus clinical symptoms in Alzheimer’s disease, and its consequences for research in genetics by Catarina Xavier and Nádia Pinto in Journal of Alzheimer's Disease
Footnotes
Acknowledgments
The authors acknowledge the comments of two anonymous reviewers that greatly contributed to the improvement of the work.
Author contributions
Catarina Xavier (Data curation; Formal analysis; Investigation; Methodology; Visualization; Writing – original draft); Nádia Pinto (Conceptualization; Data curation; Formal analysis; Resources; Supervision; Validation; Writing – review & editing).
Funding
The authors disclosed receipt of the following financial support for the research, authorship, and/or publication of this article: This work and CX are funded by FCT – Fundação para a Ciência e a Tecnologia, I.P. by the project FCT- 2022.04734.PTDC. NP is funded by FCT: 2022.04997.CEECIND.
Declaration of conflicting interests
The author(s) declared no potential conflicts of interest with respect to the research, authorship, and/or publication of this article.
Data availability
The data that supports the findings of this study are available in the supplemental material of this article.
Supplemental material
Supplemental material for this article is available online.
References
Supplementary Material
Please find the following supplemental material available below.
For Open Access articles published under a Creative Commons License, all supplemental material carries the same license as the article it is associated with.
For non-Open Access articles published, all supplemental material carries a non-exclusive license, and permission requests for re-use of supplemental material or any part of supplemental material shall be sent directly to the copyright owner as specified in the copyright notice associated with the article.