
Abstract
Background
Cognivue Clarity® is an FDA-cleared computerized cognitive test to screen for cognitive impairment included in the Bio-Hermes Study to test blood-based and digital biomarkers’ ability to screen for mild cognitive impairment (MCI) and Alzheimer's disease (AD). A subset of cognitively normal individuals have amyloid deposition (Preclinical AD) but no current assessment can identify these individuals in the absence of expensive biomarkers.
Objective
We examined differences in Cognivue Clarity performance between amyloid positive and amyloid negative individuals and whether Cognivue Clarity could differentiate True Controls (cognitively normal/amyloid negative), Preclinical AD (cognitively normal/amyloid positive), and MCI due to AD (MCI-AD, cognitively impaired/amyloid positive).
Methods
Cognivue Clarity was administered to all participants in the Bio-Hermes Study who also had amyloid PET and blood-based biomarkers. Performance was compared between biomarker-defined groups: True Controls (n = 297), Preclinical AD (n = 95), and MCI-AD (n = 113).
Results
Cognivue Clarity global scores distinguished amyloid positive individuals from amyloid negative individuals (p < 0.001) and differentiated True Controls versus Preclinical AD (p = 0.014) and Preclinical AD versus MCI-AD (p < 0.001). Three subtests [Shape Discrimination (p = 0.004), Visual Salience (p = 0.008), Adaptive Motor Control (p = 0.004)] and the 3-test mean (p < 0.001) differentiated True Controls from Preclinical AD. The 3-test composite correlated with Amyloid PET (r = −0.433) and pTau217 (r = −0.400). The 3-test mean identified Preclinical AD in both White and Black participants.
Conclusions
Cognivue Clarity, a 10-min computerized battery, screens for individuals with cognitive impairment, characterizes amyloid positive individuals, and identifies Preclinical AD. This has great potential as a cost- and time-effective strategy to screen and enroll in AD prevention trials.
Keywords
Introduction
Alzheimer's disease (AD) and related dementias affect nearly 7 million people in the US and more than 55 million people worldwide.1,2 Detection of the early stages of AD and mild cognitive impairment (MCI) in the community is challenging, with many patients first coming to medical attention at the moderate stage. 1 Recent reports suggest that nearly 80% of people living with MCI are not diagnosed until progression to dementia.3,4 This is often too late for entrance into treatment protocols or enrolling in a clinical trial. In the era of amyloid-lowering therapies, there is a need to identify individuals likely to have amyloid to enrich recruitment into trials, lower costs related to amyloid positron emission tomography (PET) and identify patients for earlier interventions. Further, the extant literature suggests that while prevalence of AD may be higher in Blacks and Hispanics compared with non-Hispanic Whites, 1 amyloid positivity on PET scans, cerebrospinal fluid and plasma may be lower,5–7 further complicating identification of patients for treatment or enrollees for clinical trials.
As its primary objective, the Bio-Hermes Study 8 tested the relationship between emerging blood-based and digital (including computerized tests) biomarkers and the presence of amyloid measured by PET scan. Participants were recruited from sites experienced in AD clinical trials using recruitment procedures common to those used in standard AD clinical trials. The participants enrolled in Bio-Hermes were similar in most clinical characteristics to patients who had been enrolled in disease-modifying therapeutic AD trials. One digital biomarker included in Bio-Hermes was Cognivue Clarity®, 9 the first FDA-cleared computerized cognitive test to screen for the risk of cognitive impairment. In the Bio-Hermes study, Cognivue Clarity differentiated between 1) clinically diagnosed cognitively normal individuals from those with MCI and AD, 2) individuals with and without amyloid as measured by PET scans regardless of cognitive status, and 3) biomarker-confirmed true controls (cognitive normal/amyloid negative) and MCI due to AD and mild AD (cognitively impaired/amyloid positive). 10
Just as disease-modifying therapy trials are recruiting individuals with MCI and early AD, there are on-going prevention trials targeting individuals with Preclinical AD.11,12 Individuals with Preclinical AD are cognitively normal individuals who demonstrate evidence AD pathology, typically by PET scan or spinal fluid measurement. 13 While plasma biomarkers are available and frequently used in research, due to lack of FDA clearance and inconsistent coverage by medical insurance, they are less frequently used in clinical practice due to out-of-pocket costs to the patient. Plasma biomarkers are marketed by different companies and not all have equal sensitivity and specificity leading to false positives and false negatives and often require further confirmation. Further, no biomarker can determine the presence of cognitive impairment or stage its severity. To date, there is no brief cognitive assessment that can prospectively identify individuals that may have Preclinical AD. Instead, these individuals can only be identified retrospectively in research projects following expensive biomarker evaluations and completing an extensive clinical-cognitive evaluation, which includes the development of cognitive composite scores and utilization of amyloid PET or cerebrospinal fluid (CSF) studies to rule patients in or out.14,15 Individuals with preclinical AD are not typically recognized in clinical practice as they are cognitively normal and would therefore not undergo biomarker testing. If there was a method to reliably screen individuals for cognitive impairment that might also suggest the presence of Preclinical AD prior to these expensive and extensive procedures, this would greatly facilitate enrollment into prevention trials by building a ‘trial-ready cohort” and offer a future pathway for identifying individuals for treatment of AD at the preclinical stage. We examined the ability of a digital biomarker, Cognivue Clarity,9,10 to discriminate True Controls (cognitively normal/amyloid negative), Preclinical AD (cognitively normal/amyloid positive), and MCI due to AD 16 (MCI-AD, cognitively impaired/amyloid positive) from each other. We examined whether there were ethnoracial differences in the ability of Cognivue Clarity to detect Preclinical AD. Last, we explored whether the different plasma biomarkers collected in Bio-Hermes performed similarly in characterizing Preclinical AD.
Methods
Study design and participants
The Bio-Hermes Study was sponsored by the Global Alzheimer's Platform Foundation and has been described elsewhere. 8 Briefly, from April 2021 through November 2022, a total of 1296 individuals were recruited from 17 US research sites with expertise in AD clinical trials. After completing screening procedures, 1001 participants were enrolled of which 964 had valid and complete Cognivue Clarity scores, 920 completed amyloid PET scans, and 887 completed both Cognivue Clarity and amyloid PET scans. Eligibility criteria for Bio-Hermes included being age 60–85 and being fluent in either English or Spanish, with a Mini-Mental State Examination (MMSE) 17 score between 20–30 inclusive. Exclusion criteria included history of depression, a negative amyloid PET scan in the past year, a history of strokes or seizures in the past year, and cancer within the past 5 years. Prior to any study procedures, an informed consent was obtained from all study participants. The protocol was reviewed and approved by Advarra, a central institutional review board (Reference Number Pro00046018). The study is registered on ClinicalTrials.gov (NCT04733989).
Clinical diagnoses
Bio-Hermes stratified individuals into three clinical cohorts (Cognitively Normal, MCI, probable AD) using consensus clinical criteria for MCI 16 and AD. 18 Performance on the MMSE, delayed recall portion of the Rey Auditory Verbal Learning Test (RAVLT) 19 and Functional Activities Questionnaire (FAQ) 20 resulted in enrollment of 417 Cognitively Normal, 311 MCI, and 273 probable AD individuals.
AD biomarkers
Plasma biomarkers were collected and analyzed by C2N Diagnostics laboratories (PrecivityAD) 21 for Aβ40, Aβ42, Aβ42/Aβ40, APOE ε4 and the Amyloid Prediction Score (APS), Quanterix laboratories for pTau181, 22 and Eli Lilly and Company for pTau217. 23 In addition, two amyloid/tau ratios were created comparing Aβ42 levels to pTau217 or pTau181 that may more closely align with amyloid PET than plasma Aβ or pTau measurements alone. 24 Participants also had amyloid PET using 18F-Florbetapir and the standardized uptake value ratio (SUVR) was calculated.25,26 Amyloid status (elevated versus not elevated) was established using a SUVR of 1.1 which is equivalent to a Centiloid Level of 24.1 consistent with thresholds used in recent AD clinical trials.27,28 The amyloid status for the Bio-Hermes cohort included 567 amyloid negative and 353 amyloid positive individuals, with 21% of Cognitively Normal individuals having a positive amyloid scan supporting Preclinical AD. 8
Clinical-pathologic diagnosis
The clinical diagnosis was combined with amyloid status to develop clinicopathologic groups with Cognitively Normal individuals divided into two groups: True Controls (cognitively normal + the absence of amyloid) and Preclinical AD (cognitively normal + the presence of amyloid). The MCI group was divided into MCI-AD (cognitive impairment + the presence of amyloid) and MCI due to a process other than AD (cognitive impairment + the absence of amyloid). The full cohort was described elsewhere,8,10 but as the focus of this report is the detection of Preclinical AD, only True Controls (n = 297), Preclinical AD (n = 95), and MCI-AD (n = 113) are considered further.
Cognivue Clarity®
Cognivue Clarity is an FDA-cleared, self-administered, computerized cognitive battery that takes 10 min to complete. Cognivue Clarity was placed in an exam room at each of the clinical sites. Other than staff entering demographic information, the Cognivue Clarity is entirely completed by the participant without supervision or staff help following directions provided by the device. Automated Cognivue technology utilizes adaptive psychophysics to assess baseline motor skills and visual acuity and uses the stimuli and the responses to the stimuli from previous trials within the same testing session to determine the level of difficulty in subsequent trials. 29 Cognivue Clarity is a modified laptop computer with only a screen and the CogniWheel,® an easy-to-maneuver wheel that provides a single point of patient interaction to select the answer. Cognivue Clarity collects 130,000 data points per administration, and provides a customized assessment calibrated to each individual's visual and motor skills. 9 A video demonstrating the Cognivue Clarity and the tests can be found at https://cognivue.com/videos/.
Cognivue Clarity is comprised of 10 subtests 9 consisting of two validity performance measures (Adaptive Motor Control, Visual Salience) that are used to set the adaptive psychophysics profile. There are four discrimination tests (Letter, Word, Shape, Motion), and four memory tests (Letter, Word, Shape, Motion) administered in order. The Adaptive Motor Control subtest measures the speed at which the participant is able to manipulate the flywheel on the device. The Visual Salience subtest measures the threshold of the participant to determine visual contrast of the target stimuli presented. The Discrimination tests present a Letter, Word, Shape or Motion stimuli that the participant must match compared with non-target stimuli manipulating a flywheel. The Memory tests present a Letter, Word, Shape, or Motion stimuli for tests of immediate and delayed recall followed by a series of n-back paradigms.
After completion, the Cognivue Clarity device provides immediate results as a report and/or in a comma-separated values file. Results include an overall average score, four domain specific scores (Memory, Executive Function-Attention, Perceptual, Visuomotor), 10 subtest scores, motor reaction time and processing speed. 9 Response tracings for each of the subtests to assess performance validity plotted as time (seconds) × test difficulty (percent of maximum score). Delayed or irregular response tracings reflect lapses in performance, fluctuating attention, or difficulty in comprehension. Global, domain and subtest scores are scaled 0–100 with higher scores reflecting better performance. Score interpretations are provided as normal, borderline, or impaired performance based on prior testing consistent with the FDA-filing30,31 and a recent report with age-normed ranges of performance. 9 Individuals aged 60 + perform similarly with a cut-off score of 69 for normal performance and this cut-off was used in analyses from the Bio-Hermes study. 10
Statistical analyses
Statistical analyses were conducted using IBM SPSS v29 (Armonk, NY). Descriptive statistics were used to summarize overall sample characteristics. Hypothesis testing was conducted to assess the ability of Cognivue Clarity to differentiate between True Controls, Preclinical AD, and MCI-AD. Two-way independent sample t-tests were used for two-group comparisons. One-way analysis of variance (ANOVA) with Tukey-Kramer post-hoc tests were used for 3 group comparisons of continuous data. ANOVA p-values are presented in the tables with significant post-hoc comparisons (p < 0.05) provided in the notes section of each table. Chi-square analyses were used for categorical data. In addition to statistical significance, effect size was calculated for ability to differentiate between True Controls, Preclinical AD, and MCI-AD, between True Controls and Preclinical AD, and between Preclinical AD and MCI-AD. Effect size is the magnitude of difference between groups and is less dependent on sample size. 32 Effect size for ANOVA is reported as Eta squared with values between 0.01–0.06 representing a small effect, values between 0.06–0.14 representing a medium effect and values ≥0.14 representing a large effect. Effect size for t-tests are reported as Cohen's d with values of 0.2 representing a small effect, values of 0.5 representing a medium effect, and values of 0.8 representing a large effect. Pearson correlation coefficients were used to assess the strength of association between Cognivue average scores and subtests and AD biomarkers. Finally, we explored differences between True Controls and Preclinical AD cases stratifying by race (White versus Black) reporting p-value and effect size. There were not sufficient numbers of individuals identifying as other races or ethnicities to conduct analyses. Multiple comparisons were addressed using the Bonferroni correction method.
Results
Bio-Hermes sample characteristics
From April 2021 through November 2022, the Bio-Hermes study enrolled 1001 individuals of which 964 had complete and valid Cognivue Clarity testing. 8 The Bio-Hermes clinically defined sample included 417 Cognitively Normal, 311 MCI, and 273 Probable AD cases and had a mean age of 72.0 ± 6.7 years (range 59–85), 15.4 ± 2.8 years of education (range 2–24), 56.2% were female, and the ethnoracial self-identification included 75.6% non-Hispanic White, 11.3% Black, 11.4% Hispanic, 1.8% Asian, and 1.1% other. Following amyloid PET scans, 21% of Cognitively Normal individuals were amyloid positive and 34% of the MCI group were amyloid positive. 8 This gave a final sample size of 505 individuals for analyses: 297 True Controls (cognitively normal/amyloid negative), 95 Preclinical AD (cognitively normal/amyloid positive) and 113 MCI-AD (cognitively impaired/amyloid positive).
Sample characteristics for this biomarker-defined group are shown in Table 1. Cognivue Clarity global scores differentiated True controls from Preclinical AD and MCI-AD and differentiated Preclinical AD from MCI-AD (p < 0.001). Other tests included in Bio-Hermes (MMSE, RAVLT, and FAQ) were used for eligibility to define MCI and probable AD groups. These tests differentiated MCI-AD from cognitively normal individuals, but scores were not different between True Controls and Preclinical AD. Since the MMSE, RAVLT, and FAQ were used for inclusion and classification, they were not subject to further analyses due to criterion contamination.
Sample characteristics and biomarker profiles by diagnostic group.
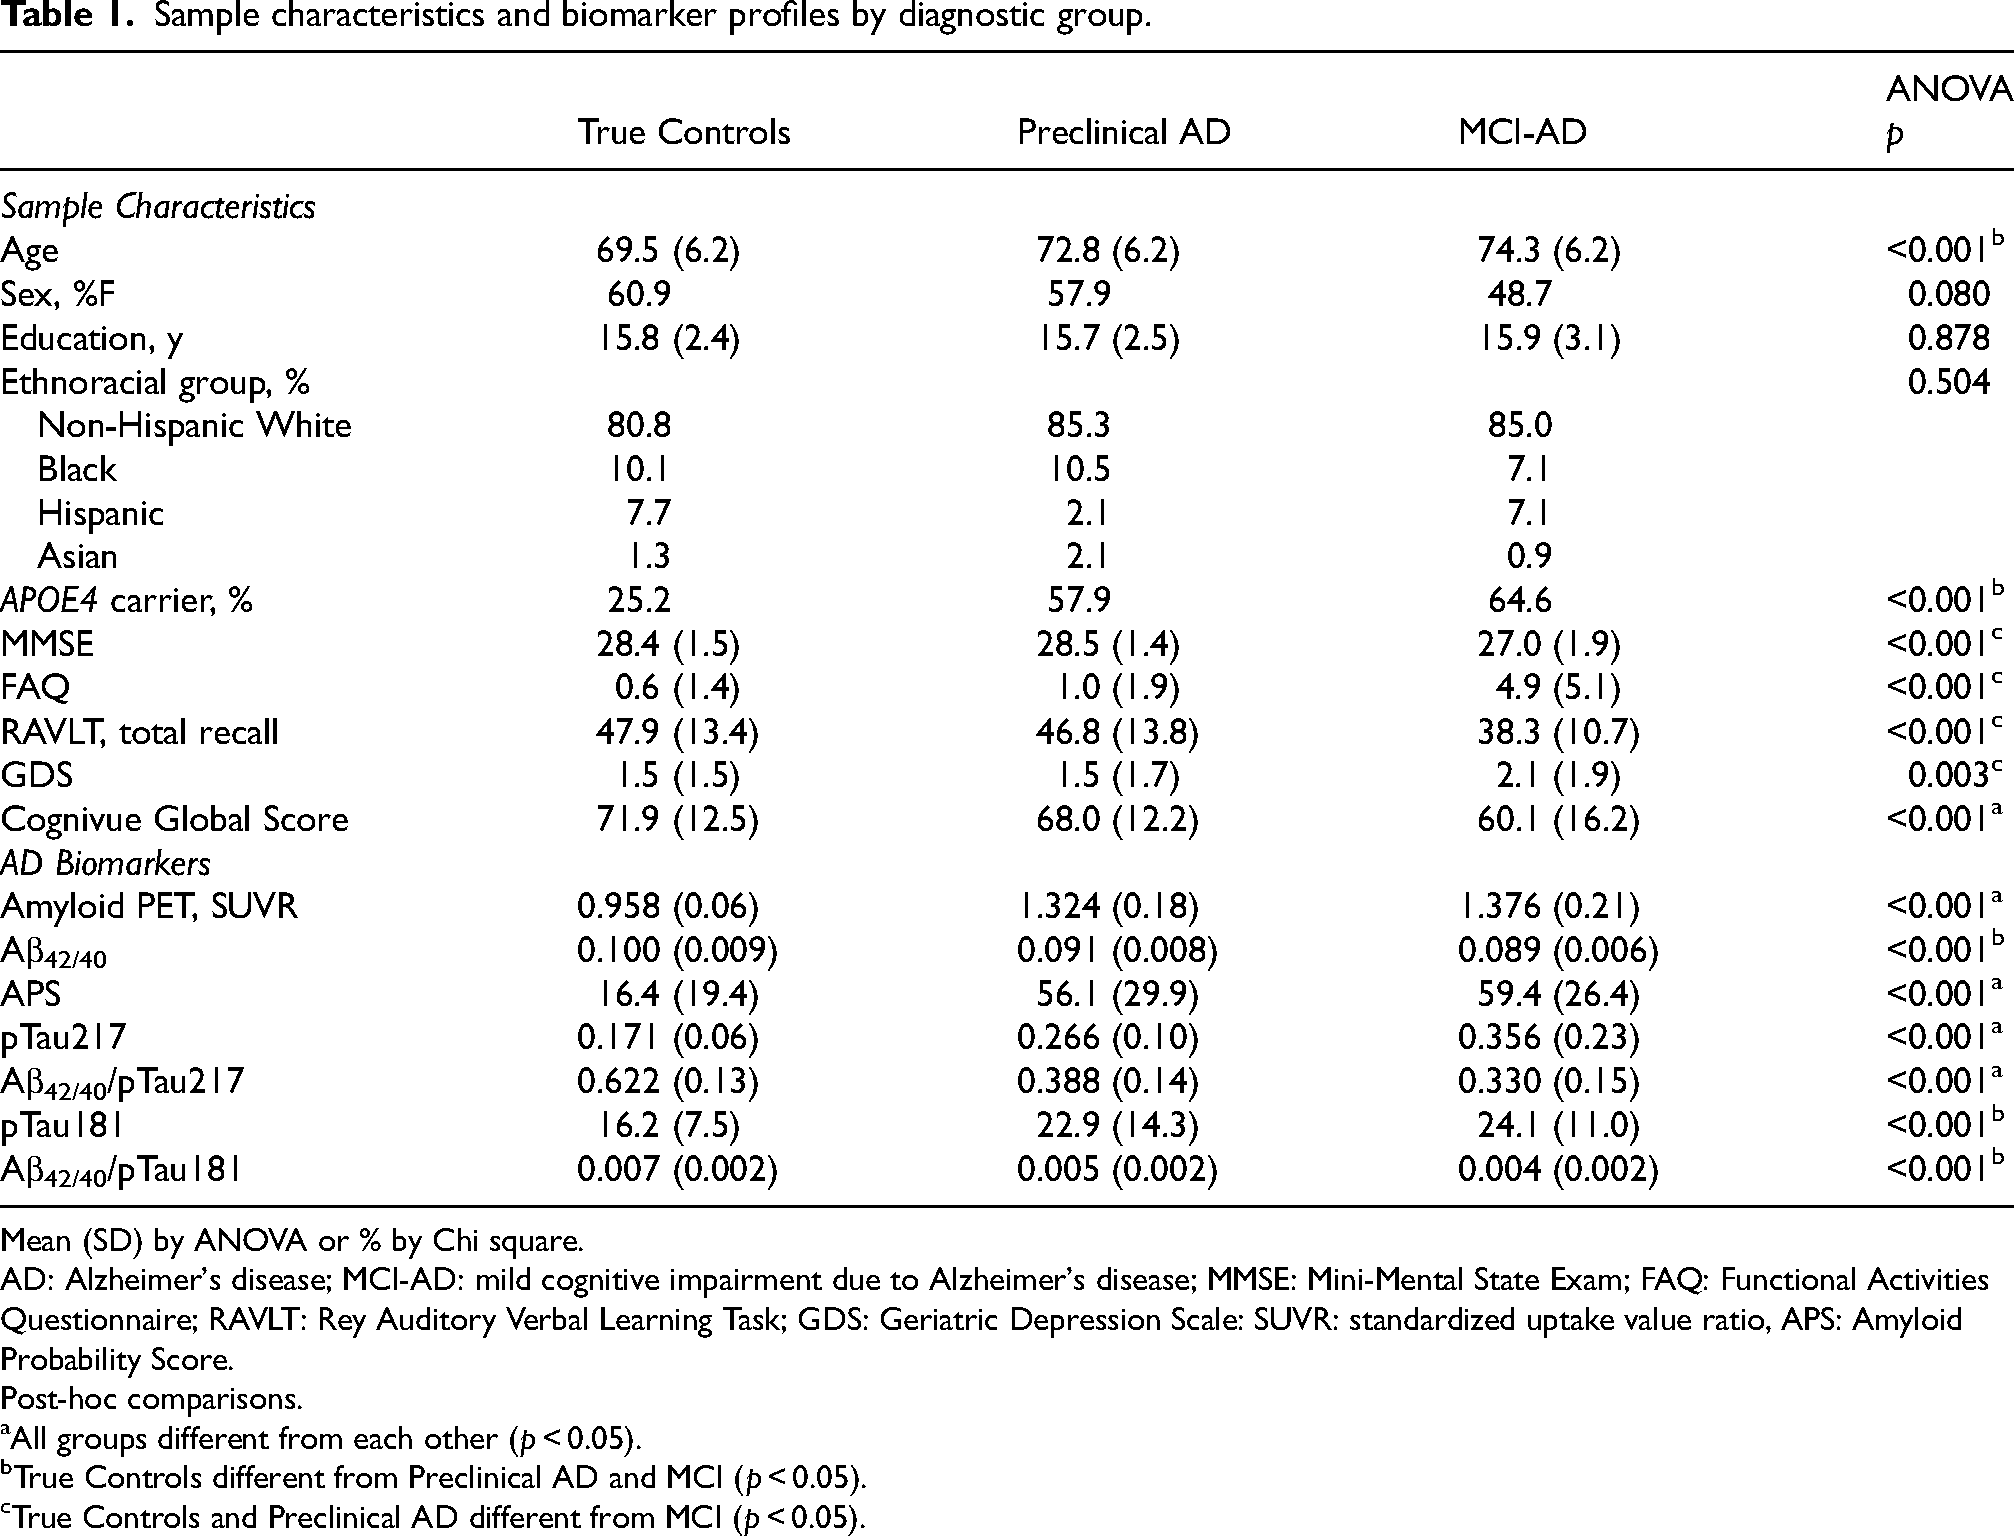
Mean (SD) by ANOVA or % by Chi square.
AD: Alzheimer's disease; MCI-AD: mild cognitive impairment due to Alzheimer's disease; MMSE: Mini-Mental State Exam; FAQ: Functional Activities Questionnaire; RAVLT: Rey Auditory Verbal Learning Task; GDS: Geriatric Depression Scale: SUVR: standardized uptake value ratio, APS: Amyloid Probability Score.
Post-hoc comparisons.
All groups different from each other (p < 0.05).
True Controls different from Preclinical AD and MCI (p < 0.05).
True Controls and Preclinical AD different from MCI (p < 0.05).
When examining the AD biomarkers, amyloid PET, APS, ptau217, and the ratio of Aβ42/40 to pTau217 differentiated all three groups from each other. The Aβ42/40 ratio, pTau181, and the ratio of Aβ42/40 to pTau181 differentiated True Controls from individuals that had amyloid (Preclinical AD and MCI-AD) but did not differentiate Preclinical AD from MCI-AD. Since participants with amyloid had different performance on Cognivue Clarity global scores than participants without amyloid, we further compared performance of the Cognivue Clarity subtests between amyloid negative (n = 297) and amyloid positive groups (n = 208) based on 18F-Florbetapir PET scans (Table 2). The Cognivue Clarity global score and each of the 10 subtests were able to differentiate individuals with negative amyloid PET scans from those with positive amyloid PET scans. The effect size of the Cognivue Clarity global score to differentiate amyloid negative individuals from amyloid positive individuals was medium to large (Cohen's d = 0.608; 95% CI: 0.425–0.791).
Cognivue clarity performance by amyloid Status.
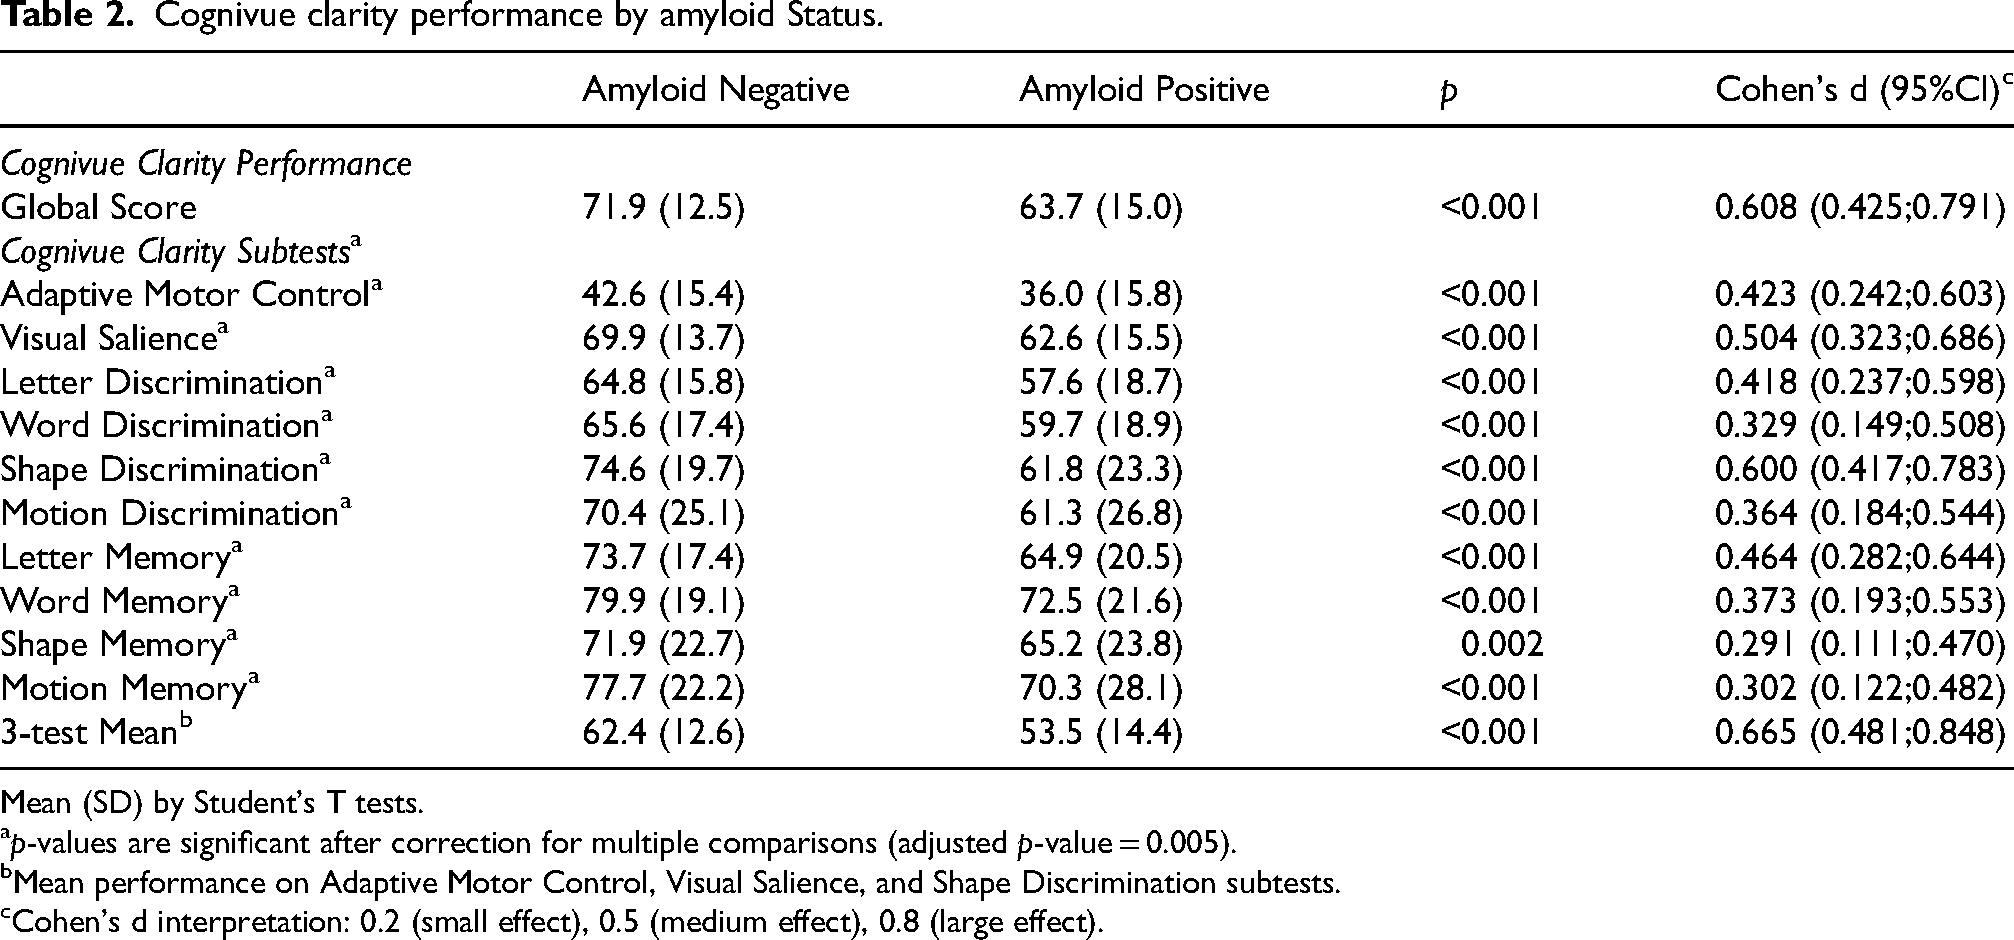
Mean (SD) by Student's T tests.
p-values are significant after correction for multiple comparisons (adjusted p-value = 0.005).
Mean performance on Adaptive Motor Control, Visual Salience, and Shape Discrimination subtests.
Cohen's d interpretation: 0.2 (small effect), 0.5 (medium effect), 0.8 (large effect).
Performance of Cognivue Clarity subtests in detecting preclinical AD
The performance on Cognivue Clarity global and subtests across True Controls, Preclinical AD, and MCI-AD is presented in Table 3. All three groups are different from each other on Cognivue Clarity global and all 10 subtests (all ps < 0.001) a medium-to-large effect size (Eta squared = 0.113). On post-hoc comparisons, the Cognivue Clarity global score was significantly different between True Controls and MCI-AD (p < 0.001) and between Preclinical AD and MCI-AD (p < 0.001) with medium-to-large effect sizes. The Cognivue Clarity global score was also different between True Controls and Preclinical AD (p = 0.014) but with a small effect size (Cohen's d = 0.316).
Cognivue clarity performance by diagnostic group.
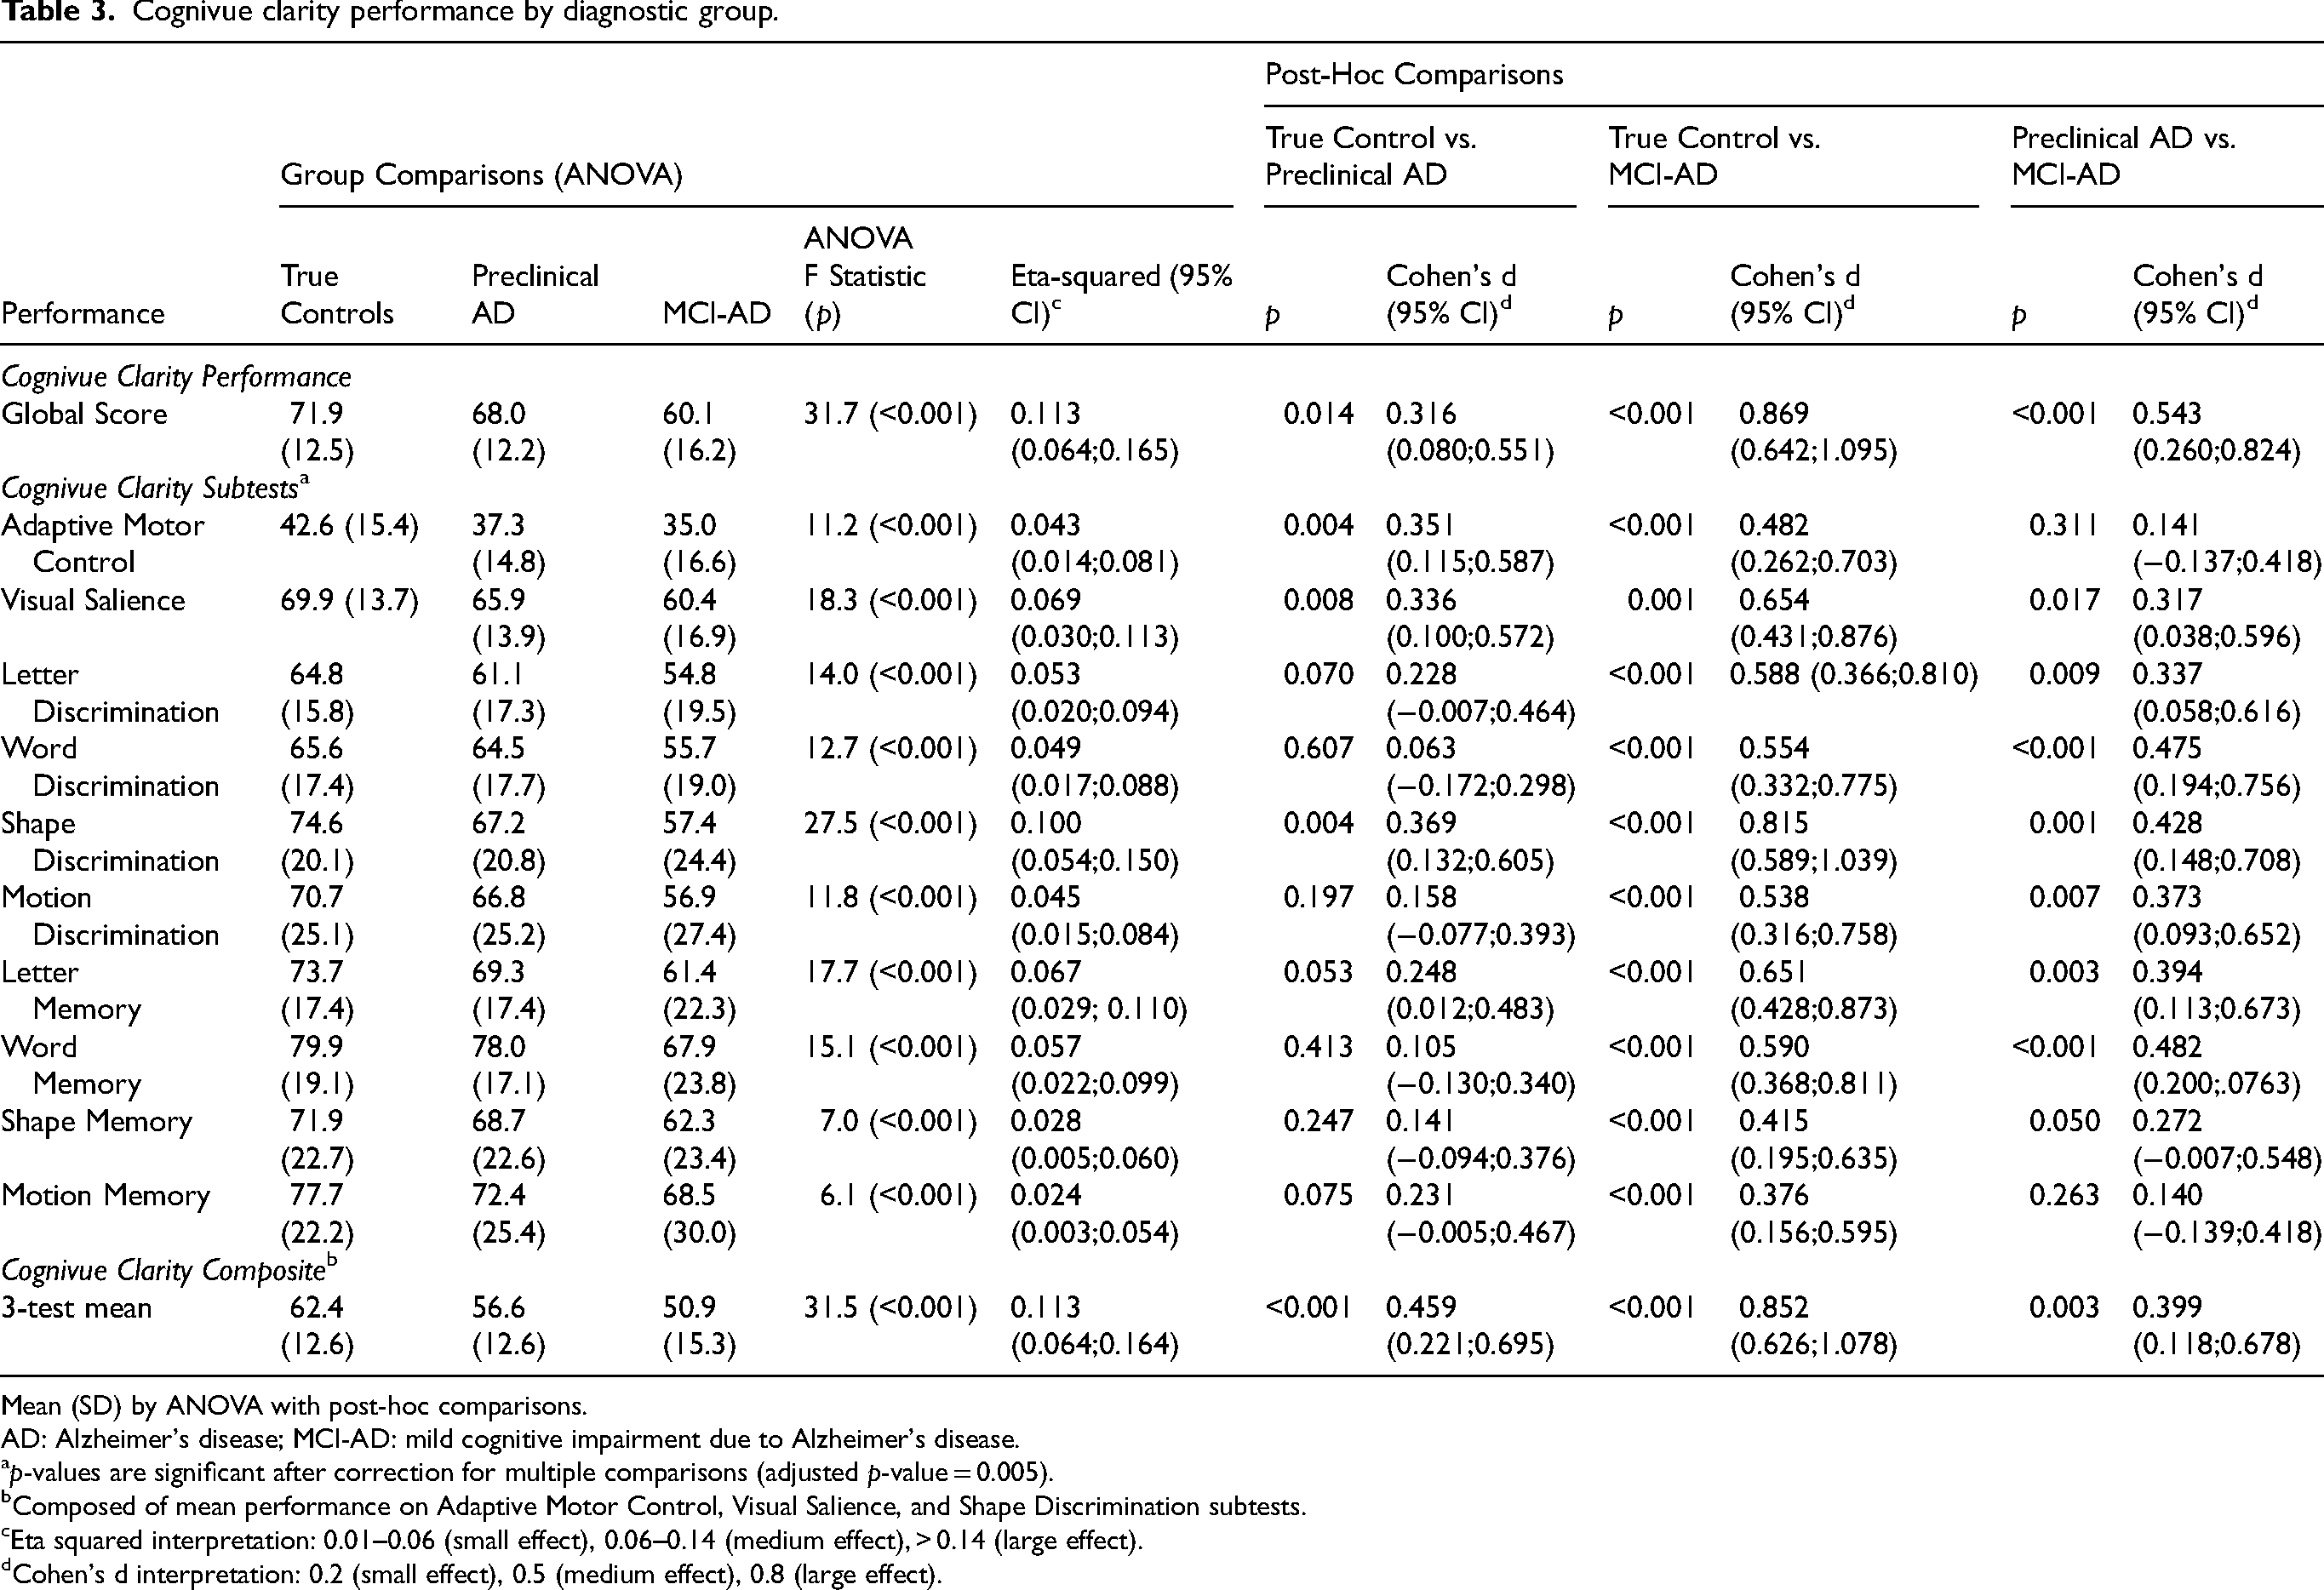
Mean (SD) by ANOVA with post-hoc comparisons.
AD: Alzheimer's disease; MCI-AD: mild cognitive impairment due to Alzheimer's disease.
p-values are significant after correction for multiple comparisons (adjusted p-value = 0.005).
Composed of mean performance on Adaptive Motor Control, Visual Salience, and Shape Discrimination subtests.
Eta squared interpretation: 0.01–0.06 (small effect), 0.06–0.14 (medium effect), > 0.14 (large effect).
Cohen's d interpretation: 0.2 (small effect), 0.5 (medium effect), 0.8 (large effect).
A further exploration of the 10 subtests on post-hoc comparisons revealed that three subtests of Cognivue Clarity significantly differentiated True Controls from Preclinical AD: Adaptive Motor Control (p = 0.004), Visual Salience (p = 0.008) and Shape Discrimination (p = 0.004) with Cohen's d ranging from 0.336–0.369 supporting a small to medium effect size. Further while all 10 subtests were significantly different between True Controls and MCI-AD with medium-to-large effect sizes (Table 3), differences between Preclinical AD and MCI-AD were smaller with Adaptive Motor Control (p = 0.311) and Visual Salience (p = 0.017) subtests no longer significantly different after correction for multiple comparisons.
To study the ability of the Adaptive Motor Control, Visual Salience, and Shape Discrimination subtests to discriminate True Controls from Preclinical AD, a composite score of the mean of the three tests was created. The 3-test mean composite score more significantly differentiated True Controls from Preclinical AD (p < 0.001, Cohen's d = 0.459) than either the Cognivue Clarity global score or the scores on the three individual subtests. Additionally, the 3-test mean composite score differentiated Preclinical AD from MCI-AD (p = 0.003, Cohen's d = 0.399). The 3-test mean composite score also differentiated amyloid positive individuals from amyloid negative individuals (p < 0.001, Table 2) with a medium-to-large effect size (Cohen's d = 0.665) providing further support that Cognivue Clarity, particularly the 3-test mean composite score, may help identify Preclinical AD due to its sensitivity to the presence of amyloid rather than solely based on the cognitive performance.
Association between Cognivue Clarity and AD biomarkers
Table 4 demonstrates the association between Cognivue Clarity global score, the 3 subtests that discriminate Preclinical AD and the 3-test composite score and AD biomarkers collected in Bio-Hermes: SUVR from the amyloid PET and plasma pTau217 from Eli Lilly, plasma Aβ42/40 ratio and APS from C2N, and plasma pTau181 from Quanterix. In addition, two amyloid/tau ratios were created comparing Aβ42/40 ratios to pTau217 or pTau181 that may more closely align with amyloid PET than plasma Aβ or pTau measurements alone. 24 Cognivue Clarity global scores and the 3 subtests were moderately associated with amyloid PET SUVR and pTau217 measurements as well as the Aβ42/pTau217 ratios (all p < 0.001). Smaller correlations were seen between Cognivue Clarity global scores and the 3 subtests for APS, pTau181 and Aβ42/pTau181 ratio. The weakest correlations were with the Aβ42/40 ratio. The 3-test composite had stronger correlations with the AD biomarkers than the individual subtests and was very similar to the global score.
Correlation between cognivue clarity global, subtests, and composite and AD biomarker
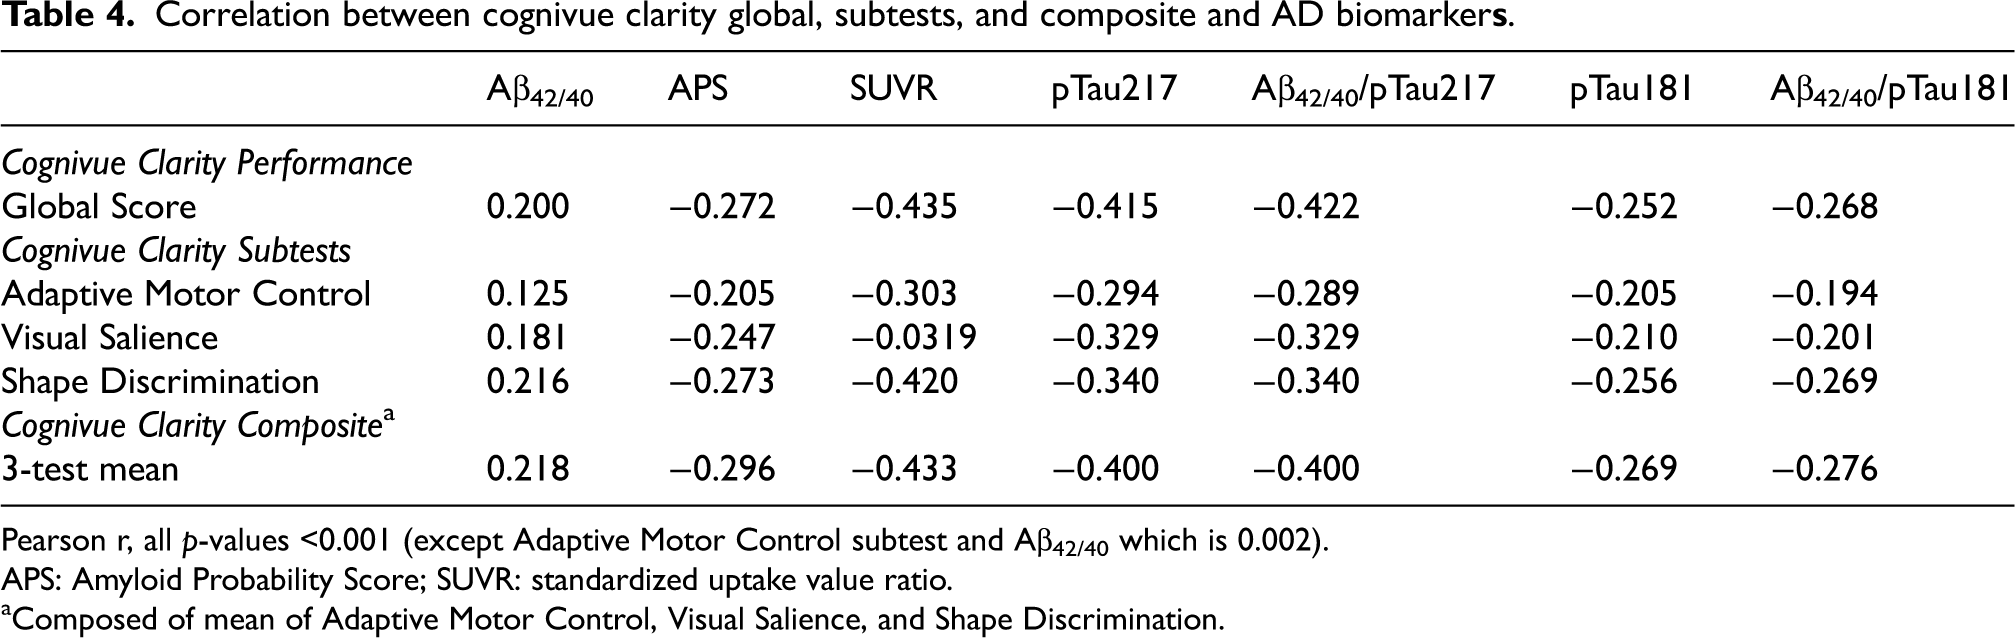
Pearson r, all p-values <0.001 (except Adaptive Motor Control subtest and Aβ42/40 which is 0.002).
APS: Amyloid Probability Score; SUVR: standardized uptake value ratio.
Composed of mean of Adaptive Motor Control, Visual Salience, and Shape Discrimination.
Cognivue Clarity comparisons between true controls and preclinical AD stratified by race
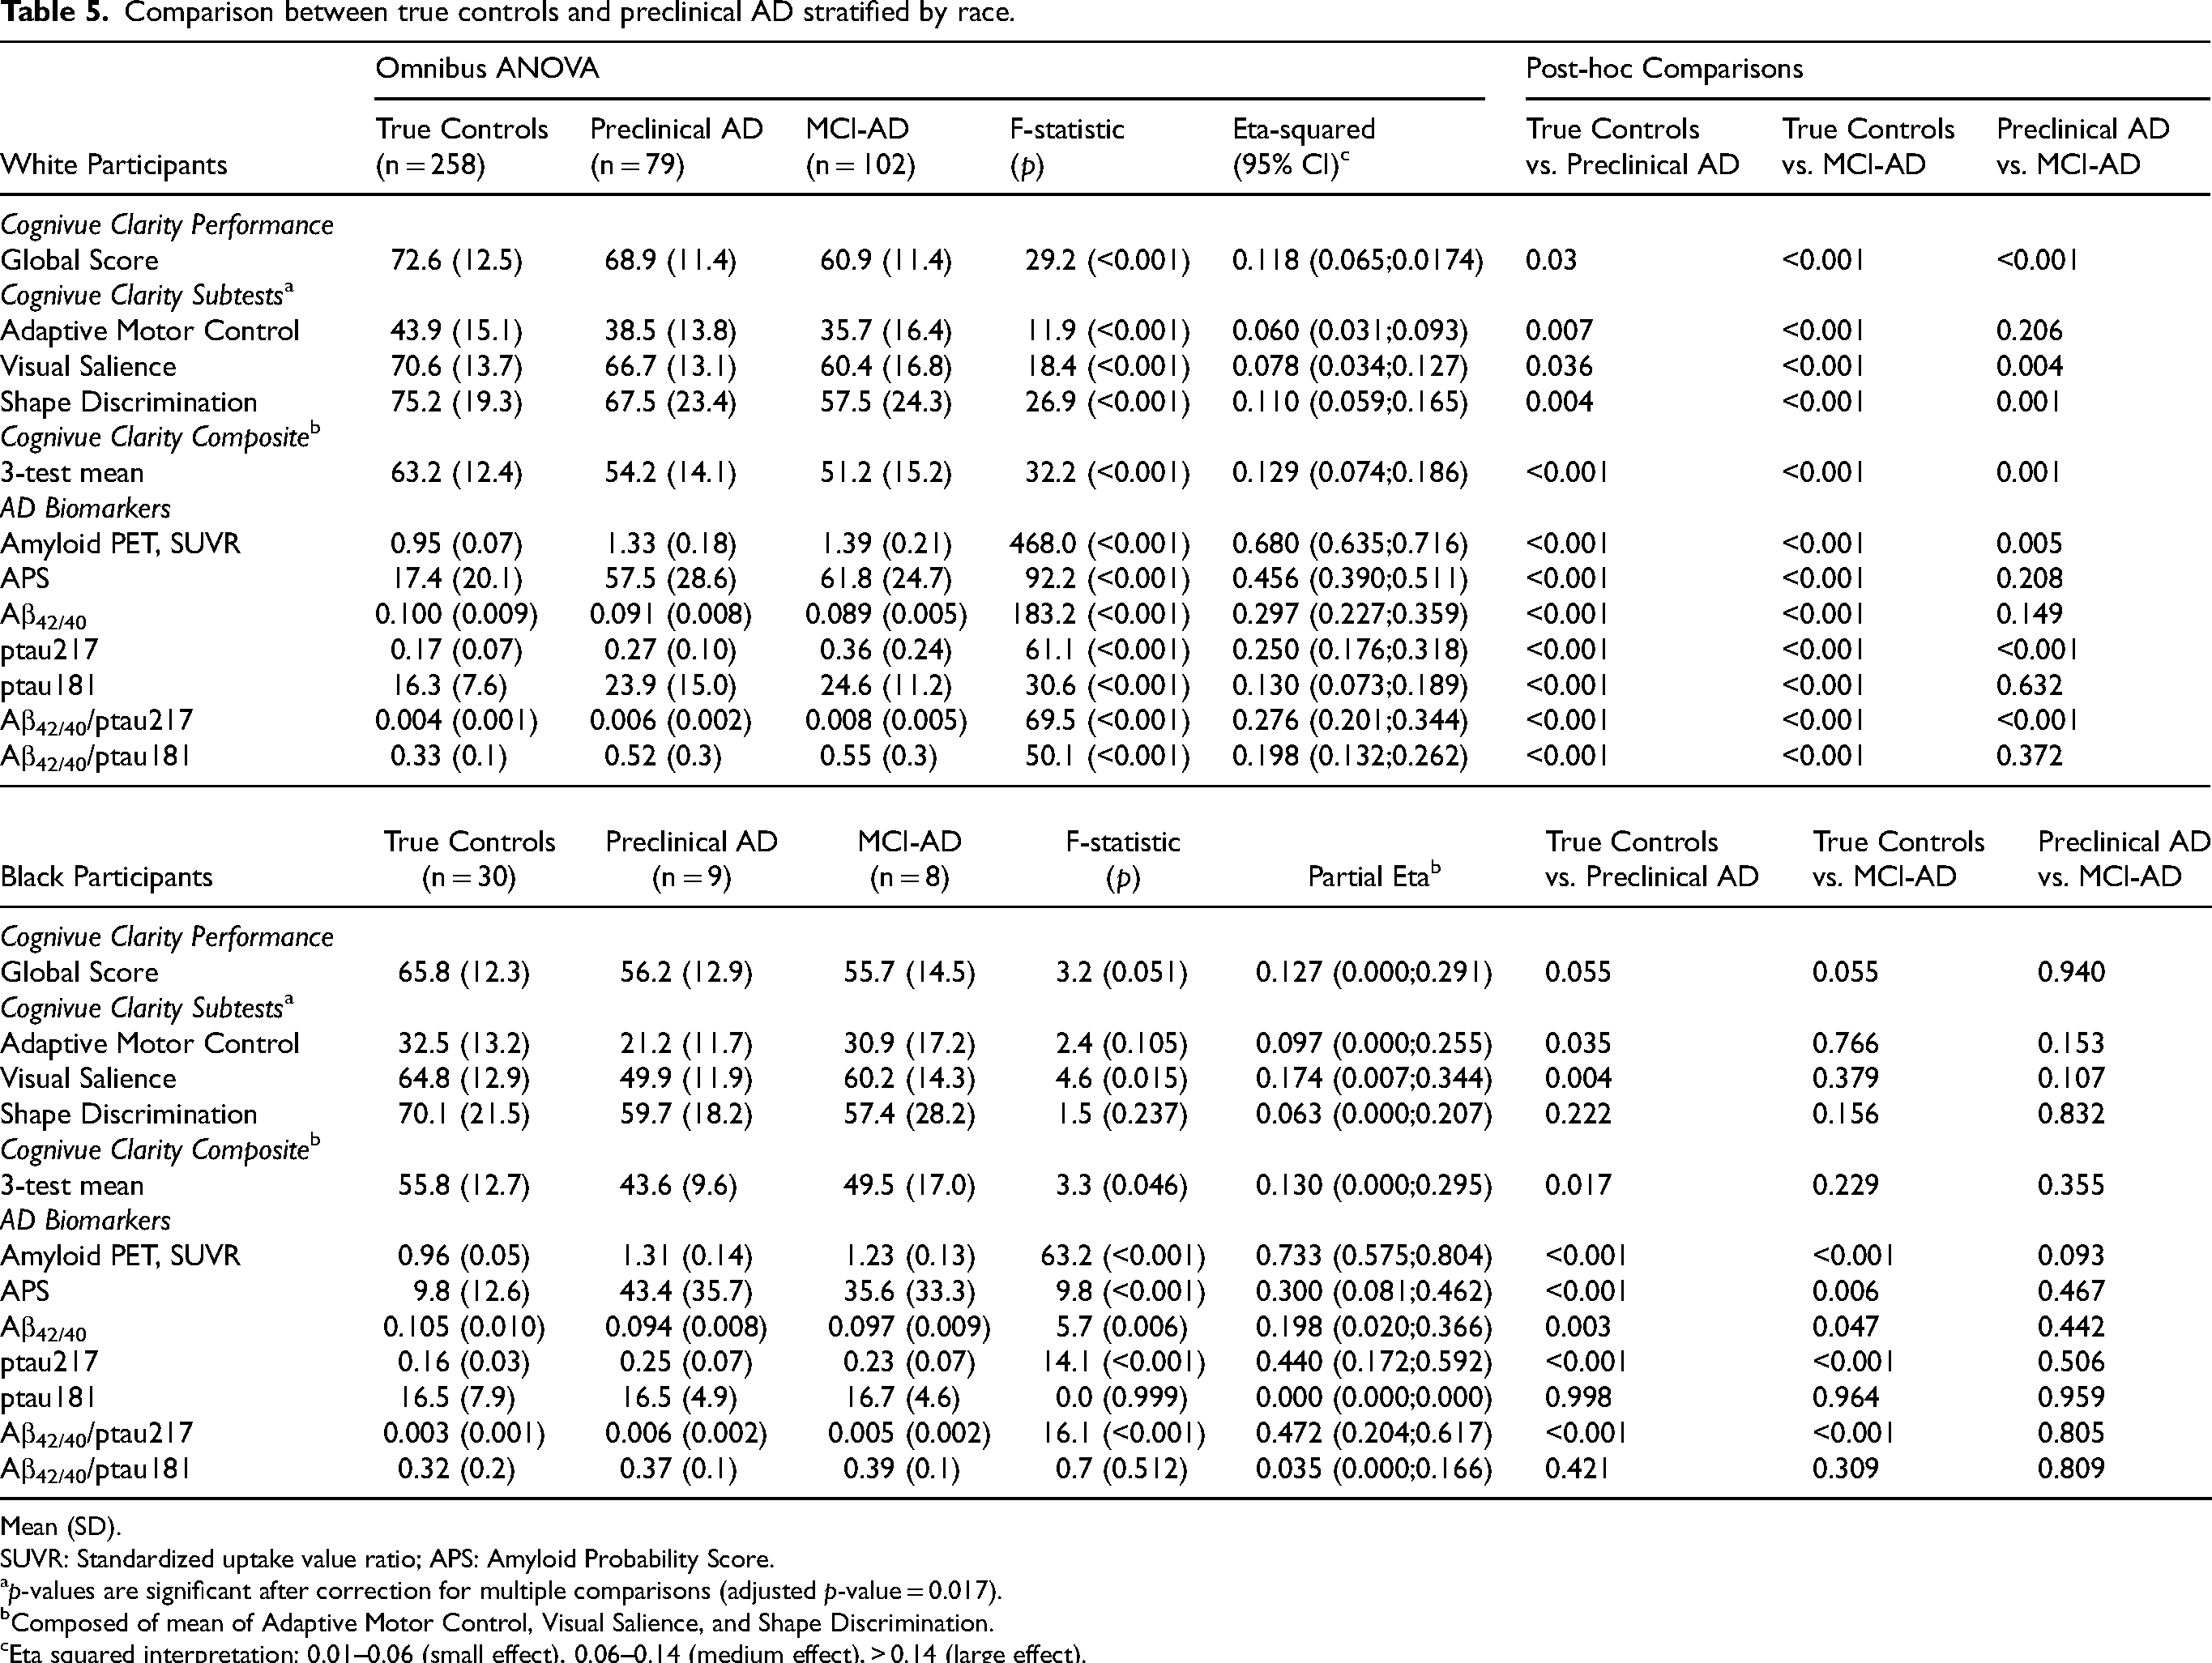
Last, we explored whether there was any difference in the ability of Cognivue Clarity global score, 3 subtests, the 3-test composite score to characterize Preclinical AD and MCI-AD in White and Black participants (Table 5). This was done in response to reports from recent clinical trials of anti-amyloid monoclonal antibodies that African American participants appeared to have lower levels of amyloid which led to high exclusion rates.5–7 In White participants, Cognivue Clarity global scores, subtest scores, and the 3-test mean composite score differentiated True Controls from Preclinical AD and MCI-AD with medium-to-large effect sizes. Post hoc comparisons revealed the 3-test composite significantly differentiated between True Control versus Preclinical AD groups (p < 0.001) and Preclinical AD from MCI (p = 0.001) with a large effect size.
Comparison between true controls and preclinical AD stratified by race.
Mean (SD).
SUVR: Standardized uptake value ratio; APS: Amyloid Probability Score.
p-values are significant after correction for multiple comparisons (adjusted p-value = 0.017).
Composed of mean of Adaptive Motor Control, Visual Salience, and Shape Discrimination.
Eta squared interpretation: 0.01–0.06 (small effect), 0.06–0.14 (medium effect), > 0.14 (large effect).
There were fewer Black participants so results should be interpreted with this in mind. In general, Black participants scored lower on Cognivue Clarity global and subtests scores, consistent with prior findings.9,10 The omnibus p-values and effect size were less robust with only the visual salience subtest (p = 0.015) and 3-test mean composite score (p = 0.046) reaching significance. On post-hoc comparisons, the visual salience subtest significantly discriminated True Controls from Preclinical AD (p = 0.004) followed by the 3-test composite (p = 0.017).
We also explored whether there was any difference in AD biomarkers by race. There were no differences in amyloid PET SUVR, ptau217 or ptau181 measurements between White and Black participants; however, Aβ42/40 ratios were lower in White participants compared with Black participants (0.095 ± 0.009 versus 0.101 ± 0.011; p < 0.001). APS scores were higher in White participants compared with Black participants (35.3 ± 31.1 versus 21.4 ± 27.2; p = 0.003). In stratified analyses, for White participants, all AD biomarkers robustly differentiated between diagnostic groups; however, only amyloid PET and ptau217 differentiated Preclinical AD from MCI-AD (Table 5). In Black participants, ptau181 measurements did not differentiate between groups. On post-hoc comparisons, amyloid PET, APS, Aβ42/40 ratios, and ptau217 significantly differentiated True Controls from both Preclinical AD and MCI-AD. However, no AD biomarker differentiated Preclinical AD from MCI-AD. Due to the smaller number of Black participants, these results should be interpreted with caution.
Discussion
In a large study of biomarker confirmed cases of True Controls, Preclinical AD, and MCI-AD, we found that Cognivue Clarity was able to identify individuals with Preclinical AD. In particular, three subtests (Adaptive Motor Control, Visual Salience, and Shape Discrimination) were significantly different between True Controls and Preclinical AD with a composite of the mean of the three tests performing better than the global score or individual subtests with a greater statistical significance and bigger effect size. The 3-test composite was moderately correlated with amyloid PET and two plasma biomarkers (APS, pTau217) that are highly predictive of amyloid positivity on PET. Preclinical AD was distinguished from MCI-AD by cognitive performance on the global scores and 3-test composite. Finally, we showed that the 3-test composite was able to detect Preclinical AD in both White and Black participants. Since the MMSE and RAVLT were used as inclusion criteria in Bio-Hermes, we did not conduct discrimination or classification analyses with them. However, using group comparisons, no differences in performance between True Controls and Preclinical AD were found.
Preclinical AD is defined as individuals who are cognitively normal with evidence of brain amyloid deposition. This was first described in autopsy cases 33 but with the advent of sensitive amyloid biomarkers, we can now identify Preclinical AD in living individuals.11,12 Since cognitive test performance typically remains within normal ranges, identifying Preclinical AD requires biomarker measurements. This asymptomatic stage, which likely precedes MCI-AD by years or decades, is accompanied by very subtle cognitive decline detectable with sensitive neuropsychological tests performed longitudinally and possibly also with tools that assess subjective cognitive complaints.13,33 Longitudinal evaluations have further suggested that individuals with Preclinical AD have an absence of practice effects on neuropsychological testing.33,34 Despite this accumulating scientific evidence, to date clinicians cannot a priori recognize Preclinical AD in the office and decide who should go on to have a biomarker or who might be eligible for a clinical trial.
Cognitive measures that are sensitive to amyloid deposition would be highly desirable since performance, rather than biomarkers, are more closely related to the core features of AD disease progression and could be sensitive to treatment effects. Traditional neuropsychological tests have not demonstrated the ability to characterize Preclinical AD, but several composite measures are currently being utilized in clinical trials. One of the first of these measures was the Alzheimer Disease Cooperative Study Preclinical Alzheimer Cognitive Composite (ADCS-PACC) derived from the total recall score of the Free and Cued Selective Reminding Test, the delayed recall score from the Wechsler Logical Memory IIa subtest, the total score from the Digit Symbol Substitution Test, and the total score from the MMSE. 15 Subsequent studies confirmed the ADCS-PACC as a useful composite for Preclinical AD trials. 14 One of several modifications of the ADCS-PACC added performance on semantic fluency to create the PACC5. 35 In a comparison of the ADCS-PACC, PACC5 and Repeatable Battery for Neuropsychological Status (RBANS), the ADCS-PACC had a significantly larger effect size than the RBANS for detecting Preclinical AD, while the PACC5 effect size was numerically larger. 36
Other composite scores have been proposed including general learning and memory composites used in the Wisconsin Registry for Alzheimer's Prevention 37 and a computerized cognitive composite (C3) from the Harvard Aging Brain Study. 38 However, the ADCS-PACC and other composites require completion of a neuropsychological test battery and a longitudinal course using a mixed model of repeated measures analysis or other advanced statistical modeling to identify Preclinical AD. Cognivue Clarity can be administered in a single 10-min sitting making it ideal for case ascertainment for treatment protocols or inclusion in clinical trials before expensive biomarkers are performed. Additionally, since cross-sectional scores discriminate groups with good effect sizes, and scores decline from True Controls to Preclinical AD to MCI-AD, Cognivue Clarity may provide insights into disease progression and treatment effects. Further research will be required to test this hypothesis.
Three subtests within Cognivue Clarity appear to be sensitive to the presence of amyloid and may help identify individuals with Preclinical AD tap into motor responses and visual discrimination. The Adaptive Motor Control subtest is used to set the baseline motor control and response times. The construct of adaptive motor control has been linked with the cerebellum, 39 anterior cingulate, 40 and dorsal medial frontal lobe. 40 The Visual Salience subtest is used to set the baseline ability to discern decrements in visual contrast important for object recognition. The construct of visual salience has been linked with primary visual cortex, 40 and the dorsal visual stream to frontal and parietal cortices.41,42 The Shape Discrimination subtest presents novel shapes for operant learning that tap into cognitive abilities across the animal kingdom including physical and social cognition, survival responses, foraging and prey recognition, attention, and navigation.43,44 This has been linked to medial prefrontal cortex, 44 inferior temporal cortex, 45 and the ventral visual stream from the primary visual cortex to temporal and posterior parietal cortices.41,46 Many of these regions are associated with the earliest sites of amyloid deposition including posterior parietal, precuneus, posterior temporal, and medial frontal lobes.47,48
We also explored differences in AD biomarker profiles between True Controls, Preclinical AD, and MCI-AD. As defined by amyloid PET, the most robust biomarker to potentially identify the Preclinical AD group was plasma ptau217 were more likely to discriminate Preclinical AD from MCI-AD,49,50 while measurements of plasma Aβ42/40 ratios were less likely provide discrimination. It was surprising that ptau181 levels were not different between Preclinical AD and MCI-AD suggesting that ptau181 and ptau217 may peak at different points along the amyloid cascade.
The Bio-Hermes Study 8 was a cross-sectional study so that longitudinal changes in Cognivue Clarity or other biomarkers could not be determined. The cohorts used in the Bio-Hermes Study were based on clinical diagnoses using limited testing (MMSE, RAVLT, FAQ). No detailed neuropsychological examination or MRI was available. The absence of MRI prohibits examining associations between Cognivue Clarity subtests with cortical volumes in the Bio-Hermes study. This is an area for future research. Although there were differences in the mean performance in Cognivue Clarity global, subtest, and 3-test mean composite scores between True Controls and Preclinical AD, there was considerable overlap of range of scores and small-to-medium effect sizes. Cognivue Clarity cannot be used as a stand-alone diagnostic for Preclinical AD but instead could be used as part of an overall diagnostic algorithm to raise suspicion and trigger additional investigation for inclusion into clinical trials or treatment planning. Future research will focus on establishing cut-off scores, sensitivity, and specificity of Cognivue Clarity for distinguishing True Controls and Preclinical AD.
There were few individuals who self-identified as Asian, American Indian/Alaska Native, or Native Hawaiian/Pacific Islander and while Hispanics were well recruited in Bio-Hermes, only 2 individuals had Preclinical AD so no conclusions could be made regarding performance of Cognivue Clarity to detect Preclinical AD in these ethnoracial groups. Although we explored differences in Cognivue Clarity and AD biomarkers in stratified analyses, the low number of Black participants suggests that results should be interpreted with caution. The strengths of this study include a large sample and extensive biomarker characterization. The biomarker characterization used in Bio-Hermes is consistent with the National Institute on Aging-Alzheimer's Association research framework 51 for biological definitions of AD and non-AD causes of cognitive impairment.
With a number of AD prevention trials on-going, screening for individuals with Preclinical AD is an expensive proposition since neuropsychological testing alone cannot detect them, requiring PET scans or lumbar puncture. Cognivue Clarity, a 10-min computerized battery, can detect individuals with cognitive impairment, identify individuals likely to have amyloid positivity, and also identify Preclinical AD. Cognivue Clarity primarily tests cognitive function and is indicated for screening for the presence of cognitive impairment. However, we found three subtests (Adaptive Motor Control, Visual Salience, and Shape Discrimination) were sensitive to presence of amyloid to identify individuals likely to have Preclinical AD. Further research is ongoing to determine whether an amyloid risk score could be developed. We also found that plasma ptau217 was the one single plasma biomarker that best characterized Preclinical AD. To further increase the efficiency and cost-effectiveness of screening for Preclinical AD, a staged screening approach likely makes the most sense. 52 Cognivue Clarity could be used to establish whether there is (a) cognitive impairment, and (b) and examination of subtest scores could support the likelihood of amyloid presence. This could be followed by measuring a readily accessible AD biomarker such as plasma pTau217.23,24,49,50 Such a strategy would increase the likelihood of identifying a case of Preclinical AD for enriching recruitment into planned clinical trials. If current prevention trials are successful, this strategy also has great potential for getting people into treatment protocols as early as possible.
Footnotes
Acknowledgments
The authors would like to thank all the participants and sites that contributed data to this project.
Author contributions
James E Galvin (Conceptualization; Formal analysis; Methodology; Writing – original draft; Writing – review & editing); Michael J Kleiman (Formal analysis; Writing – original draft; Writing – review & editing); Paul W Estes (Conceptualization; Methodology; Writing – review & editing); Heather M Harris (Conceptualization; Methodology; Writing – review & editing); Ernest Fung (Writing – review & editing)
Funding
The author(s) disclosed receipt of the following financial support for the research, authorship, and/or publication of this article: The Bio-Hermes study was sponsored by the Global Alzheimer Platform Foundation. Eli Lilly and Company provided quantitative readings of 18F-Florbetapir PET scans and pTau217 assays. Entities that provided direct funding to Bio-Hermes were AbbVie, Alzheimer's Drug Discovery Foundation (ADDF), Aural Analytics, Biogen, Cognivue, C2N, Gates Ventures, Linus Health, Merck & Co, Quanterix, Retispec, and Roche. Entities that did not provide direct funding but did provide in-kind laboratory testing and/or use of devices and testing support were Alzheimer's Disease Data Initiative, Inc. (ADDI), AITIA, EMTherapro, Lilly, Somalogic, and University of Gothenburg.
Declaration of conflicting interests
The author(s) declared the following potential conflicts of interest with respect to the research, authorship, and/or publication of this article: Dr Galvin is Chief Scientific Officer for Cognivue, Inc and receives consulting fees. Dr Kleiman received consulting fees from Cognivue, Inc to conduct statistical analyses. Mr. Estes, Ms. Harris, and Dr Fung are full-time employees of Cognivue, Inc. The authors take full responsibility for the data and have the right to publish all data. Dr. Galvin is an Editorial Board Member of this journal but was not involved in the peer-review process of this article nor had access to any information regarding its peer-review.
Data availability
The dataset for this project is available to all interested parties. Please contact JEG at jeg200@miami.edu.