
Abstract
This paper details an integrated experimental and numerical analysis of the structural performance of axially compressed Q1100 ultra-high strength steel (UHSS) welded box-section stub columns. Material characterisation was performed through tensile tests on tensile coupons extracted from both the base metal and the heat-affected zone (HAZ) to obtain their constitutive relationships. Meticulous quantification of initial geometric imperfections and residual stress fields, comprising both membrane and bending components, was carried out, with measured peak tensile residual stresses near the weld seam attaining 37.2% of the nominal yield strength. All nine stub column specimens failed by local buckling, and a clear inverse trend was observed between the normalised axial strength and the plate width-to-thickness ratio. A high-fidelity finite element (FE) model was established, integrating the measured imperfections, residual stress patterns, and the strength reduction in the HAZ. The accuracy of FE model was confirmed through rigorous validation against test results. A subsequent parametric analysis expanded the data over a wide range of cross-section slenderness, enabling a thorough evaluation of structural local buckling behaviour. Comparisons with predictions from major design codes, such as EN 1993-1-1, AISC 360, and AS 4100, showed that these standards are consistently conservative for the studied UHSS sections, with the conservatism being most pronounced for stocky cross-sections. This research provides essential insights and suggests practical refinements to bridge existing gaps in design codes for UHSS structural applications.
Introduction
The superior strength-to-weight ratio of high-strength steel (HSS) has led to its growing adoption in the construction sector, enabling the design of lighter and more sustainable structures relative to those using conventional mild steel (Fang et al., 2018; Liu et al., 2022a; Su et al., 2021). Welded hollow sections, including square (SHS), rectangular (RHS), and circular (CHS) forms, are particularly prevalent in high-rise buildings, bridges, and offshore installations due to their efficient load-carrying characteristics, excellent torsional stiffness, and adaptability to composite design (Ma et al., 2018; Meng and Gardner, 2021). A significant challenge associated with welding is the introduction of residual stresses and initial geometric deviations, which can markedly reduce buckling capacity and ultimate strength (Chen et al., 2023; Liu et al., 2024a, 2025a).
Pioneering research by Nishino et al. (1967) performed axial compression tests on welded box columns manufactured from ASTM A7 (fy,nom = 235 MPa) and ASTM A514 (fy,nom = 690 MPa) grades. Their work provided experimental validation for theoretical models of elastic and elastic-plastic plate buckling, and indicated that residual stresses had a greater effect on the behaviour of the lower-strength A7 steel. The A514 columns were found to achieve higher normalised compressive capacities than their A7 counterparts over a spectrum of plate width-to-thickness (b/t) ratios from 26 to 44. Further contributions by Rasmussen and Hancock (1992), based on tests of six welded box stub columns made from 690 MPa steel, suggested that the yield slenderness limits for HSS are similar to those for mild steel. An extension of this work by Clarin (2004), which included three steel grades, namely DOMEX 420 (fy,nom = 420 MPa), WELDOX 700 (fy,nom = 700 MPa), and WELDOX 1100 (fy,nom = 1100 MPa), demonstrated that the ratio of residual stress to yield strength (σrs/fy,nom) decreases as the material strength increases. The DOMEX specimens exhibited the smallest absolute residual stress values, highlighting a reduced impact of welding-induced stresses in higher-strength materials.
Recent investigative efforts have increasingly turned to ultra-high-strength steels (UHSS) possessing yield strengths greater than 800 MPa. Gao et al. (2009) studied the buckling response of welded box sections made from 18Mn2CrMoVB steel (fy,nom = 745–800 MPa), noting that their measured ultimate capacities were considerably higher than those estimated by ANSI/AISC 360. Their study identified the plate b/t ratio and the section’s aspect ratio as pivotal factors affecting cross-section capacity, leading to the development of a new empirical model for predicting axial strength. Parallel work by Yoo et al. (2013) on 800 MPa steel square tubular stub columns also found that current design codes systematically provide underestimates of the ultimate load, especially for non-slender sections. For steel grades with fy,nom ≥ 960 MPa, Shi et al. (2015) provided experimental evidence of the shortcomings in contemporary design standards, revealing that both Eurocode EN 1993-1-1 and ANSI/AISC 360 produce unsafe predictions. Schillo and Feldmann (2018) further analysed the effective width method (EWM) in EN 1993-1-1, noting its propensity to overestimate the resistance of plates at higher slenderness values for S500 MC, S700 MC, and S960 MC steels, and consequently proposed a modified general method. Supporting research in (Li et al., 2019) proposed a non-dimensional slenderness limit (λey) of 35 for S960 UHSS welded box sections, identifying AS 4100 and ANSI/AISC 360 as providing the most reliable effective width estimates. These conclusions were bolstered by additional tests covering b/t ratios from 20.3 to 40.1, collectively underscoring the demand for updated design approaches specific to UHSS. Investigations into the residual stresses present in HSS welded box columns have provided important understanding of their characteristics and influencing variables. The seminal research of Usami and Fukumoto (1982) provided key residual stress data for A514 steel columns, analysing specimens with b/t ratios from 22 to 58. This early work formed the basis for subsequent predictive models, such as the trapezoidal distribution proposed by Wang et al. (2012) for Q460 steel sections. Nevertheless, the literature shows considerable disagreement on key parameters. Ban et al. (2013) reported that cross-section geometry, specifically plate thickness and the b/t ratio, plays a major role in determining residual stress levels. In contrast, Sun and Packer (2014) found the b/t ratio to have an insignificant effect. Kim et al. (2014) argued that residual stresses in HSB 800 steel are independent of yield strength, a viewpoint challenged by Somodi and Kövesdi (2018), who cited both yield strength and b/t ratio as determining factors. Using neutron diffraction, Khan et al. (2016) detected consistently larger residual stresses in thicker plates relative to thinner ones. Despite these contributions, studies focusing on UHSS grades like Q1100 (fy,nom ≥ 1100 MPa) are limited, especially regarding the combined effects of residual stress and local buckling in welded stub columns.
Prominent international design standards such as EN 1993-1-1:2022, 2020 (CEN 2022), ANSI/AISC 360-22, 2022 (AISC 2022) and AS 4100-2020, 2020 (AS 2020) are primarily intended for steels with yield strengths under 700 MPa. Although EN 1993-1-1 (EN 1993-1-1:2022, 2020) includes rules for S700 steel, other codes set stricter limits, especially for hollow structural sections. For example, ANSI/AISC 360-22, 2022 (AISC 2022) allows base metal up to 690 MPa but restricts hollow sections to 485 MPa, while AS 4100-2020, 2020 (AS 2020) does not permit the use of hollow sections with strengths above 450 MPa. These limitations point to a major gap in the standardisation of HSS tubular members, particularly for those exceeding existing strength limits. Research has shown that the ratio of residual stress to yield strength diminishes with increasing material strength (Yun et al., 2022), a parameter known to critically affect column buckling behaviour (Ban and Shi, 2018). Current codes offer no specific guidance for welded box sections with yield strengths beyond 1100 MPa, raising questions about the validity of existing design methods for such UHSS members and necessitating a detailed assessment of their applicability.
The present research seeks to fill these identified gaps via a combined experimental and numerical study of Q1100 UHSS welded box stub columns. The specific objectives are threefold: (i) to determine the patterns of welding-induced residual stress, (ii) to characterise the material properties of the base metal and HAZ, and (iii) to analyse the local buckling response under axial compression, supported by a broad parametric study to identify key performance drivers. The experimental phase involved detailed measurements of initial geometric imperfections and material tests at key locations. The magnitude and distribution of welding-induced residual stresses were carefully examined. Supplementary finite element (FE) models, which included the effects of HAZ strength reduction, residual stresses, and geometric nonlinearities, were thoroughly validated against the test results. This study also assesses the relevance of current design standards, EN 1993-1-1:2022, 2020 (CEN 2022), EN 1993-1-5, 2006 (CEN 2006), ANSI/AISC 360-22, 2022 (AISC 2022), AISI S100-20, 2020 (AISI 2020), and AS 4100-2020, 2020 (AS 2020) for Q1100 UHSS sections.
Experimental investigation
Test specimens
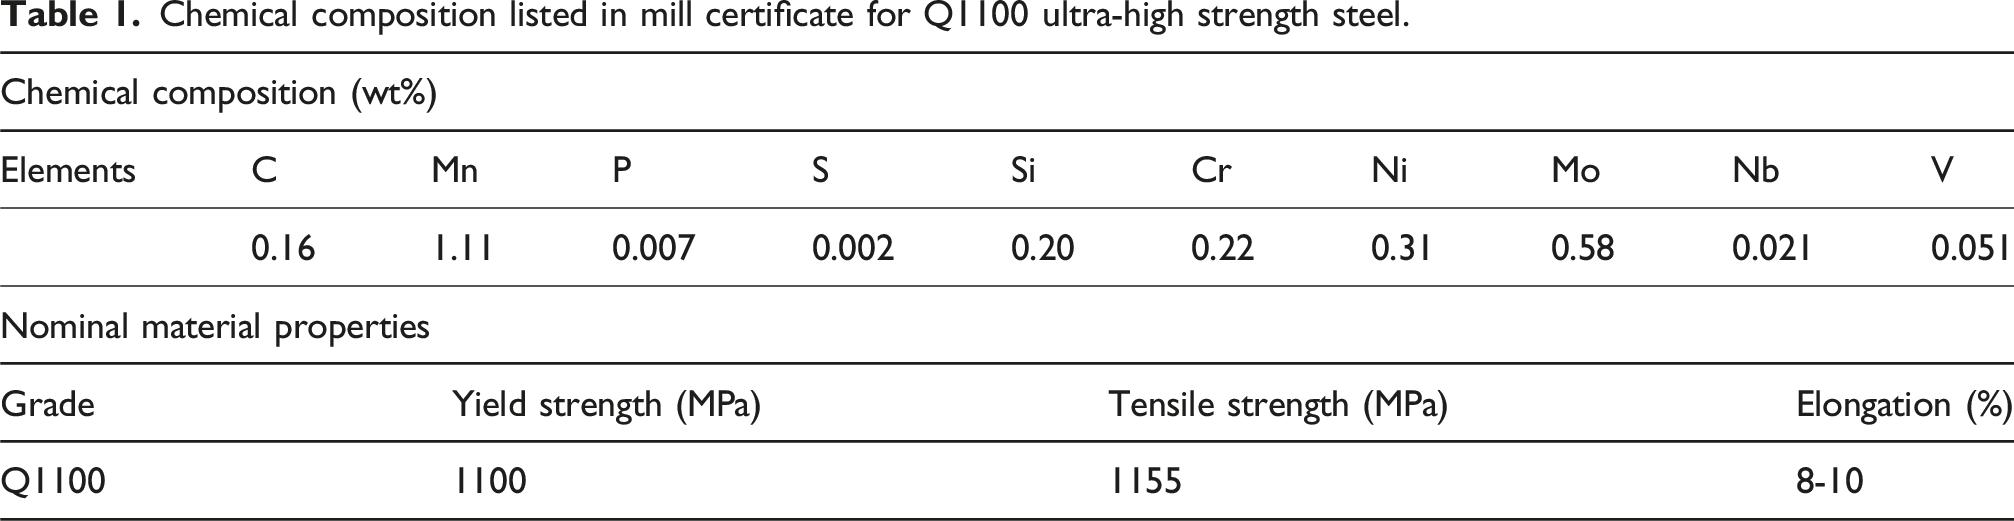
Chemical composition listed in mill certificate for Q1100 ultra-high strength steel.
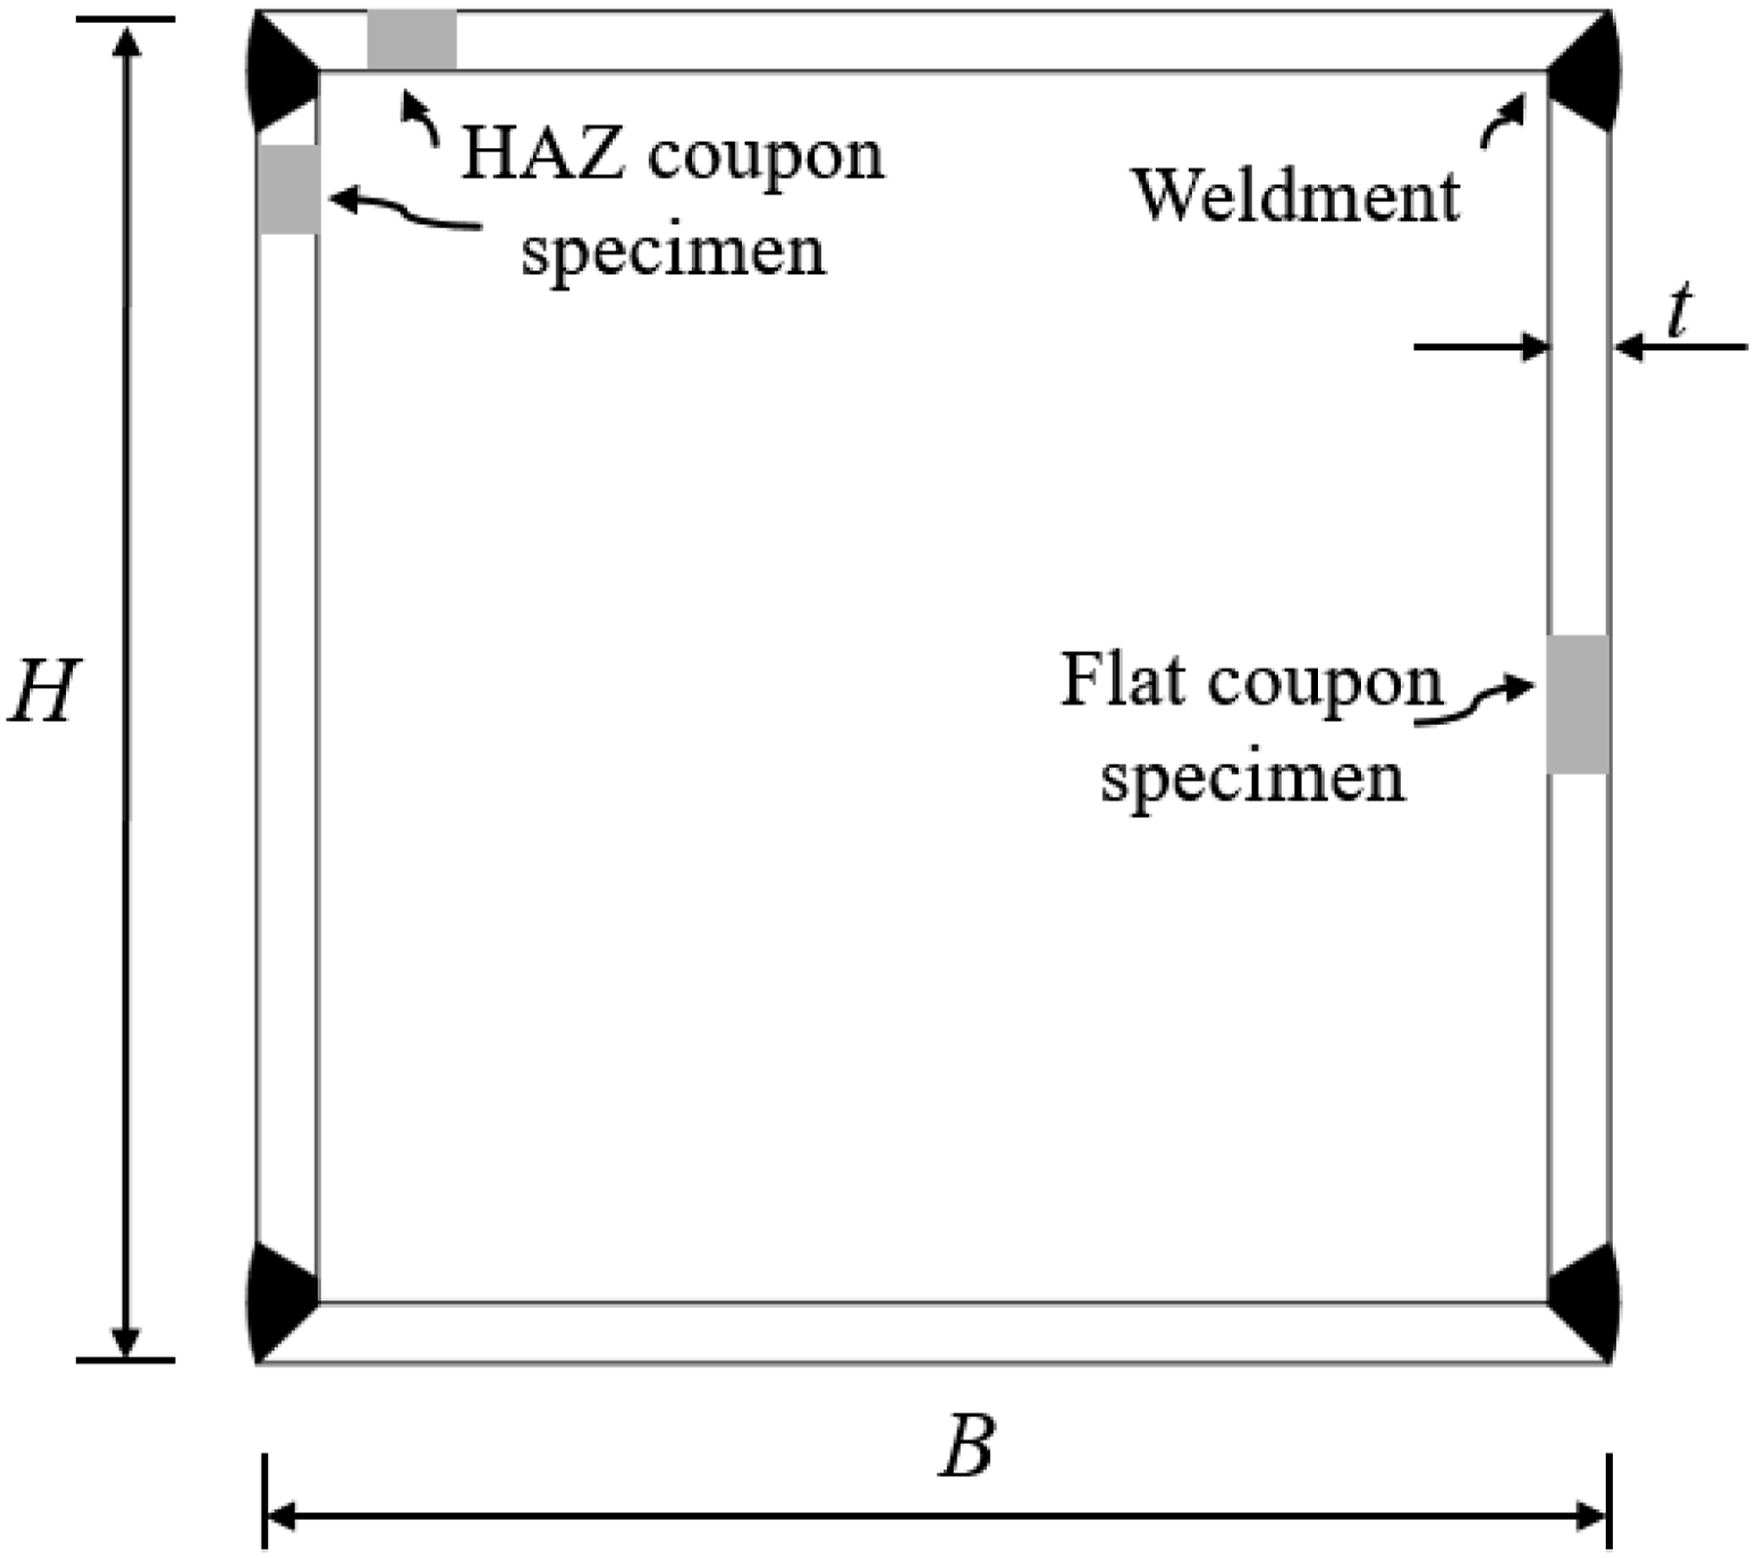
Geometry and definition of symbols and tensile coupon of Q1100 ultra-high strength steel (UHSS) welded box section.
Material properties
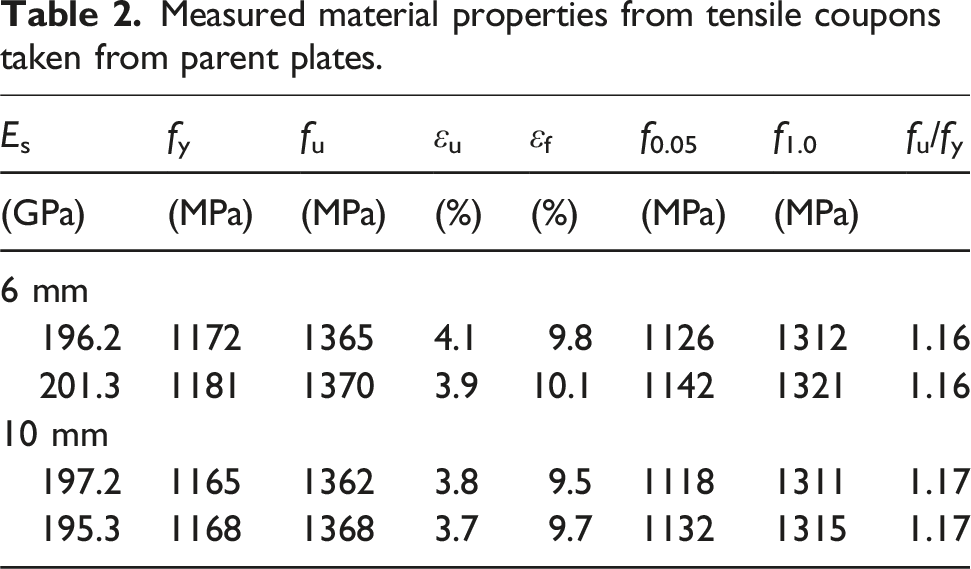
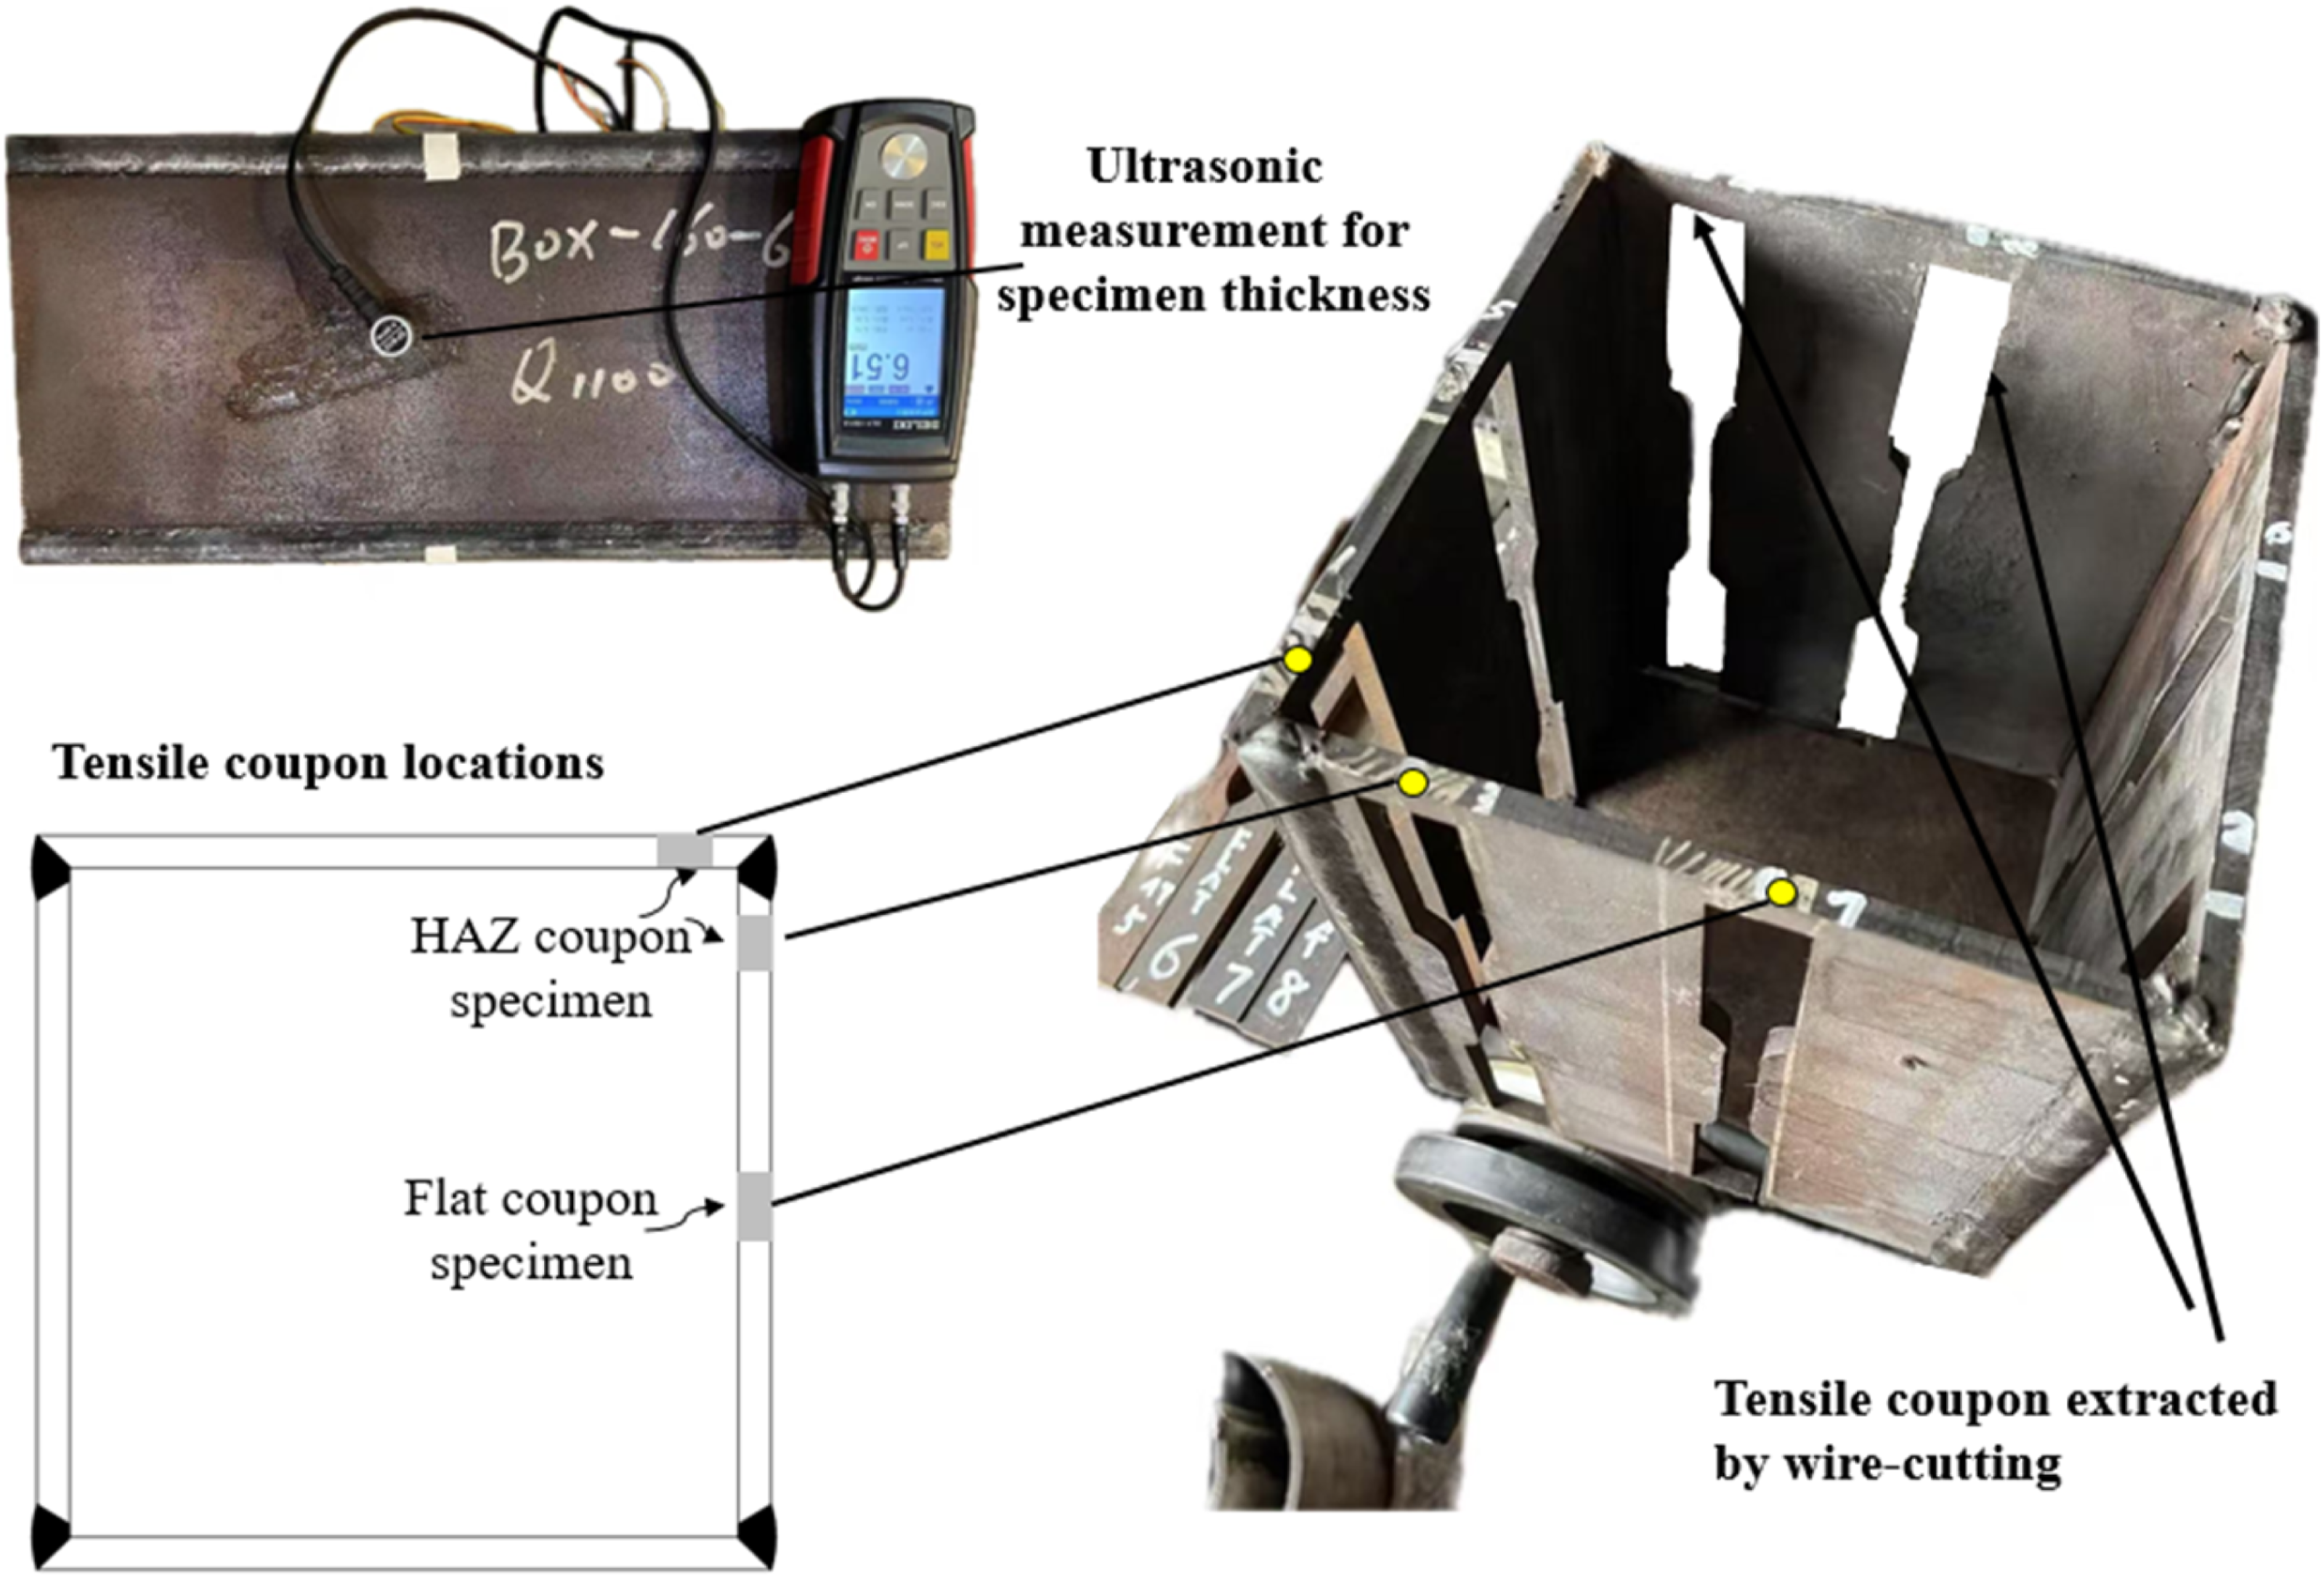
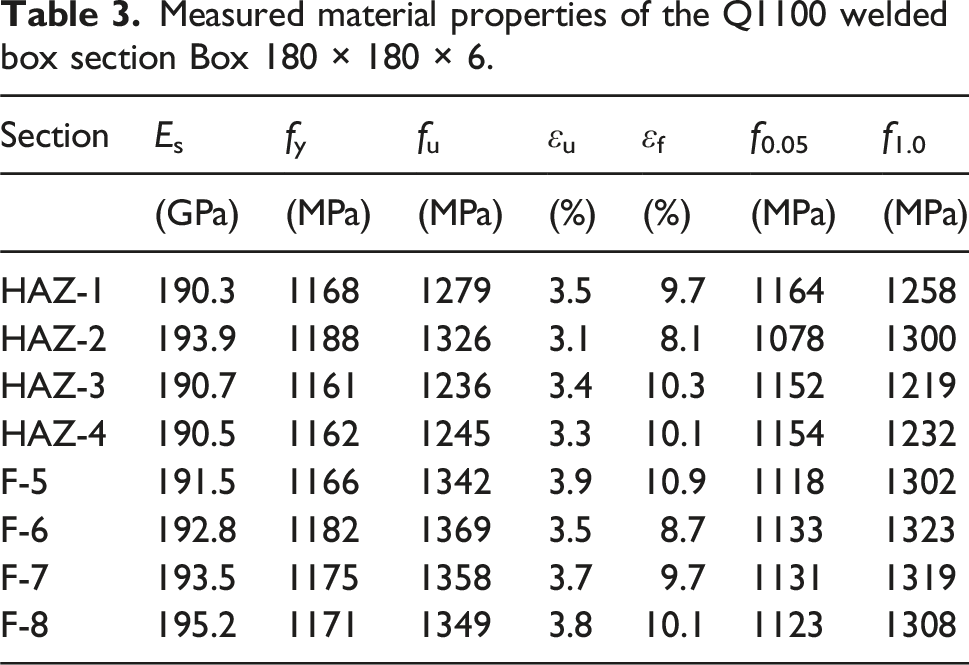
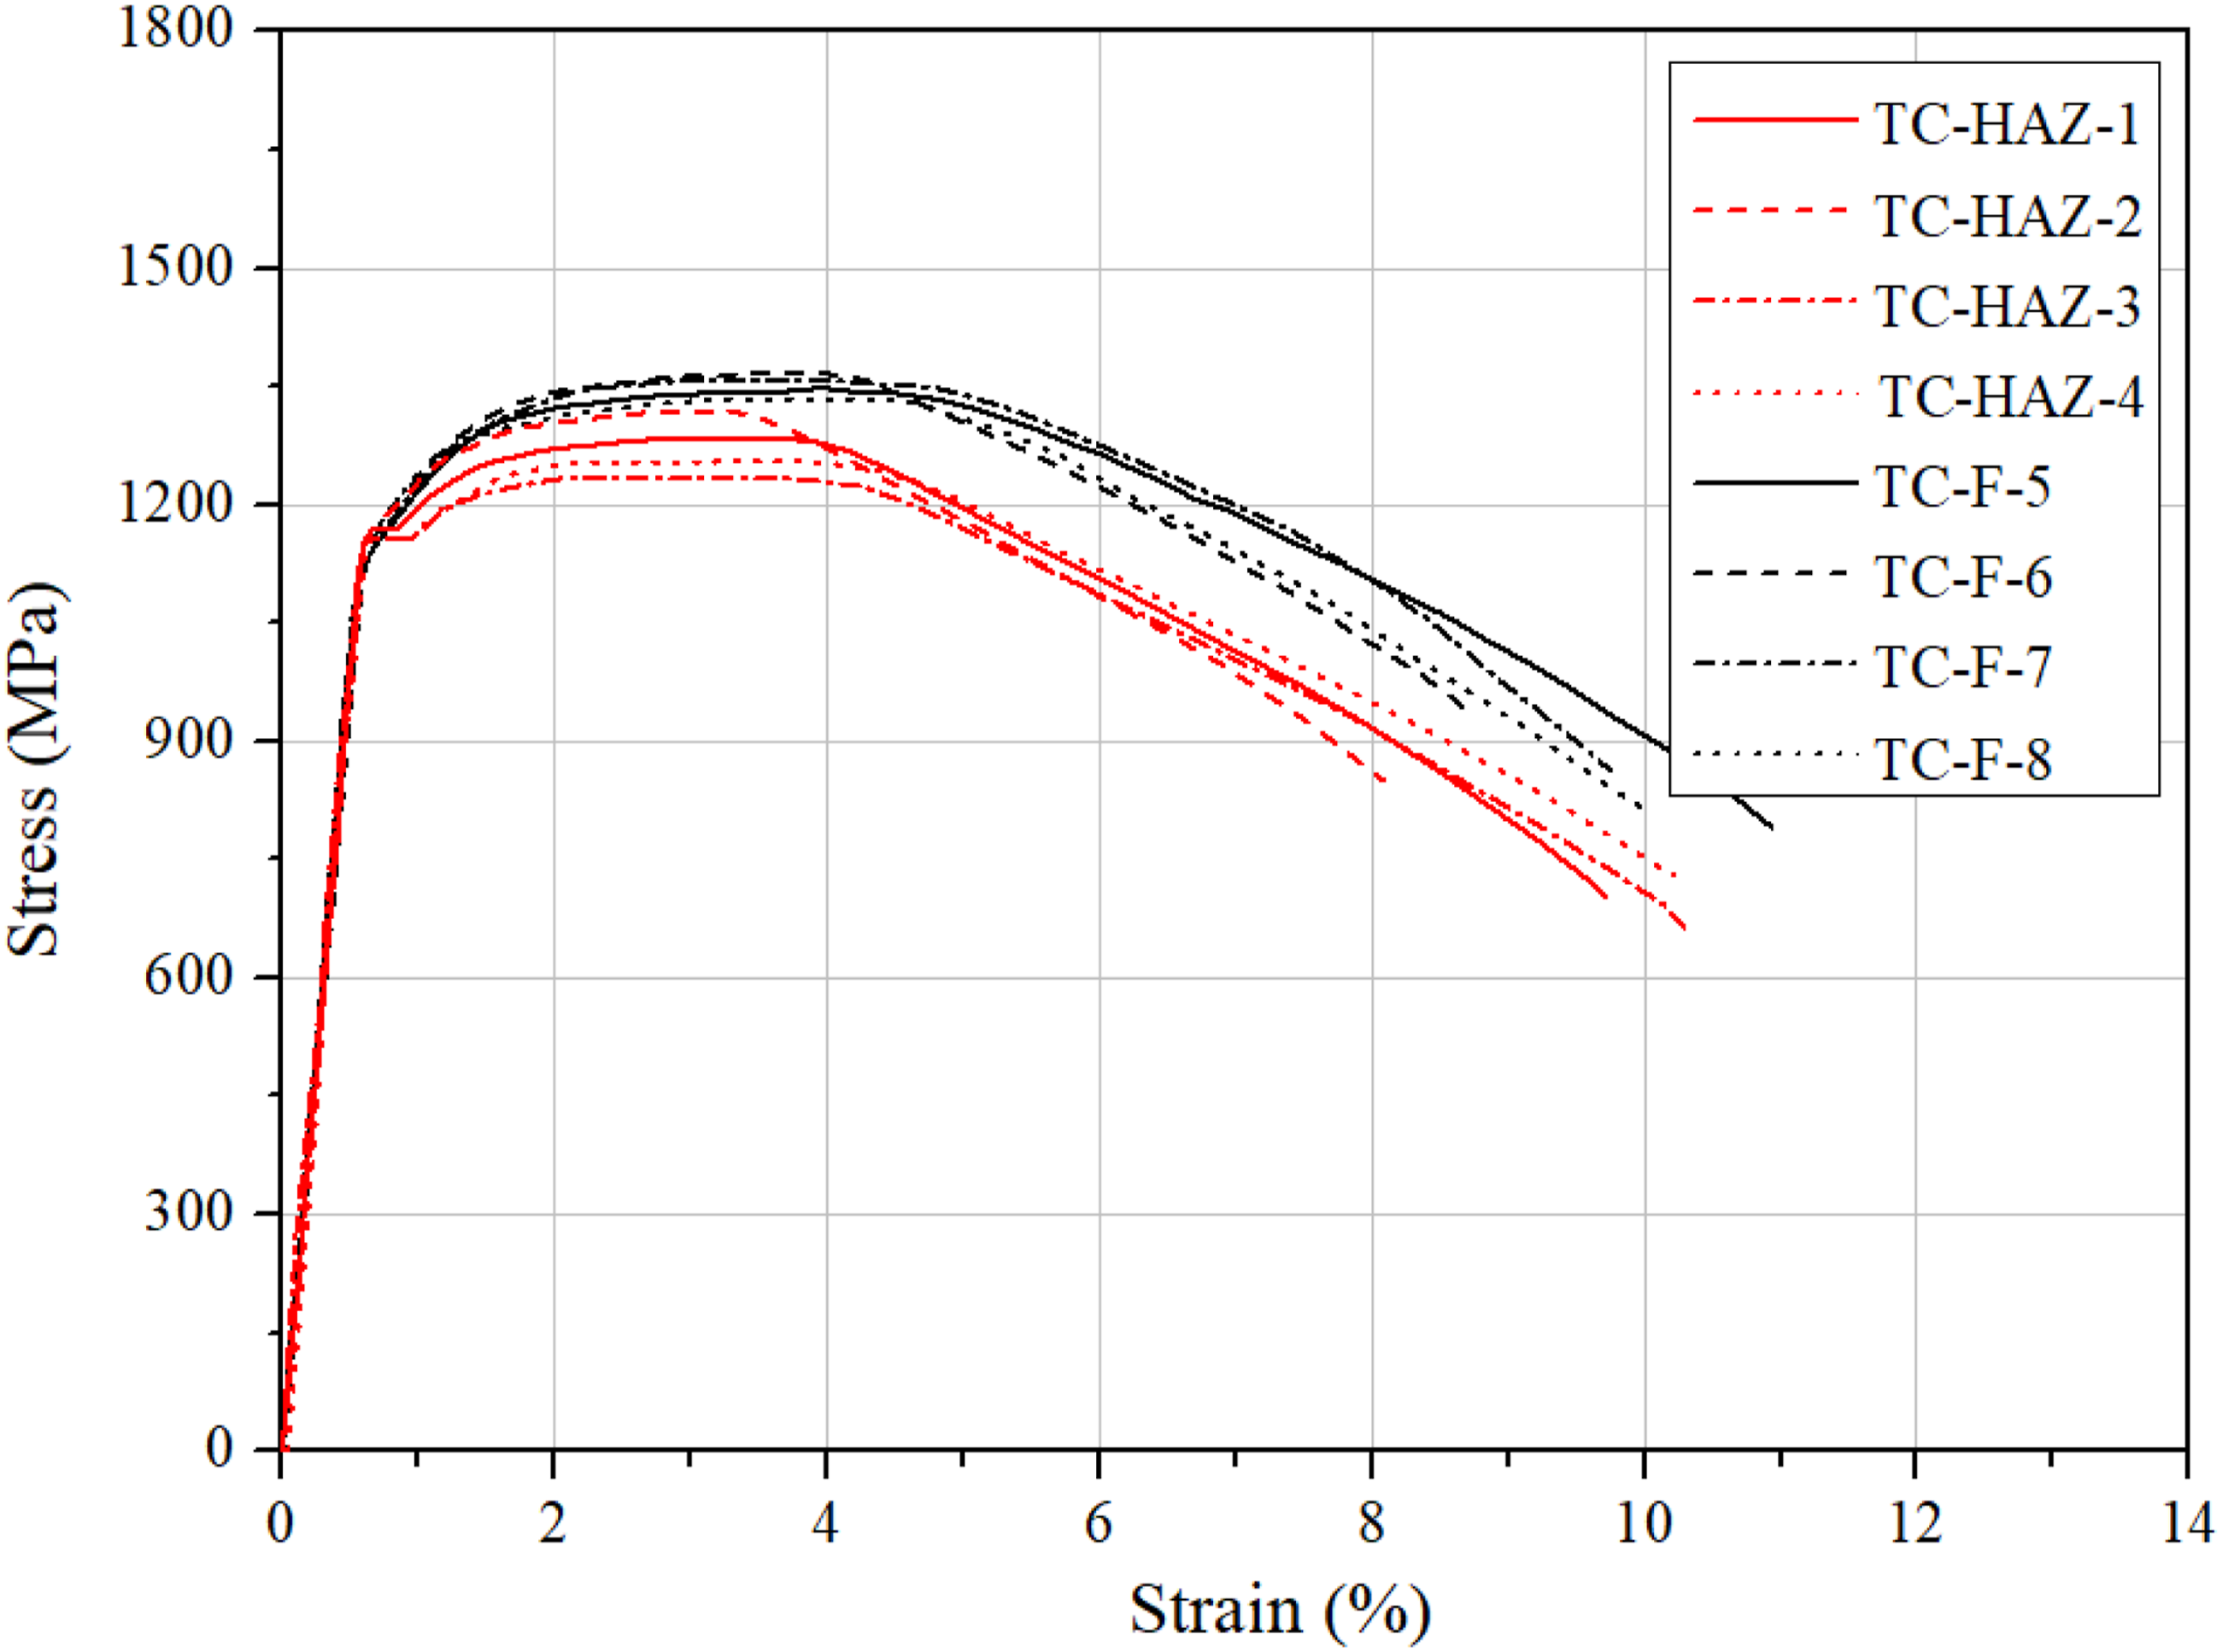
A systematic evaluation of the mechanical properties of the Q1100 UHSS welded box sections was conducted via standard tensile coupon tests. Following ISO EN ISO 6892-1, 2019 (ISO 2019), coupons were taken in the rolling direction to establish the full stress-strain curves. Tests were performed on a 100-kN hydraulic machine fitted with a non-contact video extensometer (Figure 2), from which key properties were derived encompassing elastic modulus (Es), 0.2% proof stress (used as the nominal yield strength in the absence of a yield plateau), 0.05% proof stress, 1.0% proof stress (indicating early strain hardening), ultimate tensile strength (fu), and fracture strain (εf). These data are summarised in Table 2. To assess the impact of welding, tests were also conducted on specimens from the base metal an the heat-affected zone (HAZ) of a Box 180 × 180 × 6 section. Wire electrical discharge machining (EDM) was used to precisely cut flat coupons from regions unaffected by welding (≥50 mm from the weld) to determine the base material properties, while HAZ coupons were taken close to the weld toes to capture the maximum material property degradation (Figure 3). As shown in Table 3 and Figure 4, the HAZ specimens exhibited an average 6.1% decrease in ultimate strength, a consequence of microstructural changes and residual stresses from the welding thermal cycle, demonstrating the significant influence of the welding process. The base metal coupons are labelled “F”, and those from the HAZ are labelled “HAZ” (e.g., F-5 denotes the fifth base metal coupon). Test set-up for tensile coupon specimen. Measured material properties from tensile coupons taken from parent plates. Locations of tensile coupons machined from Q1100 ultra-high strength steel welded box section Box 180 × 180 × 6. Measured material properties of the Q1100 welded box section Box 180 × 180 × 6. Measured stress-strain curves of tensile coupons from Q1100 ultra-high strength steel welded box section Box 180 × 180 × 6.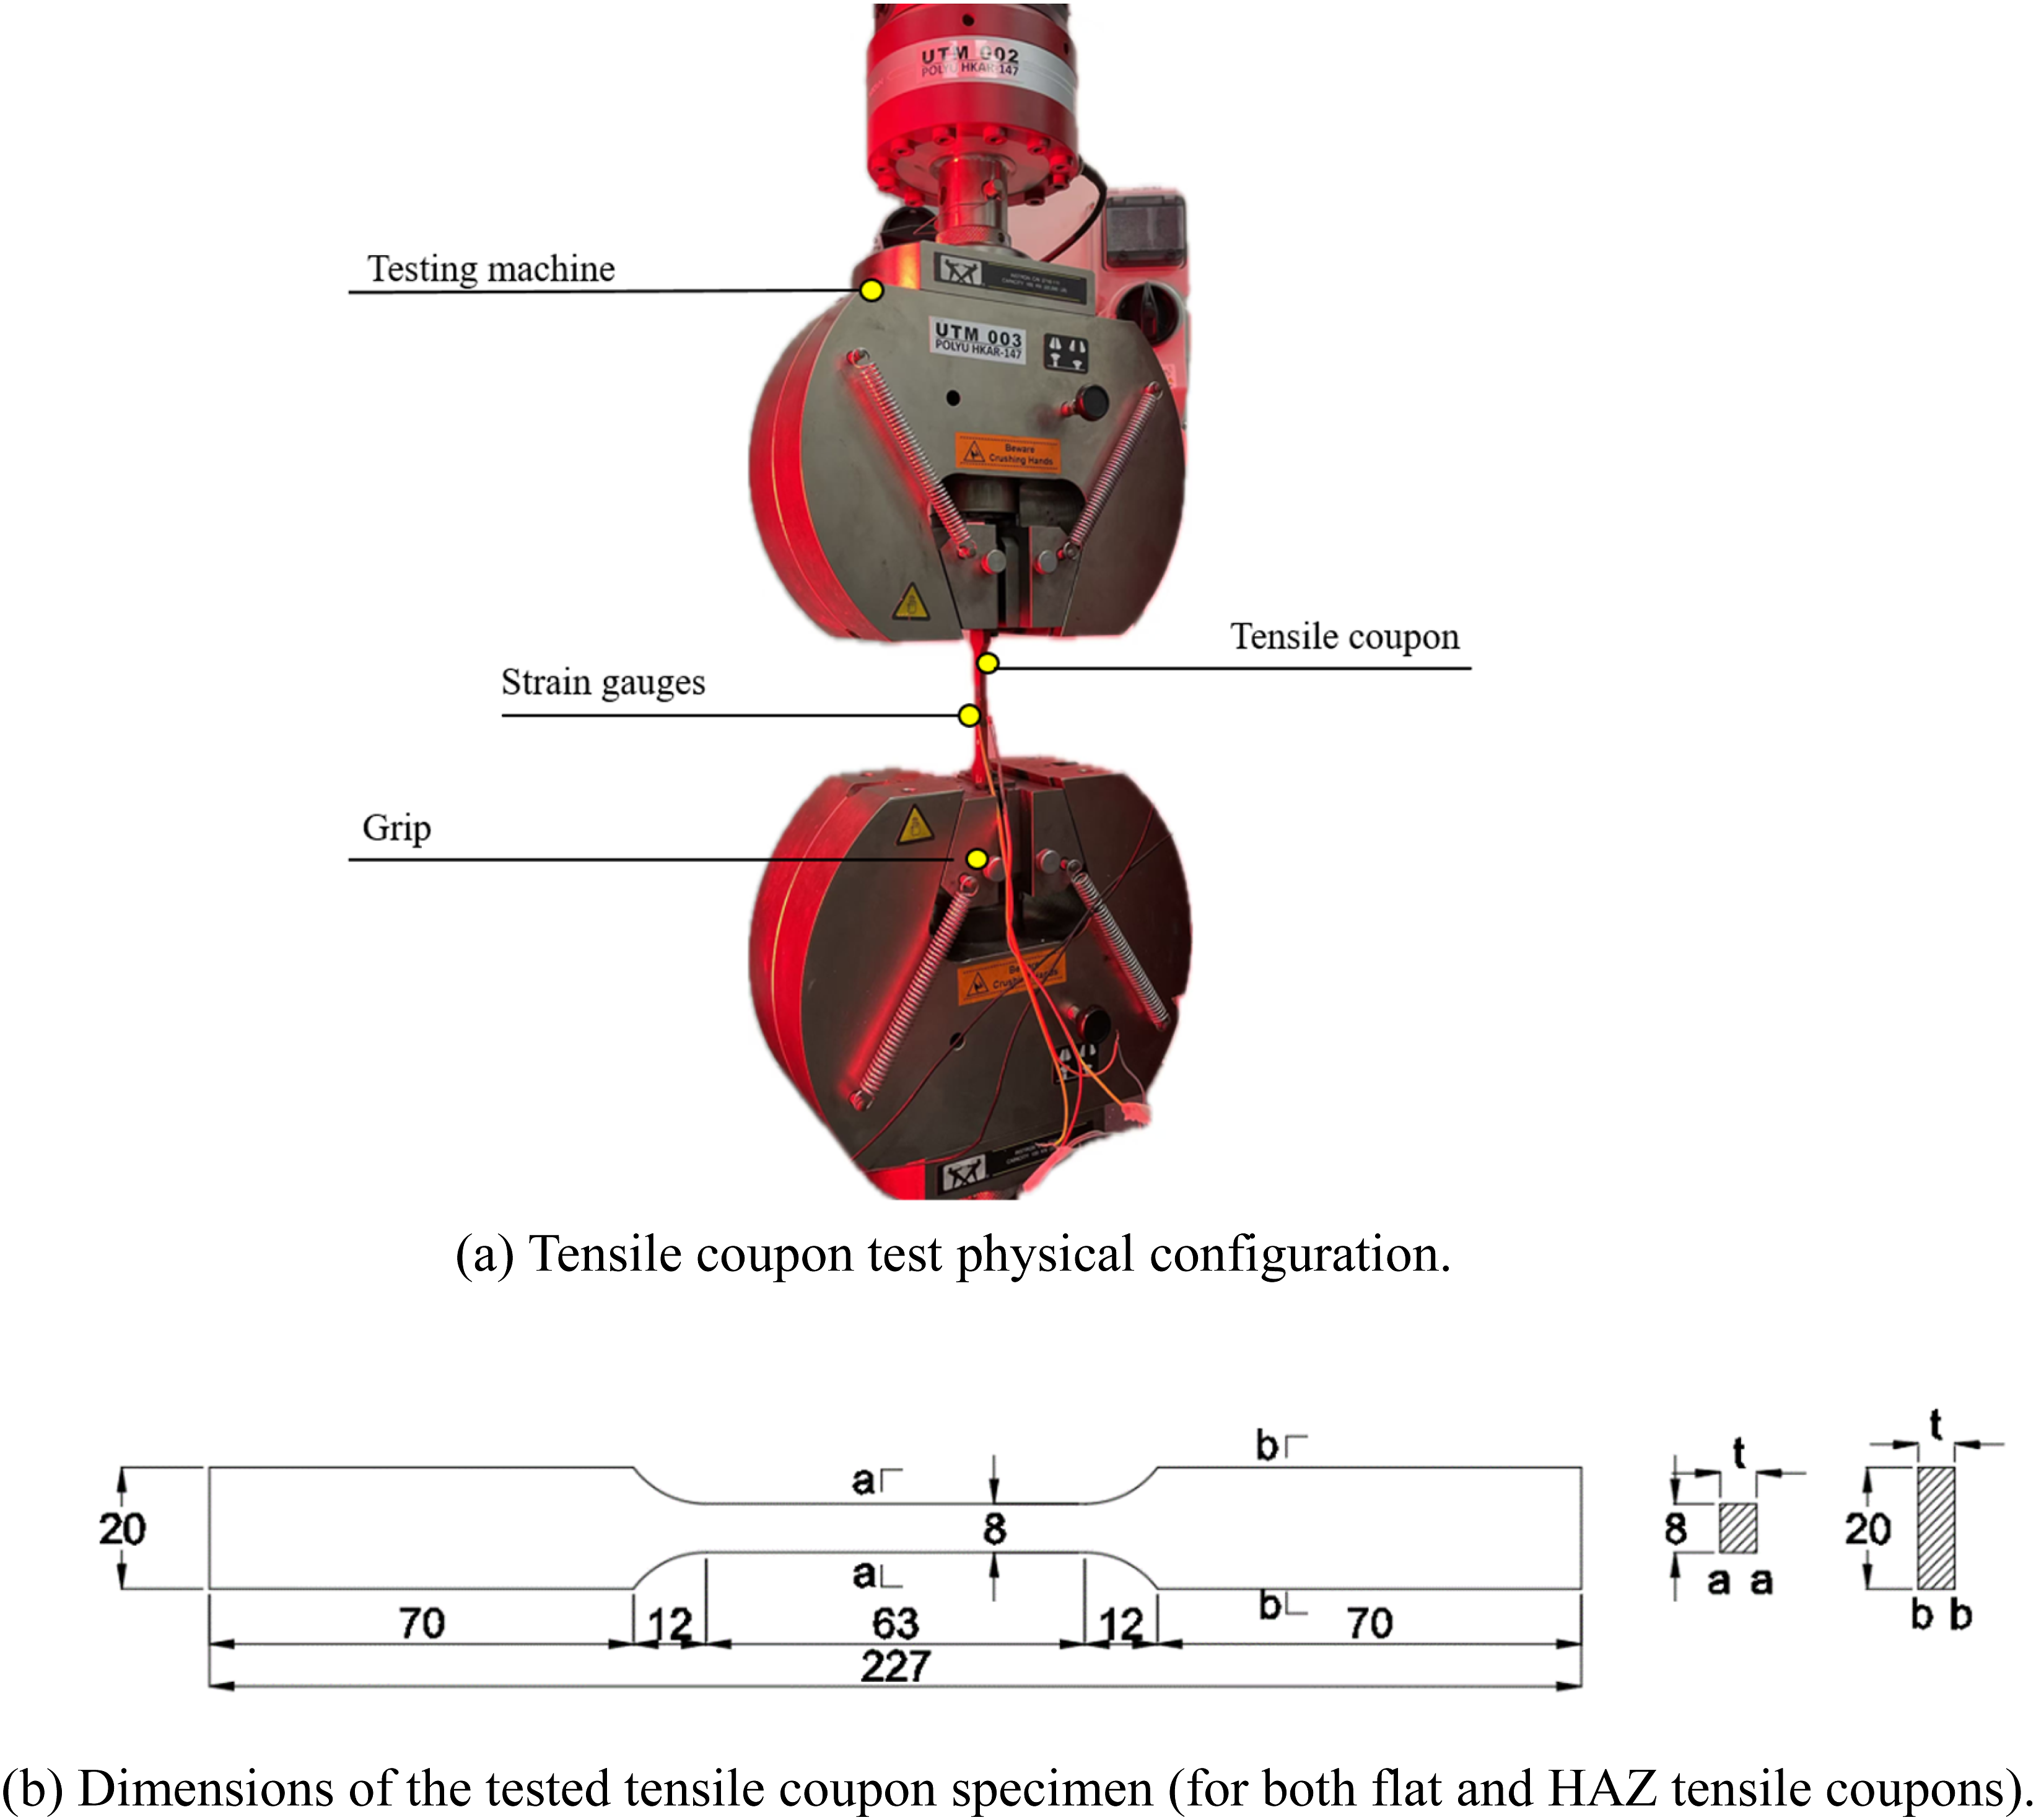
Residual stresses
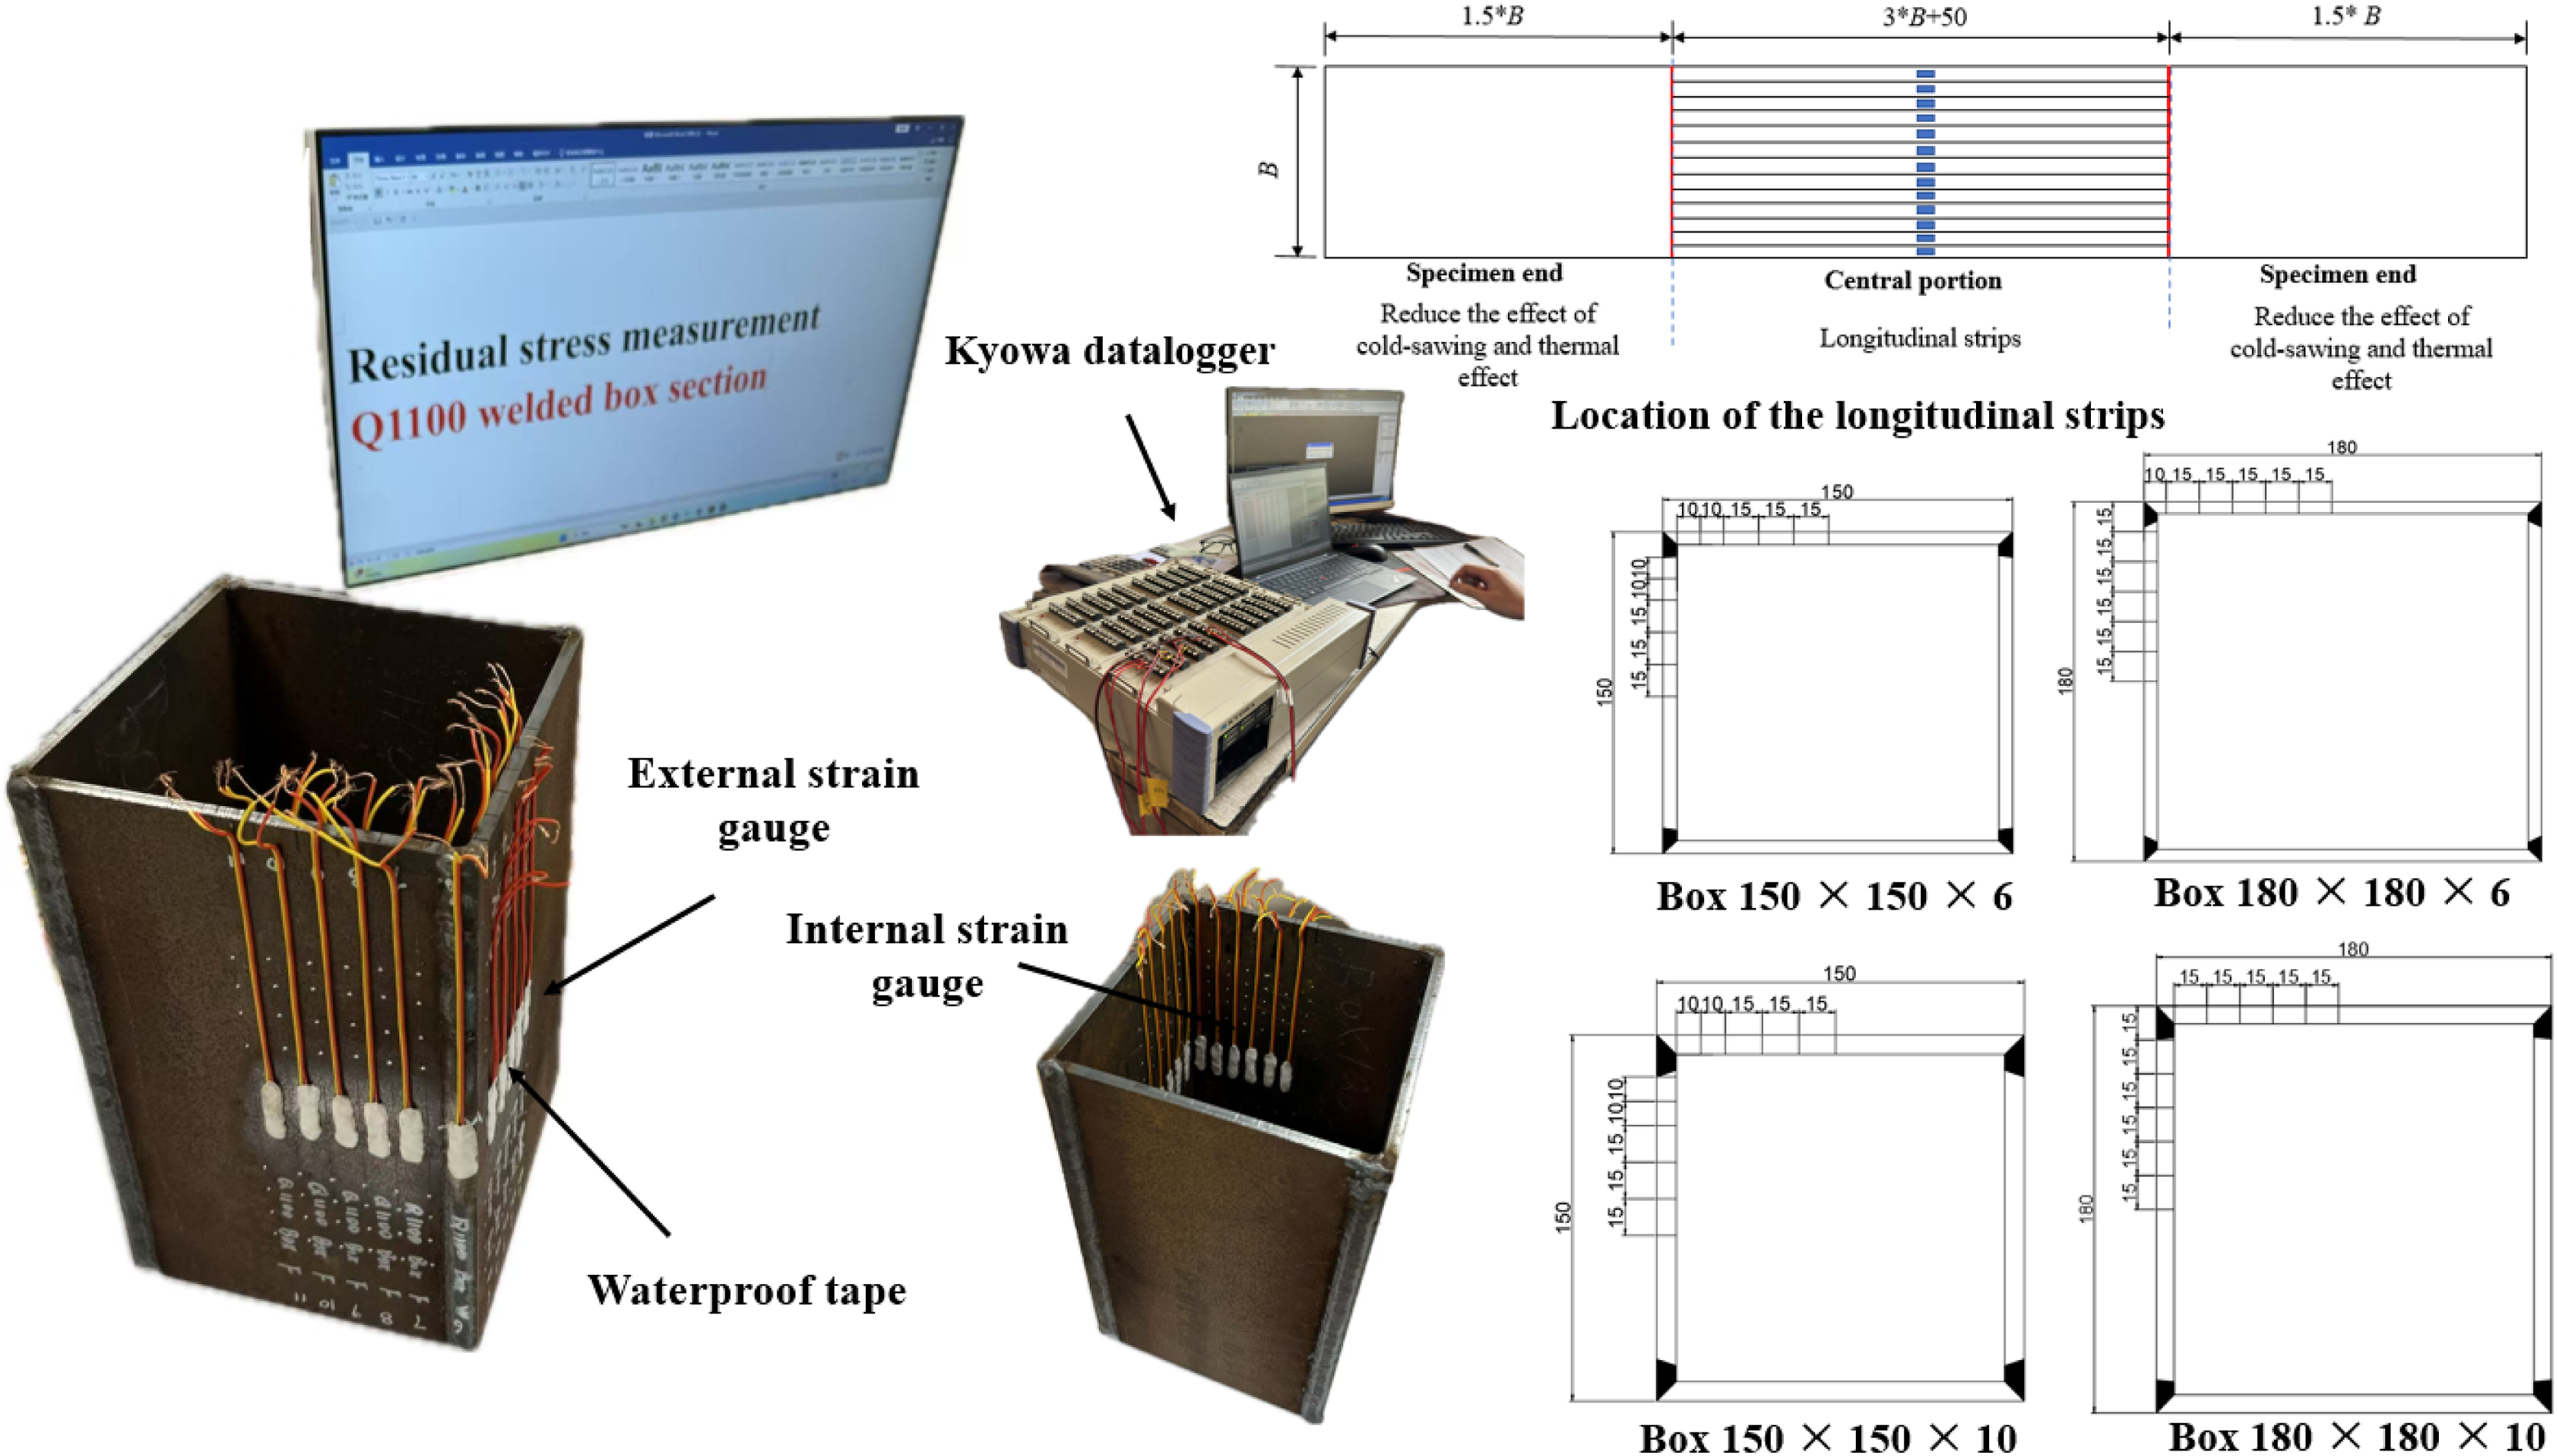
In UHSS structures, the welding process creates intricate residual stress fields as a result of non-uniform heating and cooling cycles that cause differential thermal expansion and contraction (Liu et al., 2022b, 2022c, 2023). These locked-in stresses originate from two main sources: the constraint to thermal contraction provided by the surrounding cooler material and the shrinkage of the weld metal along the weld line (Chen and Chan, 2020; Chen et al., 2024; Xu et al., 2024). The resultant stress field includes both membrane (constant through the thickness) and bending (linearly varying) components, which can collectively affect structural performance and lead to premature failure. The sectioning method was used in this study to quantify the residual stresses in the Q1100 UHSS welded box sections. This technique involves cutting the specimen to relieve locked-in strains, which are recorded using strategically placed strain gauges (Figure 5). The residual stresses measurements involved the following six main steps: (i) The central portion of the section was cut from the UHSS section columns, with a length of (3B + 50) mm, and a distance to the section ends was determined in accordance with the recommendation in (Tebedge and Tall, 1973) that an end distance of 1.5–2.0 times the section width, as shown in Figure 5 and then (ii) A smaller length of 300 mm was extracted by wire-cutting, which is considered to be sufficient to reduce the end effects as well as the cutting operation that may alter the residual stress pattern (Liu et al. (2024a) (iii) The strain gauges were equipped to the examined specimens, of which the strain gauges were attached in pairs on the opposite leg sides covered with waterproof protection materials, with an aim to ensure that the strain gauges may not be damaged during the sectioning process (iv) The readings of strain gauges were recorded prior to the cutting process, it should be noted that three times readings (the largest deviations within ± 20με) were taken and the mean value was used for subsequent analysis (v) These sections were sliced into long strips with widths of 10 mm and 15 mm according to the expected stress gradient, see Figure 5 and then (vi) After the completion of the sectioning process, the released residual stresses induced by manufacturing process were taken on the basis of the readings from strain gauges. The interlocked released residual strains on the external and inter surfaces of each cut strips comprising the UHSS welded box sections were calculated based upon the differences between the strain before and after the sectioning process, by which subtracting the initial strain readings from the final readings, the residual strains can be determined. The membrane residual stress component was calculated from the average strain change and the material’s Young’s modulus is taken as the mean measured Young’s modulus from the corresponding parent plates, as per equation (1), while the bending component was derived from the strain difference between the outer and inner surfaces, following equation (2). Arrangements of the strain gauges for residual stress measurements for ultra-high strength steel (UHSS) welded box sections.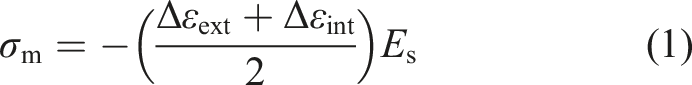
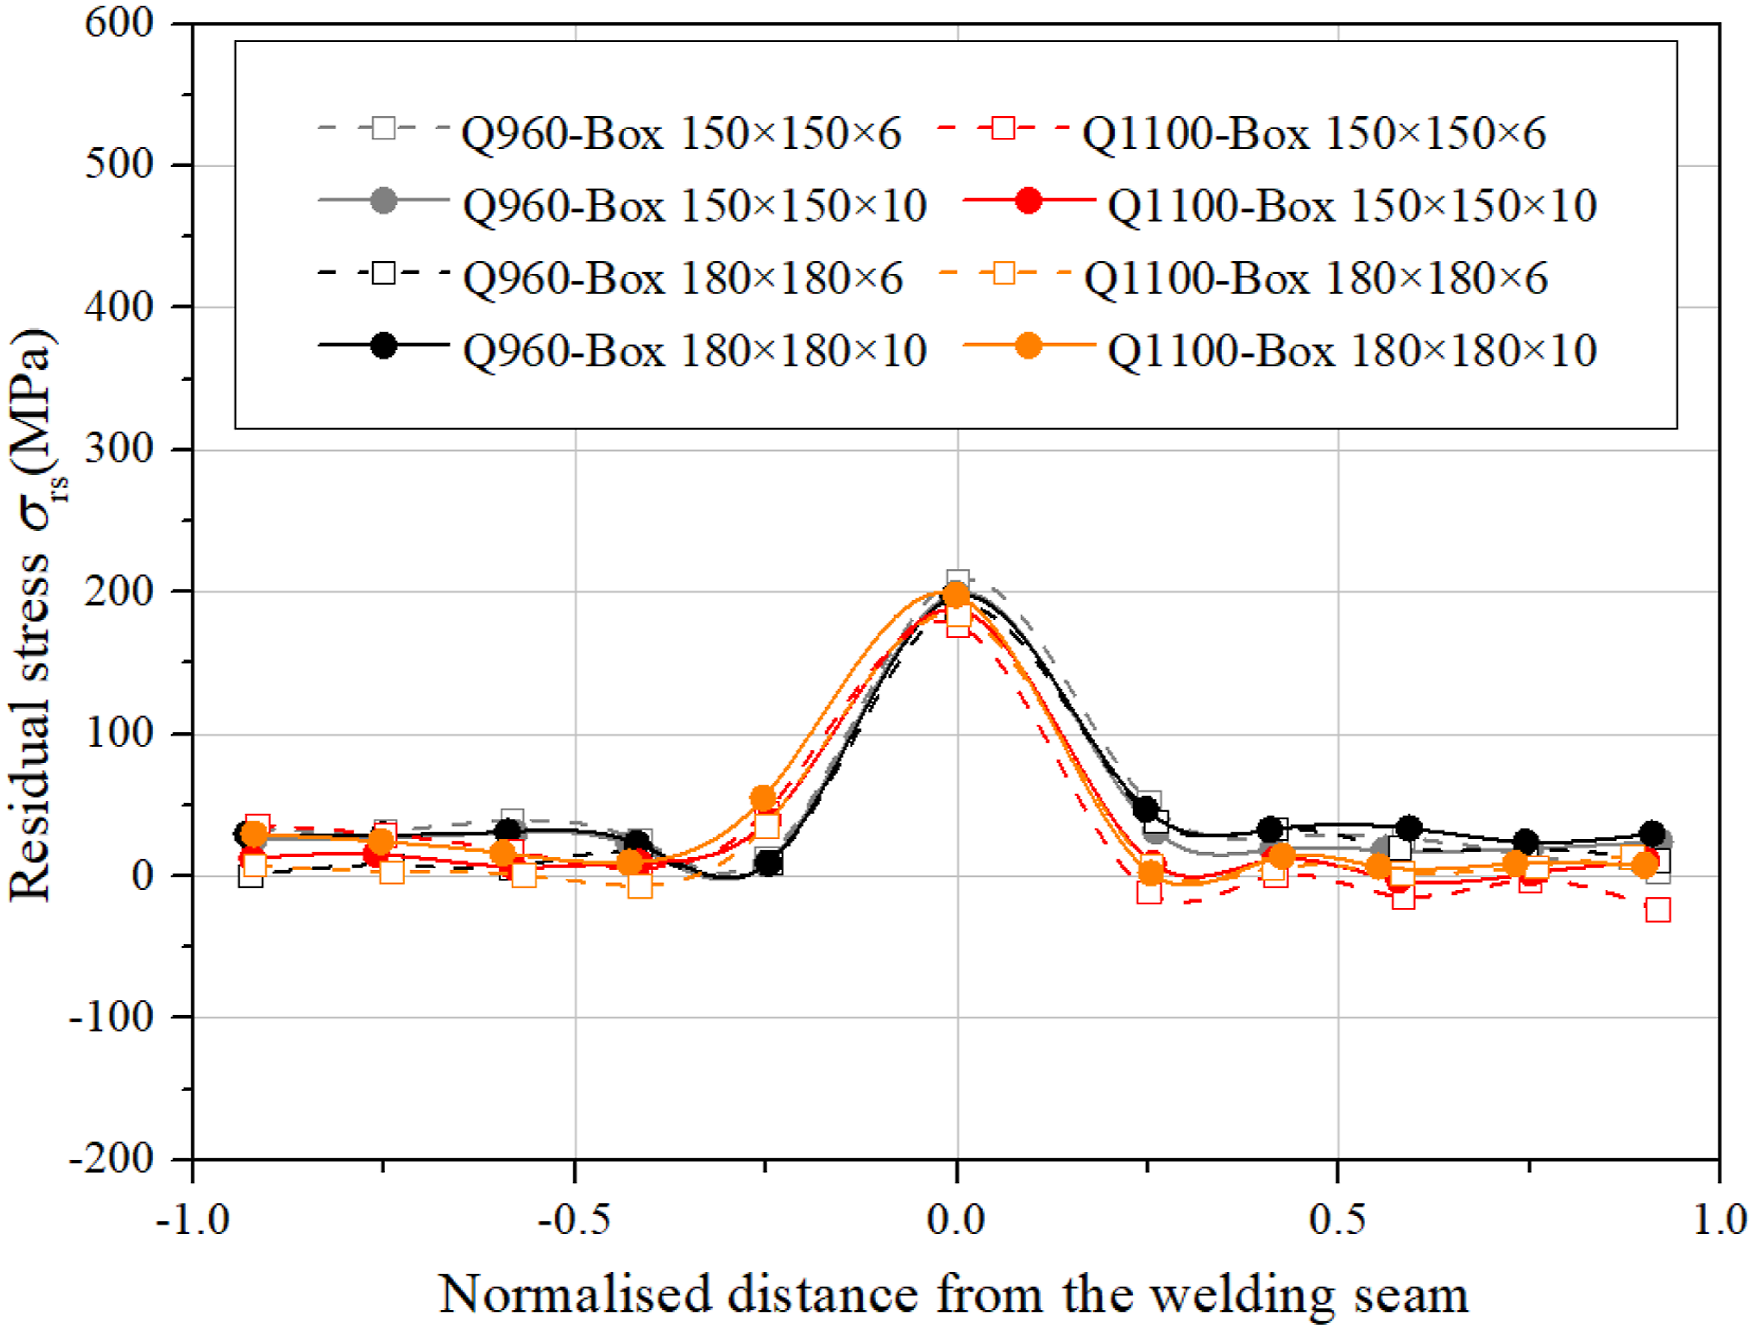
Measurements indicated that the maximum tensile stress, found in the Box 150 × 150 × 10 section near the weld, was 409.5 MPa, equivalent to 37.2% of the nominal yield strength (see Figure 6). This tensile stress diminished with distance from the HAZ, eventually becoming compressive. Bending stresses reached a maximum of 197.9 MPa (20.0% of nominal yield strength) in the Box 180×180 × 6 section, displaying a similar spatial decay, as illustrated in Figure 7. Distribution of the measured membrane residual stresses in Q960 (Liu et al., 2025b) and Q1100 ulta-high strength steel welded box section. Distribution of the measured bending residual stresses in Q960 (Liu et al., 2025b) and Q1100 ultra-high strength steel welded box section.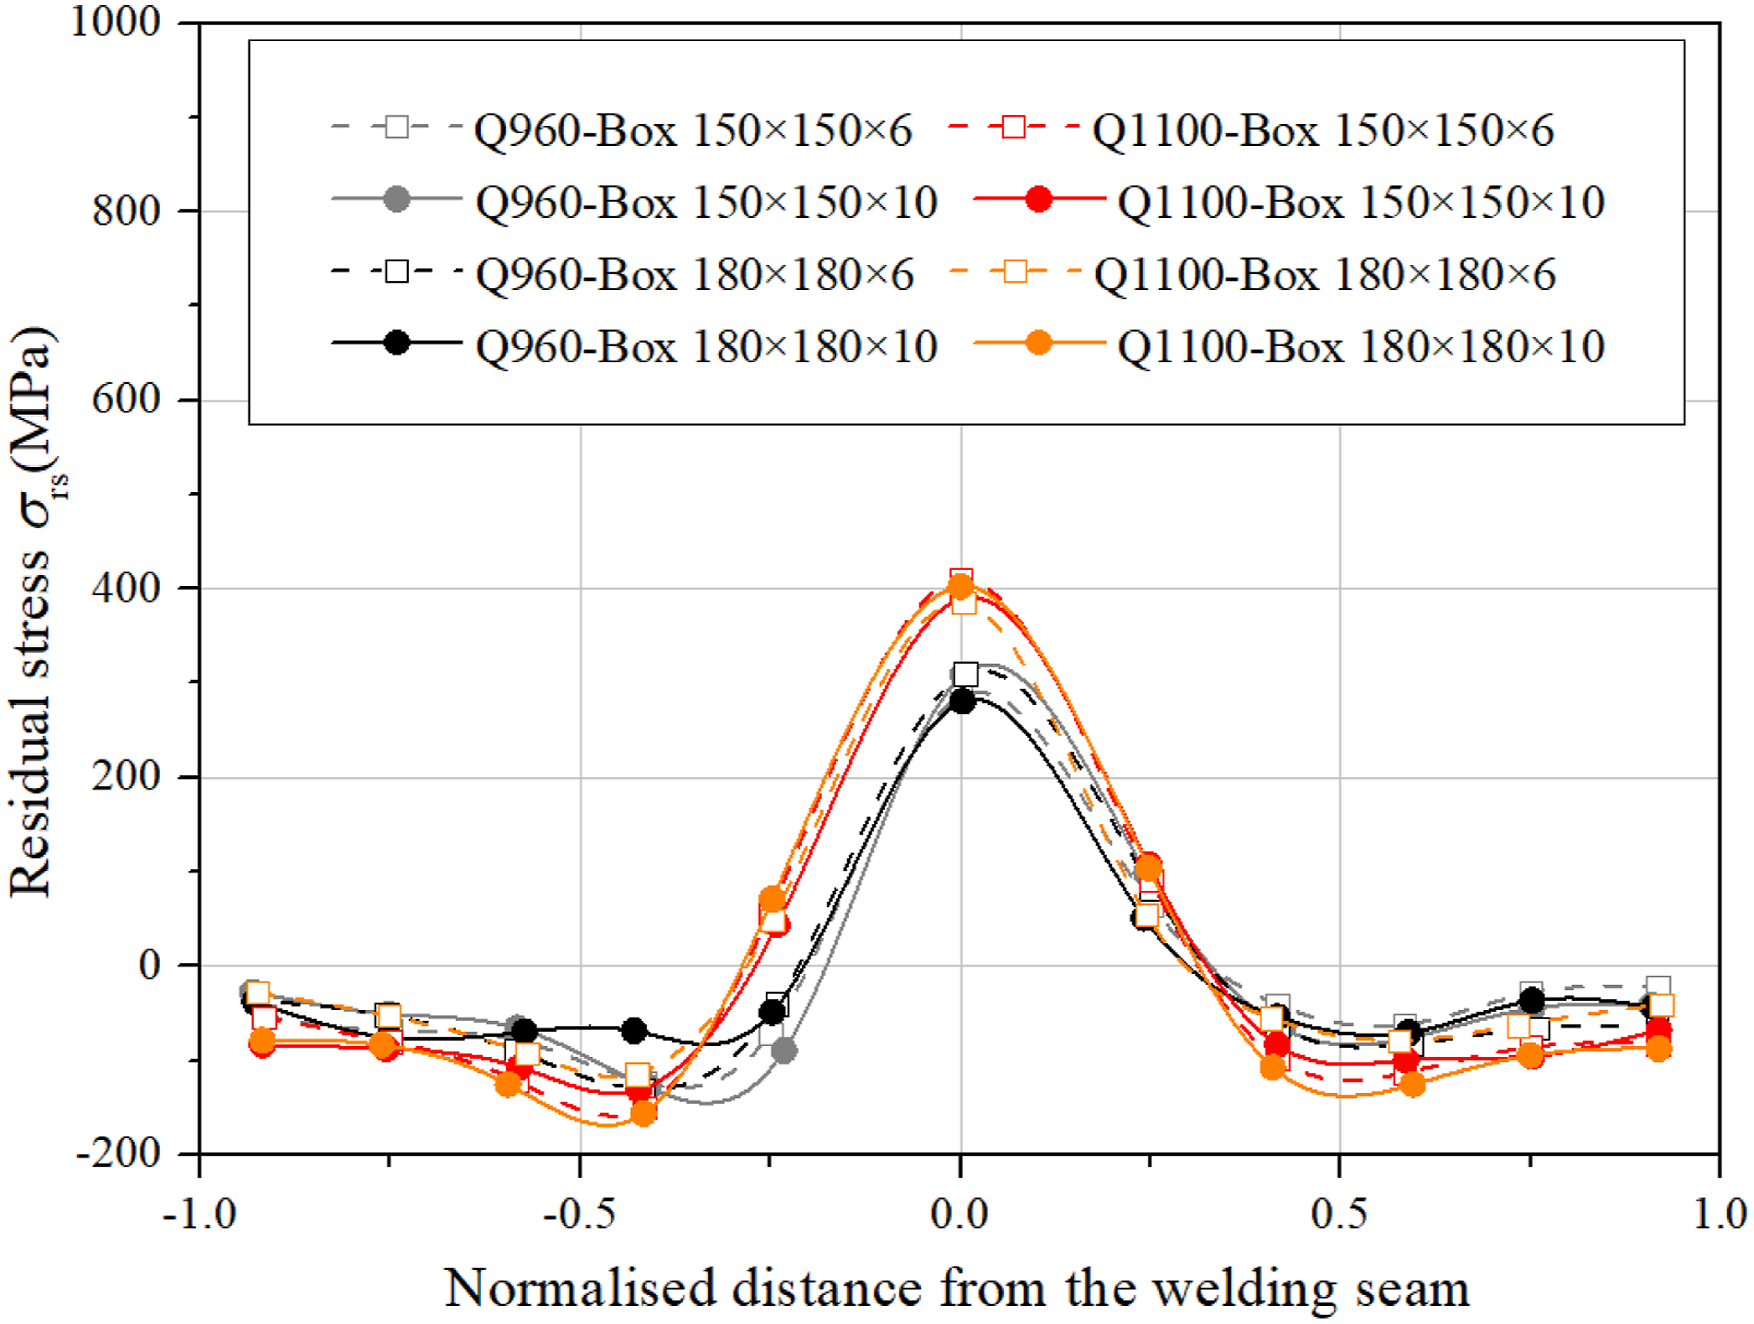
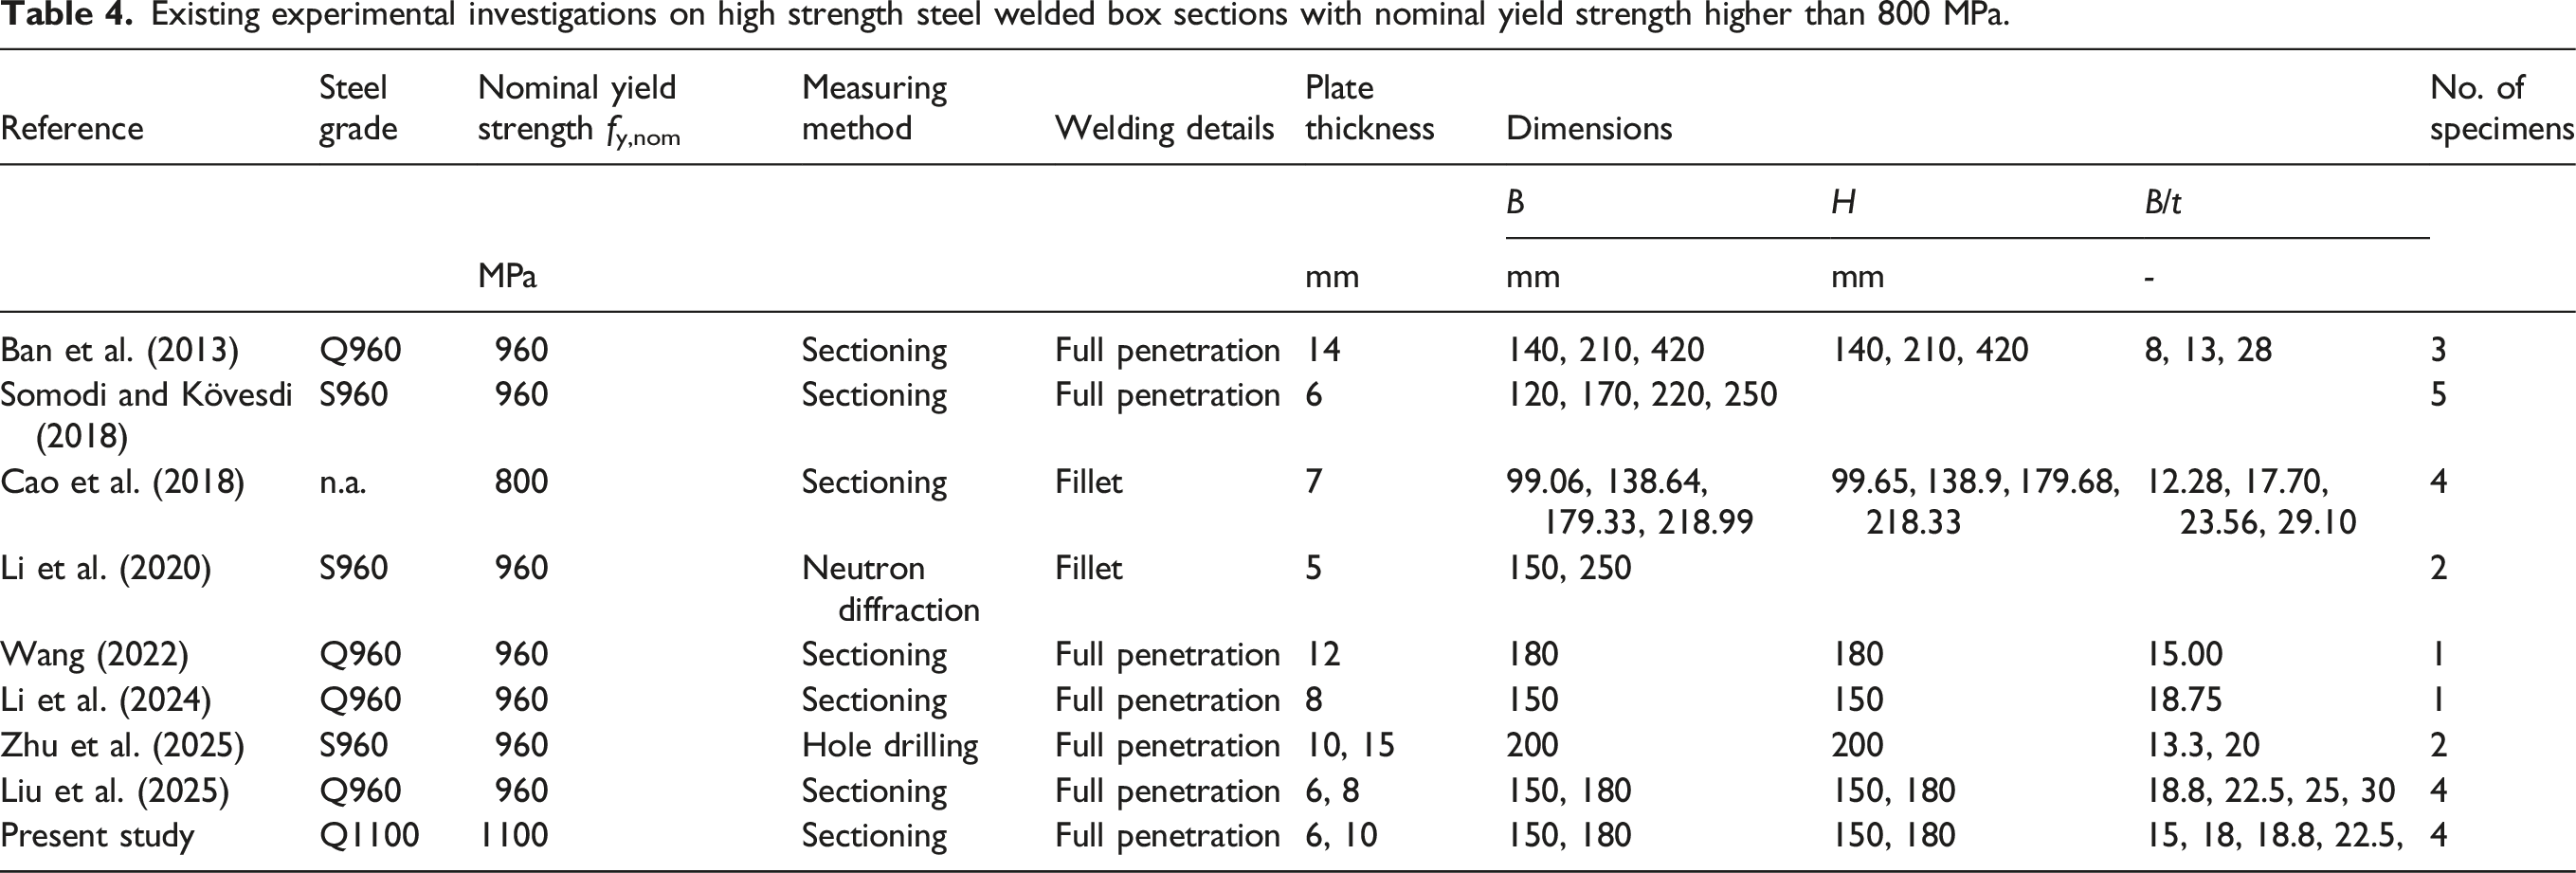
Existing experimental investigations on high strength steel welded box sections with nominal yield strength higher than 800 MPa.
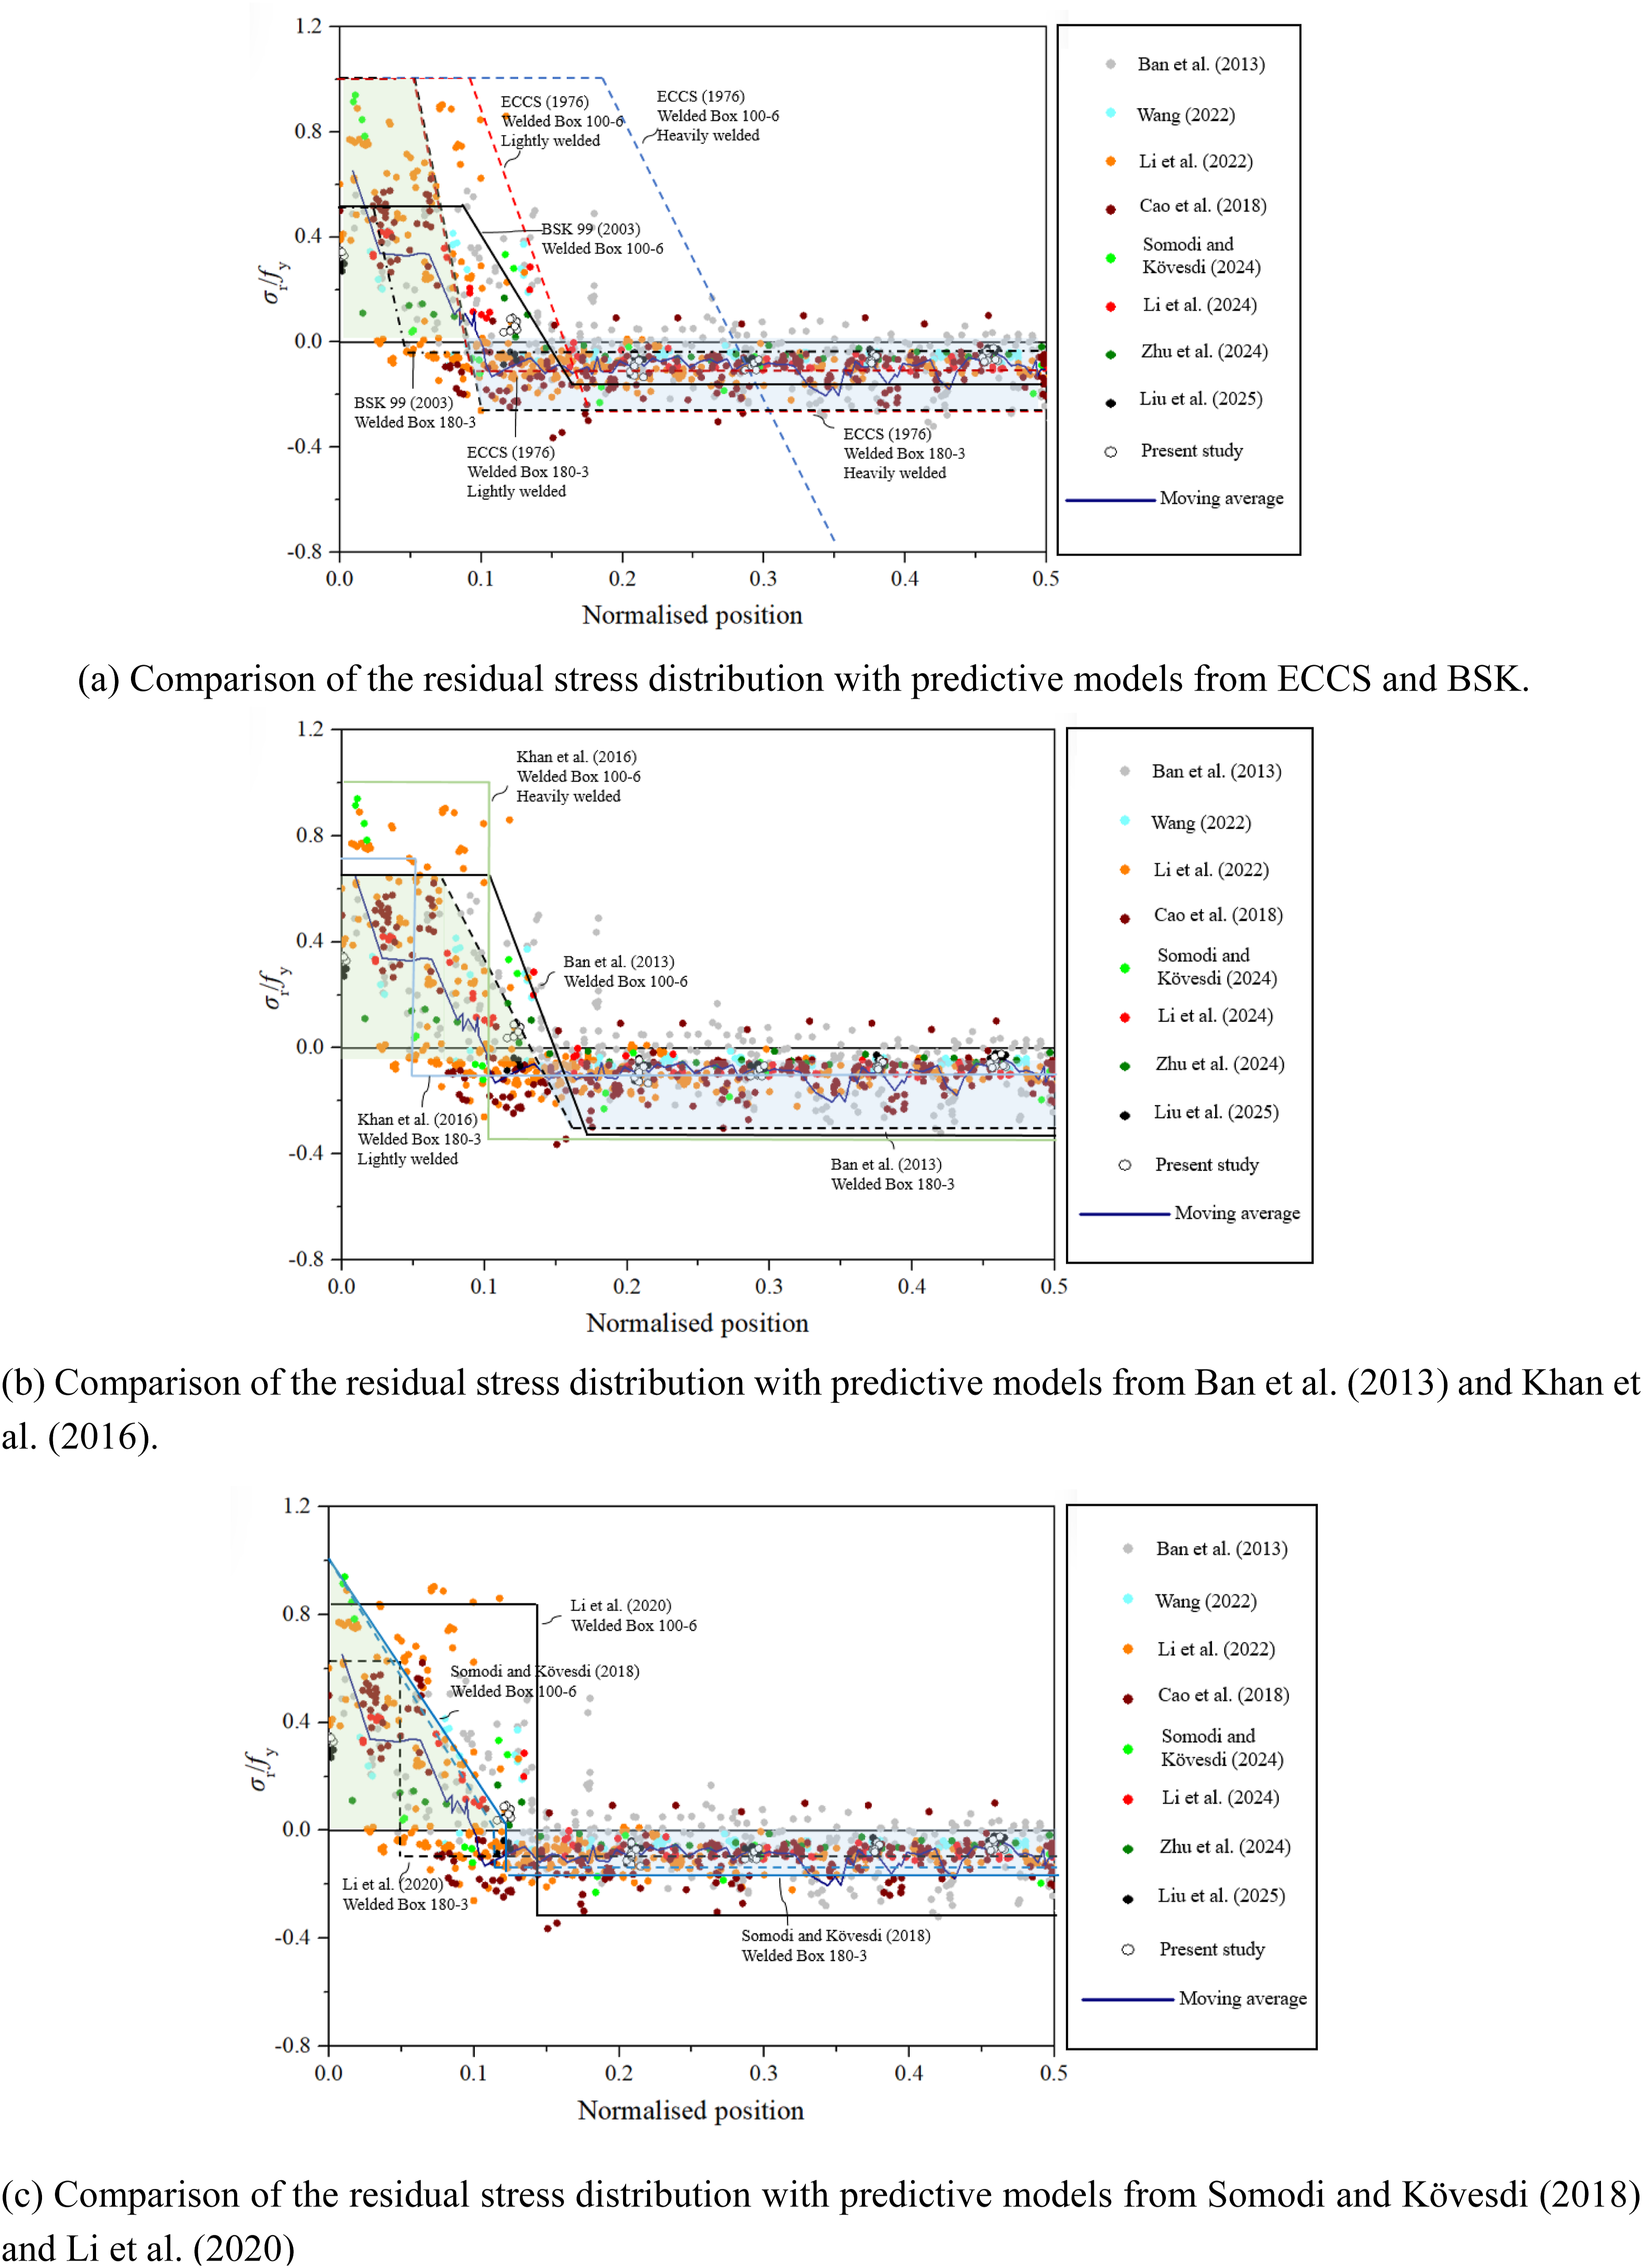
Comparison of the distribution of the measured membrane residual stresses in HSS welded box section with the existing residual stress models.
Graphical comparisons reveal key insights into model performance. The ECCS (1976) model, based on conventional steel data, consistently over-predicts tensile stresses and shows high scatter. The BSK 99 model agrees reasonably with test data for the stocky Box 100 × 100 × 6 section but under-predicts stresses for the slender Box 180 × 180 × 3 section. The model from Khan et al. (2016), though generally safe, does not capture the smooth transition from tension to compression seen in tests. Similarly, Somodi and Kövesdi’s (2018) model incorrectly predicts a sharp discontinuity in tensile stress at the weld, contrary to the measured gradual decay. Among the models evaluated, the predictive model from Ban et al. (2013) performed best, accurately reproducing both the magnitude and distribution of residual stresses in the Q1100 UHSS welded box sections.
Initial geometric imperfection
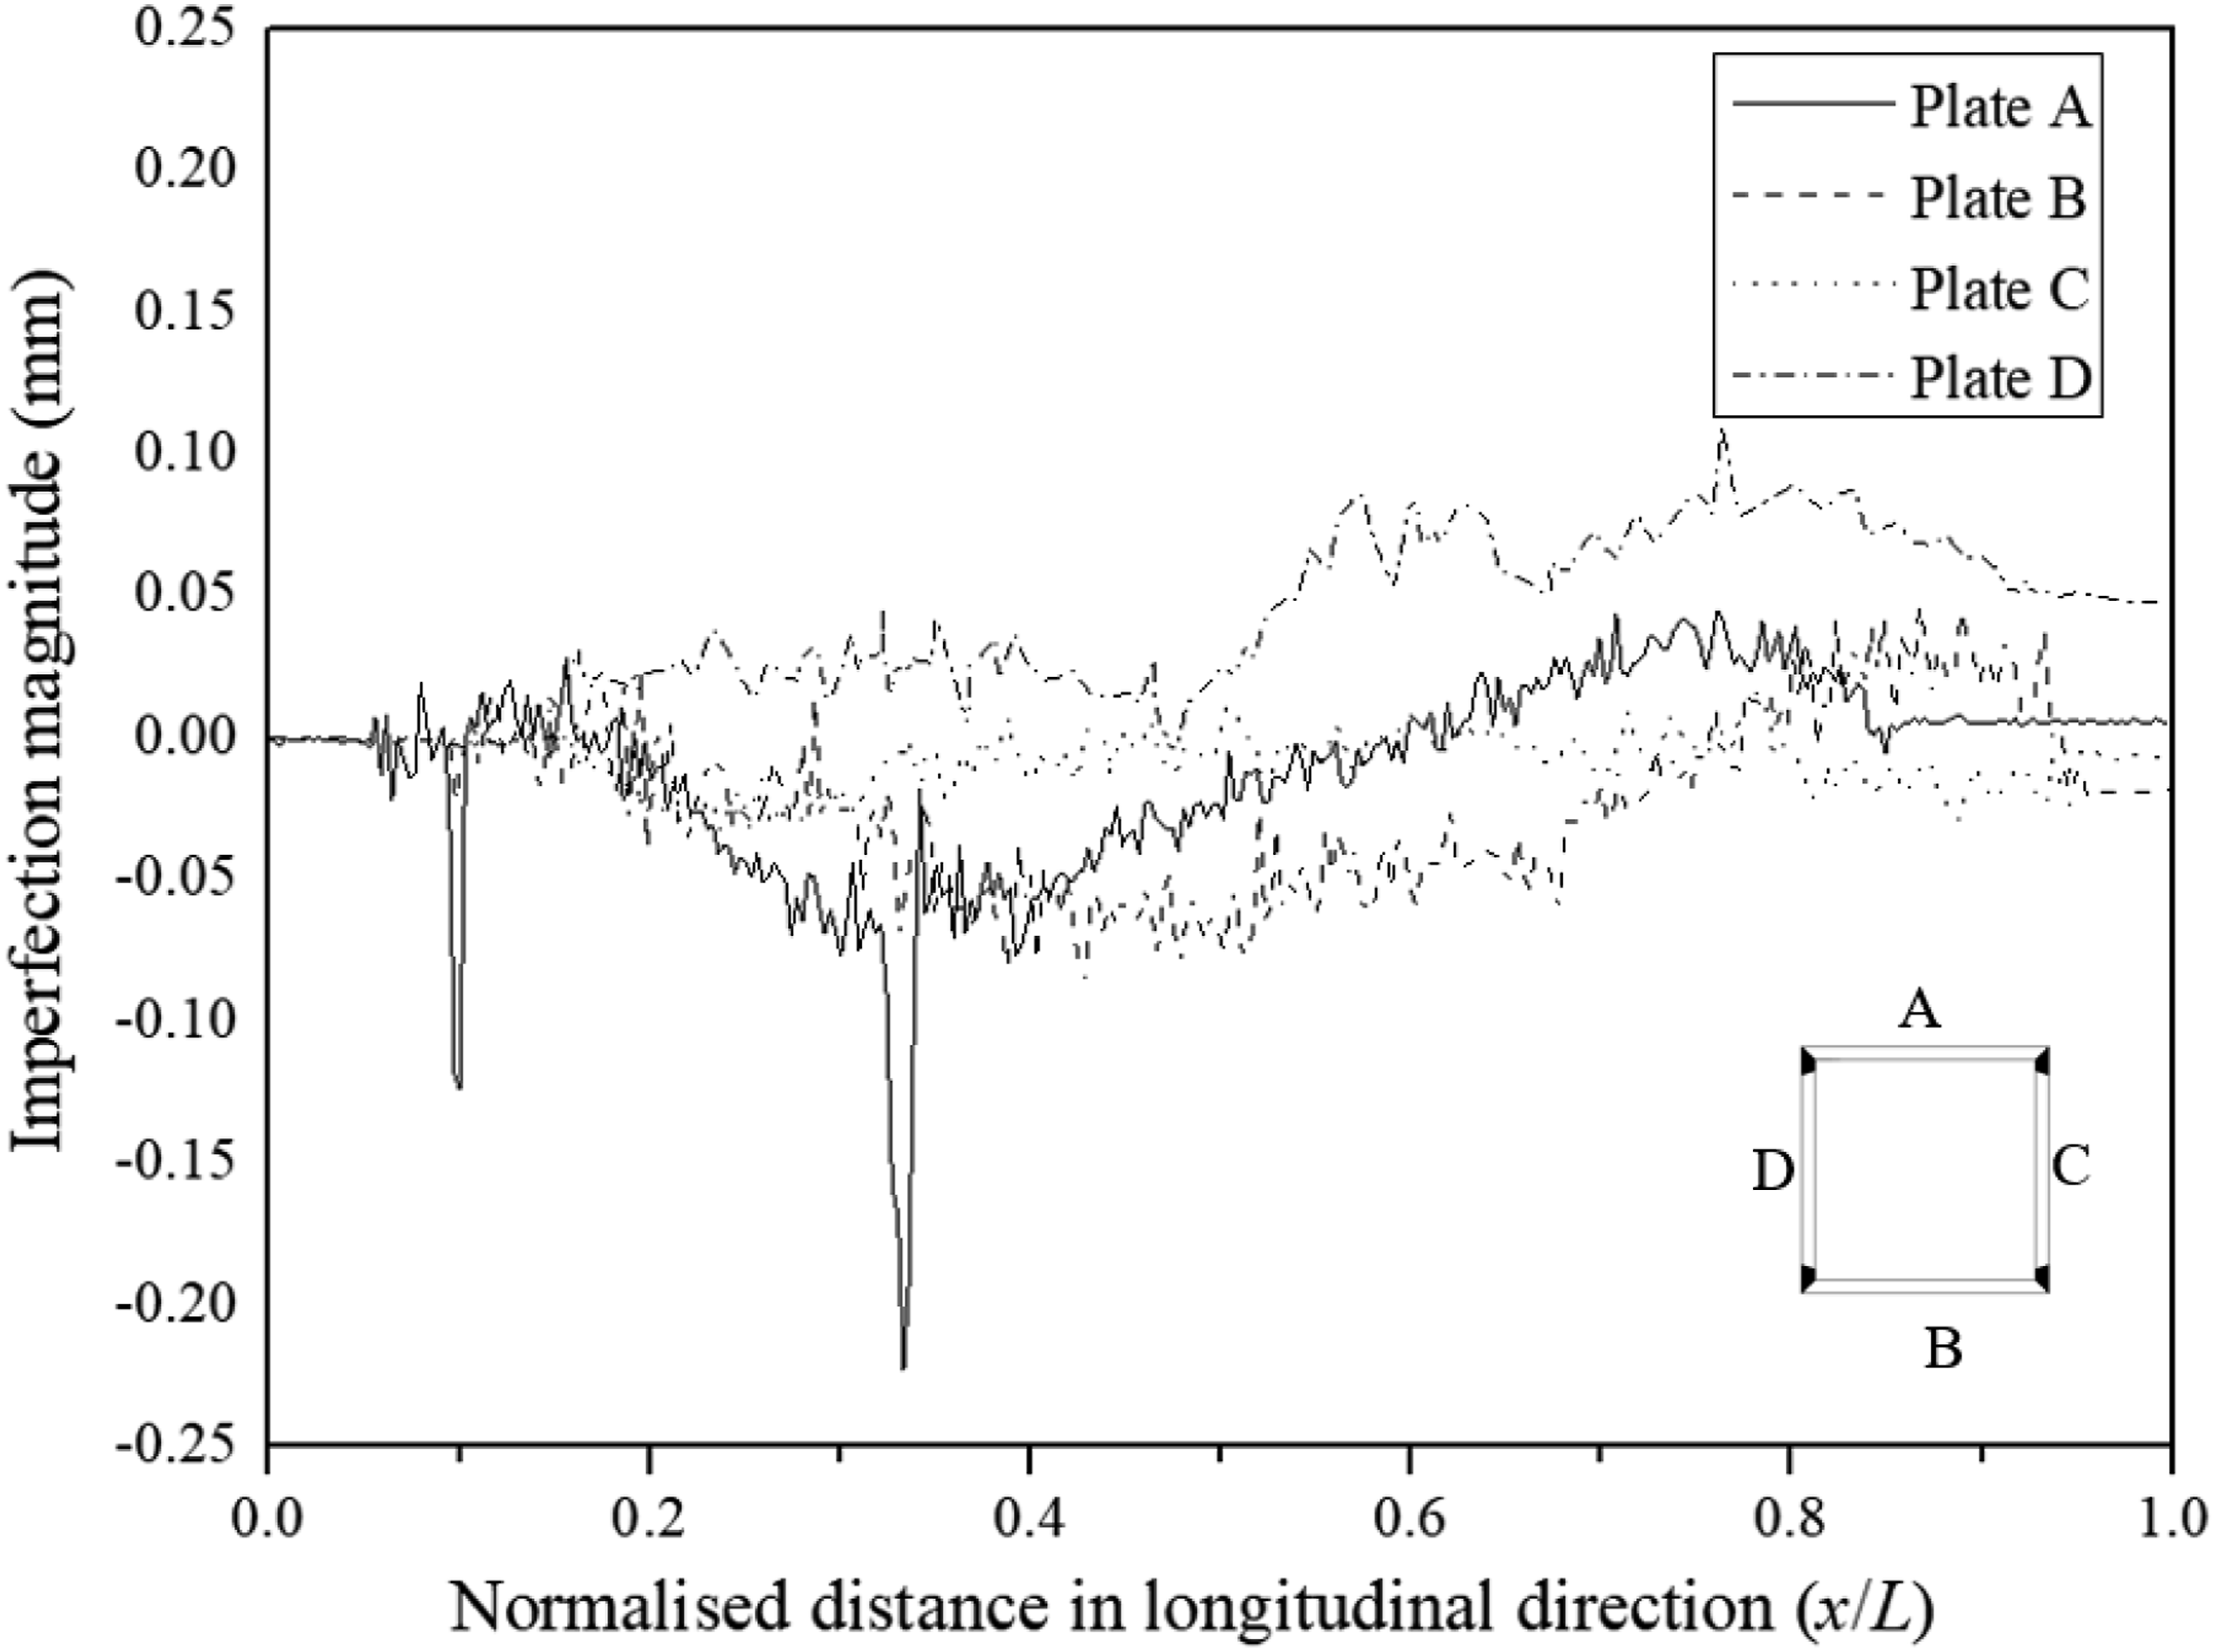
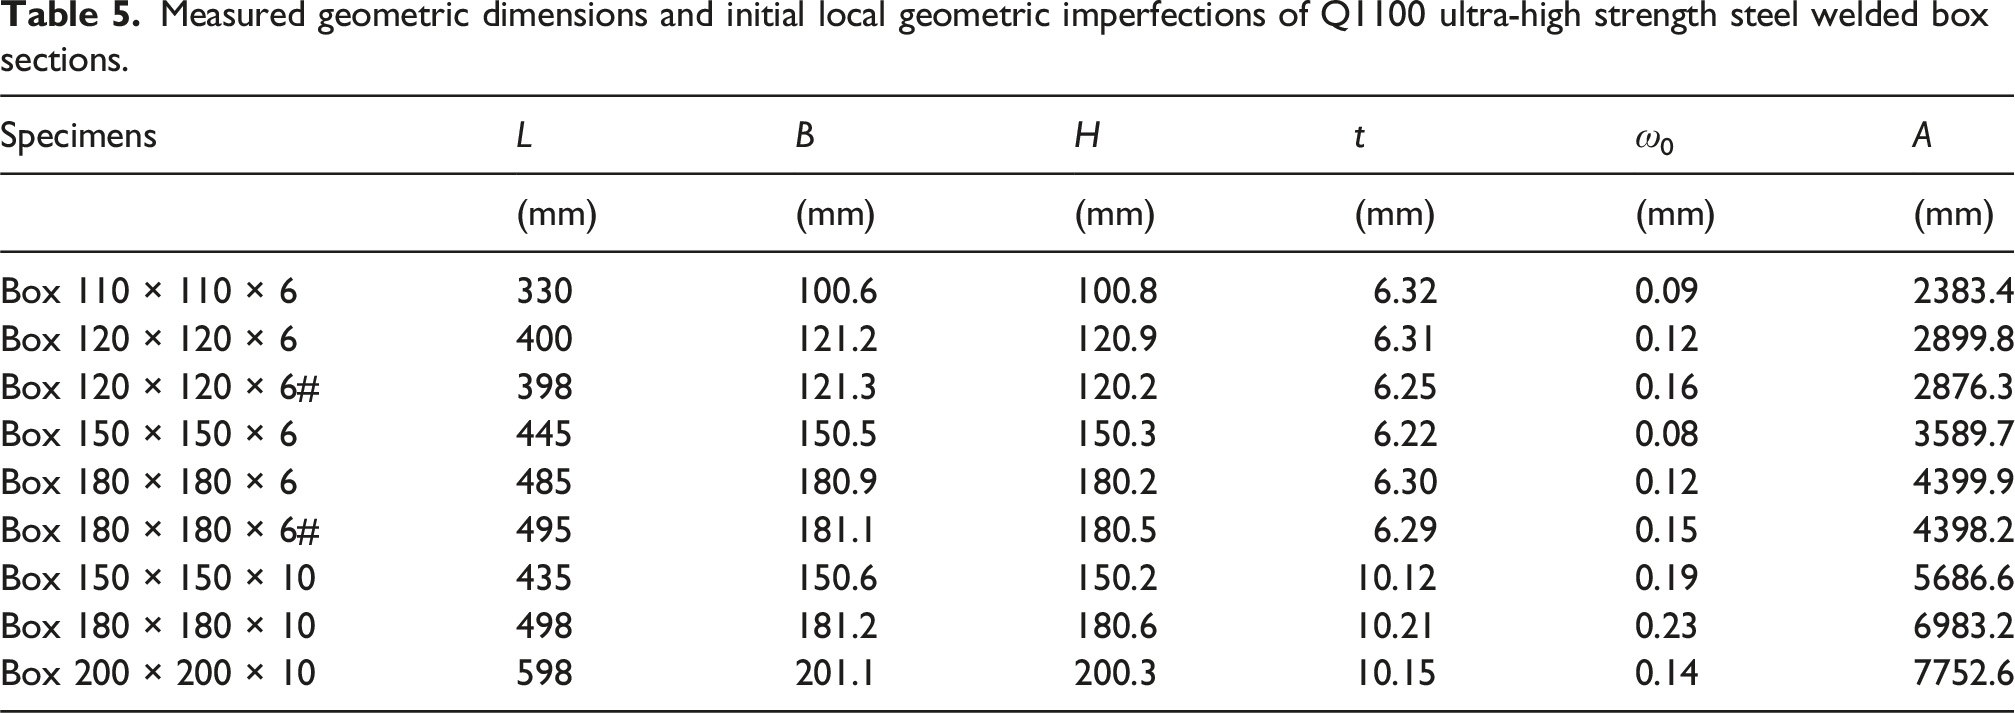
The stability and strength of welded box columns are highly sensitive to initial geometric imperfections introduced during manufacturing, handling, and erection. These deviations from the perfect geometry can substantially reduce the load-bearing capacity and trigger early local buckling failure (Liu et al., 2022d; Zhang et al., 2019; Zhong et al., 2023). While several techniques are available for measuring such imperfections in welded sections (Liu et al., 2024b; Meng and Gardner, 2020), this study used a precise contact method with three high-resolution Linear Variable Displacement Transducers (LVDTs) to map the imperfections in the Q1100 UHSS stub columns. The setup (Figure 9) placed two LVDTs near the welded corners and a third at the mid-width of the plate, allowing full-length profiling of the imperfections. Displacement readings were taken at 1.5 mm intervals along the column length, excluding the end 50 mm regions to remove any effects from the cutting process. The local imperfection magnitude was defined as the maximum deviation of the mid-section measurement from a straight line connecting the corner measurements. The overall longitudinal imperfection was measured relative to a theoretical straight line along the full length of specimen. Results for the Box 180 × 180 × 6 specimen, shown in Figure 10, exhibit a typical bow-shaped imperfection profile. The maximum recorded amplitude was approximately t/44 for the Box 180 × 180 × 10 specimen, with all data systematically listed in Table 5. A consistent bow-type distortion pattern was observed across all tested sections, providing valuable quantitative information for assessing fabrication tolerances and their effect on the structural performance of UHSS members. Initial geometric imperfection measurements for Q1100 UHSS welded box section. Measured initial geometric imperfection for Box 180 × 180 × 6 (representative section). Measured geometric dimensions and initial local geometric imperfections of Q1100 ultra-high strength steel welded box sections.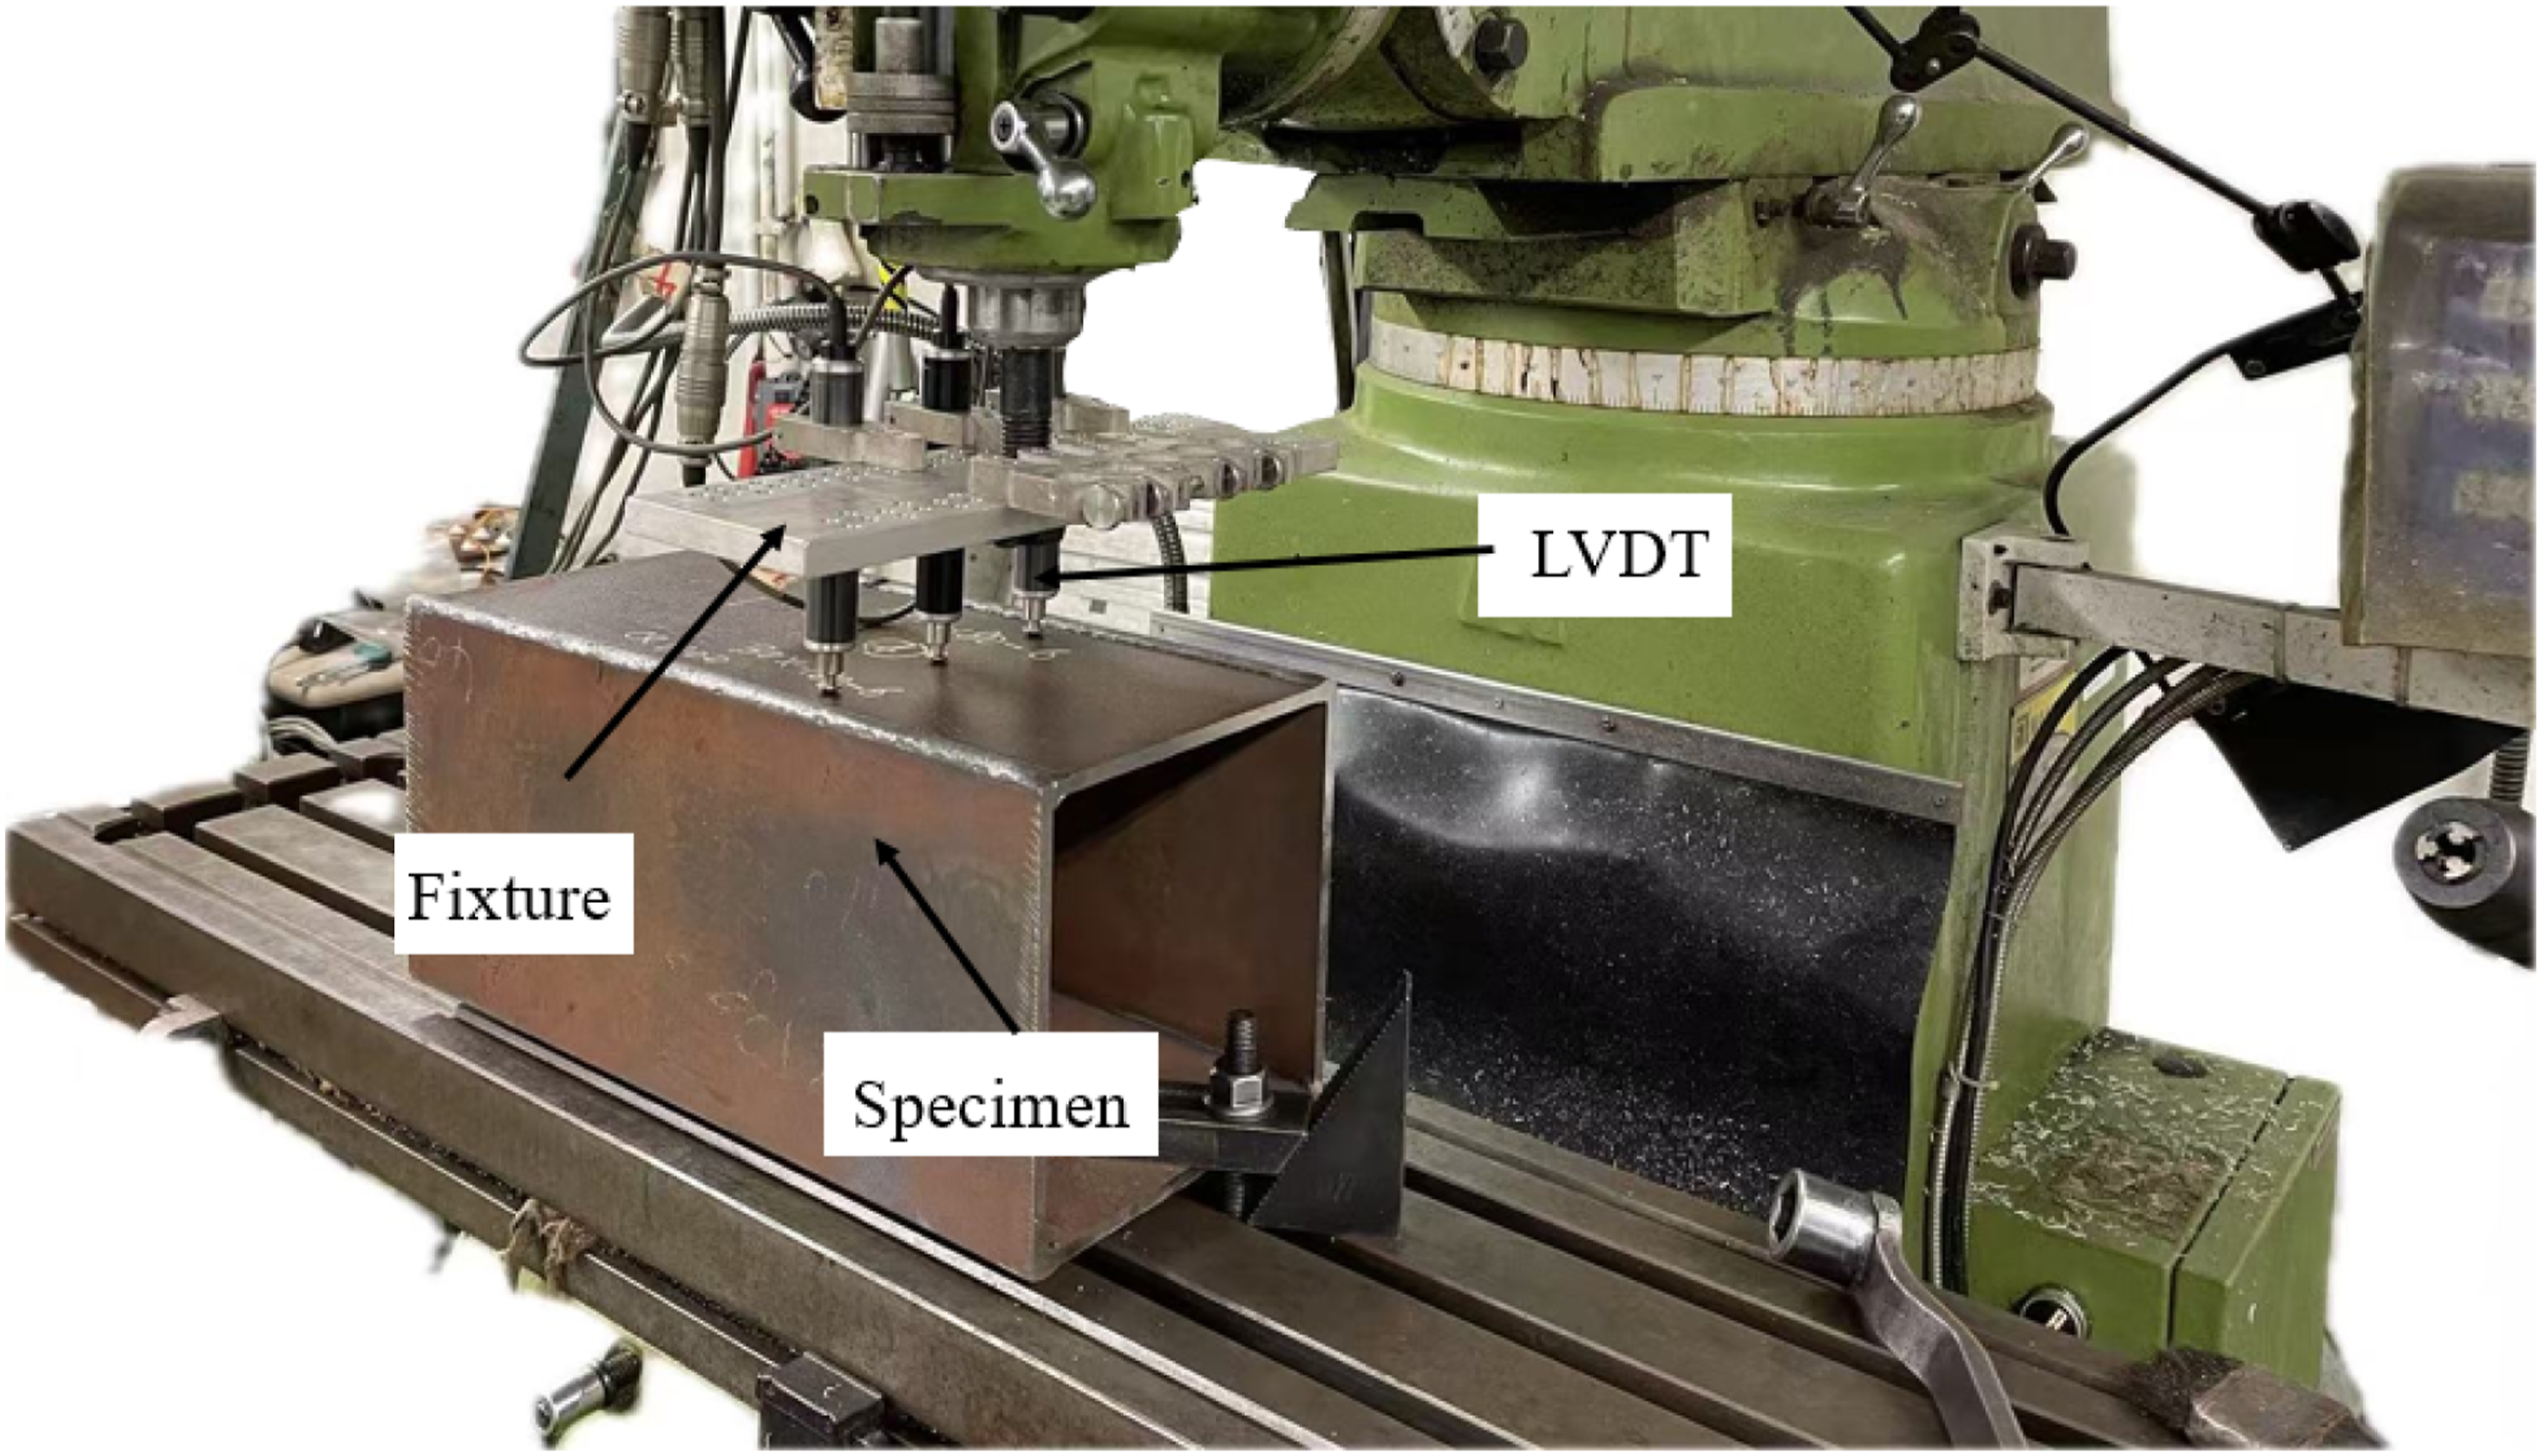
Stub column tests
The axial compressive behaviour of nine Q1100 UHSS welded box section stub columns was examined through a detailed experimental programme, with the test setup illustrated in Figure 11. Careful specimen preparation was employed to ensure data reliability. The column ends were machined flat to ensure uniform load application. The setup featured specially designed box-shaped end fixtures and supporting steel blocks to prevent end failure and to simulate fixed-end conditions, ensuring stability during loading. The tests were conducted using servo-controlled hydraulic actuators with capacities of 5000 kN and 10,000 kN. Vertical displacements were measured with three high-precision LVDT, and an array of strain gauges was used to detect the onset of local buckling. In line with established practice (Gardner and Nethercot, 2004), the strain gauge layout comprised two gauges placed at a distance of 2t from the plate edges and a third at the expected location of the buckling half-wave crest. A detailed testing sequence was followed, starting with laser alignment and a pre-loading cycle up to 10% of the expected yield load to verify system operation. After unloading to a small load (10 kN) to ensure proper seating, the test proceeded under displacement control at a rate of 0.05% of the column length per minute, consistent with the material tests. A KYOWA UCAM-65C data logger recorded all data at 2 Hz, capturing the complete load-deformation history. Strain gauge readings were used to correct for system compliance and to determine the net axial shortening of the specimen. Test set-up for Q1100 ultra-high strength steel welded box section stub columns.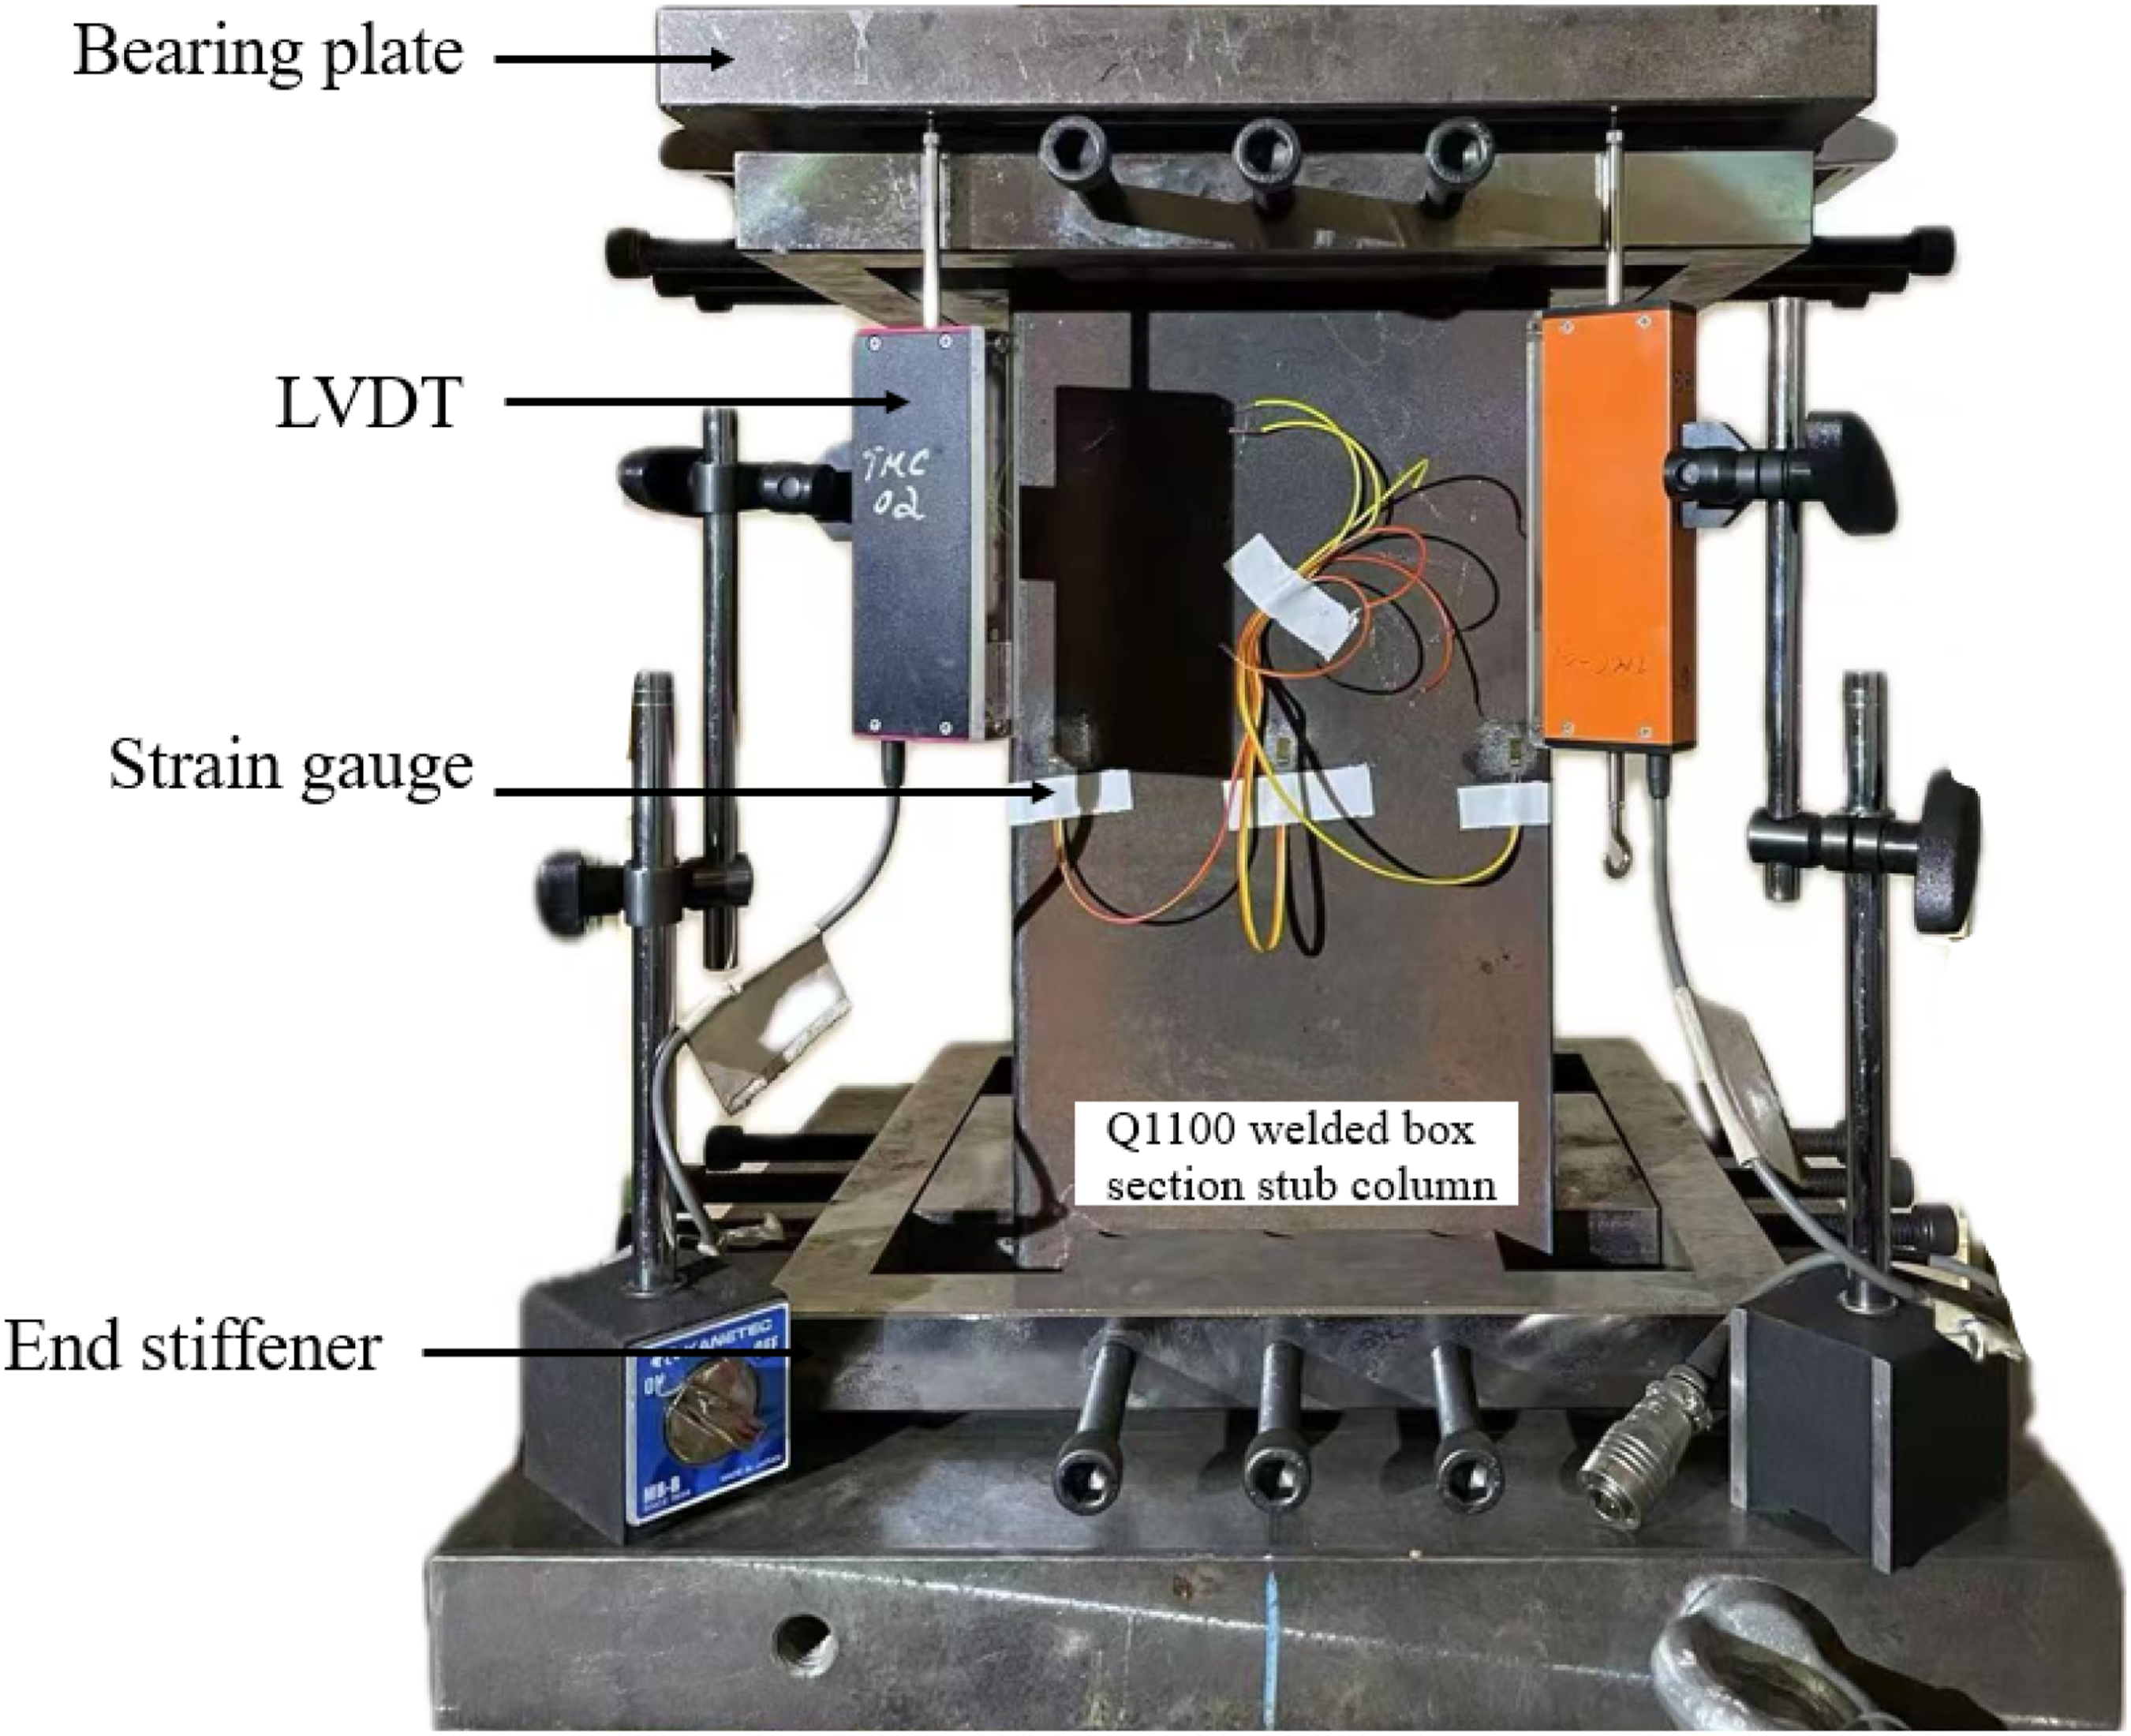
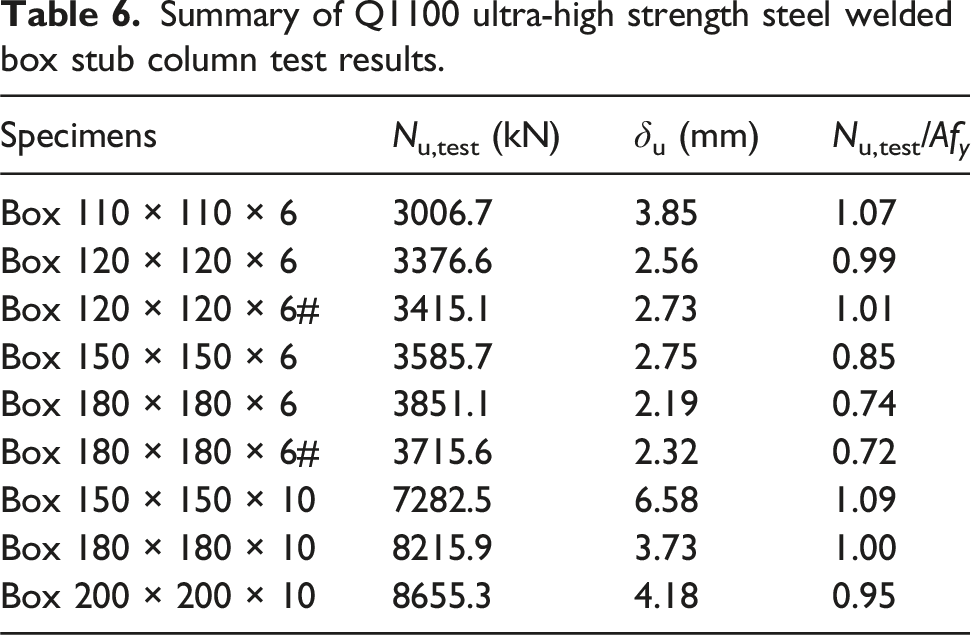
The load-deformation curves, exemplified in Figure 12, consistently showed a single peak and nonlinear response, with failure in all specimens occurring by a characteristic inward-outward buckling of the plate walls. Evaluation of key results, ultimate load (Nu,test), corresponding axial shortening (δu), squash load (Ny = Afy), and normalised strength (Nu,test/Ny), as summarised in Table 6, demonstrated a strong dependence on slenderness. Slender sections (Nu,test/Ny < 1) experienced a rapid drop in load after peak due to sudden local buckling, whereas non-slender sections displayed a more gradual post-peak softening and greater ductility, achieving full cross-section yielding. The inverse relationship between the Nu,test/Ny ratio and the width-to-thickness ratio quantitatively established the negative influence of local buckling on structural efficiency. Slender sections also showed a markedly lower deformation capacity at peak load compared to more compact sections. These results offer important understanding of the interaction between material yielding and stability-induced failure in axially compressed UHSS welded box sections. Load-end shortening curves of Q1100 ultra-high strength steel welded box section stub columns. Summary of Q1100 ultra-high strength steel welded box stub column test results.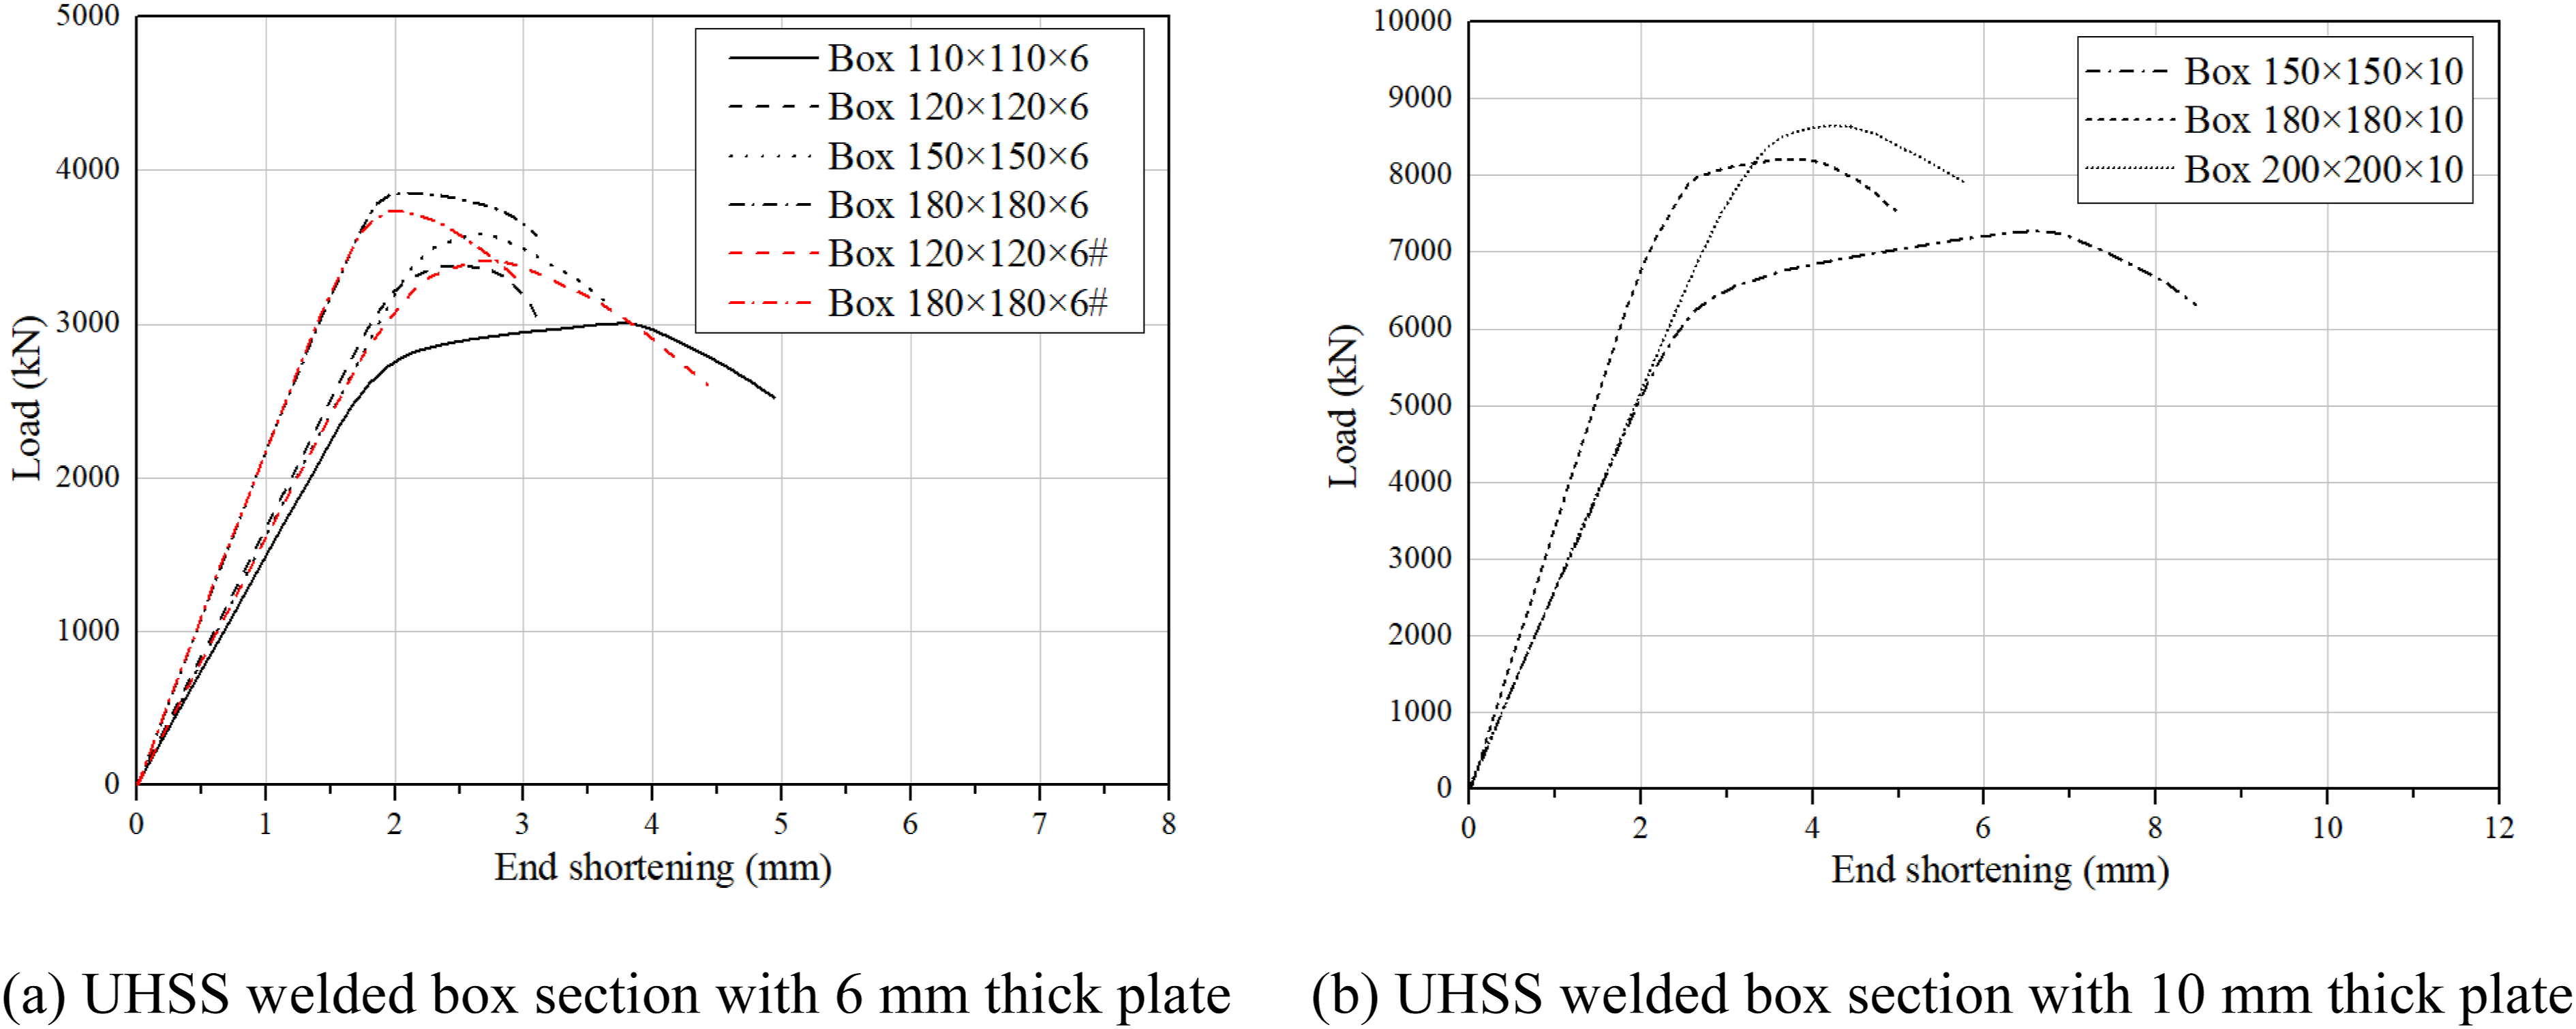
Numerical investigation
General
To supplement the experimental data, a detailed numerical study was carried out using the ABAQUS finite element (FE) software. The advanced modelling techniques used are described, covering element type, material models, and boundary conditions. The validation process is then outlined, where FE predictions are systematically compared with test measurements to establish the model’s accuracy via error analysis and sensitivity checks. Using this validated numerical tool, a wide-ranging parametric study involving 57 different geometries of Q1100 UHSS welded box sections is presented.
Development of finite element (FE) models
The FE models for the Q1100 UHSS welded box stub columns were constructed by integrating key experimentally determined parameters, including measured geometric imperfections, material properties, section dimensions, and boundary conditions. The models were validated by comparing their predictions with test results for three primary outputs, namely ultimate load, load-end shortening response, and buckling mode shape.
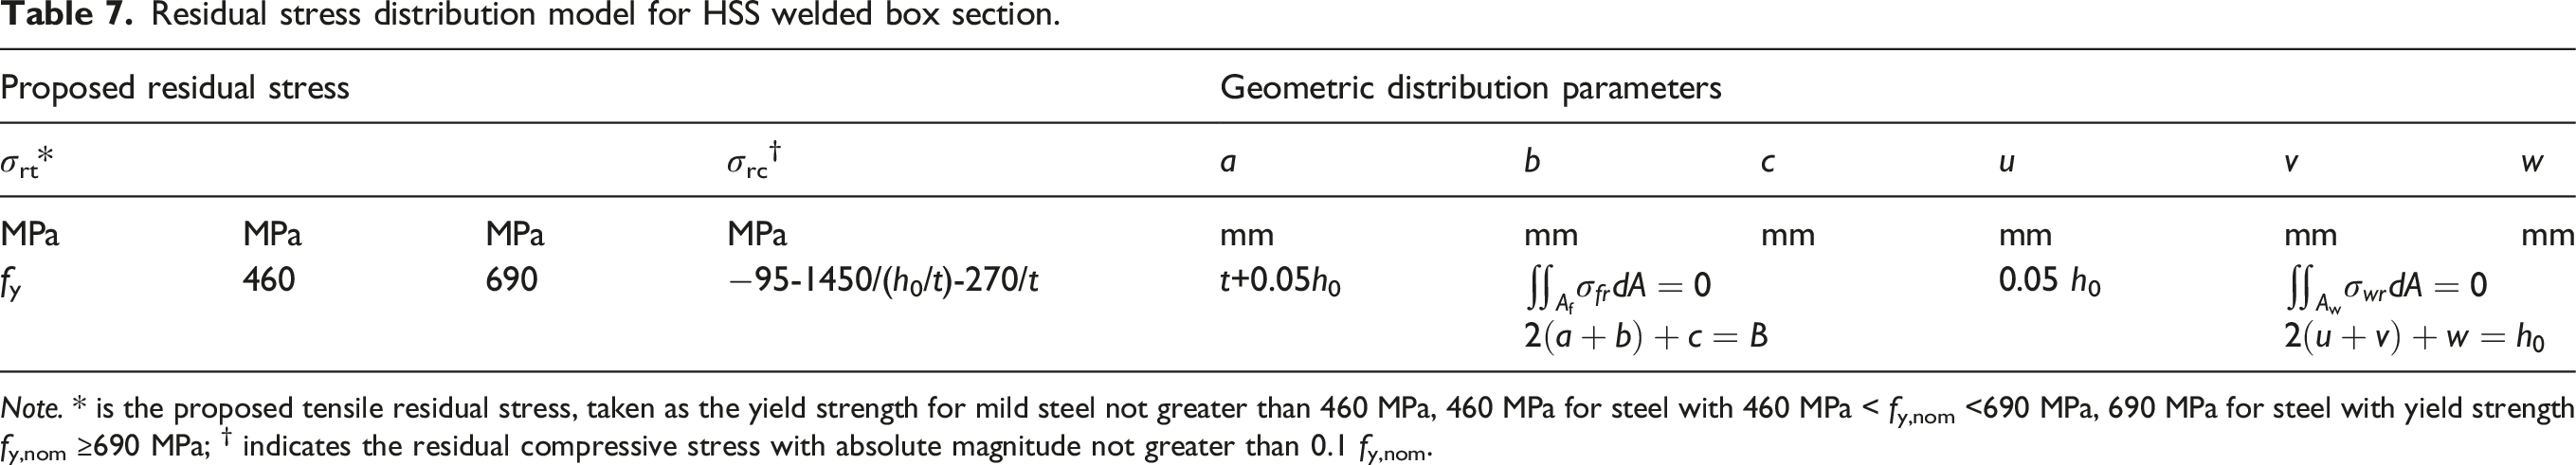
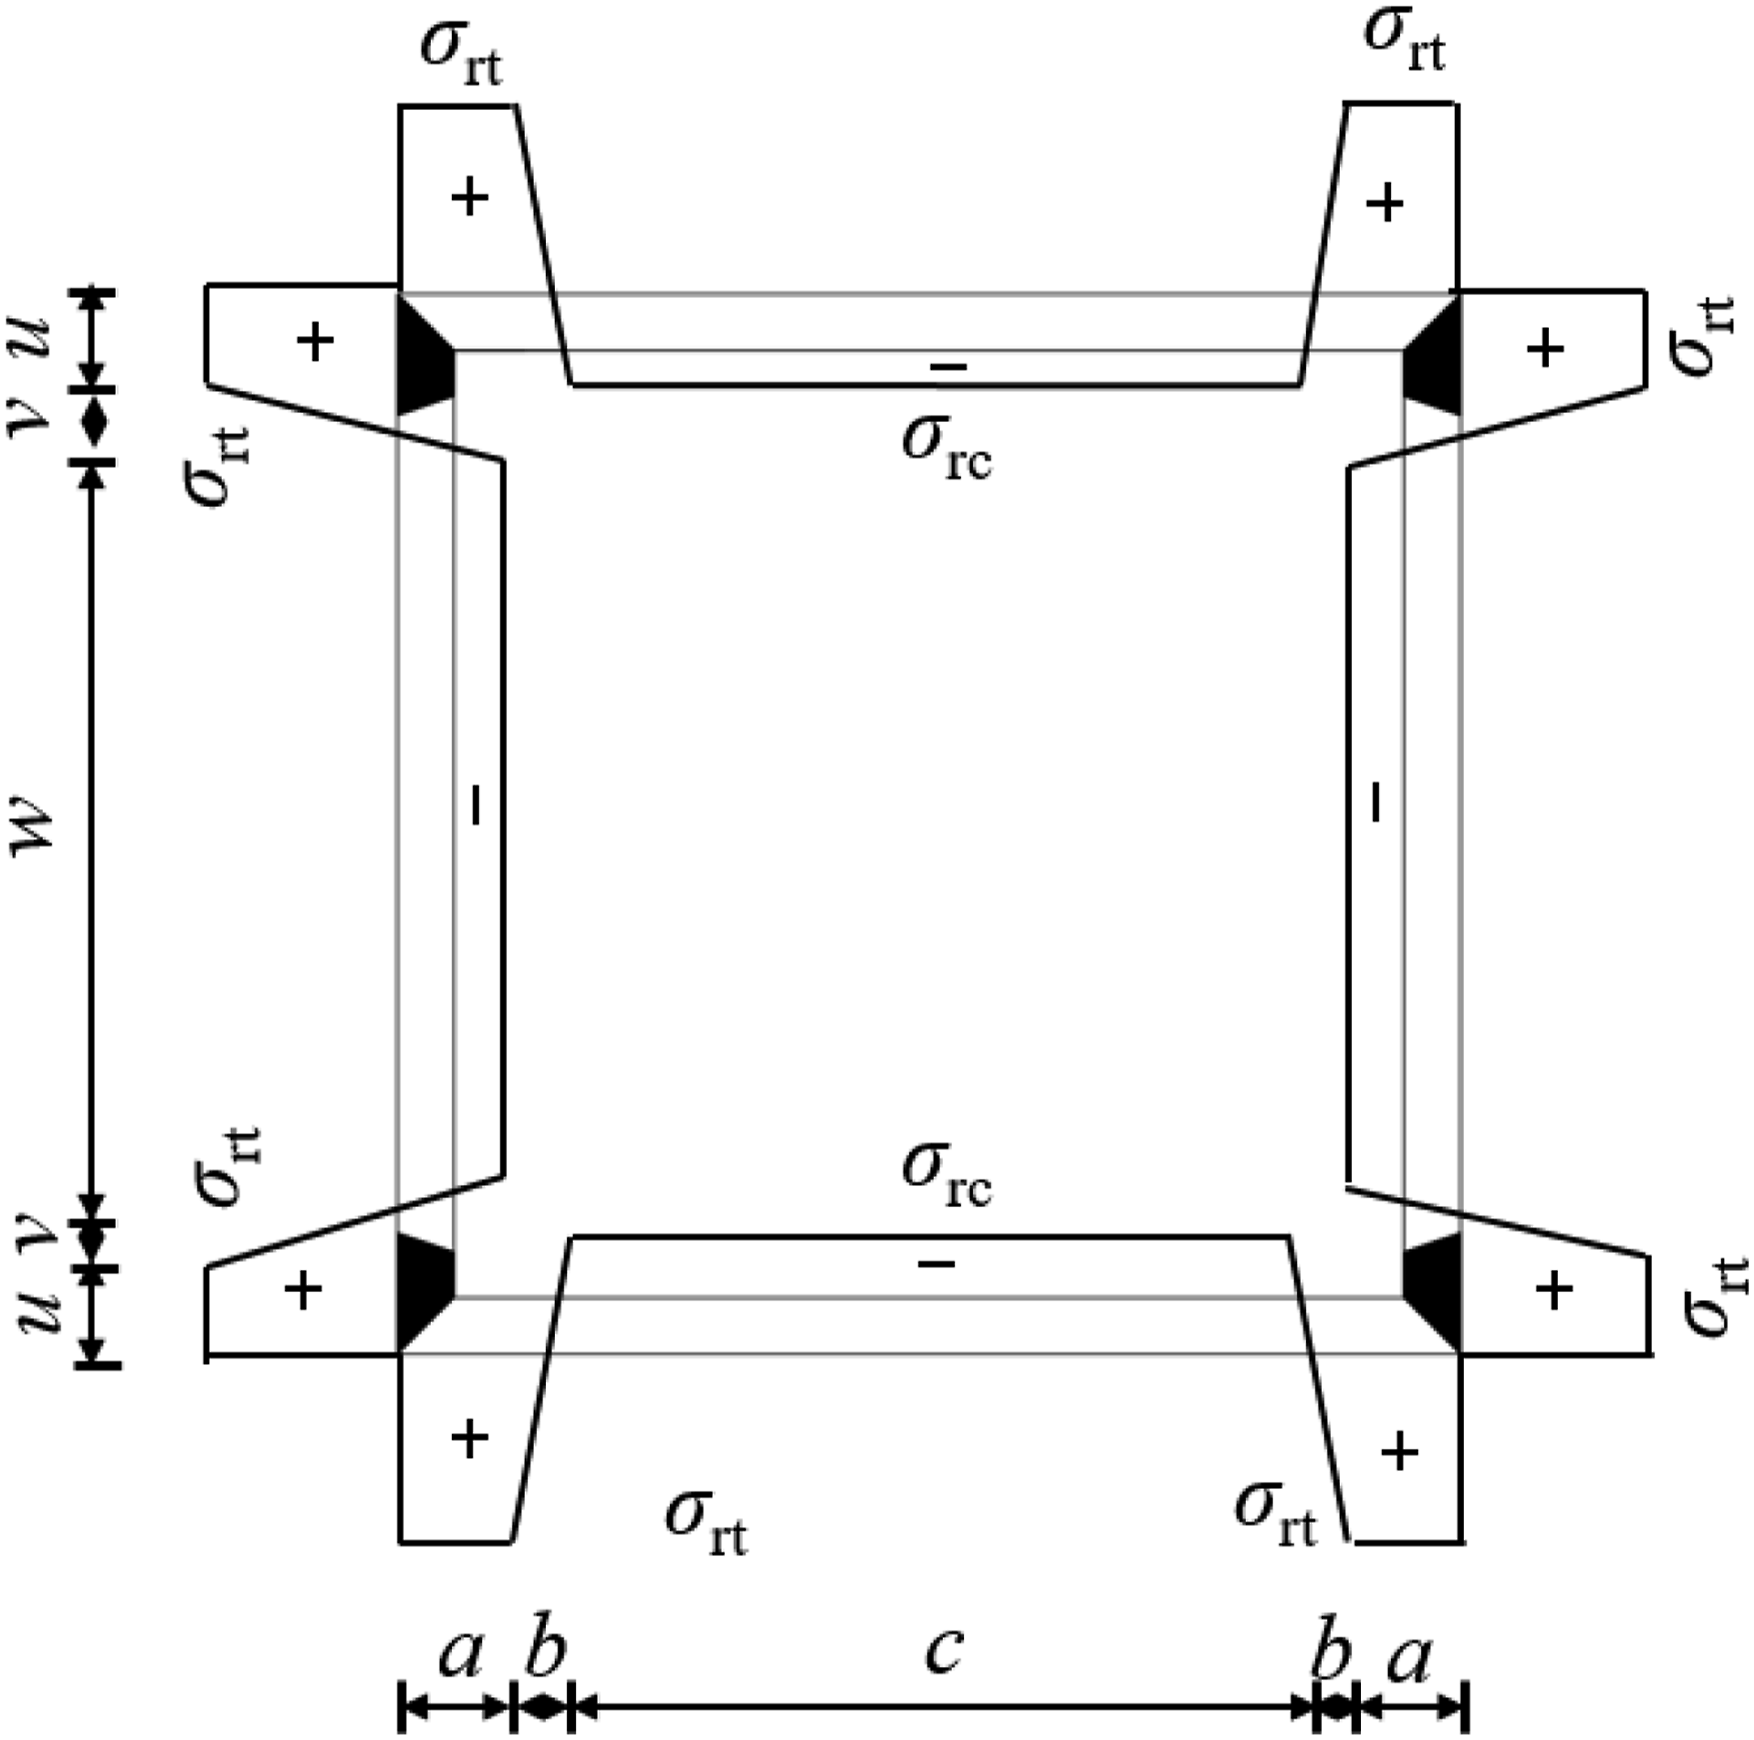
The simulations used ABAQUS S4R shell elements, chosen for their established performance in modelling welded box section members (Fang and Chan, 2019; Ma et al., 2022). The geometry was defined using the measured centreline dimensions. A mesh sensitivity study indicated that an element size of (B+H)/30 for the cross-section, with a uniform mesh along the length, provided an optimal balance. Figure 13 shows the final mesh for a representative Box 180 × 180 × 6 specimen. This mesh ensured both computational efficiency and accuracy in capturing local buckling. Residual stresses were included using a comprehensive strategy. Bending residual stresses were implicitly considered through the use of the full stress-strain curves from the tensile coupon tests as evidenced by the longitudinal curvature of the tensile coupons when they were extracted from the sections which were approximately reintroduced during tensile testing as the coupons were returned to their straight configuration under the application of tensile loading. Membrane residual stresses, mainly caused by welding, were applied using a predictive model for HSS welded box sections (Ban et al. 2013). The stress distribution was multi-linear, with parameters provided in Table 7 and Figure 14; a peak tensile stress of 690 MPa was applied near the weld line, following the conservative approach in Ban et al. (2013). This distribution showed a smooth reduction in stress from the HAZ into the compressive zones, maintaining section equilibrium while realistically representing the characteristic residual stress patterns in welded UHSS sections. Boundary conditions for Q1100 ultra-high strength steel welded box section stub columns. Residual stress distribution model for HSS welded box section. Note. * is the proposed tensile residual stress, taken as the yield strength for mild steel not greater than 460 MPa, 460 MPa for steel with 460 MPa < fy,nom <690 MPa, 690 MPa for steel with yield strength fy,nom ≥690 MPa; † indicates the residual compressive stress with absolute magnitude not greater than 0.1 fy,nom. Residual stresses distribution model.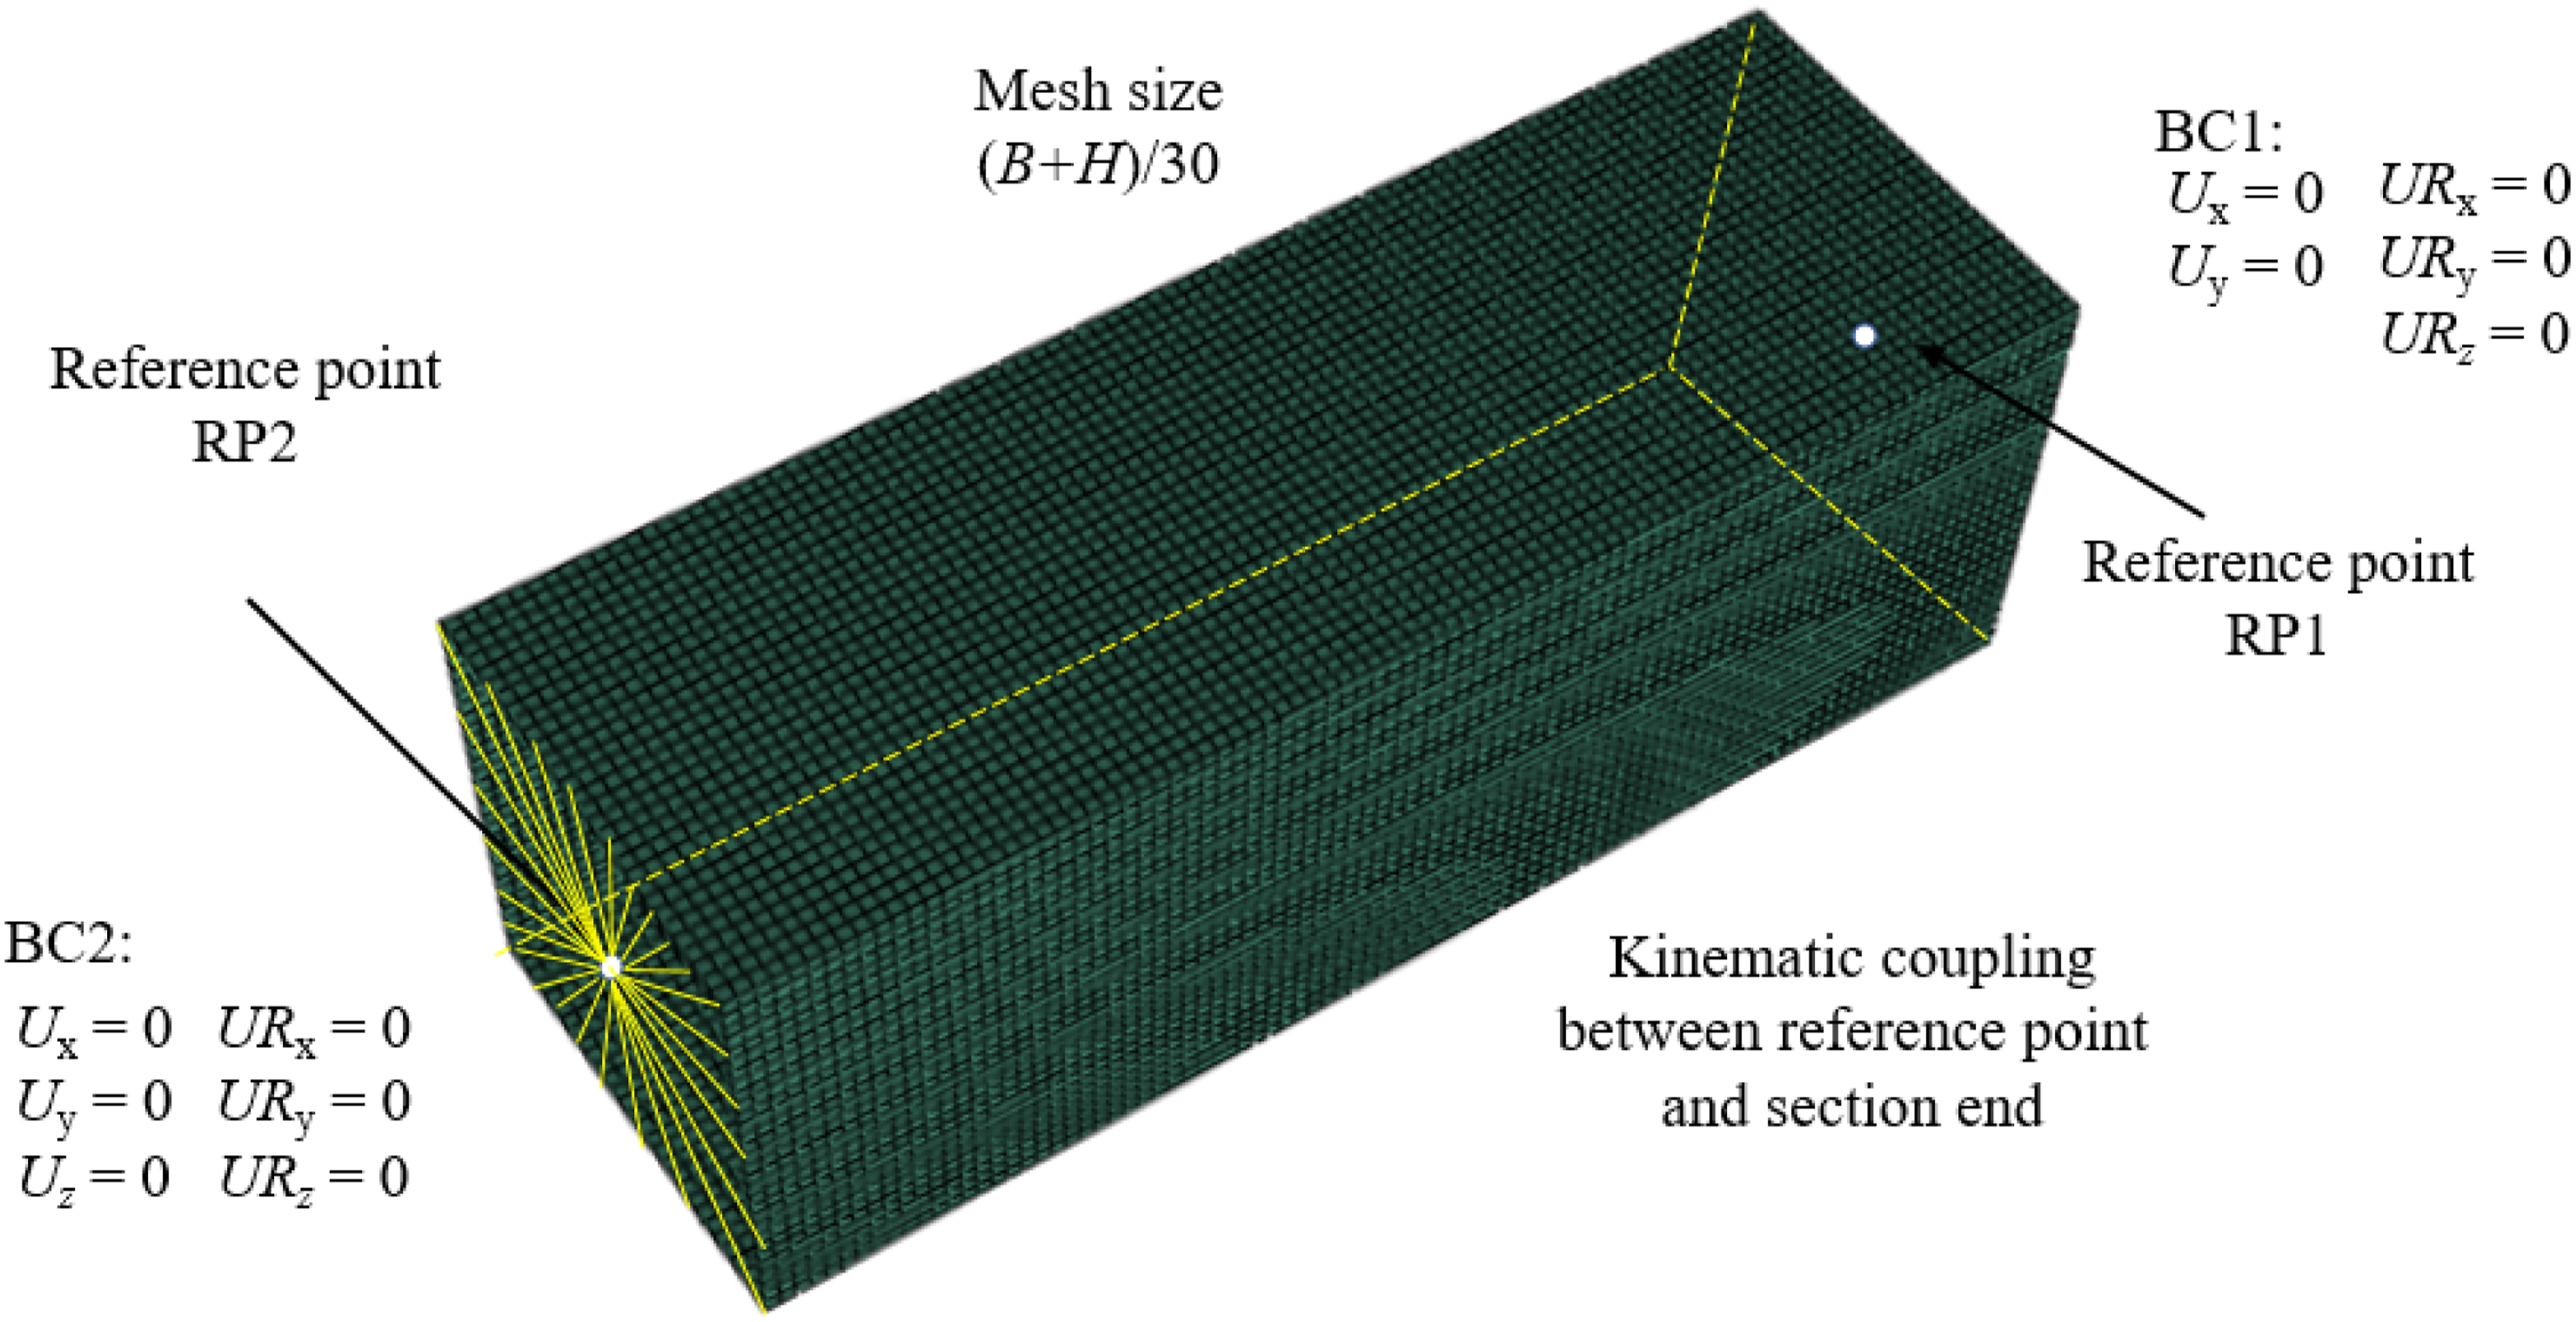
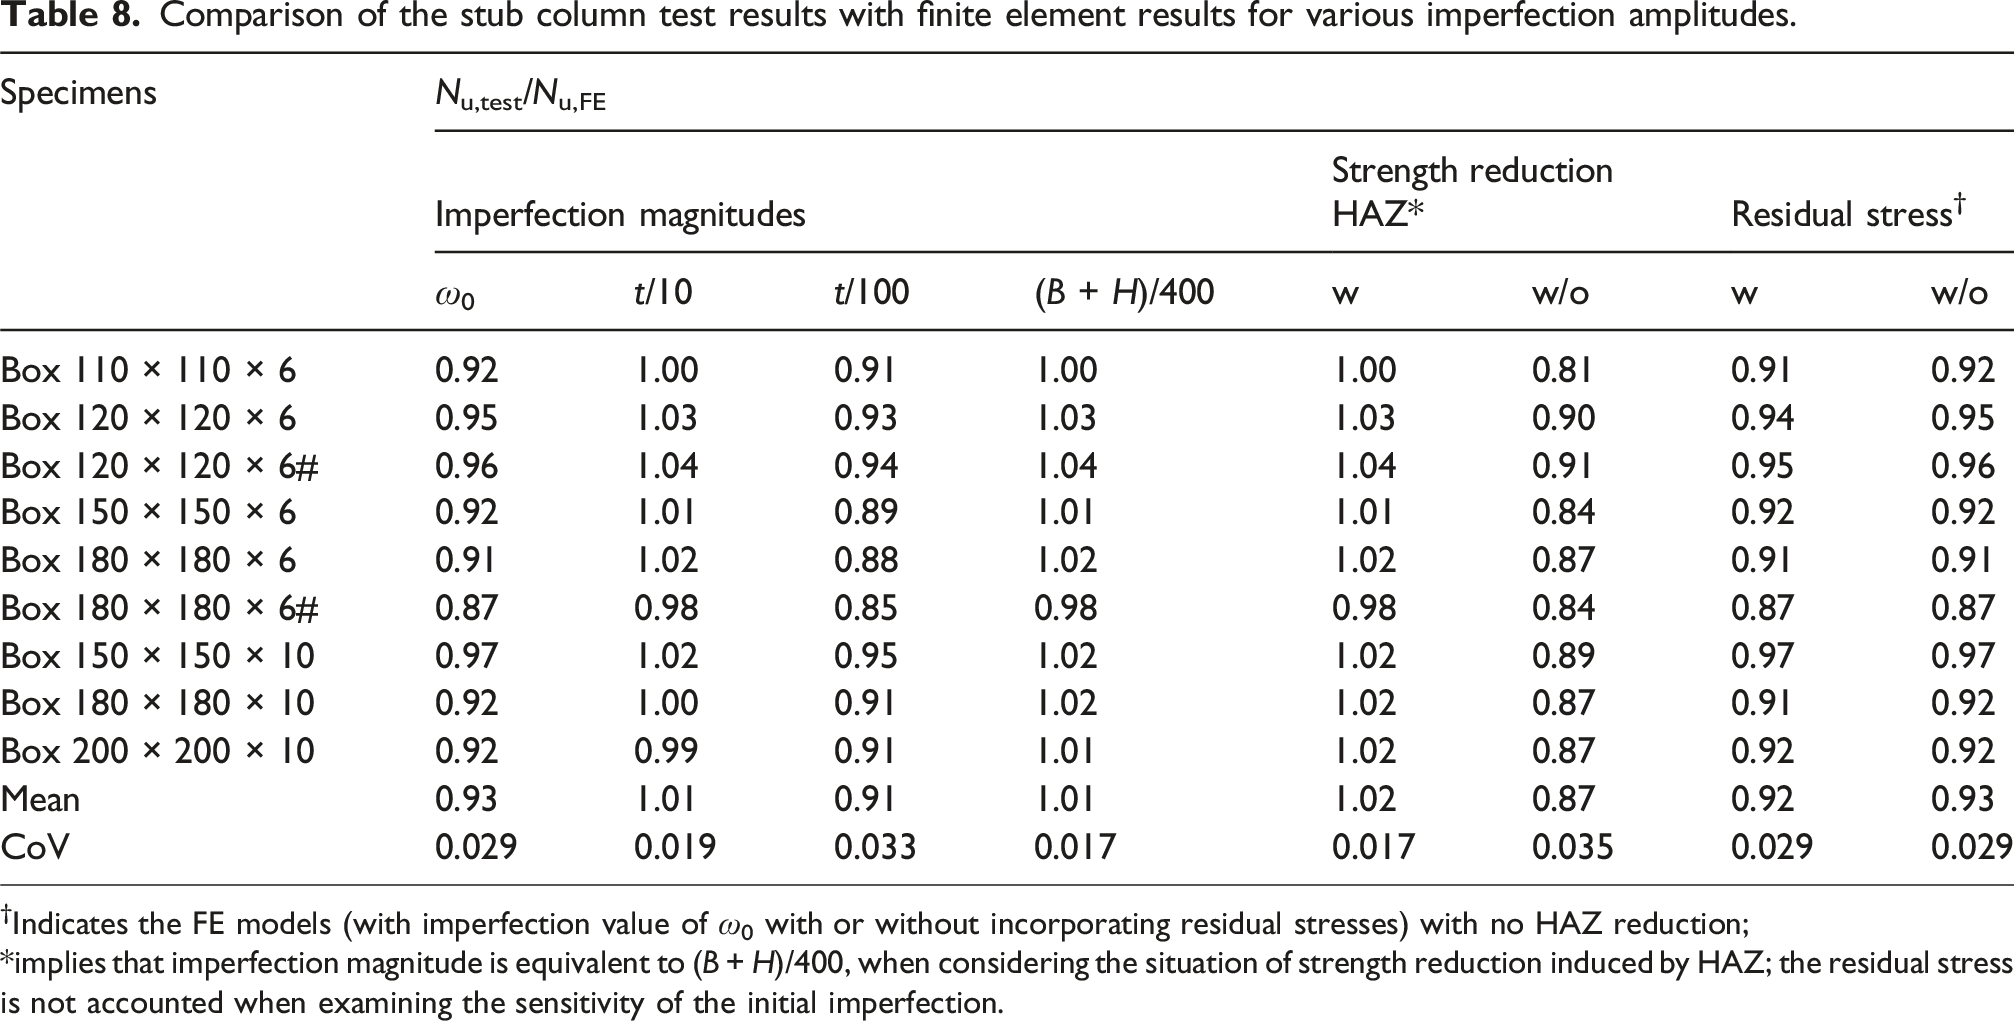
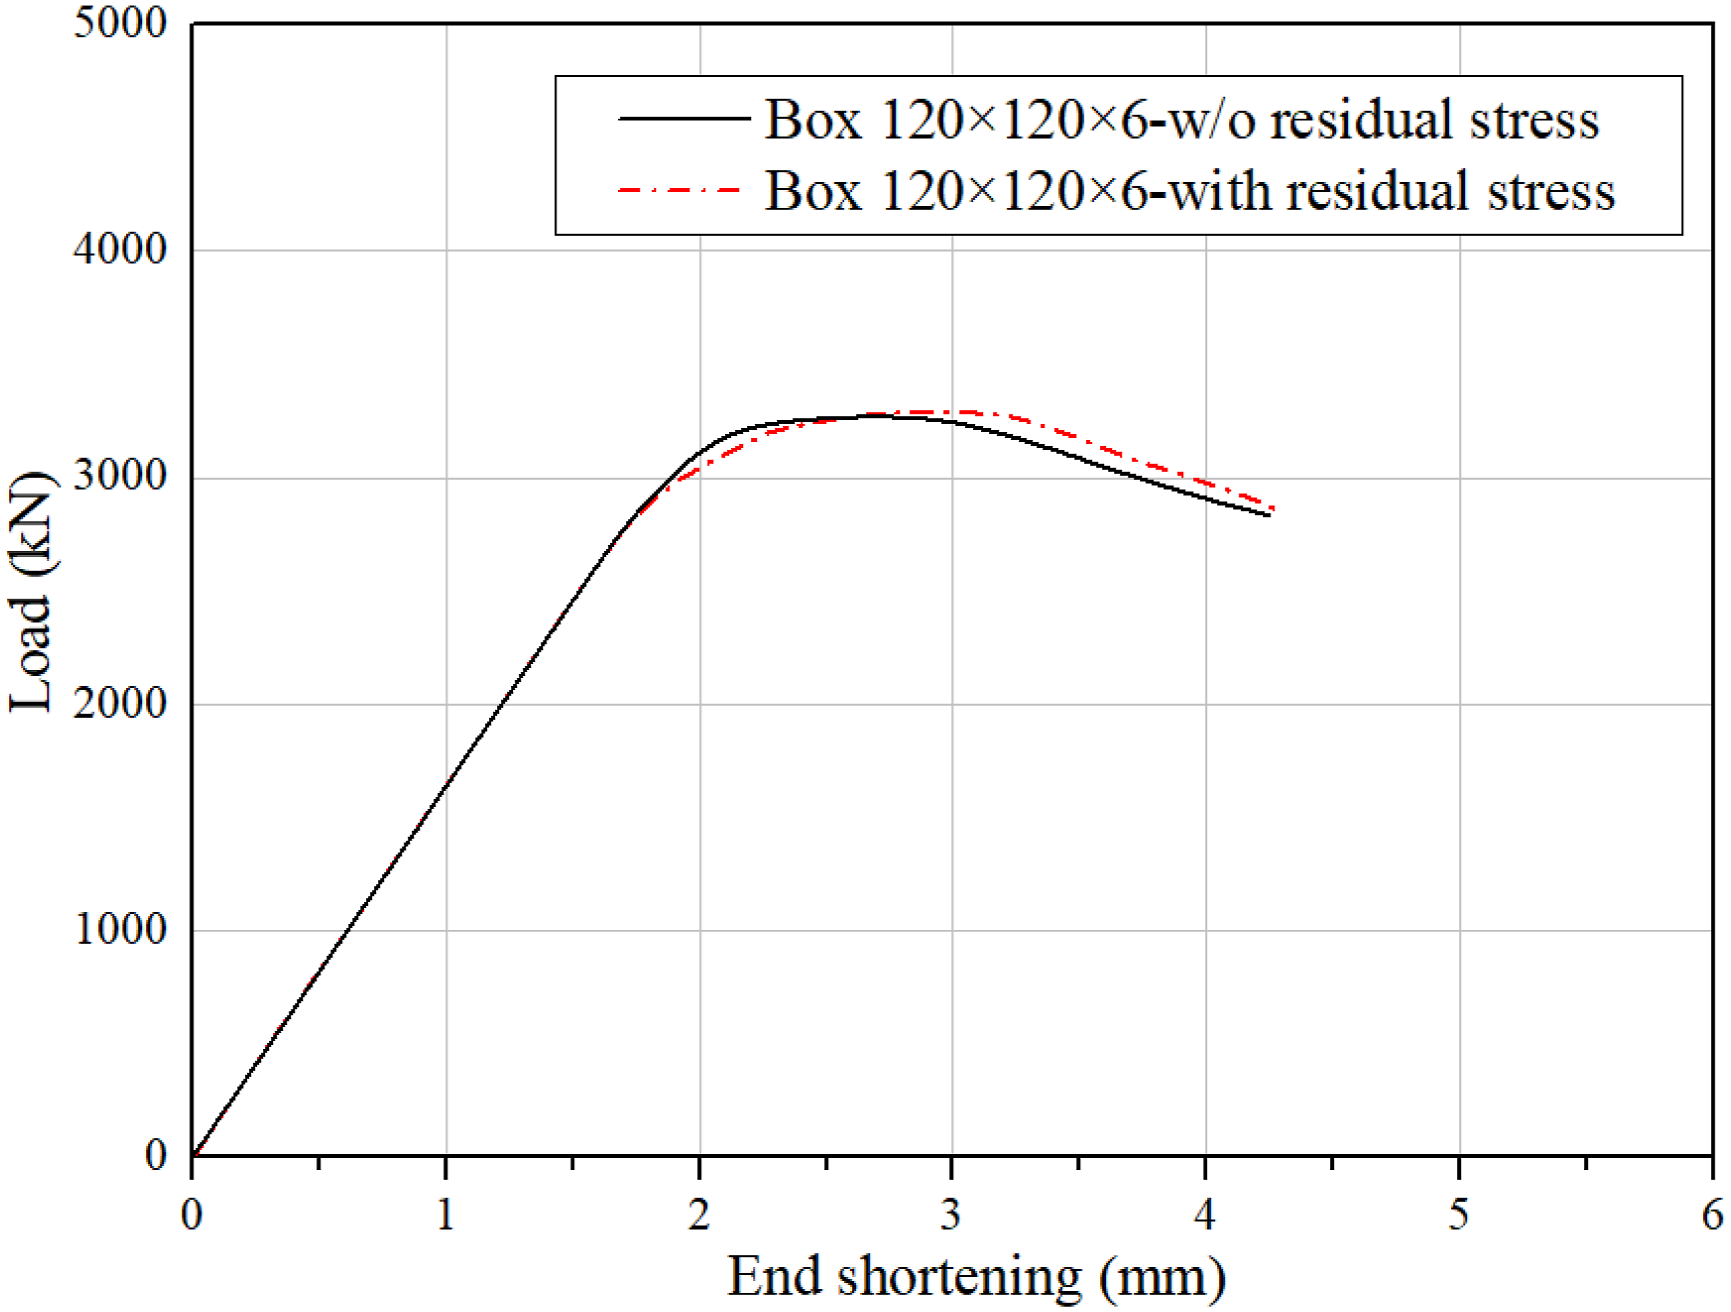
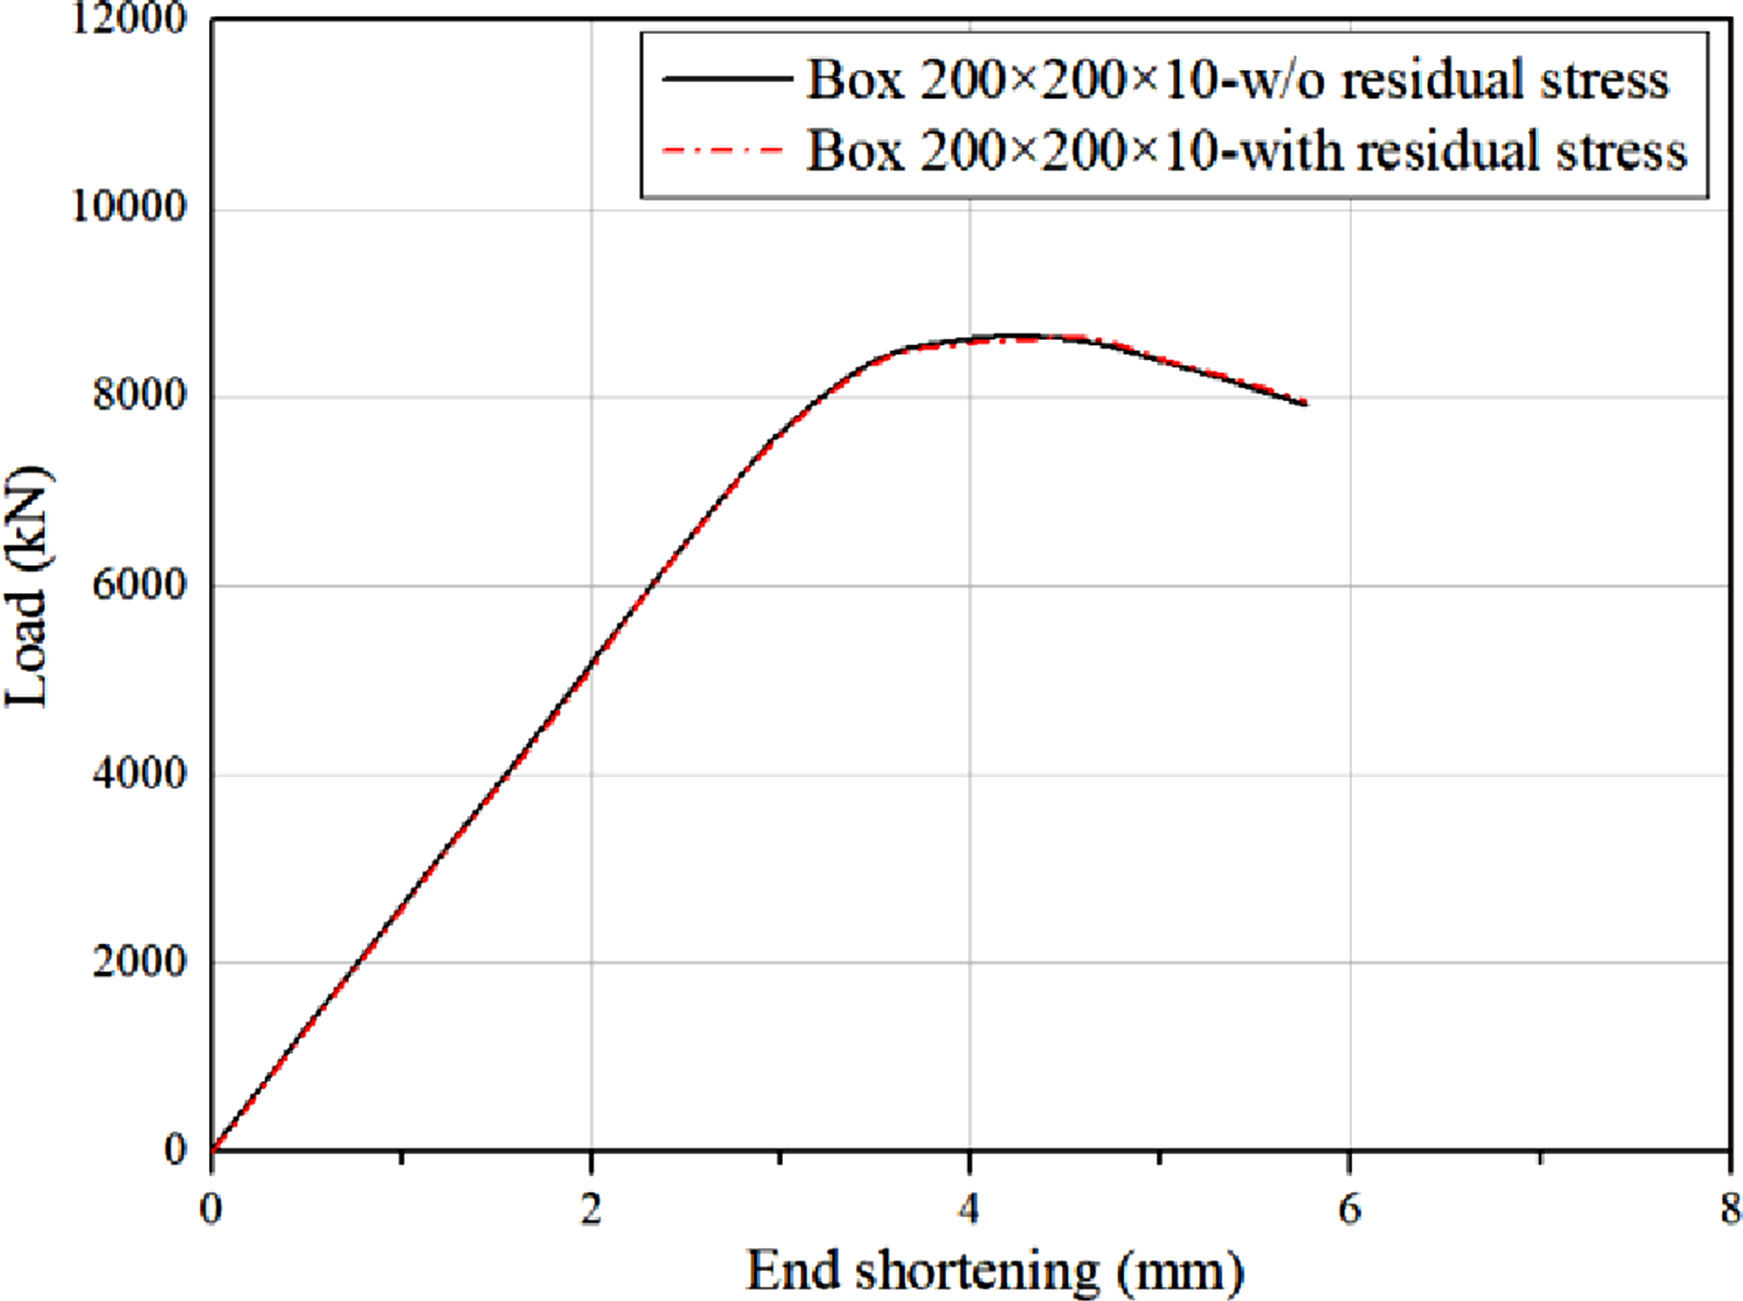
A systematic numerical investigation was conducted to assess the effect of membrane residual stresses on the local buckling response of the Q1100 UHSS stub columns (Figure 15). A sensitivity analysis, backed by statistical data in Table 8, showed that including membrane residual stresses had a negligible impact on the predicted ultimate load (Nu,test/Nu,FE). Load-end shortening curves for representative specimens (Box 120 × 120 × 6 and Box 200 × 200 × 10) indicated that residual stresses caused a slight early onset of yielding in slender sections, leading to about a 1% reduction in strength and a shift in the peak displacement. Their effect on thicker sections was minimal, as shown in Figures 16 and 17. Consequently, to simplify the computational model without loss of accuracy, membrane residual stresses were omitted in the subsequent parametric studies. Residual stresses modelling for UHSS welded box section stub column (Note that the residual stress was integrated into the FE model in form of stress gradients (i.e., 280 MPa at welding seam) rather than the exact individual stress magnitude at the welding seam). Comparison of the stub column test results with finite element results for various imperfection amplitudes. †Indicates the FE models (with imperfection value of ω0 with or without incorporating residual stresses) with no HAZ reduction; *implies that imperfection magnitude is equivalent to (B + H)/400, when considering the situation of strength reduction induced by HAZ; the residual stress is not accounted when examining the sensitivity of the initial imperfection. Comparison of the load-end shortening responses with and without inclusion of residual stress for Box 120 × 120 × 6. Comparison of the load-end shortening responses with and without inclusion of residual stress for Box 200 × 200 × 10.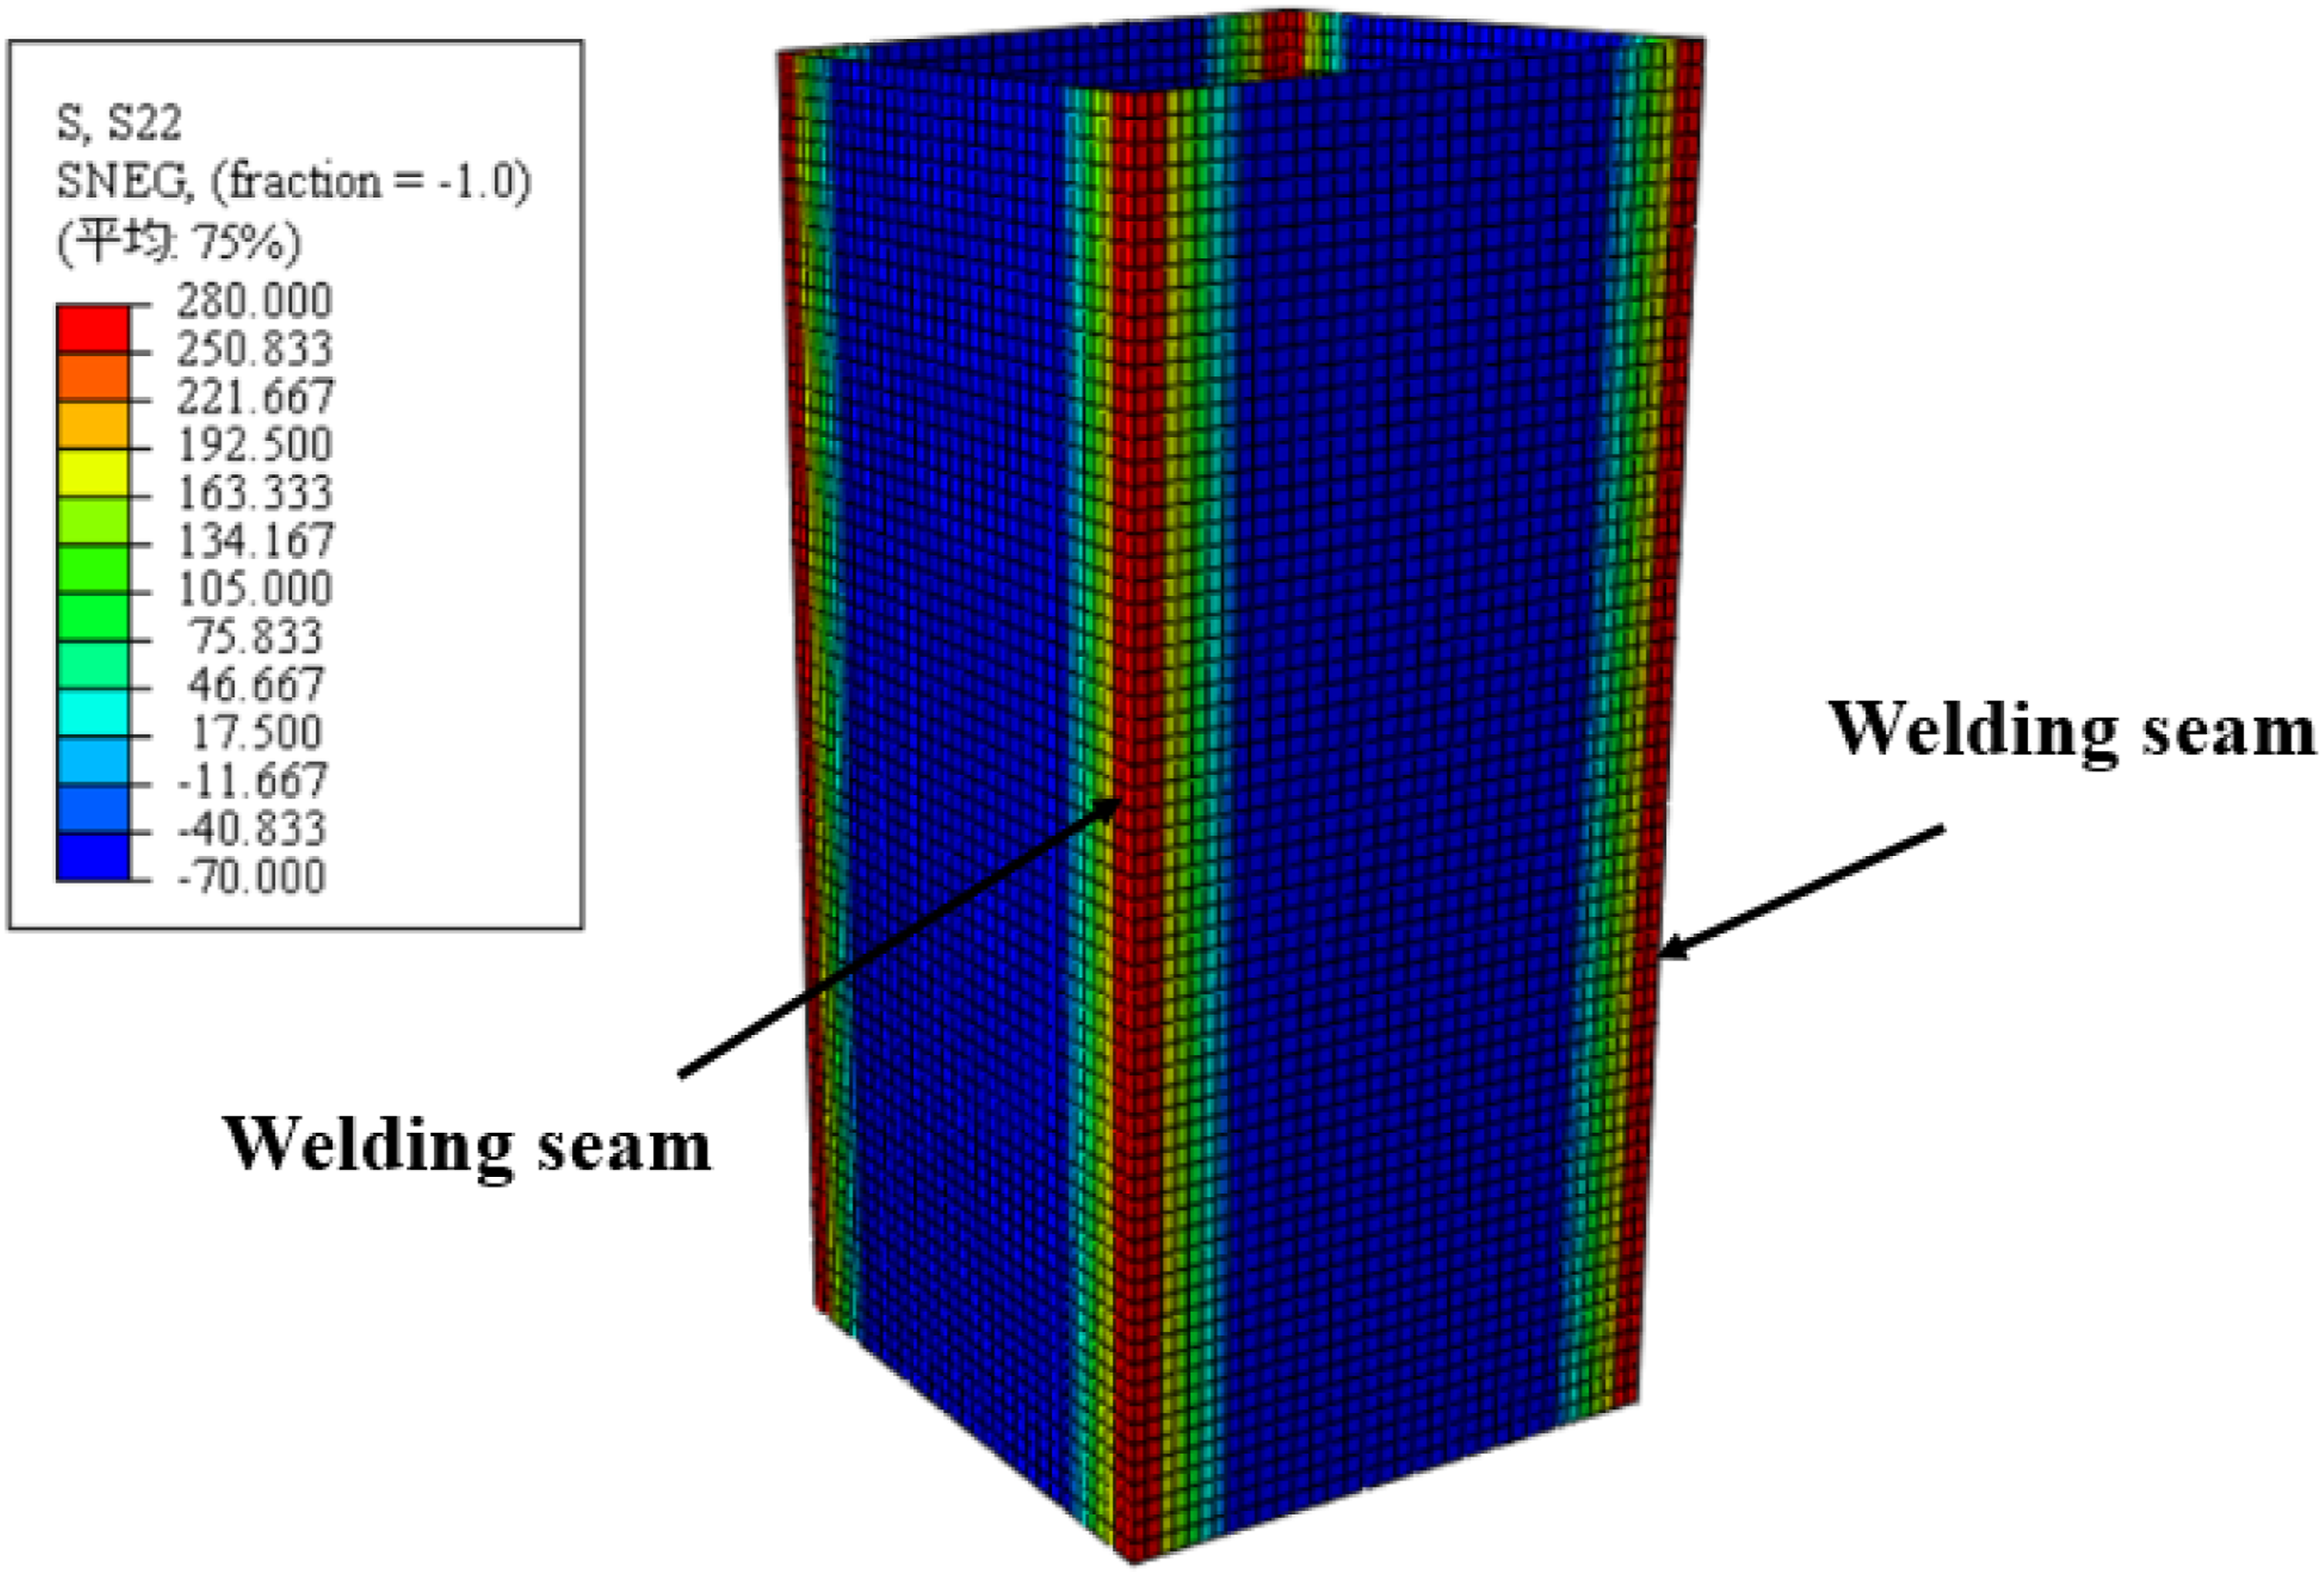
The numerical model used the experimental stress-strain data from tensile coupon tests, converting the engineering values to true stress and true plastic strain using standard equations (3) and (4). The reduction in strength within the HAZ, as noted earlier, was also explicitly modelled. As established by (Javidan et al., 2016), micro-hardness profiling and microstructural analysis confirm that the severity of property degradation in the HAZ is a function of both plate thickness and welding heat input. Their research on welded hybrid sections indicates that the softened region is confined to a well-defined distance from the weld toe. Specifically, the heat input induces a strength reduction in UHSS, with the magnitude of this reduction diminishing with increasing distance from the weld. Experimental data show reductions ranging from 5% to 30%, with no significant degradation observed in tensile coupons extracted far from the welding centreline at approximately 20 mm. This empirical approach for defining the HAZ extent is further supported by prior experimental and numerical studies on HSS welded sections (Lan et al. 2019). These studies adopted a comparable criterion of “15 mm + section thickness” for welded box sections, applying a 30% strength reduction to the critically affected zone adjacent to the weld and a 15% reduction to a less severely affected outer region. Therefore, the extent of the HAZ from the butt welds at the corners was conservatively taken as t + 15 mm along the tube walls, considering the weld profile. The HAZ was assumed to extend through the full wall thickness due to the relatively thin plates. A 30% reduction in yield (fy) and ultimate (fu) strength was applied to the HAZ material immediately adjacent to the welds, and a 15% reduction for HAZ material farther away. Specifically, in the FE model, the HAZ material was assigned a yield strength fy,HAZ-I = 0.7fy and an ultimate strength fu,HAZ-I = 0.7fu for the most severely affected region of the HAZ, whereas for the less affected region, a relatively lower reduction factor of 15% was used (fy,HAZ-II = 0.85fy, fu,HAZ-II = 0.85fu), as depicted in Figure 18. It should be noted that the fy, and fu herein are referred to the mean measured yield strength and ultimate strength from the corresponding parent plates. The ultimate strain (εu) for the HAZ near the welds was set to 2.1 times that of the Q1100 base metal, while the elastic modulus (Es) was kept unchanged (Lan et al., 2018). Modelling of materials in HAZ and butt welding at corner region.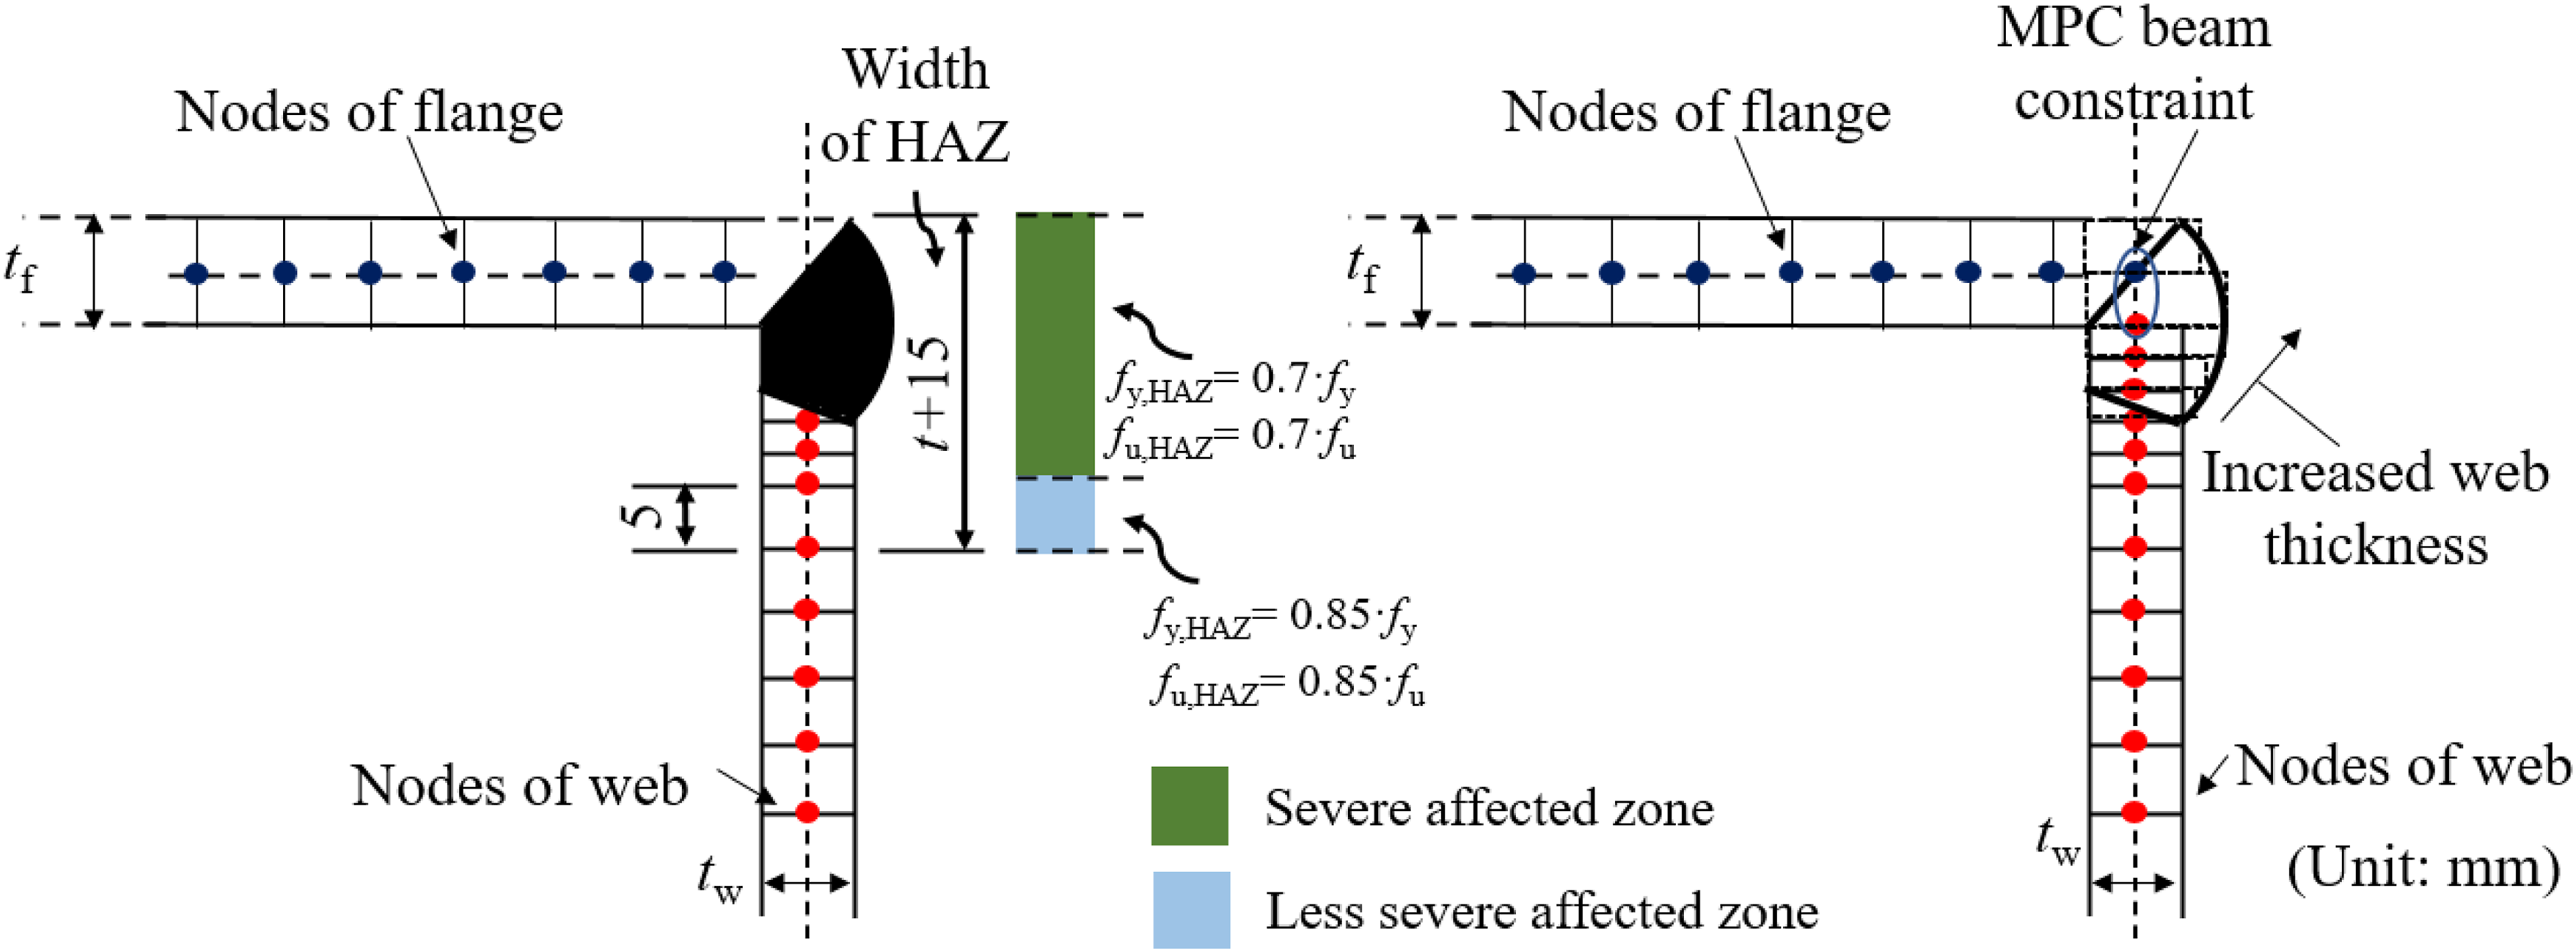
In particular, attention was also paid to the butt welds to ensure that the geometries of the butt welds can be accurately represented. The nodes at the end of the web were shifted by a distance of half the flange thickness to avoid overlapping of the elements at the web-to-flange junction, these nodes were then tied to the mid thicknesses of the flange and the web by function of “General multi-point constraints (MPC)” which can ensure that the transitional and rotational degrees of freedom were equal for this pair of nodes. The geometries of the welding were accounted for using the additional shell elements with varying thicknesses.
Boundary conditions were implemented through kinematic coupling between end faces and centroidal reference points as shown in Figure 13, with constraints carefully configured to replicate experimental fixed-end conditions. The analysis employed an advanced nonlinear formulation (*NLGEOM) with displacement-controlled RIKS step to properly account for large displacement effects.

The analysis involved two main steps: (i) an initial linear eigenvalue buckling analysis to identify potential buckling modes (Figure 19), followed by (ii) a nonlinear static Riks analysis that incorporated both material and geometric nonlinearities. Notably, the initial imperfection shape applied in the models was not the first buckling mode but the asymmetric outward waveform observed in the tests, which significantly improved the accuracy of the failure mode prediction. A sensitivity analysis on the imperfection amplitude considered the measured imperfection ω0, t/10, t/100, and the code-recommended b/200 in EN 1993-1-5, 2006 (CEN 2006). The results indicated that an amplitude of (B + H)/400 (equivalent to b/200 as specified in EN 1993-1-5, 2006 (CEN 2006)) offered the best compromise between measured reality and conservative estimation, and this value was adopted for all subsequent analyses. Typical first buckling mode shape generated from linear perturbation analysis.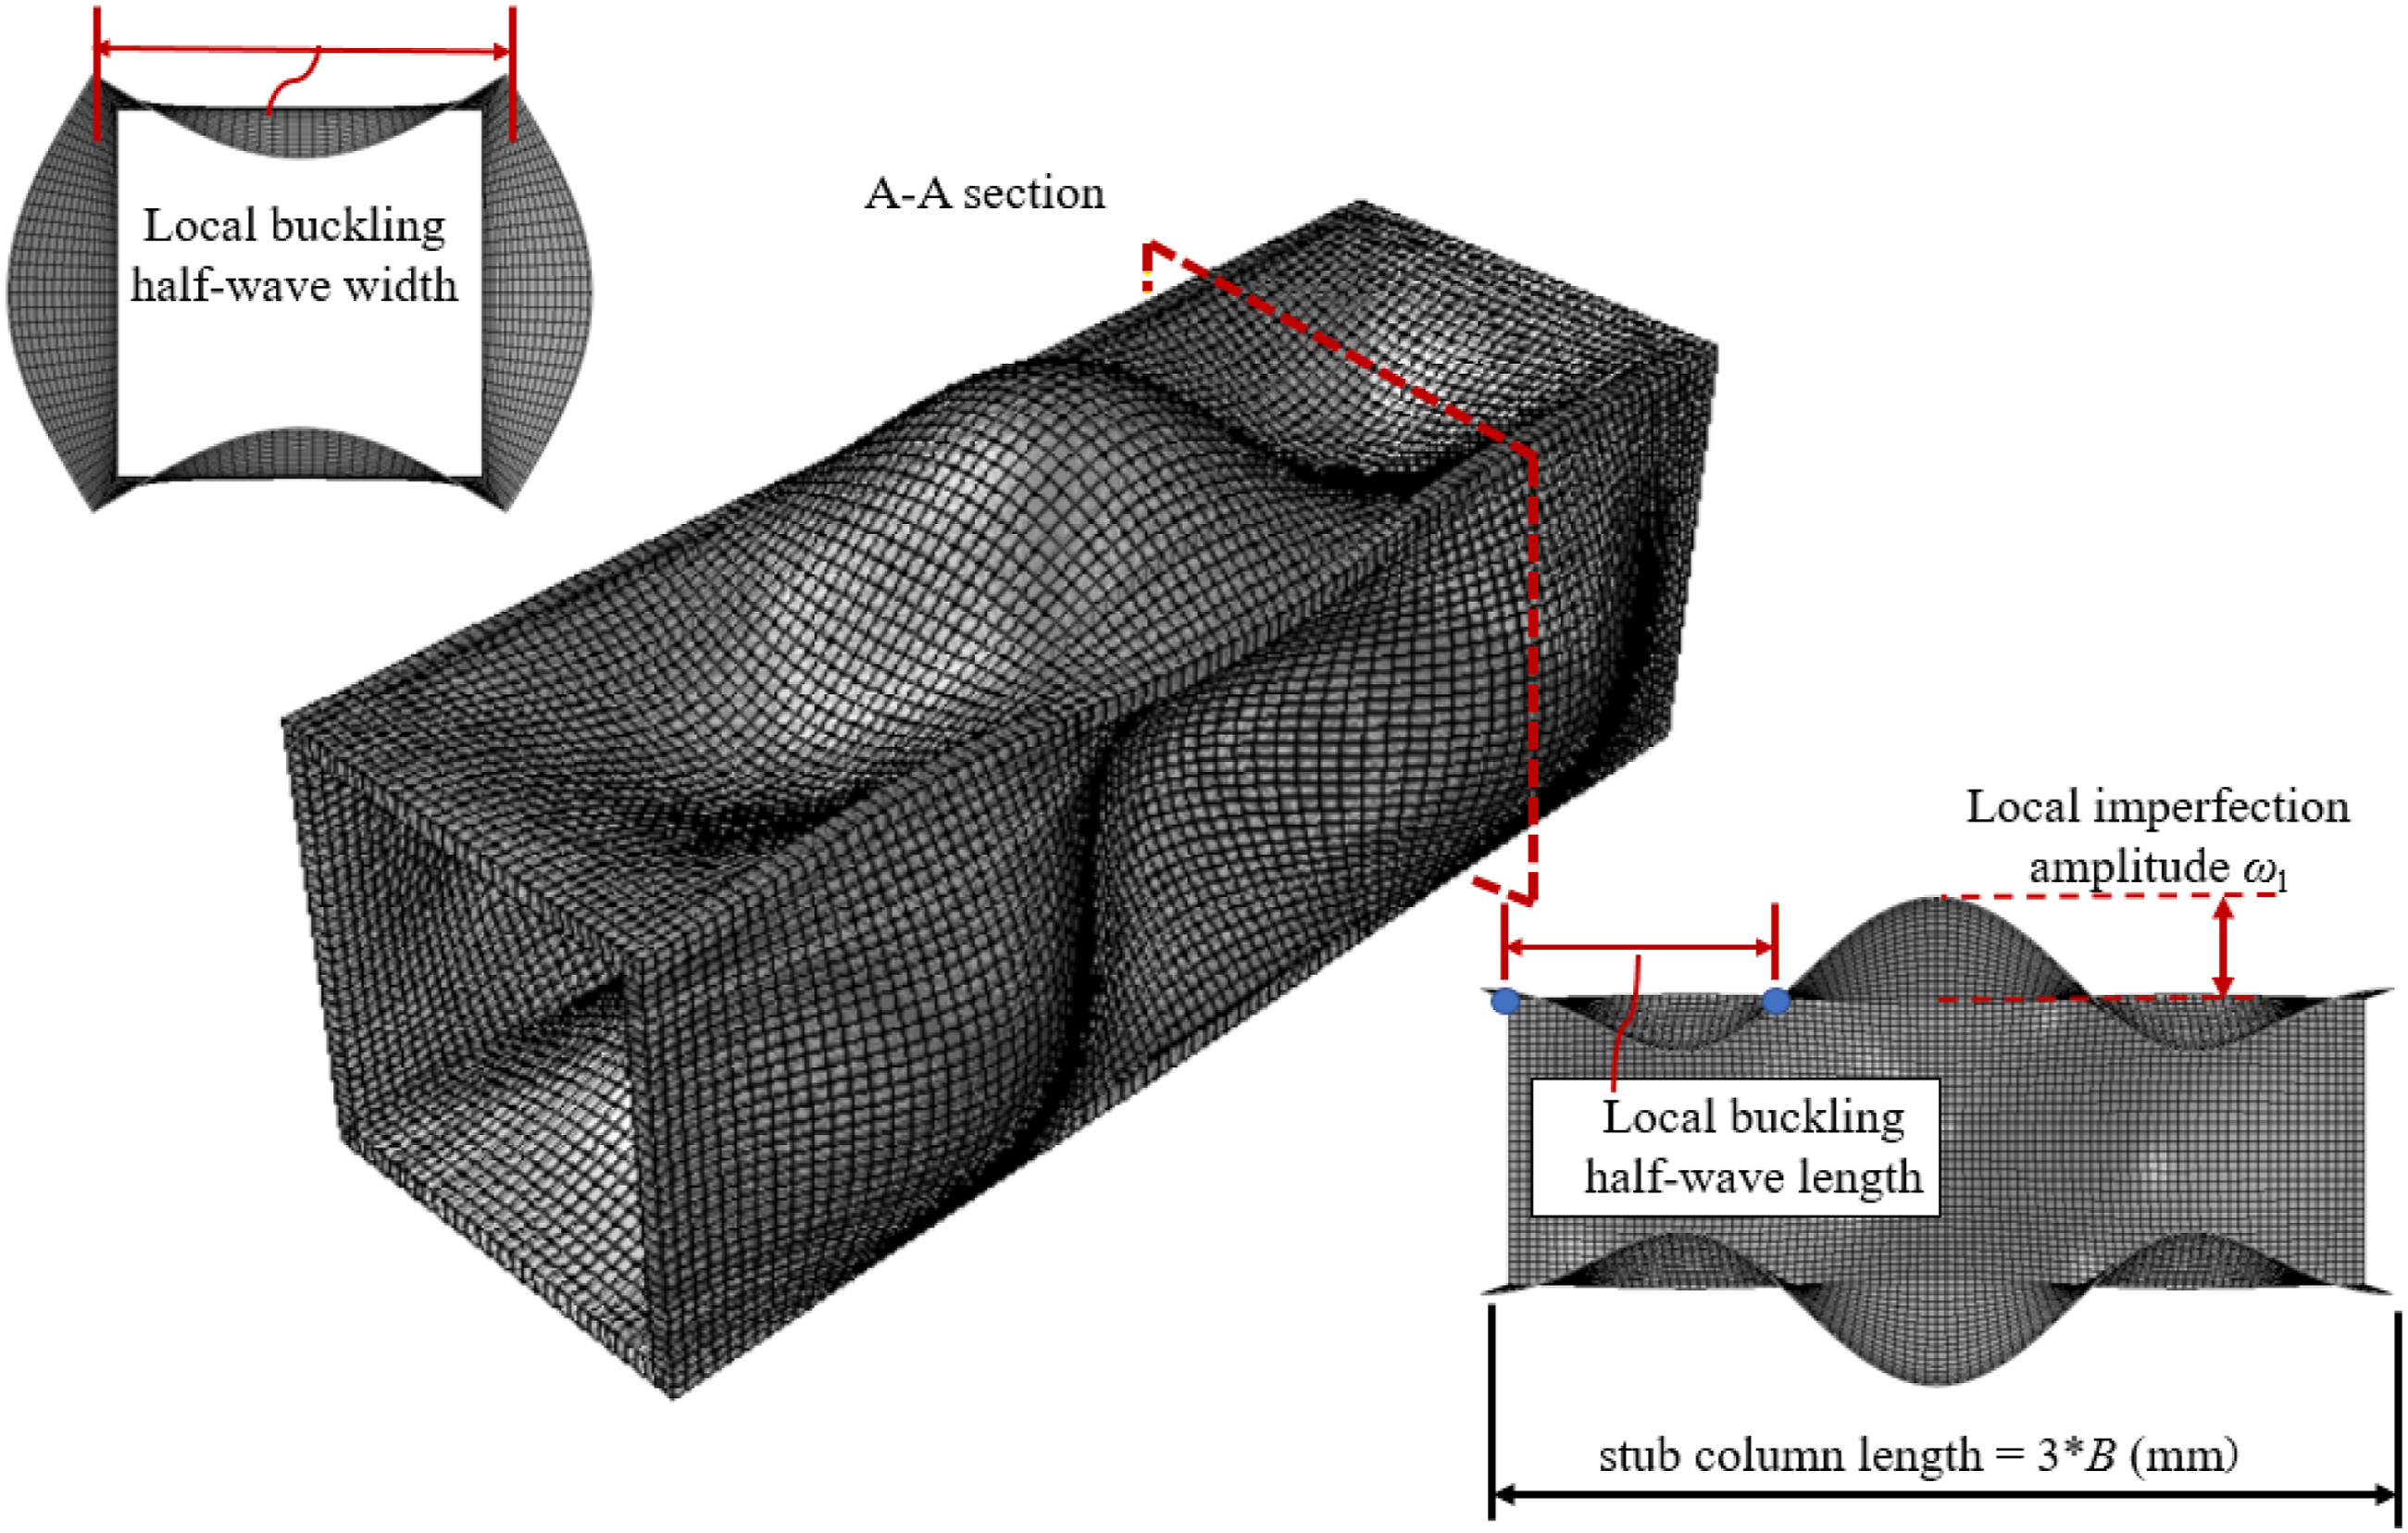
Validation of FE models
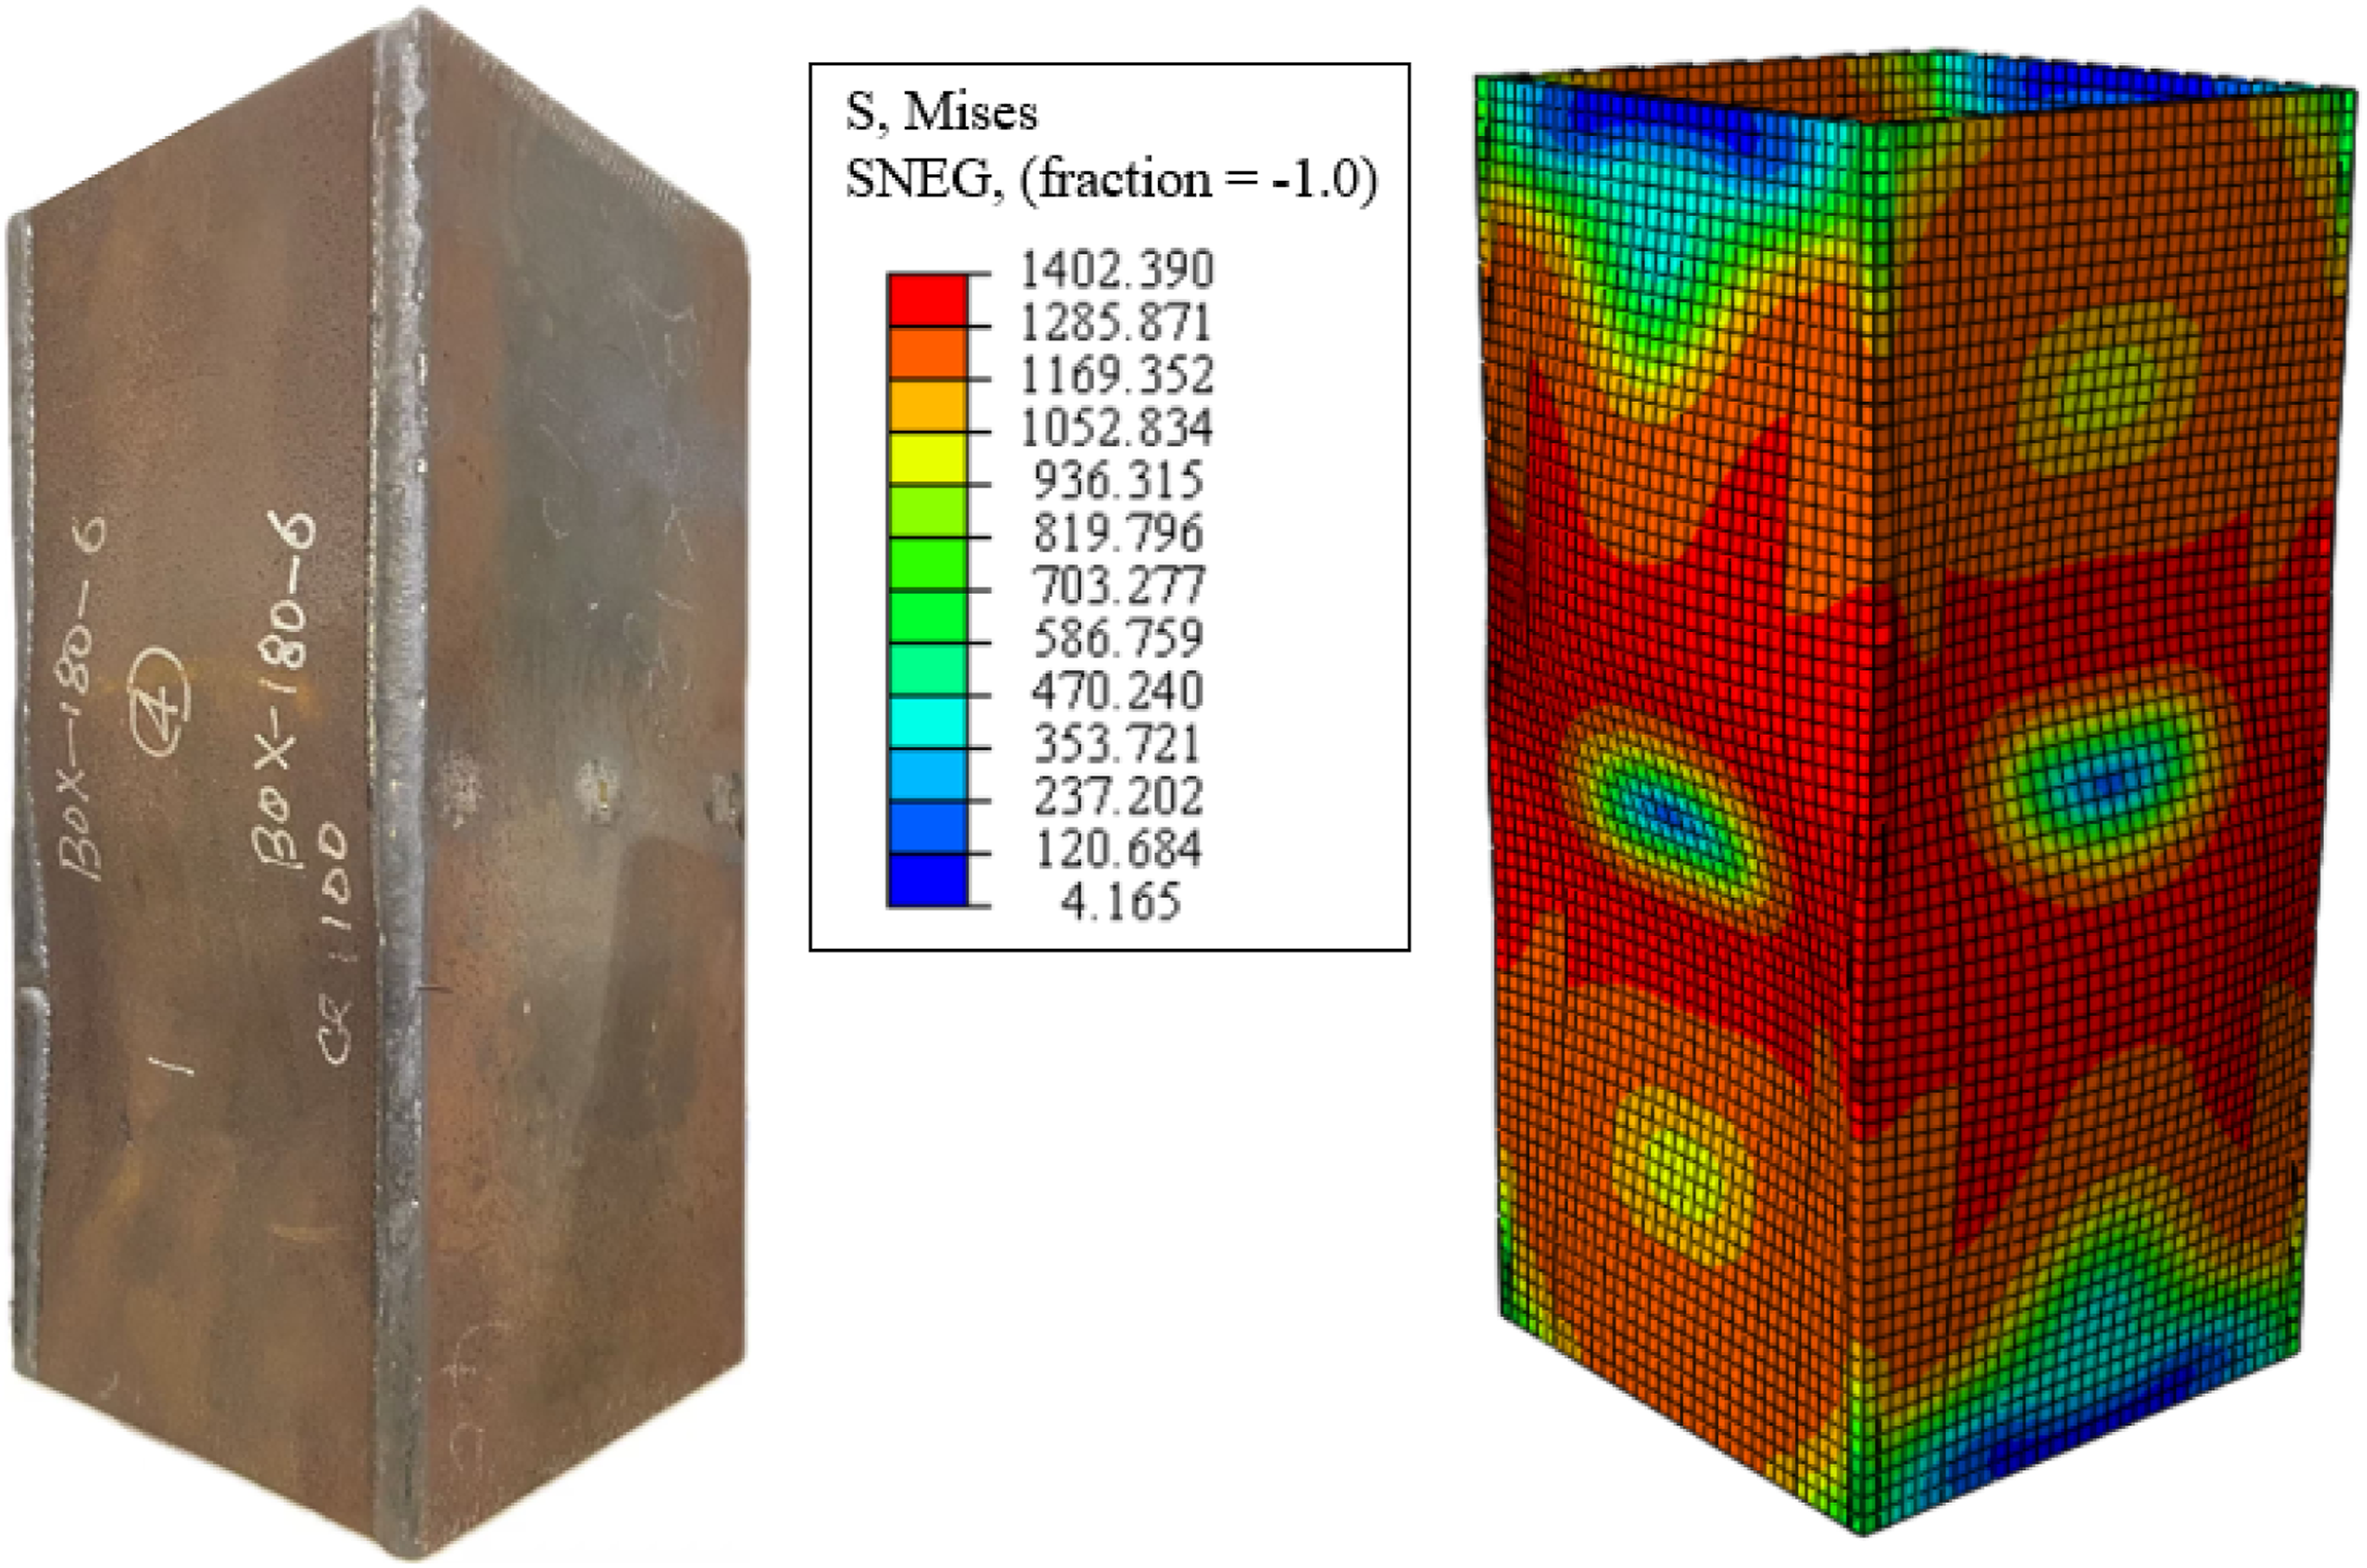
The developed FE models proved highly effective in simulating the behaviour of the Q1100 UHSS welded box stub columns, accurately replicating critical response features such as the load-shortening curve, ultimate cross-section resistance, and failure mechanism. A thorough validation against test data confirmed the reliability of the developed FE model using multiple quantitative and qualitative measures. As shown in Figure 20, the numerical simulations closely matched the experimental load-end shortening curves for sections of Box 150 × 150 × 6 and Box 180 × 180 × 10 respectively, with the predicted and measured curves aligning well throughout the loading history. The ratio of experimental to numerical ultimate load (Nu,test/Nu,FE) averaged 1.01 with a very low coefficient of variation (CoV) of 0.017 when measured residual stresses were included (Table 8). The models also accurately reproduced the physical buckling patterns, as seen in the comparison for the Box 180 × 180 × 6 specimen in Figure 21. This extensive validation, covering the response from initial loading through peak capacity and into the post-peak range, strongly supports the robustness of the numerical framework. Comparison between the experimental and numerical load-end shortening responses. Test and FE failure modes for Q1100 ultra-high strength steel box section stub column Box 180 × 180 × 6.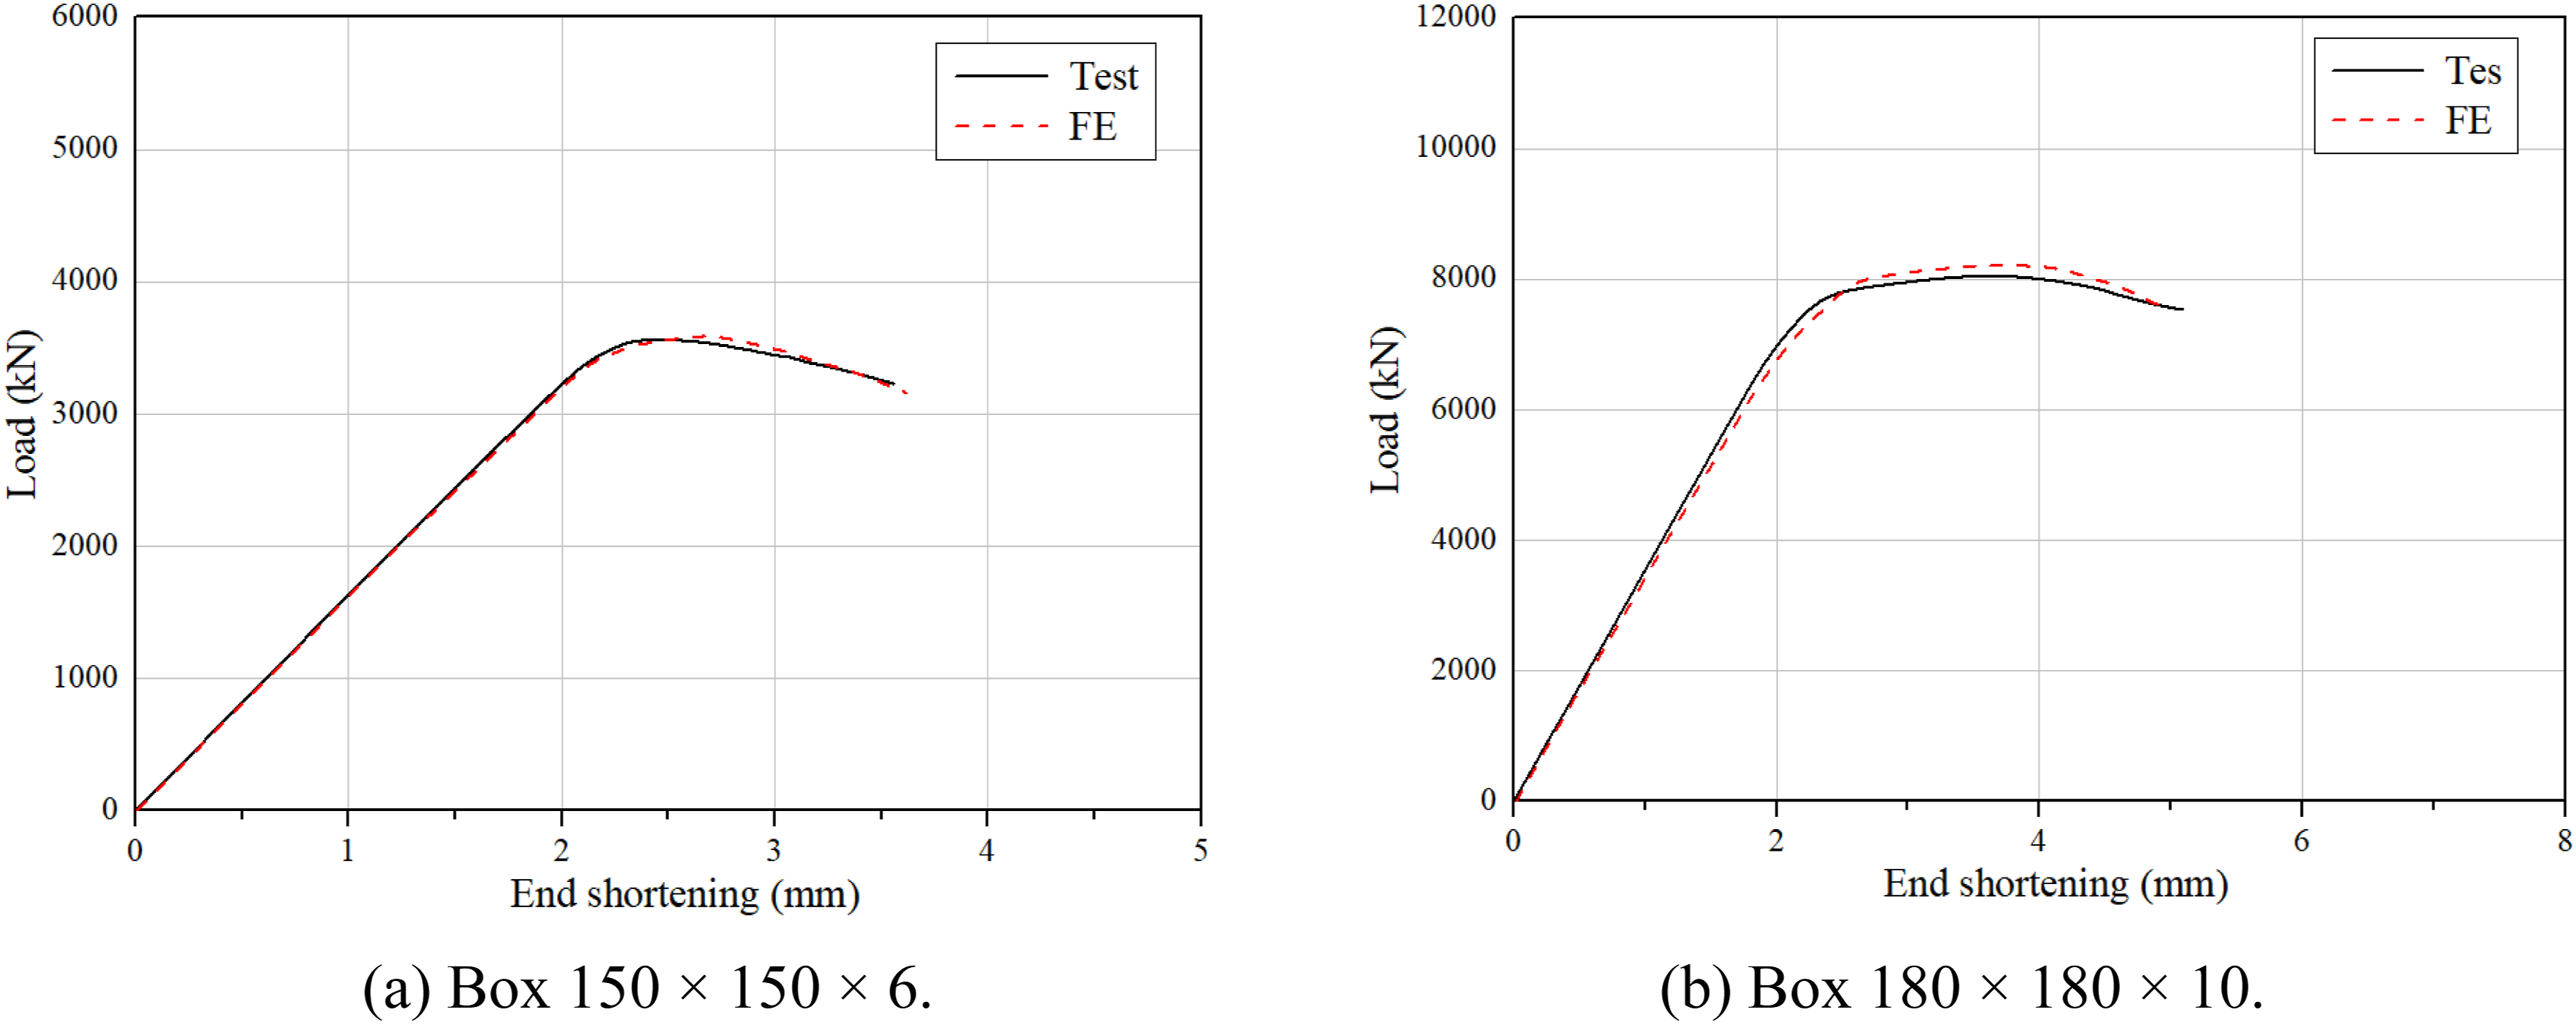
Parametric study
A broad parametric study involving 57 numerical models was conducted to explore the influence of geometric parameters on the axial compression behaviour of Q1100 UHSS welded box sections. The study covered a wide range of width-to-thickness ratios (b/t = 8 to 81.3) by varying the section width (B = 100-300 mm) and the plate thickness (t = 3, 6, and 10 mm), ensuring coverage of both tested and untested geometries and addressing uncertainties related to thickness-dependent material behaviour in UHSS. The modelling included a refined representation of the HAZ, with a width of t + 15 mm from the butt welds at the corners. The column length was set to 3B, same as the physical tests. Initial geometric imperfections were introduced in the shape of the first buckling mode, scaled to an amplitude of (B + H)/400, based on the validation study. According to EN 1993-1-1, the nominal yield strength is typically taken as the characteristic value, defined as the 5% fractile per EN, 1990; CEN 2002). Assuming a lognormal distribution for yield strength with a coefficient of variation νfy = 0.07 as per JCSS (2002), the mean yield strength was calculated as fy,nom/(1 - 1.583 × 0.07) = 1237.1 MPa. This value exceeded the mean measured yield strength of the parent plate (1171.5 MPa), so the latter was used in the parametric study for flat portion whereas the modelling method for HAZ introduced in Section “Developement of finite element (FE) models” was used for material properties within HAZ. The ultimate strength fu was taken as 1.05fy, meeting the ductility requirements of EN 1993-1-12, 2007 (CEN 2007). The stress-strain relationships of flat portion and HAZ were modelled using the modified Ramberg-Osgood model from Gardner and Yun (2018), with parameters given in Figure 22. The resulting extensive dataset allowed for a critical appraisal of existing design methods for carbon steel, creating a solid basis for evaluating their accuracy while incorporating the geometric and material nonlinearities observed in the tests. Stress-strain model used in parametric study for flat portion of UHSS Q1100.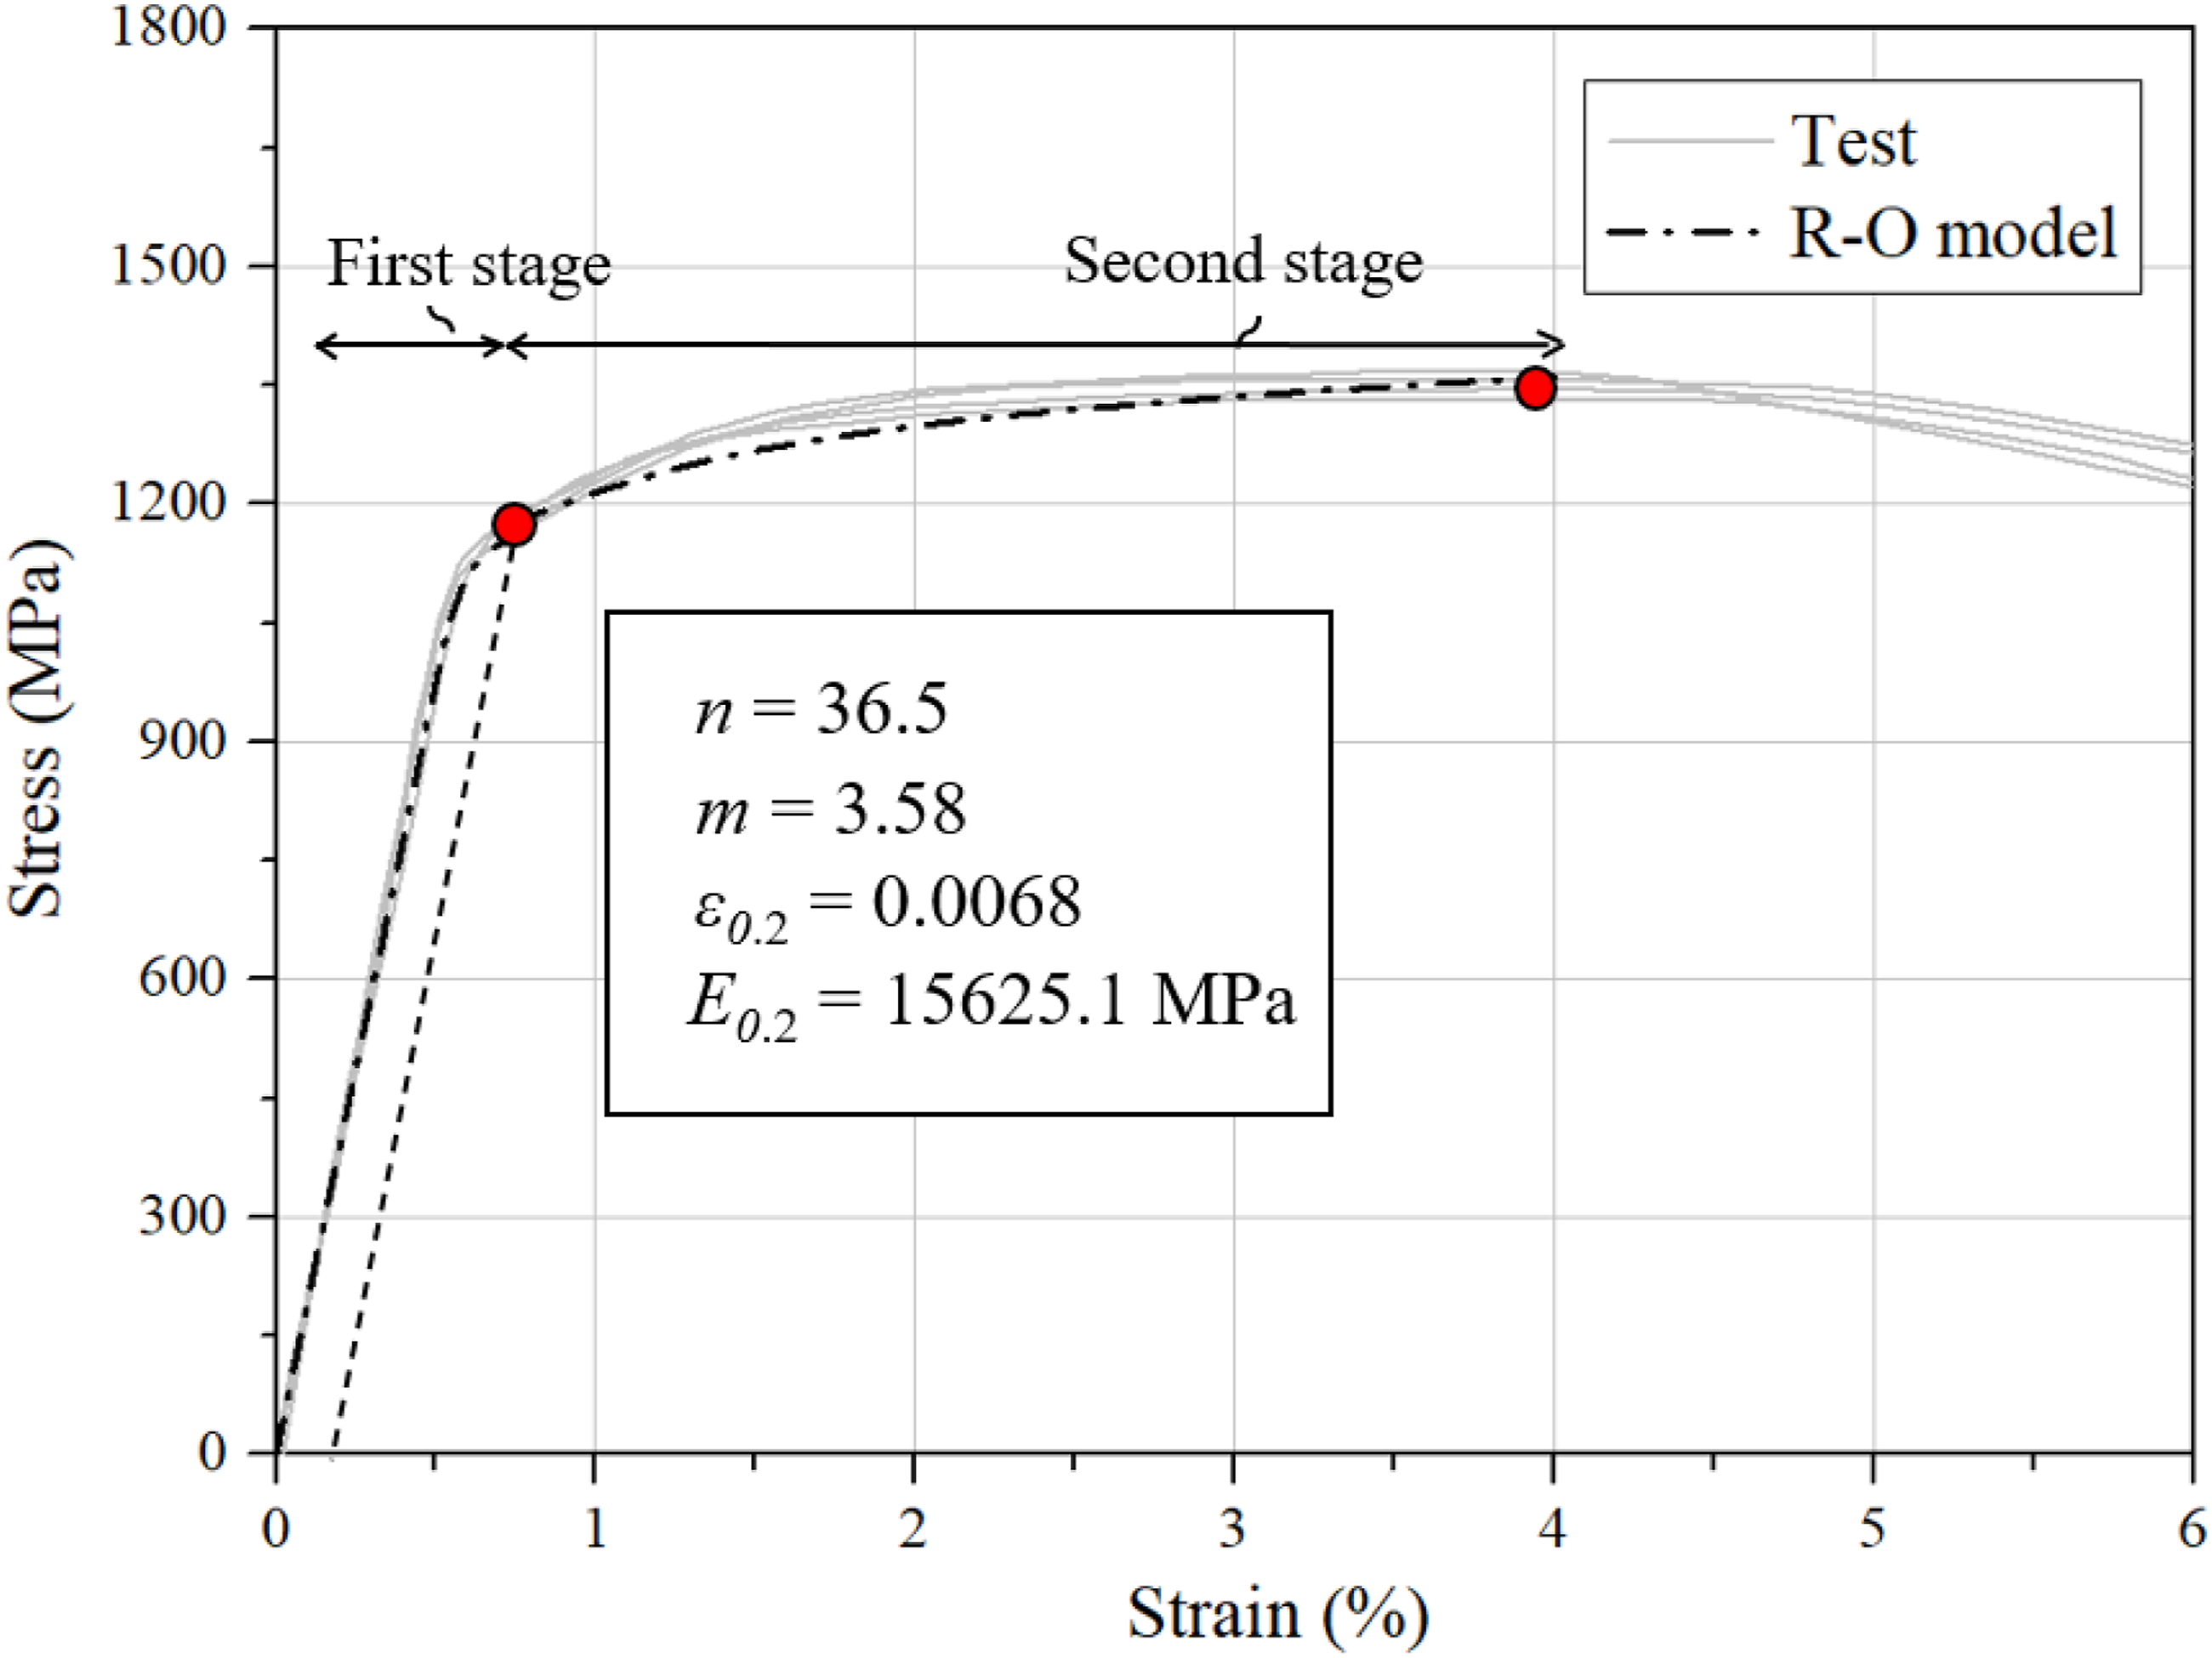
Design methods evaluation
General
This section assesses the suitability of existing structural design standards, which were originally developed for conventional mild steel, for predicting the local buckling resistance of Q1100 UHSS welded box stub columns. The evaluation uncovers fundamental shortcomings in current design approaches, as seen from the examination of three major codes. The ANSI/AISC 360-22, 2022 (AISC 2022) and AS 4100-2020, 2020 (AS 2020) specifications provide general rules for hot-rolled and cold-formed conventional steel sections, while EN 1993-1-1:2022, 2020 (CEN 2022) specifically covers hot-rolled and welded mild steel components. This study shows that these standards do not adequately capture the distinct material traits and nonlinear response of UHSS, particularly the effects of strain hardening. These results highlight an urgent need for updates to design codes and the development of specialised methods to ensure reliable performance predictions for UHSS structures.
Assessment of classification limit
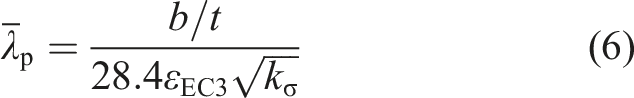
Current design standards use different strategies to classify cross-sections based on their vulnerability to local buckling. Eurocode EN 1993-1-1:2022, 2020 (CEN 2022) uses a four-Class system (Class 1-4 for compression members), where Class 1-3 can reach the full yield stress (Afy) and Class 4 sections are susceptible to local buckling before yielding. A similar distinction is made in ANSI/AISC 360-22, 2022 (AISC 2022) and AS 4100-2020, 2020 (AS 2020) which categorise sections as non-slender (equivalent to Eurocode Class 1-3) or slender (Class 4). These standards use material-dependent parameters, expressed as εEC3 = (235/fy)0.5 for Eurocode, εAISC = (E/fy)0.5 for AISC, and εAS4100 = (250/fy)0.5 for the Australian standard, to adjust for material strength. An alternative approach in AISI S100-20, 2020 (AISI 2020) uses a more fundamental slenderness parameter λp = (fy/fcr)0.5, where fcr is the elastic critical buckling stress, determined by analysis or computation. For the welded box sections in this study, the critical local buckling stress can be calculated from classical plate theory as
Slenderness limits for internal element.
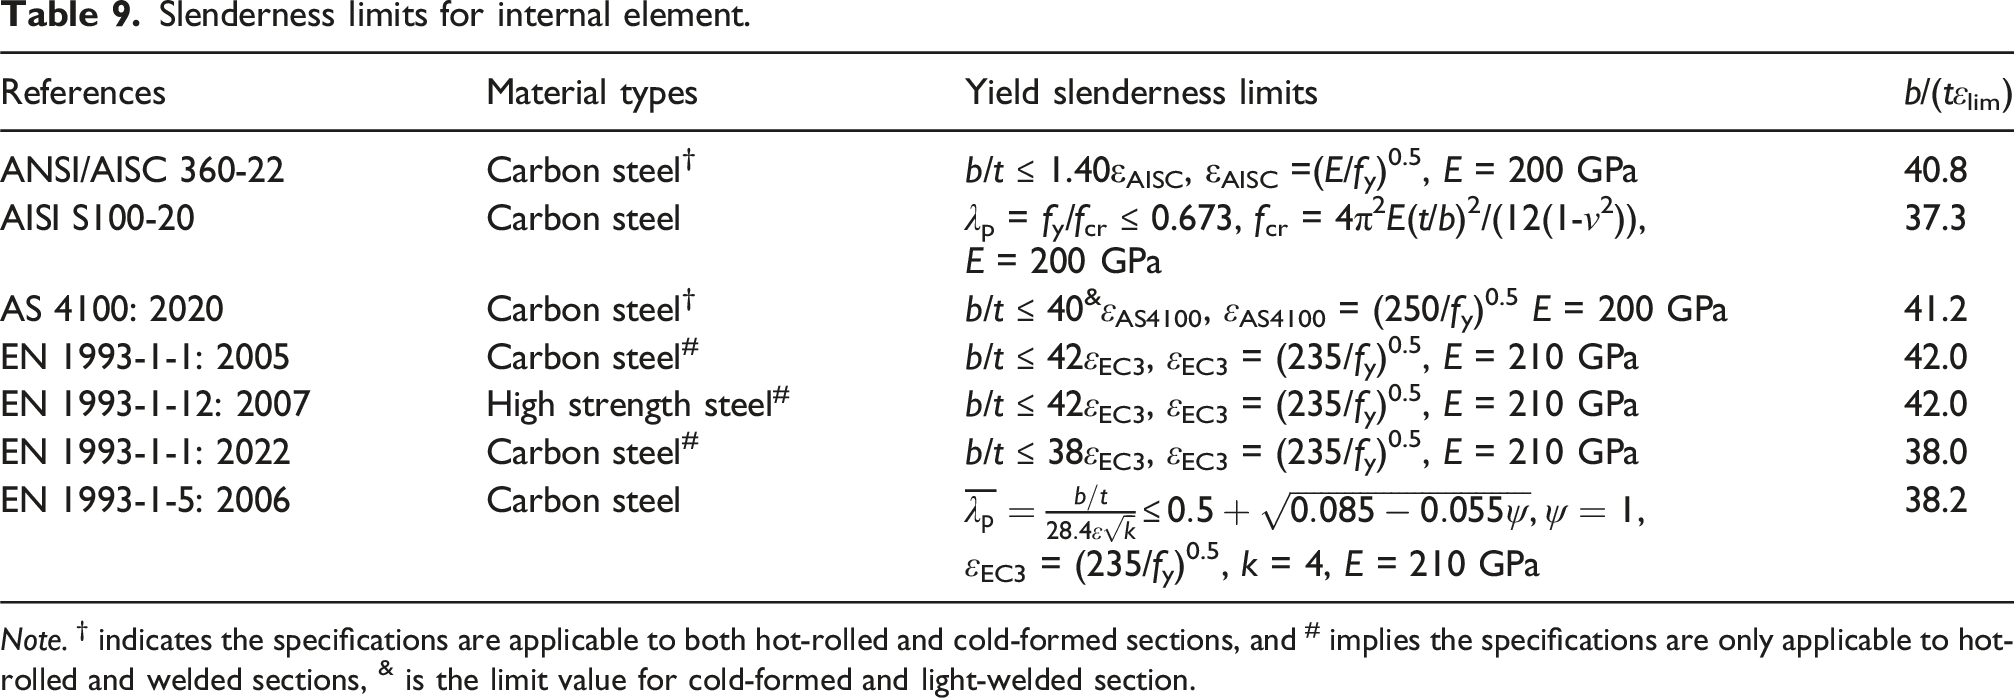
Note. † indicates the specifications are applicable to both hot-rolled and cold-formed sections, and # implies the specifications are only applicable to hot-rolled and welded sections, & is the limit value for cold-formed and light-welded section.
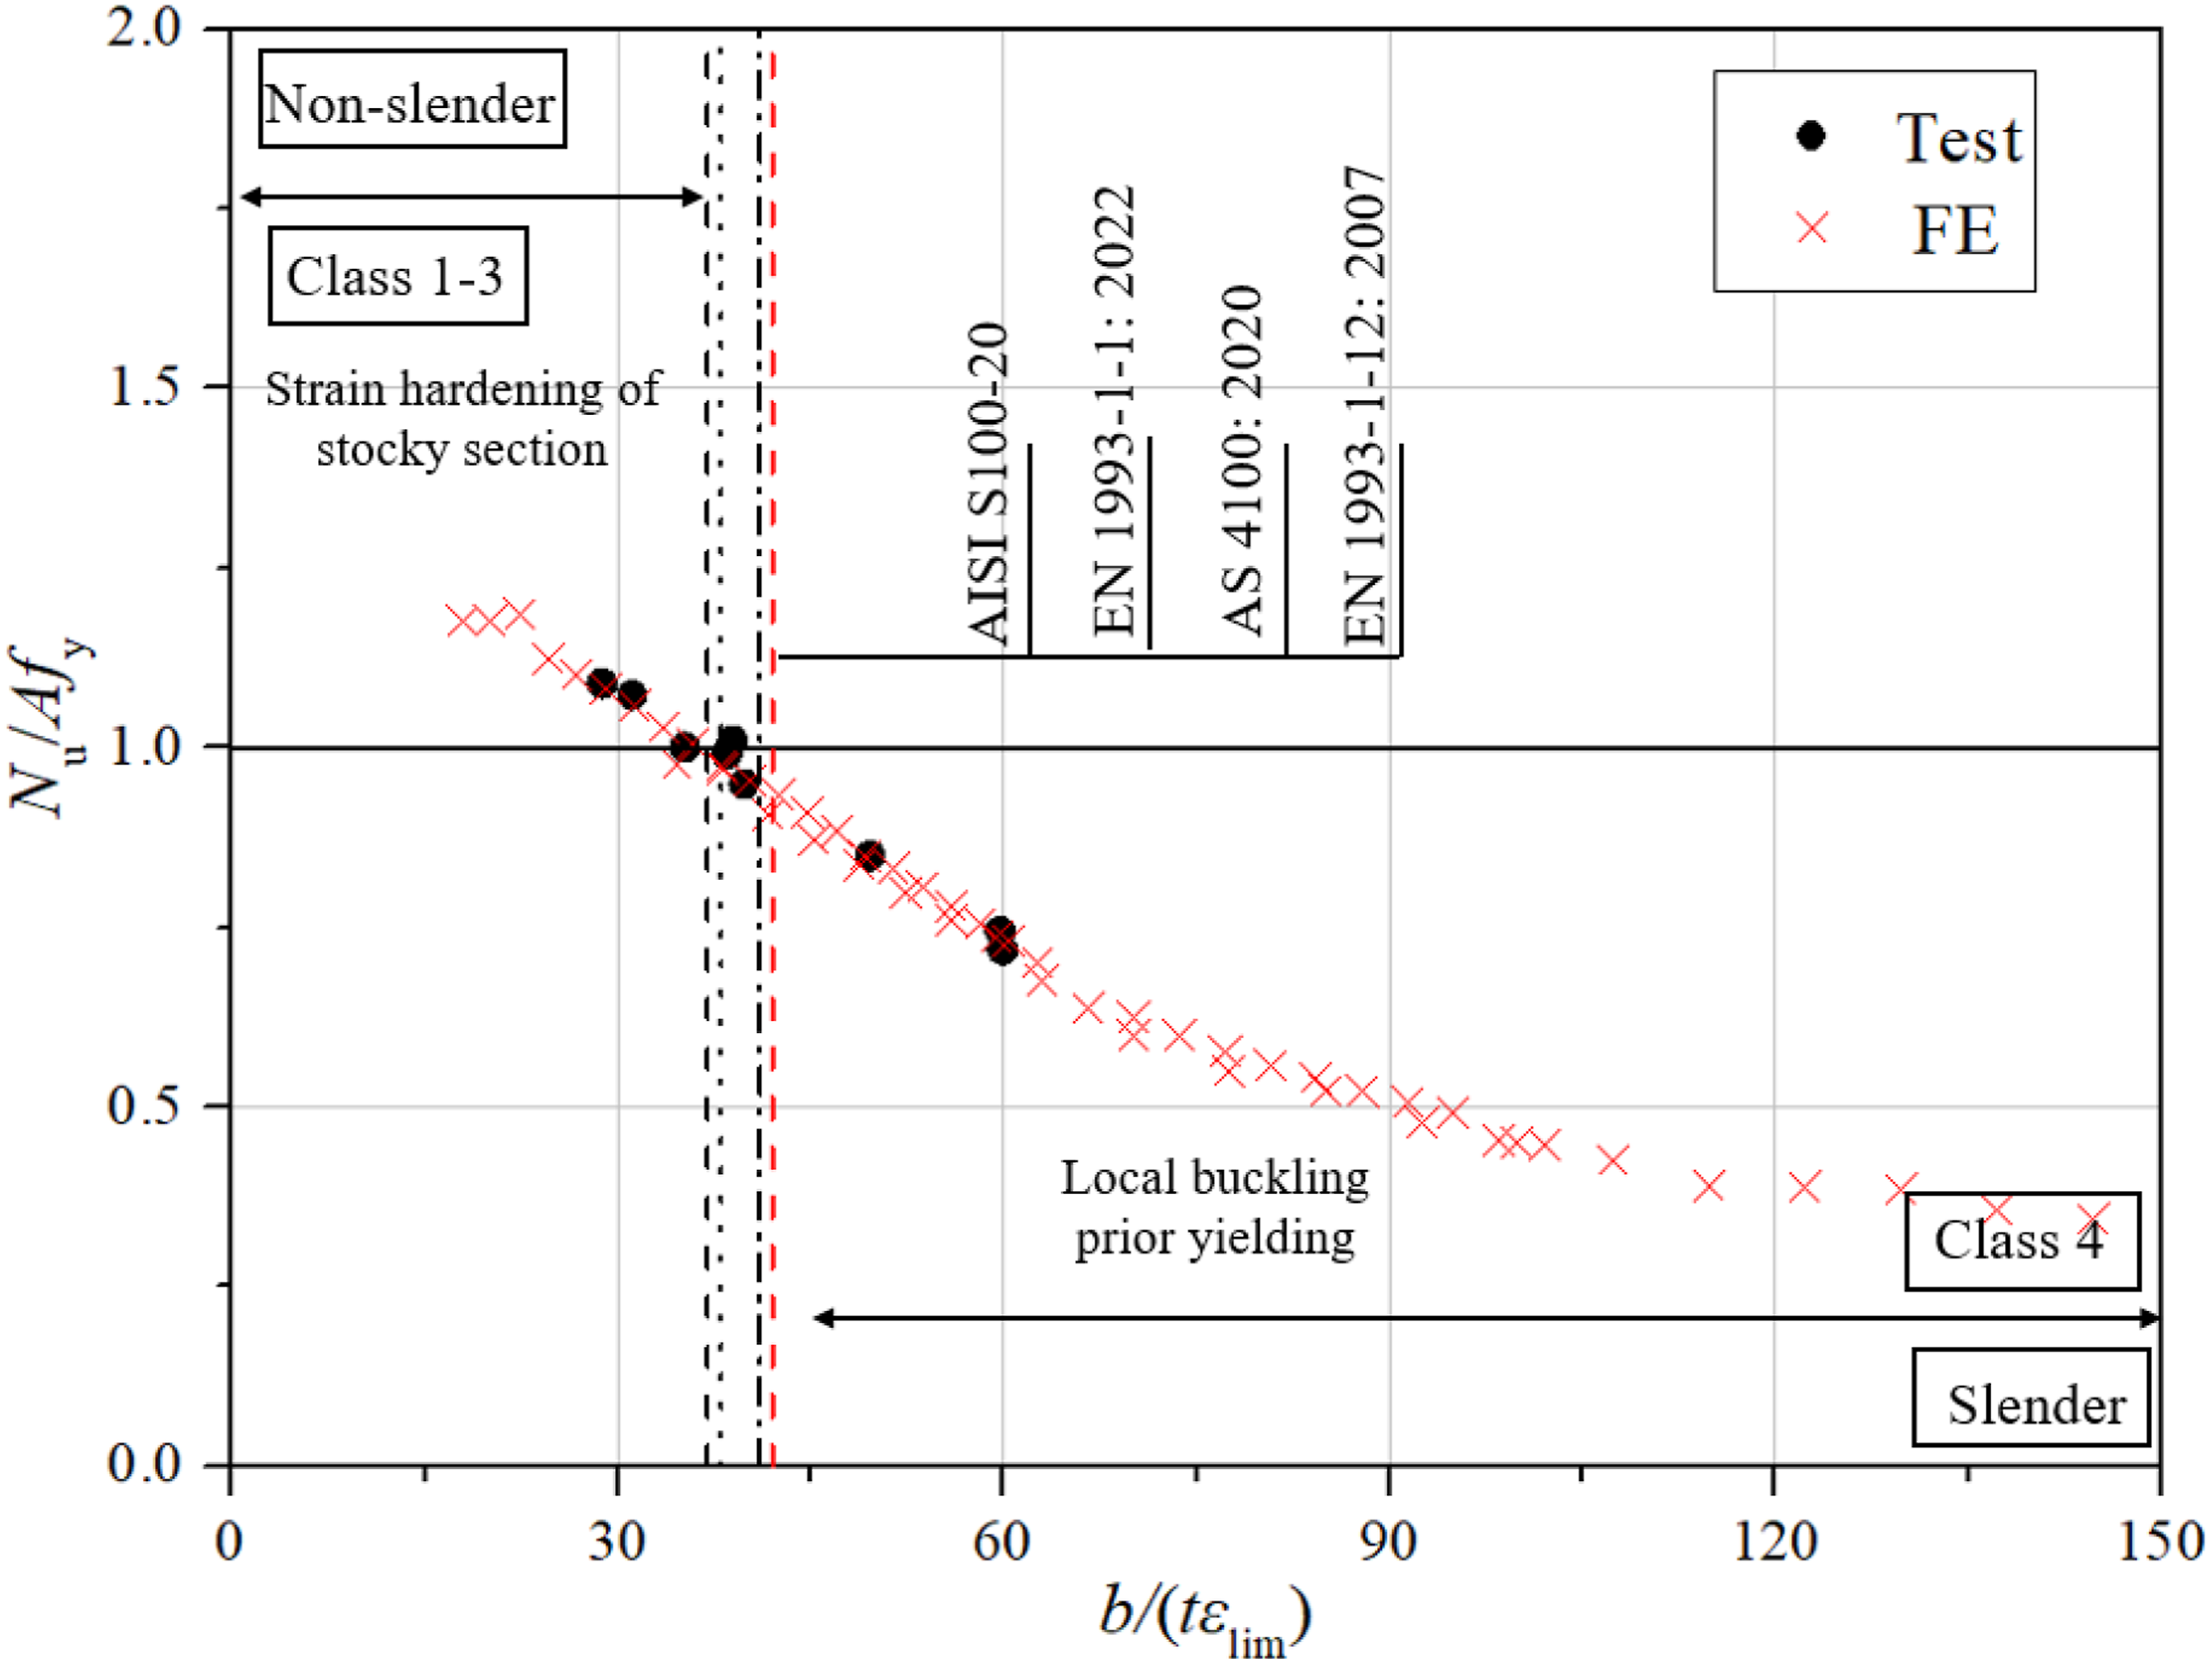
Assessment of slenderness limits in existing design codes for internal plate elements.
Cross-section resistance
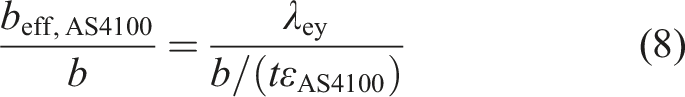
Current design codes such as EN 1993-1-5, 2006 (CEN 2006), ANSI/AISC 360-22, 2022 (AISC 2022), and AS 4100-2020, 2020 (AS 2020) use the Effective Width Method (EWM) to estimate the ultimate capacity of elements that fail by local buckling before yielding. This method accounts for post-buckling strength by reducing the nominal width (b) of the most slender plate element to an effective width (beff), giving a design resistance of Aefffy, where Aeff is the total effective area. Although all three codes use the EWM concept, they employ different formulas for beff, reflecting variations in their theoretical bases and empirical calibrations. The procedure in EN 1993-1-5, 2006 (CEN 2006), given by equation (5), is one example, illustrating the diversity in code approaches to local buckling. The accuracy of these methods was checked using the average measured yield strength (fy) from the base metal coupons, providing a uniform basis for comparing the codes across different geometries and slenderness.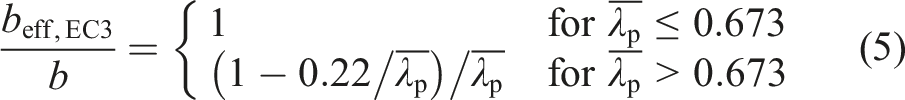
The AISC 360-22 EWM links plate slenderness directly to capacity through two parameters: the limiting width-thickness ratio (λp,AISC) and the actual b/t ratio, as specified in equation (7). The parameter λr in AISC 360-22 defines the upper slenderness limit for non-slender internal elements and is given by 1.4(E/fy)0.5, marking the threshold where local buckling begins to significantly reduce strength.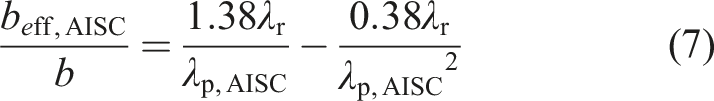
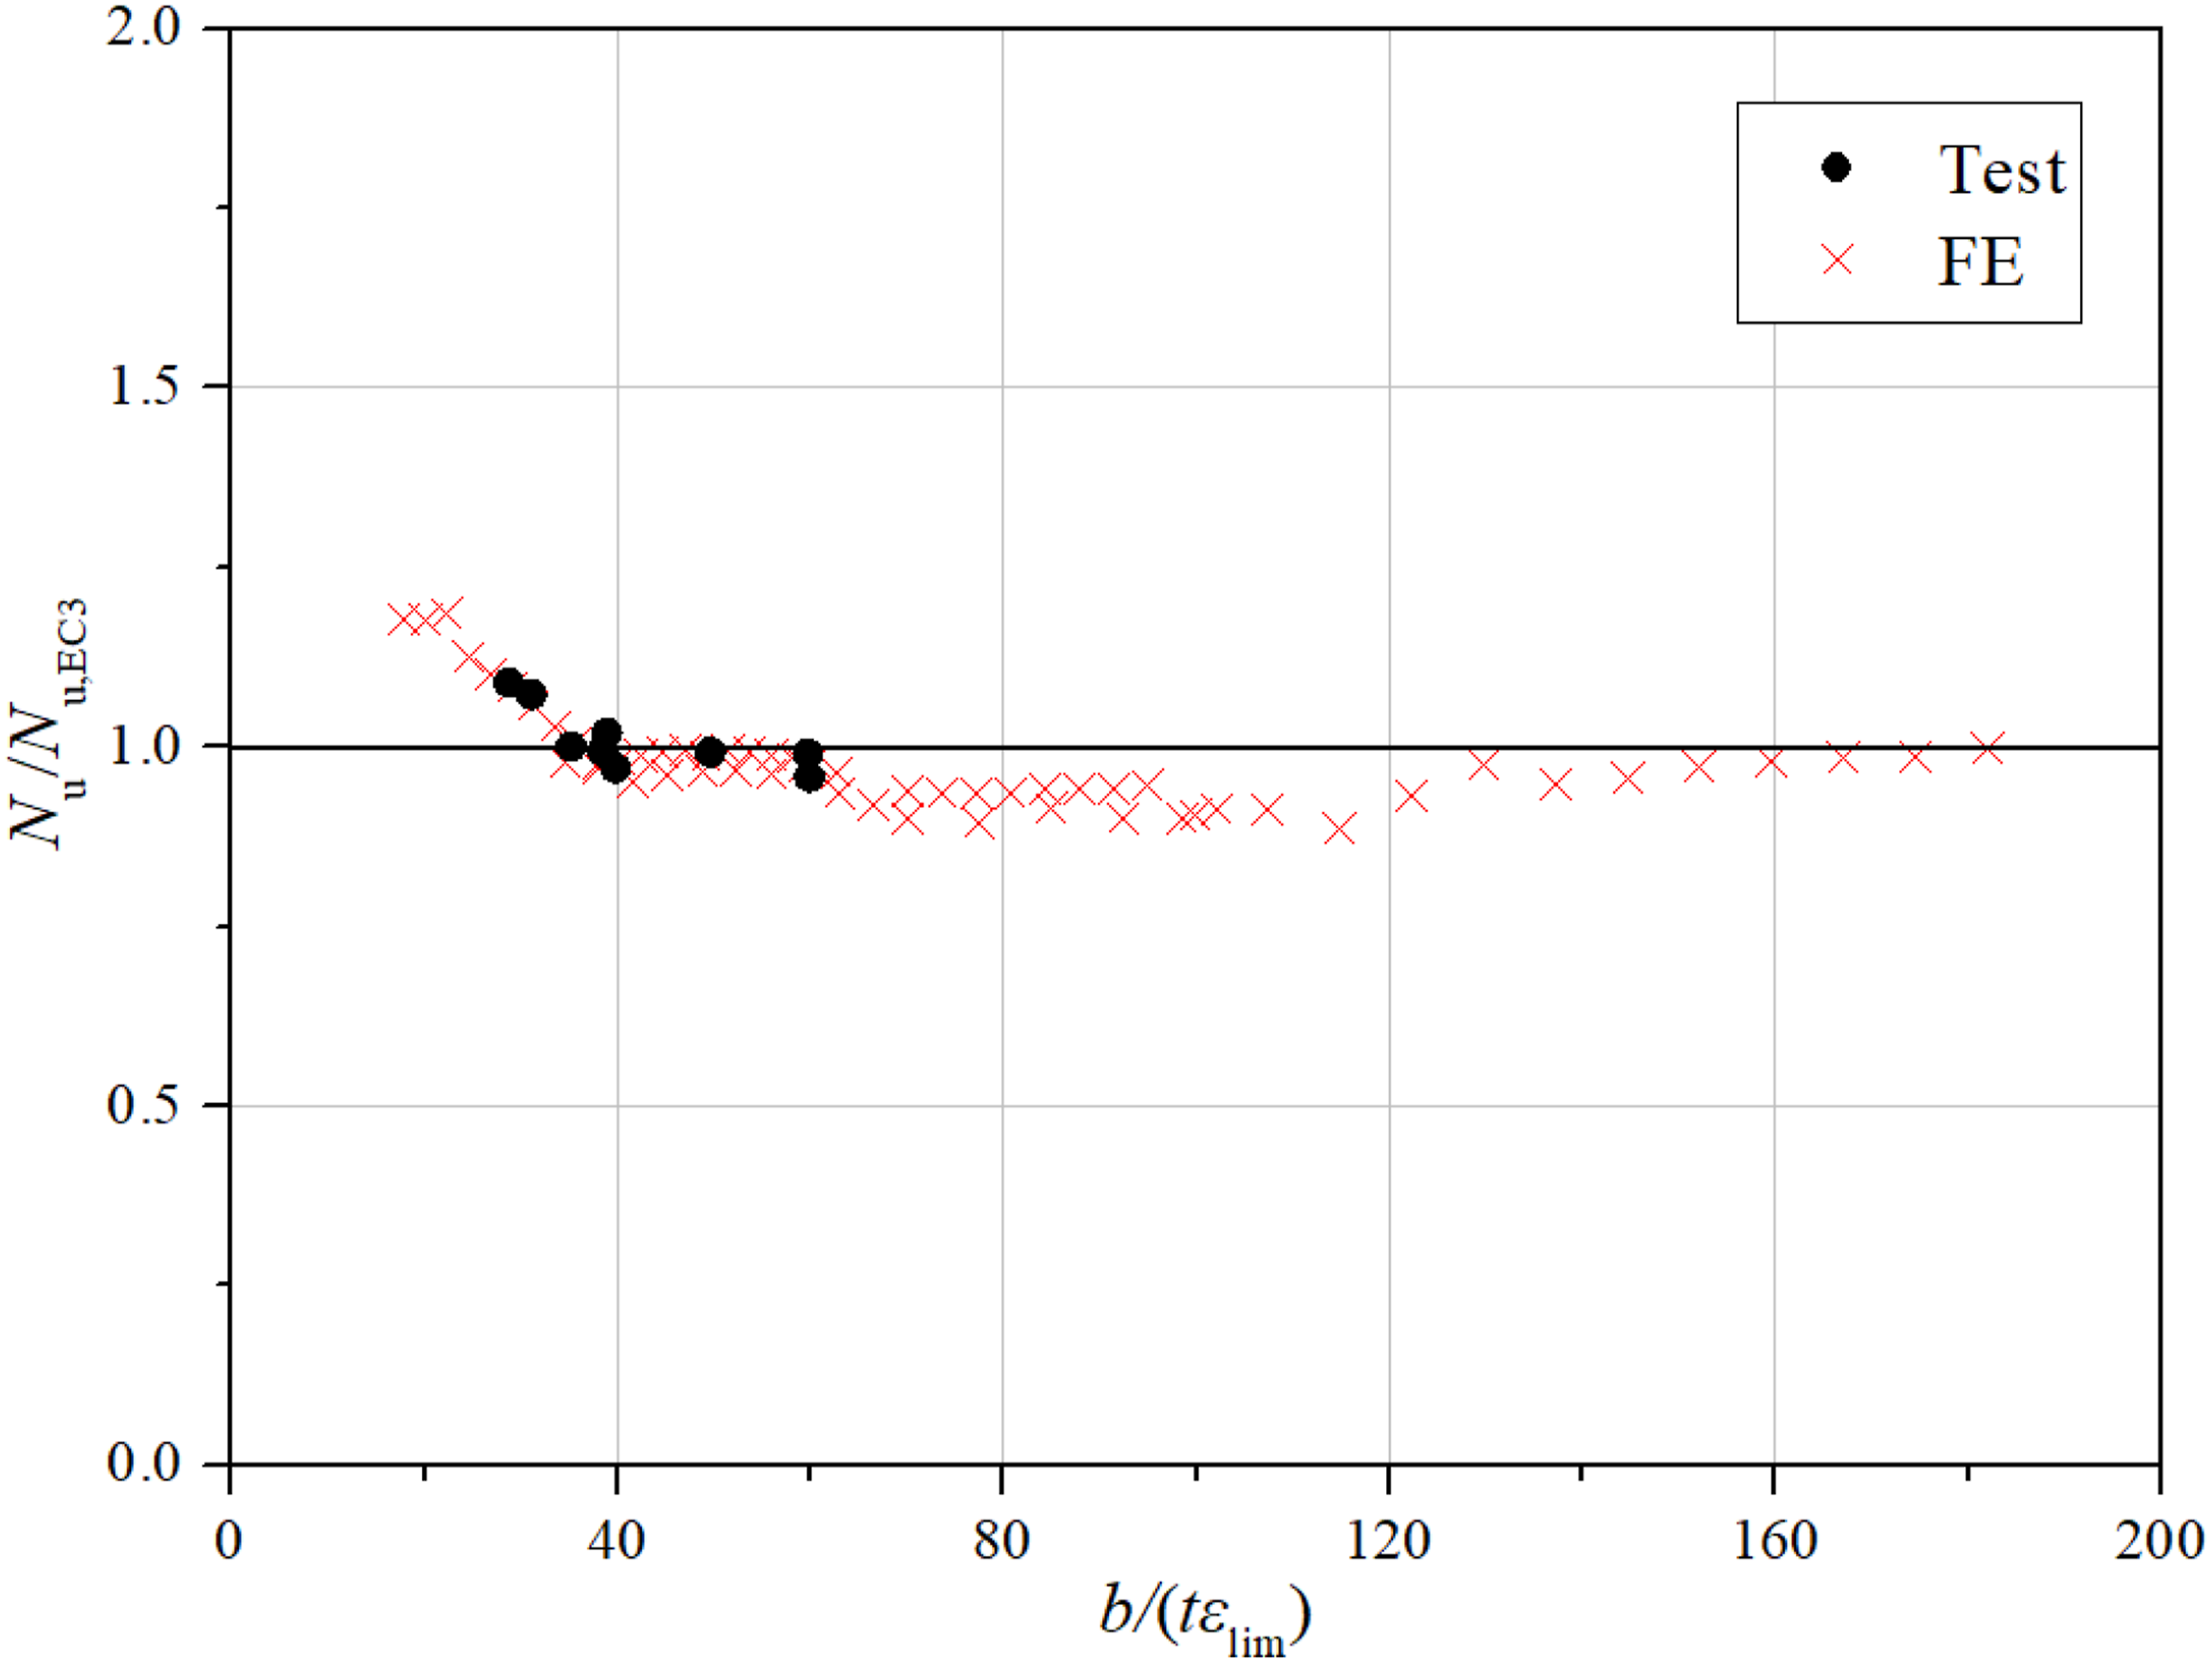
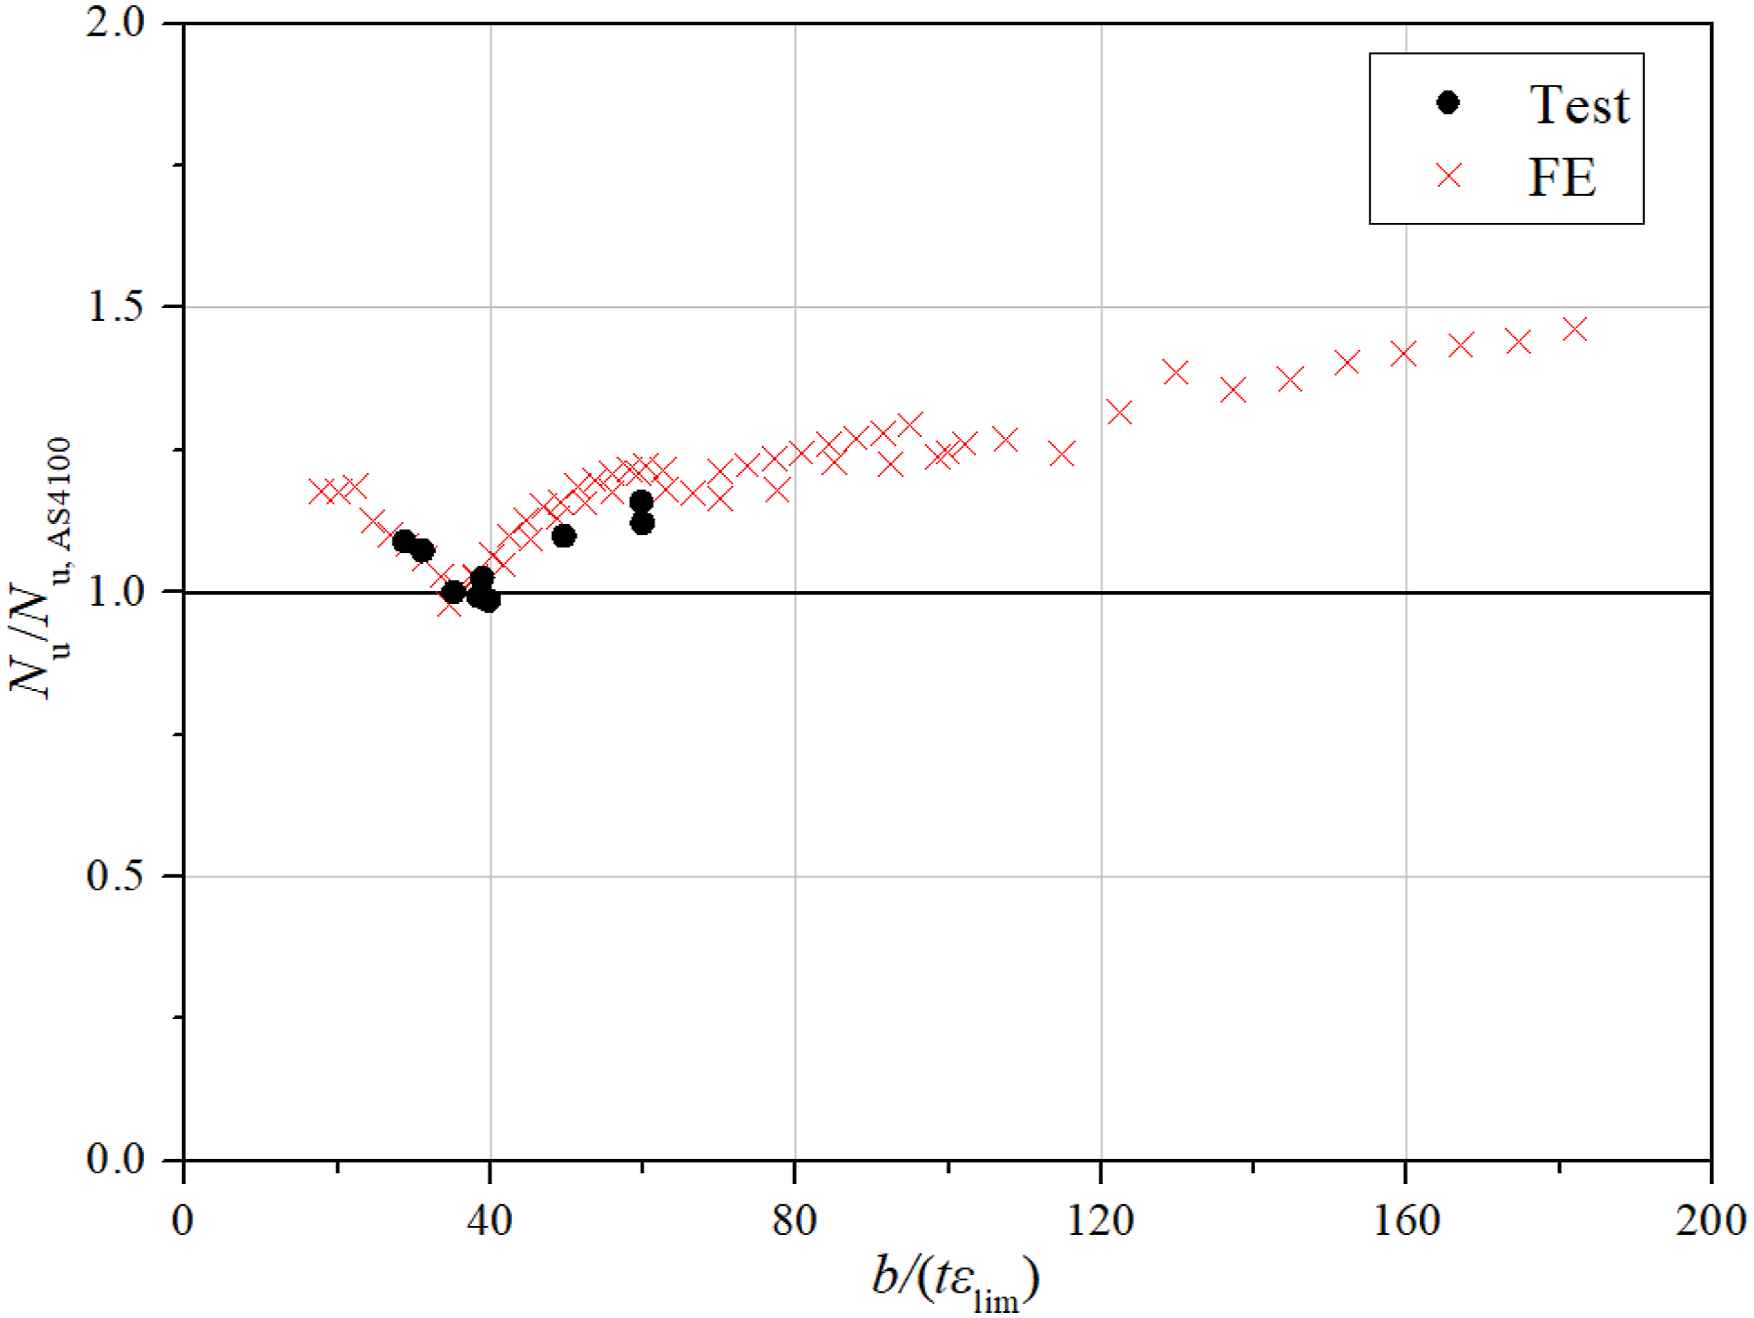
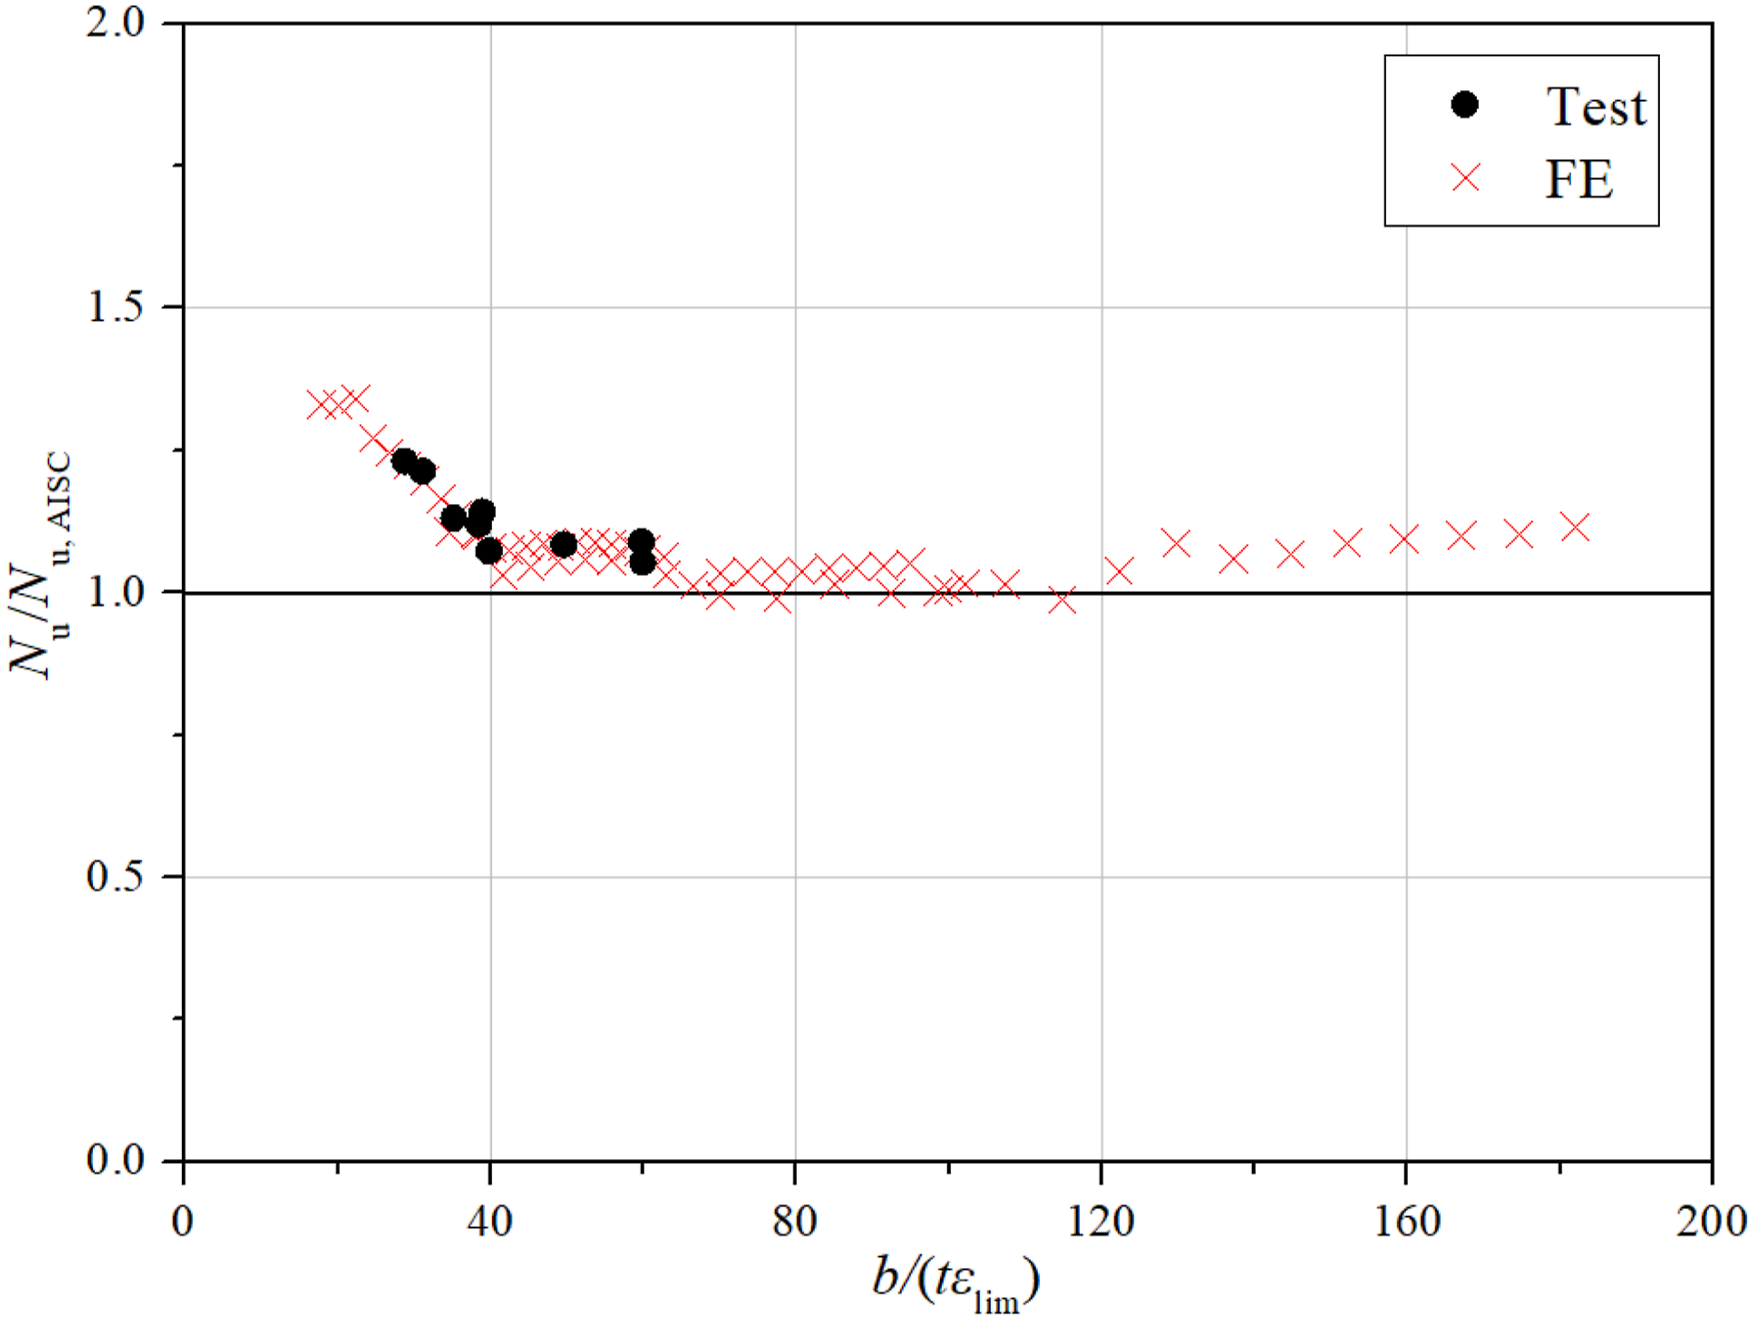
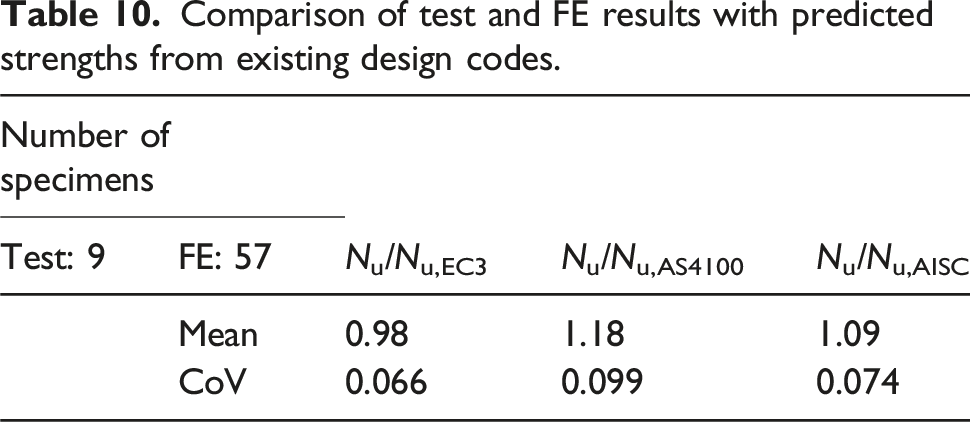
A comprehensive comparison of the design standards, presented in Figures 24–27, shows systematic shortcomings in their accuracy for Q1100 UHSS welded box sections. The analysis indicates that current methods are notably conservative for stocky sections (λp ≤ 0.65), mainly because they ignore strain hardening and cap the resistance at the yield load. For slender sections, EN 1993-1-1 and AISC 360-22 slightly overestimate the resistance, while AS 4100 remains conservative across most of the slenderness range (Figure 24). Quantitatively, the mean ratios of test-to-predicted resistance (Nu/Nu,pred) are 0.98, 1.18, and 1.09 for EN 1993-1-1, AS 4100, and AISC 360-22, respectively, with coefficients of variation (CoVs) of 0.066, 0.099, and 0.074, as reported in Table 10. Figure 26 also shows that the AS 4100 EWM consistently underestimates the strength of slender UHSS box sections, while EN 1993-1-1 and AISC 360-22 are better balanced. However, the consistent conservatism across all codes, especially for stocky sections, points to the need for revised design rules that properly account for strain hardening and the full post-yield capacity of UHSS structural elements, as depicted in Figures 25–27. Assessment of effective width methods in the existing design codes for internal plate elements. Comparison of experimental and numerical results with strength predictions from EC3. Comparison of experimental and numerical results with strength predictions from AS 4100. Comparison of experimental and numerical results with strength predictions from AISC 360-22. Comparison of test and FE results with predicted strengths from existing design codes.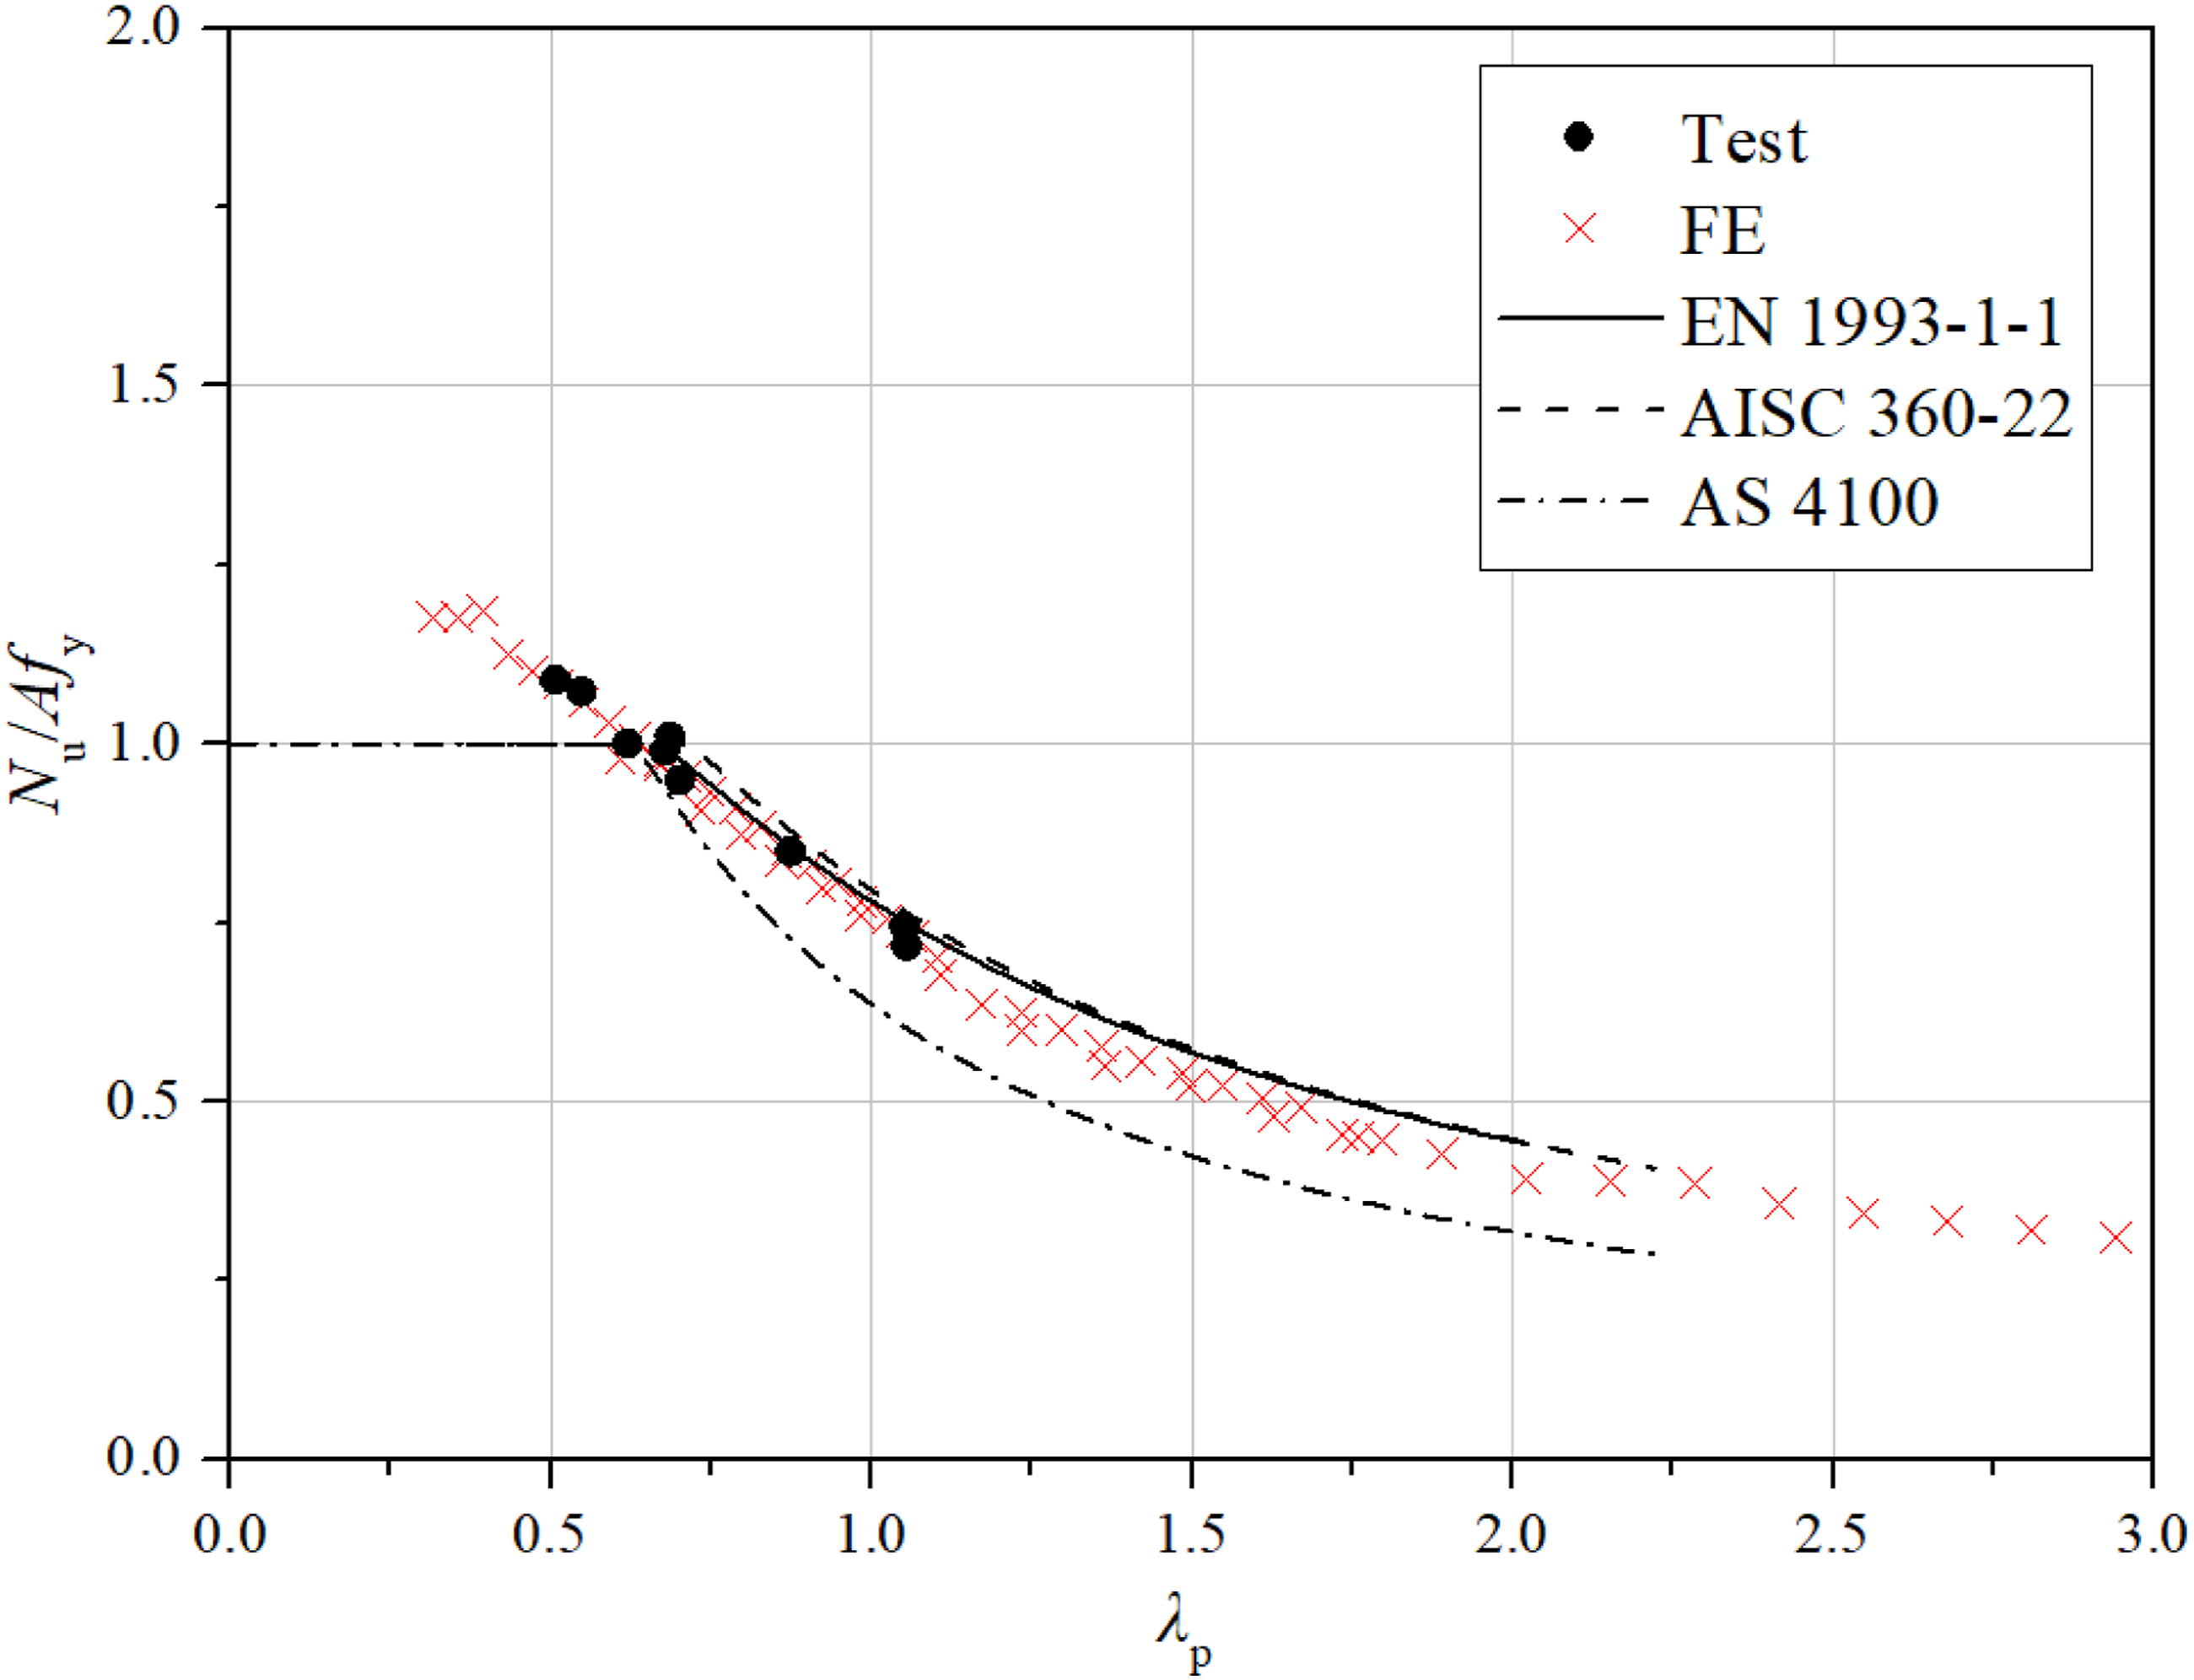
Conclusions
This research has provided a detailed examination of the material properties, residual stress patterns, and cross-section response of Q1100 UHSS welded box stub columns under axial compression, through a combination of physical tests, numerical simulation, and parametric analysis. The measured residual stresses reached a maximum of 37.2% of the yield strength in the weld region, and the welding process led to a 6.1% reduction in the ultimate strength of the HAZ. A key outcome is that existing design standards of EN 1993-1-1, AISC 360-22, and AS 4100, show considerable limitations when applied to UHSS members, especially in dealing with material nonlinearity and local buckling. The assessment of effective width methods revealed basic flaws in their application to UHSS. The methods in EN 1993-1-5 and AISC 360 were reasonably accurate for slender sections (λp > 0.65), but EN 1993-1-5 under-predicted the strength of intermediate slenderness sections (0.65 < λp < 1.0). More importantly, the AS 4100 EWM consistently under-predicted the resistance across all slenderness ranges, with errors up to 45% for slender sections.
These results emphasise the urgent need for code updates that specifically consider the mechanical behaviour of UHSS, including (i) the development of more precise cross-section classification limits based on actual plastic redistribution capability, and (ii) the inclusion of strain hardening effects in modified effective width formulations. Accordingly, a new slenderness limit of 36 is proposed for the cross-section classification of Q1100 UHSS welded box sections under pure compression based upon presented results. Such enhancements would promote both safer and more economical use of UHSS in structural applications, while preserving necessary safety factors. Future work should aim to generalise these findings to other UHSS grades and to create unified design procedures that connect conventional and ultra-high strength steel design practices.
Footnotes
Funding
The authors disclosed receipt of the following financial support for the research, authorship, and/or publication of this article: The research work presented in this paper was supported by a grant from the General Program of the Guangdong Natural Science Foundation (Project no. 2025A1515010613).
Declaration of conflicting interests
The authors declared no potential conflicts of interest with respect to the research, authorship, and/or publication of this article.
Data Availability Statement
Some or all data that support the findings of this study are available from the corresponding author upon reasonable request.