
Abstract
Wire arc additive manufacturing (WAAM) is an emerging metal 3D printing technology, and it is deemed to be suitable for constructional sector due to its high fabrication speed, flexibility, and cost efficiency. This paper investigates the geometric characteristics and mechanical properties of WAAM S308L stainless steel plate and tube through experimental investigation. 3D scanning was employed for geometric measurement to reveal the variations in the geometric properties of the WAAM S308L specimens. In addition, the monotonic tensile test, Vickers hardness test, bend test, and Charpy V-notch impact tests were conducted to assess its mechanical properties. The effects of specimen shape and loading directions relative to the material deposition orientation on the mechanical properties were examined. Material anisotropy behaviour was observed, as the 45° specimen exhibited 14% higher strength and an 80% higher Young’s modulus compared to the 90° specimen. Excellent ductility was found, as indicated by the values of ratios σu/σ0.2 ≥ 1.1, ɛ u /ɛ0.2 ≥ 15, and ɛ u ≥ 15%. The 45° sample exhibited approximately 8% greater impact energy absorption ability than the 90° sample. Curved tensile specimens exhibited a 20% higher 0.2% proof strength than plate specimens. Based on the tensile test results, the Ramberg-Osgood model is adopted to describe the full range of the stress-strain curve. Additionally, the plane orthotropic model and Hill’s yield criterion are used to accurately model the material’s elastic and plastic anisotropic behaviour. Overall, the investigated WAAM S308 L stainless steel exhibited obvious anisotropy in the mechanical properties, with qualified strength, ductility, and impact toughness for engineering practice.
Highlights
• Geometric characteristics of WAAM S308L stainless steel are investigated. • Ramberg-Osgood model is developed for the full stress-strain curves. • Plane orthotropic model and Hill’s yield criterion are proposed. • Microstructural analysis is performed to reveal its material anisotropy behaviour.
Introduction
The wire arc additive manufacturing (WAAM) method (Ali et al., 2022; Gardner, 2023; Kanyilmaz et al., 2022; Wu et al., 2018), which manufactures the member in a layer-by-layer deposition manner, is emerging as a viable method for construction. It offers significant advantages, including high printing speed, cost-effectiveness, and capacity to manufacture large-scale structures compared with other 3D printing methods (e.g., selective laser melting, electron beam melting, and fused deposition methods). Additionally, the WAAM technique can fabricate the complex-shaped steel structure (Laghi and Gasparini, 2023), which has been demonstrated in various engineering practices, including the footbridge in Amsterdam (Gardner et al., 2020), a recently built 3D metal printed pavilion in Hong Kong designed by the authors using direct analysis method (see Figure 1) (So et al., 2025), and the structural optimization of innovative members (Kyvelou et al., 2024; Laghi et al., 2020b; Ramonell and Chacón, 2021; Zuo et al., 2023). However, the lack of appropriate design methods for the WAAM steel structure limits the promotion of this newly developed technique, necessitating more comprehensive investigations, such as the mechanical test and microstructural analysis, into the detailed geometric and mechanical properties of the WAAM steel. The Hong Kong’s first WAAM pavilion: (a) Robotically printing process, (b) assembled in the factory, and (c) on-site photo.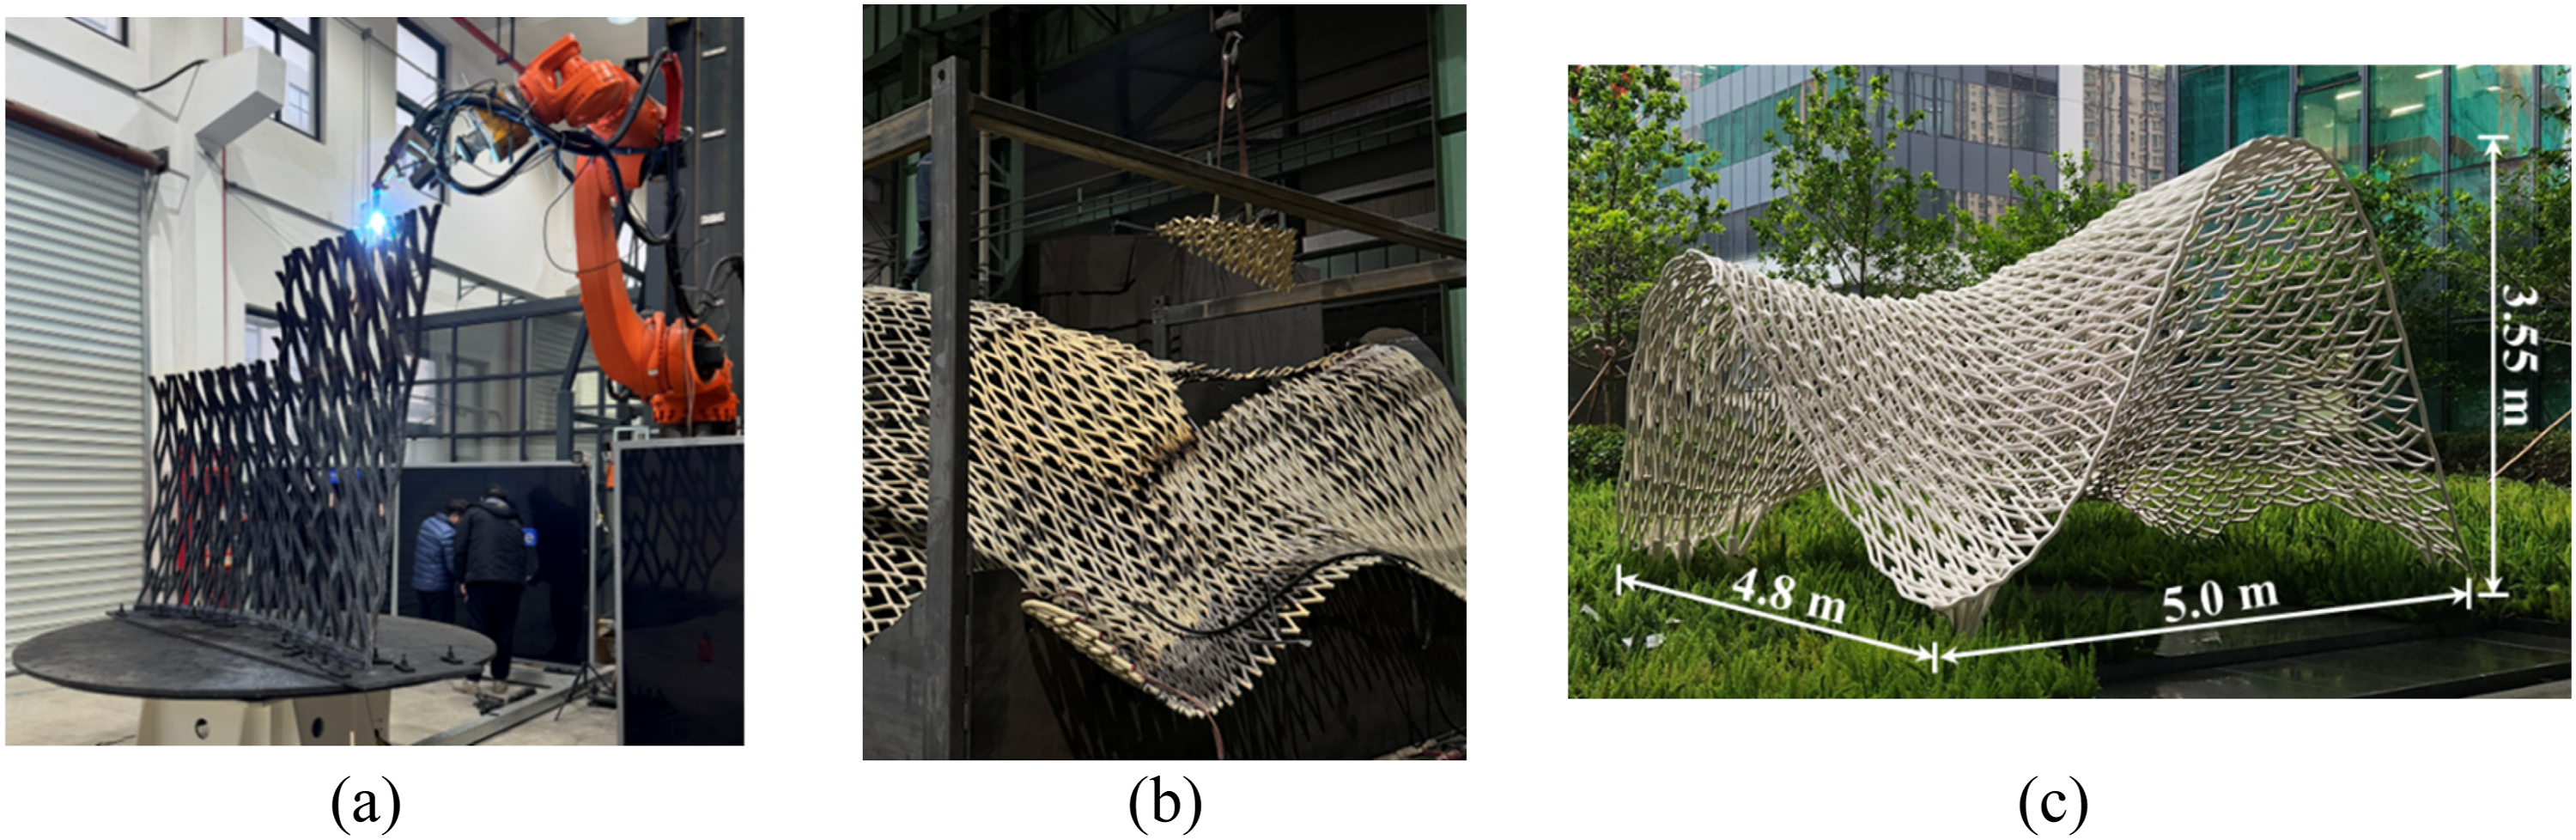
Previous studies on commonly used WAAM metal materials, including carbon steel (Laghi et al., 2023; Tankova et al., 2022; Zong et al., 2023), high-strength steel (Chen et al., 2024c; Dirisu et al., 2019; Weber et al., 2024), and stainless steel (Chen et al., 2024a; Evans and Wang, 2023; Hadjipantelis et al., 2022; Laghi et al., 2021a, 2021b, 2022), have investigated geometric irregularities and material anisotropy inherent in WAAM steel, as well as their effects on mechanical properties. The thickness, cross-sectional area, and centroid eccentricity of the WAAM steel specimen were measured and used to describe its geometric irregularity (Guo et al., 2023; Huang et al., 2022c; Laghi et al., 2020a). The geometric irregularity is identified as the primary factor leading to material anisotropy in normal and high-strength steels (Huang et al., 2022a). In terms of WAAM stainless steel (SS), Kyvelou et al. (2020) observed that the geometric undulation has a lesser effect on its mechanical behaviour. Additionally, the effect of surface condition on the fatigue crack growth behaviour of a series of WAAM stainless steel materials, including duplex stainless steel (Chen et al., 2025a), austenitic stainless steel (Chen et al., 2025c), super-duplex stainless steel (Chen et al., 2025b) has been studied. However, the design process of the WAAM pavilion ‘Weaving Love’ revealed a lack of effective cross-sectional dimensions, necessitating additional geometric properties data of the WAAM steel member to determine the design parameters.
The material properties of WAAM steel have also been the research focus. The angle between printing and loading directions is a critical factor affecting mechanical properties. Hadjipantelis et al. (2021) pointed out that WAAM S308 L stainless steel specimens with 45° loading direction angle possess the highest yield and ultimate strengths compared to specimens with other angles. A similar phenomenon was observed in other alloy materials manufactured using WAAM (Gürol et al., 2023). Huang et al. (2022a) observed a random distribution of grain orientation in normal and high-strength steel, resulting in material isotropy. Chen et al. (2024b) reveals that the strong orientation of crystals in certain directions in stainless steel causes anisotropy. Based on numerous results of monotonic tensile tests on the WAAM steel material, Huang et al. (2023) established constitutive models for normal and high strength steels using the Ramberg-Osgood model. The post-fire mechanical properties of austenitic stainless steels (ER304, ER308L and ER316L) and duplex stainless steels (ER2209 and ER2594) have been investigated by Gong et al. (2025a; 2025b), respectively; with the detailed discussions on the effects of exposure temperature and cooling method. Based on the test results, prediction models for residual tensile properties were developed. While existing research has provided valuable insights, establishing a constitutive model for WAAM stainless steel necessitates additional experimental data. Furthermore, the effects of specimen shape and anisotropy on the mechanical properties of WAAM stainless steel remain underexplored. Additionally, the impact toughness and bending behaviour of WAAM S308L stainless steel is scare in current research. To qualify WAAM S308L stainless steel for design applications, its impact toughness, Vickers hardness, bendability, and ductility must be thoroughly investigated, which current research has yet to address. Therefore, the objectives of this paper are to study these mechanical properties. Moreover, the anisotropy behaviour of WAAM S308L stainless steel are explored and the experimental data for design mechanical model are obtained.
This paper aims to investigate the geometric properties, mechanical properties, and microstructural characterisation of WAAM S308 L stainless steel. A total of 13 tensile specimens were tested, comprising two different shapes, plate and tube, and three varying printing directions: 0°, 45°, and 90°. 3D scanning was conducted to investigate the geometric variation of the specimens. In addition, the monotonic tensile test, bend test, and Charpy V-notch impact test were conducted to assess the mechanical properties. Based on the tensile test results, the Ramberg-Osgood model was developed to describe the stress-strain curves and the anisotropic behaviour in both the elastic and plastic stages was captured using the plane orthotropic model and Hill’s yield criterion, respectively. Finally, the metallographic analysis was conducted to investigate the internal microstructural features, and the scanning electron microscope (SEM) was utilised to study the ductile failure mechanism.
Experimental methodologies
WAAM printing parameters
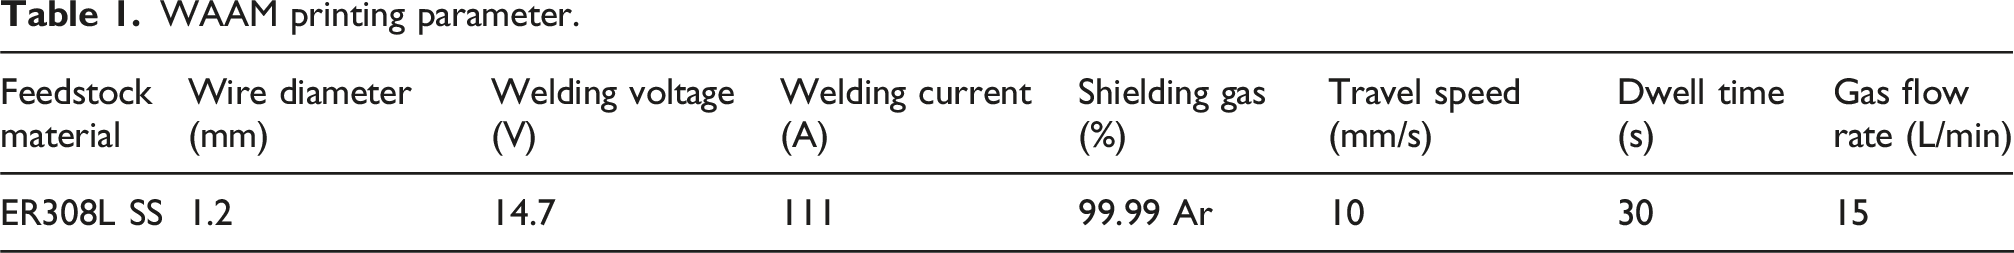
Two WAAM stainless steel plates and one circular tube were manufactured using an arc additive platform equipped with a KUKA six-axis robotic arm, as shown in Figure 2(a). The dimensions of the WAAM steel plate and tube are 320 mm (length) × 300 mm (width) × 4 mm (thickness) and 300 mm (diameter) × 4 mm (thickness), respectively. The movements of the welding nozzle for the plate and tube are illustrated in Figure 2(b), fabricating the WAAM steel plates and tube by moving back and forth in the horizontal direction to manufacture a layer and then moving in the Z direction to fabricate the next layer. Implementing a 30-s interlayer dwell time during WAAM fabrication reduced peak interlayer temperatures to ∼250°C (monitored via infrared thermography). This controlled thermal profile aligns with findings that prolonged dwell times enhance hardness and strength in additively manufactured metals, as reduced thermal energy input promotes microstructural refinement and dislocation strengthening (Turgut et al., 2023). The temperature will increase with higher deposition layers, and the higher temperature facilitates the transformation of ferrite into austenite, leading to a higher ductility (Chen et al., 2024b). Accompanied by an integrated self-checking system, essential parameters, such as the accurate position of robotic arm, environmental factors (e.g. oxygen, humidity, PM2.5 particles), printing parameters (e.g. wire feed speed, deposition rate and height), and consumable conditions (e.g. shield gas flow rate and pressure) were monitored and adjusted dynamically to ensure the quality of the printed specimens. WAAM printing: (a) WAAM steel plate and circular tube and (b) printing strategies.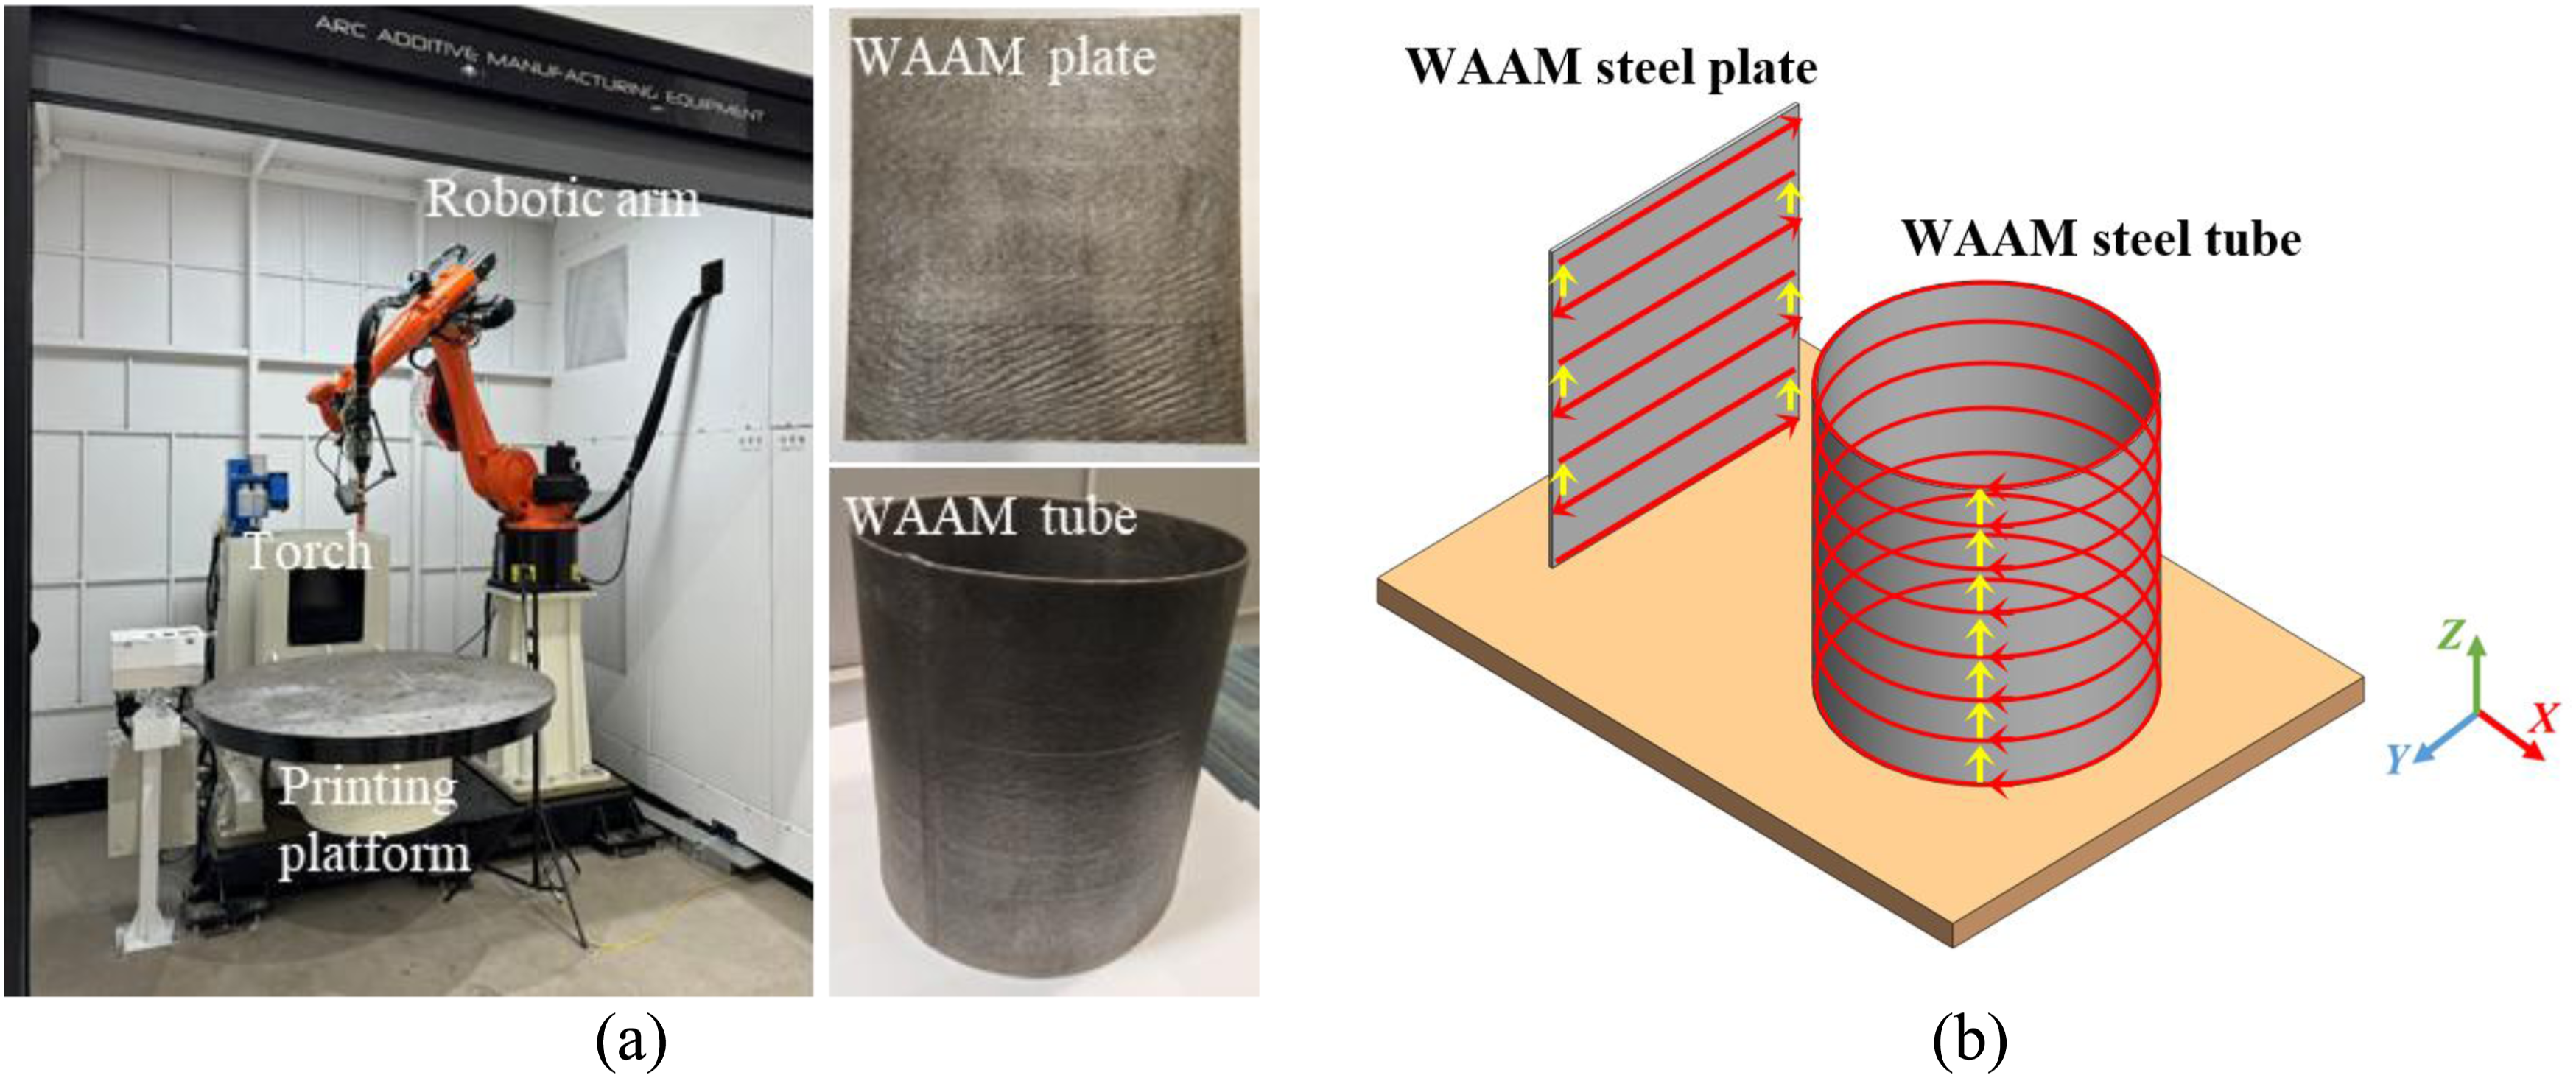
WAAM printing parameter.
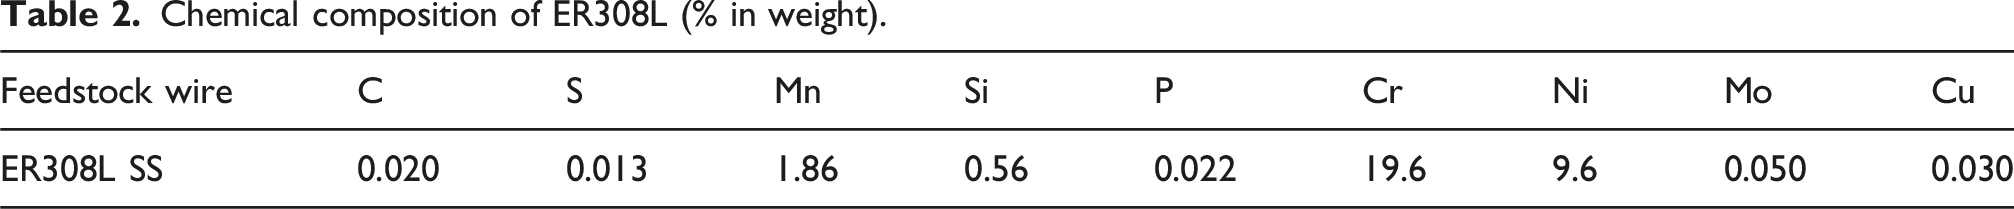
Chemical composition of ER308L (% in weight).
Test specimens
Three types of tests were carried out: monotonic tensile test, three-point bend test, and Charpy V-notch impact test, of which the tensile coupons, bend test pieces, and V-notch samples were designed and cut from WAAM steel specimens. Additionally, curved specimens obtained from circular tube members were examined, considering the widespread use of WAAM steel tube members.
The test specimens, comprising tensile coupons, Charpy V-notch impact samples, and three-point bend pieces, were fabricated from plate and circular tube stock via waterjet cutting (Figure 3). The specimen inventory includes: (a) 13 tensile coupons with nine plate specimens (grouped by three extraction angles: 0°, 45° and 90°), and four curved specimens extracted from tubular sections; (b) 12 Charpy V-notch samples grouped by three extraction angles: 0°, 45° and 90°; and (c) 12 three-point bend test pieces grouped by three extraction angles: 0°, 45° and 90°. As WAAM steel components in real-world applications are typically used in their as-built condition, all test samples were evaluated in the as-built states. The effect of the extraction angle on mechanical properties was also considered in the plate bend test pieces and V-notch samples, while the curved pieces and sample were machined at a 90° extraction angle due to their curved shape. The labelling system was designed based on the specimen type and extraction angle θ. For example, labels ‘P-T-4-45-1’ and ‘T-T-4-90-1’ are defined as follows: the first term ‘P’ and ‘T’ denote the specimens cut from the plate and tube, respectively; the second term ‘T’ indicates the tensile test; the third term ‘4’ indicates the nominal thickness of the specimen (mm); the fourth part ‘45’ and ‘90’ denote the extraction angle, and the last term indicates the specimen number. Cutting scheme of the test specimens: (a) Plate specimens and (b) tube specimen.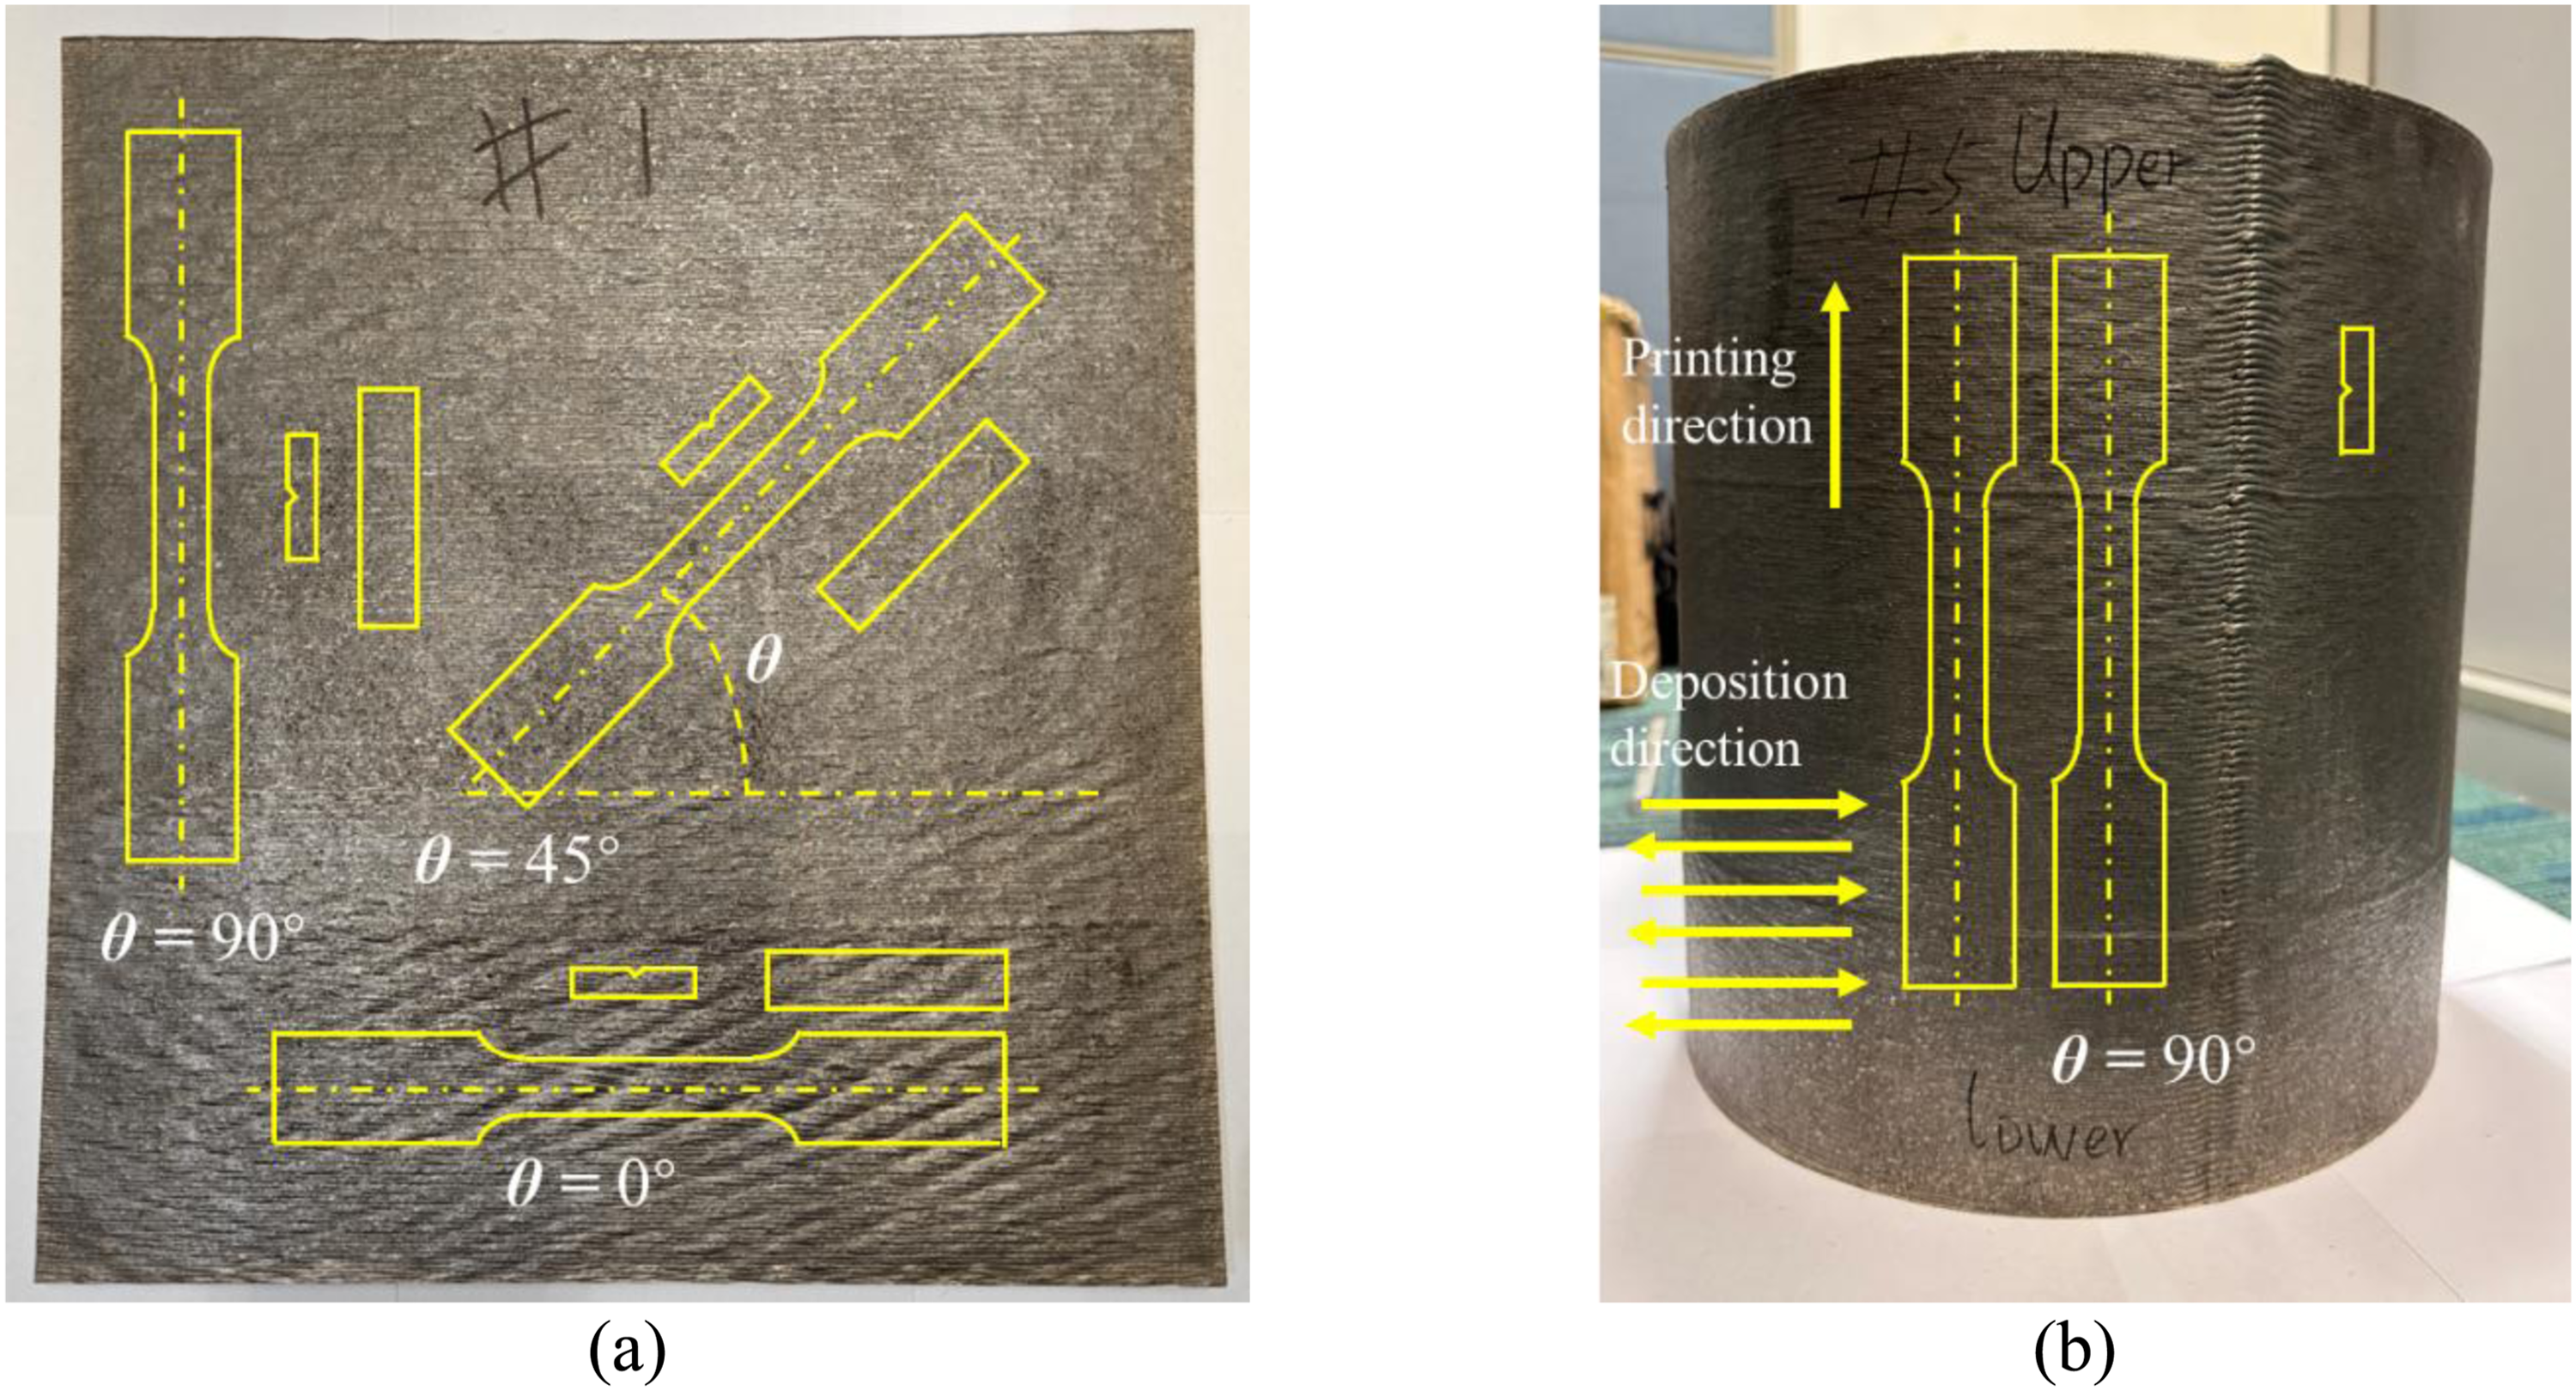
The microstructure within the WAAM steel causes variations in mechanical properties at different extraction angles. Metallographic analysis was conducted to investigate the internal structure of the material. Considering the layer-by-layer deposition method, three samples were extracted from the top, middle, and bottom positions of each plate and tube, as illustrated in Figure 4. The sample preparation process involves embedding the sample in epoxy resin, grinding the surface using sandpaper with grits of 180, 320, 400, 800, and 1200. The etching was performed using ferritic chloride hydrochloric acid solution. The sample surface was polished with a 0.05 μm master polish suspension. Metallographic analysis was carried out on an optical microscope at 200X magnification. Sampling positions on: (a) WAAM plate and (b) WAAM tube for the metallographic analysis.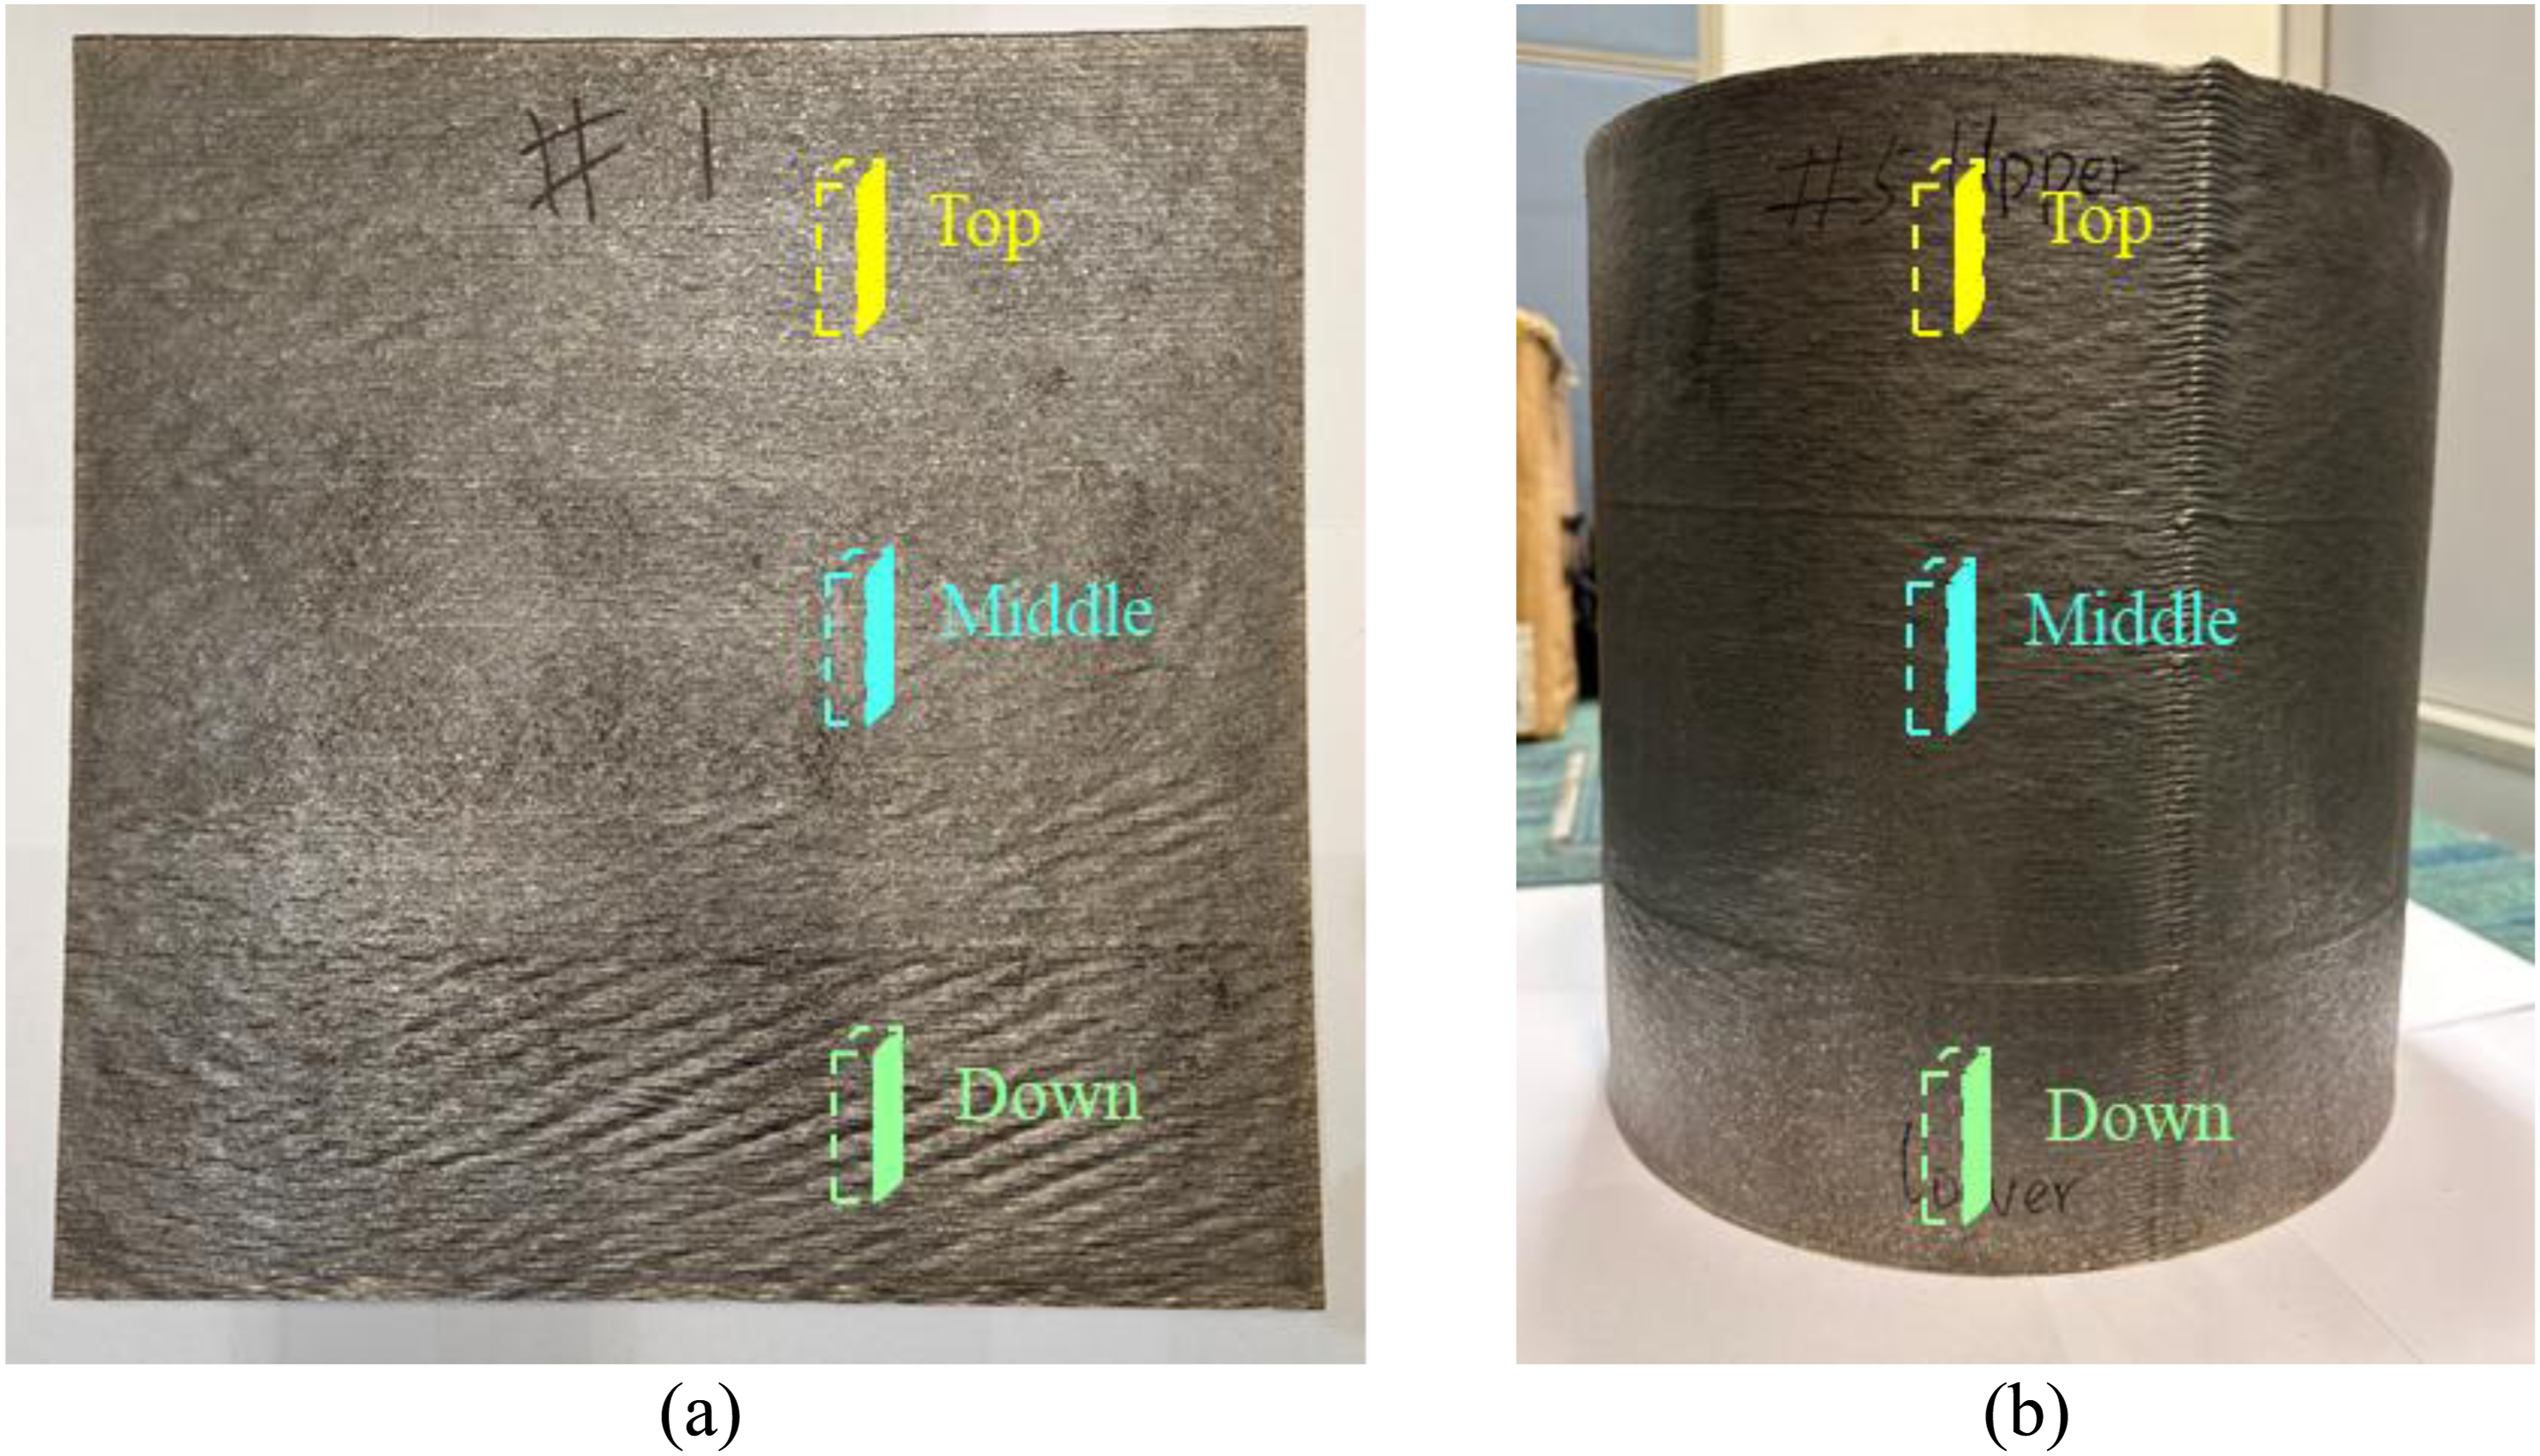
Geometric measurements
Geometric properties of the WAAM S308L SS tensile specimen|.
In this study, the geometric dimension of the WAAM specimen was measured from the 3D model obtained from the ZEISS COMET 3D scanner, with an accuracy and resolution of 0.05 mm and 0.1 mm, respectively. Details of the 3D scanning setup, model and measurement are presented in Figure 5. The definition of the both the global XYZ and local cross-sectional yz coordinate systems are presented. The definitions of the eccentricities ey and ez are also demonstrated in Figure 5 as being the deviation of the local centroid (LC) and the global centroid (GC) of the specimen cross-section. An alignment between the local and global axes of the specimen was conducted to ensure measurement efficiency. Geometric measurements using 3D scanning method: (a) 3D scanning test setup, (b) 3D scanning model, and (c) contour profile model.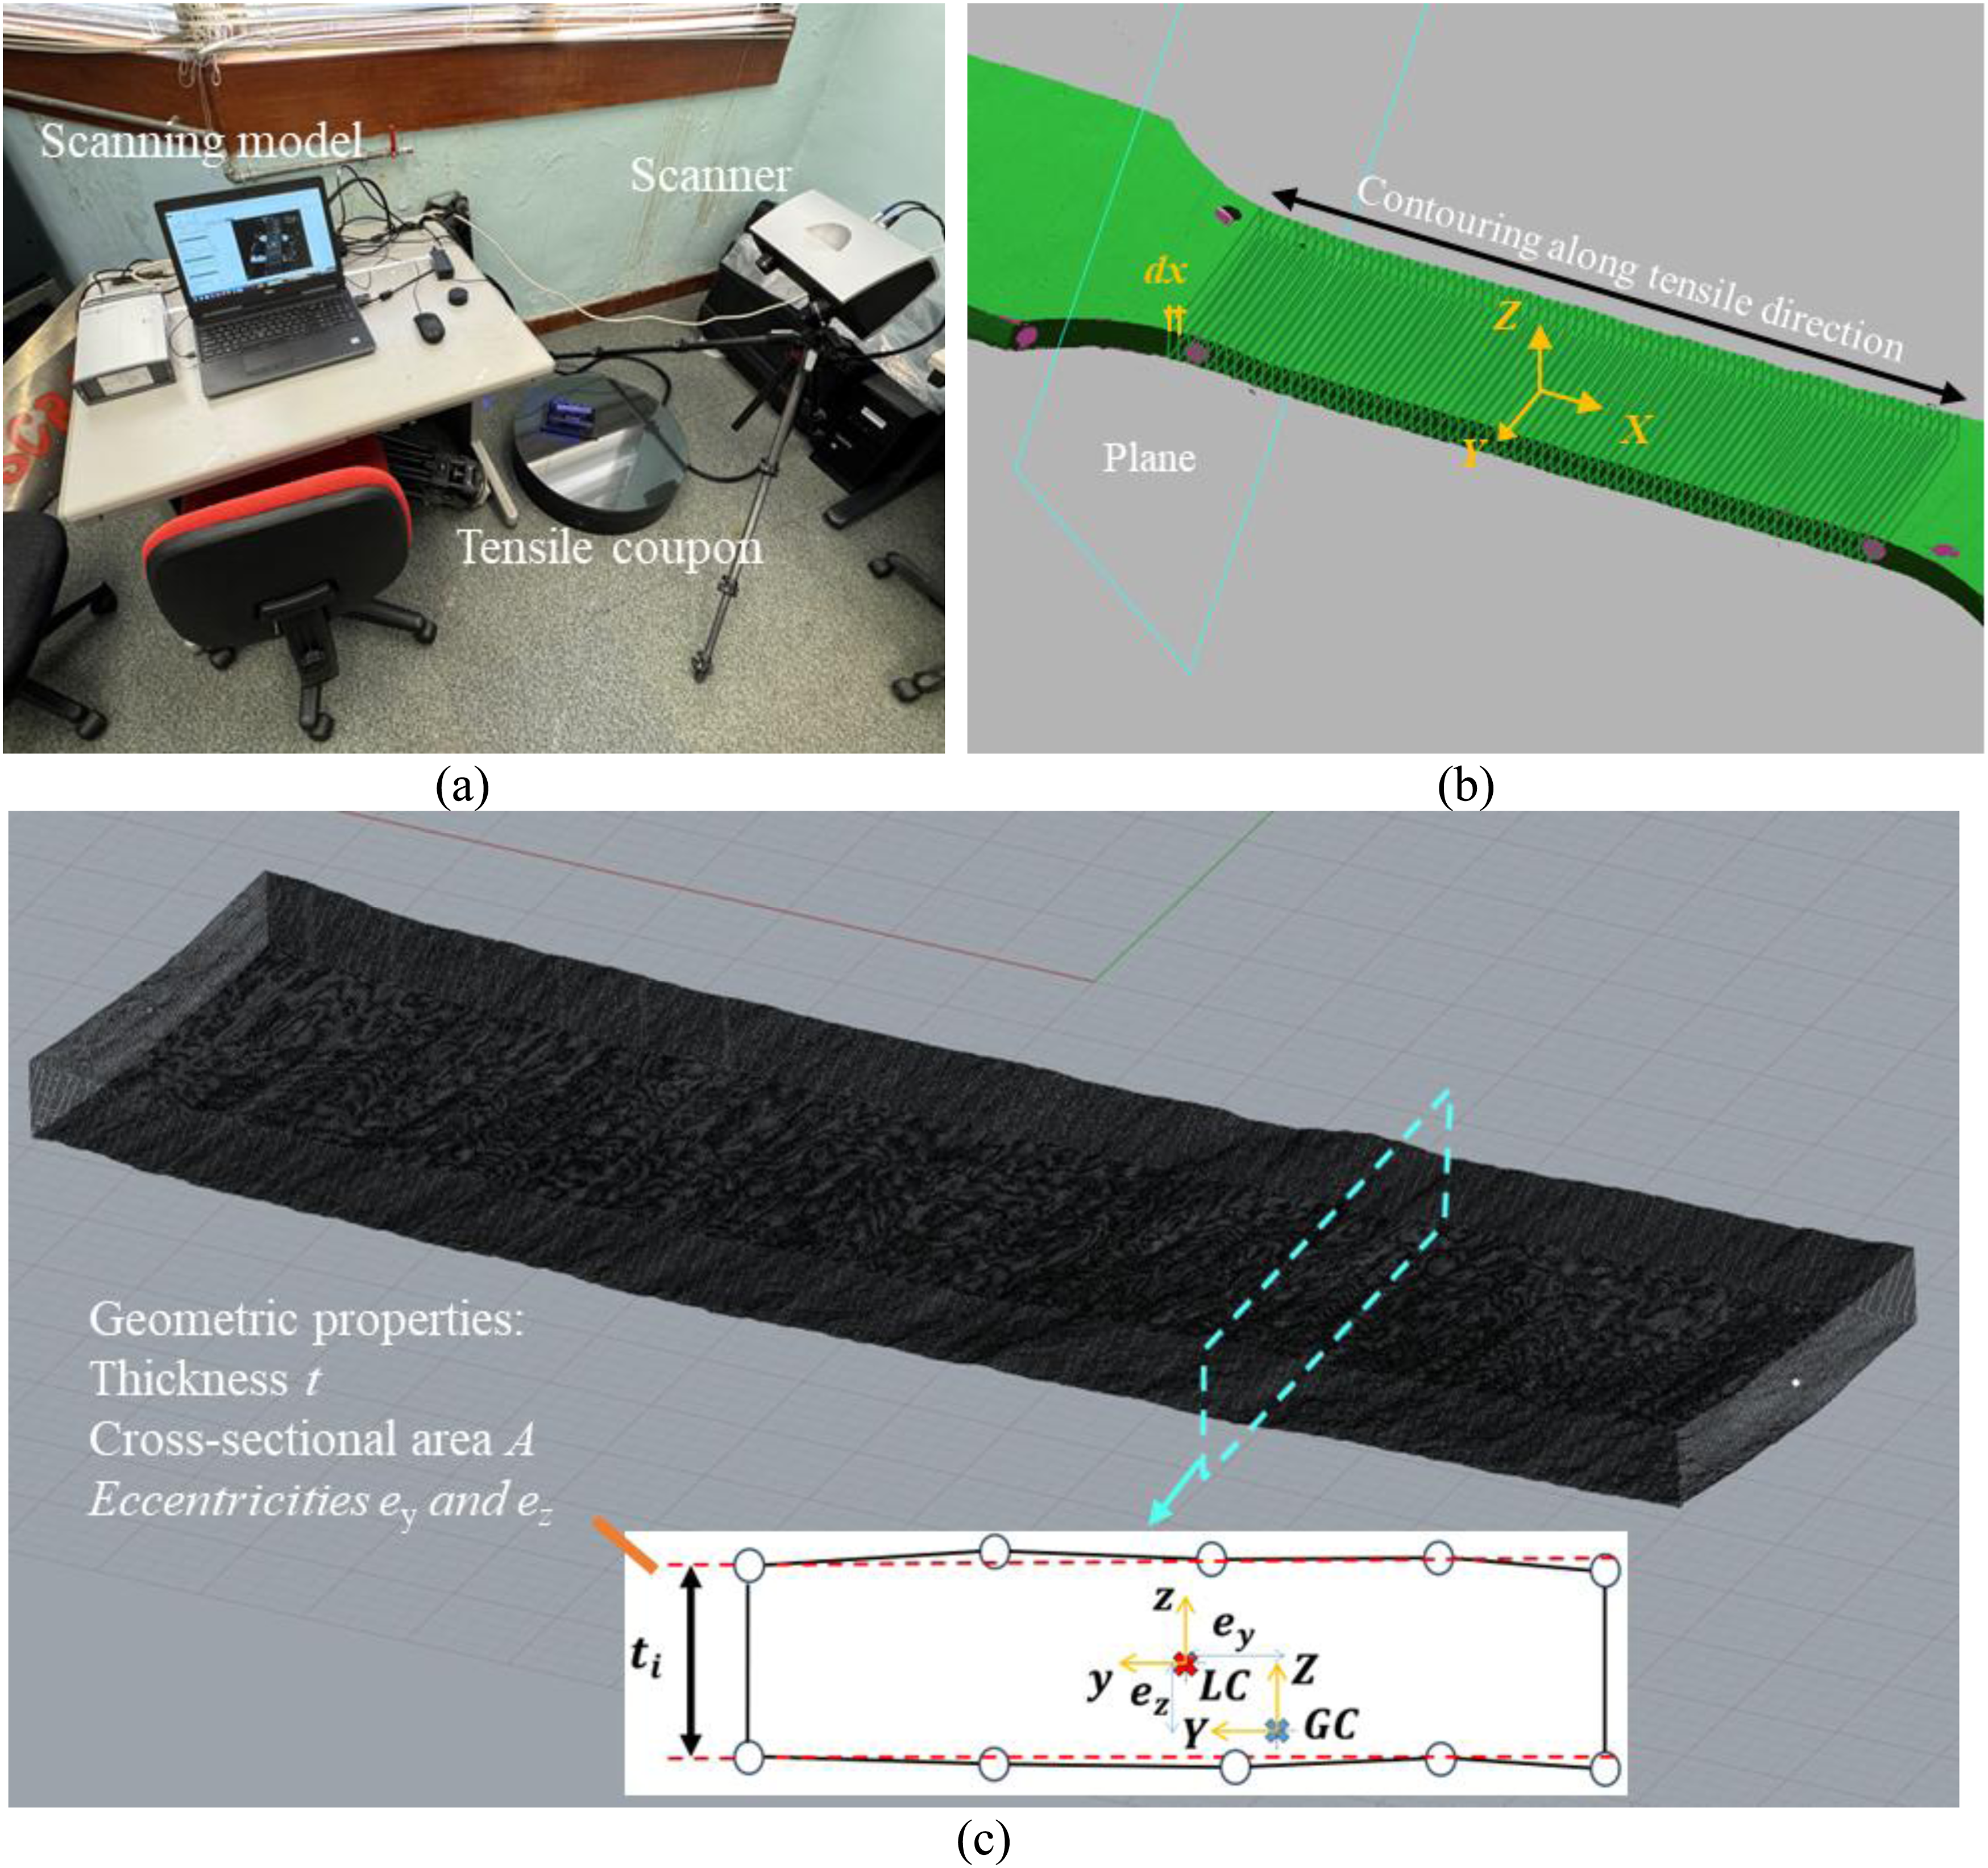
The gauge part of the 3D scanning model was selected, and a series of contour lines enclosing the cross-section at intervals of 0.1 mm along the x-axis direction were created for measurement. Huang et al. (2022a) have confirmed that the contours with a spacing of 0.1 mm can represent the accurate specimen geometry. In each cross-section, the thickness along the y-axis direction was measured with an interval of 1 mm to calculate its average thickness. To improve the measurement efficiency, Rhino software was employed to capture and record the geometric properties of the 3D model using the Python script. The cross-sectional properties, including cross-sectional area A, eccentricities of the cross section to the global axis of specimen e y and e z , and thickness t, were obtained. The recorded data were used for the statistical analysis.
Microhardness test
Vickers hardness measurements on the WAAM S308 L stainless steel were conducted following the standard (EN ISO 6507-1: 2023, 2023). Test samples were extracted from the top, middle and bottom positions from the WAAM steel plate and tube using waterjet cutting. The surfaces of the samples were polished to ensure its smoothness and freedom from oxide. The test was carried out on a Wilson Hardness tester, with the applied load and holding time were set to 0.3 kgf and 10 s, respectively. To account for the anisotropy in hardness along the deposition direction and the printing direction, one diagonal of the Vickers indentation was aligned parallel to the deposition direction, while the other diagonal was aligned parallel to the printing direction. The indentations were uniformly distributed on each sample surface in a 5 × 5 array, with adjacent points spaced at six times the indentation diagonal length. The mean and standard deviation values of the measured hardness were calculated.
Charpy V-notch impact test
The Charpy V-notch impact test was conducted at room temperature in accordance with the BS standard (BS EN ISO 14556: 2023, 2023). Sub-size V-notch samples dimensioned 55 × 10 × 4 mm were machined from WAAM steel plates. To reduce test error, each test on samples with the same extraction angle was replicated three times. The tests were carried out on an impact test machine using a pendulum impact tester to provide the impact load. Before testing, the actual width and thickness of the test samples were measured by the vernier scale. Calibration measurement was conducted before the impact tests to eliminate measurement errors caused by the additional energy absorption from friction inside the test machine.
Bend test
The bending capacity of WAAM S308L SS with different extraction angles was examined using bend tests in accordance with the standard (EN ISO 7438: 2016, 2016). The bend test was conducted on a WANCE Universal Testing Machine, as shown in Figure 6. Both the diameters of the loading and support rollers were 30 mm, and the span length of the support roller was 62 mm. A loading rate of 1 mm/s in the vertical direction was used. At the beginning of the test, preloading was conducted until the load reached 0.5 kN. The test was executed when the load dropped to 60% of its maximum value. Bend test setup.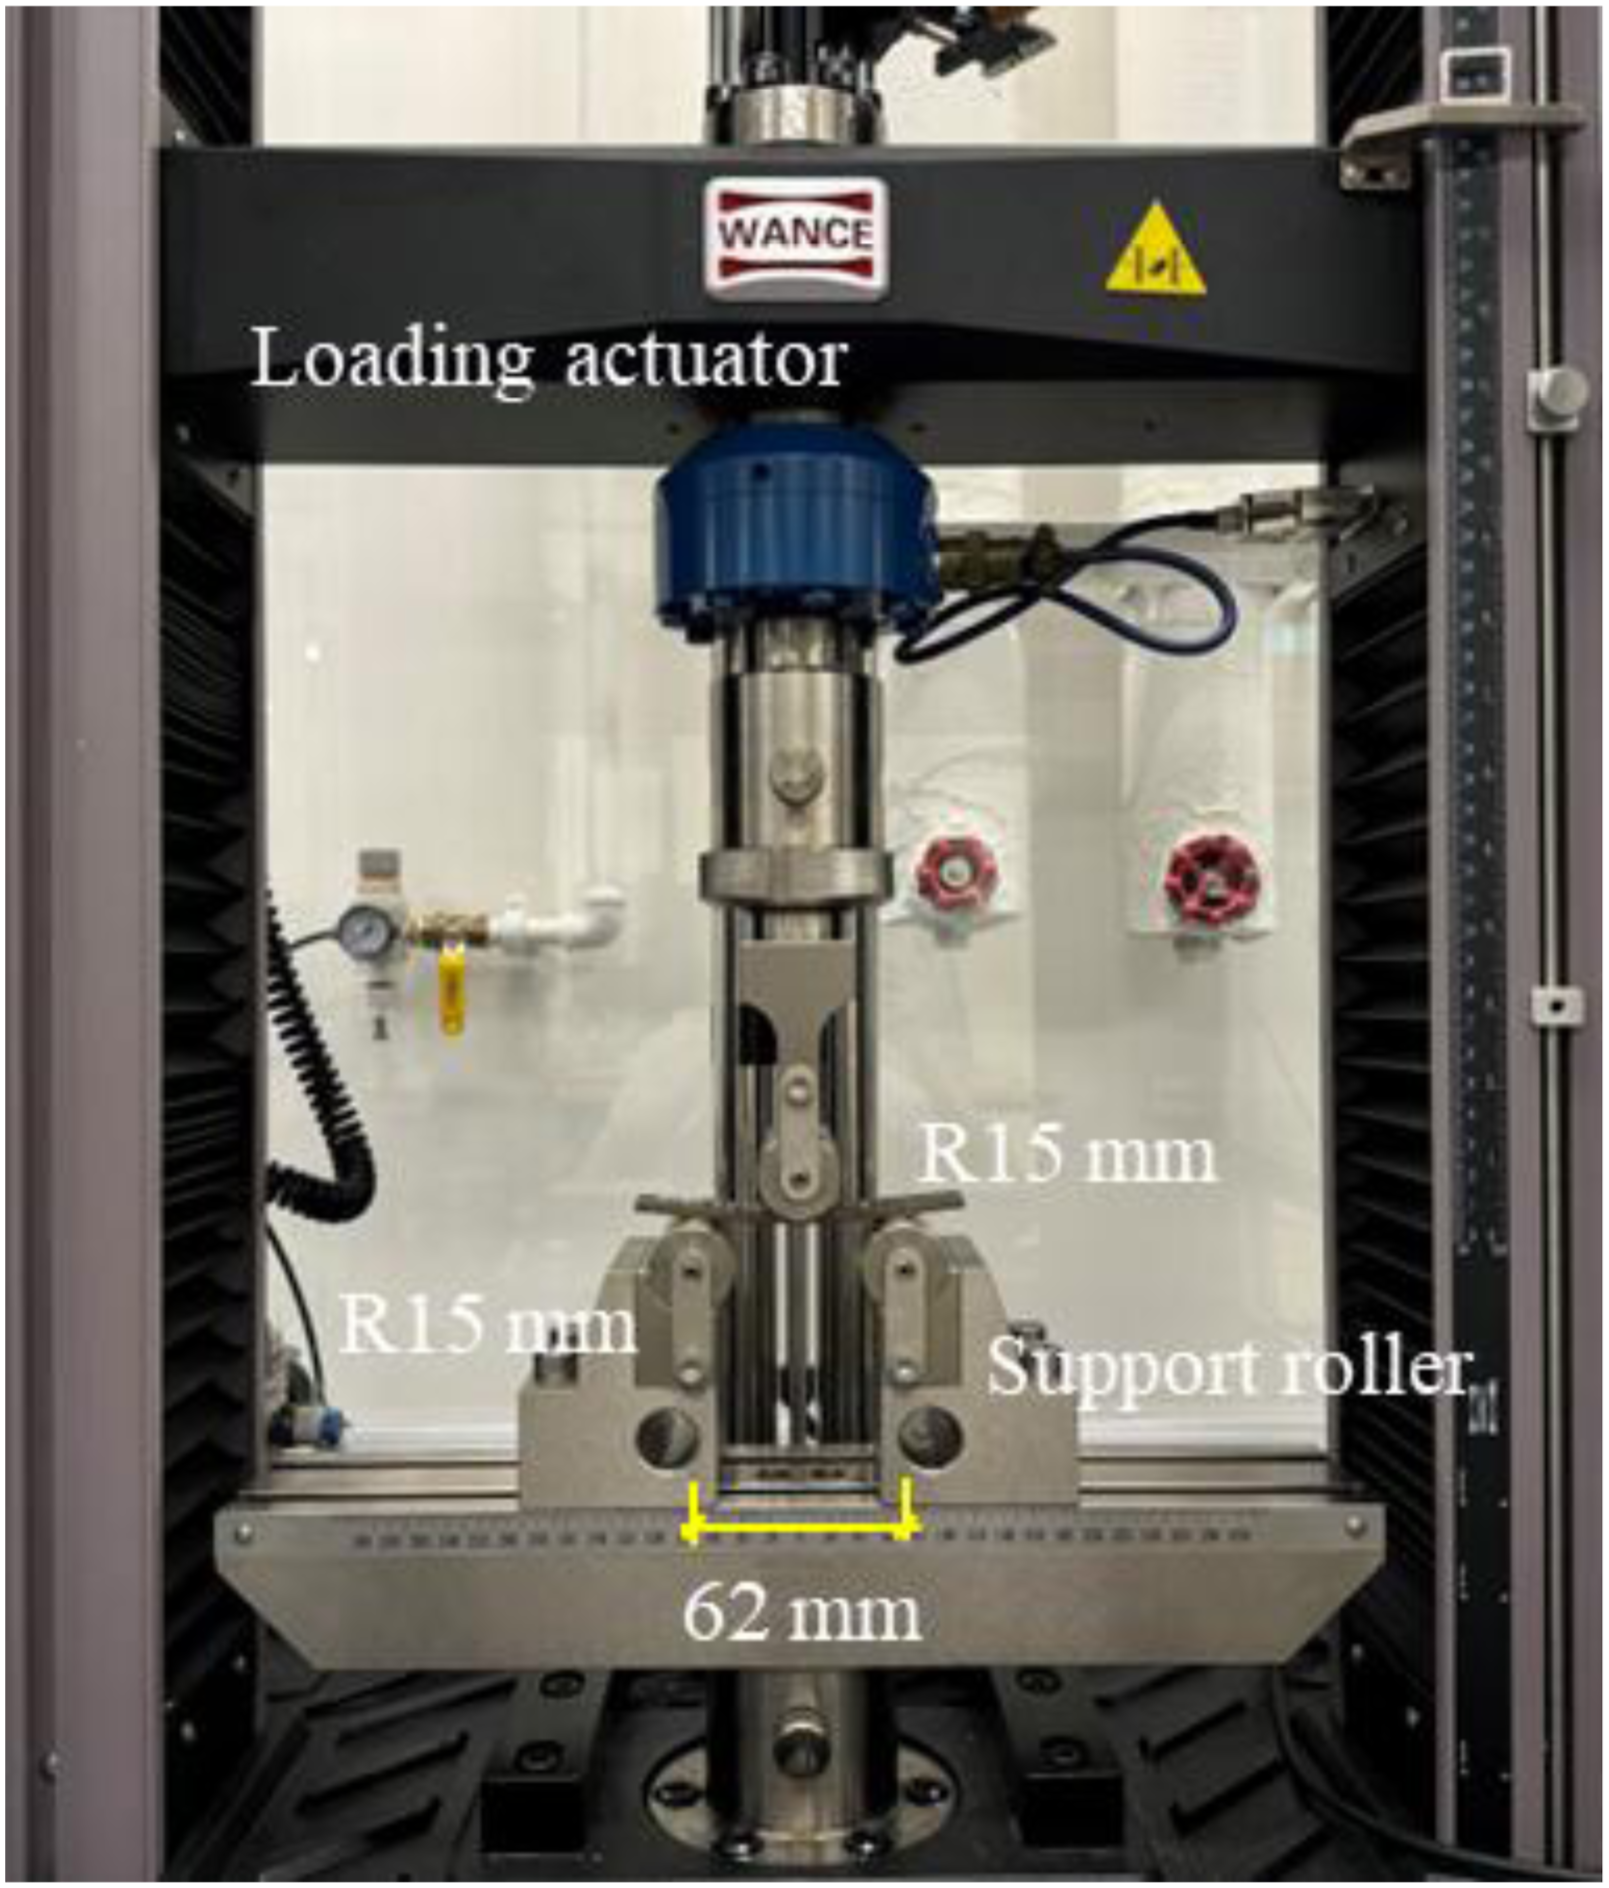
Tensile test
Mechanical properties of WAAM S308L SS were investigated using tensile coupon tests conducted at room temperature in accordance with the standard (ISO 6892-1: 2019, 2019). The tensile coupons were tested under uniaxial monotonic loading using a 100 kN Instron Electromechanical Universal Testing Machine (UTM). The Digital Image Correlation (DIC) system was employed to monitor the evolution of deformations and strains on the gauge part of the coupon during testing. White matt paint was sprayed onto the surfaces of the coupons. Based on the captured images, the strain field was calculated using the reference pattern on the specimen surface. Besides, a pair of overlapping standard gauge length of 5.56
In terms of the loading scheme, displacement control mode was employed with a loading rate of 0.5 mm/min according to the standard (ISO 6892-1: 2019, 2019). The tensile test setup is shown in Figure 7. Working synchronously with the test machine, DIC images were captured at a frequency of 1 Hz in the software. A region over the parallel part of the coupon with a paint pattern was selected for analysis. The relative displacement between the surface speckles in the middle part, with a length of 25 mm, was chosen for longitudinal strain calculation. The nominal stress was calculated by dividing the applied load by the original average cross-sectional area. The nominal strain determined over the full gauge length of the coupon. The strain field over the gauge length of the coupon was captured by the DIC, and both the longitudinal and transverse strains were used for stress-strain analysis. Tensile test setup.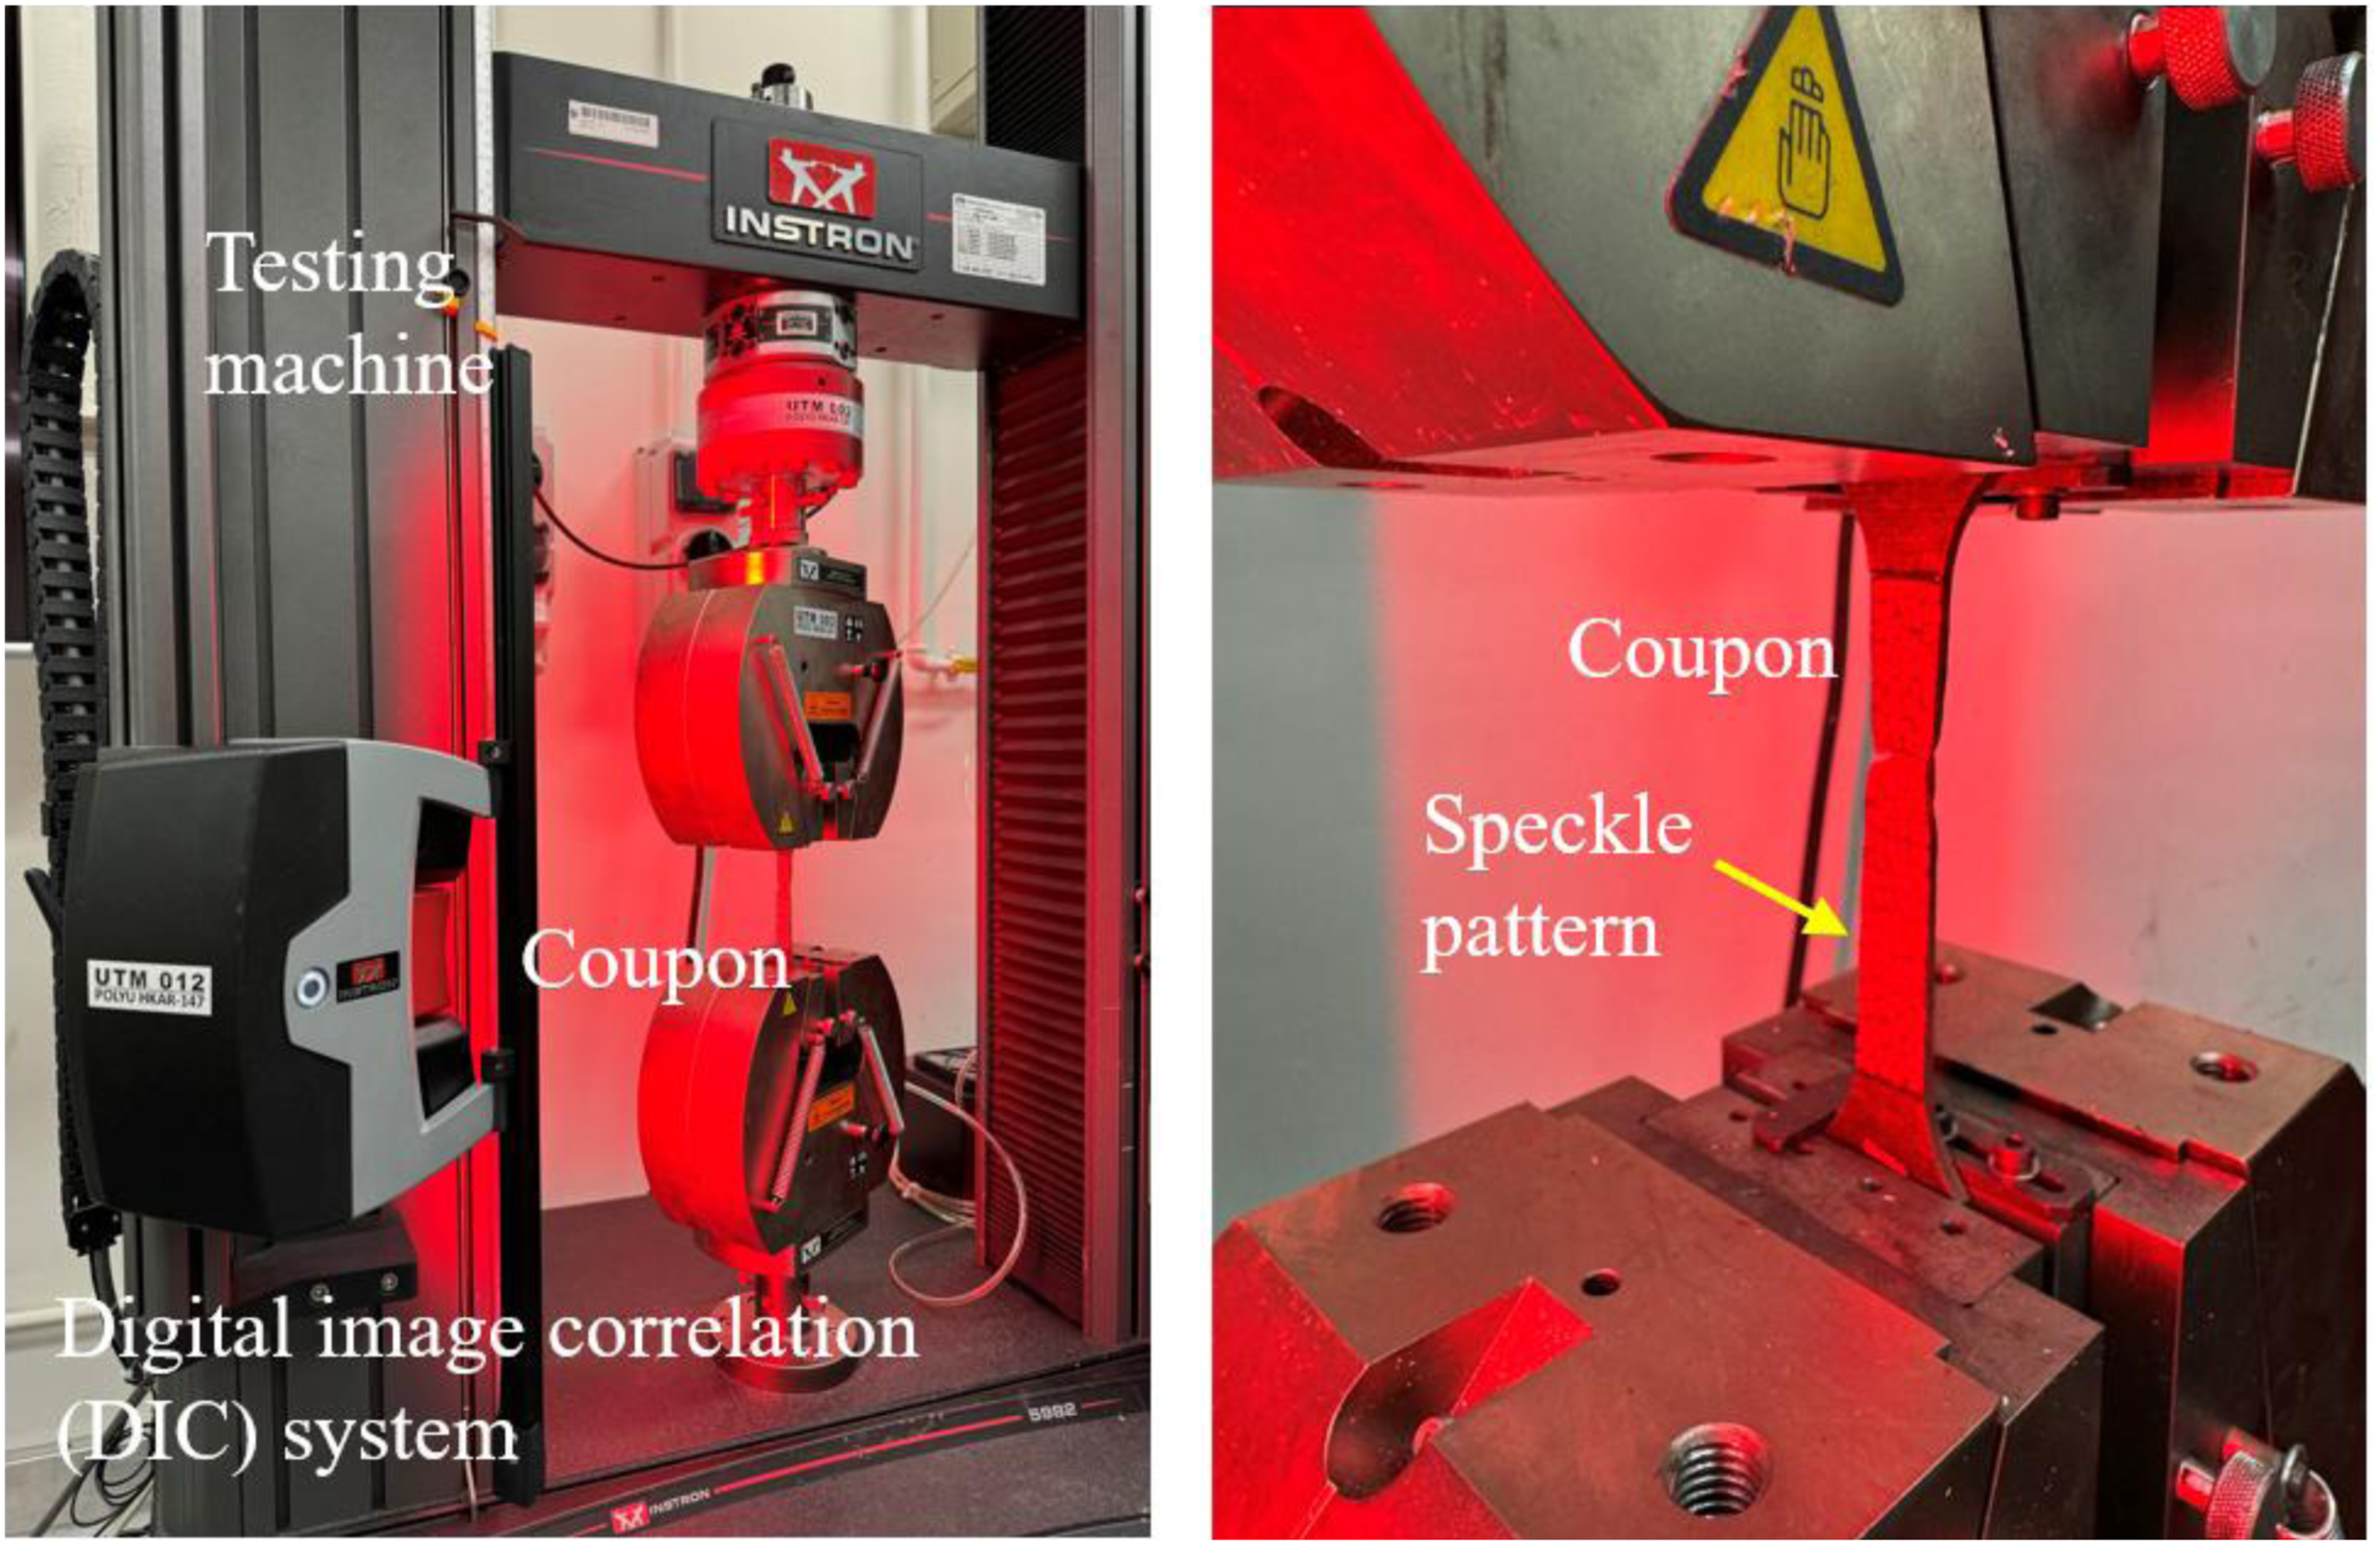
Results & discussion
Geometric properties
Several factors, the thickness t, the cross-sectional area A and the eccentricities e
y
and e
z
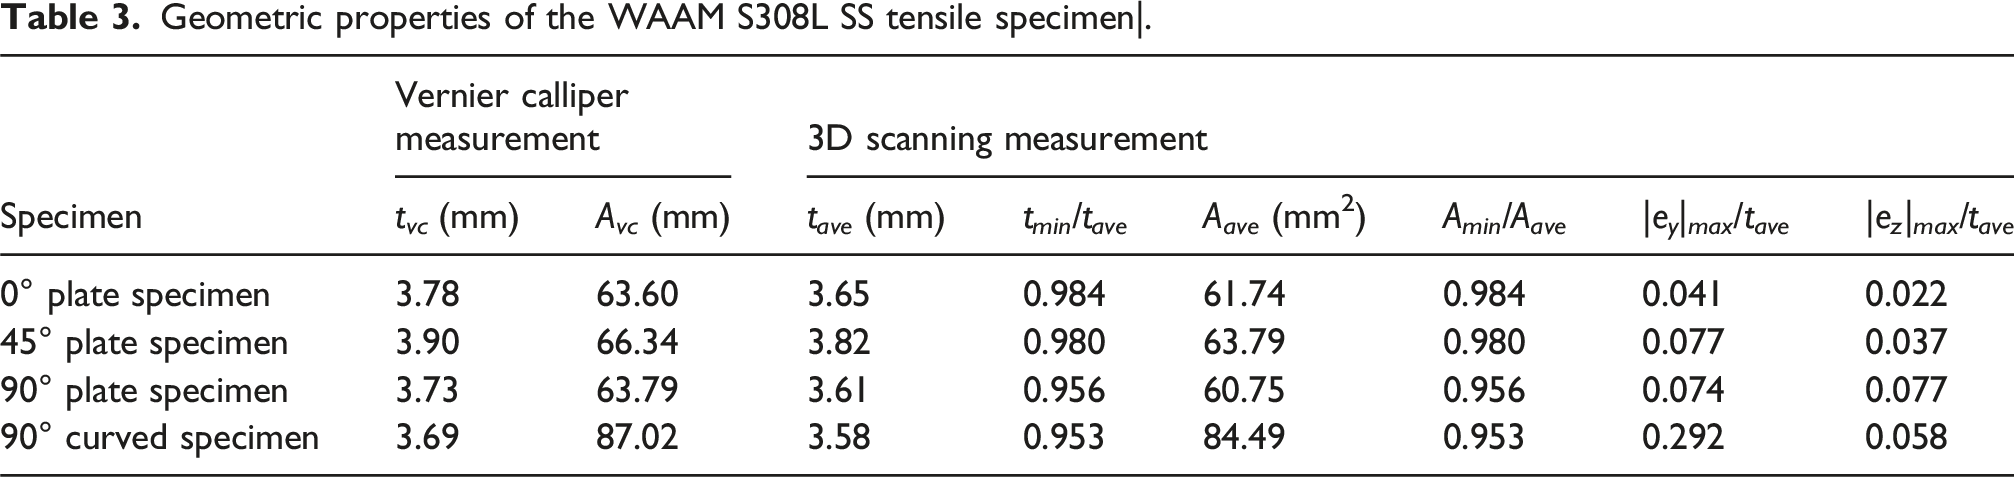
, are used to describe the geometric undulation. The probability distribution histograms of the specimen thickness with different extraction angles are provided in Figure 8, and the geometric properties of the WAAM steel specimen are summarized in Table 3. Comparison between the results obtained from vernier calliper and 3D scanning measurements demonstrates the reliability of the 3D scanning method. The geometric properties measured by 3D scanning tends to be smaller than those measured by vernier calliper, which is mainly attributed to the reverse modelling problem. The 45° plate specimen shows the largest thickness value (3.90 mm) compared to other specimens. For the plate specimen, the 0° specimen exhibits a symmetric distribution. In comparison, the plate specimens with the angles of 45° and 90° present the negative and positive skew, respectively. This can be attributed to the crest and trough regions along the x axis direction. The observed cross-sectional area: mean value A
ave
, and ratio of minimum A
min
to A
ave
are provided in Table 3. The tendency for the value of A
min
/A
ave
decreases with the increasing extraction angle, confirming the effect of crest and trough region on the area variability. The geometric measurement results (t
min
/t
ave
and A
min
/A
ave
) of the 90° curved specimen were comparable to those of the 90° plate specimen. Thickness distribution of the WAAM S308L SS tensile coupons: (a) 0° plate specimen, (b) 45° plate specimen, (c) 90° plate specimen and (d) 90° curved specimen.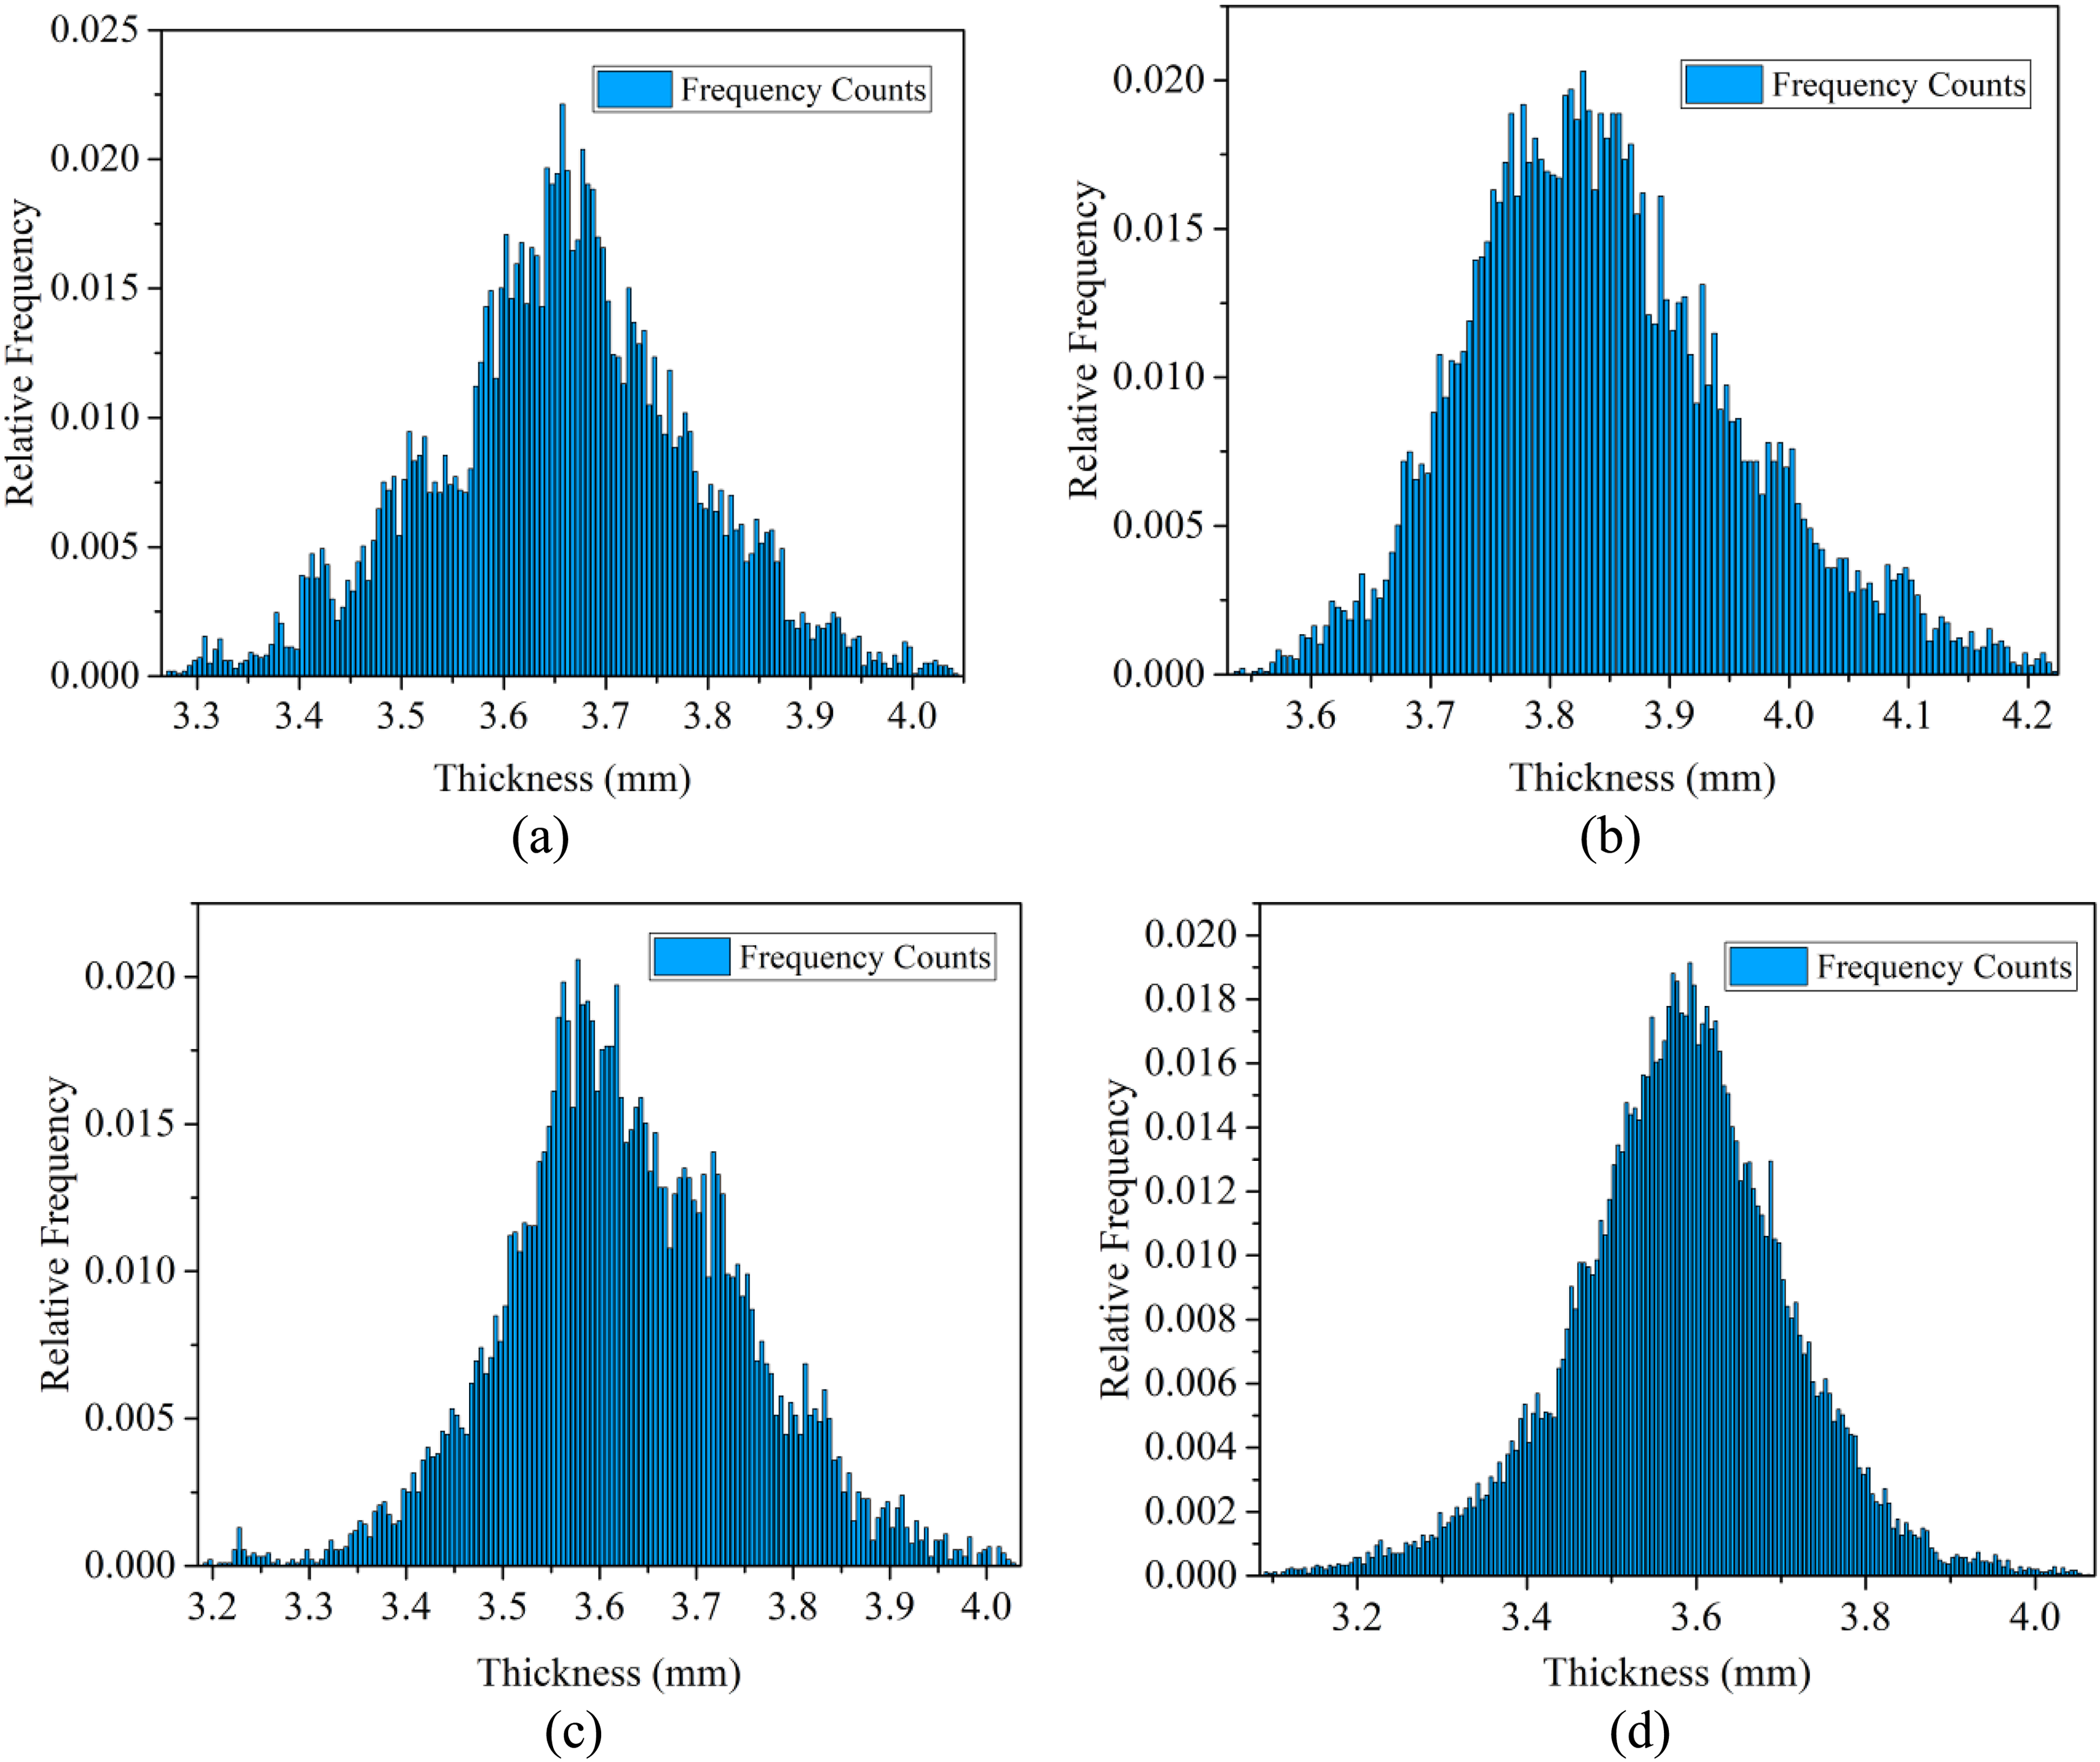
The eccentricities e
y
and e
z
of the local cross-section along the longitudinal direction are illustrated in Figure 9. The eccentricity along the y-axis fluctuates around zero, indicating a small deviation in mass distribution during the printing process. For the eccentricity e
y
, a trough region is observed in the middle part of the longitudinal length, while the two side positions have almost the same eccentricity value, indicating an obvious initial imperfection in the z-axis direction during printing. The values of Eccentricity distribution of the WAAM S308L SS tensile coupons: (a) 0° plate specimen, (b) 45° plate specimen, (c) 90° plate specimen and (d) 90° curved specimen.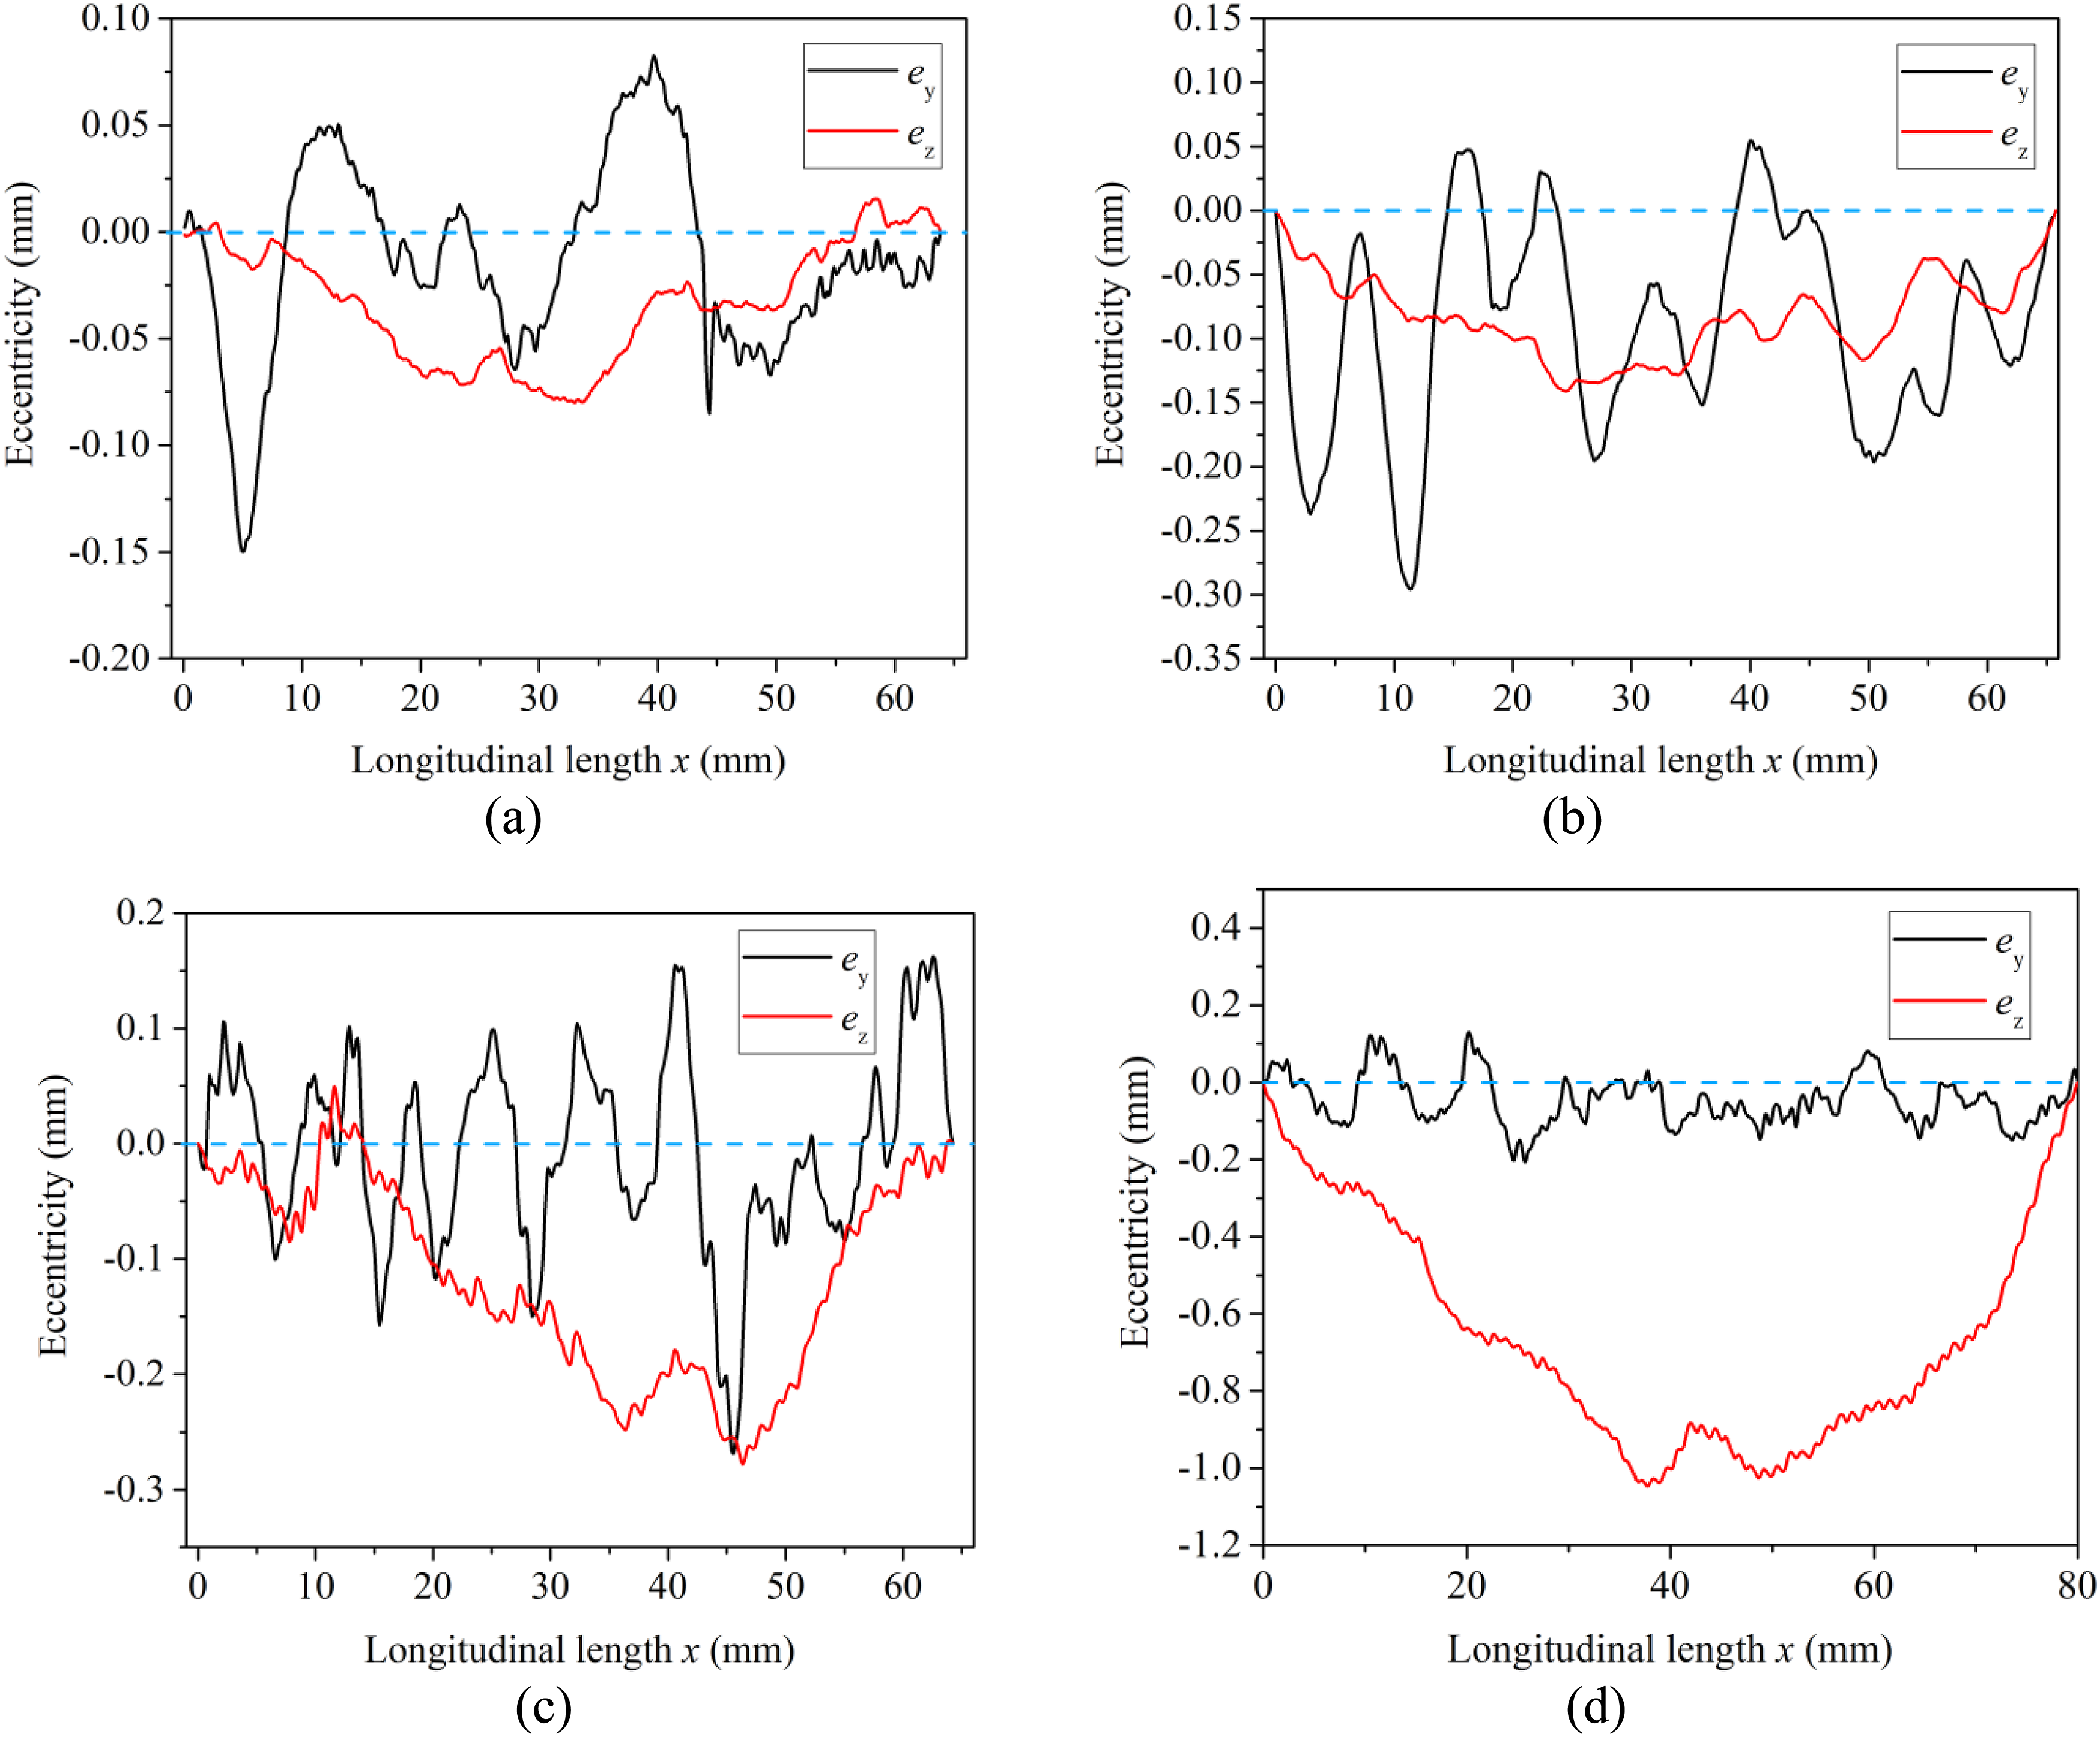
Hardness
Vickers hardness measurement results of WAAM plate and tube are shown in Figure 10, with the average values and standard deviation plotted as error bar. The hardness shows an increase trend from the bottom to the top, which can be attributed to the thermal cycle. There are fewer thermal cycles in the top layers compared to the bottom ones, resulting in a higher hardness value (Turgut et al., 2023). The smaller difference between the measured results of specimen extracted from the middle and bottom indicates the relative homogeneity of the properties of the WAAM steel member in these positions. Additionally, the samples extracted from the WAAM steel tube exhibits higher hardness compared to those from the plate, demonstrating the effect of curved shape on the hardness property. Hardness measurement results.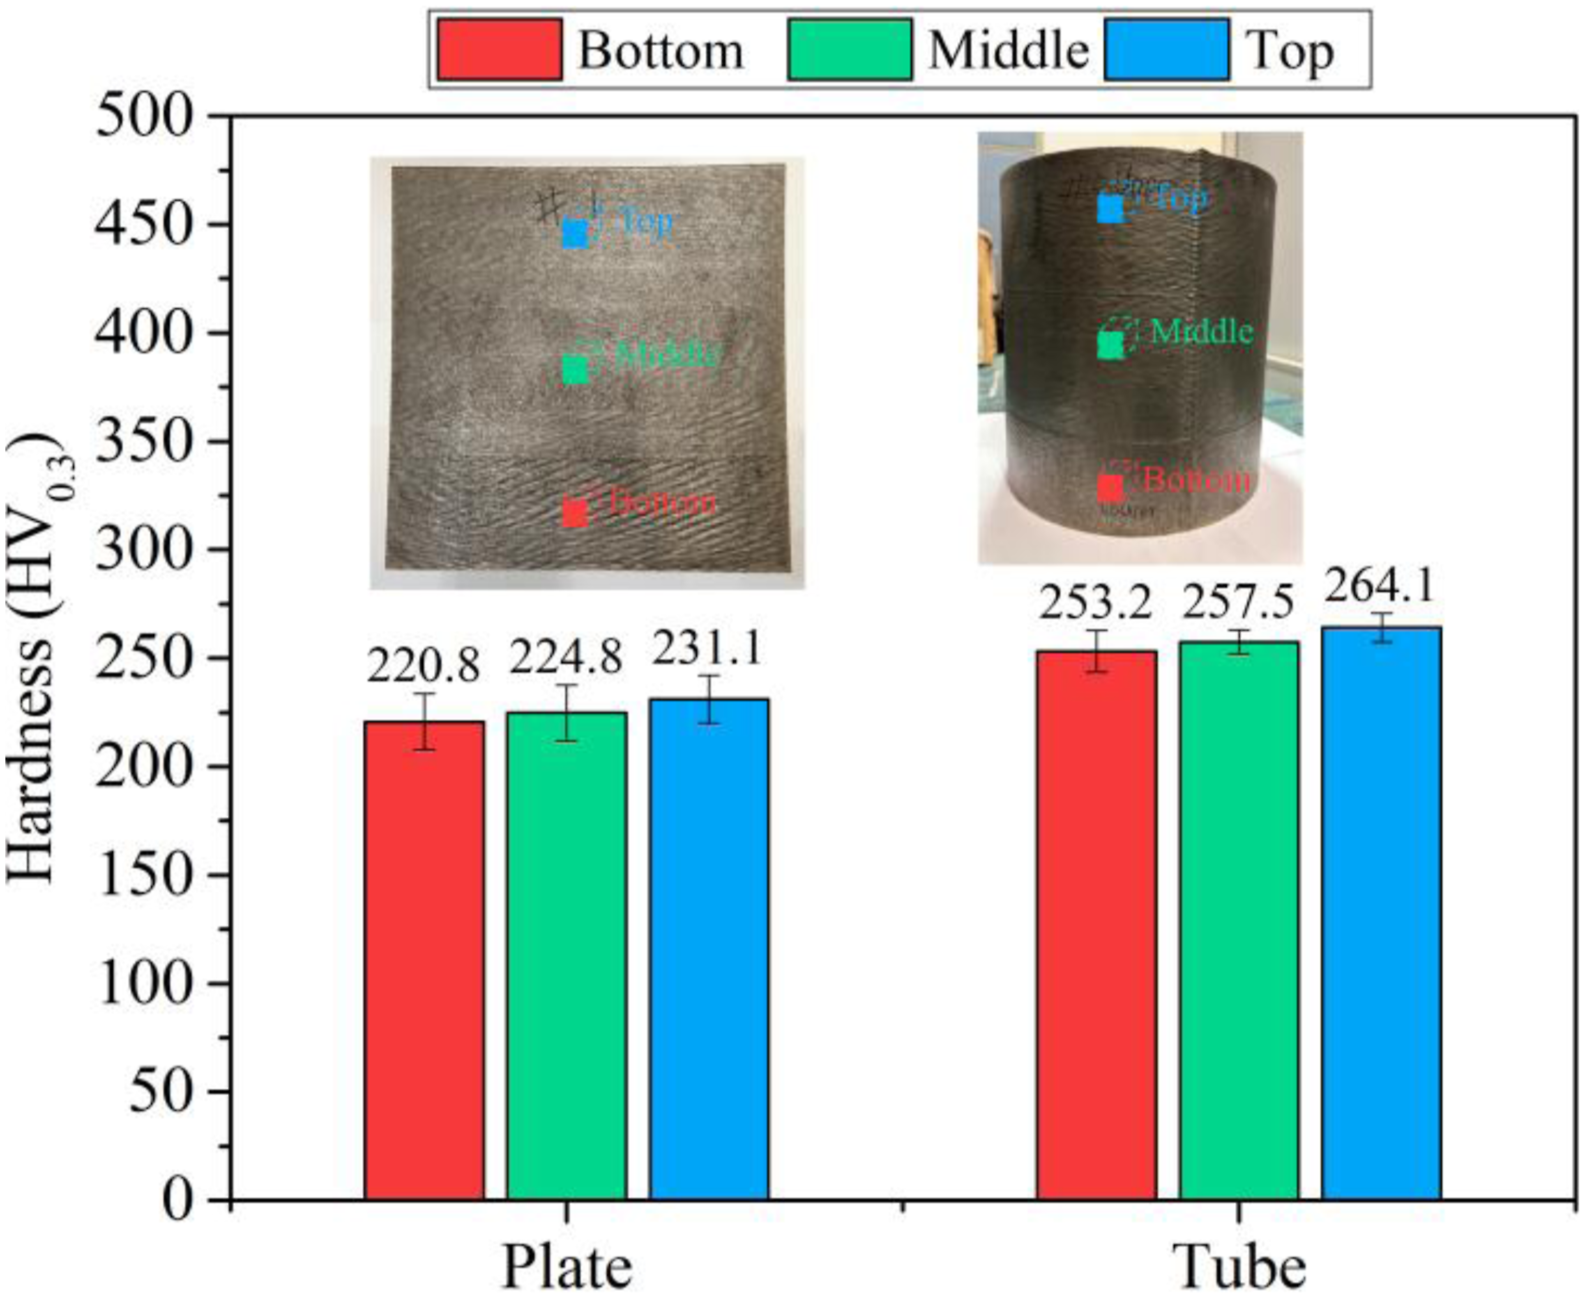
Impact toughness
Given the limitation of the plate thickness, the standard Charpy V-notch impact sample dimensioned 55 × 10 × 10 mm cannot be obtained. The energy absorbed by the 55 × 10 × 4 mm test sample was modified by a modification factor μ with the value of around 2.5 (equalled to 10/measured thickness). Therefore, the impact energy of the Charpy V-notch impact sample will be multiplied by a modification factor μ for correction. The converted absorbed energy of sample with different extraction angles is presented in Figure 11. The average absorbed energy of the sample was calculated based on the replicate test results, and the standard deviation (SD) was indicated by the error bar. Results of Charpy impact test.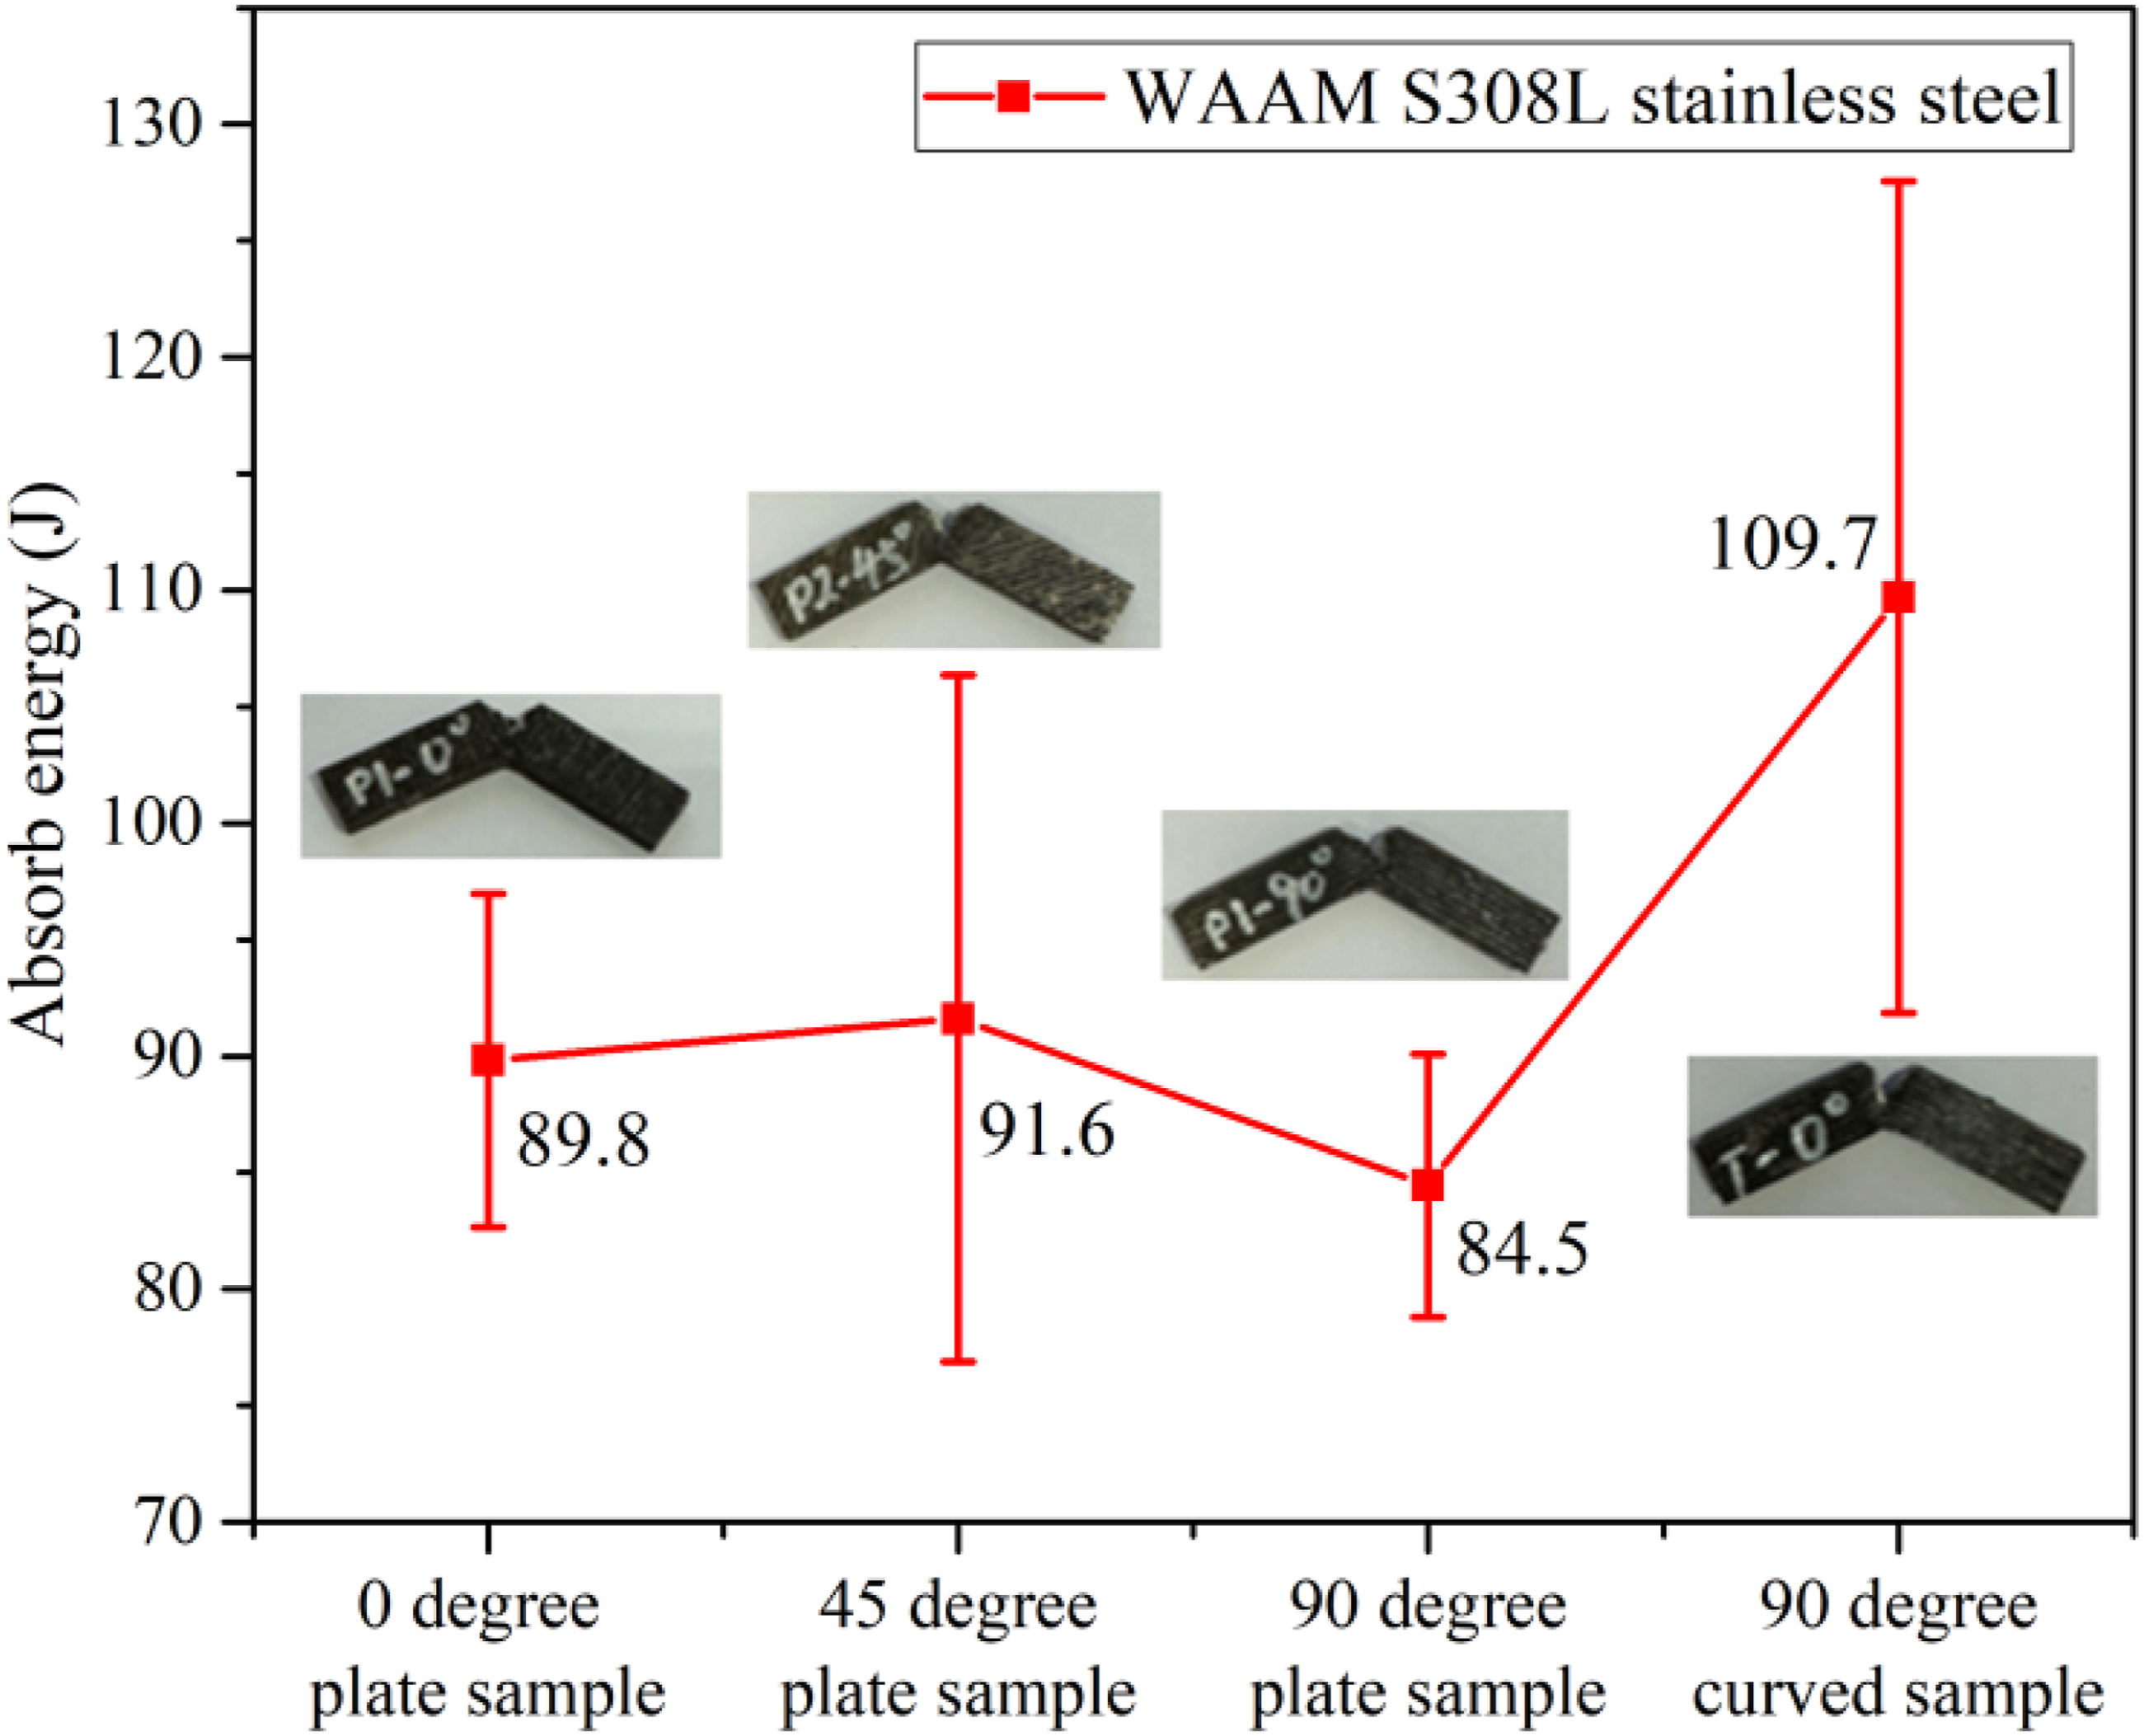
Samples with an extraction angle of 45° possess superior energy absorption capacity, while those with a 90° angle had inferior results, indicating the material anisotropy in the impact toughness of WAAM S308 L stainless steel. The larger SD values of 45° plate and 90° curved samples suggest greater sensitivity. The average absorbed energies of 0°, 45°, 90° plate sample and 90° curved sample are 89J, 91J, 84J and 109J, which are much larger than the minimum average Charpy V-notch impact test energy requirement (27 J) given in the standard (BS EN 1993-1-10: 2005, 2005). For plate samples, there was no significant difference in impact toughness due to the extraction angle. Comparably, curved samples exhibit higher impact toughness than plate samples. The fracture surfaces of the samples, shown in Figure 11, display obvious deformation caused by impact load, demonstrating a ductile fracture mode without breaking into two parts.
Bending behaviour
Typical plate and curved bend pieces for specimens are shown in Figure 12(a) and (b). The average bending angle of all specimens is around 150°, and there are no cracks observed on the surface. Experimental results demonstrate that WAAM S308L SS, in both flat and curved shapes, possesses excellent bendability. Typical test pieces: (a) Before and (b) after the bend test.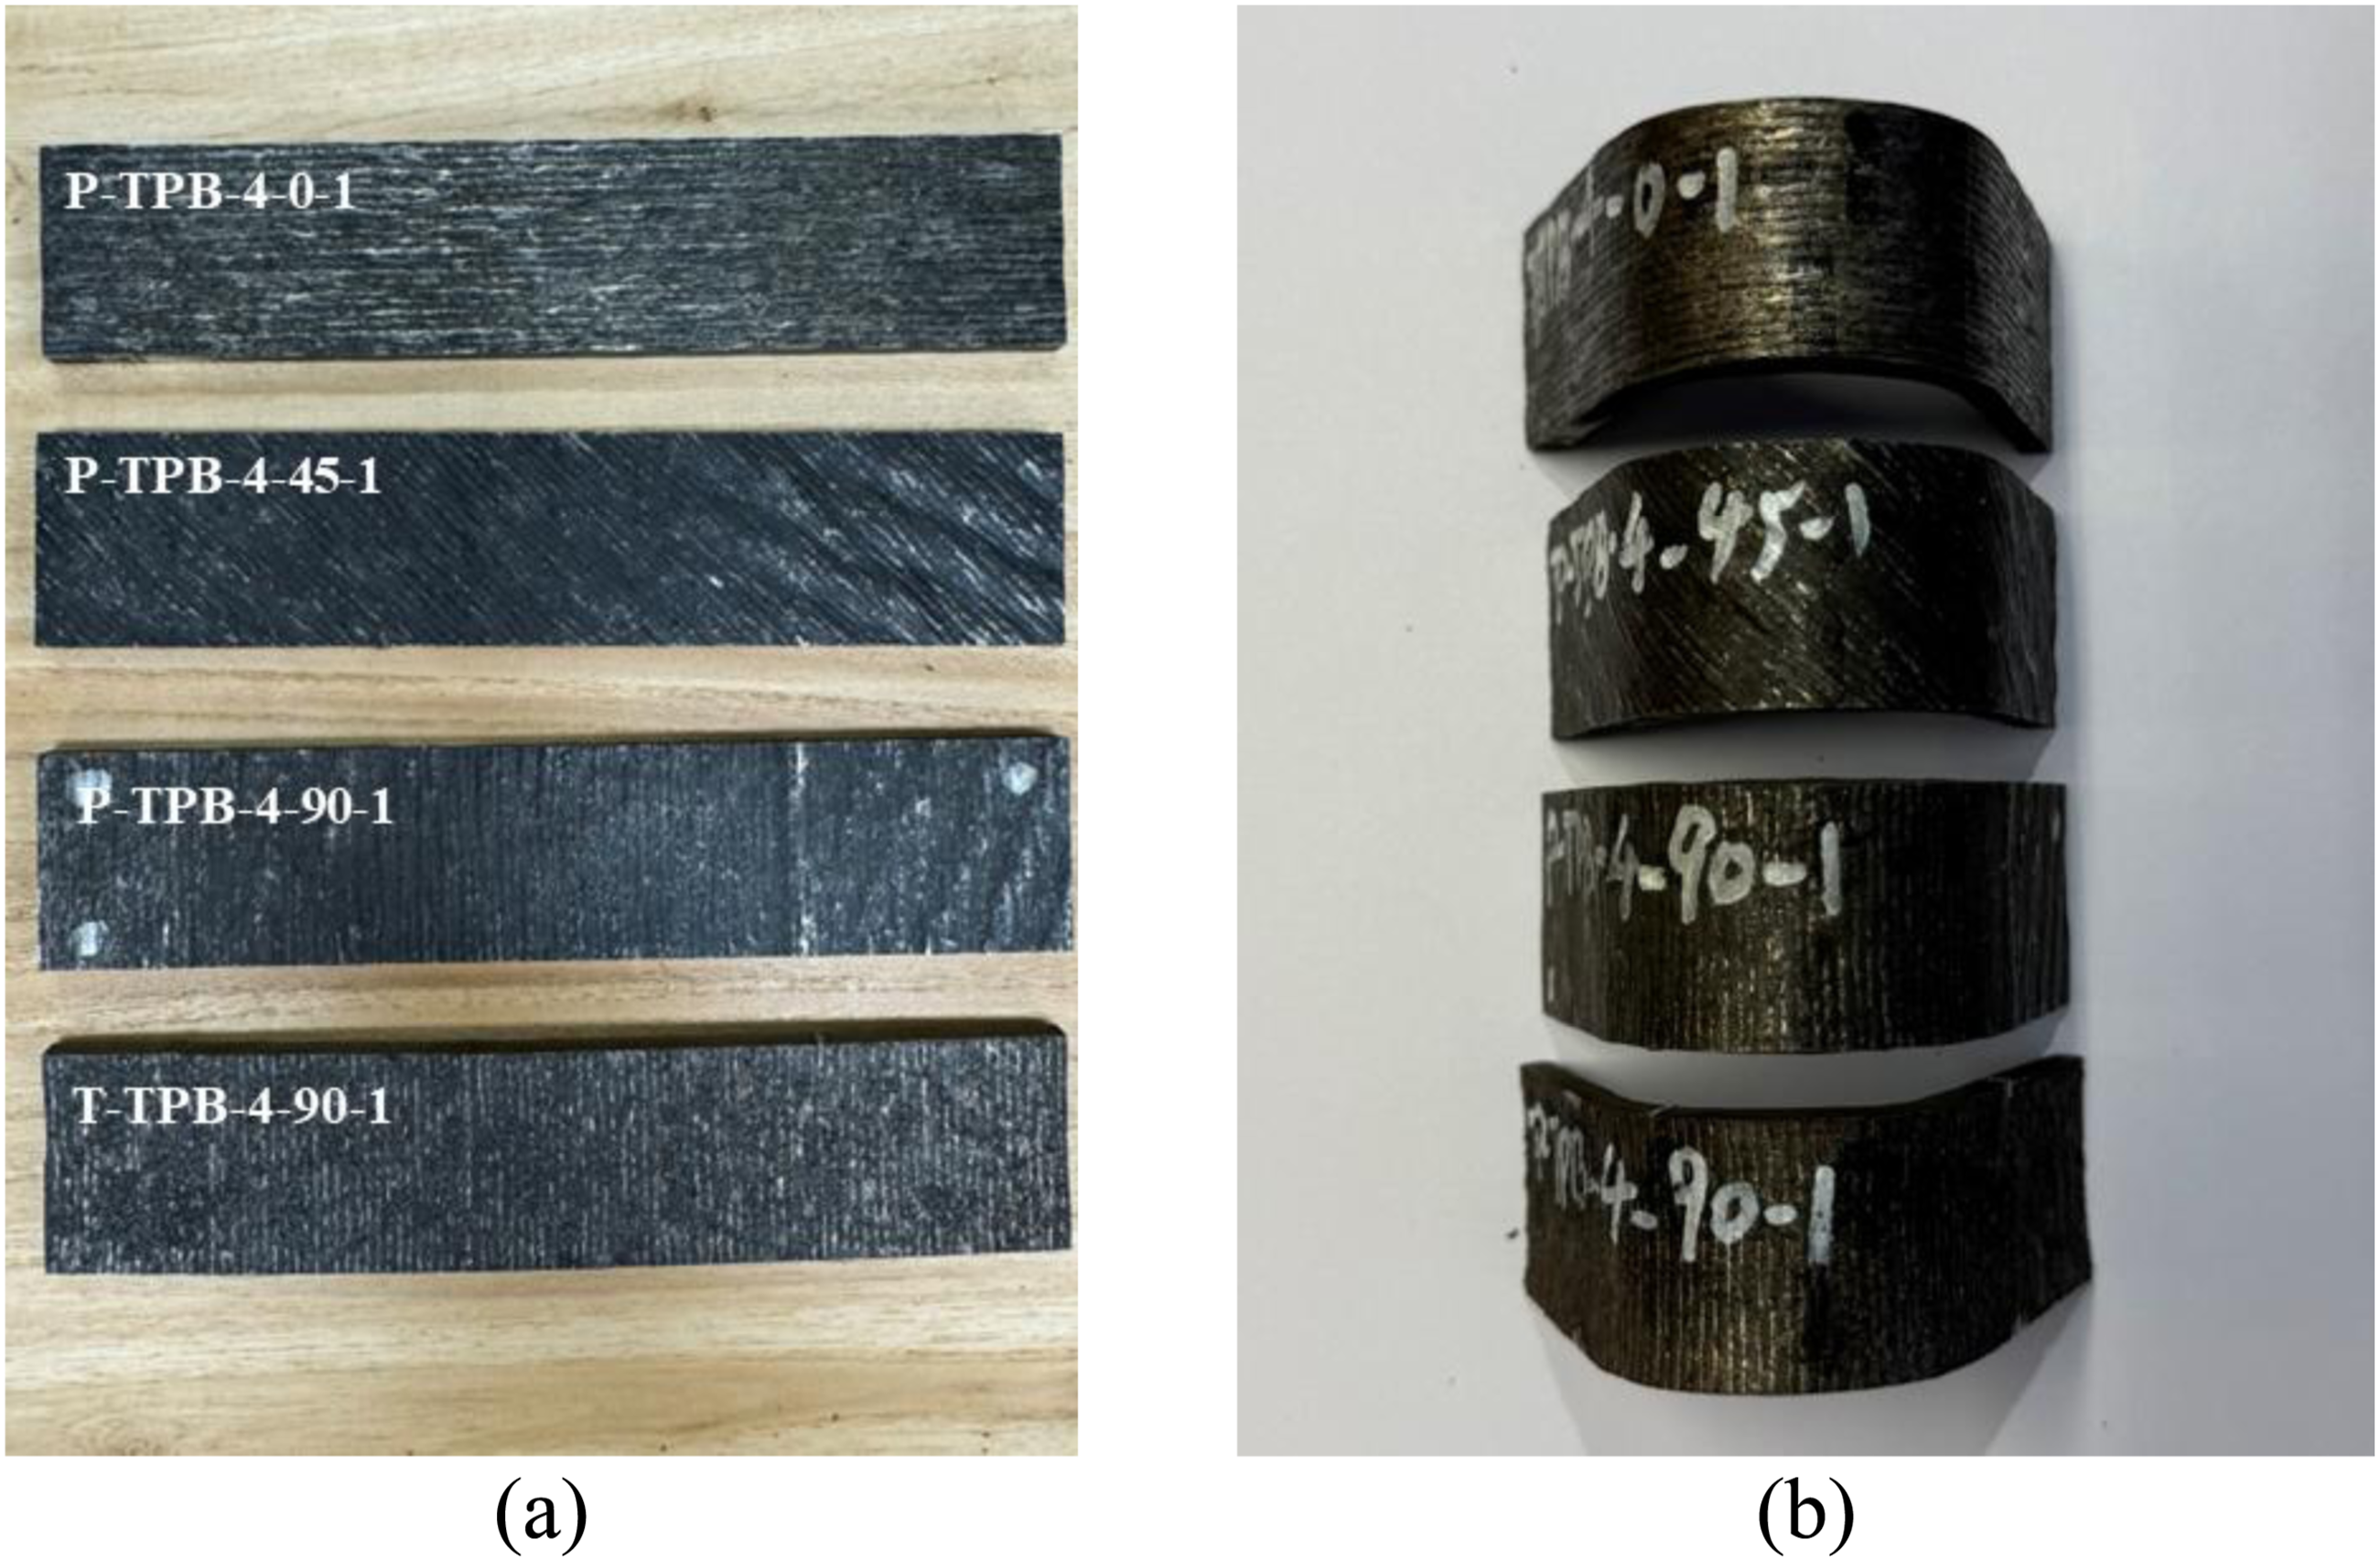
Tensile test results
As shown in Figure 13, the stress-strain curves were plotted for the WAAM S308L SS plate and curved coupons. Given that there are no obvious yield platforms, the 0.2% proof strength is adopted as the yield strength. The mechanical properties of Young’s modulus E, elongation ratio δ, 0.2% proof strength σ0.2, 1.0% proof strength σ1.0, and ultimate strength σ
u
are obtained from the stress-strain curves and provided in Table 4, and the mean and standard deviation values of specimen with different extraction angles are calculated. It can be seen that the ductility requirements, σ
u
/σ0.2 ≥ 1.1, ε
u
/ε0.2 ≥ 15, and ε
u
> 15%, given in the standard (BS EN 1993-1-4: 2025, 2025), are fully satisfied. To investigate the influence of geometric undulation on the mechanical properties, the results of WAAM S308L stainless steel machined tensile coupon obtained by Chen et al. (2024b) were utilized for comparison. These specimens were also manufactured using cold metal transfer technologies. The as-built specimens exhibited a decrease in the Young’s modulus, with a significant reduction observed for the 90° specimens, consistent with existing research results (Kyvelou et al., 2020). Notably, the strength difference between machined and as-built WAAM S308 L stainless steel specimens is statistically negligible. This finding indicates that geometric undulations inherent to the as-built WAAM surface topography exert negligible influence on the material’s mechanical properties. Stress-strain curves of the WAAM tensile coupons: (a) full range and (b) initial range. Mechanical properties of the WAAM S308L SS.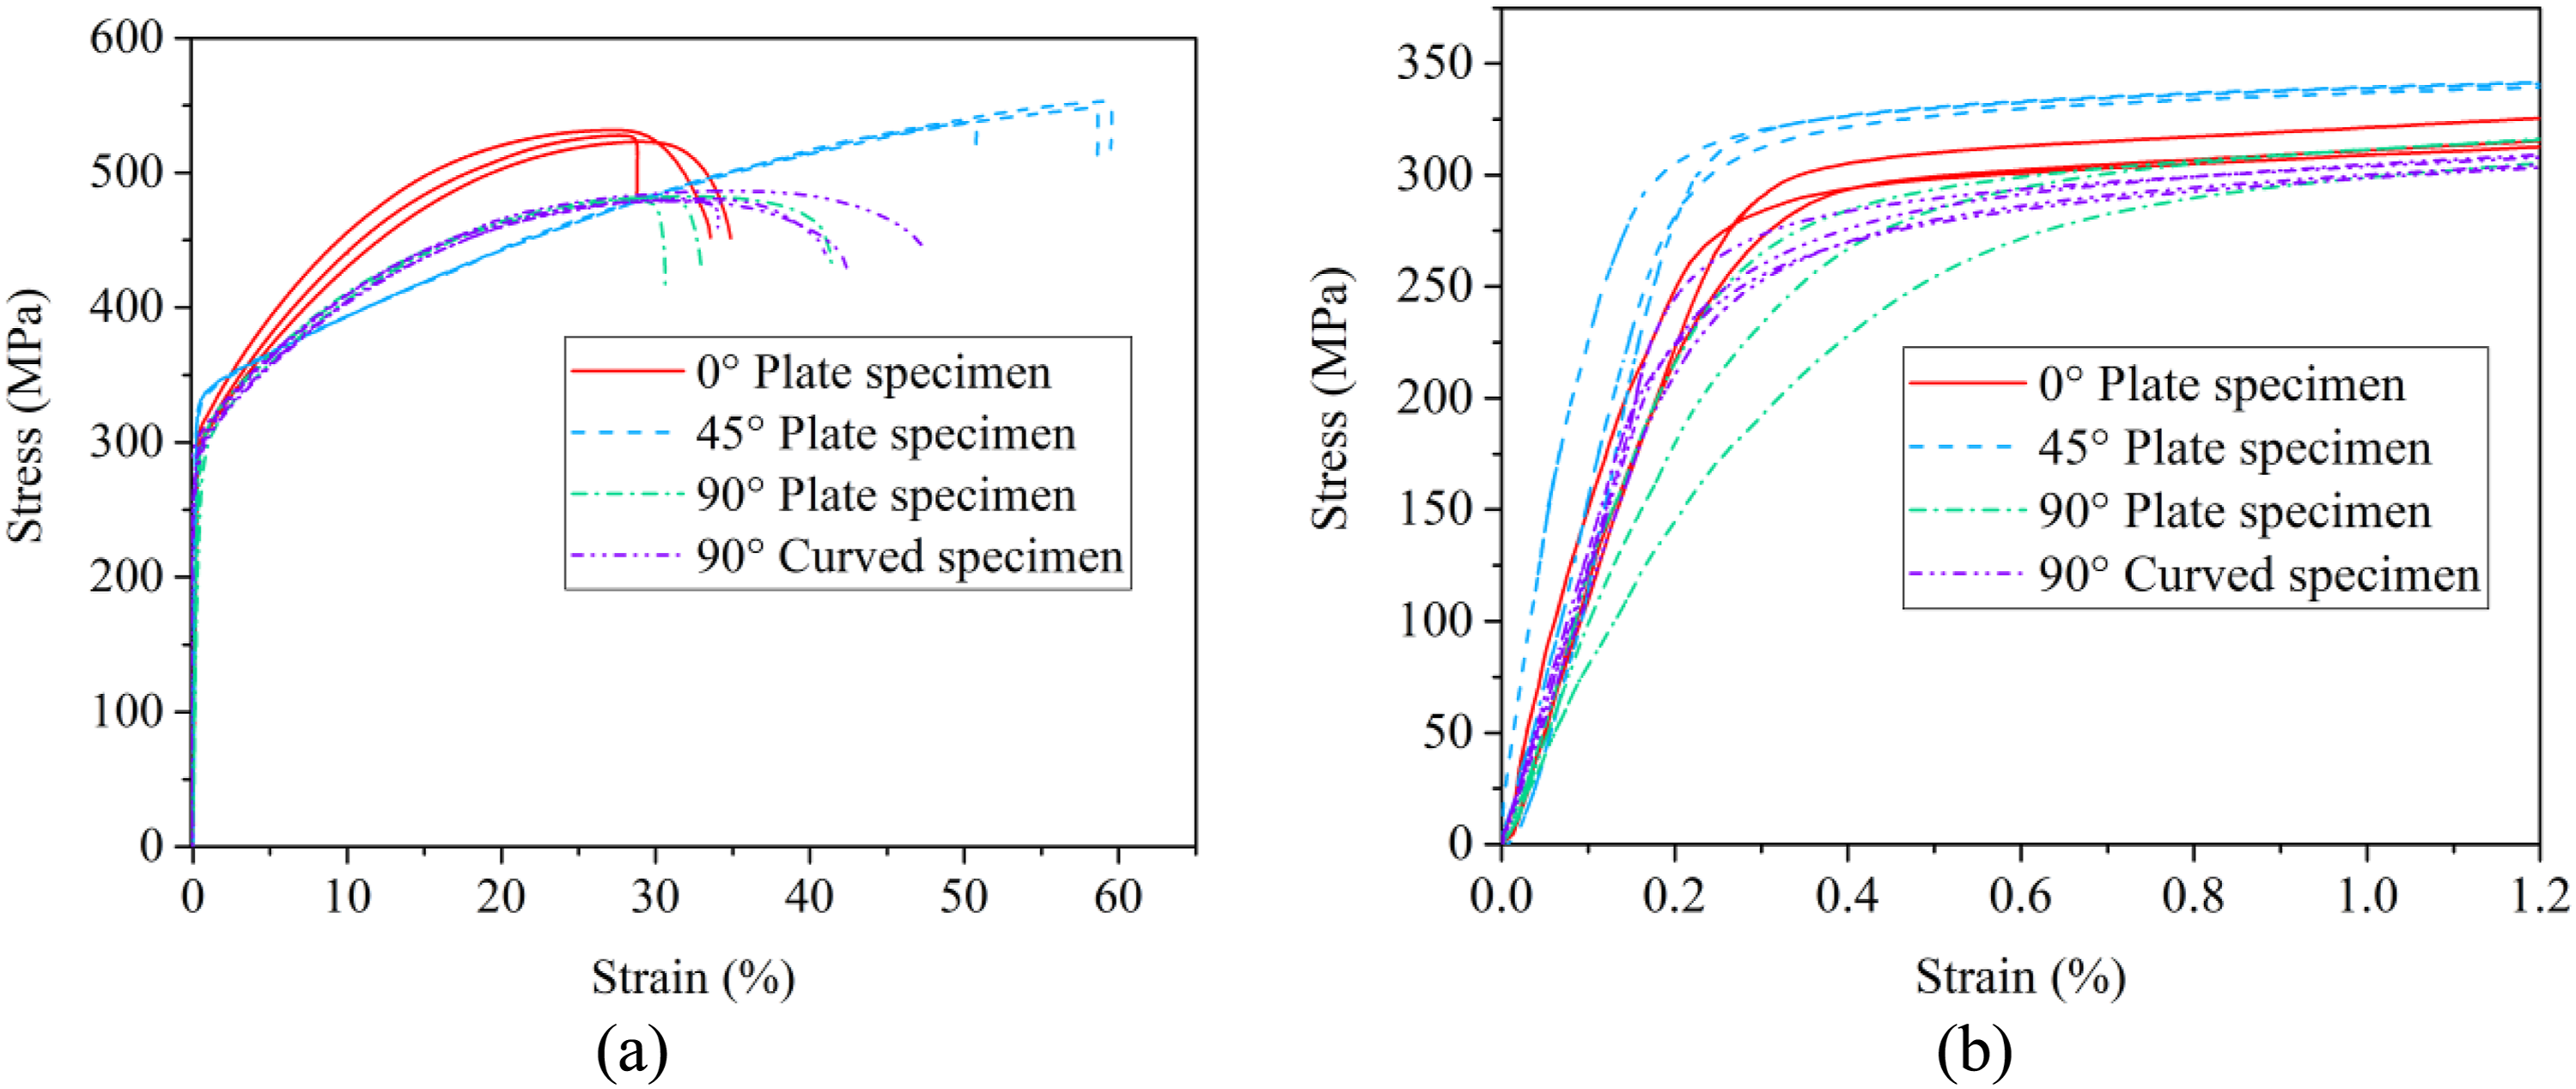
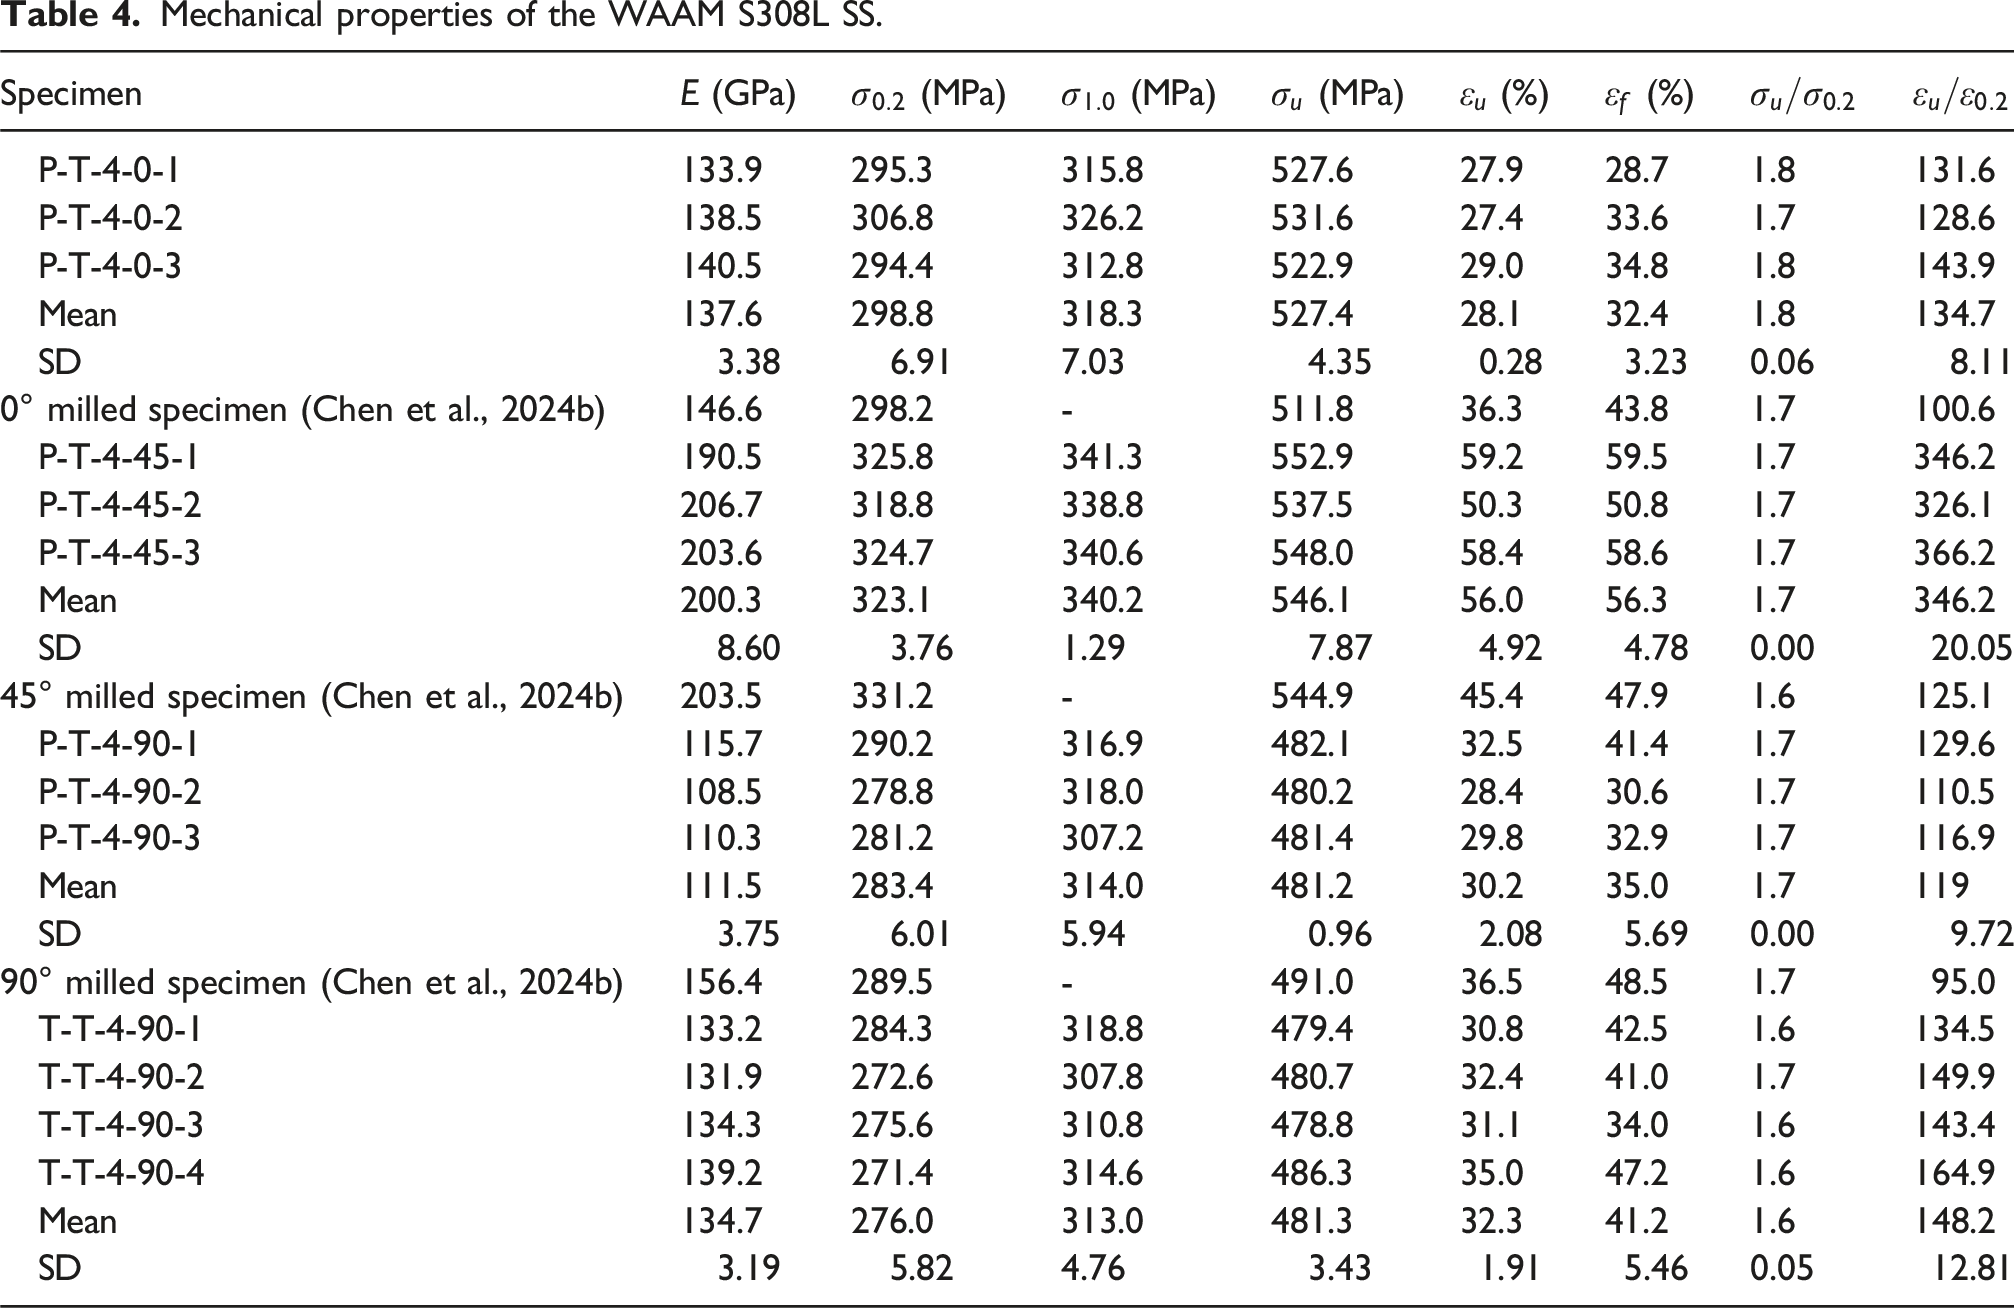
Material anisotropic behaviour can be observed from the stress-strain curves (see Figure 13) of the plate specimens: the 45° WAAM S308L SS tensile coupon possesses superior mechanical properties, as evidenced by the mean values of Young’s modulus, strength, and ductility (ε u ) being 83%, 14%, and 85% larger than those of 90° tensile coupon, respectively. These tensile specimens show consistent performance evidenced by the low SD values of mechanical properties. The mechanical properties of the specimens decrease in the order of 45° > 0° > 90°, where 45° specimens retain the highest performance and 90° specimens the lowest.
The material anisotropy behaviour can be attributed to the microstructural crystallographic texture. As a main feature of crystallographic texture, grain orientation is an important factor affecting mechanical properties. Laghi et al. (2020c) points out that grain orientation tends to grow along the maximum thermal gradient during the printing process. Besides, the rapid solidification of the printing metal contributes to a strong crystallographic texture. Therefore, grains growing parallel to the loading direction, namely the 90° specimens, exhibited inferior mechanical properties as it is easier for grain dislocation slip to occur. Comparatively, specimens with 0° and 45° extraction angles have shown better tensile properties. To account for material anisotropy in structural design, the plane orthotropic model and Hill’s yield criterion are used to model the elastic and inelastic responses of anisotropic materials.
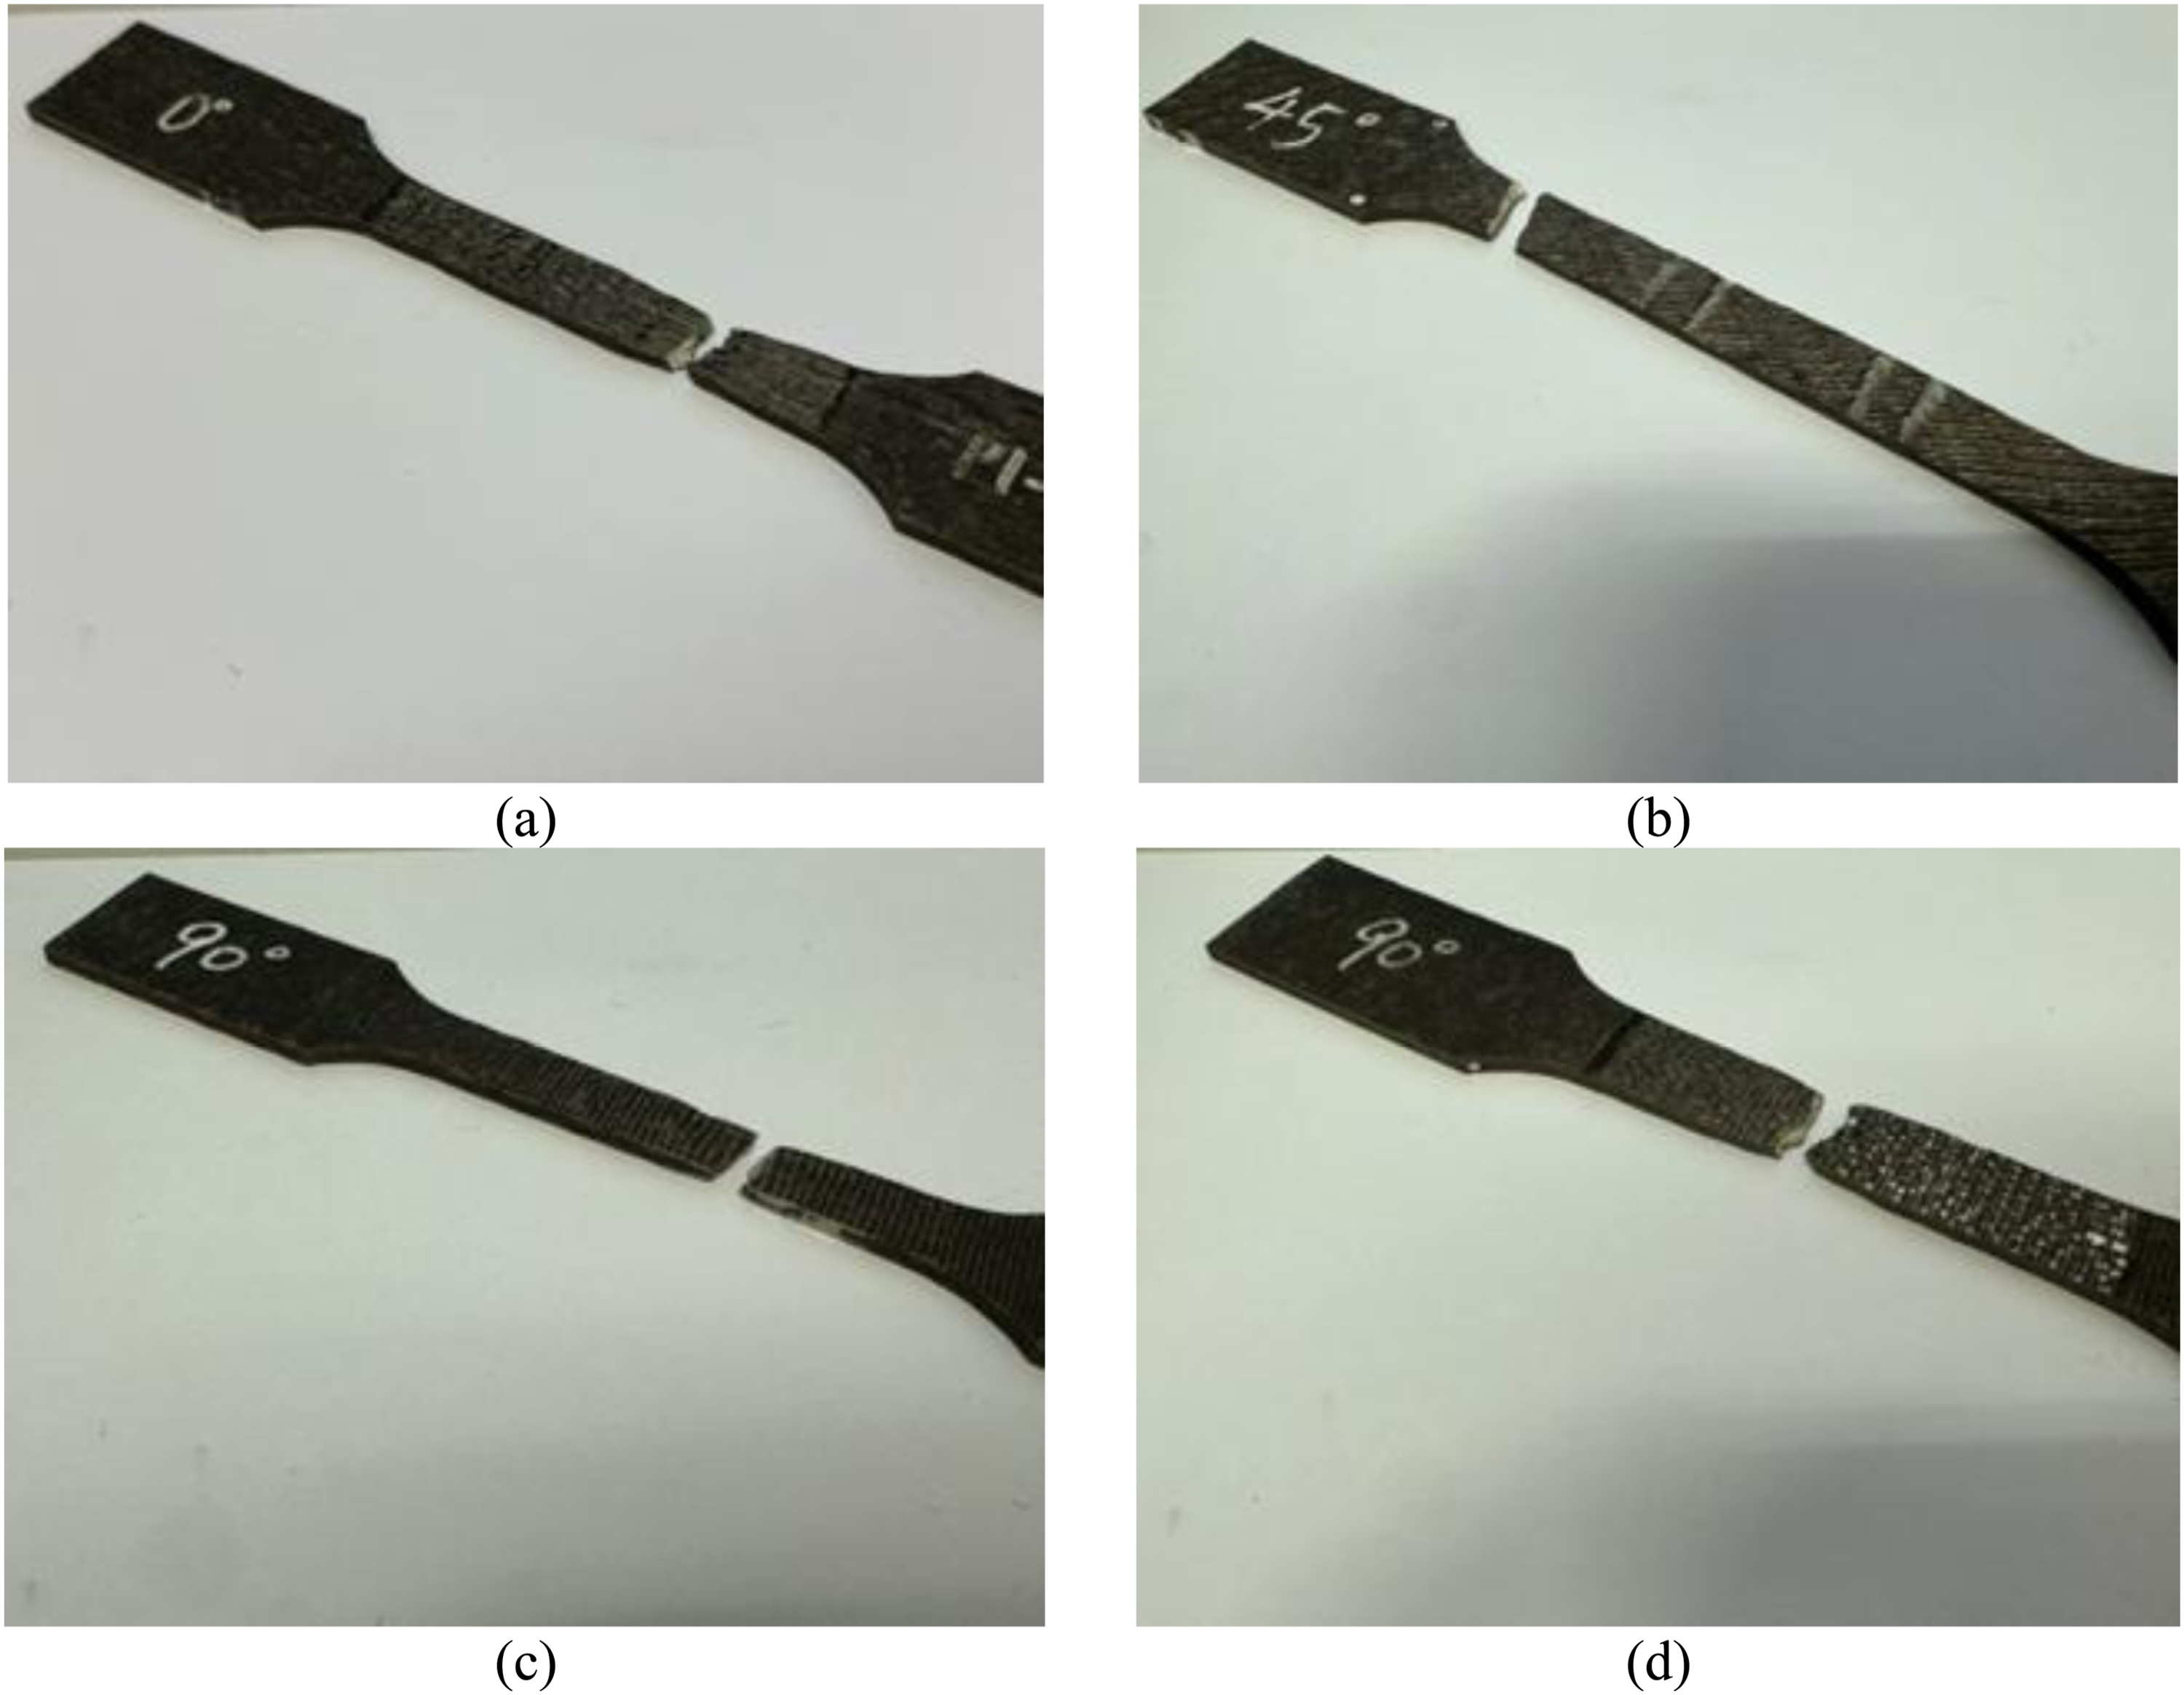
The typical longitudinal strain fields of the specimen, when the stress reached σ1.0 are plotted in Figure 14. It is observed that for the 90° specimen, the maximum strain tended to develop in the middle part in the horizontal direction, while the maximum strain was located near the clamp side for the 45° specimen. The failure modes of the test specimen are shown in Figure 15. A preferred failure located near the clamp side was observed in the 45° specimen, while other specimens tended to fracture in the middle part. To reveal the failure mechanism of the material, the microscopic morphology of the tensile fracture surface was investigated using the TESCAN VEGA3 system. Samples were cut from the fracture surfaces of the tensile coupons. Strain fields of the specimens at Failure modes of the tensile coupons: (a) 0° plate specimen, (b) 45° plate specimen, (c) 90° plate specimen, and (d) 90° curved specimen.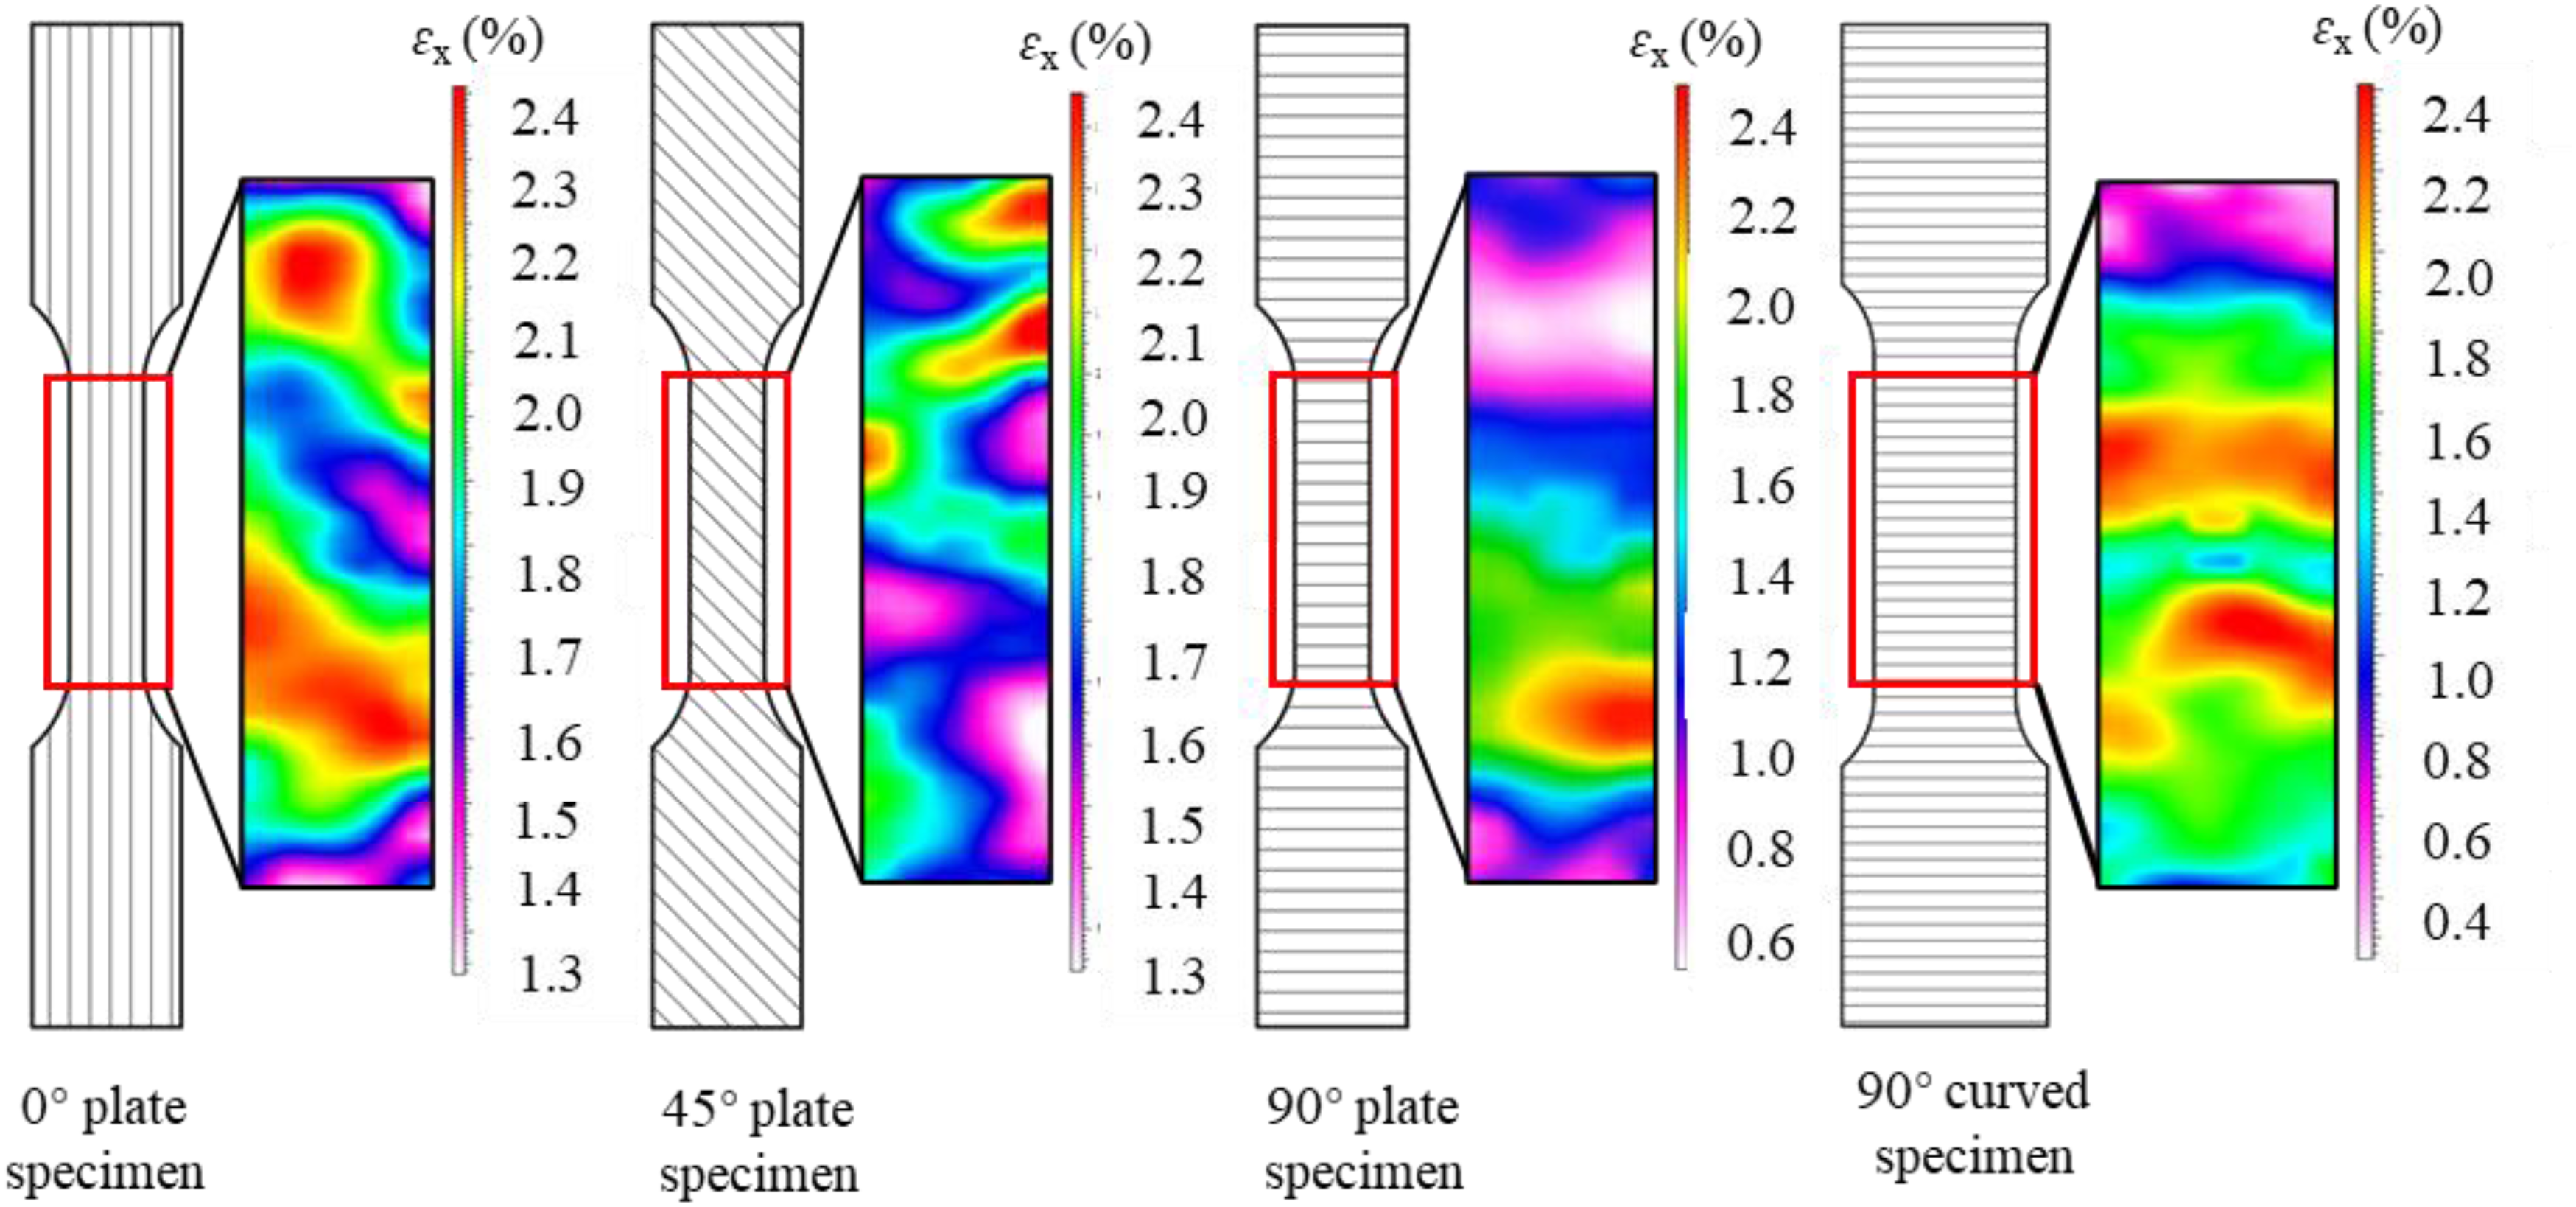
Anisotropy modelling
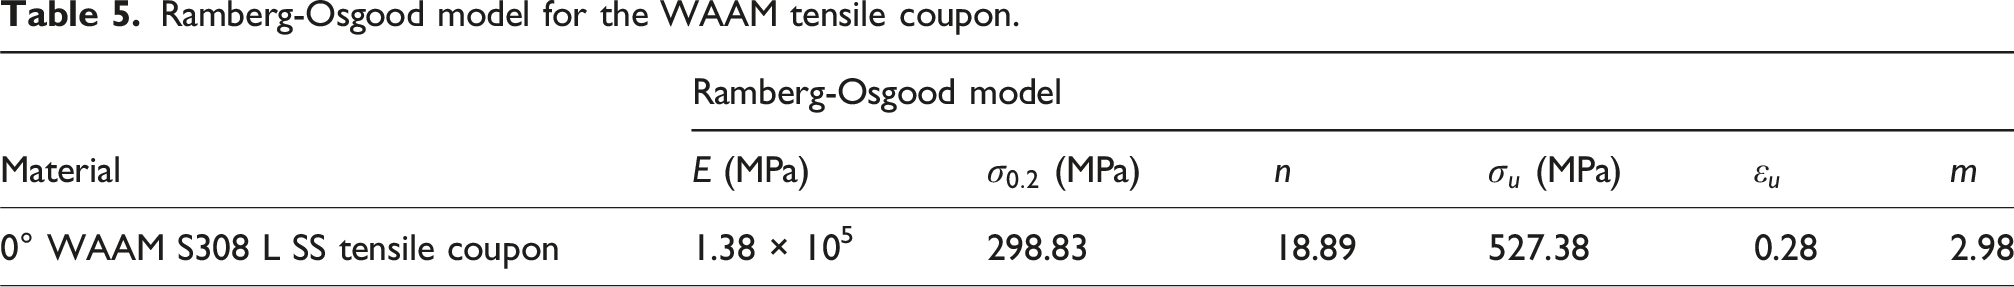
Material models were developed to describe the stress–strain relationship and anisotropic behaviour of the 4 mm as-built WAAM S308L stainless steel plate based on tensile test results. The 0° extraction angle was selected as the reference direction to facilitate subsequent formulation derivation (Hadjipantelis et al., 2022). Elastic and inelastic anisotropic mechanical properties at various extraction angles were evaluated relative to this reference direction. A two-stage Ramberg-Osgood model was employed to describe the stress-strain curve of 0° WAAM S308L SS plate tensile coupon. The Ramberg-Osgood model consists of two parts: the elastic (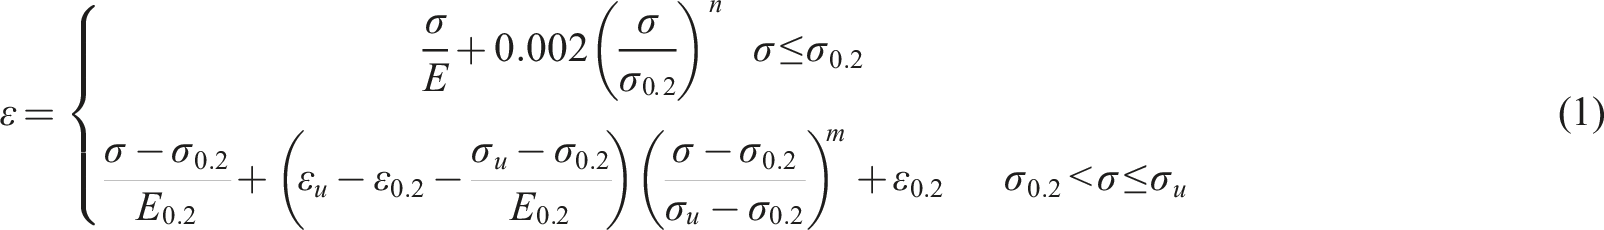
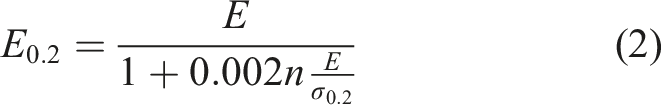
Ramberg-Osgood model for the WAAM tensile coupon.
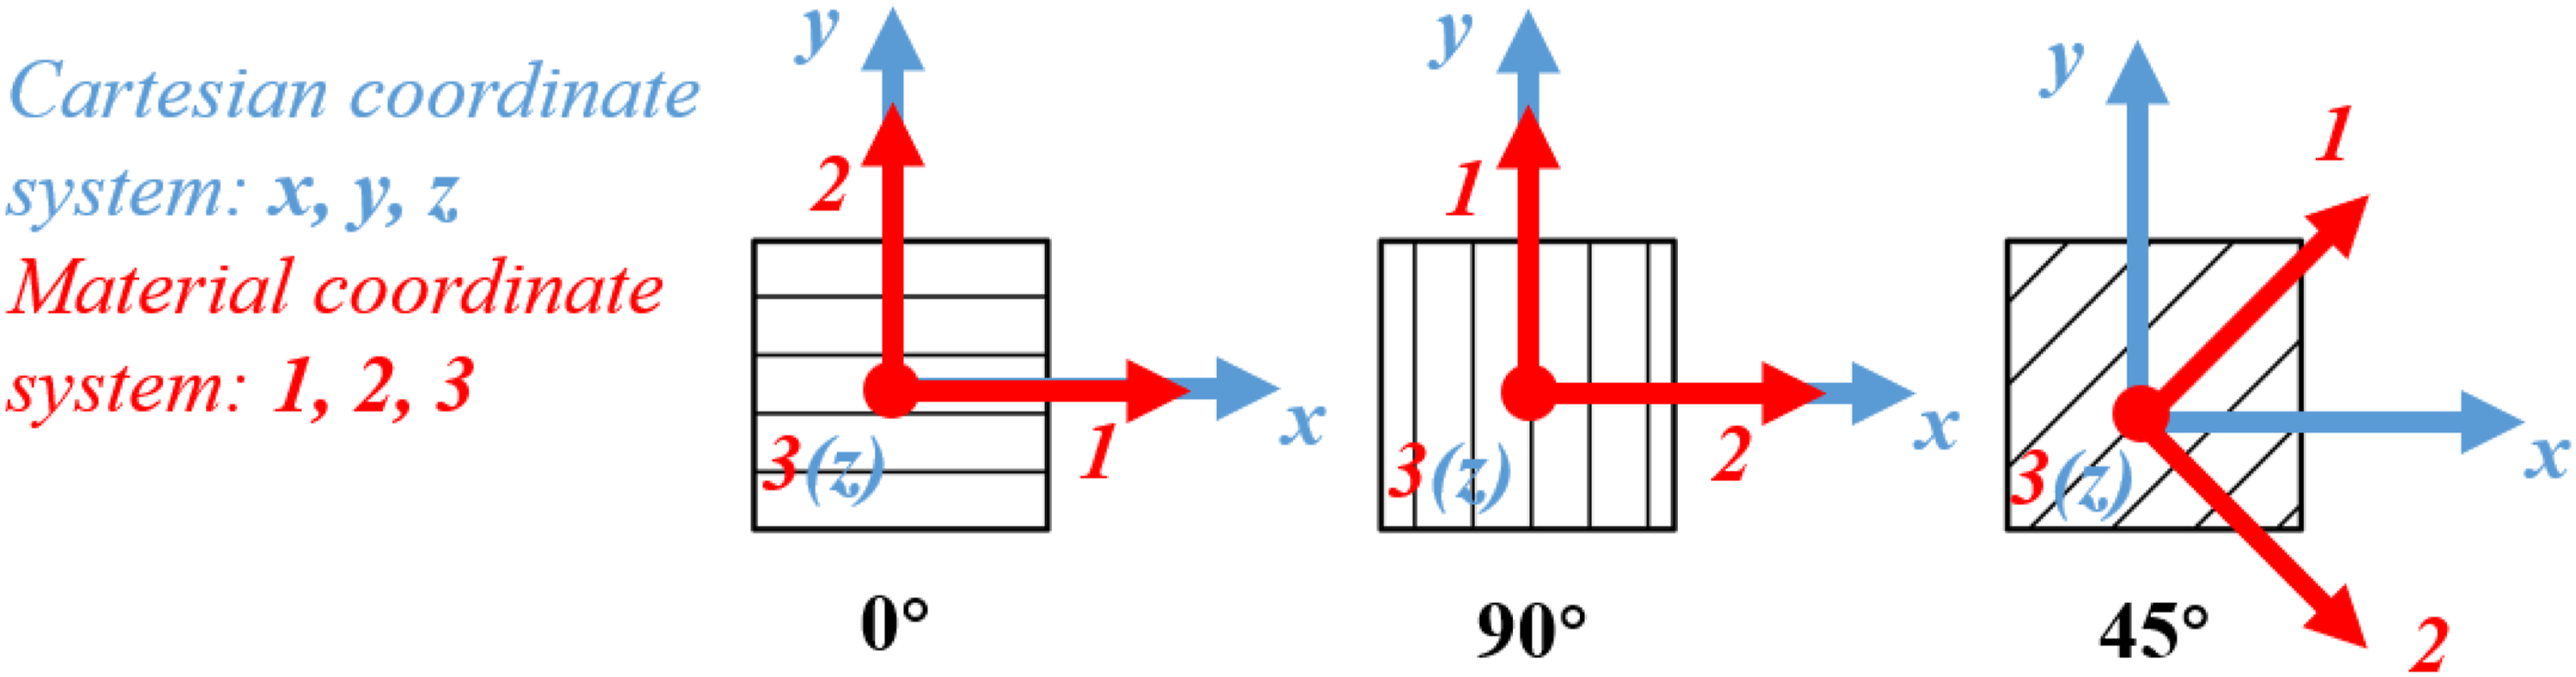
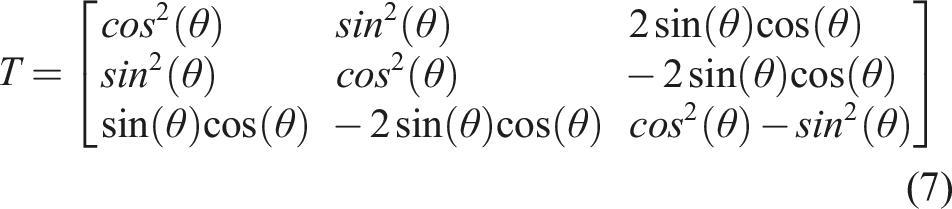
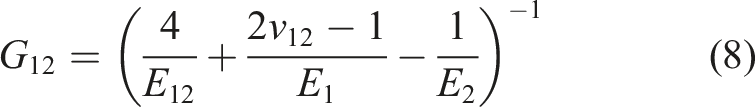
The observation of the anisotropy in the WAAM S308 L SS tensile coupon has demonstrated its heterogeneity. For the linear elastic constitutive model describing the stress-strain relationship, an orthotropic plane stress model containing four parameters will be developed to capture the anisotropic behaviour. The definitions of both the Cartesian and material coordinate systems are shown in Figure 16. In the Cartesian coordinate system, the x-axis represents the loading direction, and the transverse direction is defined in the y-axis. In terms of the material coordinate system, the printing direction of the WAAM material is defined as the 1-axis direction, while the perpendicular part is defined as the 2-axis direction. Besides, the 3-axis direction is oriented out of plane. The relationship between plane stress and strain is given as: Definition of material and Cartesian coordinate systems.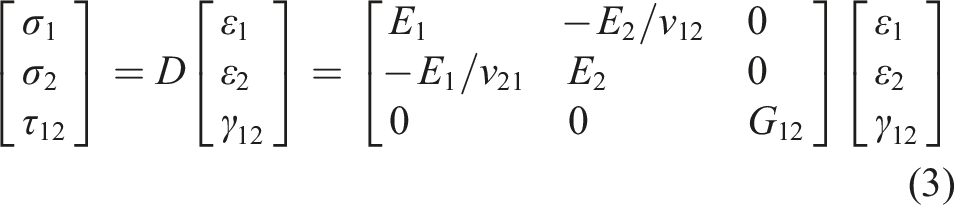
It is noted that the Poisson’s ratios v12 and v21 can satisfy the reciprocal equation: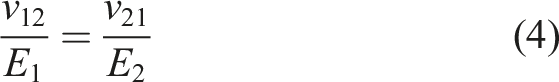
For the Poisson’s ratio 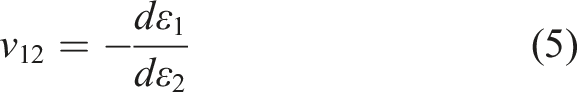
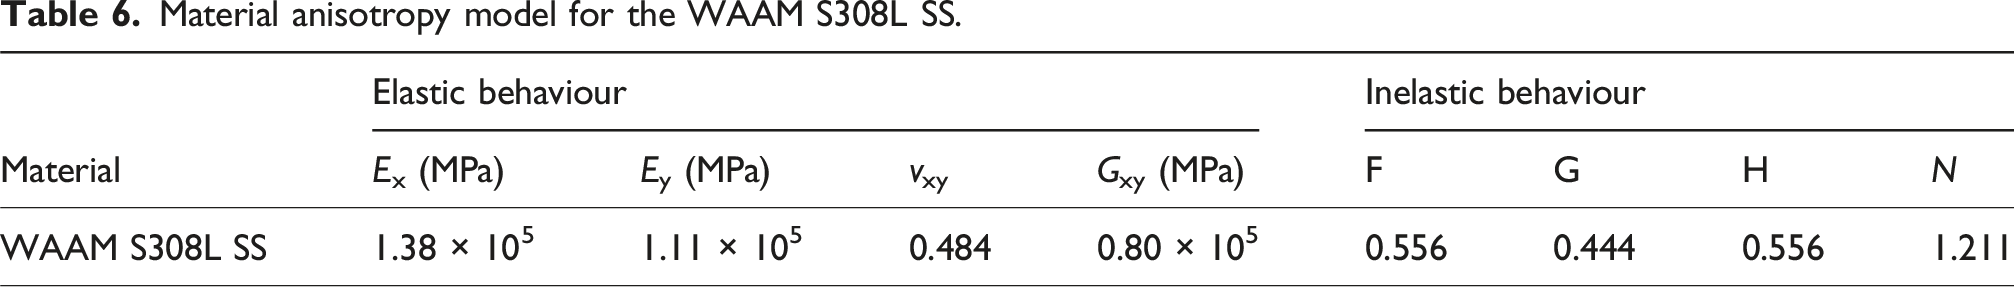
The parameters E1, E2 and 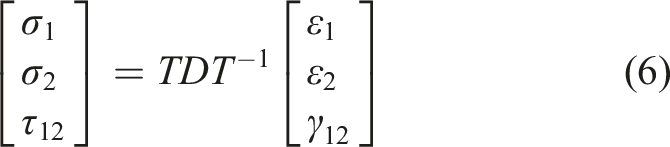

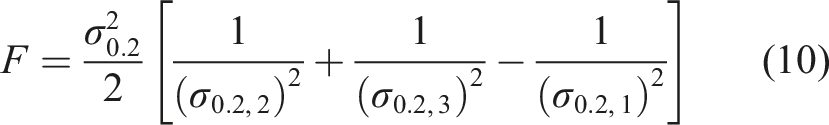
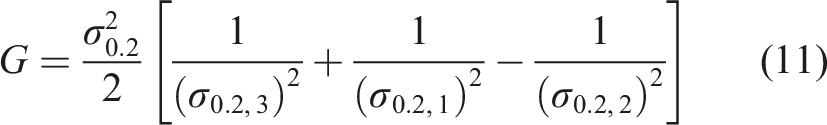
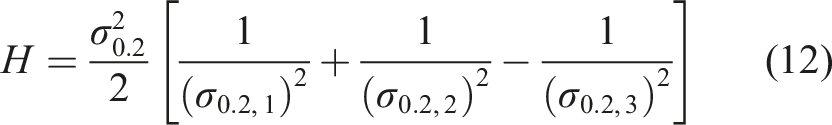
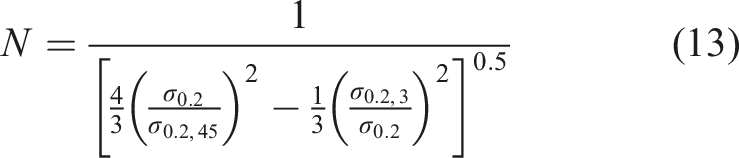
Material anisotropy model for the WAAM S308L SS.
Metallographic characterisation
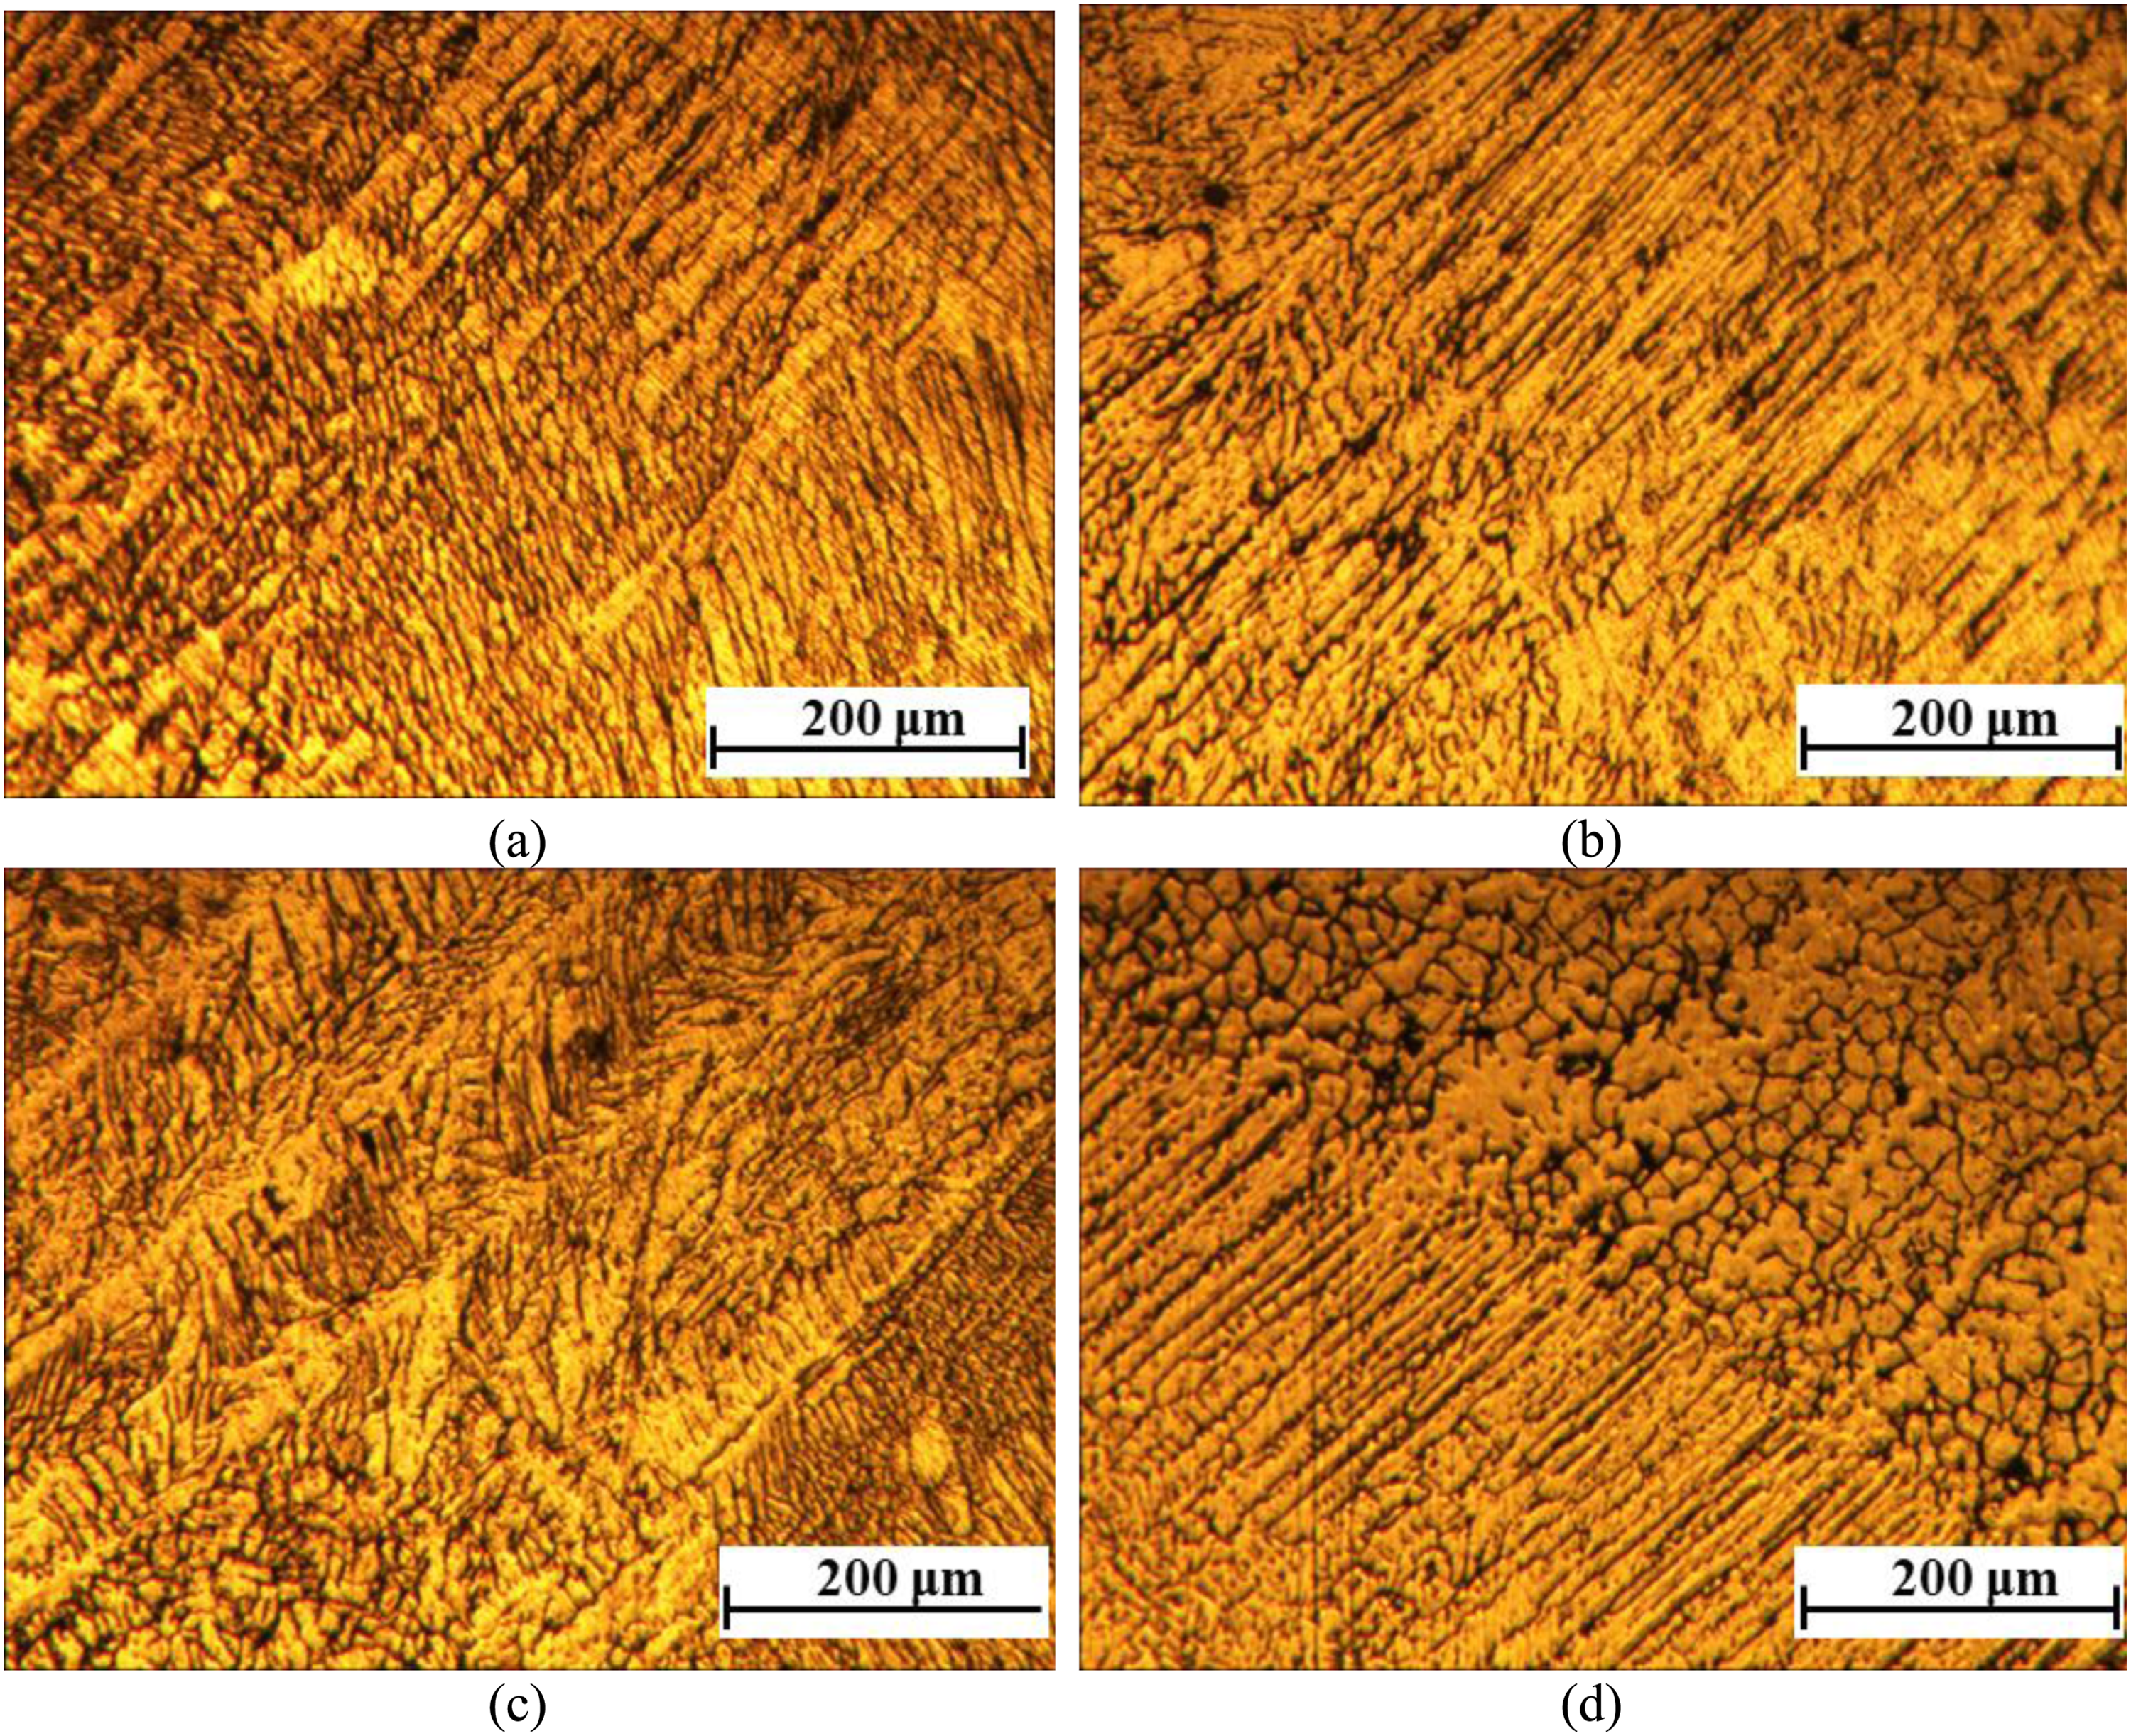
The results of the metallographic analysis of each sample are presented in Figures 17 and 18 for the plate and tube, respectively. Metallographic results show no obvious defects, such as cracks, delamination, and porosity. Additionally, the presence of distinct grain boundaries within each layer indicates refined microstructure, while strong metallurgical bonding at interlayer interfaces contributes to the material’s overall mechanical properties. The elongated austenitic dendritic grain structure observed is typical in the additive manufacturing process due to the rapid cooling rate. The weld metal austenitic phase appears in a dendritic form, with grains oriented toward the direction of the thermal gradient. Comparatively, austenitic grains are generally equiaxed in the annealed condition. Within the dendritic grains, γ-austenitic and δ-ferritic sub-structures can be observed, as shown in Figure 17. Additionally, a transition zone between elongated dendritic and face-centred cubic austenitic phases was found, mainly located at the interface between different deposited layers that underwent remelting and solidification. Similar phases and transition zones were also observed in the WAAM steel tube, as shown in Figure 18. Metallographic analysis of the WAAM S308 SS steel plate: (a) up, (b) middle, (c) down and (d) transition zone. Metallographic analysis of the WAAM S308 SS steel tube: (a) Up, (b) middle, (c) down and (d) transition zone.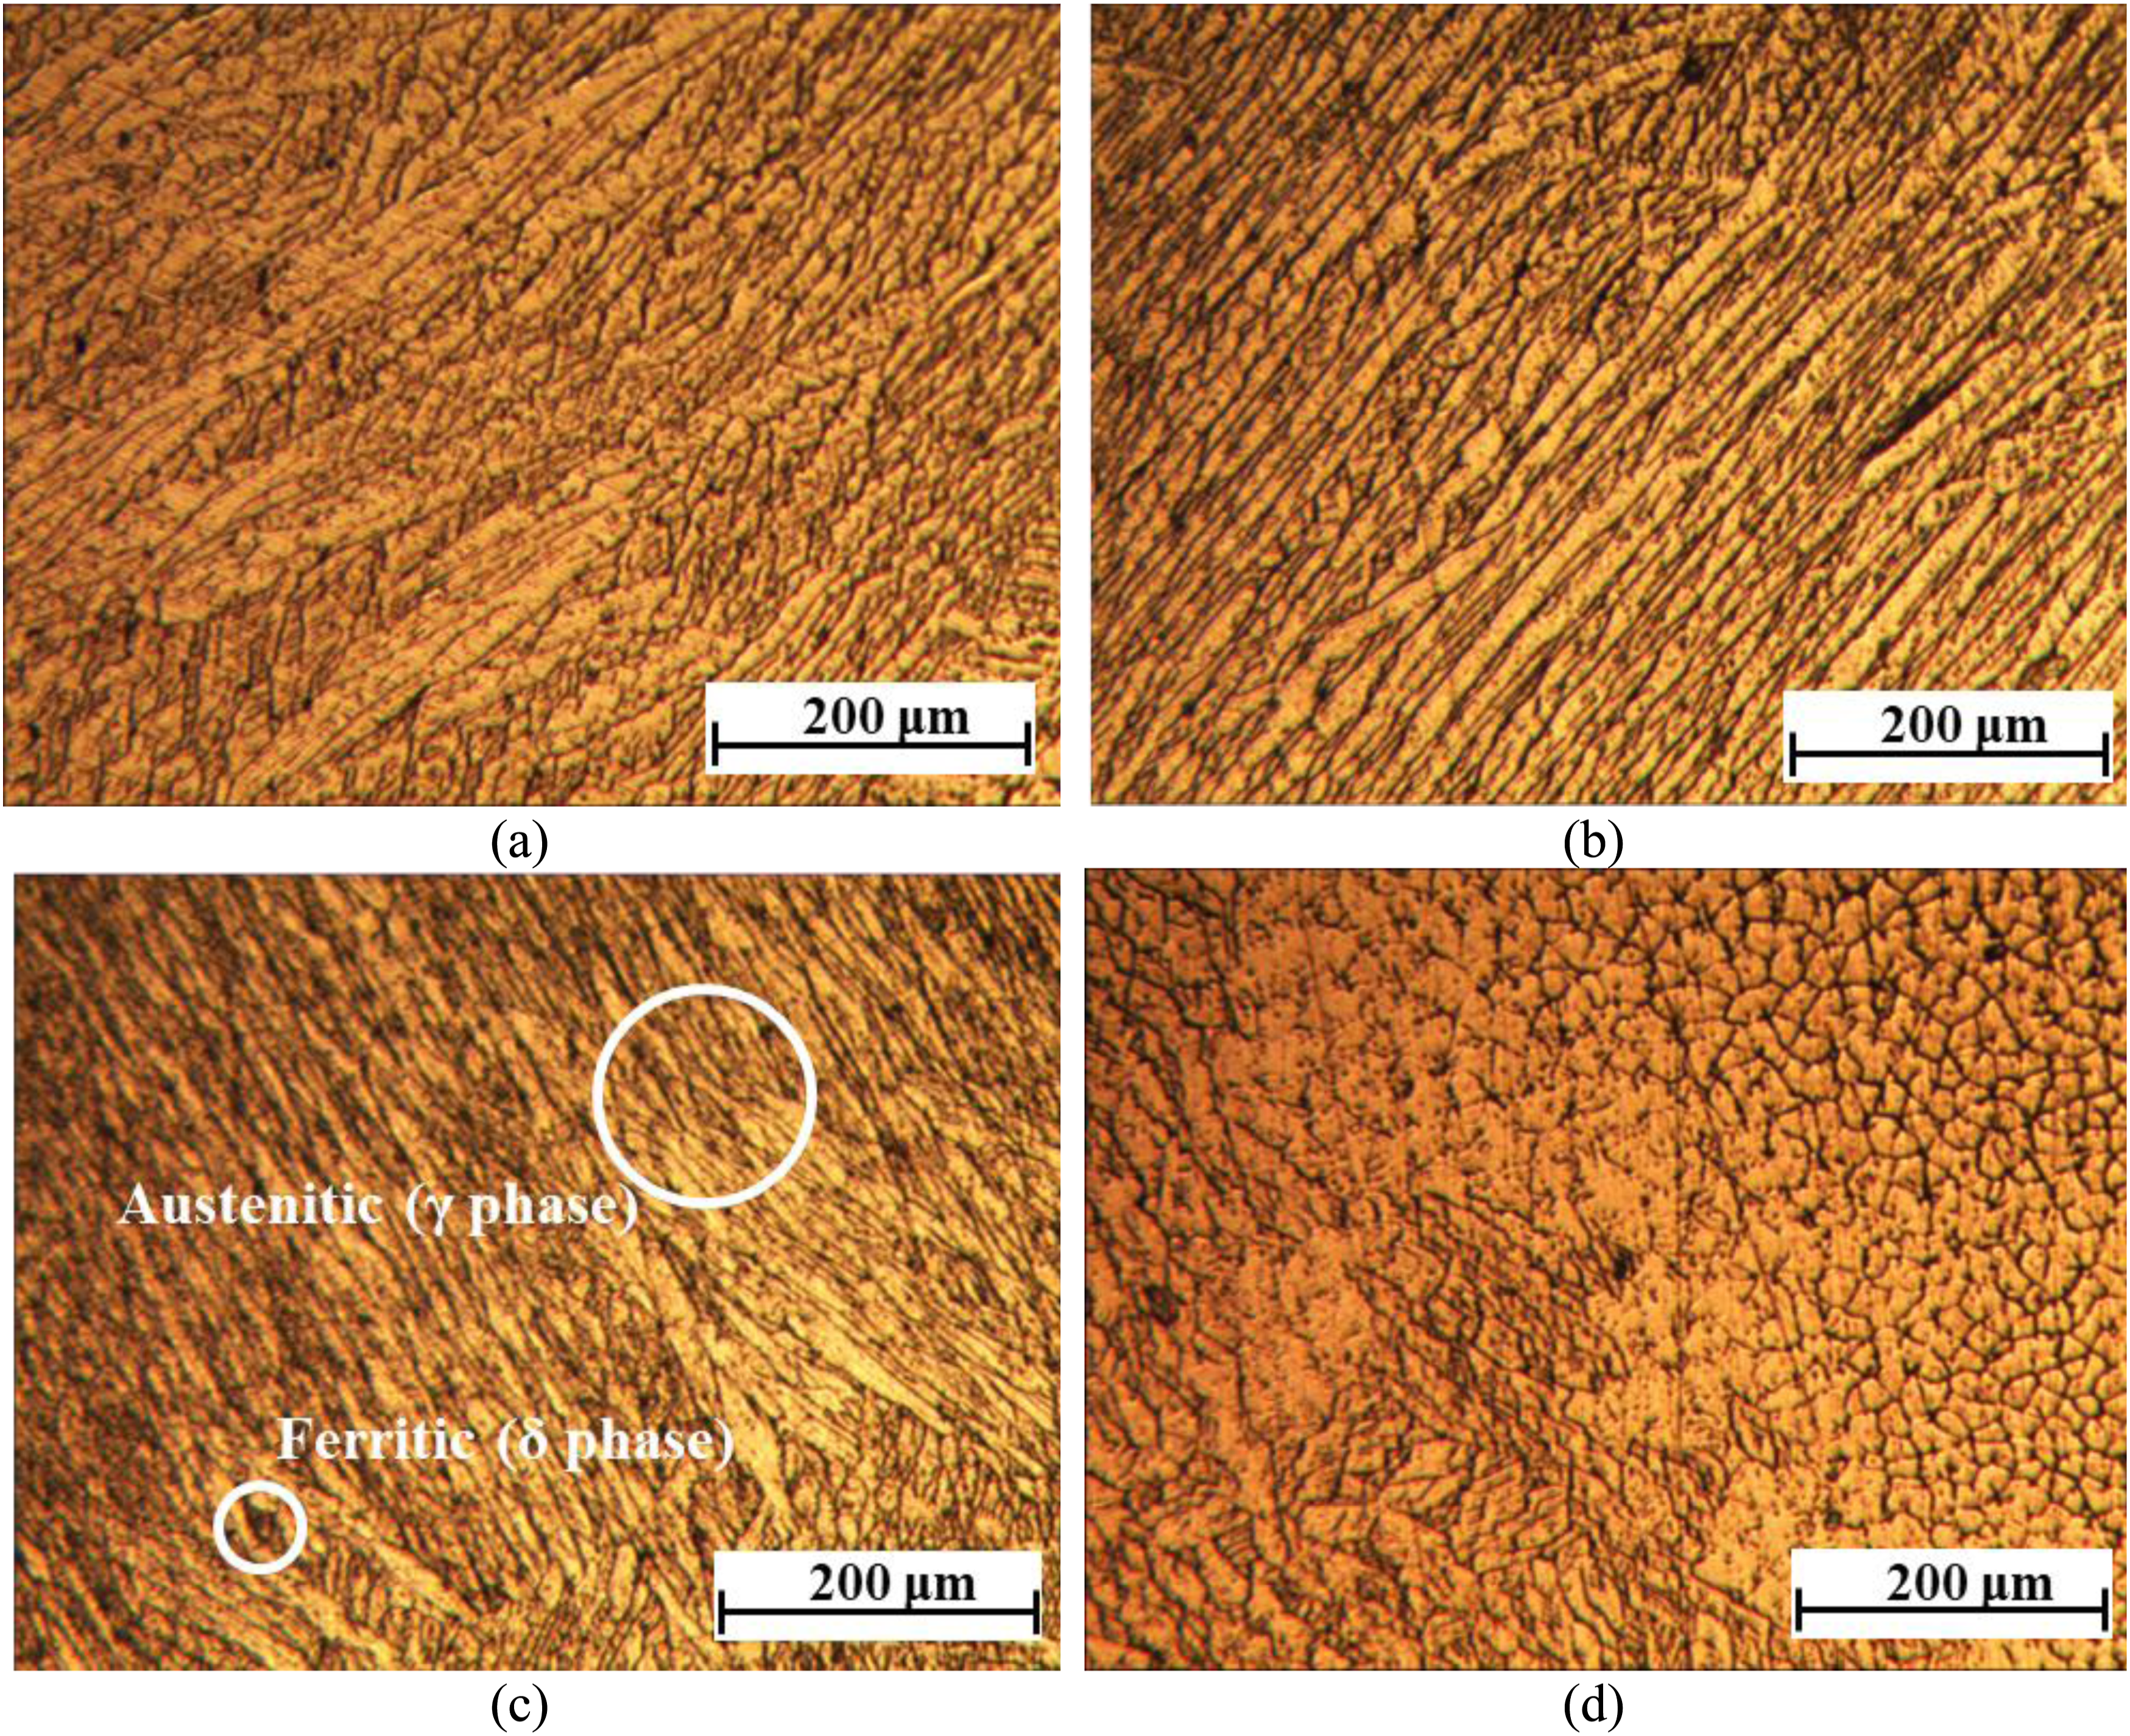
SEM analysis of the fracture morphology
Both low and high magnifications of the morphologies for samples extracted from plate and curved specimens are presented in Figure 19. The ductile fracture mechanism is evidenced by the SEM micrographs of the fracture surface. Numerous micrometre-sized dimples were observed, indicating good ductile behaviour. A comparison of the dimension and shape of the dimples between the plate and curved specimens demonstrates no major difference. SEM microscopy of the fracture surface: (a) (b) Fracture surface of the plate specimen and (c) (d) fracture surface of the curved specimen.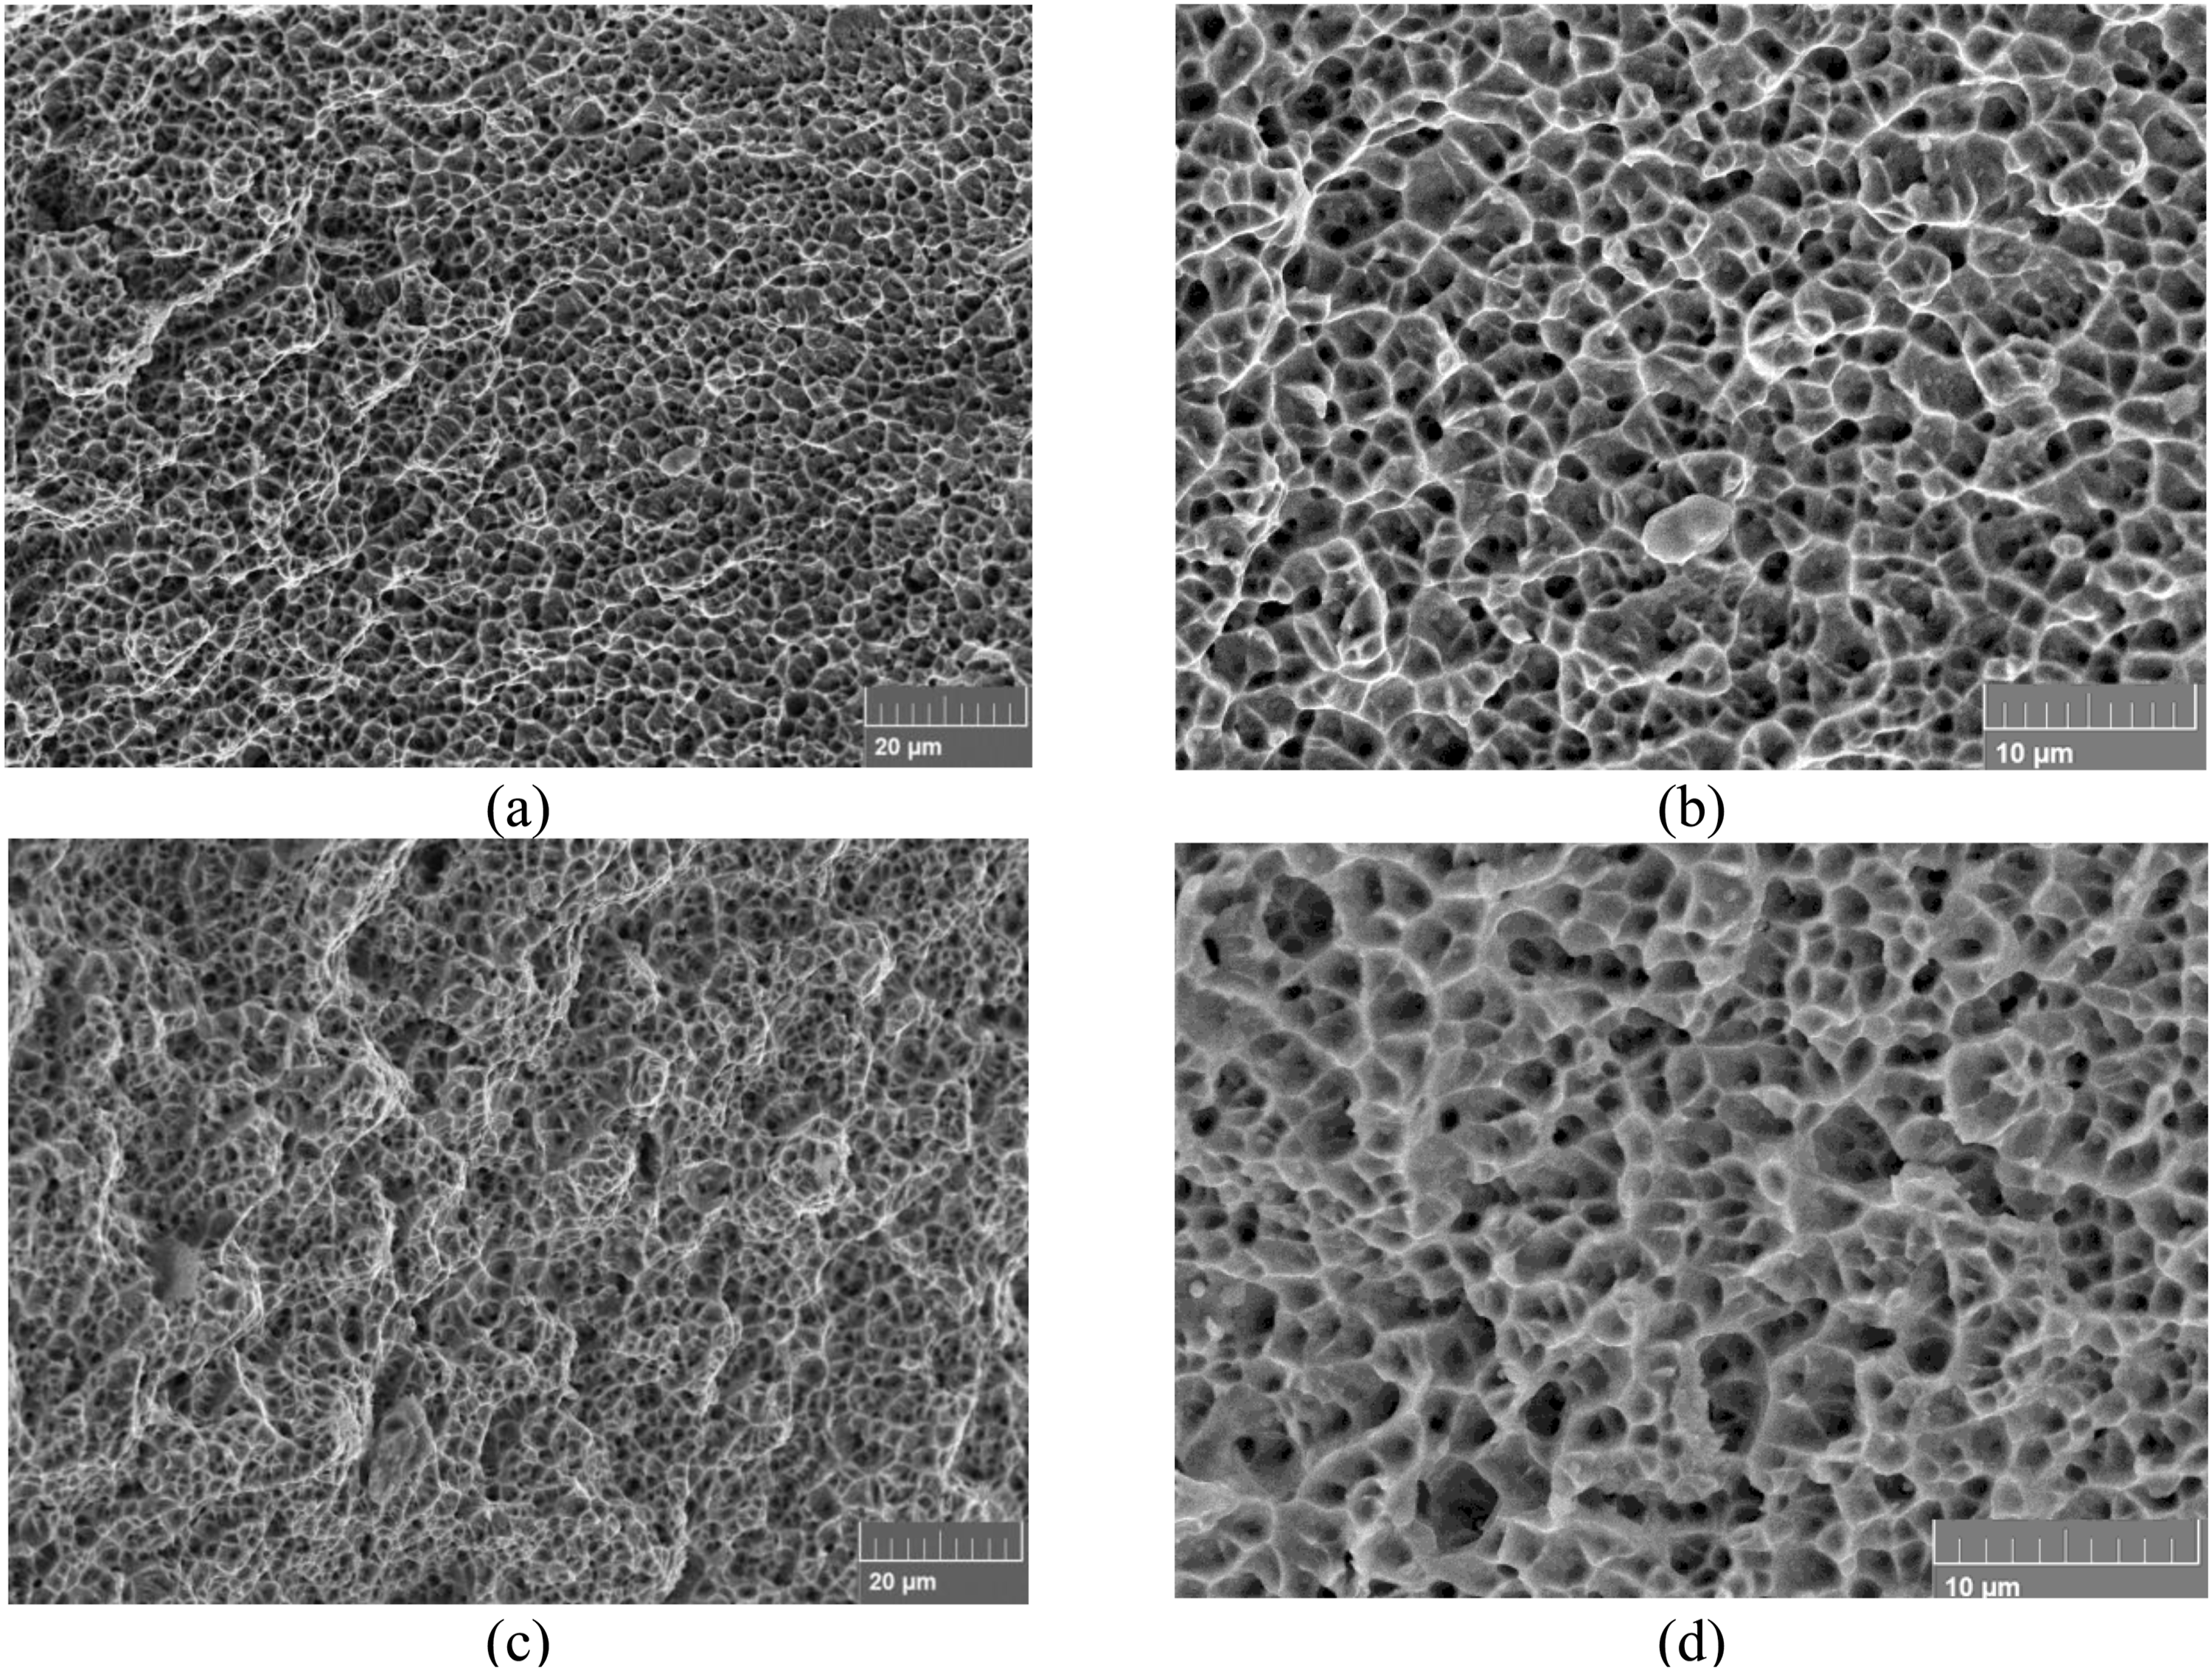
Inclined dimples were observed on the surface in both types of specimens, as shown in Figure 20(a) for the plate specimen and Figure 20(b) for the curved specimen. The appearance of the inclined dimples can be attributed to the anisotropy and inhomogeneity of the material. For anisotropy, the differences in mechanical properties in different directions cause varying material deformation, developing local shear stress. Therefore, some regions on the fracture surface experience shear deformation, leading to inclined dimples. Additionally, internal deficiencies (e.g., inclusions, voids) within the material cause local stress concentration, leading to non-uniform deformation. Inclined dimples on the fracture surfaces of (a) plate specimen and (b) curved specimen.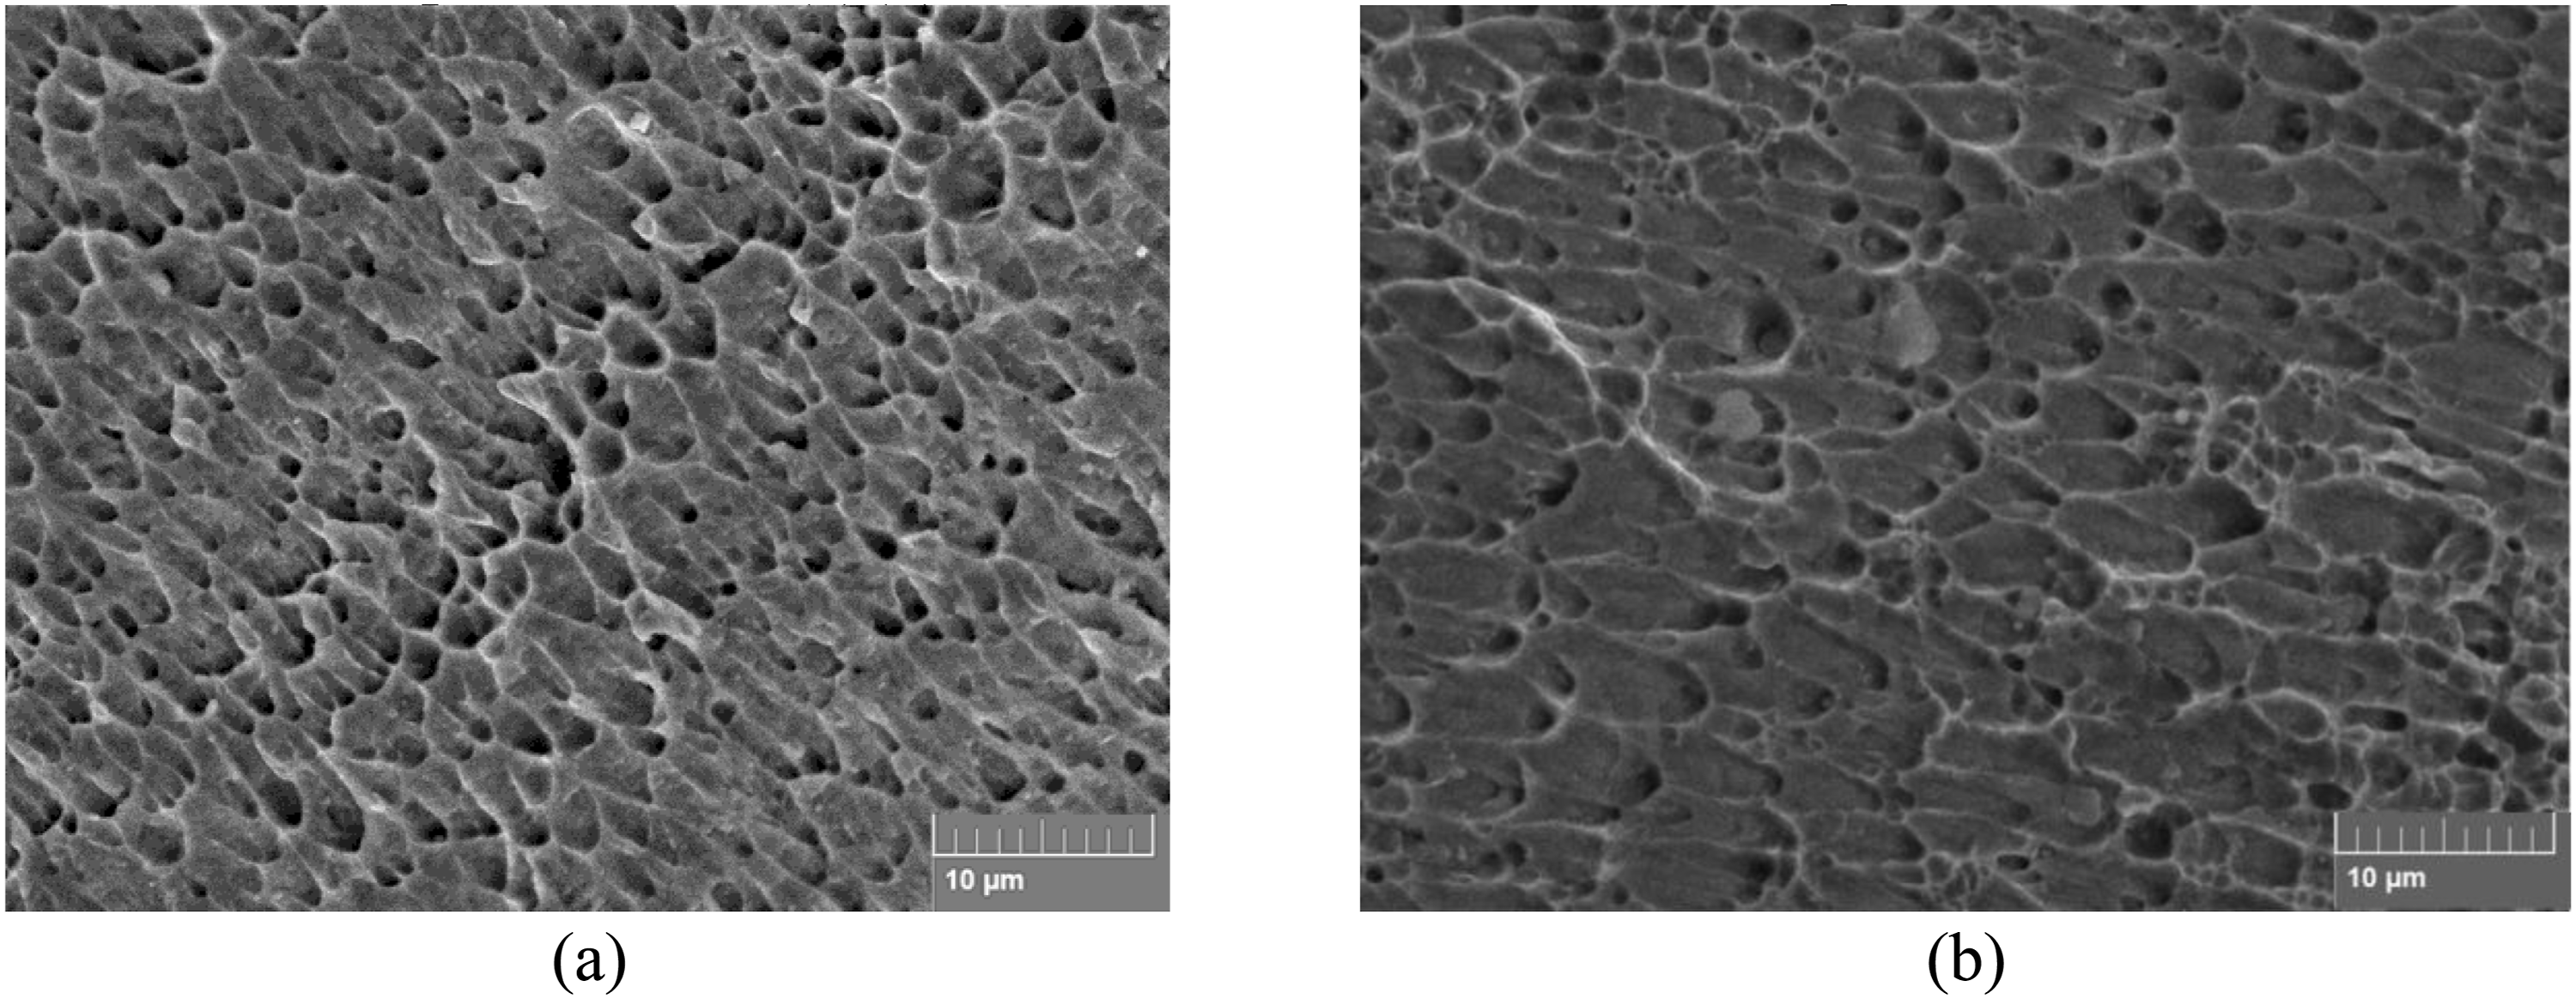
Conclusion
In this paper, experimental investigations were conducted to study the geometric properties, mechanical properties, and microstructure characteristics of WAAM S308L SS plates and circular tubes. The following conclusions can be drawn: (1) Geometric imperfections were quantified by cross-sectional properties and eccentricity. It was obvious that the 0° specimen possessed the lowest variation in cross-sectional properties, while those of 45° and 90° specimens tended to be larger due to crest and trough regions along the longitudinal direction. Compared to plate coupons, curved coupons showed notable eccentricity (≈L/80) due to thermal distortion. (2) Material anisotropy was revealed in tensile test: strength decreased from 45° to 0° to 90°, with ductility satisfying Eurocode requirements. Based on the test results, the Ramberg-Osgood model was employed to describe the full range of the stress-strain curve. The orthotropic plane stress model and Hill’s yield criterion were used to capture the anisotropic elastic part and inelastic behaviour, respectively. (3) The WAAM plate and tube exhibited an increasing trend in the Vickers hardness from the bottom to the top, which was caused by the varying thermal cycles at these positions. The higher hardness measured in the WAAM tube demonstrates the effect of curved shape on the hardness property. (4) Impact toughness of the WAAM S308L SS was less affected by extraction angle but significantly influenced by shape, with curved specimens absorbing 1.2× more energy than plates. (5) Microstructure analysis revealed elongated austenitic grains with preferred orientation, contributing to material anisotropy. The SEM analysis indicated ductile fracture.
Footnotes
Author contributions
An-Rui Liang: Methodology, Investigation, Writing – original draft. Liang Chen: Writing – original draft, review & editing. Jake L. Y. Chan: Investigation. Derek Kwok-Leung So: Resources. Siu-Lai Chan: Conceptualization. Si-Wei Liu: Funding acquisition, Supervision, Writing – review.
Funding
The authors disclosed receipt of the following financial support for the research, authorship, and/or publication of this article: The work described in this paper was partially supported by grants from a Research Grant Council of the Hong Kong Special Administrative Region through the project “Second-order direct analysis for the design of steel members with irregular cross-sections (PolyU/21E/15203121)”.
Declaration of conflicting interests
The authors declared no potential conflicts of interest with respect to the research, authorship, and/or publication of this article.