
Abstract
Ageing Metallic Railway Bridges (MRBs) are still widely in use despite being exposed to traffic loads and environmental conditions that differ significantly from their original design assumptions, often incorporating materials that are no longer in use. While these factors tend to make these structures more susceptible to degradation, they continue to deliver essential socioeconomic value as a vital element of railway networks. To ensure their safe operation and extended service life, it is critical to preserve structural integrity by effectively managing important durability risks, with fatigue being a primary concern. Achieving this requires precise characterisation of current traffic volumes and their variation over time, supported by appropriate evaluation and monitoring strategies. Rather than relying solely on normative load models, this study introduces an approach that uses a Bridge Digital Twin (BDT) demonstrator for fatigue assessment and monitoring, while incorporating real traffic data derived from Weigh-In-Motion (WIM) system and supplemented by Machine Learning (ML) techniques. A direct comparison between normative and real traffic inputs revealed significantly different fatigue outcomes which directly affect conclusions regarding fatigue-critical details and decisions that follow. The study illustrates the added value of using real traffic data instead of relying solely on standard fatigue load models in effectively characterising fatigue states of ageing MRBs. Furthermore, the BDT approach allows for a more dynamic and comprehensive fatigue assessment process, raising conventional standards of MRBs evaluation.
Keywords
Introduction
With increased mobility of people and goods, there is a growing interest in preserving and extending the lifespan of ageing transport infrastructure, which is still vital in satisfying current and future mobility demands. In particular, ageing Metallic Railway Bridges (MRBs) - most of which are still in operation - have been under constant threat of fatigue, primarily due to dynamic loads induced by passing trains (Horas et al., 2022, 2023b; Lee et al., 2017). With regard to fatigue assessment, while new metallic bridge structures benefit from design guidance and load characterisation provided by current standards, such as the Eurocodes, ageing MRBs – designed under outdated assumptions (Cremona et al., 2013), particularly regarding traffic tonnage and speed - may require a more precise evaluation based on real traffic conditions.
A widely used technology for traffic monitoring and characterisation is the Weigh-In-Motion (WIM) system (Maljaars, 2020; Zhou et al., 2021), which, among other parameters, estimates the axle loads, axle spacing, and vehicle speed by measuring the dynamic forces exerted by vehicle wheels on sensors installed in the track (Marques et al., 2016; Pimentel et al., 2021). These parameters enable the determination and understanding of real traffic conditions. In the context of continuous fatigue evaluation, particularly for estimating associated damage state and respective remaining life, the information of full real traffic characterisation, including the knowledge of the types of trains running on the rail line is of paramount importance. Such information can be derived from the aforementioned parameters obtained through WIM systems - the basis for predicting future traffic evolution or reconstruct past traffic conditions when historical data is unavailable. However, while WIM can provide these key parameters with reasonable accuracy, it does not inherently and automatically provide train types or traffic trend estimations, necessitating advanced approaches such as Machine Learning (ML) to automate these traditionally manual and time-consuming processes. For instance, Nhamage et al. (2025a) developed a real-time ML system that uses WIM data (axle spacing, axle loads, and train speed) collected over a bridge located in Setúbal District, Portugal, to automate the classification of train types and determine total tonnage per train category crossing the bridge.
Current fatigue analysis of ageing MRBs has been conducted based on two primary approaches: (i) global methods; and (ii) local methods. Global methods typically evaluate all fatigue stages (initiation and propagation of fatigue cracks), mainly using Stress-Life (S-N) curves based on nominal stresses recommended in the codes in force (Horas et al., 2023b; Lee et al., 2017). S-N curves establish the relationship between the constant amplitude stress range, S, and the number of cycles to failure, N. In this context, the Linear Damage Accumulation Method (LDAM) is the most widely used technique for fatigue life estimation (Lee et al., 2017). Local approaches, on the other hand, focus on the fatigue assessment based on local parameters to investigate either the crack initiation or crack growth. Commonly employed local methods include hot-spot stress, effective notch stress, and fracture mechanics (Horas et al., 2023b; Mecséri and Kövesdi, 2020).
Several gaps remain in how fatigue and other degradation events are monitored and managed, despite significant advances in fatigue research on ageing MRBs. Recent key developments include: the multiphase fatigue assessment proposed by Kühn (2013) and later enhanced by Horas et al. (2023a), where the authors proposed a four-phase-based fatigue assessment; the classification catalogues for riveted bridge components developed by (Taras and Greiner, 2018); and the probabilistic fatigue life update proposed by Lee et al. (2017). Additional developments by Leonetti et al. (2020) include a probabilistic model for fatigue life prediction of welded details subjected to random variable amplitude loading, and a system reliability for fatigue life prediction focused on riveted connections. Other probabilistic approaches for fatigue analysis include studies such as (Rakoczy et al., 2016, 2020). It is important to note that within the framework of S-N curve-based fatigue assessment, as adopted in this study, a probabilistic approach can be applied if translated into a nominal-stress S-N curve. Its adoption may depend on the infrastructure manager, since, according to the codes in force, the probability of failure must be associated with the curves established by the standards. To promote the use of Linear Elastic Fracture Mechanics (LEFM) in fatigue life predictions, Leander and Al-Emrani (2016) also contributed with a probabilistic sensitivity analysis addressing uncertainties related to this approach. While these contributions are essential, they are not sufficient on their own to support modern bridge infrastructure monitoring and decision-making.
One innovative approach for bridging this gap is Bridge Digital Twin (BDT), which has emerged as a transformative technology. A BDT provides a virtual replica of a real-world bridge, dynamically updated through continuous data integration, so that this virtual replica may reflect the bridge’s actual condition throughout the asset’s lifecycle, allowing for enhanced decision-making (Hoskere et al., 2025). Enabled by Bridge Information Modelling (BrIM) - bridge domain, BDTs offer great potential to meet the current demands of Structural Health Monitoring (SHM) and infrastructure management, including fatigue-related processes as demonstrated by recent studies (see, for instance, Jiang et al. (2022) and Nhamage et al. (2023)). So, while BrIM can serve as a foundation for developing BDT, the two technologies should not be conflated. Some of the differences highlighted in many studies include: (i) a BDT requires the existence of a physical bridge, whereas a BrIM model can exist independently, even before construction; (ii) a certain link (synchronisation) of virtual bridge and physical bridge is necessary in BDT, while BrIM does not inherently include such connectivity; and (iii) BDT is in budding stage, whereas BrIM is commercially established and widely adopted as a specialised extension of BIM for bridge applications (Yang et al., 2023).
Building upon the work of Nhamage et al. (2023), who developed a BDT for the Várzeas Bridge located in Portugal using normative traffic loads specified in Eurocode 1-Part 2 (EC1-2) (CEN, 2023) for fatigue state characterisation, this study introduces an extended, more complete BDT framework. The new framework incorporates real traffic data obtained through WIM system and enhanced by ML techniques for automatic train identification and traffic evolution estimation. An architecture of the proposed BDT is outlined in the next section and describes the conceptual structure and data flow among its key components. A Fatigue Analysis System (FAS) based on global fatigue methods and capable of automatically computing fatigue damage and the associated Remaining Fatigue Life (RFL) across multiple connection details, is introduced. The section also describes the approach for generating the as-is-BrIM model, structured in accordance with the latest IFC (Industry Foundation Classes) schema which includes bridges – the IFC 4.3. Open-source tools, notably Blender, IfcOpenShell, and Python, are considered within the modelling workflow to support the as-is-BrIM model development and the semantic integration of fatigue-related data. The approach further defines a dual-mode for fatigue data representation: graphically, using a colour-coded scale directly related to fatigue damage index, and semantically, using IFC property sets (IfcPropertySet) to embed FAS output parameters such as damage values, RFL, and the detail location.
The following section then presents a case study of the Várzeas Bridge. It outlines the normative traffic proposed in EC1-2 (CEN, 2023), as well as a description of real traffic data in the global BDT model. Limitations related to the availability of historical/real traffic data and site access constraints at the case study bridge are addressed. Considering these constraints, WIM data from another Portuguese bridge (Alcácer do Sal) with comparable traffic flow characteristics were adopted. Parameters derived from traffic measurement, namely, axle load, axle spacing, and train speed, were employed for feature formulation in supervised classification ML models to automatically identify train types, with output (train type, quantity of each train type set and associated load), in turn, used for estimating traffic volume evolution. The traffic estimation covers both past and future scenarios. Supervised ML techniques (specifically linear regression) are employed for past traffic estimation based on economic, social, and environmental indicators defined by the World Bank (WB) and representative of the region where the bridge is located. These indicators, derived from WB Open Data (World Bank), have been applied in different forecasting contexts that are economically, socially, and environmentally dependent, including transportation and related infrastructure (see, for instance, (Feng et al., 2024)). In this work, they are used to define the features and targets of the ML model. For future traffic, projections available in the literature are considered.
Subsequently, a section is devoted to a critical analysis, discussing the relevance of incorporating real traffic data into BDT-based fatigue assessment, as well as the broader implications of BDT adoption for modern Structural Performance Monitoring and Management (SPMM).
Methodology for fatigue state characterisation using real traffic data within a BDT framework
BDT architecture
Different approaches have been developed to address fatigue-related issues in existing MRBs. However, despite their recognised benefits, most of these approaches still rely heavily on conventional frameworks, which are becoming less feasible in light of the requirements for modern infrastructure management. Modern demands prioritise digital systems and improved handling of big data and fragmented information. For instance, in conventional approaches, large volumes of data generated from analyses or collected from field testing and inspections are often poorly managed. Integrating this data to enable digital visualisation of components with potential problems, such as fatigue damage, can improve efficiency and promote sustainable practices. This can be achieved via BDT, a technology that emerged as a promising tool for supporting a wide range of bridge assessment and management processes. Its implementation requires the integration of multiple technologies and systems, ranging from data acquisition platforms to modelling and simulation tools.
Following the core concept and requirements of a Digital Twin (DT) model, two interacting environments are considered: the Physical Environment (PE) and Virtual Environment (VE), each with its specific components. Figure 1 shows a global architecture derived from this concept. The architecture outlines the BDT model anchored in BrIM and designed to be a dynamic, data-driven model of fatigue behaviour. The proposed architecture is rooted in DT models featuring 5 dimensions - a prevalent framework in EC&O contexts (see, for instance, Jiang et al. (2021) and Osadcha et al. (2023)). Nonetheless, this study adopts a 6-dimensional structure, which consists of the following: (i) Physical Asset (PA) (the bridge to be mirrored); (ii) Physical Asset Data (PAD); (iii) Twin Database (TDB); (iv) FAS; (v) Enriched BrIM Model (EBrIMM); and (vi) Service Environment (SE). Within this structure, the first two components belong to the PE, while the remaining four constitute the VE. BDT architecture.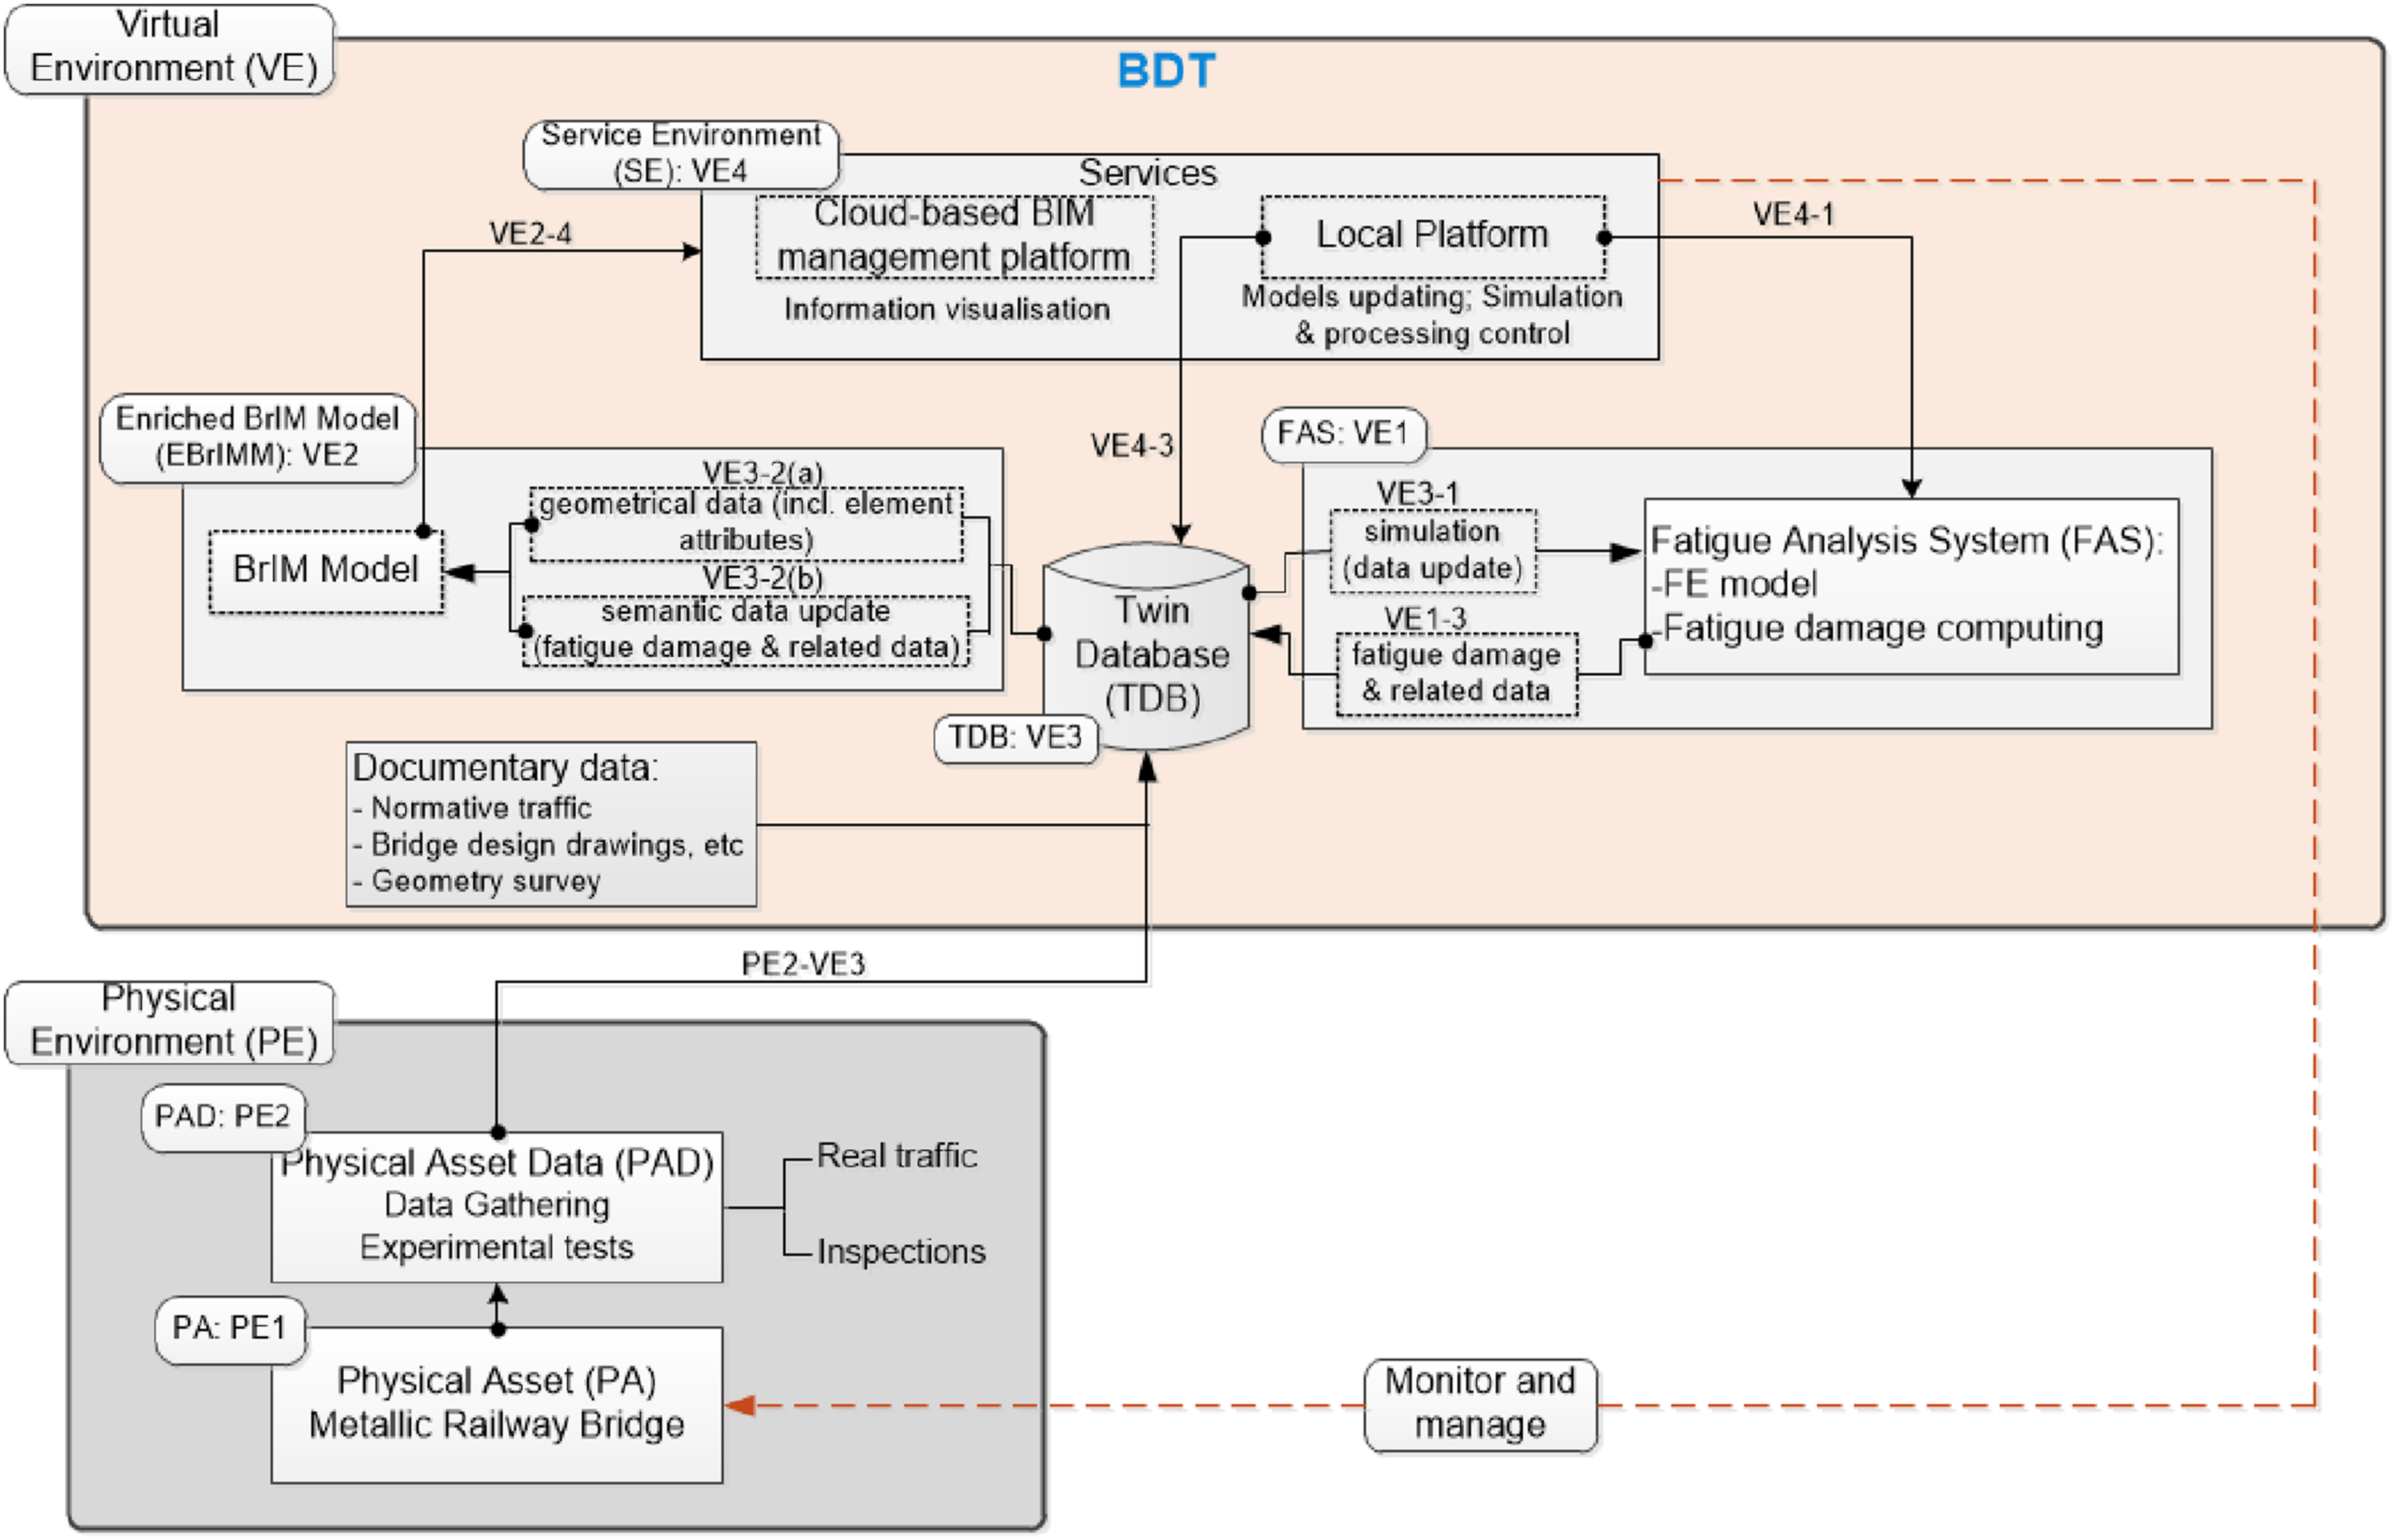
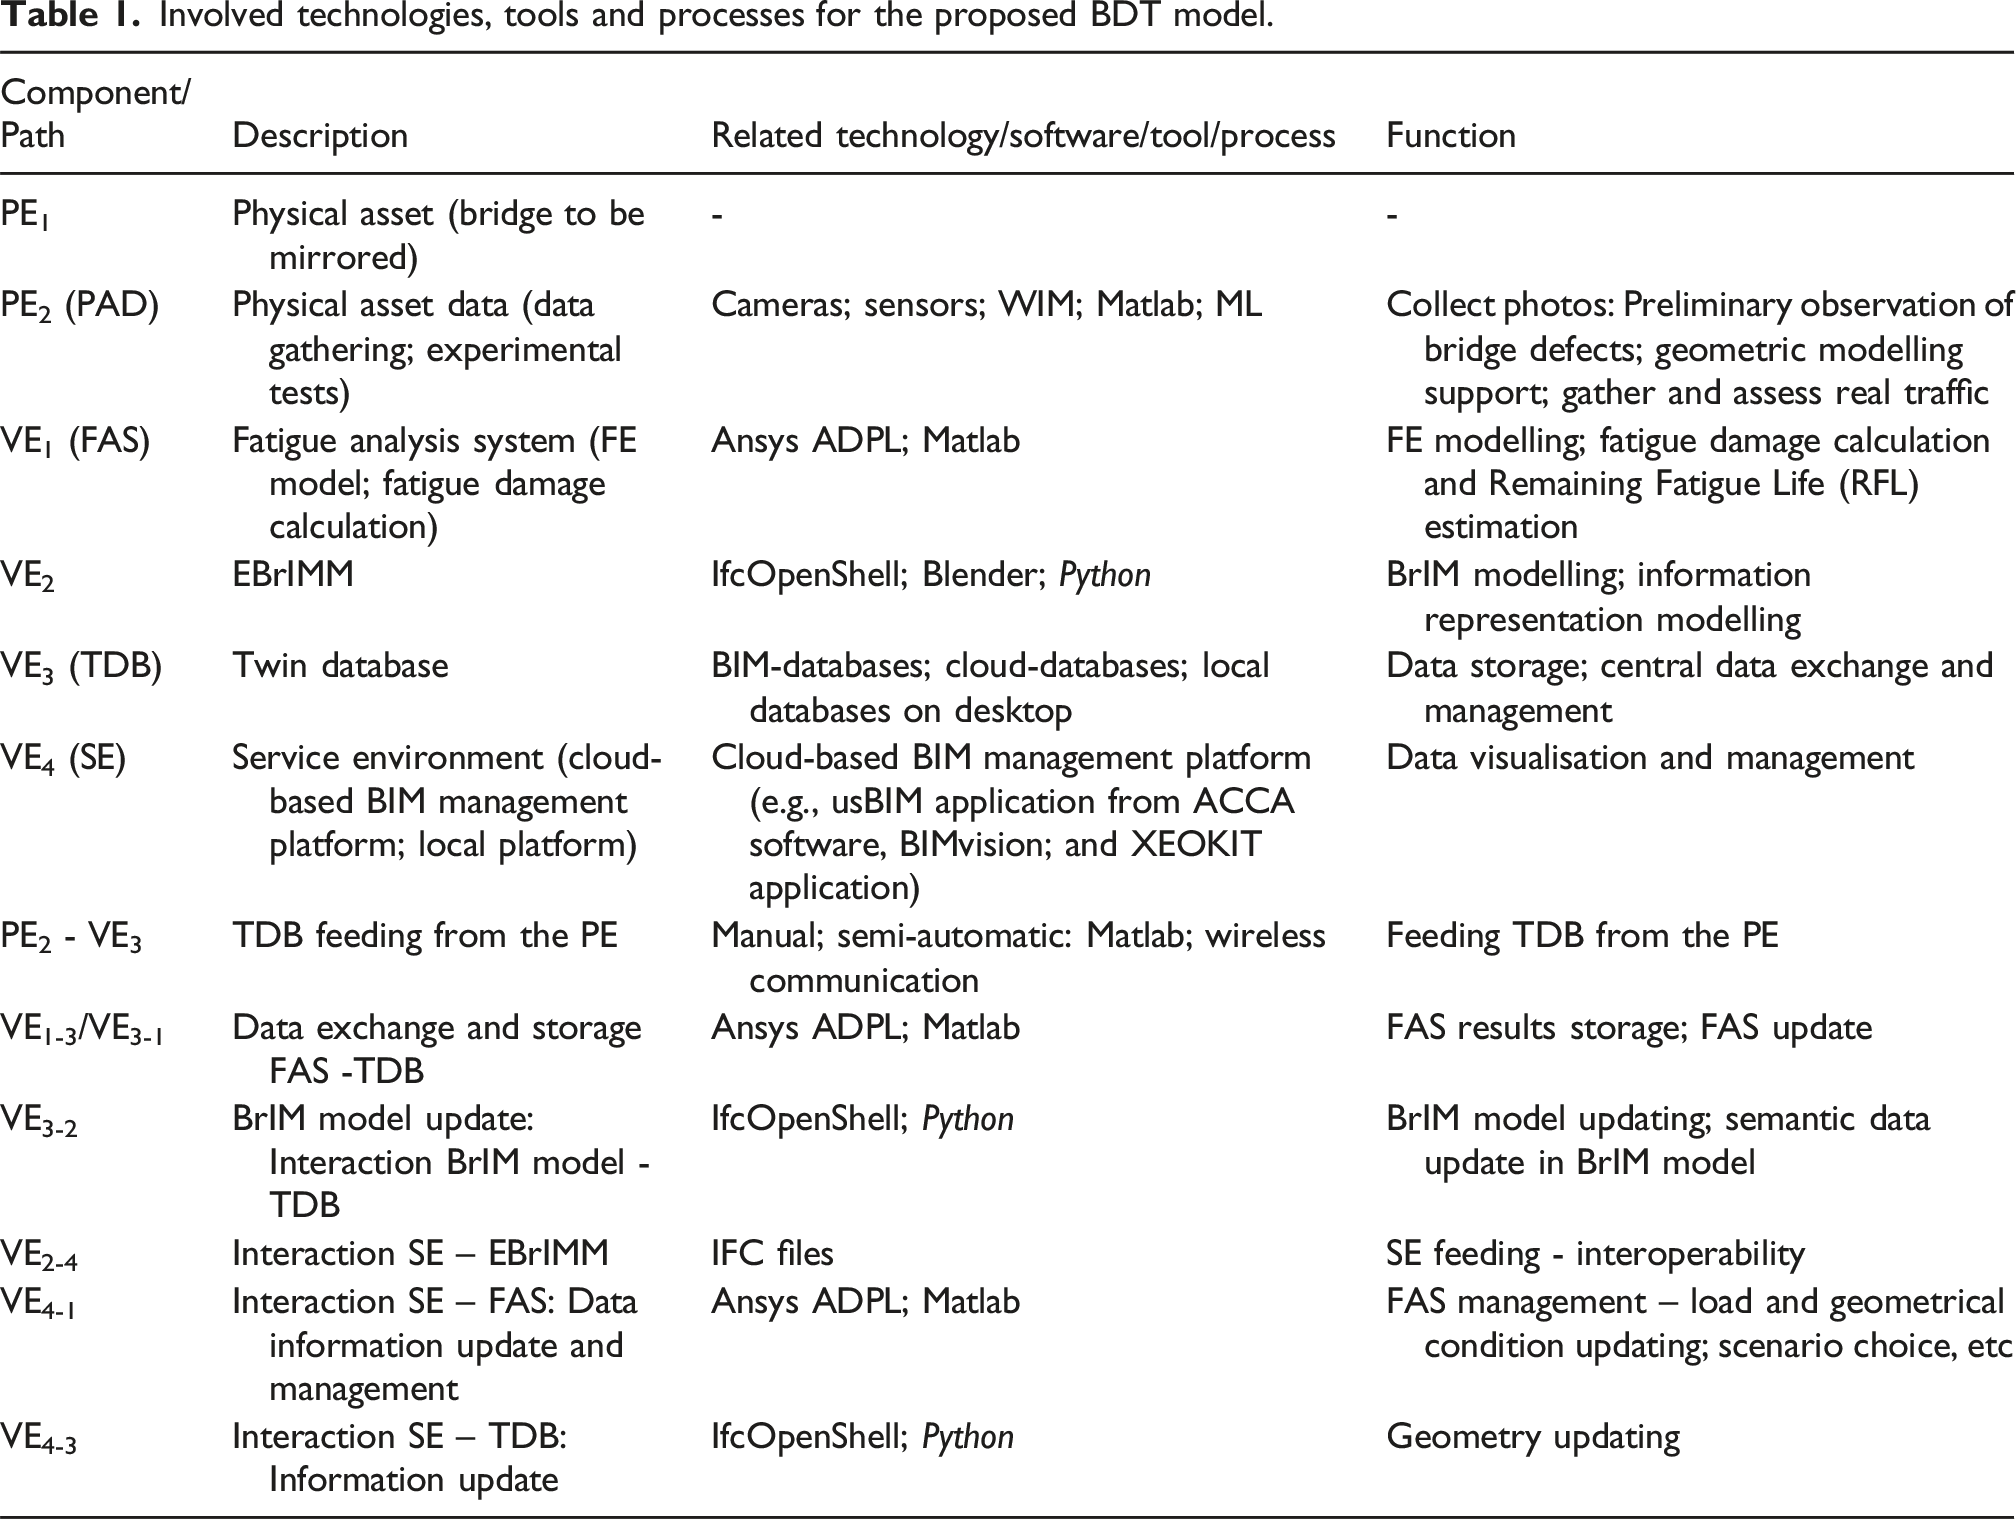
Involved technologies, tools and processes for the proposed BDT model.
As stated in the previous section, the primary inputs for fatigue assessment and monitoring in the proposed BDT model are load and geometrical conditions, both of which can be continuously updated with reflection in the virtual representation of the FAS output. Within the proposed architecture, load conditions are addressed in two forms: (i) Normative traffic included as part of the documentary data within the VE; and (ii) Real traffic acquired through field measurements in the PE. The incorporation of real traffic data contributes to establishing a more comprehensive BDT, particularly valuable in a context where such data remains scarce and fatigue studies involving BDTs are also limited.
Global method-based fatigue analysis system
Global approaches for fatigue assessment
Global fatigue evaluation methodologies using nominal stress S-N curves have been widely adopted in structural engineering for existing MRBs, owing to their practicality. These approaches, while conservative, inherently account for local load transfer mechanisms in the assumed resistance limits (S-N curves), avoiding the need for local detailed modelling (Horas et al., 2023b), which is particularly relevant given the discrepancy in scale between the global dimensions of civil structures and the localised nature of fatigue damage. The total damage can then be computed based on the loading cycles, which are highly influenced by the magnitude of the traffic scenario, and compared against the resistance at the nominal stress level, encompassing both crack initiation and propagation stages. The damage for each cycle can be accumulated using the LDAM, which serves as the core calculation approach in this study (see Figure 2). Scope for fatigue assessment.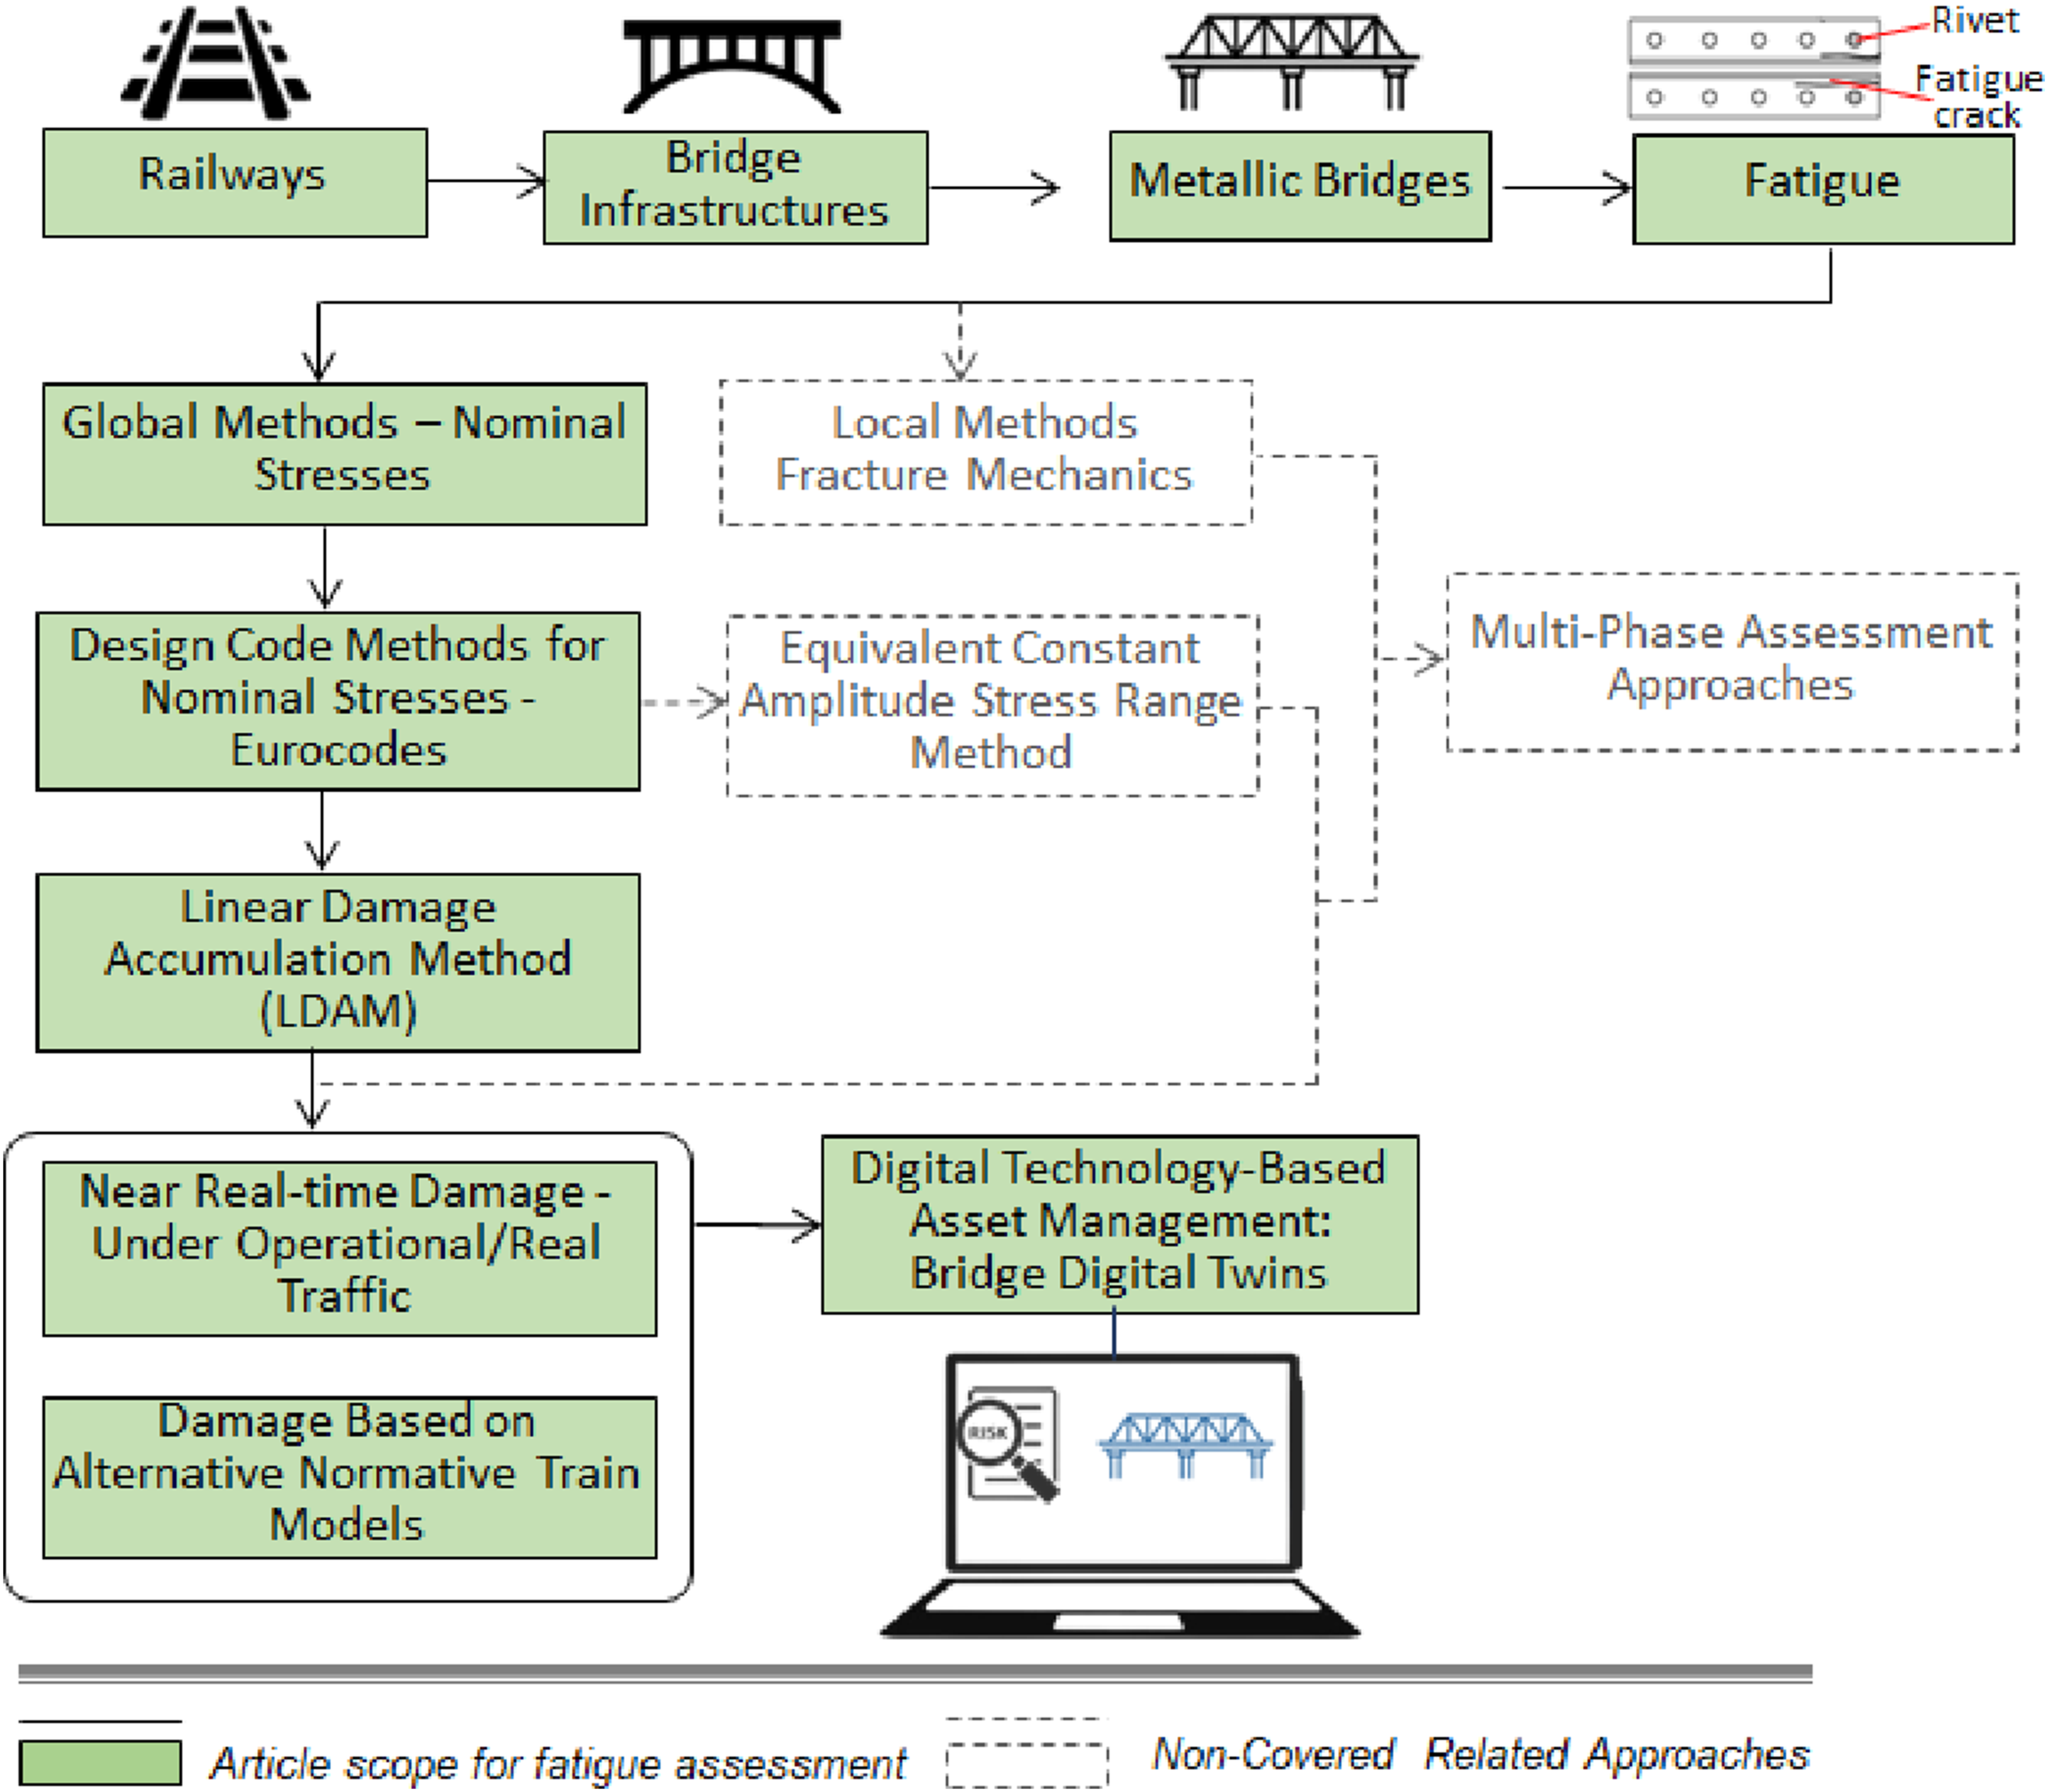
The overall framework in Figure 2 illustrates the transition from a broad railways context to a more focused estimation of fatigue damage in ageing MRBs, supporting real-time assessment under operational traffic conditions. As one of the primary methods outlined in Eurocode 3-Part 1-9 (EC3-1-9) (CEN, 2010), the LDAM supports the use of either normative or real traffic load to perform quasi-static or dynamic structural analyses. These calculations allow for the determination of nominal stress values at locations of interest. For example, in quasi-static analyses, the nominal stress values are computed as functions of load positions, 
As suggested by Kühn (2013) and Horas et al. (2023a), in the case of ageing MRBs, fatigue assessment may involve multiple levels of evaluation, one of which is a standard-level assessment aimed at identifying fatigue-critical details. This level, which typically relies on a global approach, notably the LDAM, is particularly well-suited for incorporating real-time traffic data to support continuous fatigue state characterisation. The integration of such data, when combined with BrIM-based modelling approaches, may lead to the formation of a BDT, ultimately enabling a more realistic and dynamic framework for fatigue evaluation and monitoring. In implementing LDAM, which involves determining stress spectrum related to each railway loading, three main calculation steps should be carried out as follows: (i) Stress cycle counting: application of a suitable cycle-counting algorithm (e.g., the Rainflow) to determine the relationship between nominal stress ranges, (ii) S-N curve selection: adoption of an appropriate nominal stress-based S–N curve to determine the fatigue resistance, (iii) Damage accumulation: for
Proposed fatigue analysis system
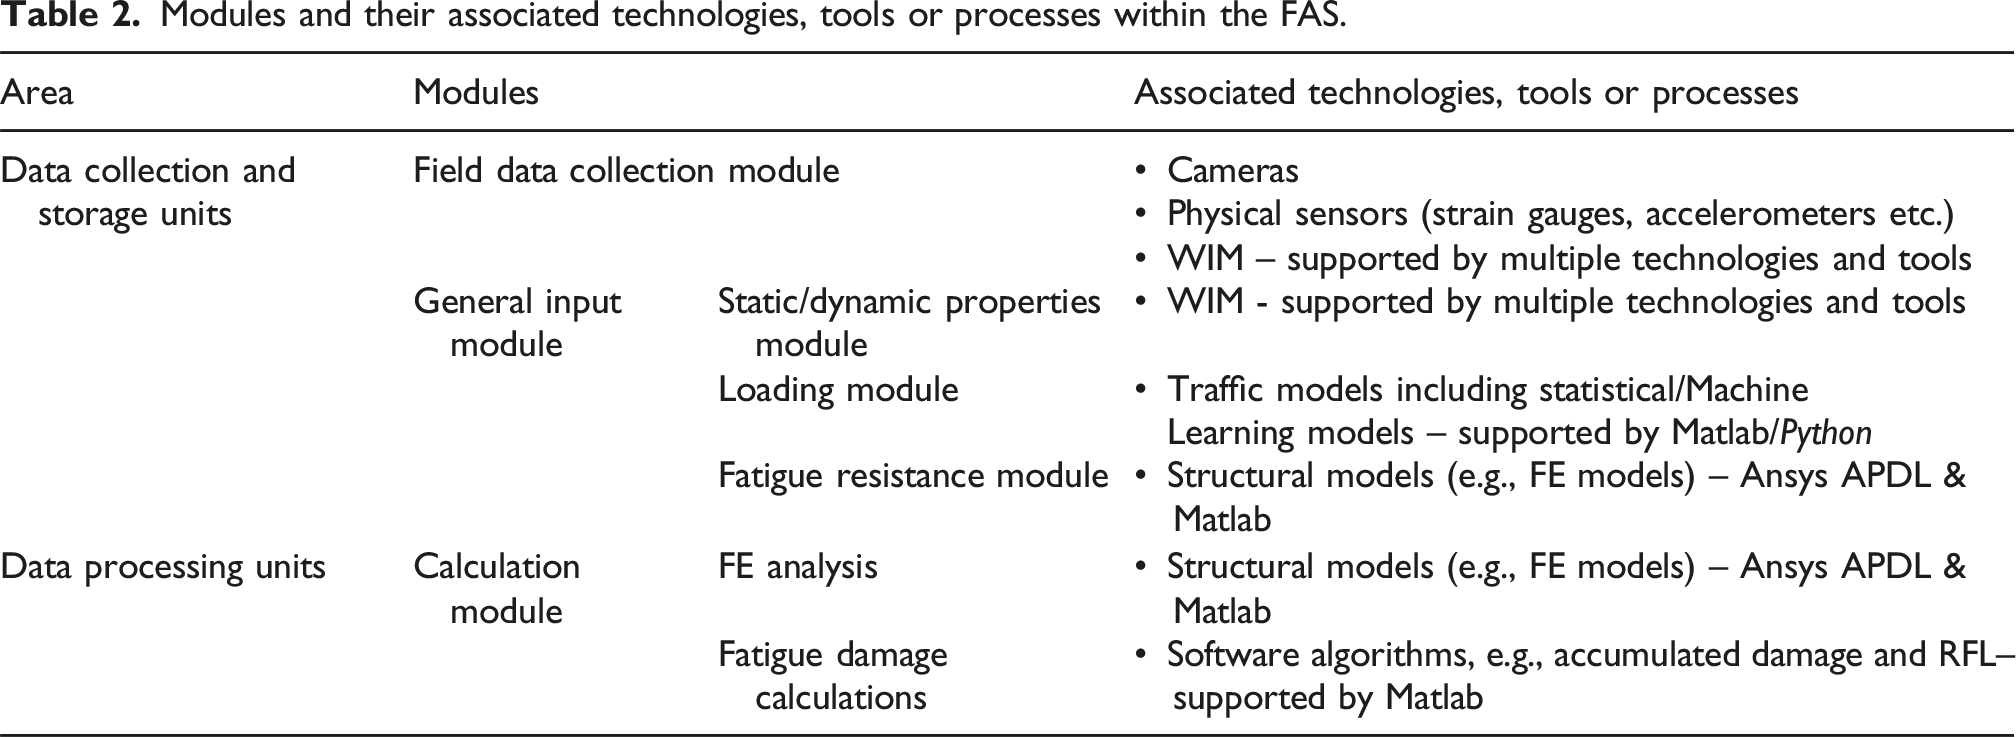
As one of the core components in the proposed BDT architecture, the FAS is based on a global method, implementing the LDAM to systematically compute damage at bridge connection details and further estimation of RFL. As outlined in Figure 3, the FAS is structured into four interconnected modules, each responsible for a specific set of operations: (i) Field Data Collection Module; (ii) General Input Module; (iii) Calculation Module; and (iv) Fatigue Consumption Module. Each module is associated with specific tools, technologies, or processes that enable its integration into the global BDT model. These are detailed in Table 2. Overview of adapted FAS for integration in global BDT model. Modules and their associated technologies, tools or processes within the FAS.
Real-time integration of weigh-in-motion data enhanced by machine learning
While normative load specifications for fatigue assessment, such as those outlined in EC1-2 (CEN, 2023) provide adequate traffic load characterisation for the design of new bridge structures, their application to existing ageing bridges tends to be excessively conservative, since both past and present traffic are generally lower in terms of tonnage and volume. This conservatism may lead to inaccuracies in fatigue assessments, making it critical to incorporate real traffic data into structural evaluations whenever it is possible (Horas, 2021). Figure 4 depicts the workflow for real-time traffic data processing, which begins with data collection using WIM system and progresses to the use of ML for train type identification and traffic volume estimation. Both tasks are addressed using supervised learning approaches. The former is formulated as a classification problem which considers features such as axle spacing, axle loading and train speeds, while the latter is treated as a regression model that incorporates features related to economic and social trends of the region where the bridge is located. Real-time traffic data is of paramount importance for achieving a truly dynamic BDT. In this context, traffic weighing aligns with several recent contributions to real-time traffic-based SHM (see, for instance, (Zhou et al., 2024; Zhou et al., 2025)). Real traffic processing workflow: data acquisition and integration.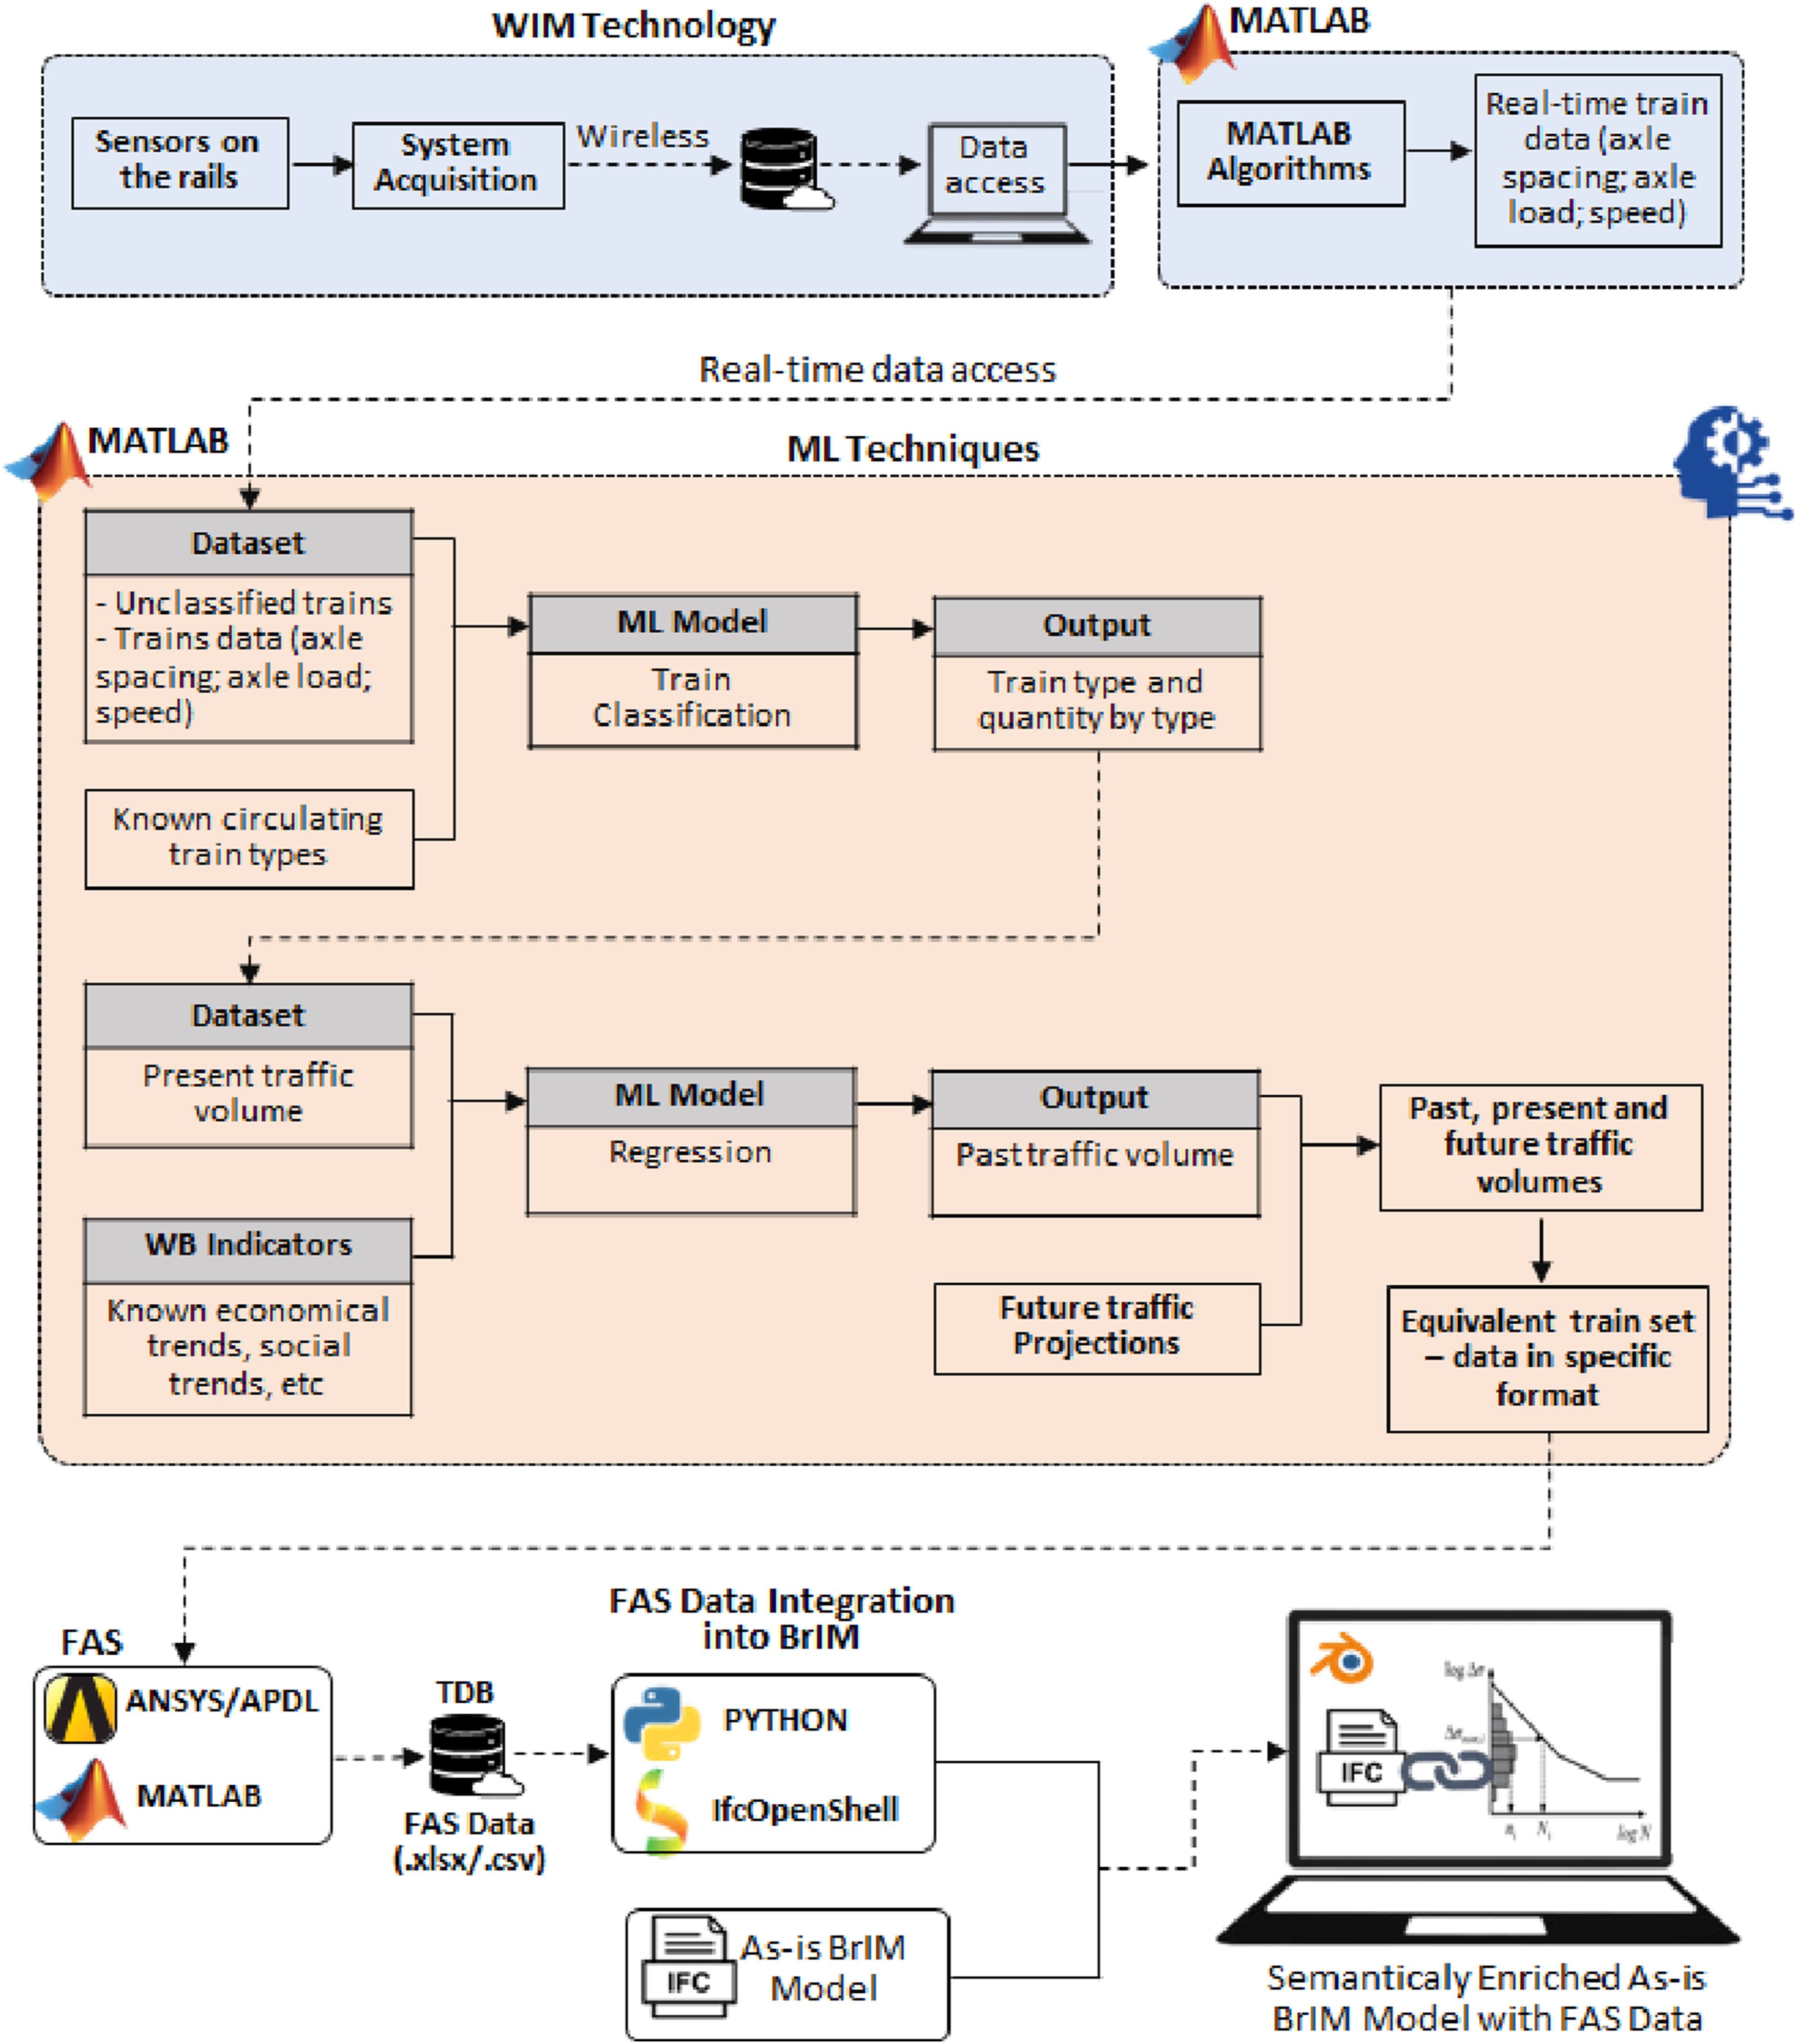
BrIM model generation and FAS-based data-driven representation
BDTs are built on two core features: (i) the 3D geometry of existing bridge assets; and (ii) dynamic data about structural performance. In BDT approach, these two parts are deeply interconnected, and integrating them requires various tools and strategies. BrIM, a specific application of Building Information Modelling (BIM) for bridges, is revolutionising bridge management by allowing structural condition monitoring data to be incorporated into the BrIM model - a process referred to as semantic enrichment. This process enables the visualisation of potential unfavourable trends in structural behaviour, providing geometrical context to monitoring data and supporting improved interpretation, analysis, and decision-making. Structural condition data may include defects identified through visual inspections, as well as deformations, cracks, and damages detected via simulation tools.
Since both the BrIM model and FAS are essential parts of the final integrated model, an ideal approach is to link the relevant components of the FAS to those of the BrIM model. This link is not based on the objects themselves but rather on the IDs assigned to those objects. This means that an object or component in FAS may share the same ID, or at least a corresponding ID, as its counterpart in the BrIM model, enabling data connection. In addition to IDs, other BIM/BrIM features, such as IfcPropertySet, may play a relevant role in achieving this link. As a user-defined IFC feature, specific attributes may be defined through IfcPropertySet for data allocation while keeping the interoperability of the BrIM model.
Effectively, to achieve a BDT using BrIM and FAS, a BrIM model for a given existing bridge (as-is-BrIM model) must be generated and enriched with semantic fatigue data derived from FAS. This includes associating fatigue damage with traffic variability and other scenarios, and ensuring its representation within the as-is-BrIM model. While the term “BrIM model” refers to a digital model of a bridge that can be created from the design phase to construction and completion (i.e., not necessarily existing bridge asset), the “as-is-BrIM model” refers to a digital representation (in accordance with existing BIM standards) of an existing bridge created using various reconstruction methodologies (see, for instance, (Nhamage et al., 2025b)). The term “as-is-BrIM model” has been increasingly adopted in recent studies (Mohamed et al., 2023; Nhamage et al., 2025b). This work proposes exploring open-source tools - Blender, IfcOpenShell, and Python for parametric BrIM modelling and semantic enrichment. As part of the semantic enrichment of the as-is-BrIM model, representing fatigue damage states and associated information may involve both graphical and non-graphical data representation. Graphical data representation allows for a visual understanding of the severity of fatigue damage, and it is proposed here to use a colour scale - a widely accepted approach in SPMM and smart bridges applications - to effectively represent damage or other aspects related to structural management. However, most current representations of structural anomalies in literature are often static (e.g., green for low severity, orange for medium, and red for high) and lack gradual transitions between severity levels (see, for instance, (Mohamed et al., 2023)). This work proposes a more dynamic and automated representation of damage intensity, which requires advanced algorithmic manipulation. The proposed workflows for parametric as-is-BrIM model generation and semantic FAS data integration are depicted in Figures 5a and 5(b), respectively. As-is-BrIM model generation and semantic enrichment with FAS data: (a) Global workflow for parametric-based BrIM model generation; and (b) Schematic representation of semantic FAS data integration in as-is-BrIM model by using the IfcPropertyset approach.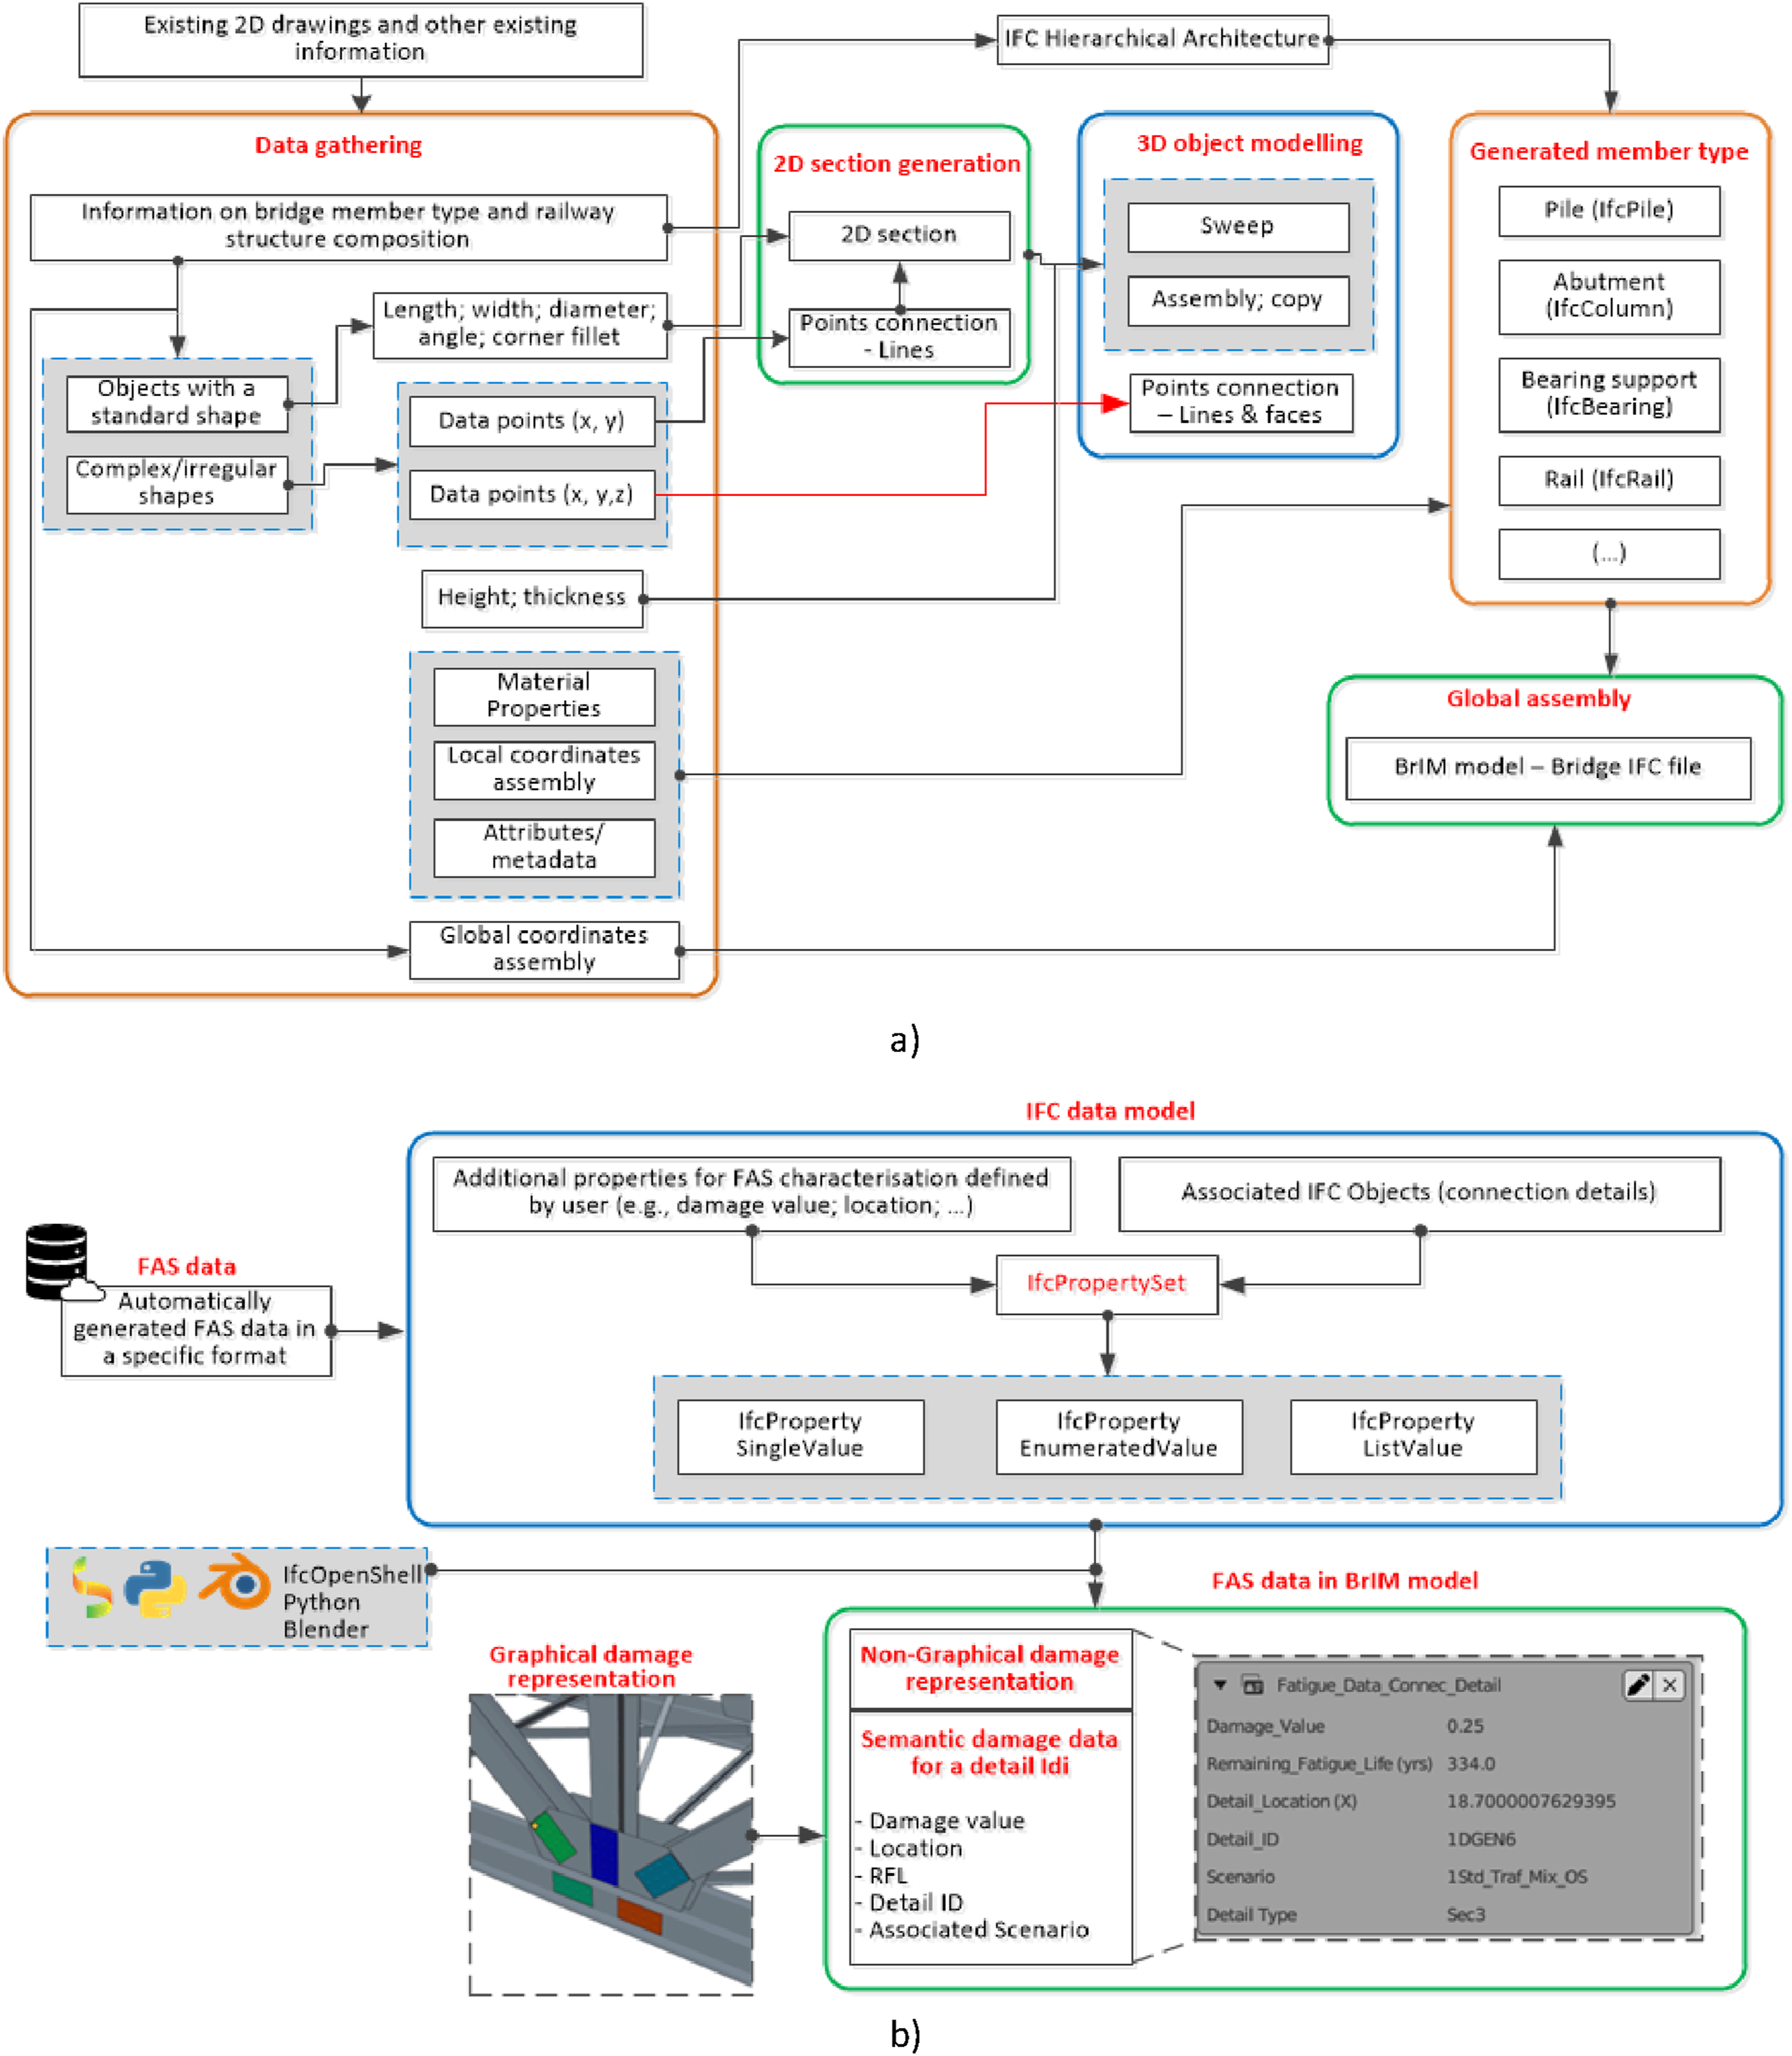
Summary of innovative aspects
The proposed methodology provides a comprehensive and dynamic approach to fatigue assessment of ageing MRBs, combining a FAS based on global methods under both normative and real traffic conditions with BrIM modelling and semantic enrichment approaches, all integrated into a BDT framework. As a response to modern demands for bridge asset monitoring and management, this BDT-oriented methodology introduces several notable innovations.
First, from a loading perspective, the methodology shifts from relying solely on normative load models to dynamically integrating real traffic data obtained through WIM systems and supplemented by ML techniques for automated train identification and traffic evolution estimation. Second, in terms of modelling, the methodology adopts an openBIM approach, using open-source tools to support parametric generation of an as-is-BrIM model and automated semantic enrichment. By adhering to the most recent IFC schema (IFC 4.3), which includes bridge structures, the approach promotes interoperability and facilitation of data exchange across BIM platforms. Third, the approach introduces a dual representation of fatigue state: graphical, by employing dynamic colour-coding that gradually changes to reflect the extent of fatigue damage; and non-graphical, by embedding structured metadata such as damage values, RFL, and location. The practical relevance of these methodological advances is explored in next section, where a case study demonstrates the full application of the approach.
Case study - the Várzeas Bridge
Bridge structure description
The Várzeas Bridge, shown in Figure 6, is located in Aveiro district, Portugal, along the Beira Alta international railway line, linking Portugal to Spain. Built in 1958, it replaced an older metallic bridge constructed in 1882. Except for one stone column and the abutment, the bridge is constructed entirely of steel and features riveted connections. It has five continuous spans of 50.5 + 60× 3 + 50.5 m, with a total of 281 m in length. General overview of the Várzeas Bridge (Horas, 2021): (a) Global perspective; and (b) Side elevation (dimensions in metres).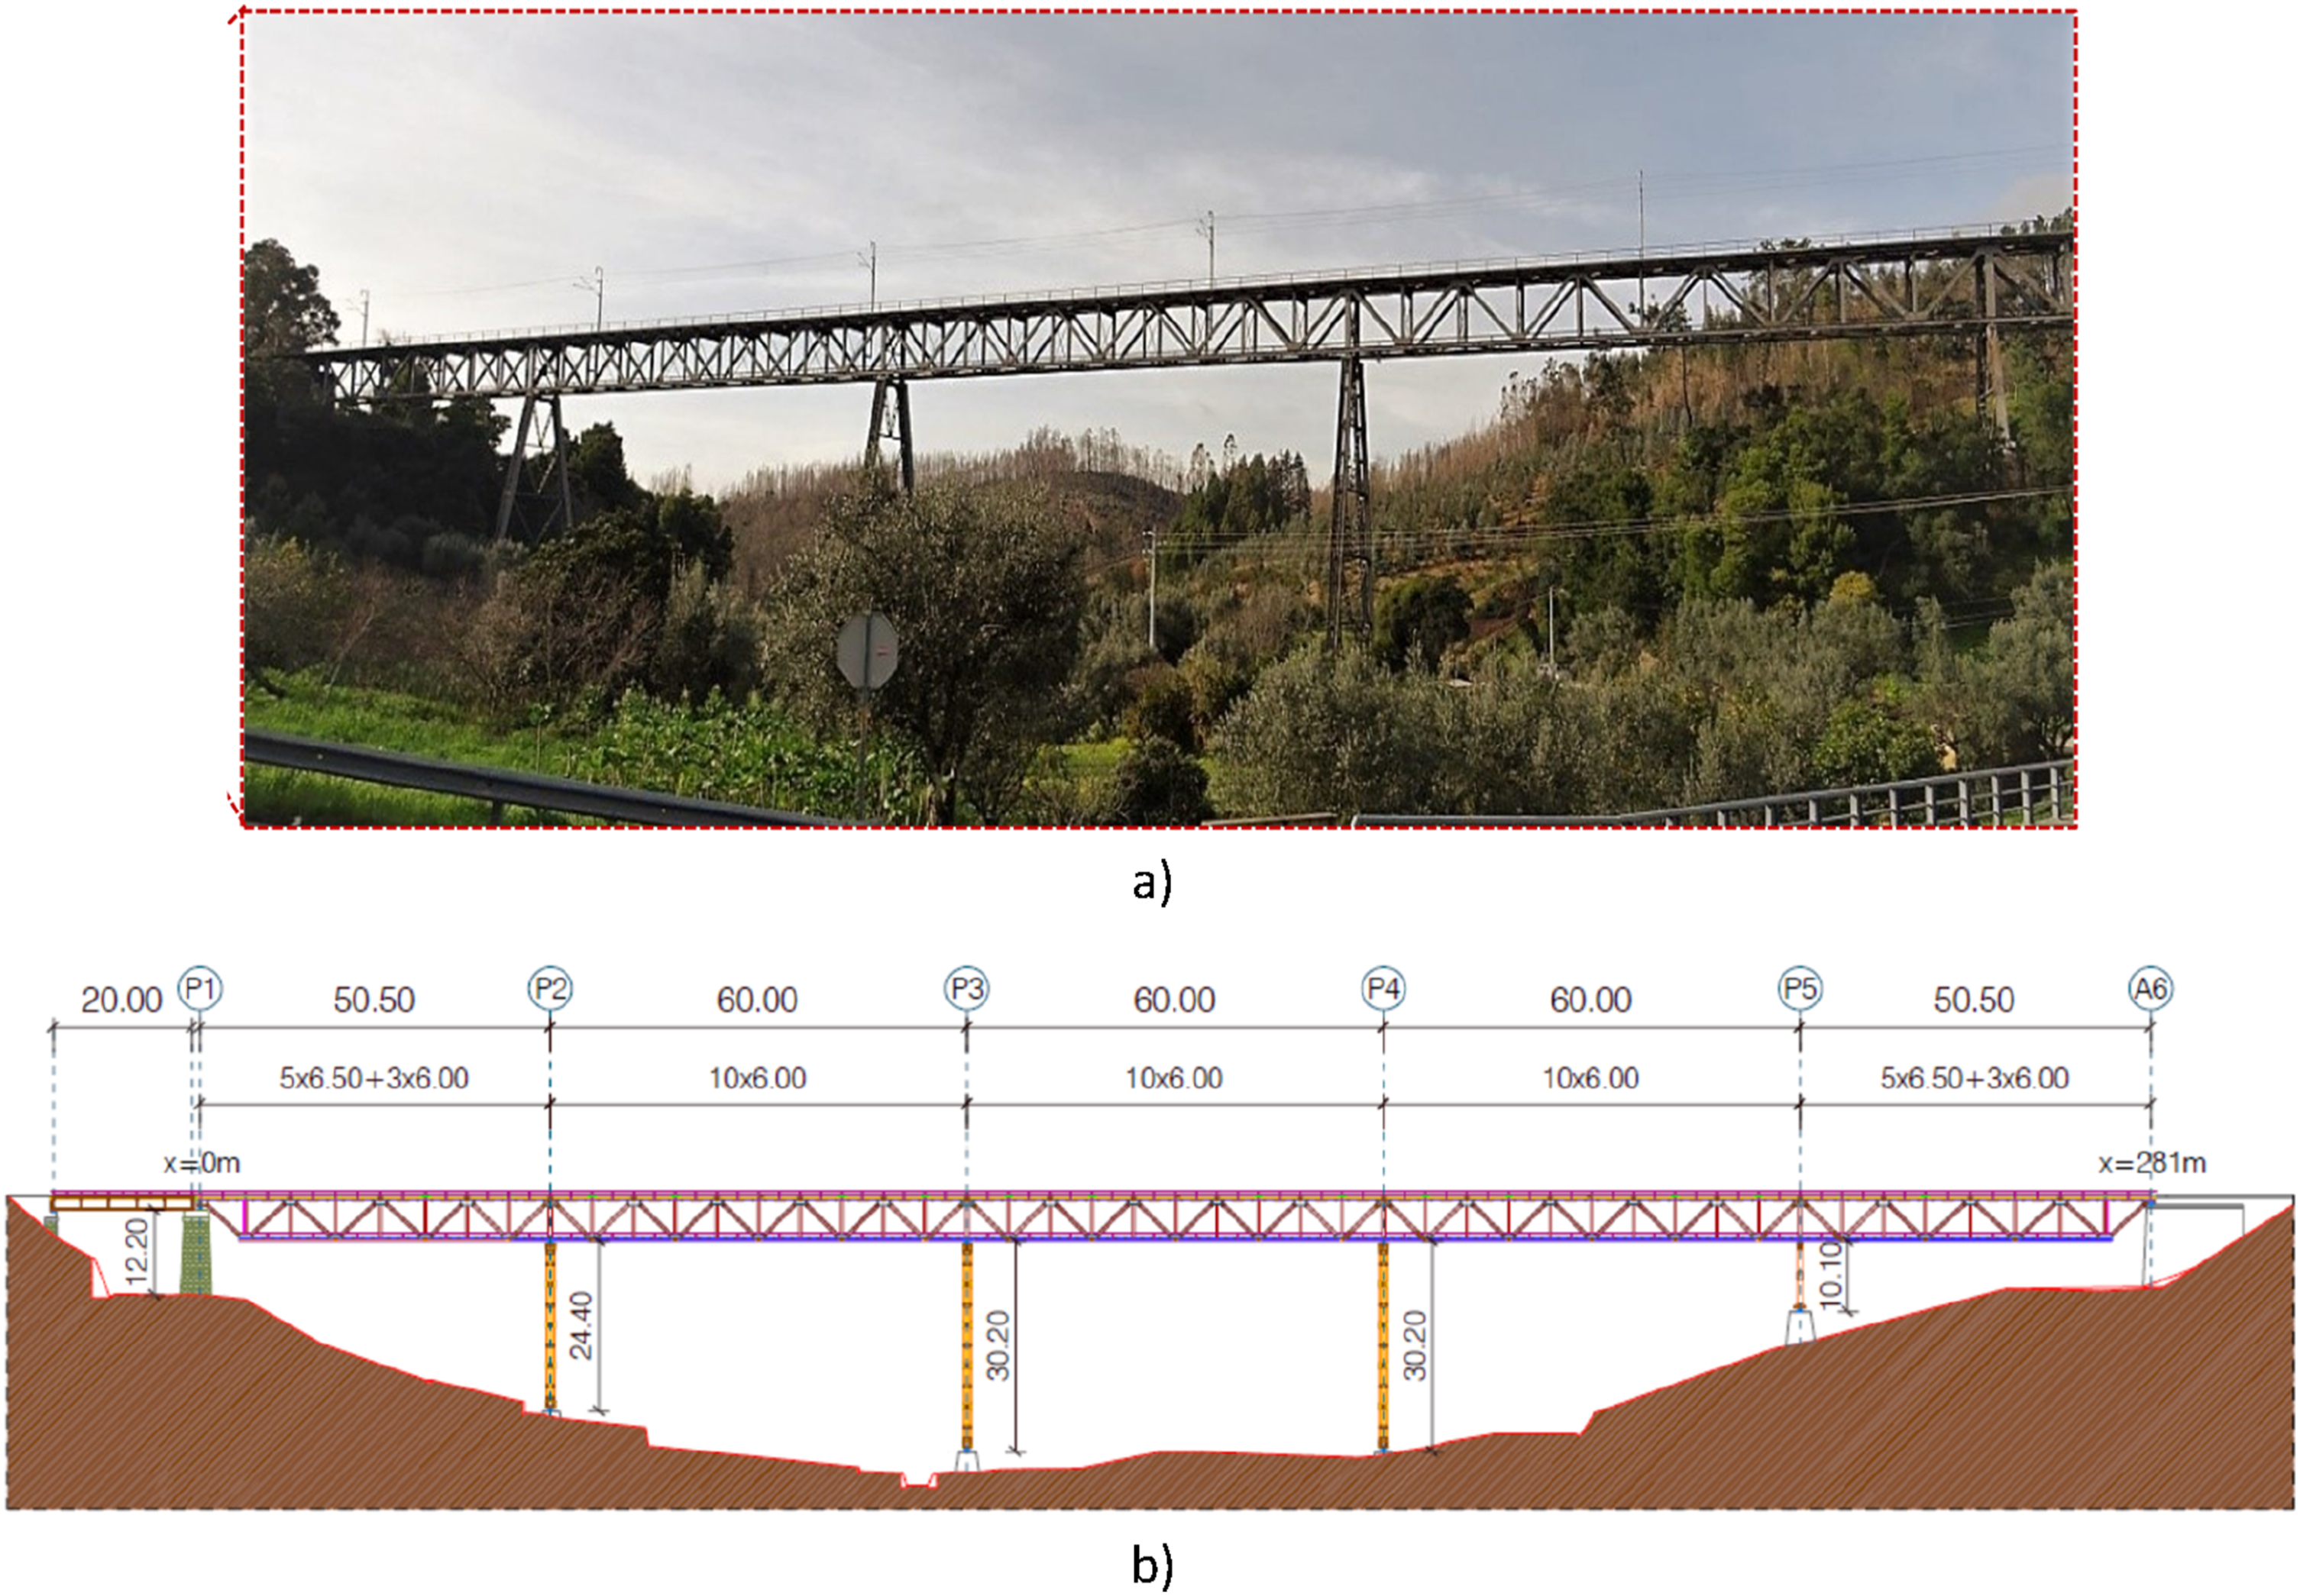
The bridge is supported by four trapezoidal-shaped steel truss columns, with heights varying from 10.10 m to 30.20 m, as well as a 12.20 m tall stone column. The continuous deck consists of two inverted warren trusses, 5.95 m in height and 4.40 m in width. Further details on the structural composition can be found in Horas et al. (2022).
Traffic for fatigue assessment
Normative traffic
Under the LDAM, EC1-2 (CEN, 2023) specifies a set of 12 trains (referred to as “fatigue trains”) grouped into three scenarios: (i) standard traffic mix; (ii) heavy traffic mix; and (iii) light traffic mix. Each mix is based on an annual traffic volume of 25 million tonnes per track. The characteristics of these traffic sets may be found in ANNEX D of EC1-2 (CEN, 2023) with the standard traffic mix being applied in this case study for comparison purposes.
Subsection 8.9 of EC1-2 (CEN, 2023) also refers to the possibility of using “special rail traffic mix” specified by the relevant authority, which may include real measured traffic. For ageing MRBs, incorporating real traffic data is particularly valuable, as it enables more realistic fatigue characterisation and can help maximise the RFL of these vital assets, ensuring their continued safe use. The process employed for real traffic determination and integration is outlined in the next subsection.
Real traffic
In line with the current trend of applying DT technology to railway infrastructures - notably bridges (the BDTs) – in addition to the normative traffic specified in EC1-2 (CEN, 2023) and other applicable standards, real traffic data obtained through WIM system and processed using ML was considered for the Várzeas Bridge case study. This integration aims to better represent fatigue evolution in a digital environment, as real traffic data is a critical input for assessing fatigue and making optimised decisions regarding the need for advanced analyses or interventions. The importance of real traffic data lies in its sensitivity to the condition of ageing MRBs, where structural deterioration phenomena, particularly fatigue, are a major concern. Accurate information on service railway loads is critical for evaluating structural integrity and preventing unnecessary reinforcements or bridge replacement.
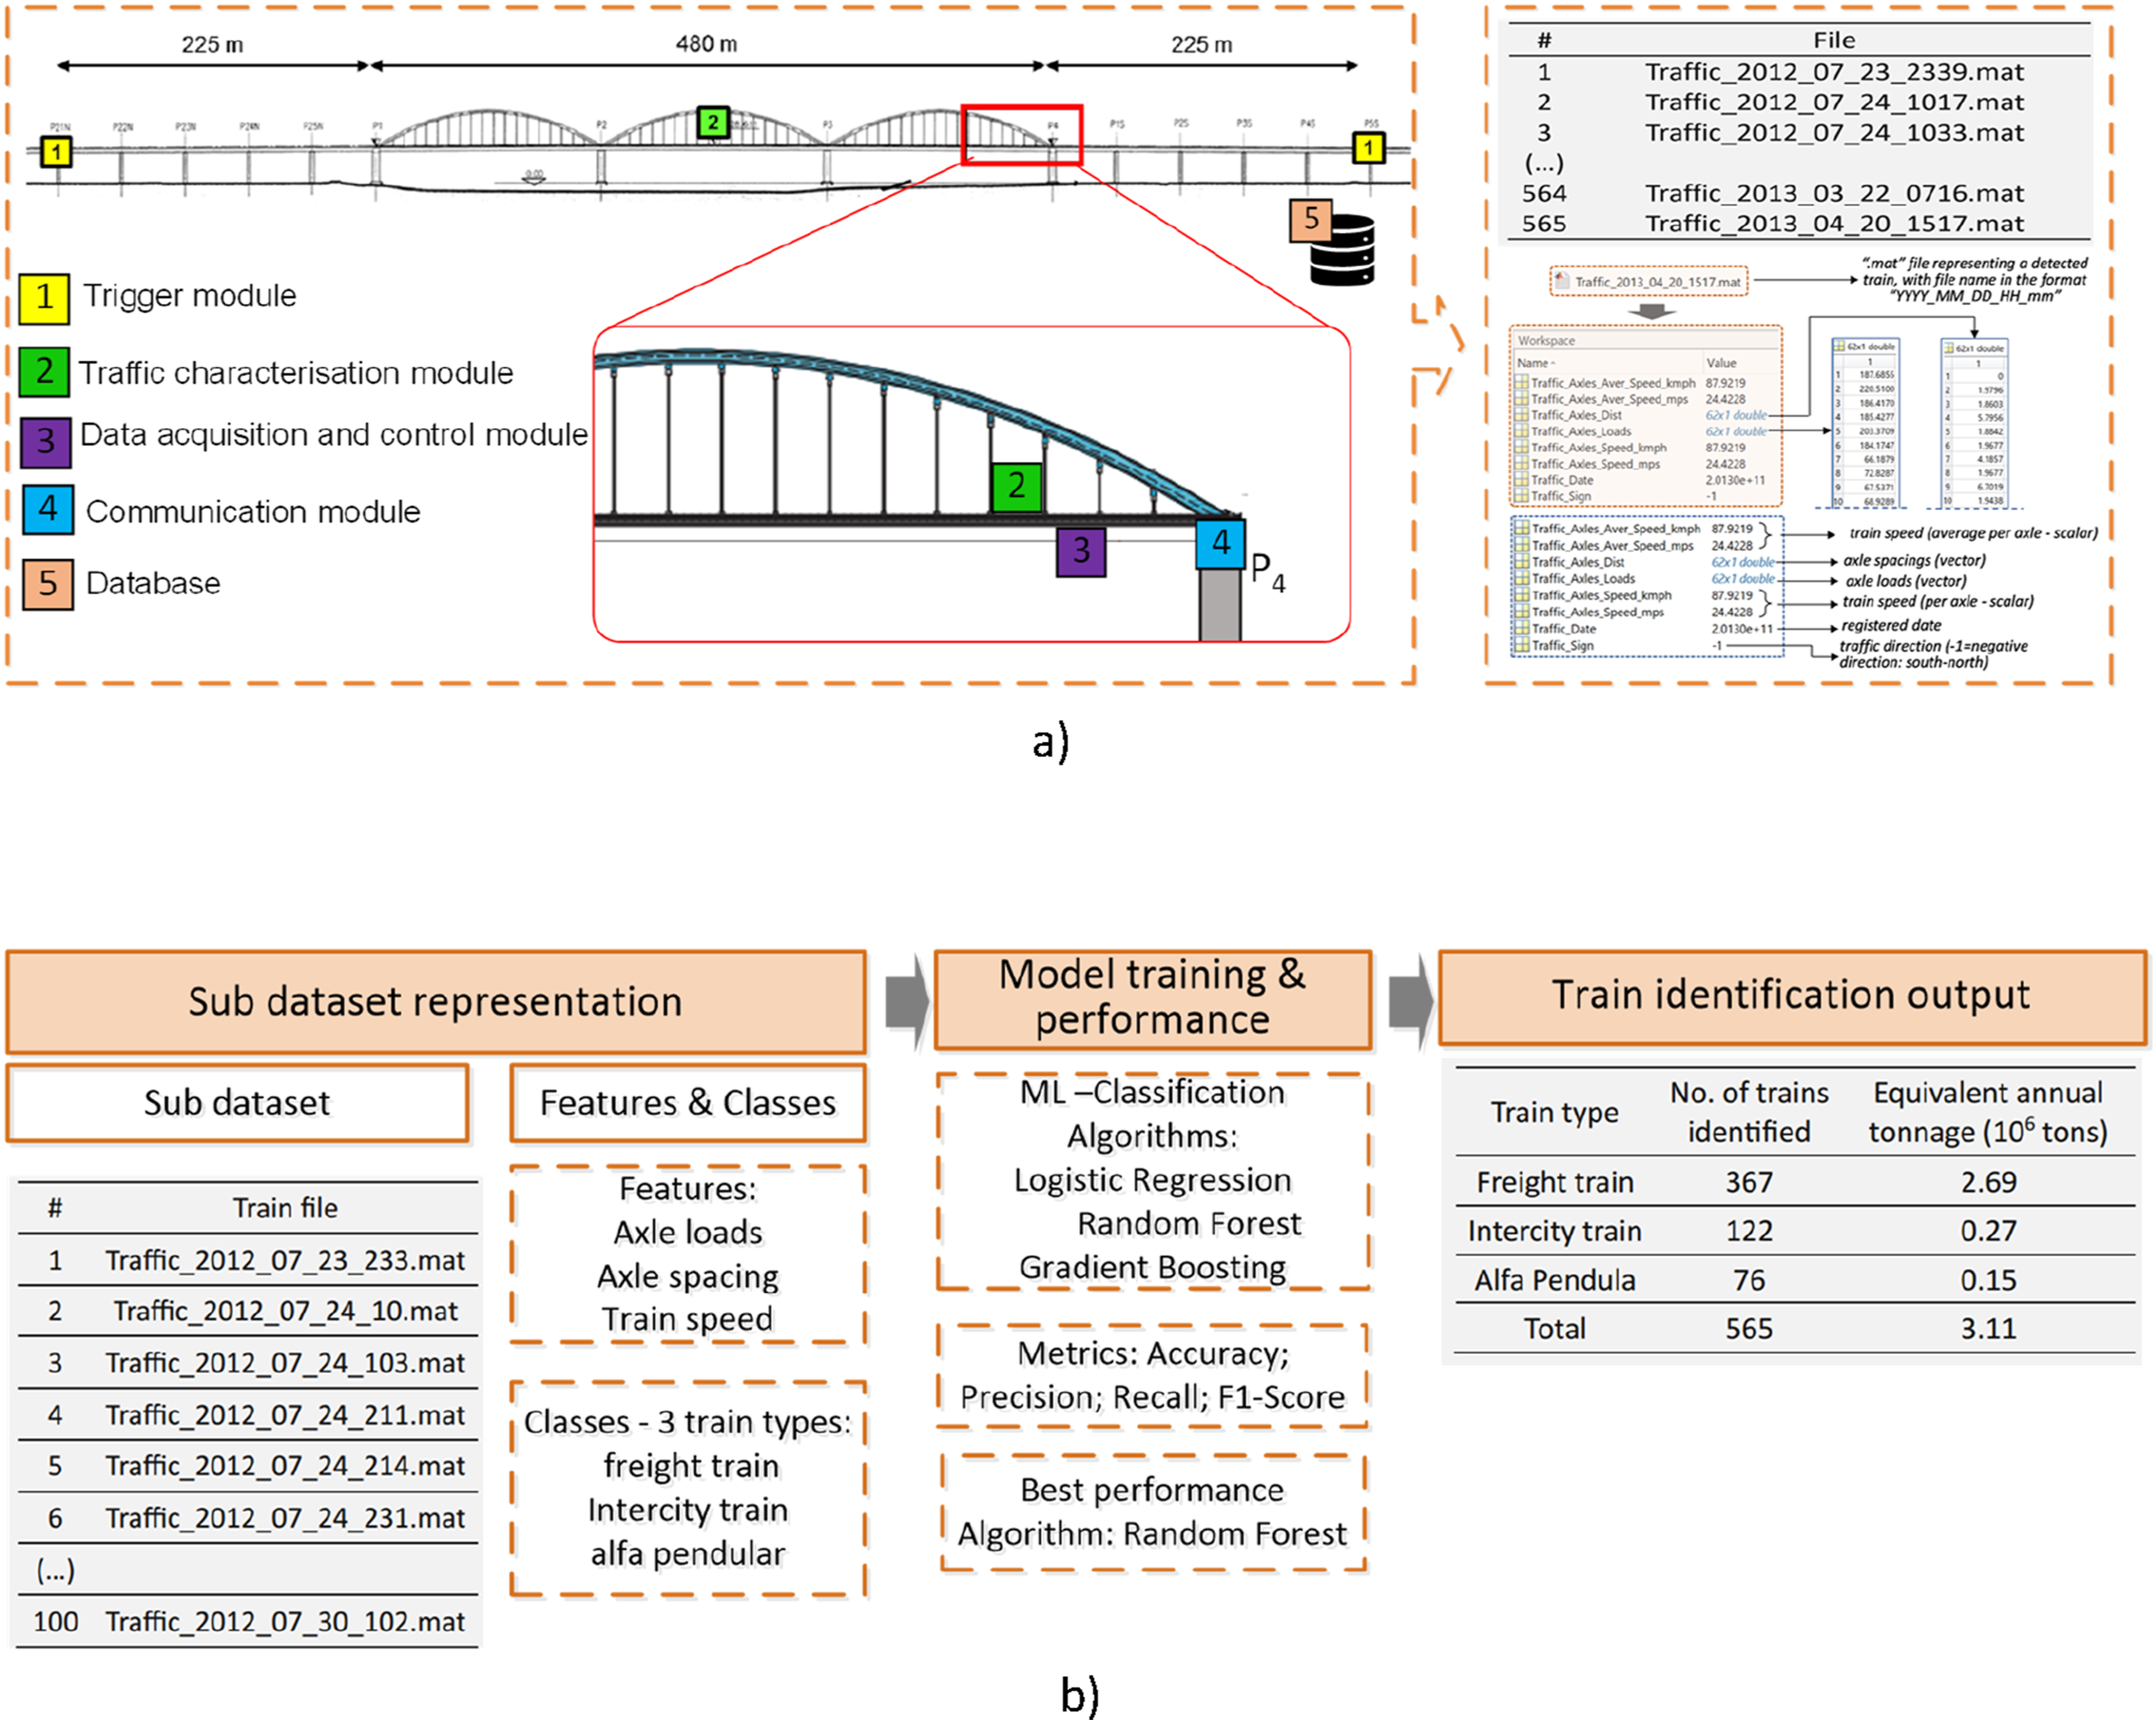
Real traffic is integrated based on real-time traffic measurements derived from a WIM system and enhanced by ML approaches for automated train type identification and traffic evolution estimation. While direct traffic measurement on the Várzeas Bridge was not feasible due to operational constraints, WIM data from the Alcácer do Sal Bridge, also located in Portugal and carrying traffic with comparable flow levels and train configurations was considered fully representative. This demonstrates how relevant traffic data from nearby or rail lines carrying equivalent traffic can effectively fill data gaps, which is particularly valuable given that historical or long-term real traffic records are still rare. By adopting this representative dataset, the study illustrates a practical and transferable solution to enhance fatigue characterisation where direct monitoring campaigns may be limited or operationally challenging. A detailed description of the dataset can be found in Nhamage et al. (2025a), with this information being a suitable reference given the comparable train flow and load levels between the two bridge locations. In that study, the WIM system, supported by Matlab routines, captures real-time data about passing trains, including axle loads, axle spacings, and train speeds. ML techniques, also implemented in Matlab, use these parameters to automatically identify train types. The overall process is depicted in Figure 7, and follows the steps below: (i) Traffic data collection (Figure 7(a)) – a WIM system was used to collect real-time traffic data on the Alcácer do Sal Bridge over a period of 2 months (intermittently between 2012 and 2013), capturing 565 trains and representing the equivalent of 3.11 million tonnes per year. Key parameters from collected data included axle loads, axle spacings, and train speeds; (ii) Automatic train identification (Figure 7(b)) – a supervised ML approach (Random Forest) was used to classify trains into three types based on eight features (i.e., train speed, sum of train axle spacings, and the first six train axle loads), considering the circulating trains on the line. The targets (classes) are these circulating trains, which fall into three categories: Alfa Pendular (high-speed train), Intercity Train, and Freight Train. After establishing the features and targets (dataset representation), as shown in Figure 7(b), the process involves model training and evaluation, with performance expressed in terms of accuracy, precision, recall, and F1-score metrics. The output is train identification (number of trains by type and annual tonnage per train type). Further details on the process can be found in a previous data-focused study by Nhamage et al. (2025a); (iii) Tonnage estimation per train type set: based on the train identification output, the annual tonnage was distributed per train types, as follows: • Freight trains: 2.69 Mt/year; • Intercity trains: 0.27 Mt/year; • Alfa Pendular: 0.15 Mt/year. Real traffic collection and processing: (a) WIM system-based traffic collection; (b) ML-based train identification.
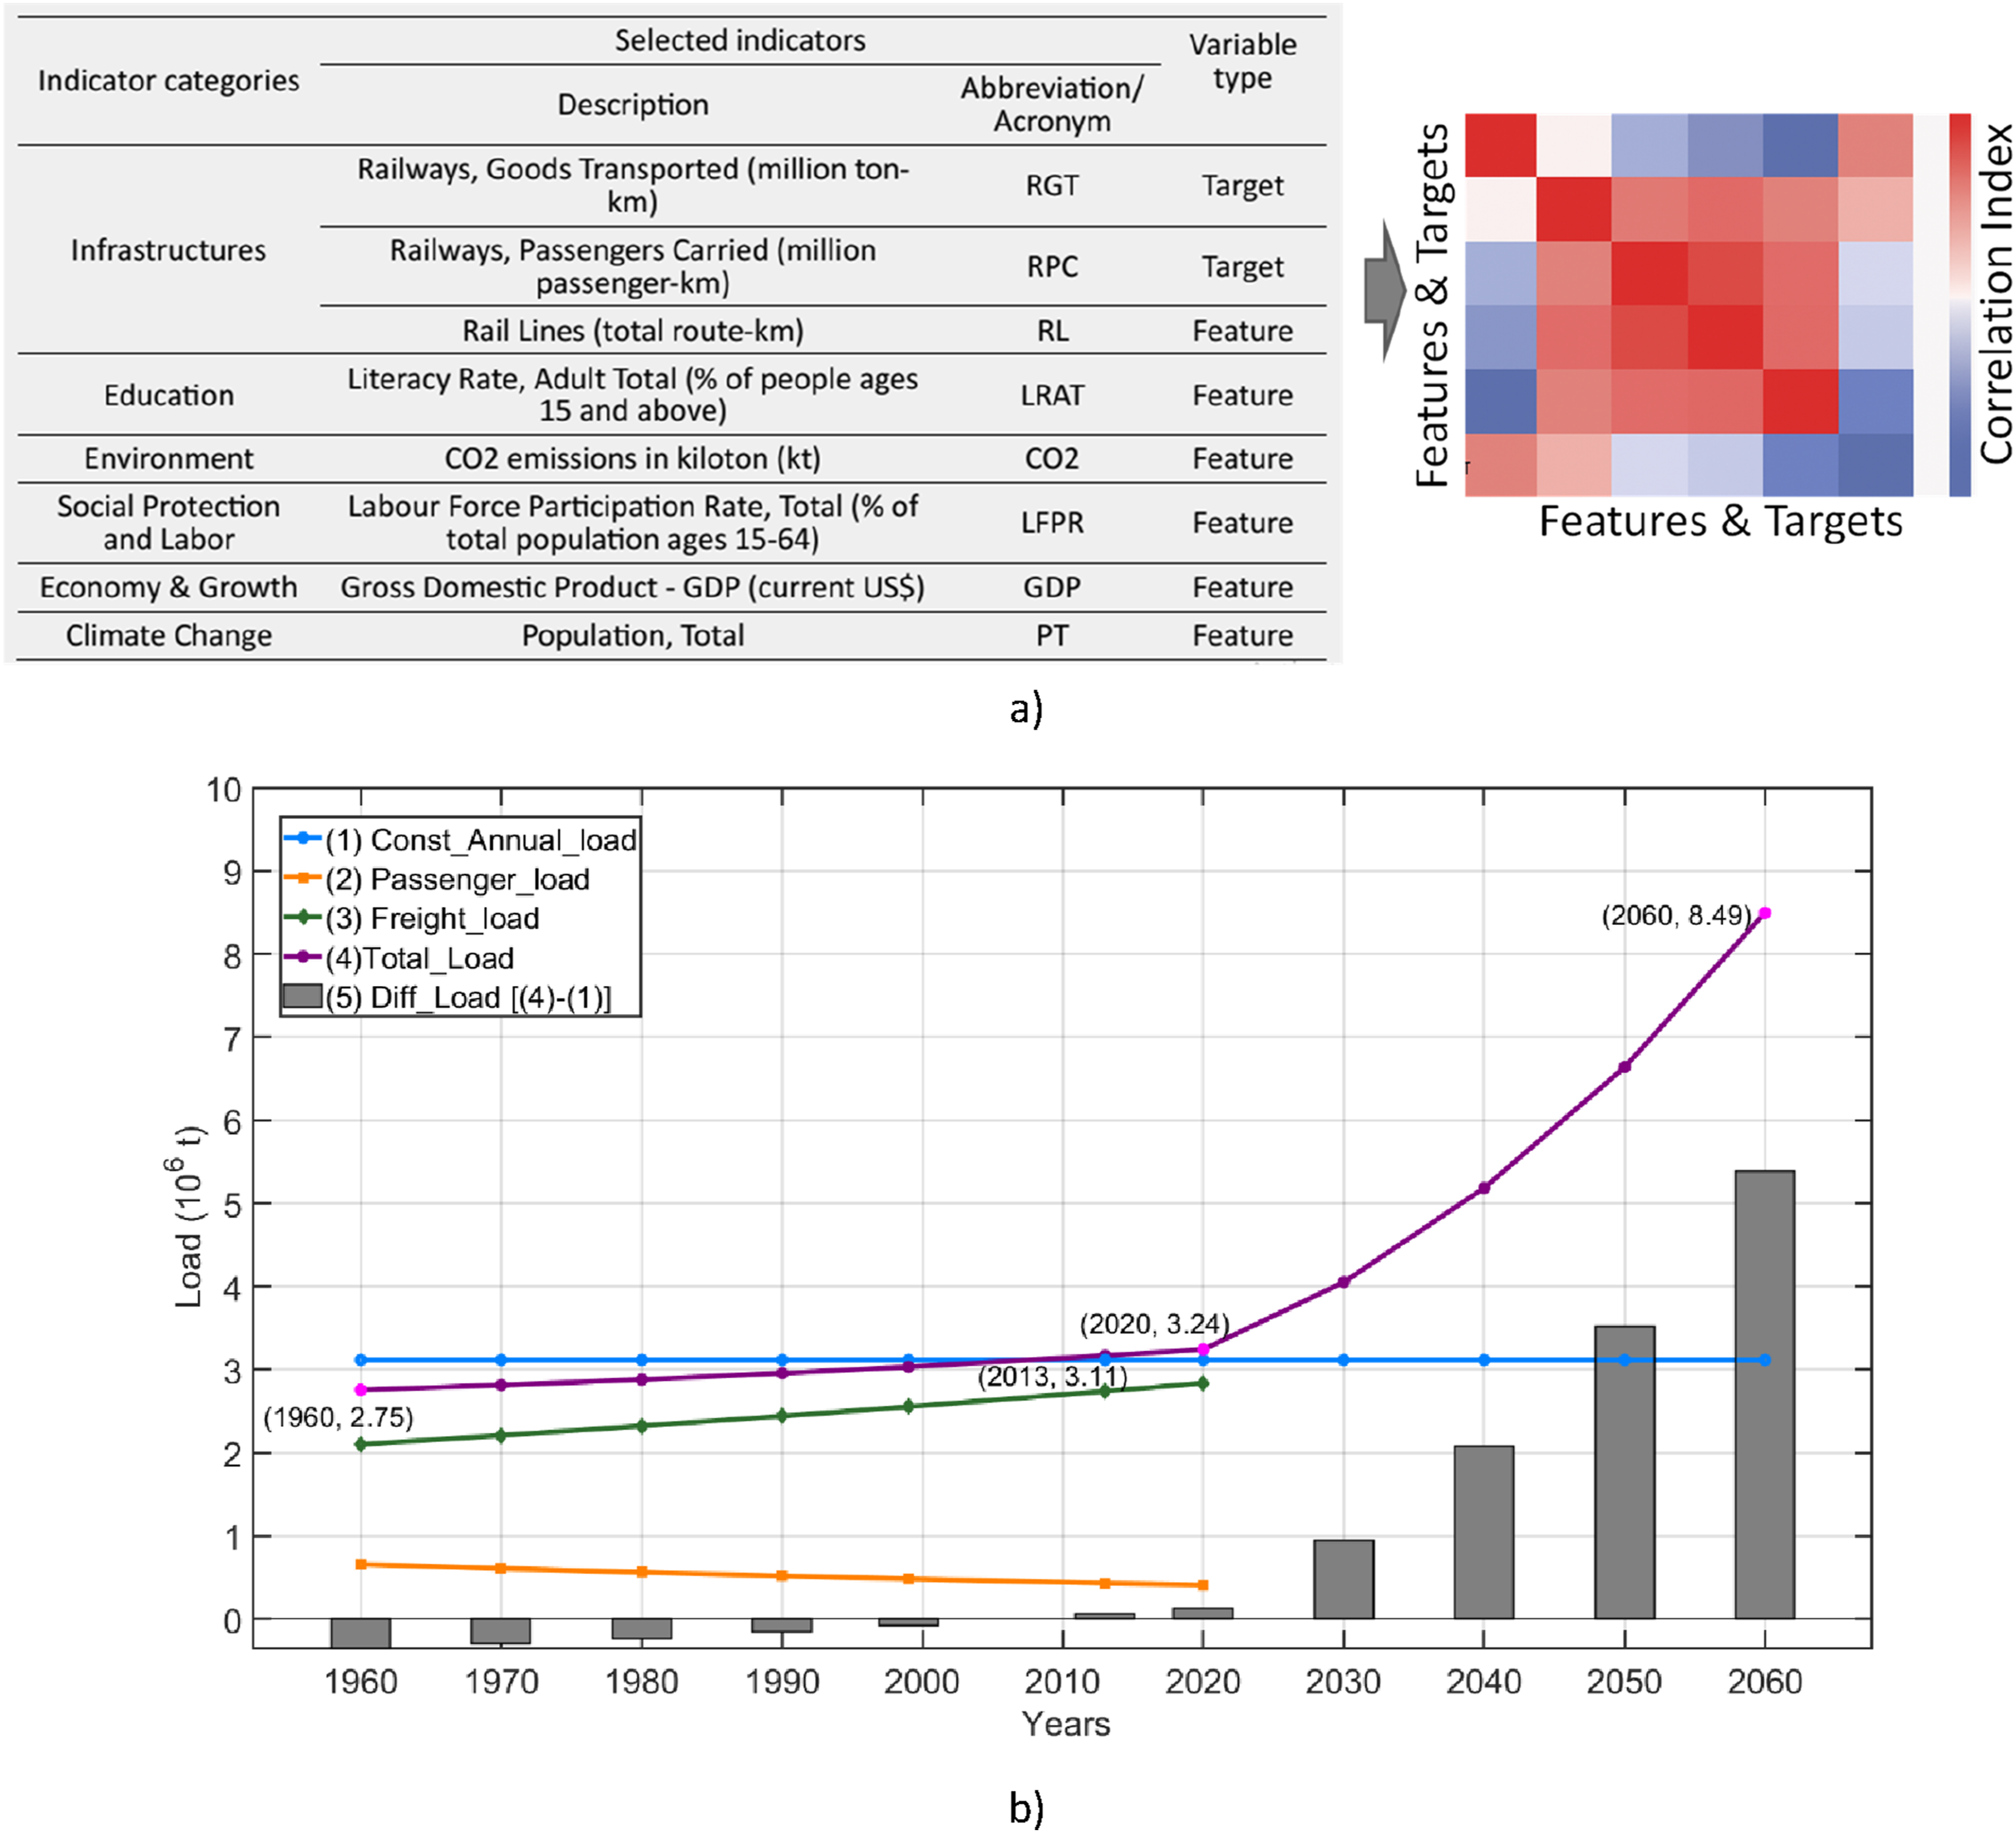
Based on the identified trains and tonnage estimation per train type set, ML techniques were further employed to estimate past traffic volumes, taking into account economic, social, and environmental indicators from the WB (World Bank). Future traffic projections are informed by ongoing and planned railway network expansions, which are aligned with transport policy goals. For example, in the case of Europe, the following forecasts stand out: (i) Doubling high-speed rail traffic by 2030 and tripling it by 2050 (European Commission, 2020); (ii) Increasing freight rail transport by 50% by 2030 and doubling it by 2050; and (iii) Shifting at least 30% of freight traffic over 300 km from energy-intensive modes (e.g., road transport) to environmentally friendly alternatives such as rail by 2030, with a target of 50% by 2050 (López-Acevedo et al., 2024). In this framework, the past traffic volume estimation was based on supervising learning - specifically, linear regression and involved the following steps: • Data representation (Figure 8(a)): six features and two targets initially defined based on WB indicators across six categories - infrastructure, education, environment, social protection & labour, economy & growth, and climate change: - Features: Rail Lines (RL), Literacy Rate (LRAT), CO2 emissions (CO2), Labour Force Participation Rate (LFPR), Gross Domestic Product (GDP), and Population Total (PT); - Targets: Railways Goods Transported (RGT) and Railways Passenger Carried (RPC); • Data Correlation (Figure 8(a)): correlation analysis performed to identify the most relevant predictors for each target; • Traffic rate variation and volume evolution estimation (Figure 8(b)): using linear regression with the filtered features, freight traffic was estimated to have grown at 0.5% per year from 1960 (approximately the period the bridge case study was constructed) to 2020. In the same period, passenger traffic showed a −0.8% annual decrease, 1960–2020. Variation rates applied to the measured traffic (3.11 Mt/year) resulted in the following traffic volume estimates: - 1960: 2.75 Mt/year; - 2020: 3.24 Mt/year; and - 2060: 8.49 Mt/year (assuming +2.5% annual growth, based on aforementioned traffic projections). Estimation of the evolution of real traffic volume: (a) Data representation and correlation; and (b) Traffic tonnage variation 1960–2060.
The estimation of past, present, and future traffic volumes was converted into equivalent train sets for fatigue damage calculation. This involved a reverse process: starting from the estimated total tonnage and, based on the identified train types operating on the line, including their typical axle loads, axle spacings, and speeds, the equivalent train sets were recreated proportionally for each train category originally derived from the WIM measurements (Freight trains, Intercity trains, and Alfa Pendular). This allows the subsequent fatigue calculations to be based on realistic load distributions that are consistent with the real traffic conditions.
Fatigue state characterisation in a bridge digital twin environment
Fatigue analysis system implementation
As outlined in the methodology section, a FAS was proposed as part of the BDT framework to systematically compute damage at connection details and to estimate the RFL. This FAS, which was initially developed and documented in Horas et al. (2023a), was adapted in the present work for seamless integration into the BDT environment. The structural model supporting the FAS was developed based on project information and visual inspections, and validated through ambient and forced vibration tests, confirming its accuracy in representing the bridge’s structural behaviour (Horas et al., 2022). Building on this validated model, the proposed BDT represents the bridge’s condition from commissioning to the present and supports continuous updates through real-time traffic data. In addition to normative traffic scenarios, this study incorporates a WIM system enhanced with ML that provides instantaneous traffic measurements and their evolution over time.
Enhancements introduced in this study focused on adapting the system to automatically account for variations in both load and geometrical conditions, while allowing for fatigue damage calculation at connection details. For example, geometrical conditions were automated using Matlab and Ansys APDL (Ansys Parametric Design Language) routines in the Finite Element (FE) model. By performing quasi-static analysis and using influence lines, the static responses - which serve as input for fatigue damage calculation - can be automatically updated when geometrical parameters (managed by the user via spreadsheets) are modified (Figure 9). Regarding load conditions, customised Matlab routines were developed to support automated processing of a wide range of traffic scenarios, including real traffic data, with the traffic input data controlled by the user. This is also illustrated in Figure 9. FAS - user-managed input data on traffic and geometrical conditions.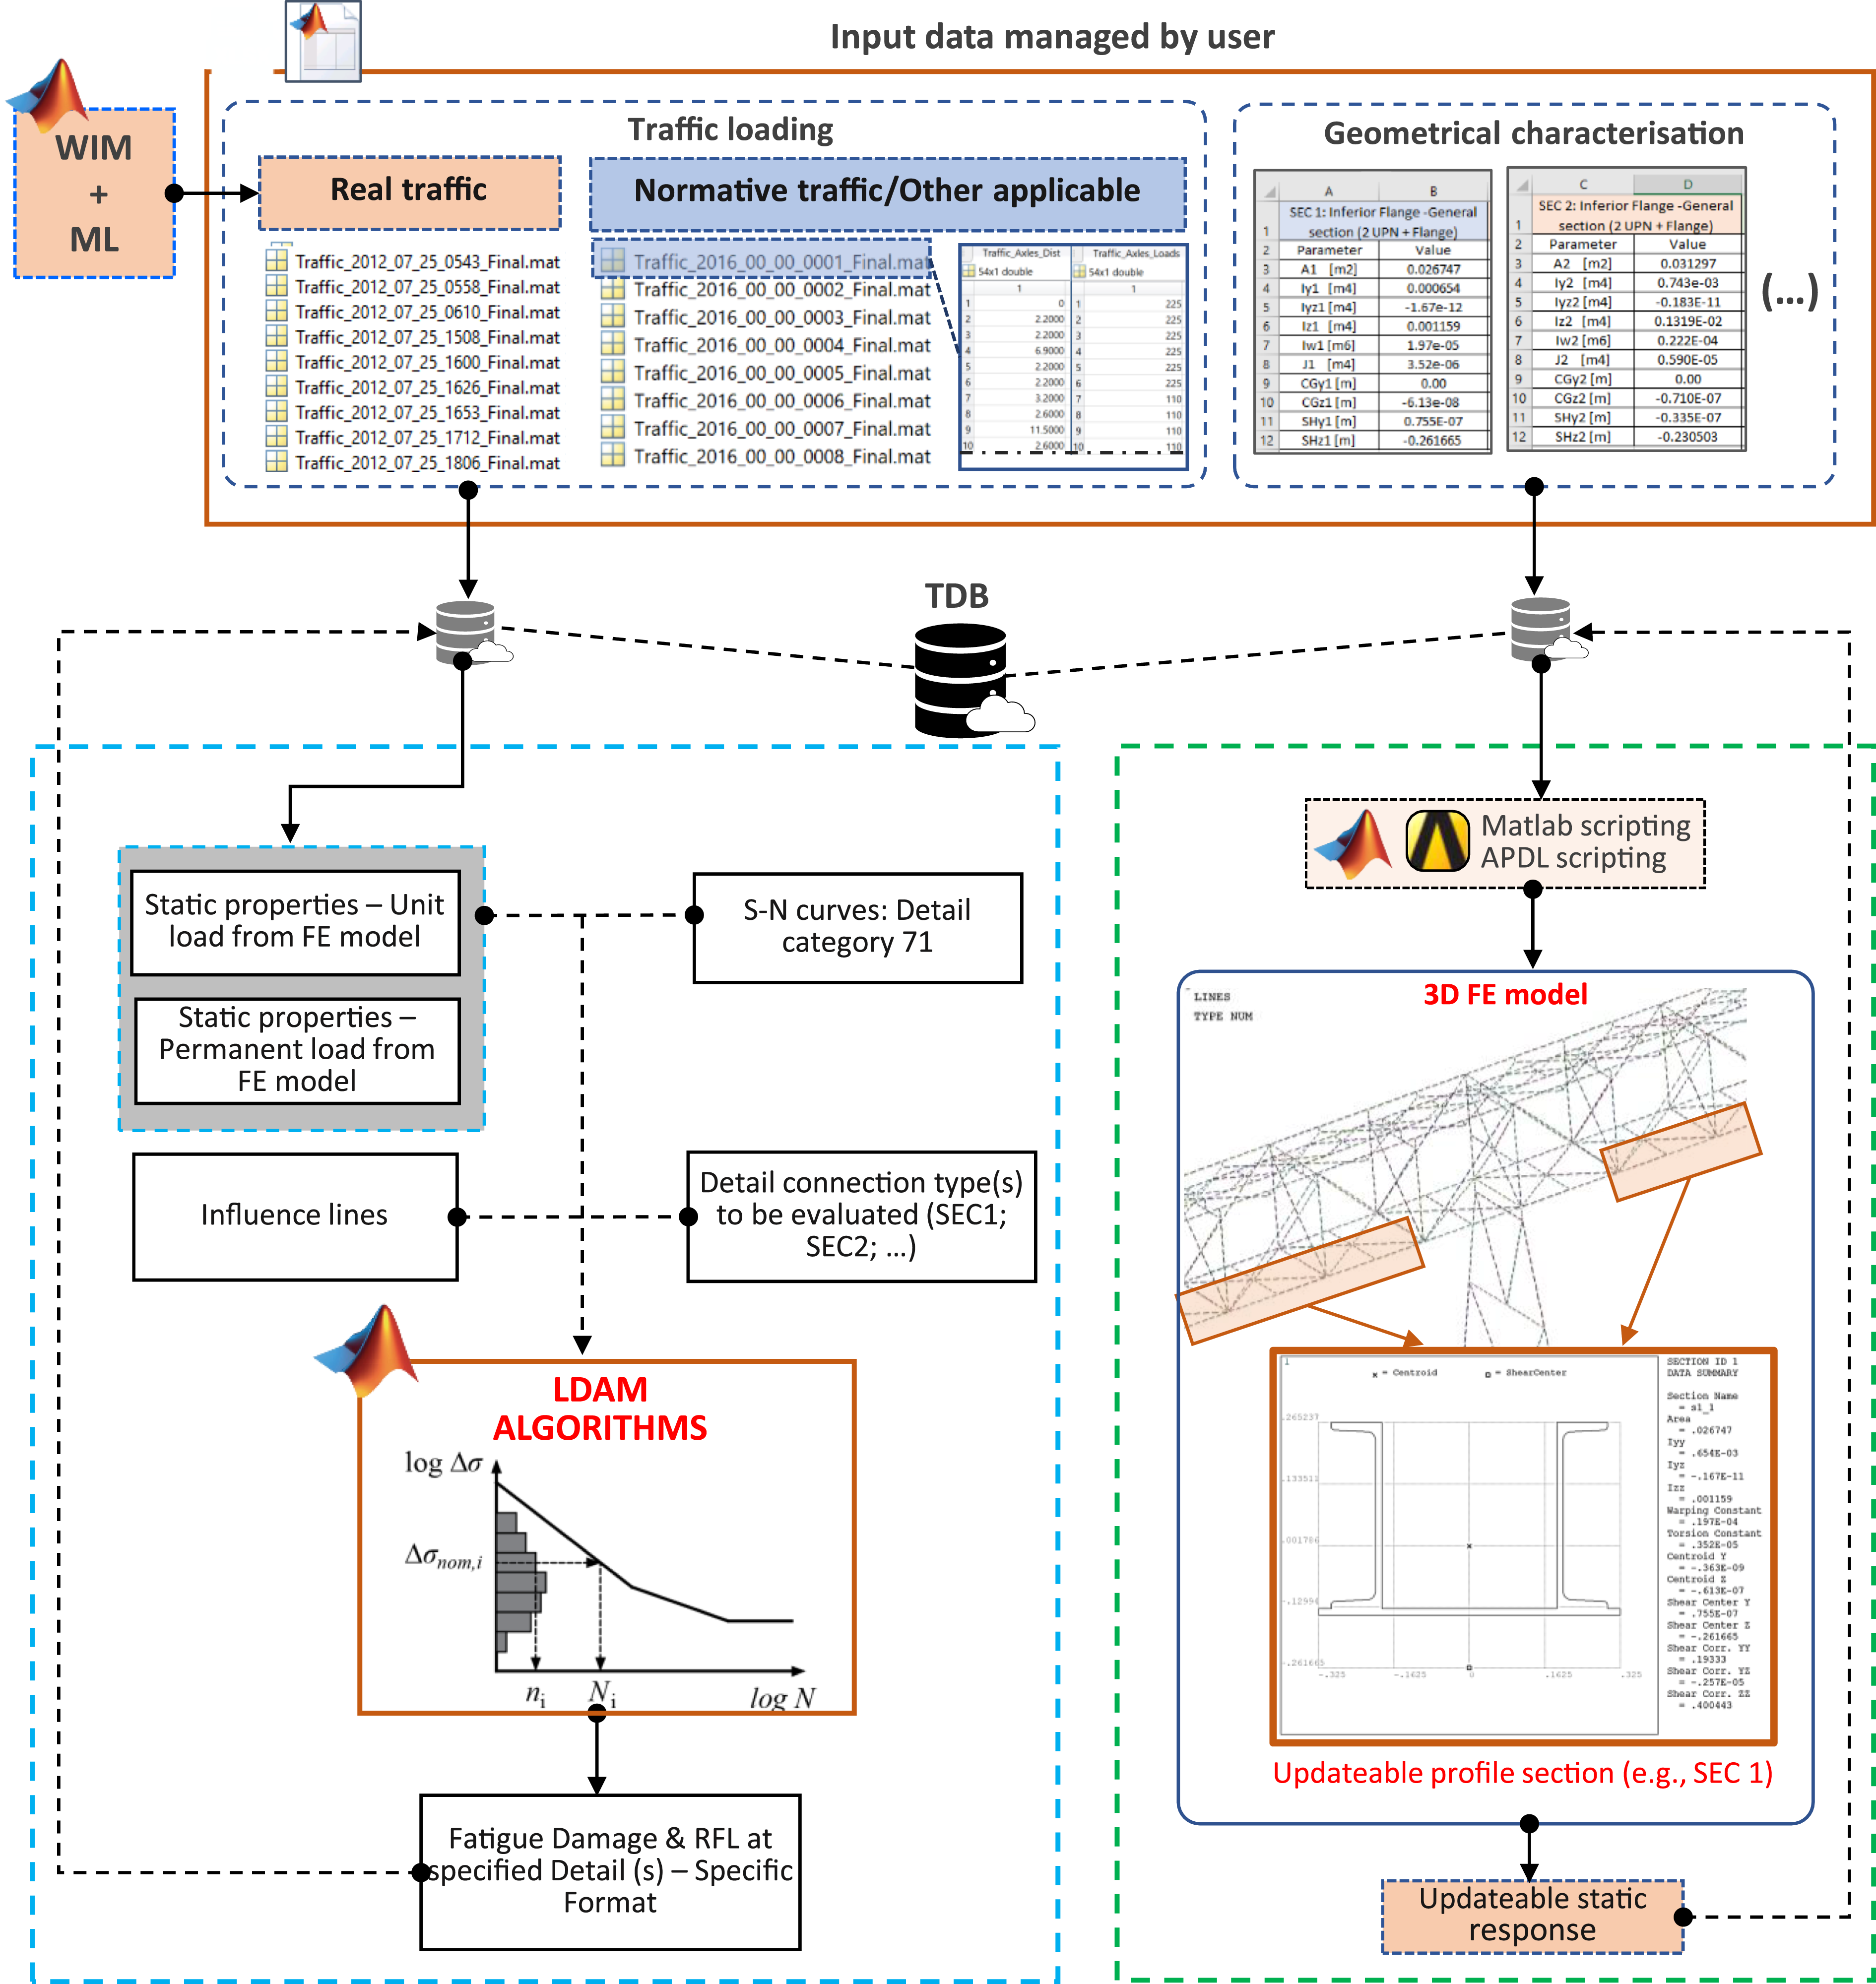
Fatigue damage is computed using the LDAM, incorporated into the FAS. As outlined in EC1-2 (CEN, 2023), for structures such as the Várzeas Bridge, the LDAM based on quasi-static analysis - properly amplified by applying dynamic coefficients may be considered for fatigue calculations. In practical terms, the dynamic amplification effect was considered as described in equation (1), accounting for moving loads through the coefficient
Following the applicable fatigue assessment procedures specified in Eurocodes, the fatigue damage accumulation is computed over a standard reference period of 100-year lifespan (
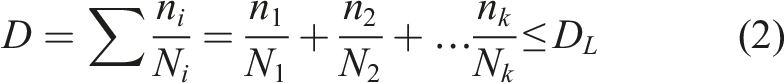
Since LDAM typically limits the overall fatigue damage ( • If • If
The implementation of the LDAM involves the consideration of appropriate S-N curves and a stress spectrum, with stress ranges
As part of the enhancements introduced to the existing FAS to integrate it into the global BDT model, a global Matlab routine and associated application were developed to compute fatigue damage under various load conditions and geometric scenarios. Once the accumulated fatigue damage of a particular connection detail is known, the RFL concerning that detail can be directly assessed. Considering that the Várzeas Bridge was constructed in 1958, the following expression was adopted to evaluate the RFL of a particular detail directly: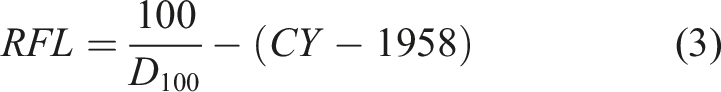
Generation of basic BrIM model
The as-is-BrIM model generation of the Várzeas Bridge was achieved by employing open-source tools, notably IfcOpenShell, Blender and Python programming. This approach enabled the implementation of a parameterised workflow and IFC manipulations based on IFC 4.3. The parametric modelling approach relied on numerical input parameters, algorithms involving extensive mathematical operations, and the generation of 3D objects as outputs (Figure 10). A Python script was developed to read the input data from Excel/CSV files and automatically generate the as-is 3D BrIM model. This process is structured through a main Python file (with supporting subfiles), which handles data reading and model generation in a fully automated way. As illustrated in the same Figure 10, for global as-is-3D BrIM model generation, the process is summarised in five steps, as follows: (i) Modelling of single elements: Run the “mother file” (Script_Varzea_Global_Part_1.py). It involves modelling at least one representative instance of each type bridge member; (ii) Material assignment: Run Script_Varzea_Global_Part_2.py. Material properties are assigned to the previously created individual elements; (iii) Substructure assembly: Run Script_Varzea_Global_Part_3.py. It involves replicating elements and assembling them to create all substructure components; (iv) Superstructure assembly (deck): Run Script_Varzea_Global_Part_4.py. Similar to the previous step, this involves replicating and assembling elements to create the entire superstructure (trussed deck); (v) Track and global model assembly: Run Script_Varzea_Global_Part_5.py. This final step assembles the track elements and integrates all components into the global as-is-BrIM model. Basic as-is-BrIM model generation.
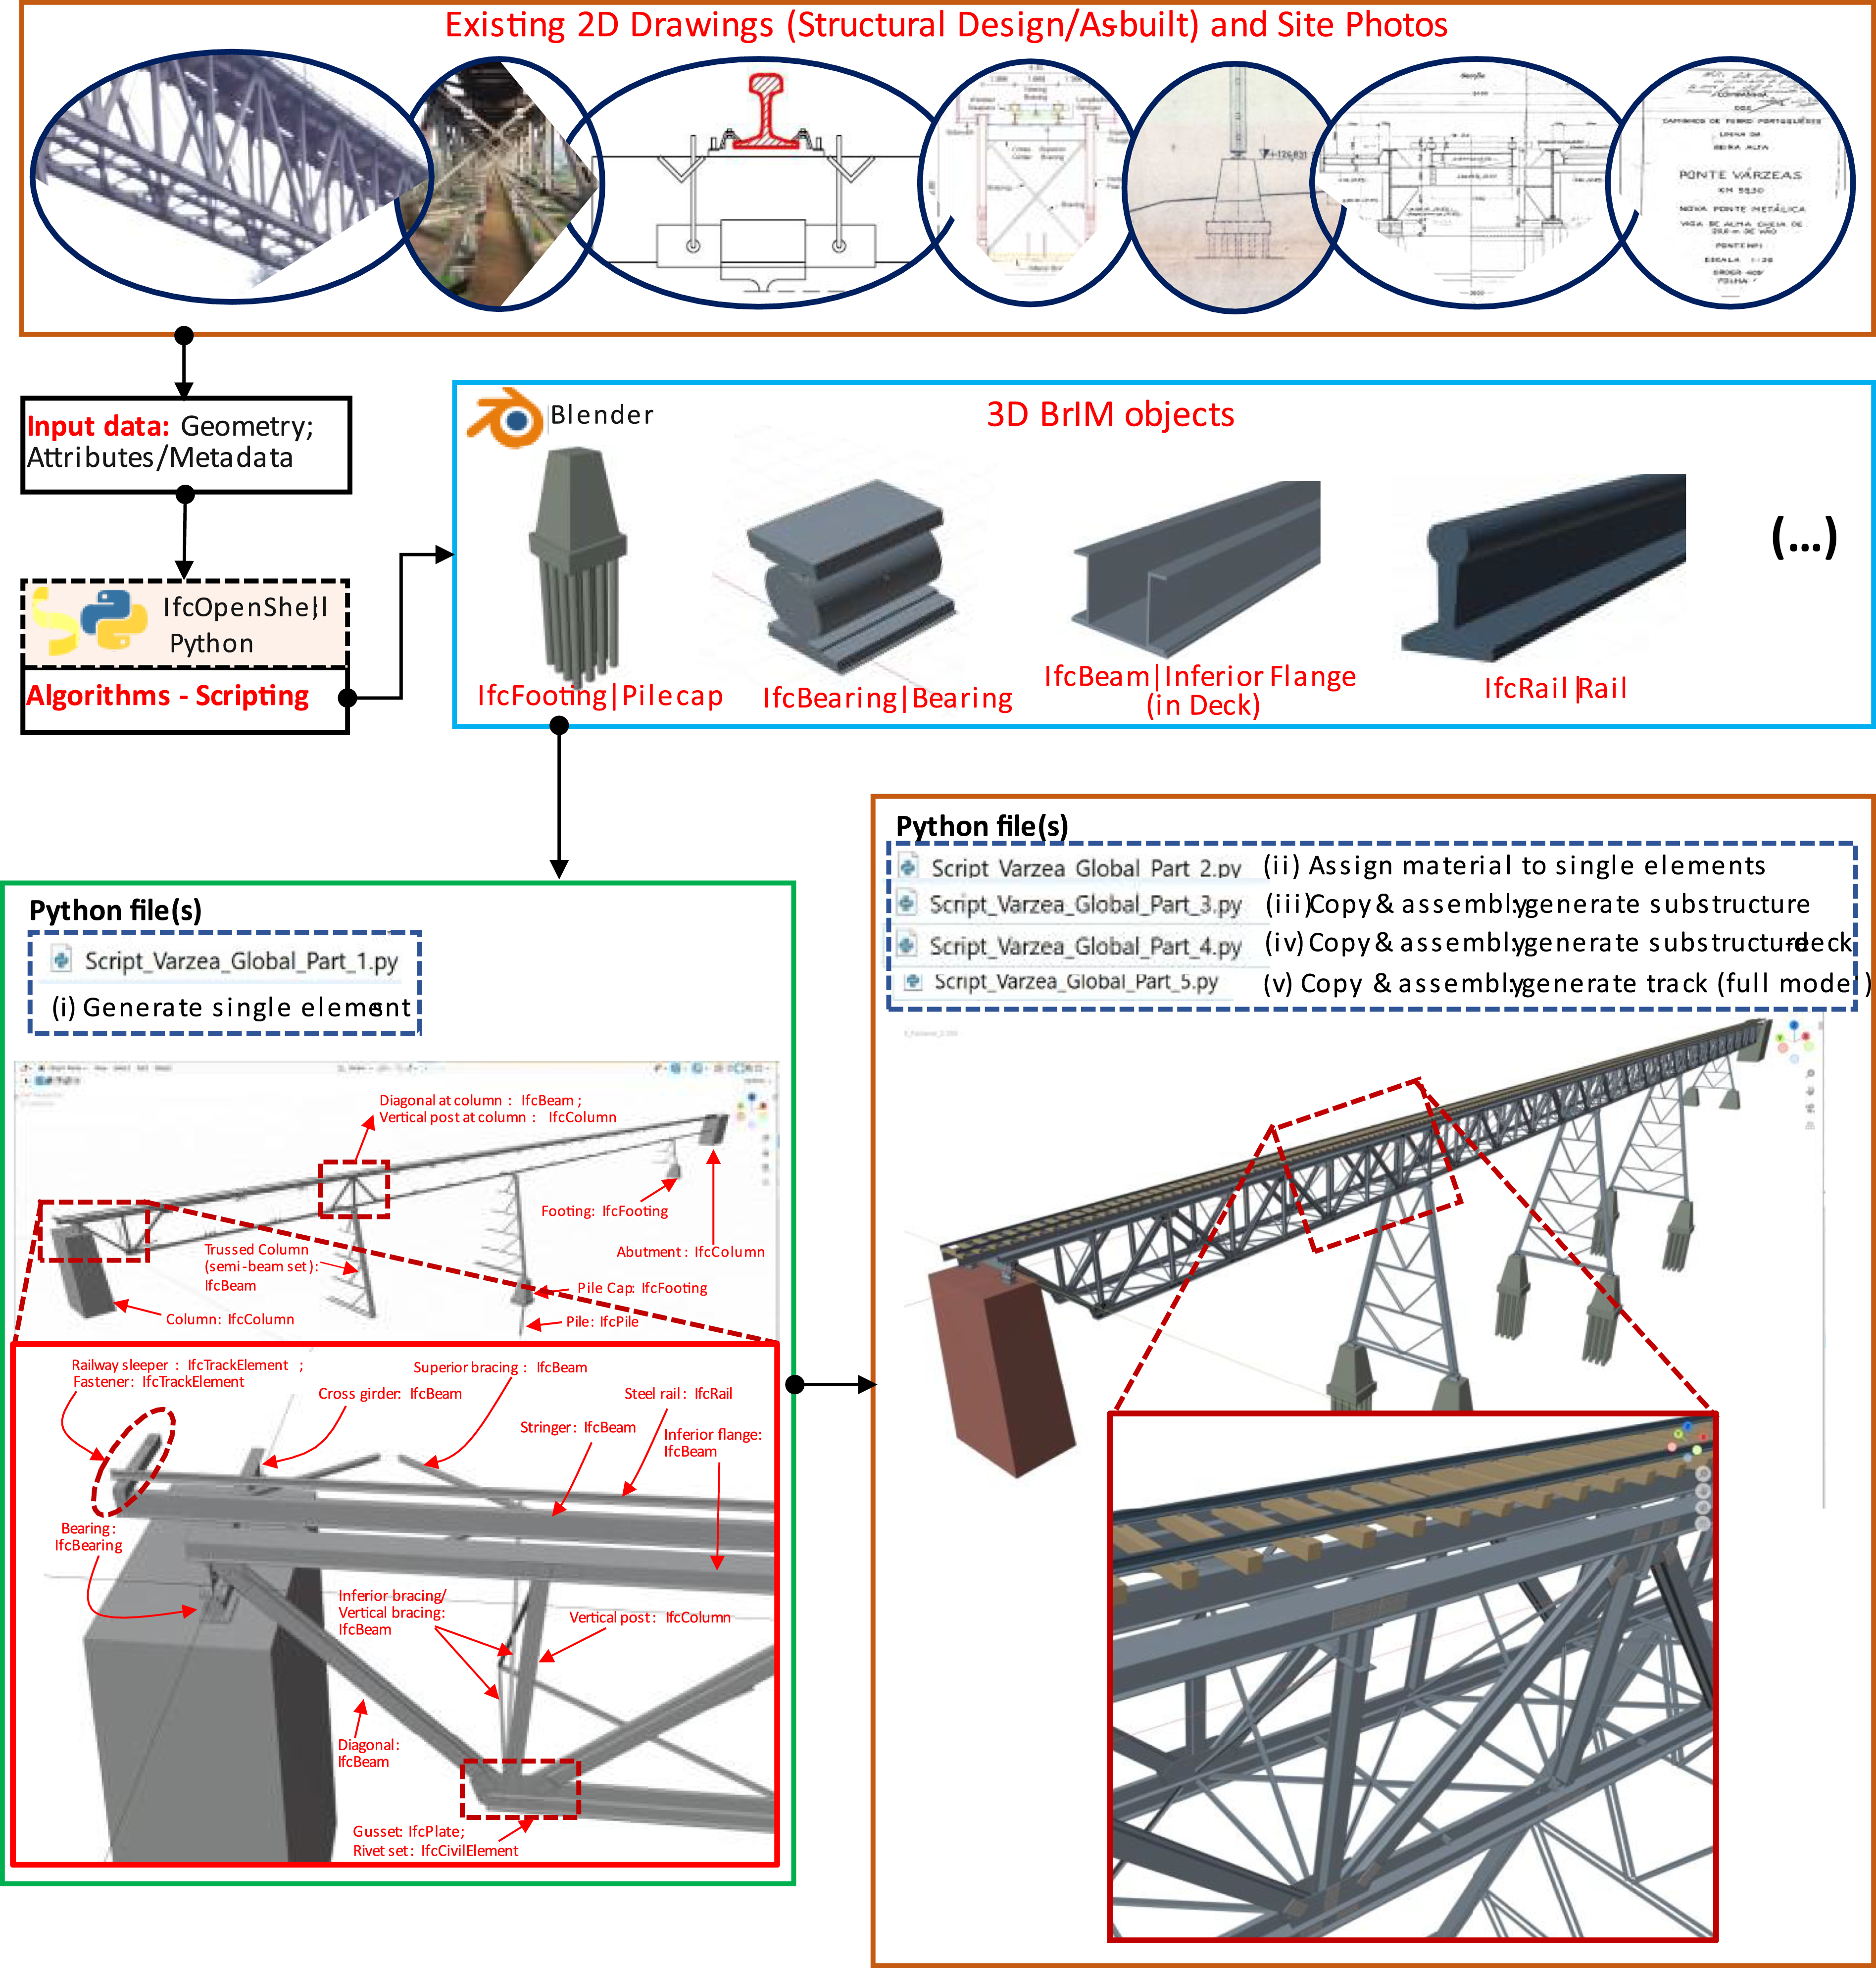
A significant advantage of this automatic process is that the input data can be modified to automatically update the 3D BrIM model. Or, when necessary, automatically generate a different bridge model (but of the same type) just by changing the input data.
Since the basic as-is-BrIM model generation is purely parametric and script-driven, it is highly flexible and can be easily extended to other tasks within bridge monitoring and management processes. This includes an easy interface with additional processes such as semantic enrichment and fatigue related-data visualisation. For example, using unique IDs and an IFC-compliant structure allows certain elements to be linked to updated fatigue results (generated from analysis) or other performance indicators. This ensures that the BrIM model serves not just as a geometric, static 3D model but as a dynamic information container that evolves with the asset’s condition. Overall, the parametric generation and open-source scripting framework provide a solid basis for developing BDTs that are customisable, interoperable, and ready to be integrated with condition assessment tools throughout the asset’s lifecycle.
Integrated model - BDT
Fatigue damage modelling
Given the need for representing fatigue development at principal connections, these details were modelled in a representative manner, i.e., using low to medium Level of Development (LOD) (Figure 11). The as-is-BrIM model, including the modelled connection details, remained interoperable within the openBIM framework – an important gain from the point of view of bridge asset management. These connection details were modelled in the same way as other bridge components, but with specific IDs assigned to link them to FAS, enabling semantic enrichment. Fatigue damage modelling – visualisation of the FAS data.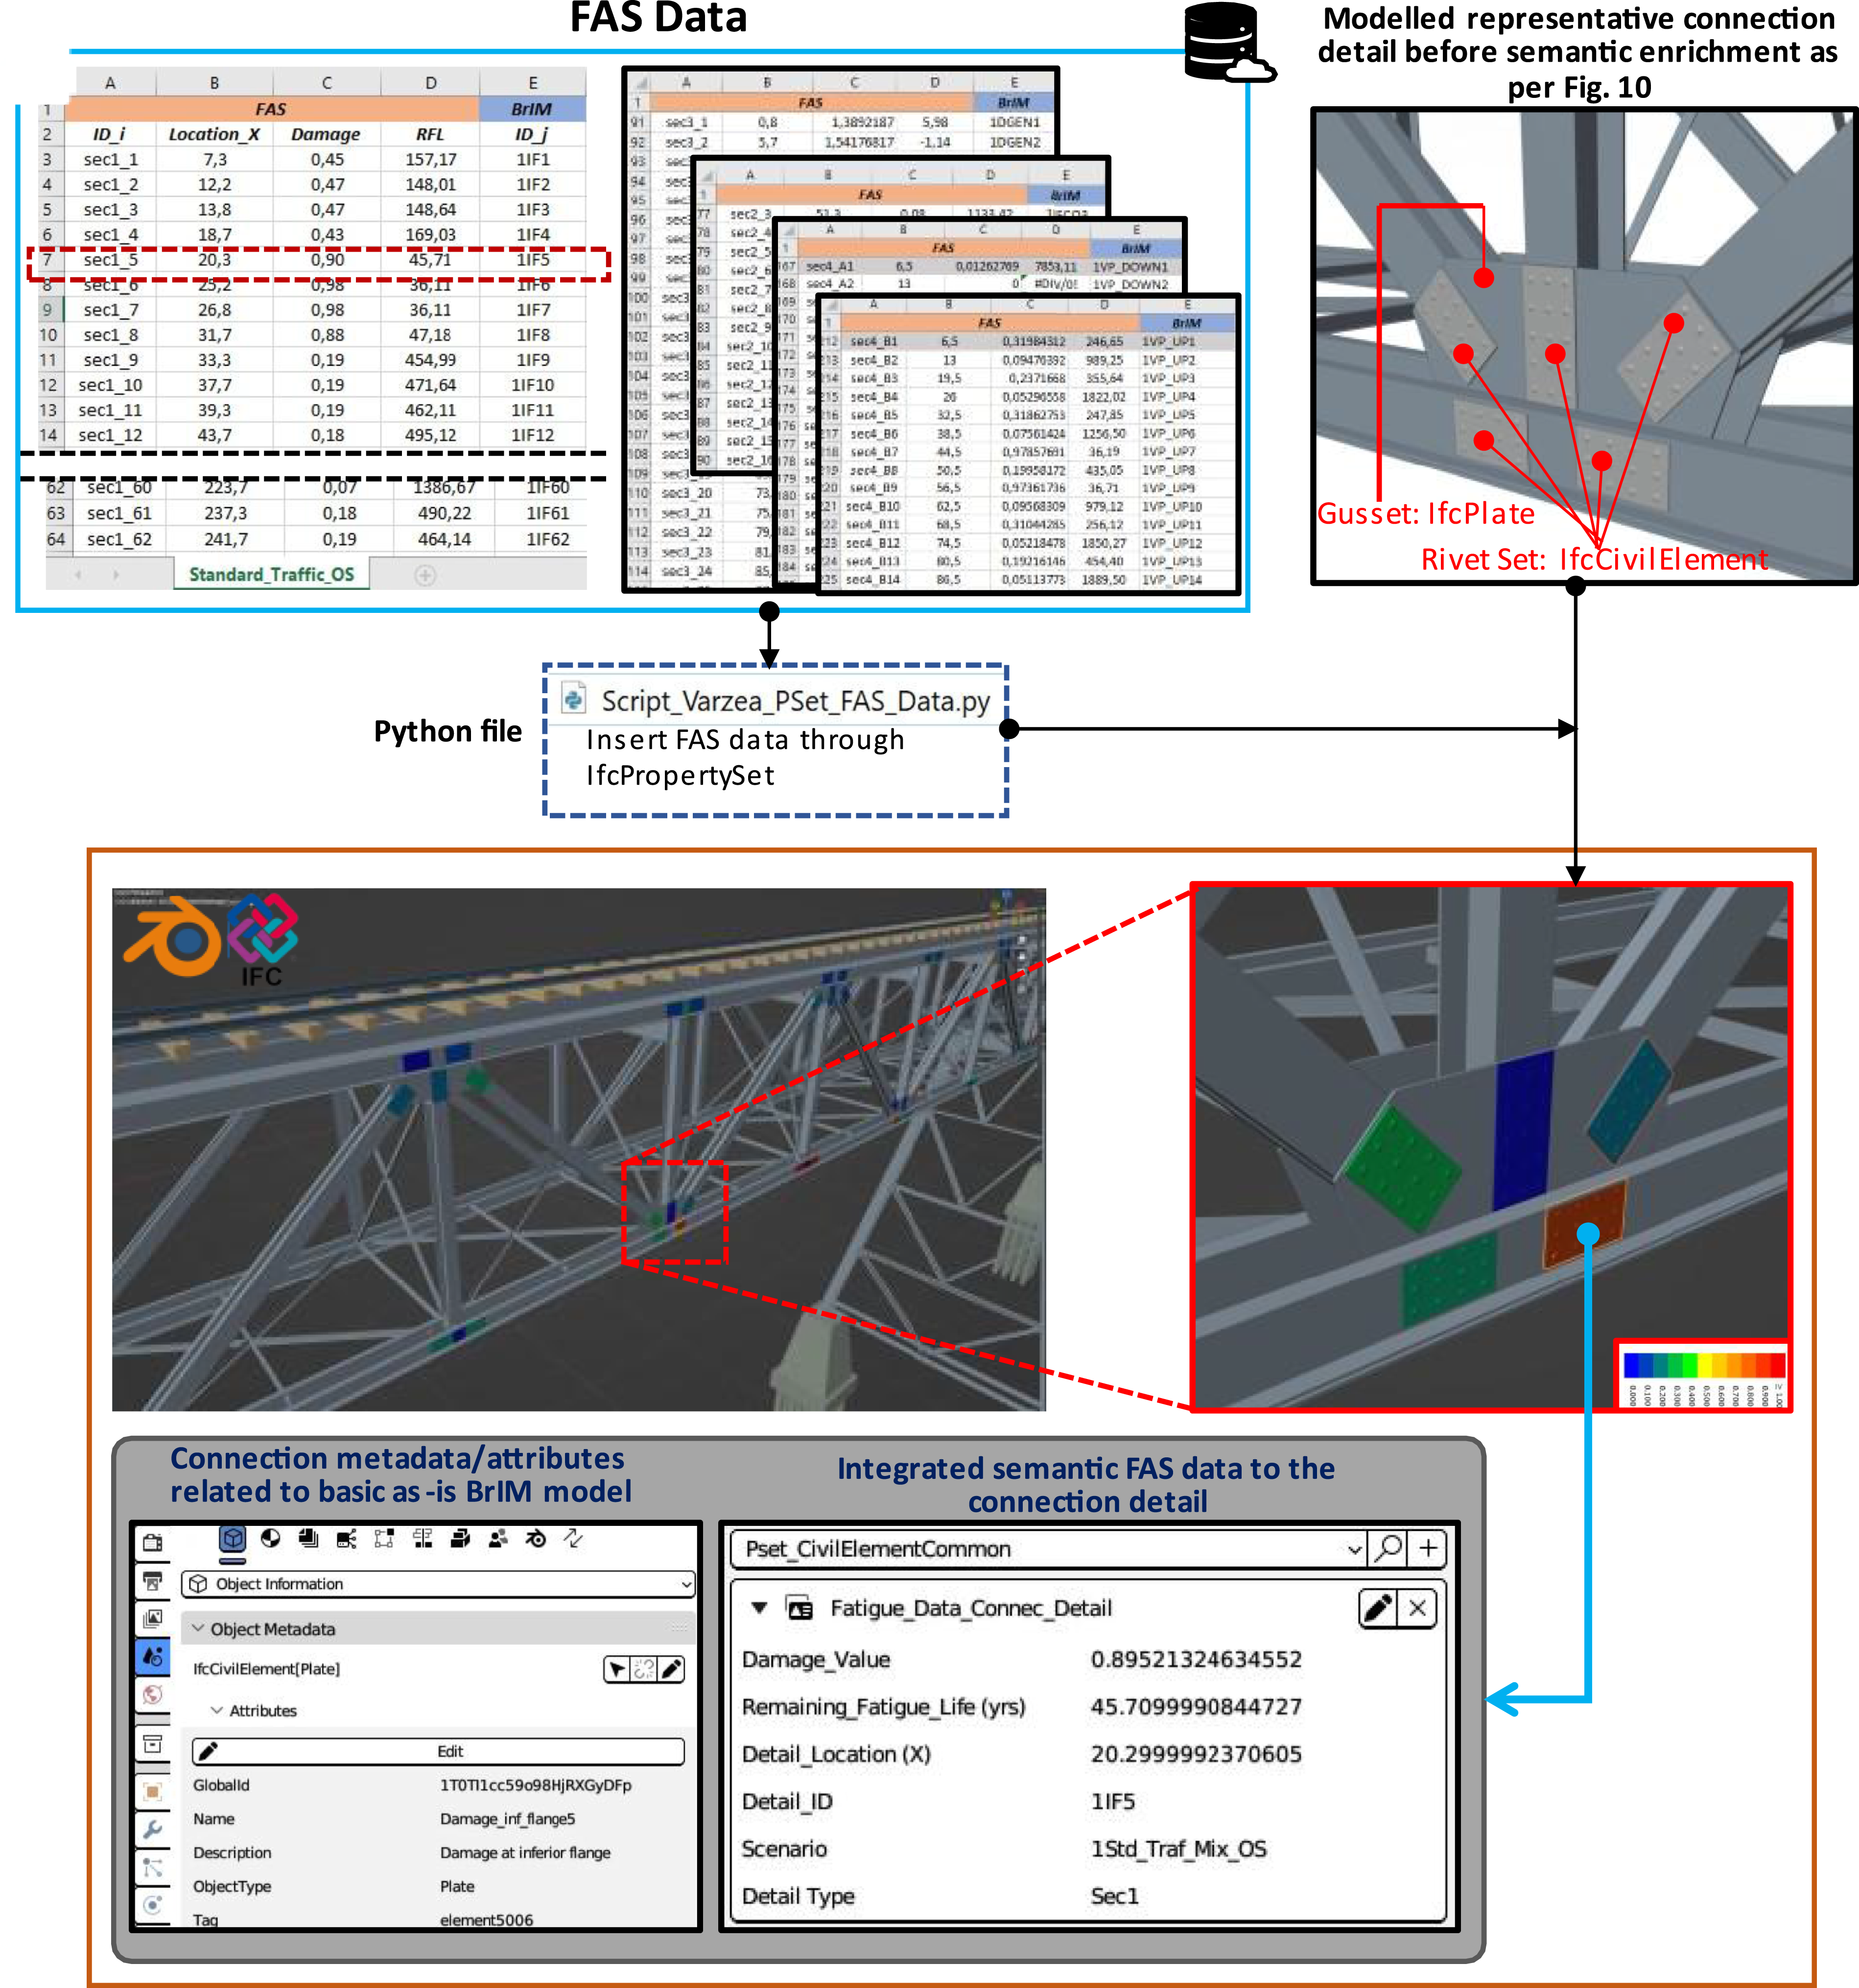
As also shown in Figure 11, a colour-coding scheme was developed to visually represent fatigue condition (graphical representation of fatigue state). An algorithm was developed in Python using IfcOpenShell to dynamically assigns colour intensities to the modelled connections based on fatigue damage indices. Simultaneously, IfcPropertySet was used to embed non-graphical FAS data. This process involved defining specific attributes to characterise the fatigue state, thereby enabling comprehensive semantic representation and efficient data retrieval. These attributes include: “Damage_Value”, “Damage Location”, “Detail ID”, “Remaining_Fatigue_Life (yrs), “Detail Type”, and “Scenario”. Such dual representation, both graphical and semantic, enables an integrated and interoperable visualisation of fatigue conditions, thus promoting more informed and effective decision-making in the context of bridge maintenance and management.
BDT platform
The ultimate goal and primary expectation of a BDT are to provide a flexible and robust platform for bridge asset management, capable of visualising and simulating the structural condition of the bridge. As illustrated in Figure 12, a comprehensive BDT platform has been established, comprising the following parts: (i) Simulation Platform - This part is intended for access by experts and engineers, and is responsible for conducting analyses and simulations when necessary. It includes: • Spreadsheets (Excel, Matlab files - “. mat”, or other file formats) for adjusting geometric or traffic-related parameters; and, • A Matlab-based desktop application that enables experts and engineers to select and configure the analysis scenarios of interest. (ii) FAS and TDB – This is the core system for fatigue calculations, simulations, and data storage: • The FAS receives instructions from the Matlab application, extracts input data from the TDB, computes fatigue damage (and associated information.), and outputs the results, storing them in the TDB. The output results follow an appropriate structure for export and integration into the as-is-BrIM model; • The TDB storage solution can be designed taking into account basic cloud storage approaches, such as OneDrive, for example, or BIM-integrated storage services (e.g., the usBIM platform by ACCA Software). (iii) Python files for Automated Graphical and Semantic Enrichment – This consists of a set of Python scripts developed using the IfcOpenShell library. When executed in the Blender environment, these scripts interact with the pre-generated as-is-BrIM model to dynamically and automatically enrich it based on FAS data extracted from TDB. This enrichment includes: • Automated colour assignment for connection details according to the fatigue damage index; • Embedding of FAS metadata into these connection details using the IfcPropertySet approaches; (iv) Visualisation/Representation Platform - This part is designed to support access by both experts, engineers and non-experts, allowing for continuous monitoring and visualisation of fatigue evolution. This is achieved through the IFC file of the dynamically enriched as-is-BrIM model, which contains continuously updated FAS data that can be visualised in BIM management platforms and/or BIM Viewers. For example, the online usBIM platform from ACCA software provides both management and visualisation capabilities and was chosen to store and read the IFC file. Within the platform, users can access mainly: • All information of the basic as-is-BrIM model (structured according to the IFC schema); and, • Updated fatigue evolution data, strategically embedded into the as-is-BrIM model. The fatigue evolution data is represented in both graphical and non-graphical forms. BDT platform overview: (a) location of connection detail with highest damage per detail type; (b) BDT platform.
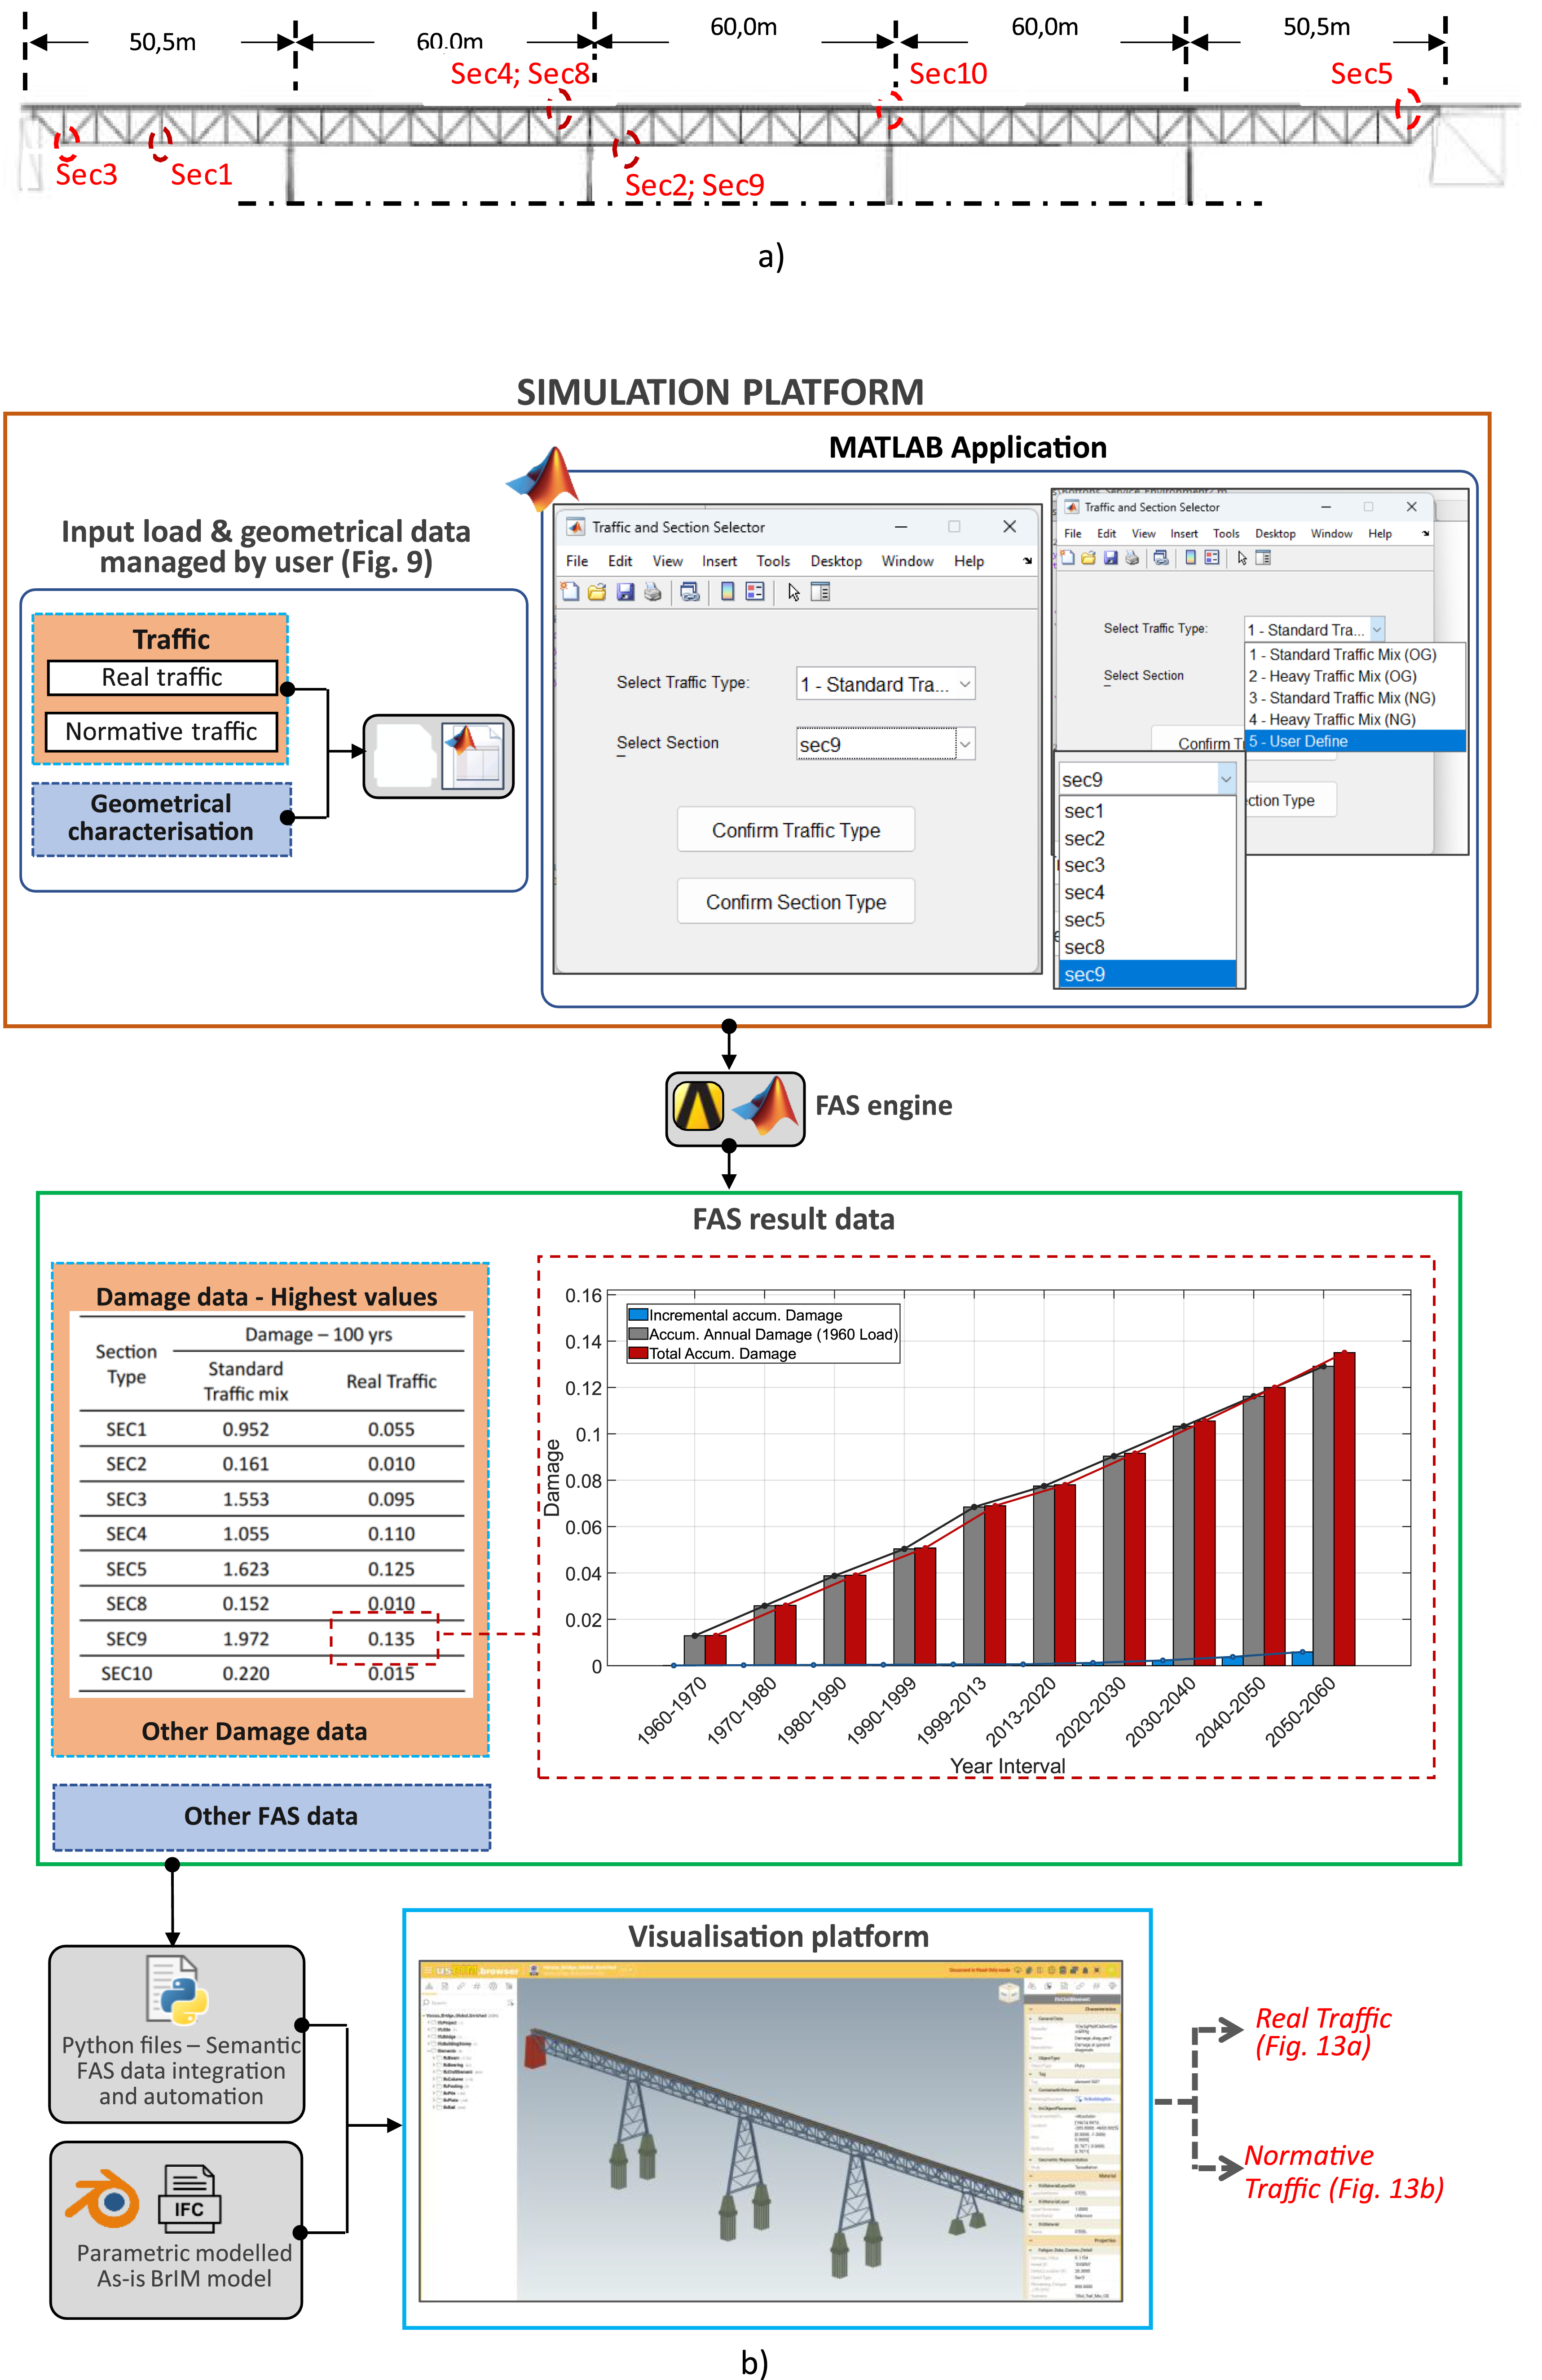
The incorporation of real traffic data into the global BDT allowed a direct comparison of the fatigue damage induced by real traffic and normative traffic. For the FAS implemented in this bridge case study, the principal connection details were categorised into eight types, based on their location within the deck truss structure: (i) General inferior flange – along the spans (SEC1); (ii) Inferior flanges - close to intermediate columns (SEC2); (iii) General diagonals - along the spans (SEC3); (iv) General vertical posts - along the spans (SEC4); (v) Cross-girders (SEC5); (vi) Superior flanges (SEC8); (vii) Diagonals - close to intermediate columns (SEC9); and (viii) Vertical posts – at intermediate columns (SEC10).
The connection details with the highest damage index in each type, under both real traffic and normative traffic (standard traffic mix), are highlighted in Figure 12(a). Among all connection detail types, the one related to the diagonal at x = 115.7 m exhibited the highest fatigue damage index in both normative and real traffic scenarios. The fatigue characterisation of this connection detail is also highlighted in the BDT environment (Figure 13), where it can be seen that this detail classified as fatigue-critical under normative traffic ( BDT platform – FAS data visualisation: (a) Visualisation of connection detail with highest damage index (SEC 9) – real traffic; (b) Visualisation of connection detail with highest damage index (SEC 9) – normative traffic.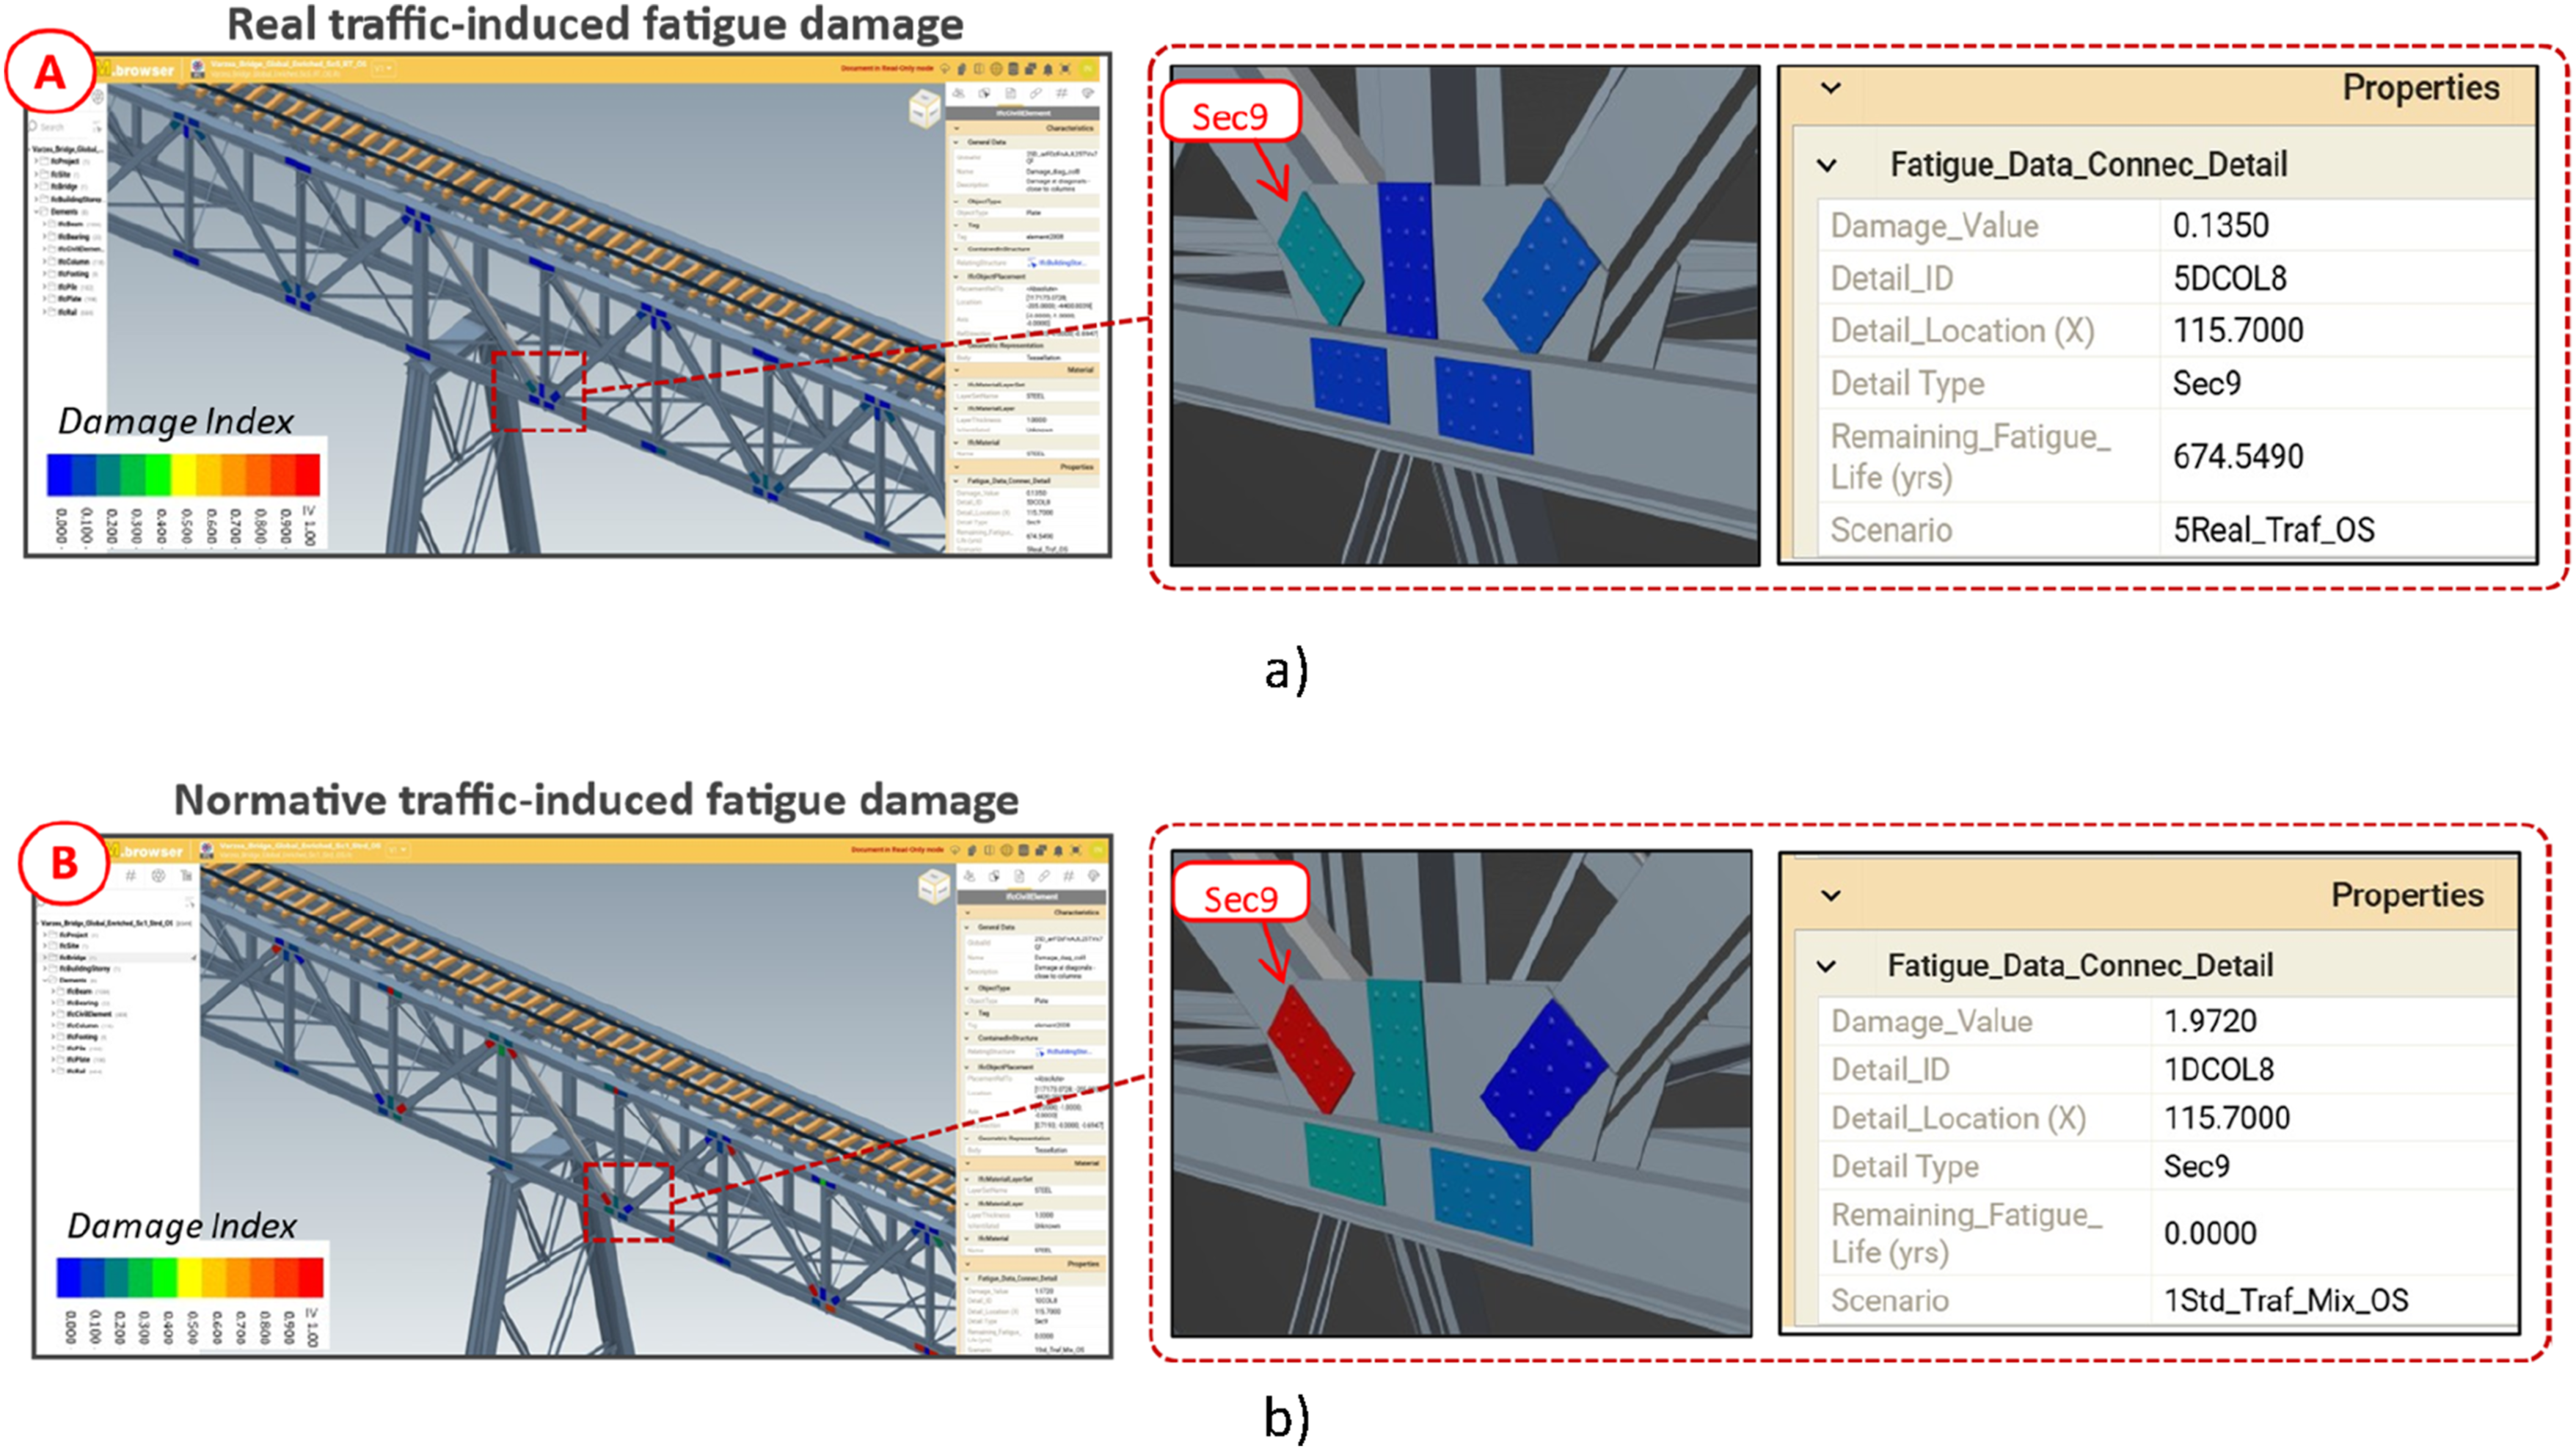
While the incorporation of real traffic data represents a significant step forward in fatigue assessment reliability, it is important to note that the results and extended RFL estimates are only valid if no accidental or undetected defects exist in addition to those identified during inspections, and if no unforeseen damage occurs during future operation. Nonetheless, the clear discrepancy observed between normative and real traffic scenarios highlights the practical reality that in the case of ageing MRBs, a decision based solely on normative load models may unnecessarily limit service life or eventually lead to premature interventions. By providing an updated and realistic fatigue condition, the proposed BDT framework provides infrastructure managers with an important decision-support tool that balances safety, reliability, and cost.
Discussion
The proposed methodology and results demonstrate that the proposed BDT model can serve as a valuable complement to existing bridge monitoring and management practices, in particular for fatigue assessment and monitoring of ageing MRBs. By integrating real traffic data derived from WIM systems and supplemented by ML techniques, this BDT approach goes beyond normative traffic assumptions, providing a more realistic, real-time characterisation of fatigue states and supporting better-informed decision-making. Within this context, it is worth presenting the following reflections: • Added value for bridge management and compatibility with existing frameworks: The proposed BDT model complements conventional inspections and monitoring practices, providing bridge managers and operators with important tool for making more informed decisions about service life extension or plan targeted interventions; • Adaptability for different contexts: The proposed system for real traffic acquisition and processing, which includes the use of WIM complemented by ML, can also be applied to other Portuguese regions or nations. To maximise the benefits, infrastructure managers should promote regular traffic campaigns; • Integration with Bridge Weigh-In-Motion (B-WIM) and full dynamic updating: The proposed BDT framework can be expanded to incorporate B-WIM technology, allowing a direct, real-time load measurements based on bridge response. This means that both fatigue damage and traffic scenarios can be progressively updated over time, resulting in the full capability of a true BDT.
Conclusions
This study demonstrated the transformative potential of BDT model for fatigue state characterisation in ageing MRBs, incorporating real traffic data obtained from WIM systems (also possible through B-WIM) and enhanced through ML techniques. It addresses the limitations of relying solely on normative fatigue traffic models, which tend to be overly conservative when applied to ageing bridge structures. The Várzeas Bridge, located in Portugal, served as a real-world case study to demonstrate the capability of the BDT model to dynamically assess fatigue evolution under both real and normative traffic conditions. To build the BDT model, an upgraded FAS based on global methods was integrated with an as-is-BrIM model, resulting in a graphical and semantic representation of fatigue data. The major contributions and findings of this study are summarised as follows: • Enhanced accuracy through incorporation of real traffic data: the use of real WIM-based traffic data resulted in lower fatigue damage estimates compared to those derived from normative fatigue load models, thereby providing a more realistic representation of the structural performance. Notably, for the most fatigue-sensitive connection detail (diagonal at x = 115.7 m), the damage index decreased from • Improved interpretability through visual and semantic data representations: the automated integration of FAS outputs into an IFC-based BrIM model, along with colour-coded damage index visualisation and embedded metadata, facilitated interpretation and improved bridge management workflows; • Interoperability via open standards and tools: the use of IFC-based modelling for BrIM, combined with open-source tools and semantic enrichment via IfcPropertySet, ensures interoperability, enabling consistent visual and semantic representation of fatigue data across various BIM platforms; • Support for strategic decision-making: by identifying the actually fatigue-critical and non-critical details under operational load conditions, the proposed BDT framework enables more targeted and efficient maintenance interventions.
In conclusion, the proposed BDT model shows substantial promise for enhancing fatigue monitoring in ageing bridges and lays the groundwork for more integrated, real-time, and intelligent bridge management systems. Future developments could expand this framework by incorporating local fatigue methods into the FAS to evaluate critical connection details, considering both linear and non-linear structural behaviour.
Footnotes
Funding
The authors disclosed receipt of the following financial support for the research, authorship, and/or publication of this article: This work was financially supported by Funding - UID/04708 of the CONSTRUCT - Instituto de I&D em Estruturas e Construções - funded by Fundação para a Ciência e a Tecnologia, I.P./MCTES through the national funds. Also, support was given by FCT scholarship funds - SFRH/BD/151229/2021.
Declaration of conflicting interests
The authors declared no potential conflicts of interest with respect to the research, authorship, and/or publication of this article.