
Abstract
Steel tubes with small cross-sectional dimensions have extensive applications in civil engineering. This study focuses on understanding the effect of the unsupported length-to-width (L/B) ratio on the structural stability of square steel tubes with small cross-sectional dimensions (small square steel tubes) subjected to axial compression and tension. Sixty-three small square steel tube specimens with three different cross-sectional dimensions (25 mm × 25 mm, 30 mm × 30 mm, and 35 mm × 35 mm) were tested under compression and tension. Specimens with varying L/B ratios ranging from 2 to 12 were tested under axial compression. The ultimate compressive strength of the specimens was compared with the ultimate tensile strength of the corresponding specimens. The experimental findings revealed that the L/B ratio significantly influenced the failure mechanism, stress-strain behaviour, stability, and ultimate to yield stress ratios of small square steel tubes. The results also highlighted the importance of using controlled length and cross-sectional dimensions of the small square steel tubes to ensure stability in engineering applications.
Introduction
Steel hollow sections have numerous applications in the construction industry due to their high strength against buckling and captivating aesthetic features (Cheng et al., 2014; Liu et al., 2021; Wardenier et al., 2002). Particularly in the last two decades, steel tubes have been used extensively in concrete columns to enhance the ultimate strength and ductility of the columns (Alhussainy et al., 2019; Faridmehr et al., 2024; Liu et al., 2014; Nie et al., 2019; Xiamuxi and Hasegawa, 2012; Yang et al., 2015). Due to the higher confinement ability of steel tubes, recent research investigations focused on concrete constructions involving steel tubes to increase the structural performance of concrete structures (Li and Jiao, 2021; Wang and Cai, 2023; Yuan et al., 2019). In some studies, small steel tubes were used to reinforce RC columns and the effect of small steel tubes on the performance of RC columns were investigated (Alhussainy et al., 2018b, 2019; Hadi et al., 2017). For the same cross-sectional area, the radius of gyration of steel tubes is much higher than the radius of gyration of solid steel bars. As a result, the slenderness ratio (L/r ratio, where L represents the tube length and r is the radius of gyration) of the steel tube section is notably lower than the slenderness ratio of solid steel sections. The lower L/r ratio leads to higher bending stiffness and, consequently, higher axial load-carrying capacity of the steel tube in comparison to the solid steel bar with the same effective length and cross-sectional area (Rasmussen et al., 2004; Rasmussen and Hancock, 1993).
The axial load carrying capacity and failure modes of steel tubes, including local buckling and global buckling, are influenced by their cross-sectional dimensions, for example, diameter (D) or width (B), length (L), and tube wall thickness (t) of the tubes (Al-Sadoon et al., 2023; Alhussainy et al., 2017; Meng and Gardner, 2020; Sun et al., 2021). These influencing parameters are considered in terms of outer dimension to thickness ratio (D/t or B/t) and length to thickness ratios (L/t). The local buckling behaviour is influenced by the diameter to thickness (D/t) ratio or width to thickness (B/t) ratio, whereas the global buckling behaviour is influenced by the length to diameter (L/D) ratio of the steel tubes. Steel tubes with larger outer diameters (D or B) and comparatively smaller wall thicknesses (t) tend to be more prone to local buckling. Conversely, steel tubes with longer lengths (L) and smaller outer diameters (D or B) are more prone to experiencing global buckling (Alhussainy et al., 2017).
The local buckling behaviour of steel circular hollow sections (CHS), rectangular hollow sections (RHS) and square hollow sections (SHS) depends on the D/t ratio or B/t ratio of the tubes. The local buckling of the steel tube can be prevented by imposing limits on the D/t or B/t and L/t ratios specified by design standards (AISC360, 2022; Hancock and Zhao, 1992; Zhao and Hancock, 1991). The performance of circular steel tubes considering the thickness was investigated in a few previous studies (Sohal and Chen, 1987; Teng and Hu, 2007; Zhao, 2000). The influence of thickness was assessed through D/t ratio. Zhao (2000) found that an increase in the D/t ratio reduced the compressive capacity of the circular steel tubes due to the local buckling of the steel tubes. Teng and Hu (2007) observed that the failure mode of circular steel tubes with a small D/t ratio was outward buckling around the circumference.
The influence of length to cross sectional dimension ratio is significantly important for the stability of the steel tubes (Alhussainy et al., 2017). The global buckling behaviour of the steel bars and tubes is largely influenced by the length-to-cross-sectional dimension ratio. When the length to cross sectional dimension ratio is higher, small dimension steel tubes are more susceptible to experiencing global buckling particularly prior to the yielding of the steel tubes (Alhussainy et al., 2018a). A reduction in the yield stress and ultimate load carrying capacity of steel tubes was reported due to the occurrence of global buckling at a higher L/D ratio under axial compressive loading. Alhussainy et al. (2017) suggested limiting the L/D ratio to prevent the global buckling of small dimension steel tubes.
For a large length to cross sectional dimension ratios, some design standards have specified reduction factors for axial compression capacity of steel tubes. However, the codified reduction factors might not be applicable for small steel tubes (AISC360, 2022; CSA, 2001; EUROCODE3, 2007; Johnson and Anderson, 2004). For small dimension steel tubes, the effect of the length and cross sectional dimensions on the axial loading capacity is significantly important (Al-Sadoon et al., 2023; Meng and Gardner, 2020). Al-Sadoon et al. (2023) stated that the elastic buckling strength of small dimension hollow steel pipes is sensitive to length to diameter ratio of the steel pipe when used in practical applications. A limited number of studies investigated the performance of small dimension steel tubes for varying length to cross-sectional dimension ratios. Alhussainy et al. (2017) investigated the behaviour of small-diameter circular steel tubes under axial compressive loading with increasing length-to-diameter (L/D) ratios. It was reported that for L/D ratios of under 4, steel tubes experienced local failure (elephant foot buckling) and for L/D ratios of 6 or more, steel tubes experienced global failure (yielding of the tube).
Small-dimension steel tubes with varying lengths and cross-sectional dimensions may be applied in various civil engineering projects. However, a limited number of research studies have been conducted on the effect of the unsupported length-to-width (L/B) ratio on the axial performance of small square steel tubes, particularly those with cross-sectional dimensions under 40 mm. The small cross-section steel tubes are critical in modular systems, lightweight frameworks, scaffolding, and pipelines, where stability becomes a dominant factor due to higher slenderness (Al-Sadoon et al., 2023; Alhussainy et al., 2017; Gubetini et al., 2024). Therefore, to gain a clearer understanding of instability effects and obtain practical insights into the failure mechanisms of small square steel tubes, it is important to investigate their performance under axial tension and compression by varying the unsupported length-to-cross-sectional ratios.
This study experimentally investigates the behaviour of square steel tubes with small cross-sectional dimensions (small square steel tubes) under axial tension, as well as the influence of the length-to-width (L/B) ratio under axial compression, which has not been adequately investigated to date. The primary objective of this investigation is to assess the influence of varying length-to-width (L/B) ratios of the small square steel tubes on relative structural behaviour, failure mechanisms, and stability trends.
To achieve the objectives of this study, small square steel tube specimens with six different L/B ratios for three different cross-sectional dimensions were tested under axial compression and their failure modes were investigated. In addition, tube specimens were tested under tension to compare the behaviours under tension and compression. Ultimately, this study aims to recommend, based on the experimental results, the most suitable L/B ratio of small square steel tubes for efficient structural applications. Extensive numerical investigations have been considered beyond the scope of this paper. It is noted that the presented experimental results should be translated with caution for other tube specimens with different cross-sectional dimensions and L/B ratios.
Experimental program
Overview
In the experimental program, the behaviour of cold-form steel tube specimens, for three different cross-sectional dimensions, was investigated under axial tension and compression. A total of 9 specimens for the three different cross-sectional dimensions of steel tubes were tested under axial tension and a total of 54 specimens for the three different cross-sectional dimensions of steel tubes were tested under axial compression. The steel tubes with a minimum yield stress of 350 MPa were used in this study. The steel tubes used in this study were sourced from One Steel, Australia (OneSteel, 2024).
Specimen labelling
The experimental program consisted of testing three different groups of cold-formed steel tube specimens, which were labelled as ST25, ST30 and ST35. Cold-formed steel sections are being used across the construction industry due to their high strength and light weight (Hancock, 2016). Groups ST25, ST30 and ST35 represent cold-formed small square steel tube specimens with cross-sectional dimensions of 25 mm × 25 mm, 30 mm × 30 mm, and 35 mm × 35 mm, respectively. For simplicity, hereafter, these three cross-sectional dimensions of steel tube specimens have been written as 25 mm, 30 mm, and 35 mm square steel tubes. The wall thickness of all the tubes was 2 mm, resulting in inside cross-sectional dimensions of 21 mm × 21 mm, 26 mm × 26 mm, and 31 mm × 31 mm for ST25, ST30, and ST35 specimens, respectively.
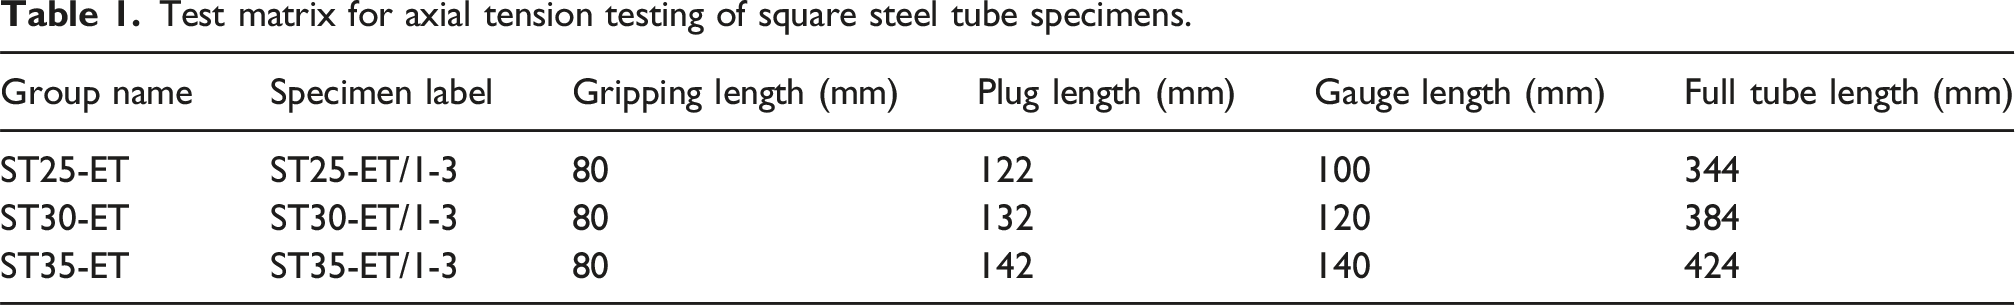
Test matrix for axial tension testing of square steel tube specimens.
Test results of square steel tube specimens under axial tensile loading.
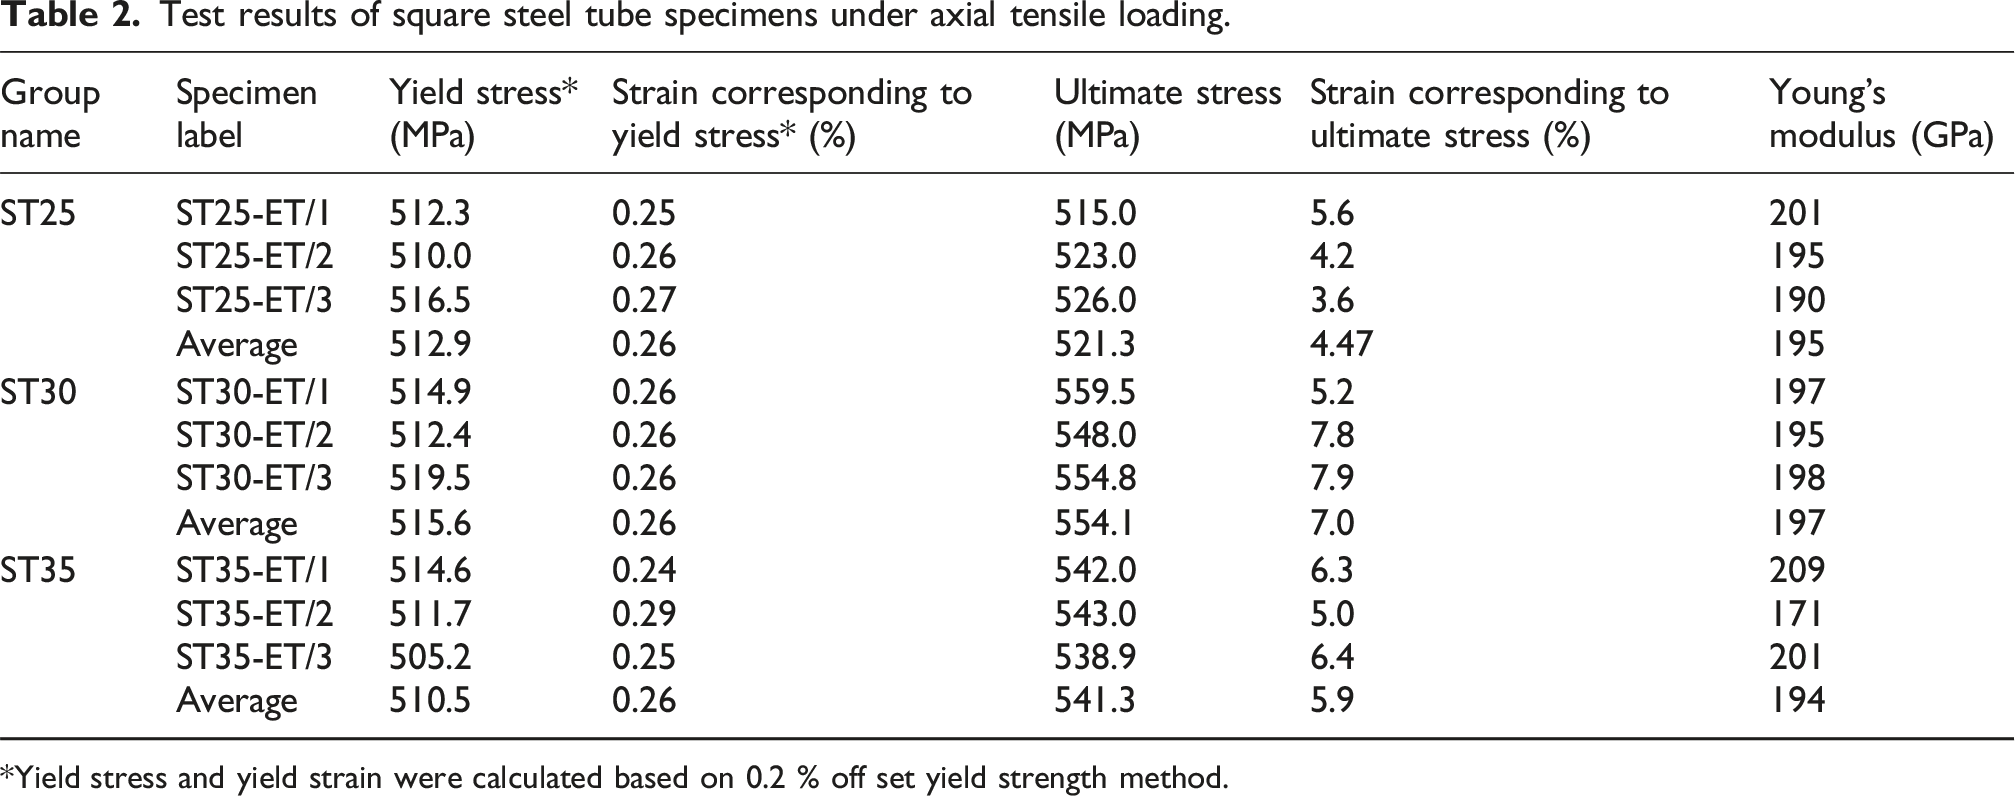
*Yield stress and yield strain were calculated based on 0.2 % off set yield strength method.
Test results of 25 mm square steel tube (Group ST25) specimens under axial compressive loading.
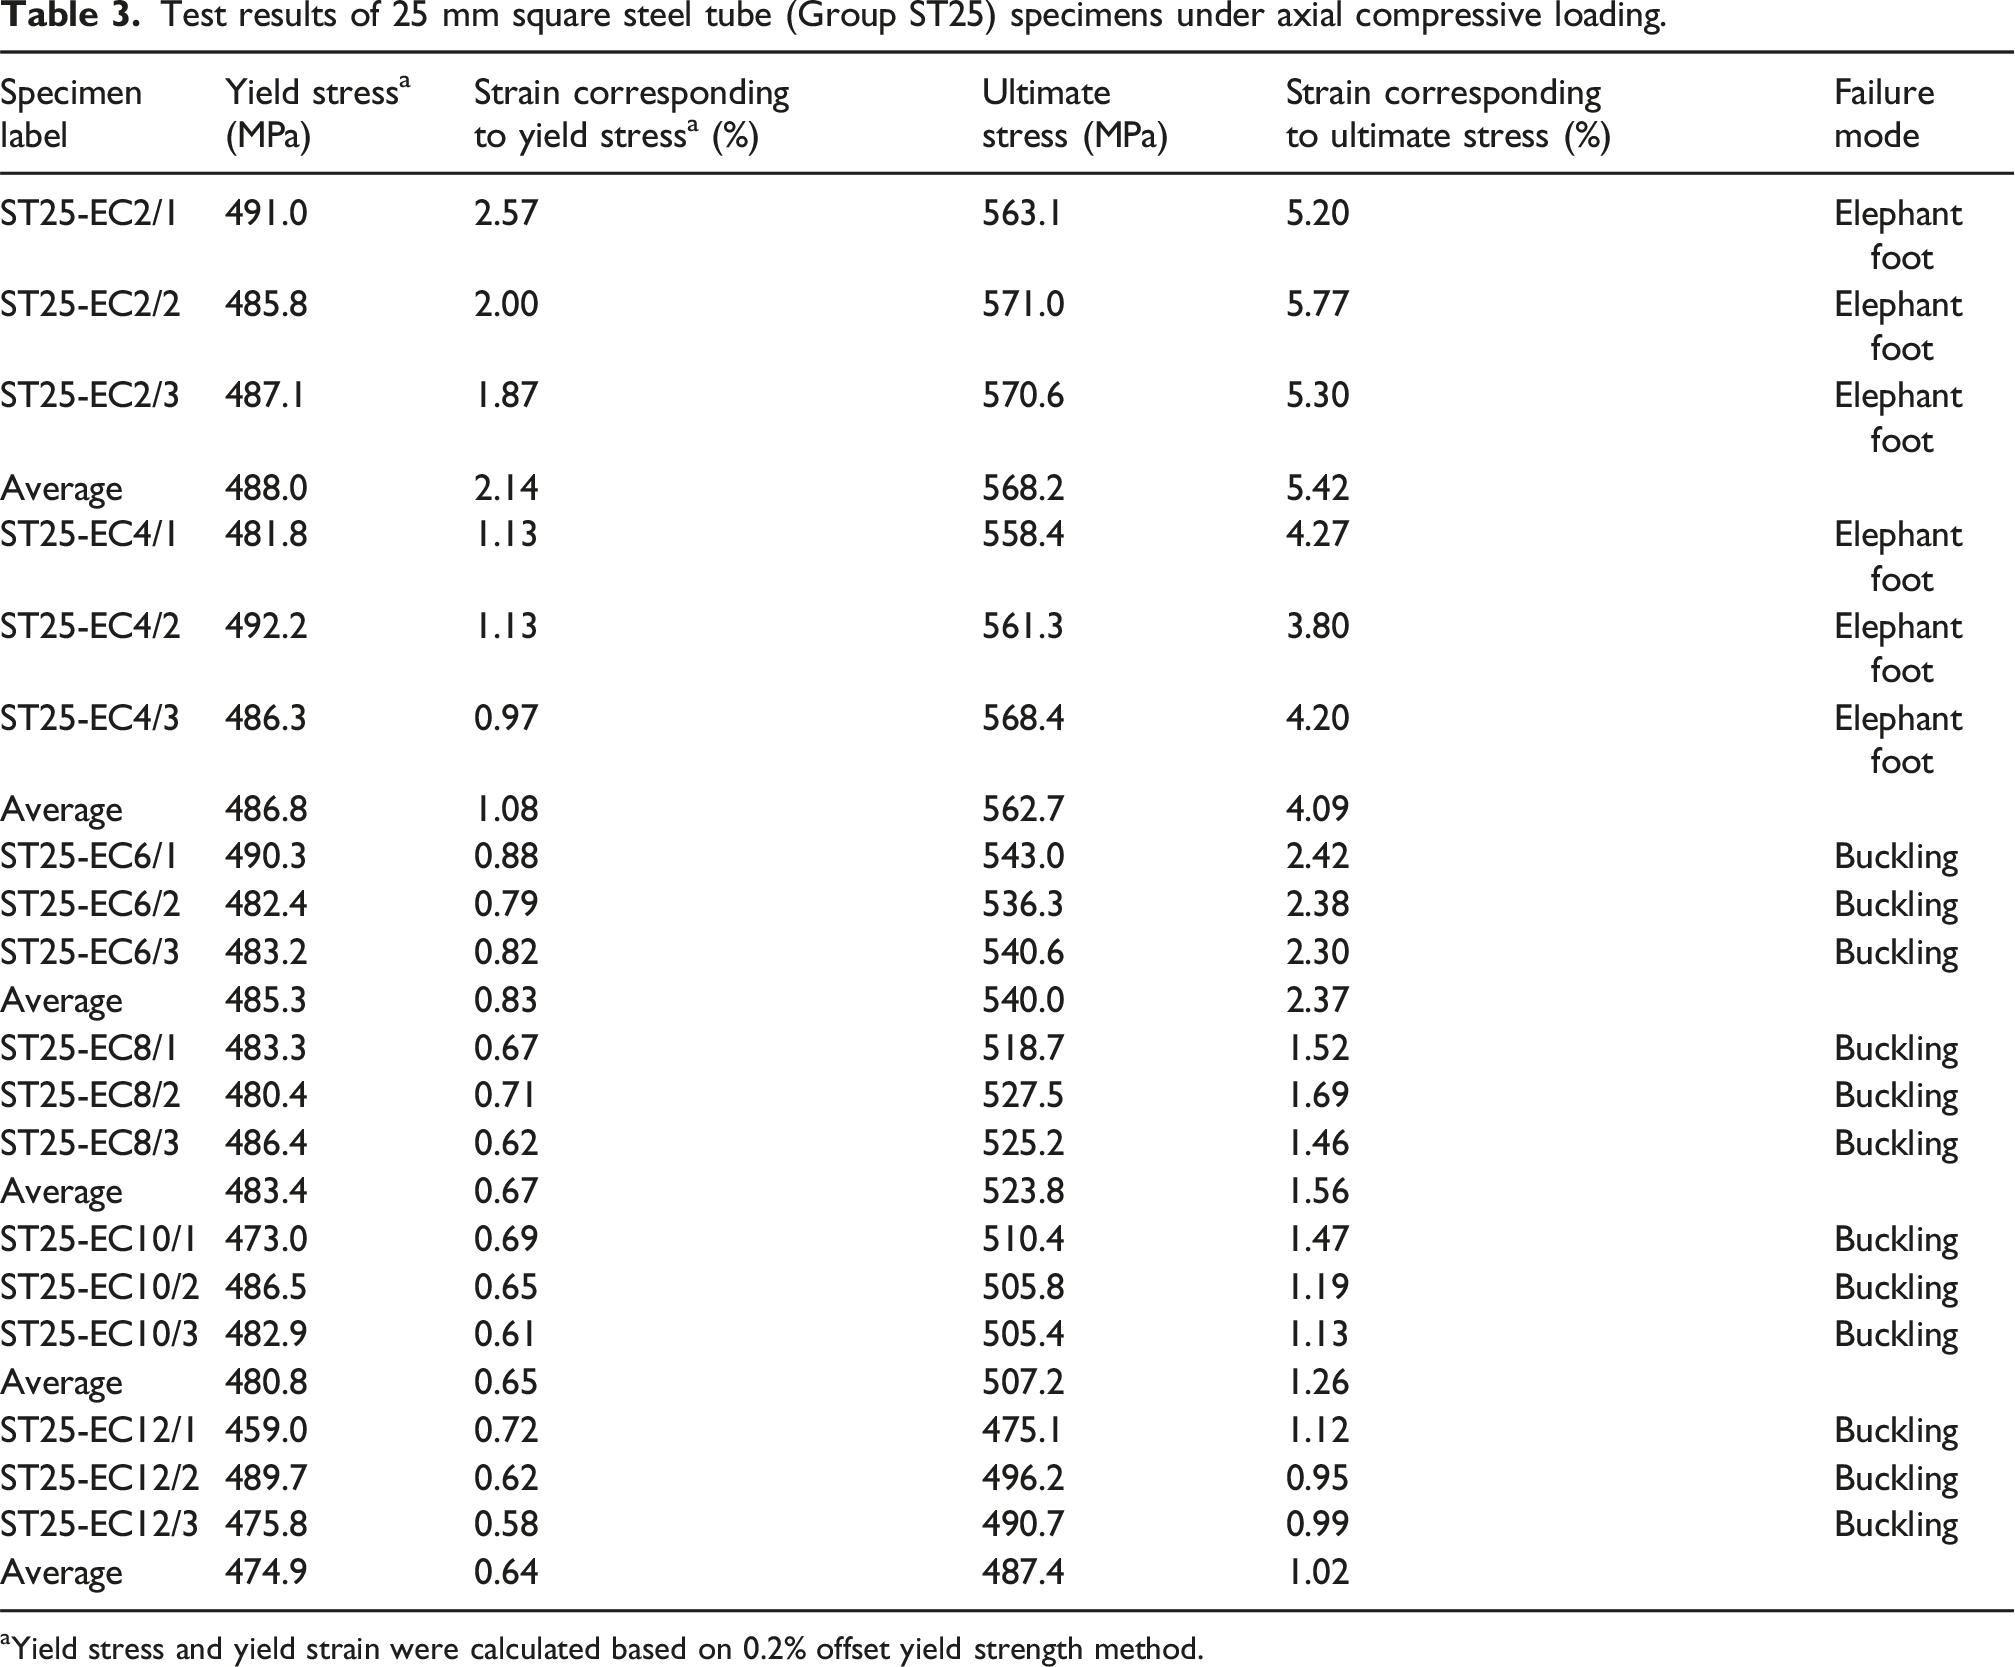
aYield stress and yield strain were calculated based on 0.2% offset yield strength method.
Test results of 30 mm square steel tube (Group ST30) specimens under axial compressive loading.
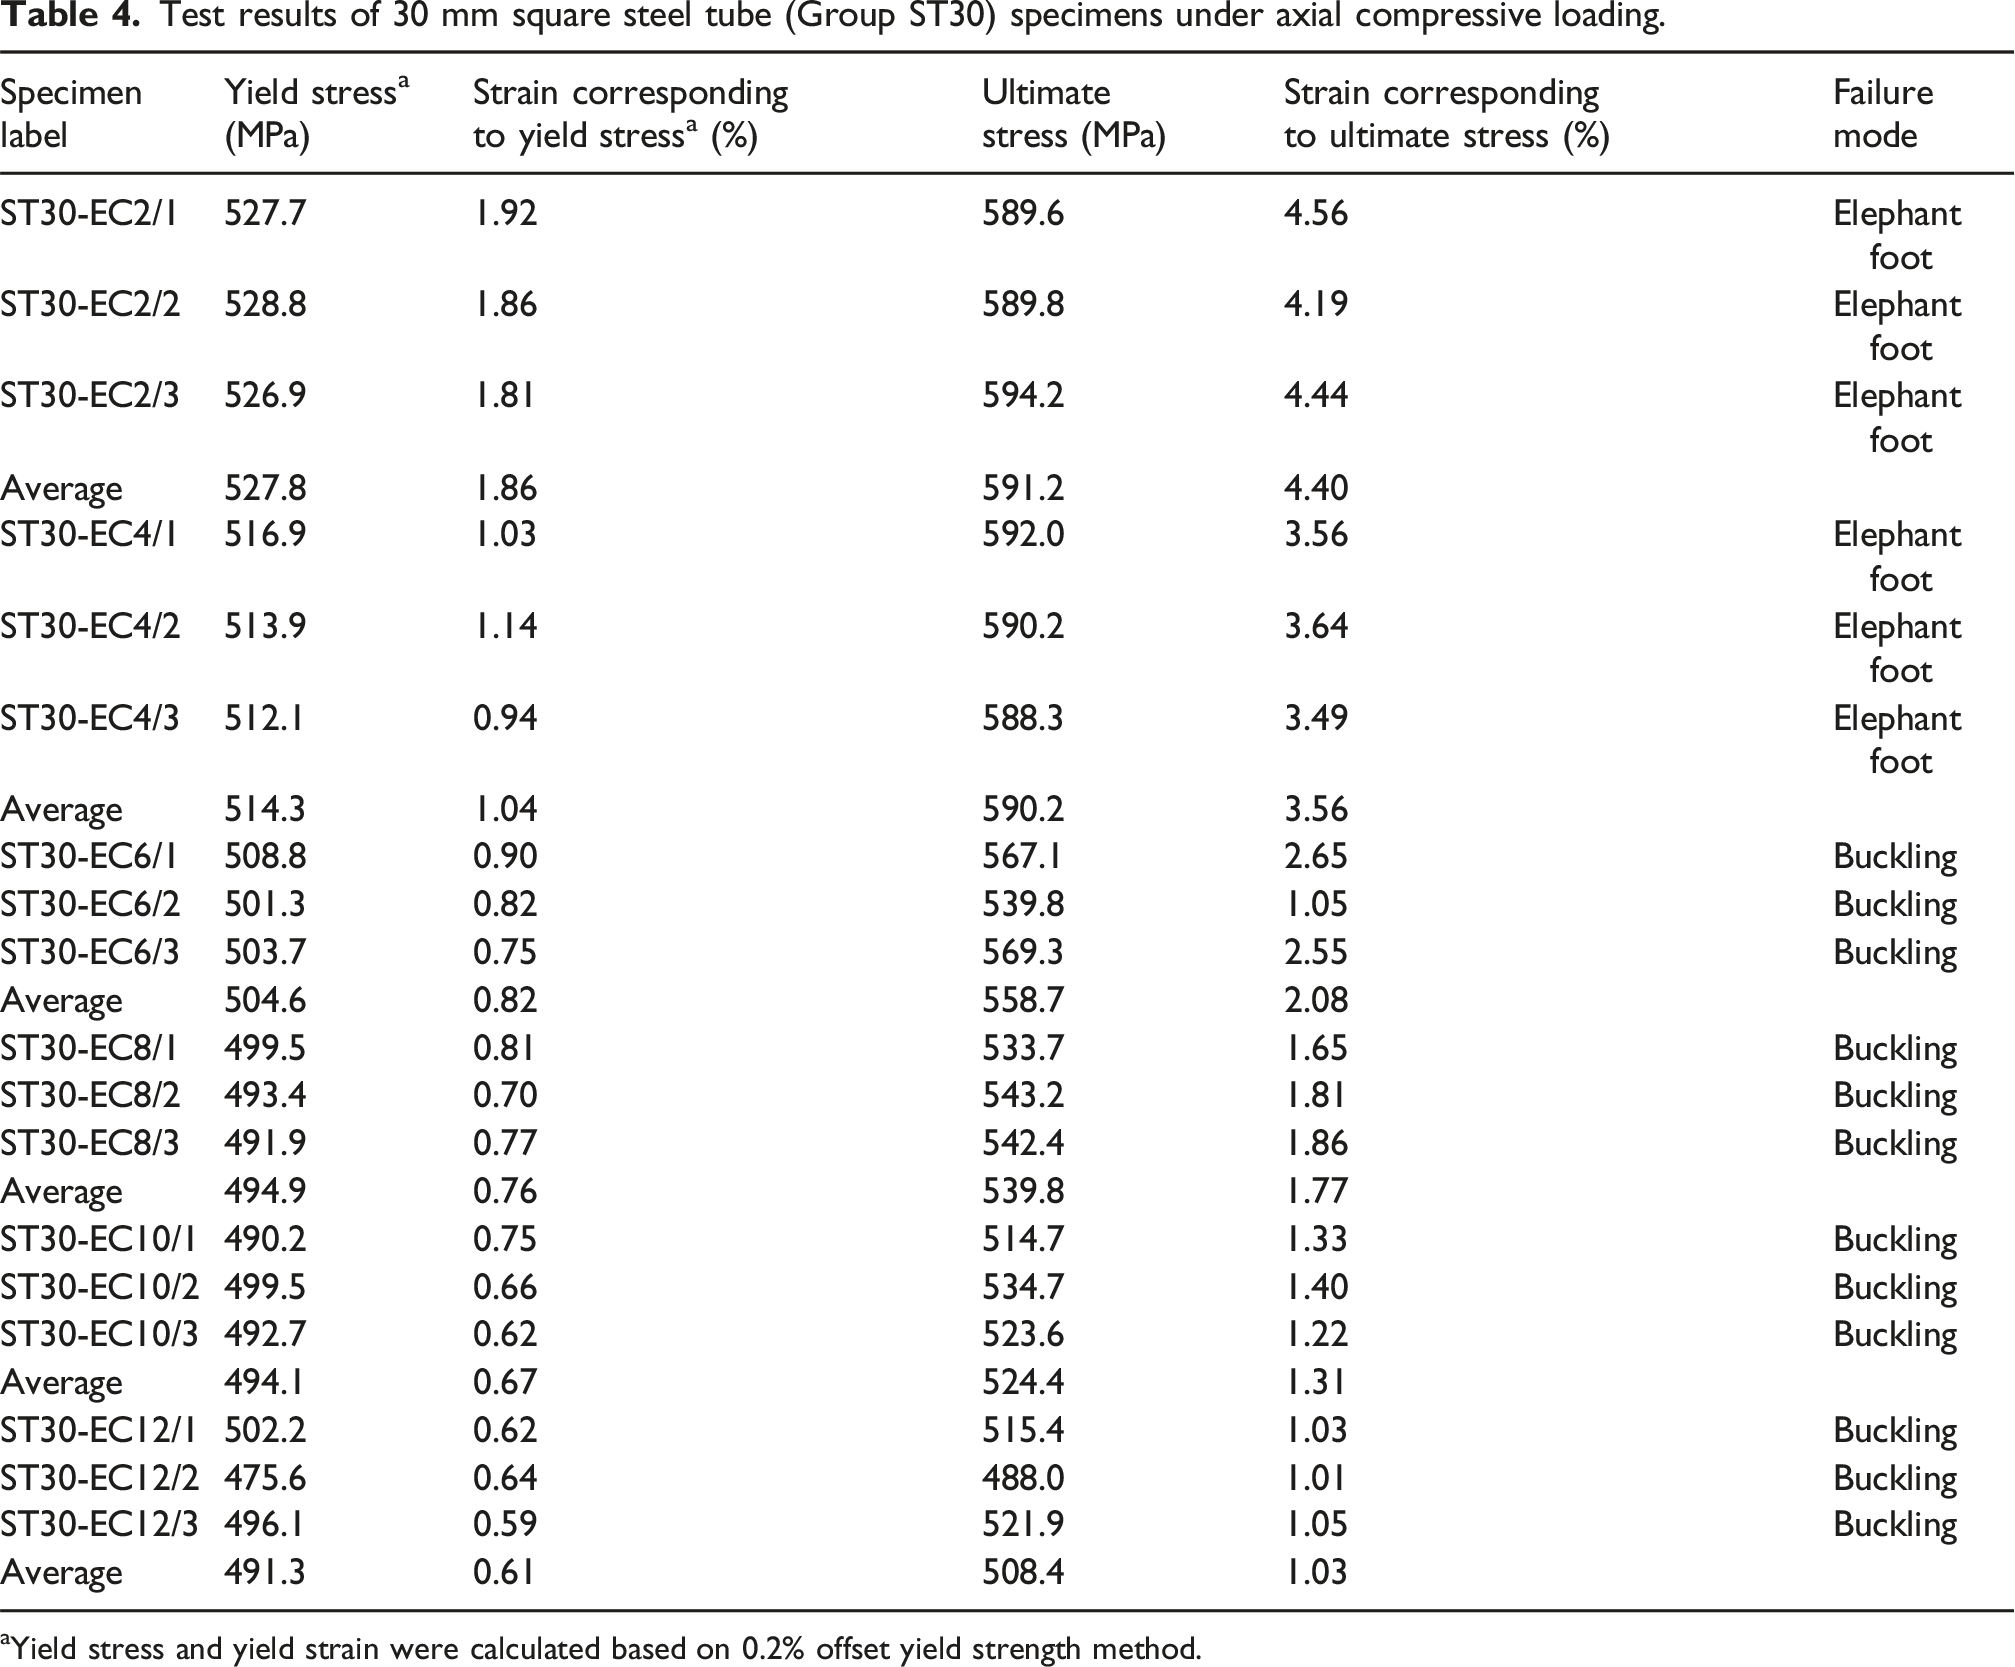
aYield stress and yield strain were calculated based on 0.2% offset yield strength method.
Test results of 35 mm square steel tube (Group ST35) specimens under axial compressive loading.
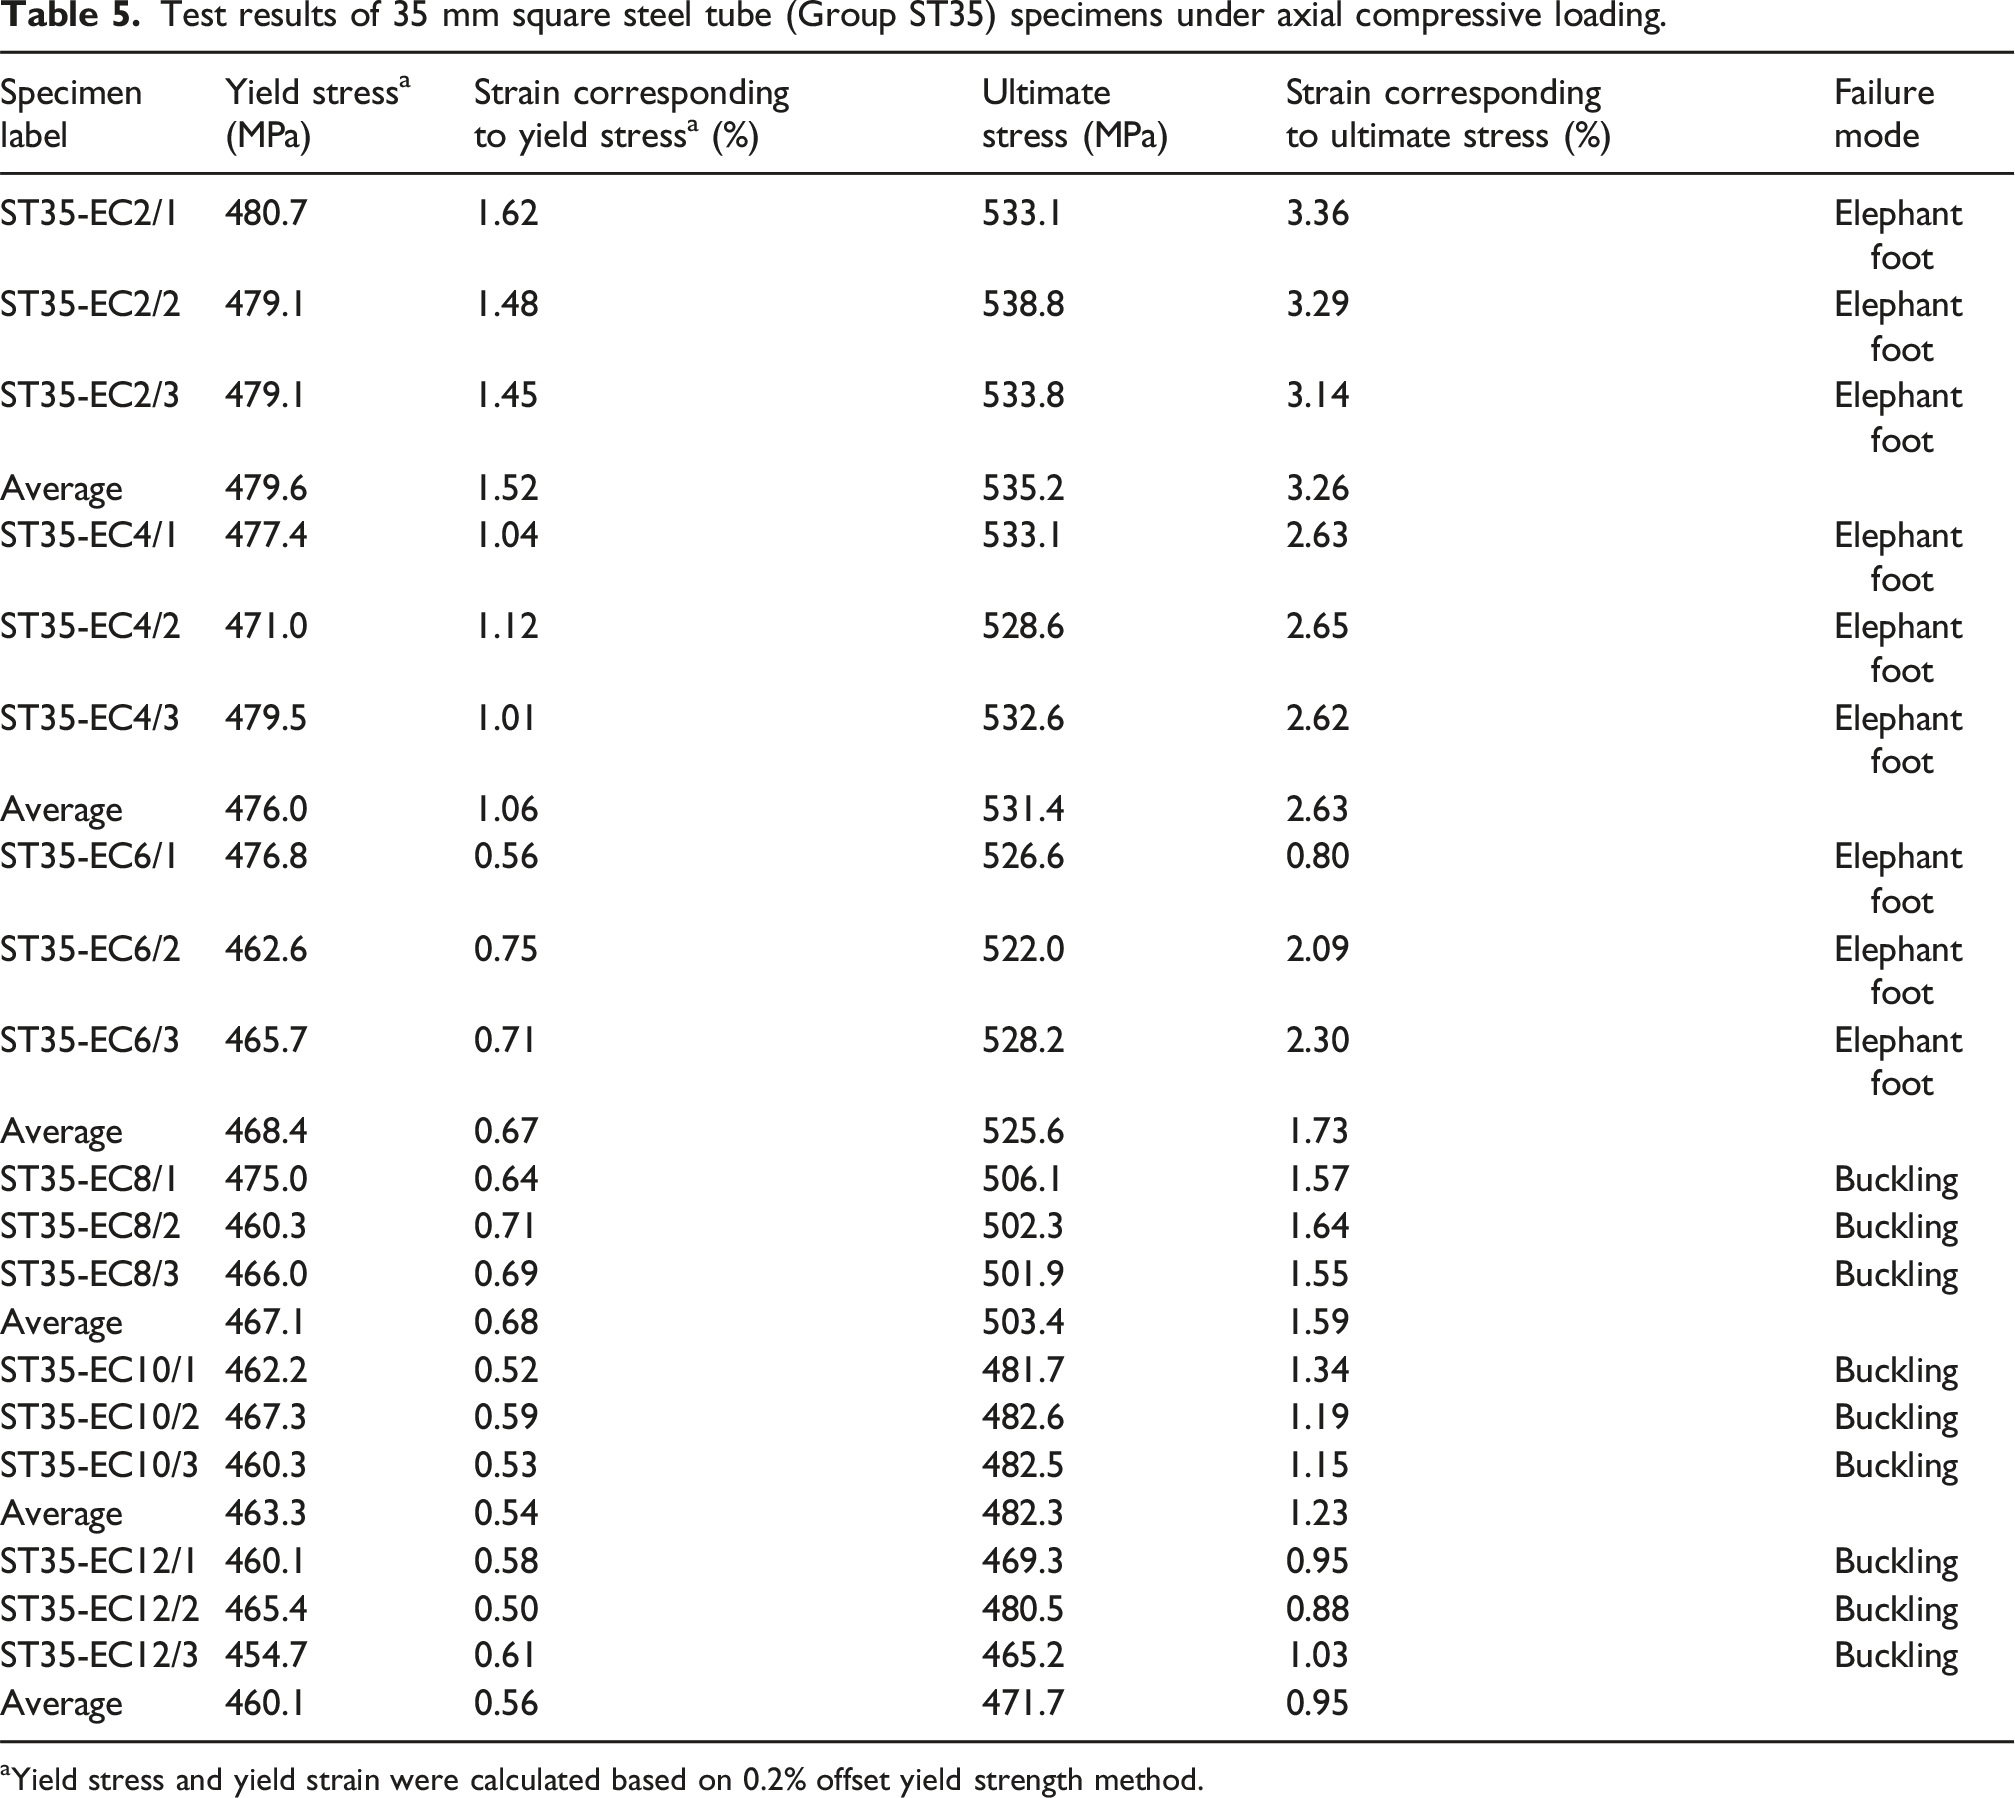
aYield stress and yield strain were calculated based on 0.2% offset yield strength method.
Instrumentation and testing
Tensile test
The tensile testing of all specimens was conducted using a 500 kN universal testing machine (UTM) in the Engineering High Bay Laboratory at the University of Wollongong, Australia. All the tensile tests were conducted according to ASTM standards (ASTM-A370, 2022). As per ASTM-A370 (2022), full size steel tube specimens can be used for tensile testing by using steel plugs at the ends of steel tubes. These steel plugs are recommended to protect the ends of the steel tubes from crushing and pressing due to the strong gripping of UTM jaws during the test. The design guidelines required to design and manufacture these metal plugs for circular steel tubes are given in the ASTM-A370 (2022). These guidelines were followed to manufacture steel plugs for square steel tubes in this study.
As per ASTM-A370 (2022), the length of the metal plug includes the gripping length of machine jaws and two times the inner dimension of the steel tube. A constant gripping length of 80 mm was maintained in accordance with the gripping depth of the machine jaws. The total length of the steel plug was the gripping length of 80 mm plus two times the inner dimension of each steel tube. For the better adjustment of these plugs in steel tubes, the cross-sectional dimensions of plugs were kept equal to the inner cross-sectional dimension of each steel tube specimen, i.e., 21 mm, 26 mm, and 31 mm squares for ST25, ST30, and ST35 specimens, respectively (Figure 1). Schematic drawing and physical models of metal plug for square steel tube specimens.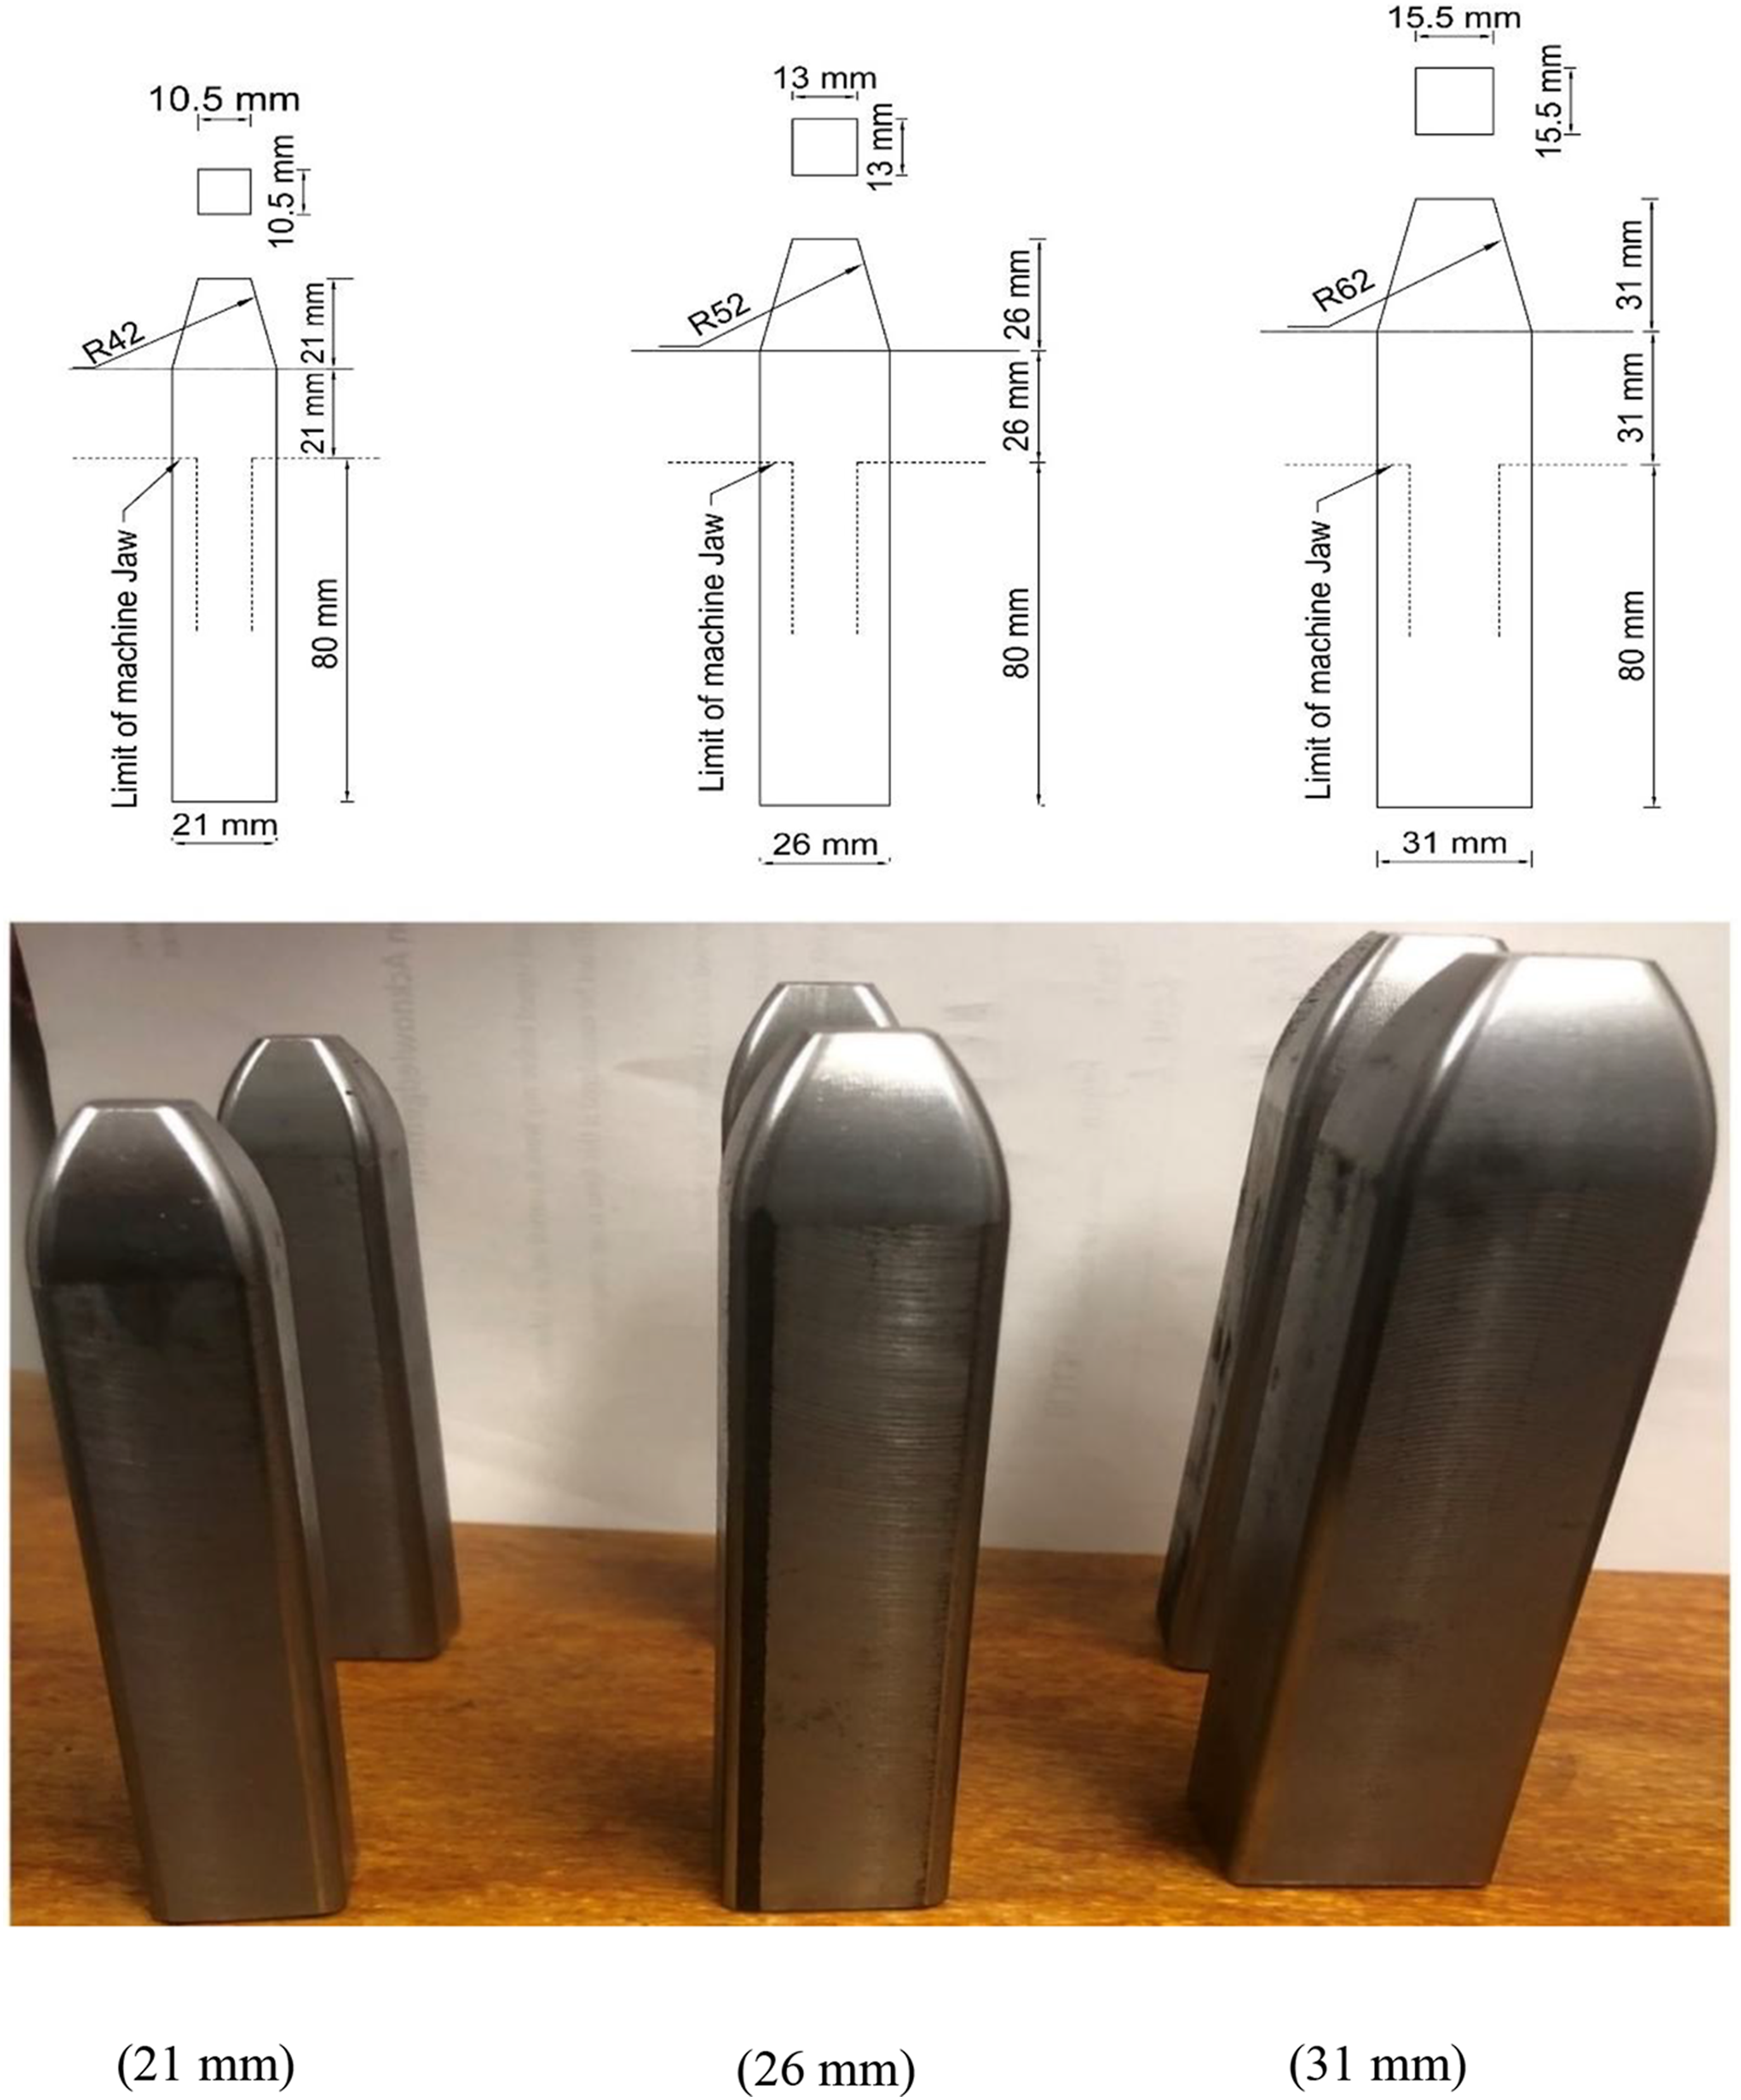
To prevent the development of stress concentrations in the specimens under tensile loading, ASTM-A370 (2022) recommends a smooth reduction in plug dimensions from the tip of the steel plug over a length equal to the dimension of the plug and at a radius equal to twice the cross-sectional dimension of the plug.
This smooth reduction was made over a depth equal to the cross-sectional dimension of the plug, i.e., 21 mm, 26 mm and 31 mm for ST25 mm, ST 30 mm, and 35 specimens, respectively. This was achieved by fixing the cross-sectional dimension of the plug tip at half of its original cross-sectional dimension, resulting in dimensions of 10.5 mm × 10.5 mm for 21 mm steel plug, 13 mm × 13 mm for 26 mm steel plug, and 15.5 mm × 15.5 mm for 31 mm steel plug (Figure 1). The smooth reduction from the tip of the plug was achieved at a radius equal to twice the cross-sectional dimension of the plug, 42 mm for 21 mm steel plug, 52 mm for 26 mm steel plug, and 62 mm for 31 mm steel plug (Figure 1).
The total length of the steel tube specimen depends on the gauge length and metal plug length recommended by ASTM-A370 (2022). Gauge length and metal plug lengths varied according to the cross-sectional dimension of the steel tube. The gauge length was four times the outer dimension of the steel tube i.e., 100 mm for ST25, 120 mm for ST30, and 140 mm for ST35 mm specimens. Adding the gauge length of each steel tube specimen to two times the metal plug length for the corresponding steel tube gave the full length of the steel tube specimens, i.e., 344 mm, 384 mm, and 424 mm for ST25, ST30, and ST35 specimens, respectively (Table 1). Table 1 shows the details of the full tube length, gauge length, gripping length, and metal plug length for the steel tube specimens.
Based on the different outer dimensions of square steel tubes, tensile testing was conducted using different openings of the machine jaws for compact gripping of the steel tubes (Figure 2). For the axial tensile testing of the steel tube specimens, displacement controlled loading was applied. The displacement controlled loading rate was maintained at 2 mm/min to keep the strain rate within limits specified by Australian Standard AS1391 (AS1391, 2020). A total of nine specimens, three for each cross-sectional dimension of the steel tube, were tested for tensile stress, and the average of test results was calculated and presented. 25 mm steel tube specimen fitted in the UTM jaws for axial tensile testing: (a) Schematic diagram and (b) Testing of specimen.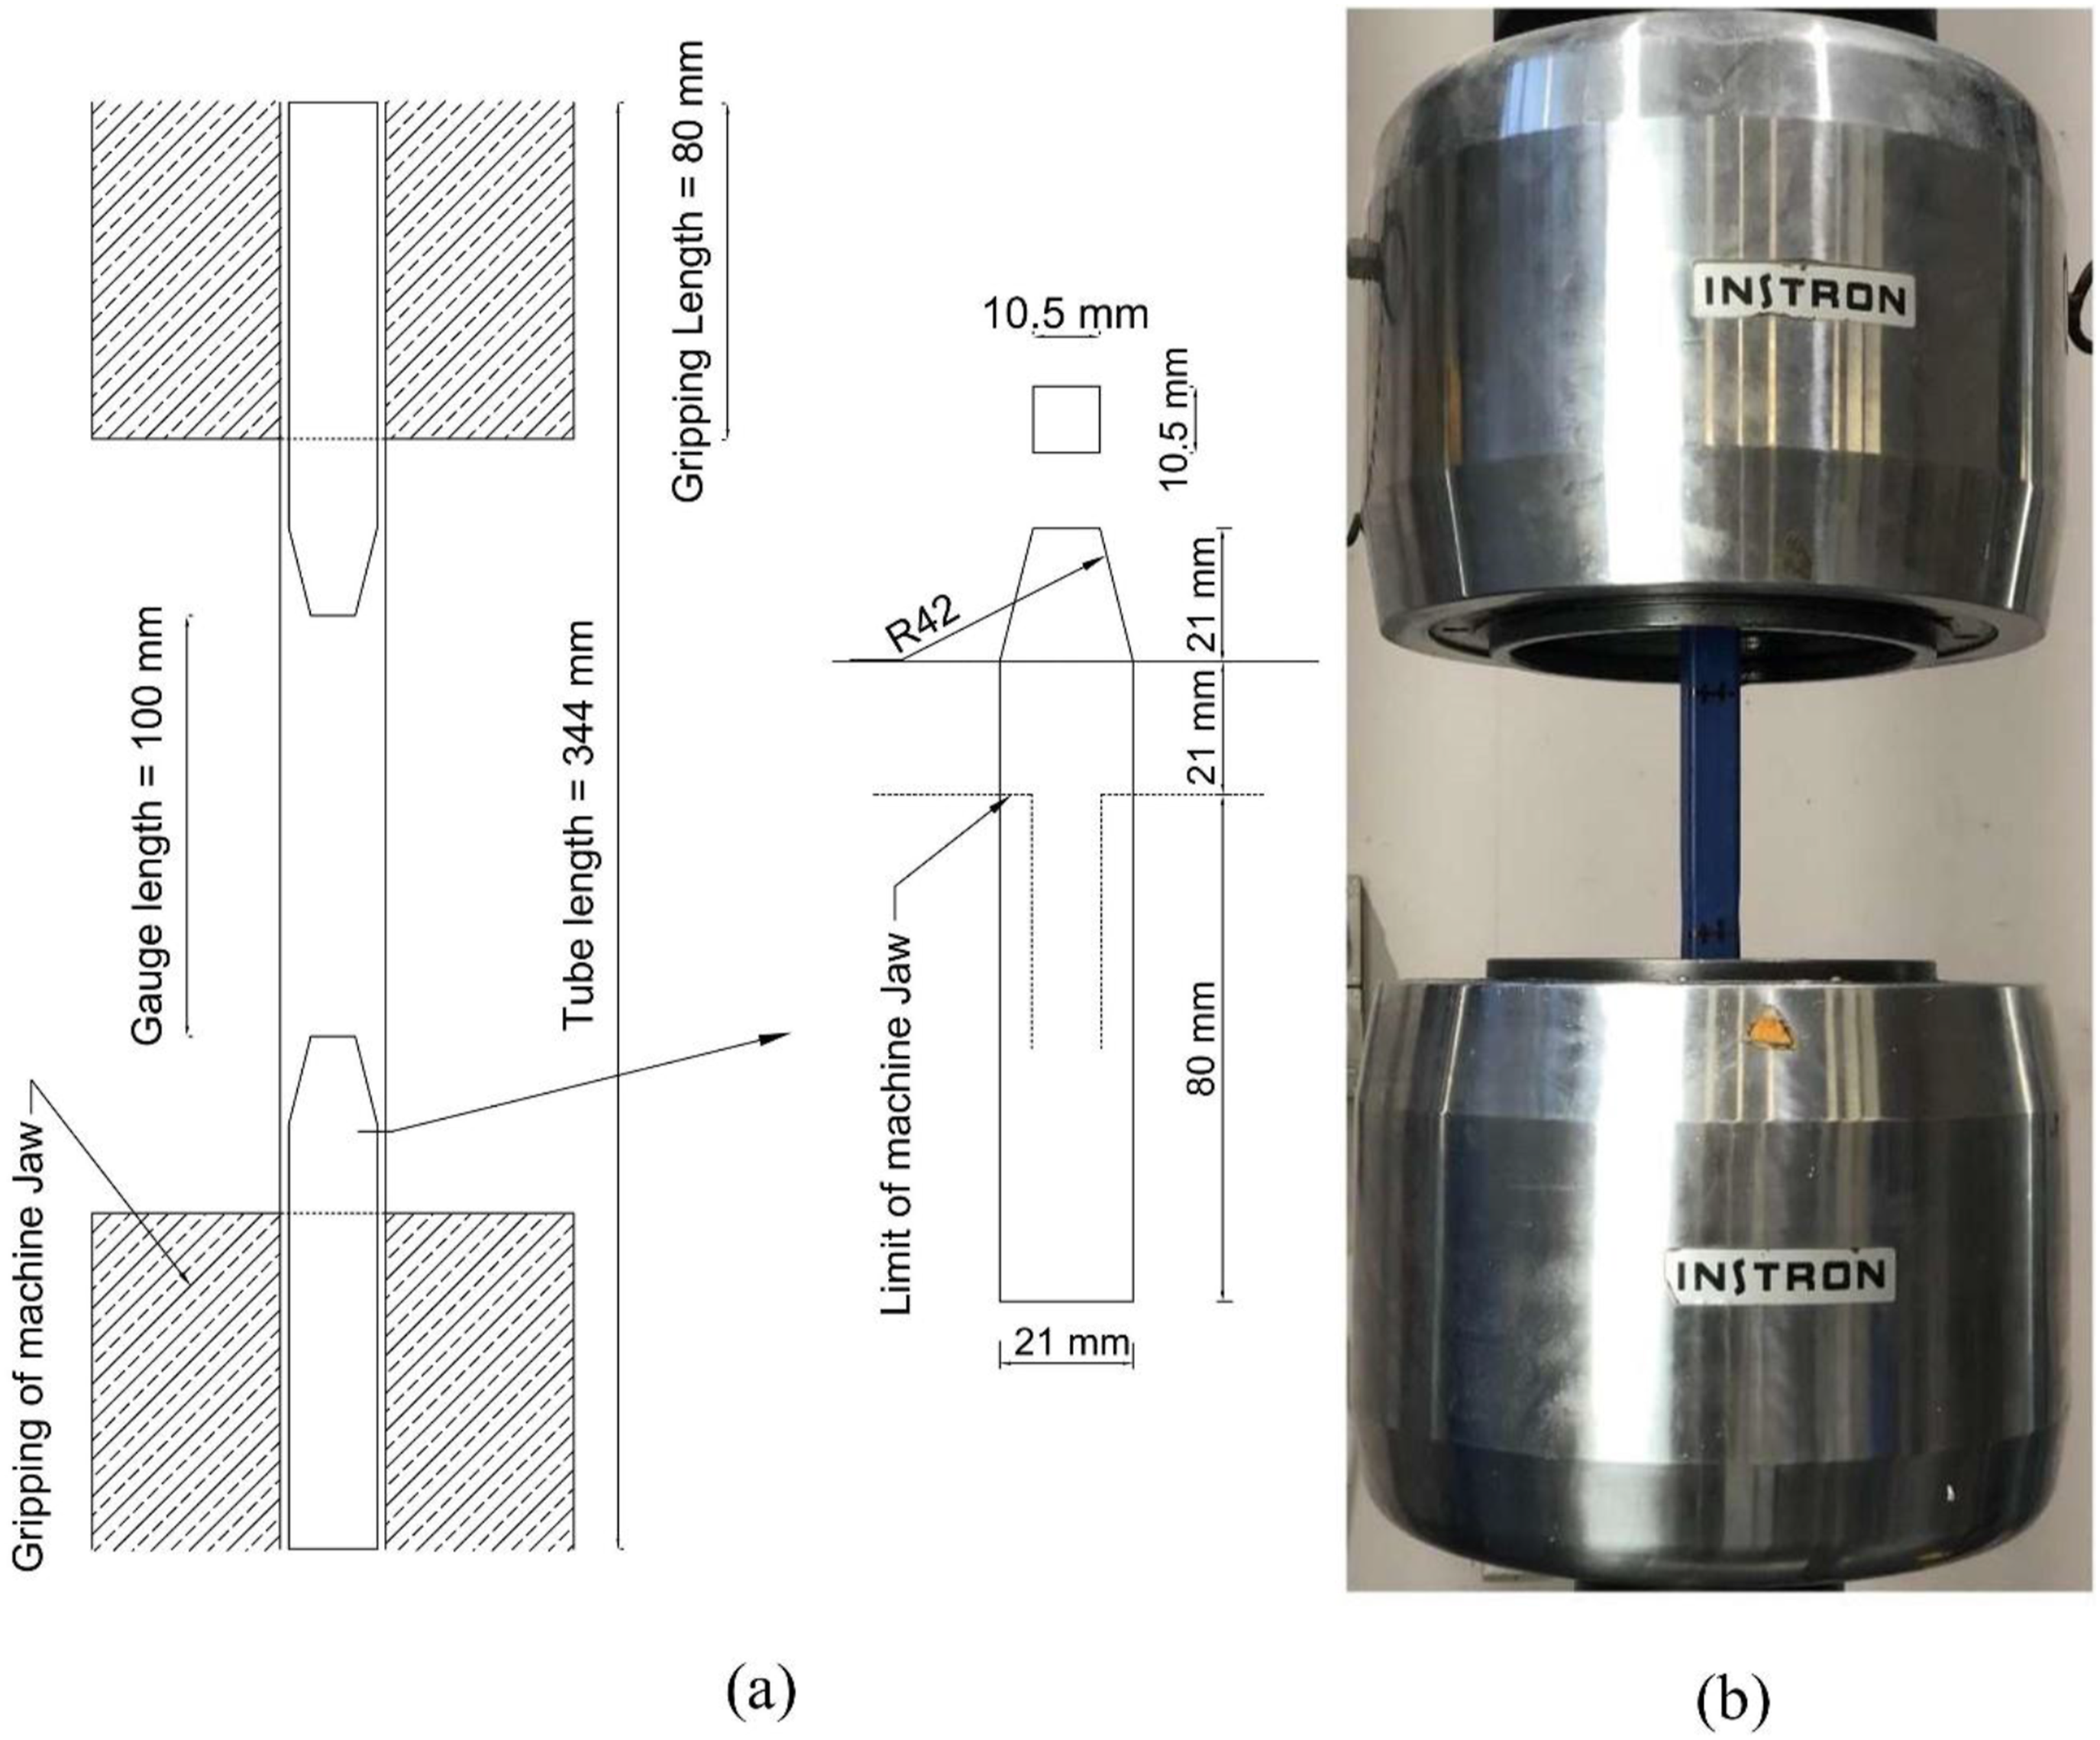
Compressive test
For the axial compressive testing, flat grips on the UTM were used. The lower grip of the UTM was aided with the additional support of a steel circular spherical seat. A flat steel plate was also used with the upper grip of the UTM. The spherical seat had a diameter of 120 mm and a depth of 52 mm, and the flat steel plate had dimensions of 200 mm × 300 mm with a thickness of 6 mm. The unique design of the spherical seat aided in accommodating any surface non-uniformity on the specimen during the application of compressive load. The characteristics of the spherical seat and placement of the flat steel plate ensured the uniform application of axial compressive load.
Figure 3 represents the schematic diagram of the testing setup at compression, including the test setup for three different dimensions of steel tube specimens before the application of axial compressive loading. The steel tube specimens were placed between the flat grips of the UTM, and axial compressive loading was applied through displacement controlled loading at the rate of 1 mm/min. The loading rate was decided by following the guidelines specified in AS4100 (2020). Alhussainy et al. (2017) also applied the same loading rate while testing the circular steel tubes under axial compression. A total of 54 specimens for three different cross-sectional dimensions of steel tubes with six different L/B ratios were tested under axial compression. Axial compression testing setup of square steel tube specimens: (a) schematic diagram of the testing setup (b) 25 mm square steel tube specimen, (c) 30 mm square steel tube specimen, and (d) 35 mm square steel tube specimen.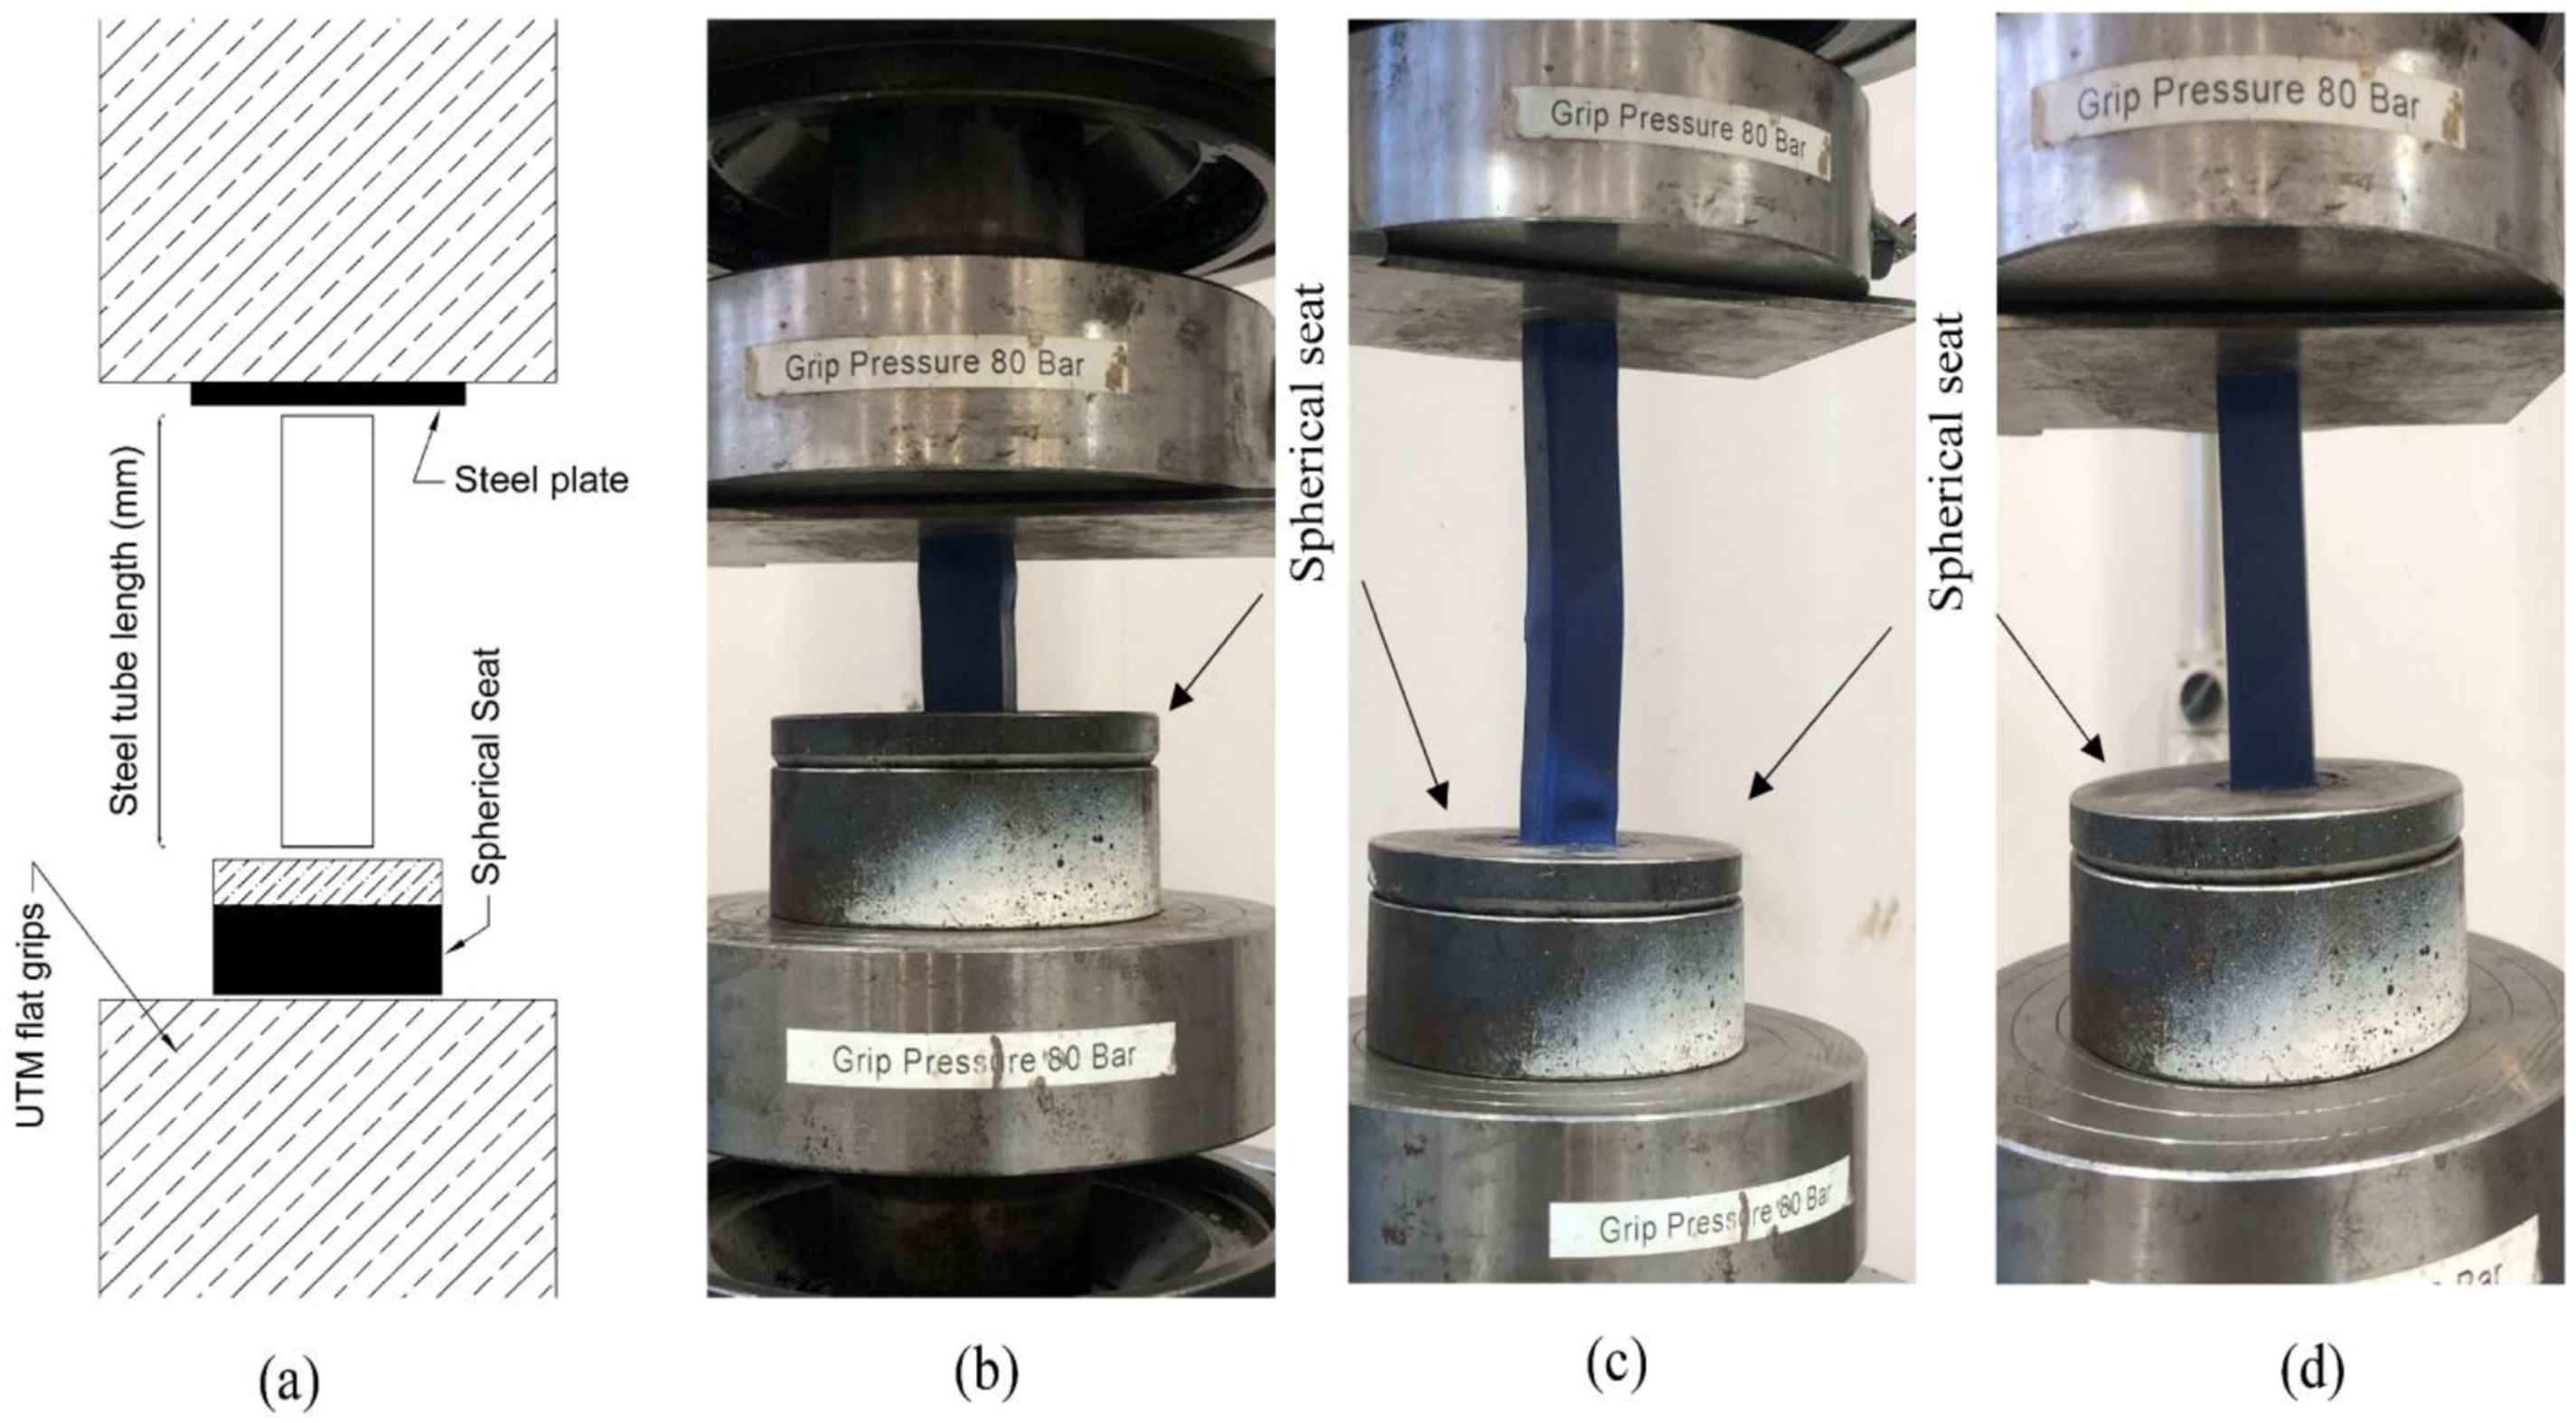
Results of tensile testing
Experimental test results of square steel tube specimens under axial tensile loading are reported in Table 2.
Three specimens for each cross-sectional dimension of square steel tubes, i.e., 25 mm, 30 mm, and 35 mm square tube specimens (Groups ST25, ST30 and ST35), were tested under axial tensile loading to determine the yield stress, ultimate stress, yield strain (corresponding to yield stress) and ultimate strain (corresponding to ultimate stress). It was noted from the stress-strain curve that there was no clearly identifiable yield point. Therefore, the yield stress and corresponding yield strain were calculated using the 0.2% offset yield strength method, as specified by ASTM-A370 (2022). In this method, a straight line is drawn parallel to the initial linear portion of the stress-strain curve, using the elastic modulus obtained from the linear region, but offset by a strain of 0.002 (0.2%). The offset value of 0.002 was adopted as it is commonly used in practice and was employed by Alhussainy et al. (2017) in a similar study involving small-diameter steel tubes tested under axial tension and compression. The intersection point of this offset line with the actual stress-strain curve is defined as the yield point, and the corresponding stress is taken as the 0.2% offset yield strength. Almost identical average values for yield stress and corresponding strain were observed across all steel tube specimens, which were 512 MPa, 515 MPa, and 510 MPa for ST25, ST30, and ST35 specimens, respectively. The almost identical average yield stress values for all tested specimens can be attributed to the uniformity of the materials and the relatively small difference in the cross-sectional dimensions of the square steel tubes. The variations in the cross-sectional dimensions (from 25 mm to 35 mm) did not significantly affect the yield strength of the steel tubes. The average yield strain for all three cross-sectional dimensions of steel tubes was 0.26 % (Table 2).
The failure of all tested specimens under tensile loading is illustrated in Figure 4. Figure 5 provides the stress-strain curves for all tested specimens. The ST30 specimens achieved the highest average ultimate stress and corresponding strain, while the ST25 specimens achieved the lowest overall average ultimate stress and corresponding strain. The average ultimate stress and corresponding strain of the ST30 specimens were 554 MPa and 7.0 %, respectively. The average ultimate stress and corresponding strain of the ST35 specimens were 541 MPa and 5.9%, respectively. Failure modes of square steel tube specimens under axial tension: (a) 25 mm square steel tube specimens, (b) 30 mm square steel tube specimens, and (c) 35 mm square steel tube specimens. Stress-strain behaviour of square steel tube specimens under axial tension: (a) 25 mm square steel tube specimens, (b) 30 mm square steel tube specimens, and (c) 35 mm square steel tube specimens.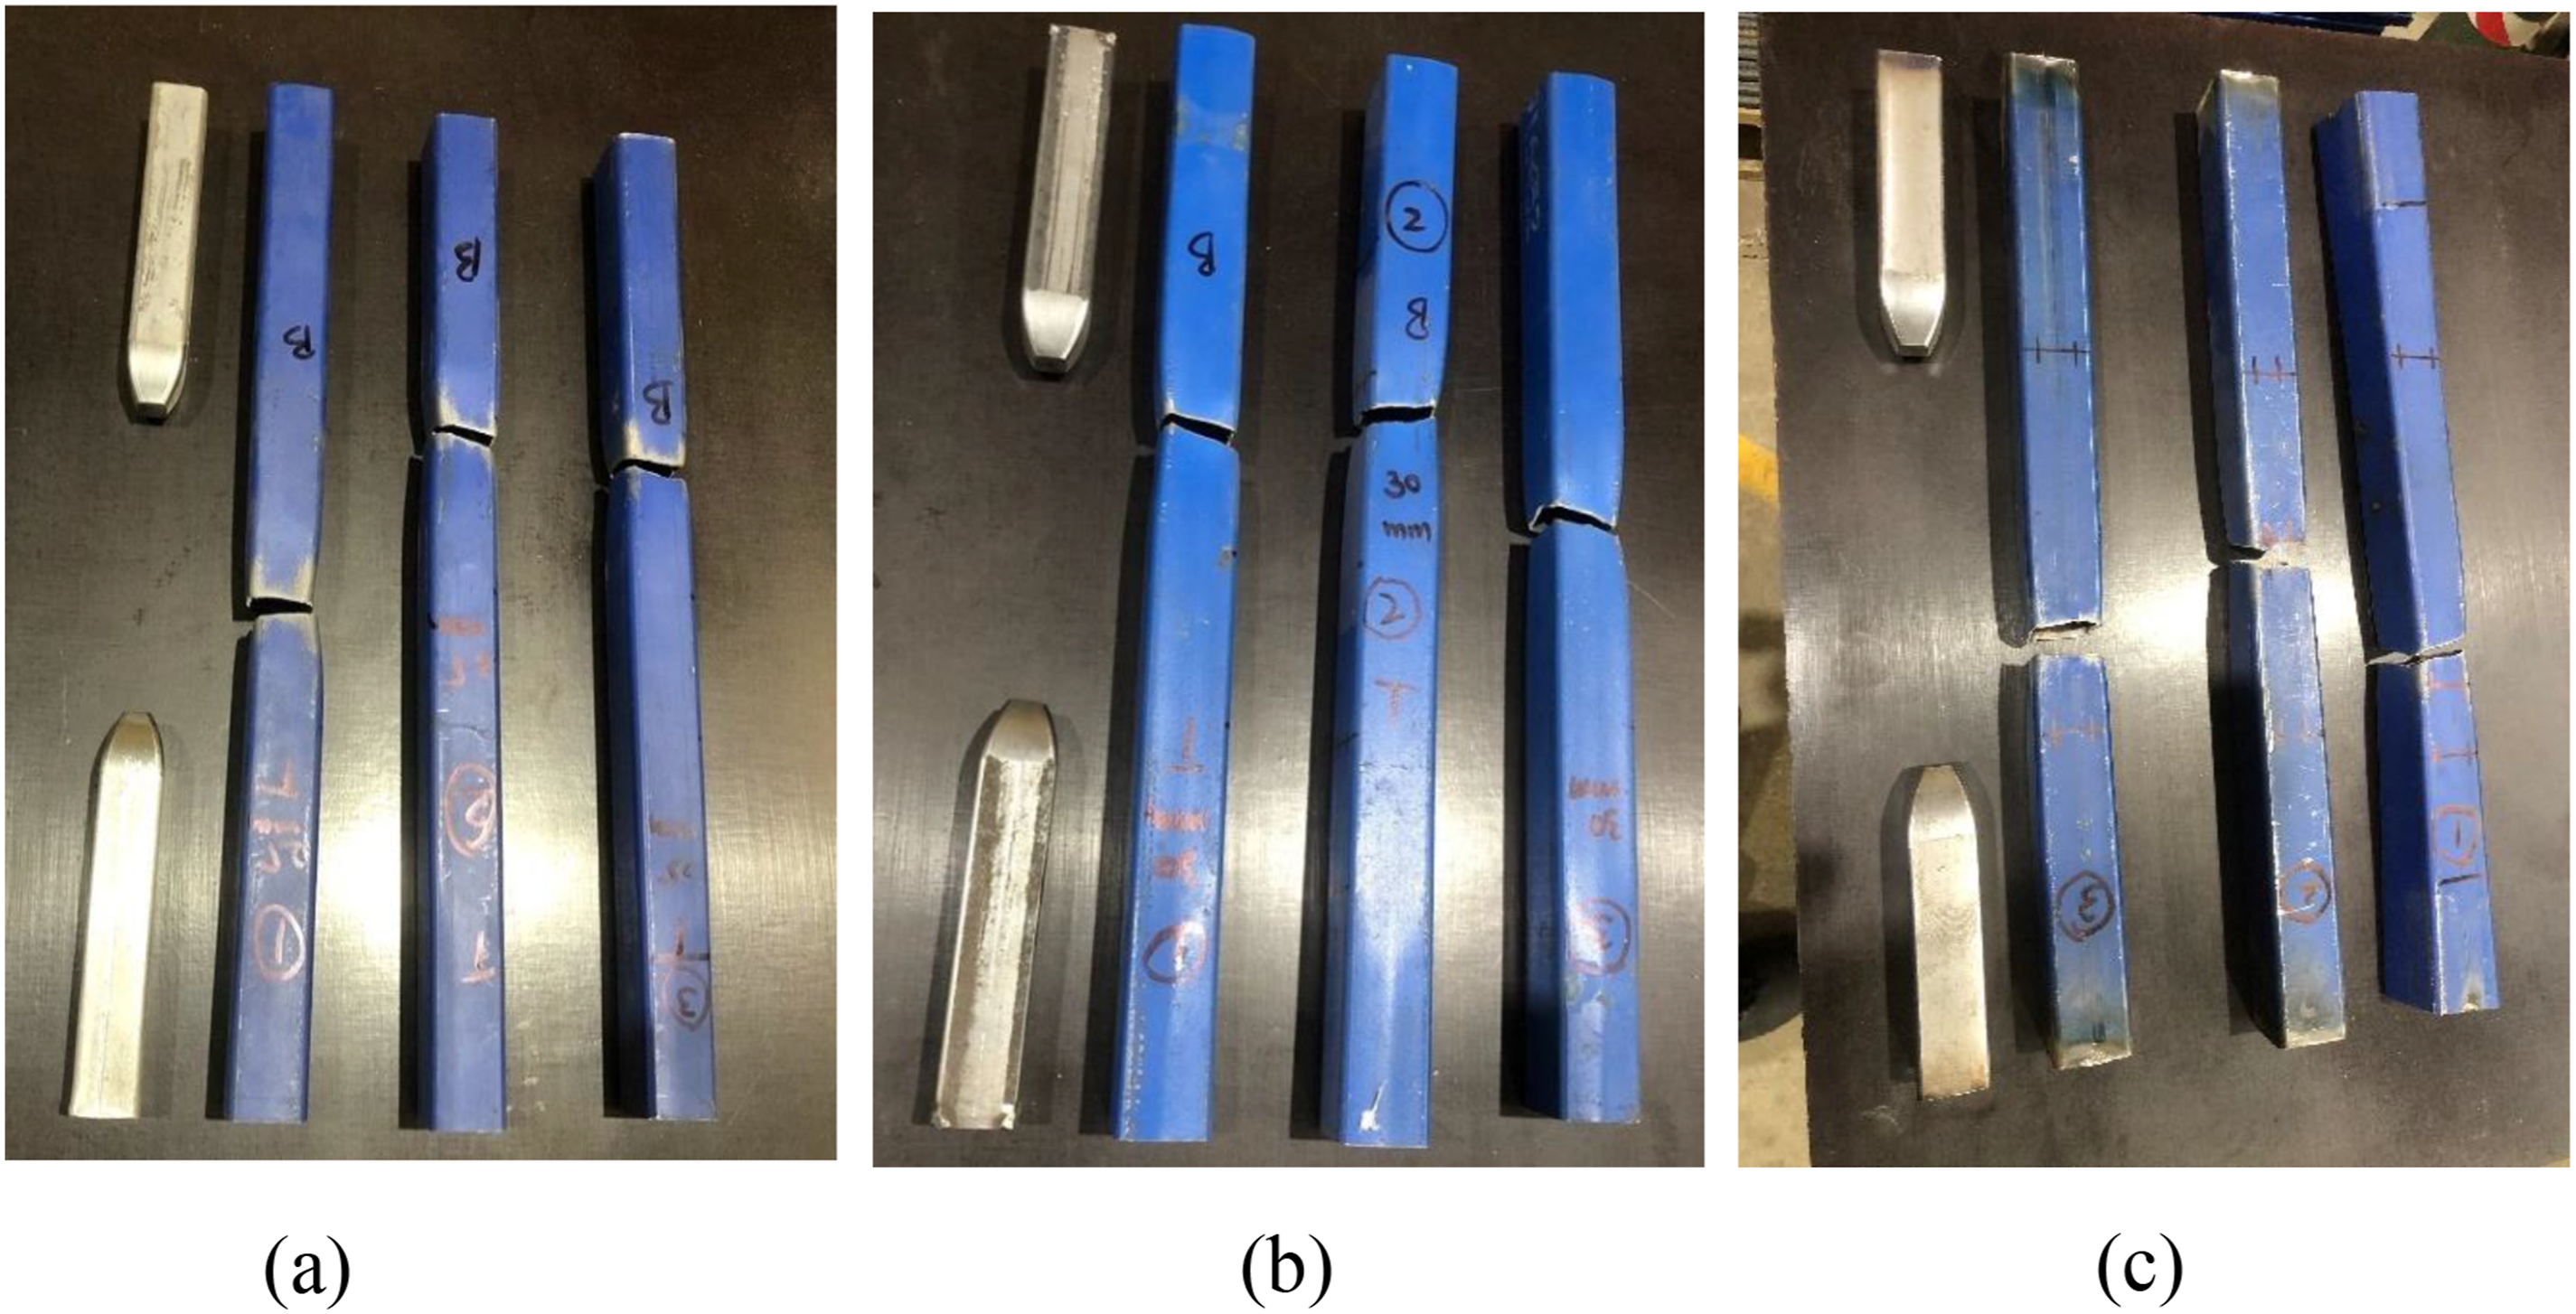
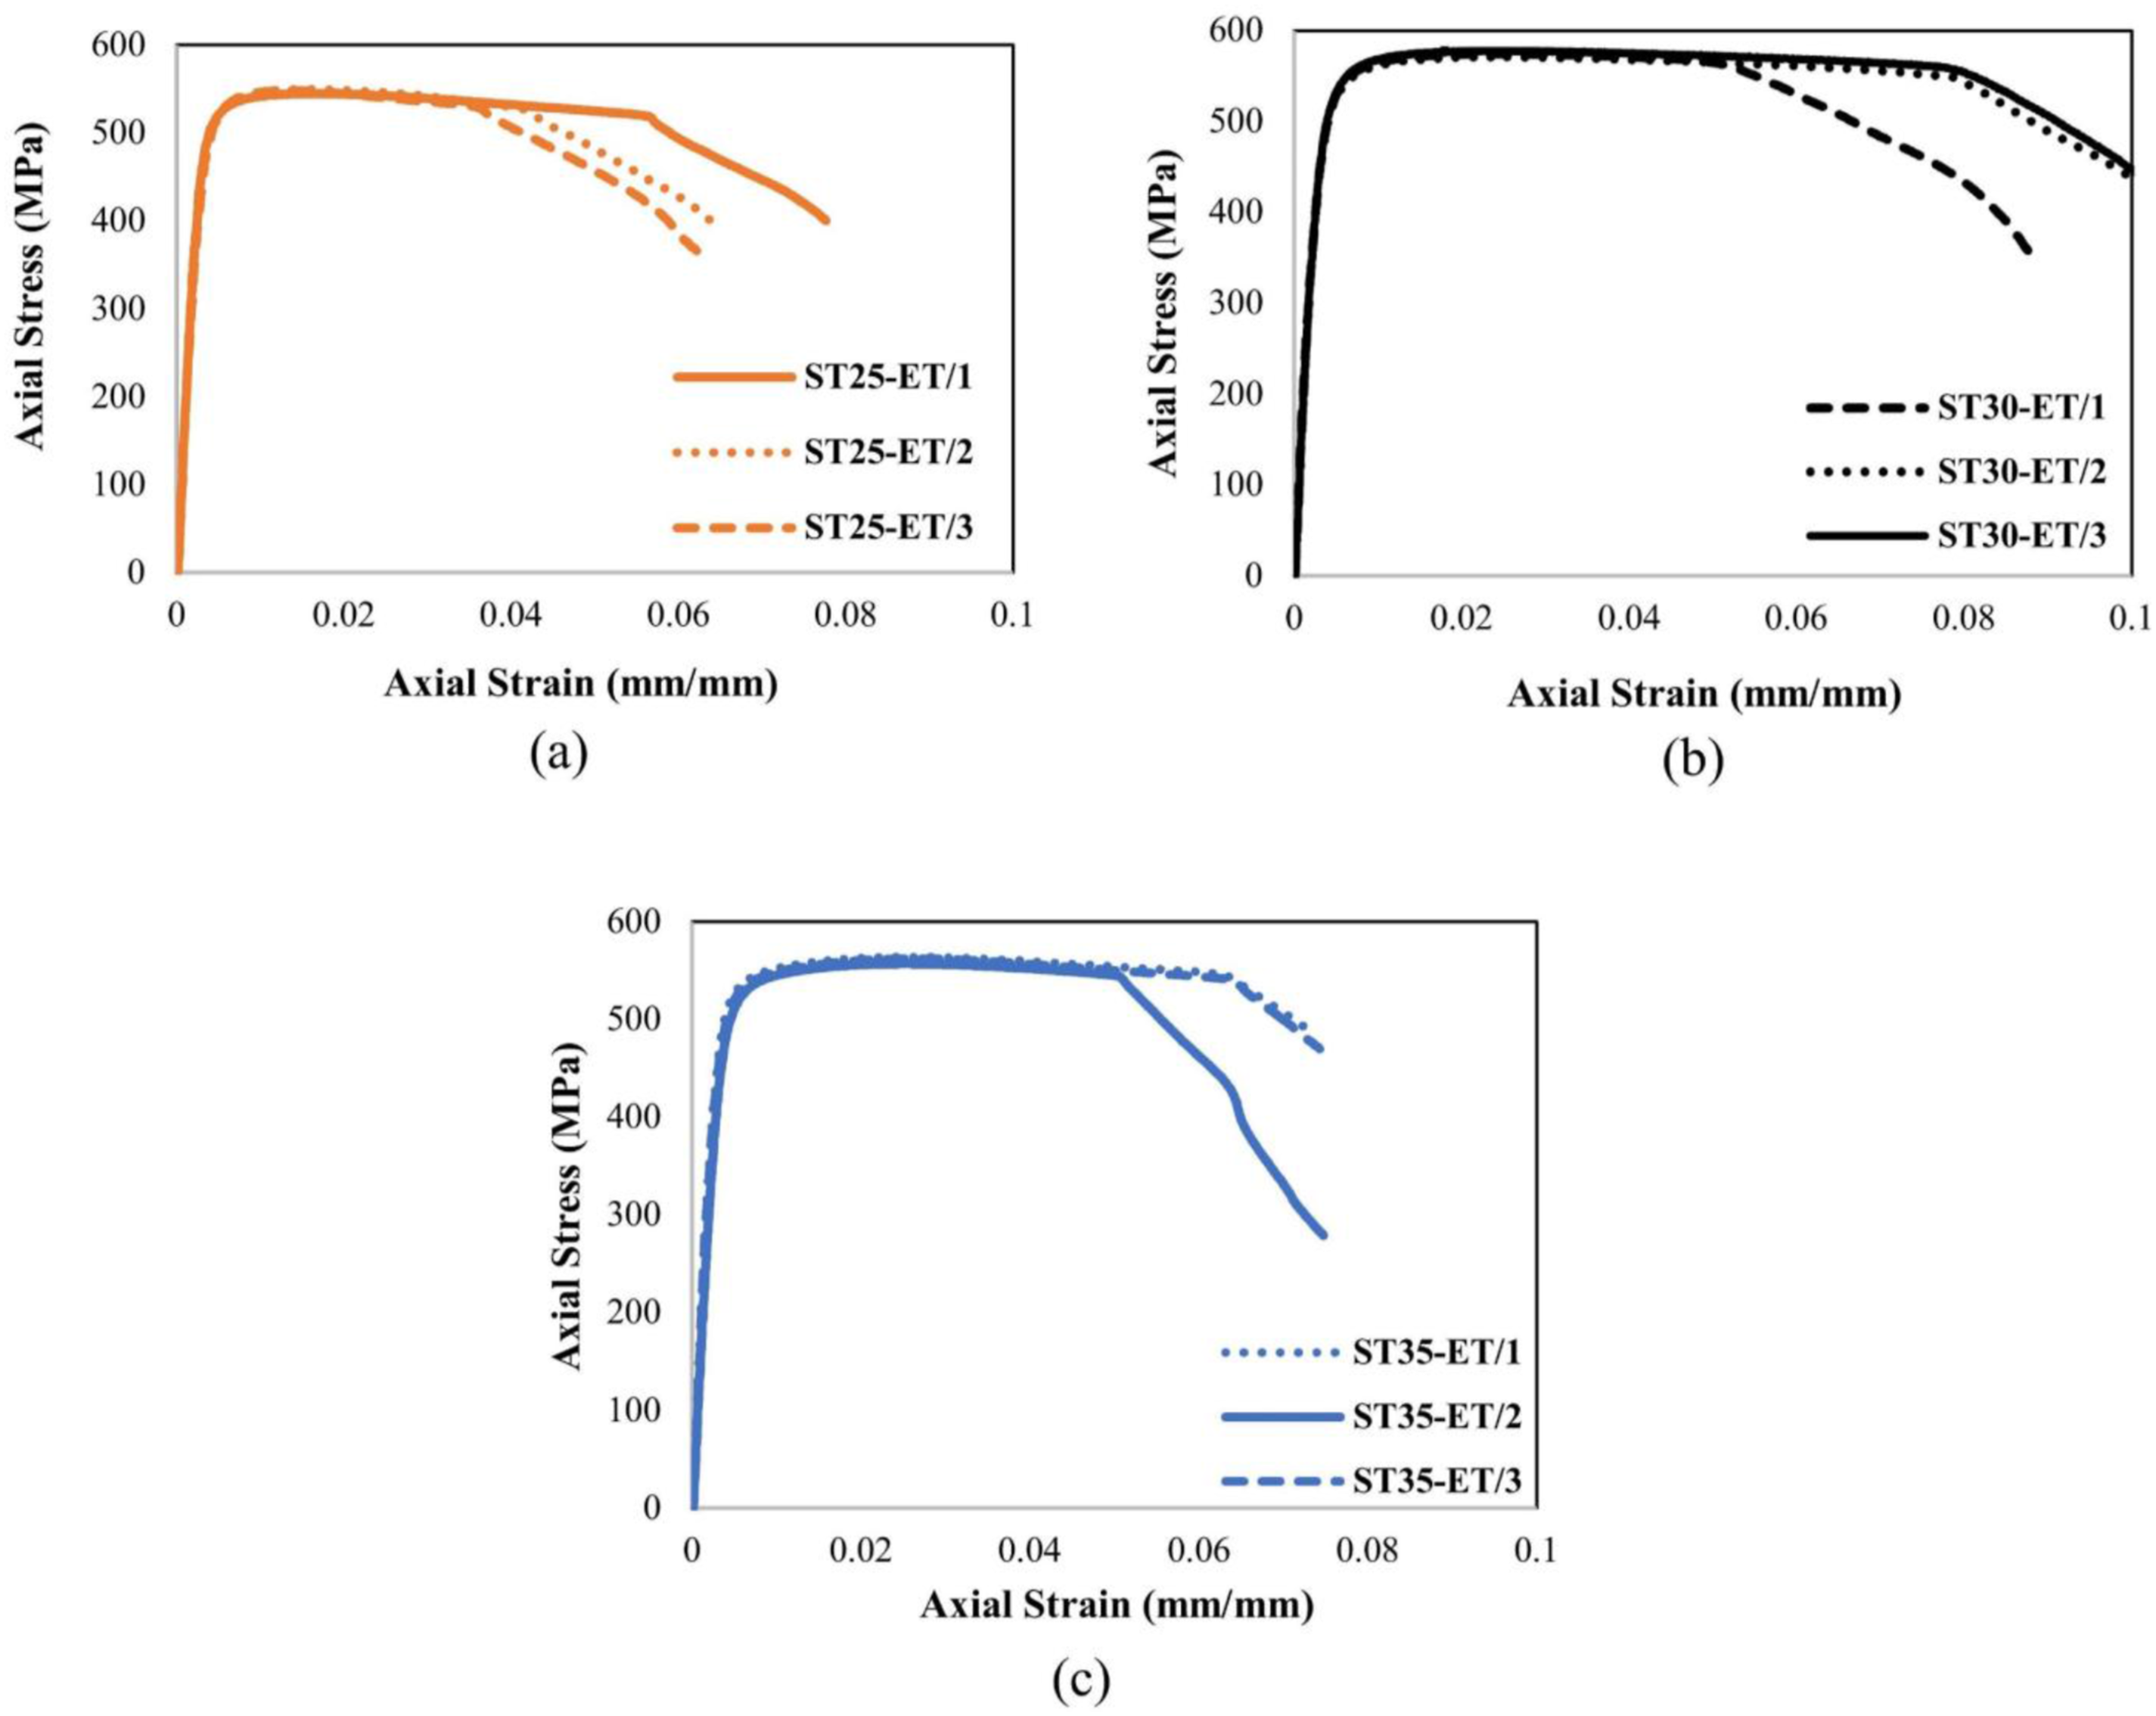
The lowest average ultimate stress and corresponding strain observed for ST25 specimens were 521 MPa and 4.47%, respectively. The difference in the ultimate stress and corresponding strain for all steel tube specimens was under 6.0%. The observed difference in average ultimate stress and corresponding strain among the tested specimens were influenced by the variation in the cross-sectional area, which affected the ability of the steel tubes to sustain applied loads before failure. Specimens with larger cross-sectional areas (ST30 and ST35) allowed for better load distribution, resulting in higher ultimate stresses.
In contrast, ST25 specimens exhibited lower ultimate stress due to their smaller cross-sectional area, which increased stress concentration during tensile testing. The average of Young’s modulus (E) for all three cross-sectional dimensions of steel tubes was calculated using stress-strain data from the tensile testing. It was noted that almost the same E value was obtained from calculations for all steel tube specimens i.e., 195 GPa, 197 GPa and 194 GPa for ST25, ST30, and ST35 specimens, respectively (Table 2). The consistency in the values of E across all specimens demonstrated that the elastic properties of the material were not affected by the cross-sectional dimensions.
Results of compressive testing
The response of square steel tube specimens to axial compression, for the evaluation of inelastic buckling behaviour, was found to be influenced by the length-to-width (L/B) ratio of the steel tube specimens. Based on the L/B ratios of steel tube specimens, two different failure modes were observed under compressive loadings. These two failure modes were the local buckling and global buckling failure of steel tube specimens. The local buckling failure occurred in the form of the elephant’s foot buckling, characterised by the outward expansion of the cross-section from one end of the specimens with lower L/B ratios. The use of flat plate restrained the free movement of the specimen at one end, leading to stress concentrations caused by minor misalignment or imperfections in the specimens. Specimens with lower L/B ratios experienced more prominent localised buckling at the restrained end due to their shorter lengths and stress concentrations imposed by the end restrains. Theofanous et al. (2009) and Li et al. (2016) also discussed the effects of end restraints in compression testing and concluded that end restraints significantly affected the buckling performance of specimens, leading to localised buckling at the restrained end. The global failure occurred in the form of the bending of steel tube specimens between two ends. The global buckling observed in the specimens with higher L/B ratios was due to the longer unsupported length, which allowed the tubes to deform along their entire length under compressive load. As the length increased, the bending stiffness of the tubes decreased, making them more vulnerable to global instability, and ultimately resulting in global buckling. Figure 6 shows both failure modes observed during the testing of the square steel tube specimens. The response of all steel tube specimens under axial compressive loading is reported in Tables 3–5. Failure modes observed in compressive testing based on L/B ratio: (a) Local Buckling and (b) Global Buckling.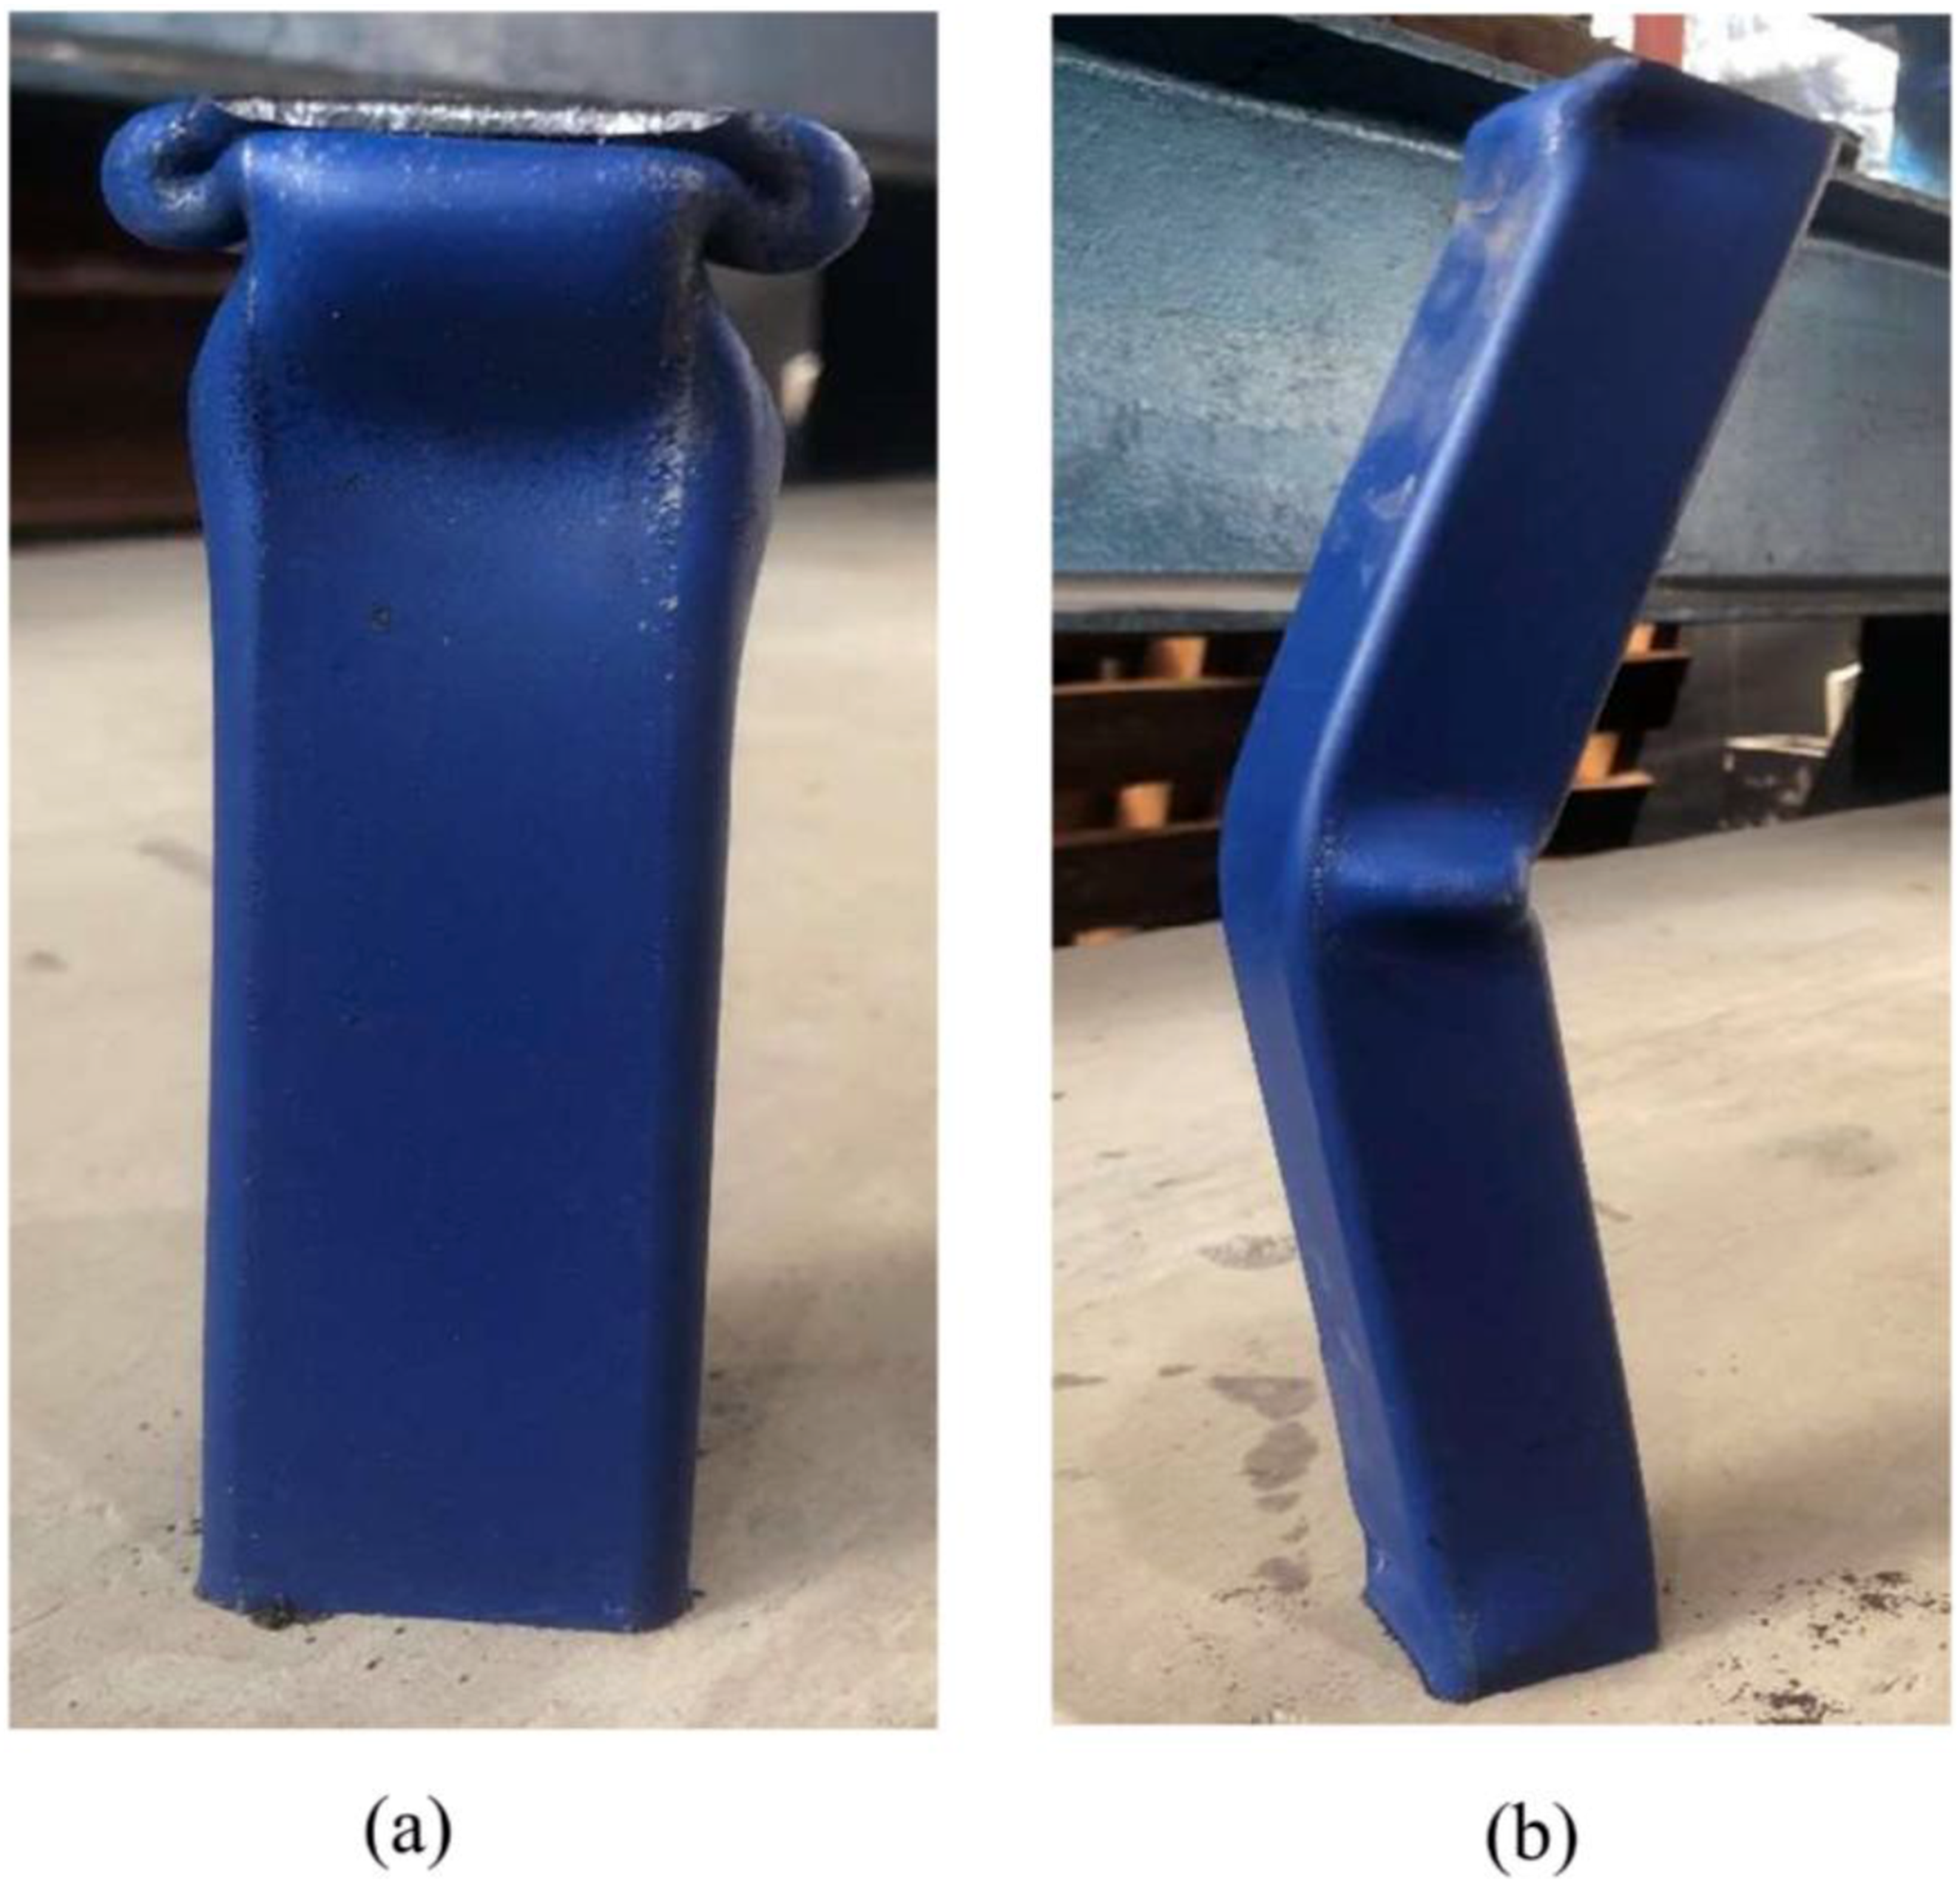
Effect of L/B ratio on the compression behaviour of steel tubes
The effect of L/B ratio on the compression behaviour of square steel tube specimens was observed by testing three different dimensions of steel tube specimens i.e., 25 mm, 30 mm, and 35 mm square tube specimens (Groups ST25, ST30 and ST35) with six different L/B ratios ranging from 2 to 12 under axial compressive loading. From the outcome of compressive testing, it was observed that for groups ST25, ST30 and ST35 specimens, the yield point at which the material changes from elastic to plastic was not clear in the stress-strain response. Therefore, the 0.2% offset yield strength method, as outlined in ASTM-A370 (2022), was adopted to distinguish the elastic and plastic regions and yield stress values corresponding to the 0.2% plastic strain for each specimen
25 mm square steel tube
Axial compression test results for 25 mm square steel tube specimens (Group ST25) having six different L/B ratios ranging from 2 to 12 are reported in Table 3. The results include yield stress and corresponding strain, ultimate stress and corresponding strain and the observed failure modes. Results reported in Table 3 were derived from the stress-strain curve obtained from the experimental data of axial compression tests. For each L/B ratio, three specimens were tested, and three stress-strain curves are presented for each steel tube specimen. It was observed from stress-strain curves that all three specimens for each L/B ratio exhibited very similar stress-strain behaviour.
Figure 7 illustrates the failure modes of ST25 specimens under axial compression for all six L/B ratios. For Group ST25 specimens, elephant’s foot buckling occurred at L/B ratios of 2 and 4, shifting to global failure for L/B ratio ≥4. Considering the change in failure modes with different L/B ratios of Group ST25 specimens, and to avoid their global buckling, it is advisable to keep the L/B ratio under 4 in structural applications. Typical failure modes of 25 mm square steel tube specimens under compressive loading with different L/B ratios: (a) Global failure in the form of buckling and (b) Local failure in the form of elephant’s foot buckling.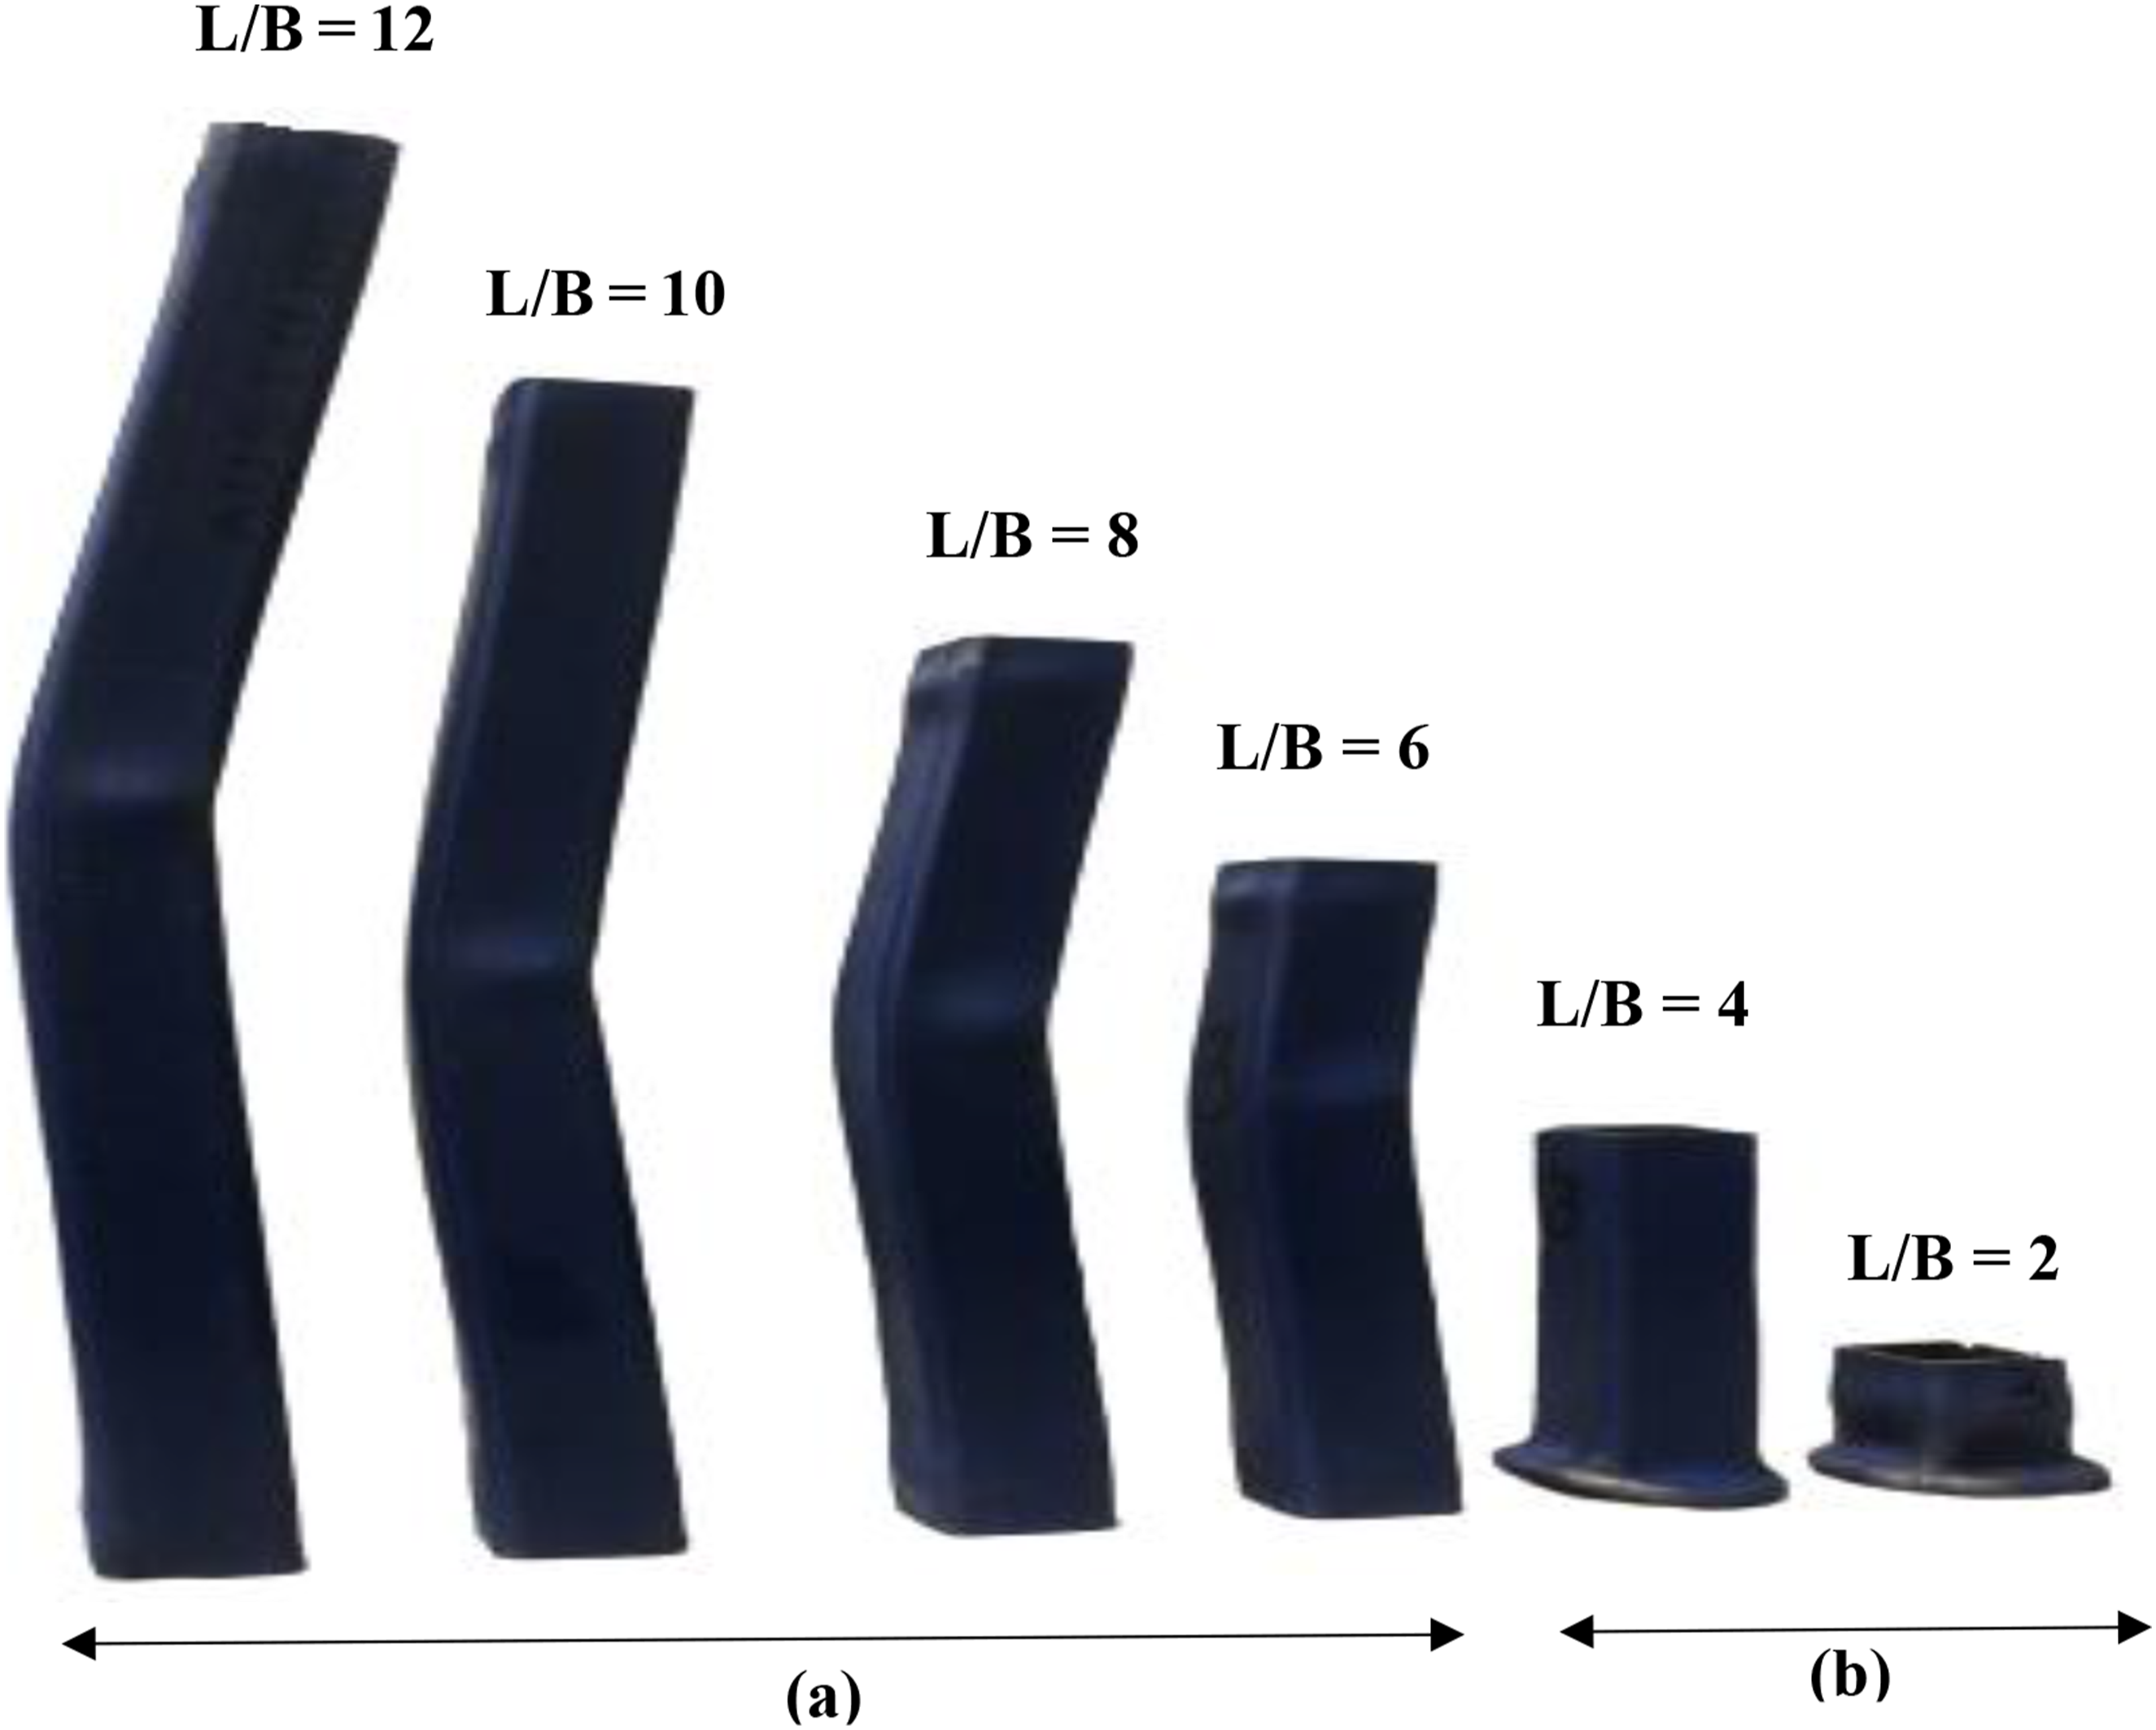
The axial compressive behaviour of Group ST25 specimens was assessed based on two parameters: yield stress and ultimate stress. The yield stress was calculated using the 0.2% offset yield strength method and the ultimate stress was extracted from the peak stress value in the stress-strain graph for each specimen. It was observed from the stress-strain curves that, for L/B ratios of 2 and 4, where the failure mode was the elephant foot buckling at one end, a square ring started to develop from one end of the tube after the yield point, continuing until reaching ultimate capacity. Subsequently, a decreasing axial stress-axial strain response was observed.
Interestingly, after reaching a strain of 30% and 20% in the specimens with L/B ratios of 2 and 4, respectively, another increasing axial stress-axial strain response began with the development of a second square ring on the same side of the tube where the initial ring was formed (Figure 8(a) and (b)). This subsequent rise in the stress–strain curve, which was not observed for L/B ratios greater than 4, can be attributed to progressive local failure near the previously formed ring, where the specimen continued to undergo strain hardening. The reduced slenderness and increased resistance to global instability in shorter specimens enabled the formation of an additional local ring, resulting in a subsequent rise in the stress–strain curve. For the specimens with L/B ≥6, buckling of the tubes from the middle was observed after reaching the ultimate axial compression capacity. When comparing the tensile and compressive stresses for Group ST25 specimens, it was observed that the yield tensile stress was slightly greater than the yield compressive stress (Tables 2 and 3). In addition, for the specimens with L/B ratios ≤6, the ultimate compressive stress was found to be greater than the ultimate tensile stress. Whereas, for the specimens with L/B ≥6, the ultimate tensile stress was greater than the ultimate compressive stress. 25 mm square steel tube specimens with different L/B ratios under axial compressive loading: (a) L/B = 2, (b) L/B = 4, (c) L/B = 6, (d) L/B = 8, (e) L/B = 10, and (f) L/B = 12.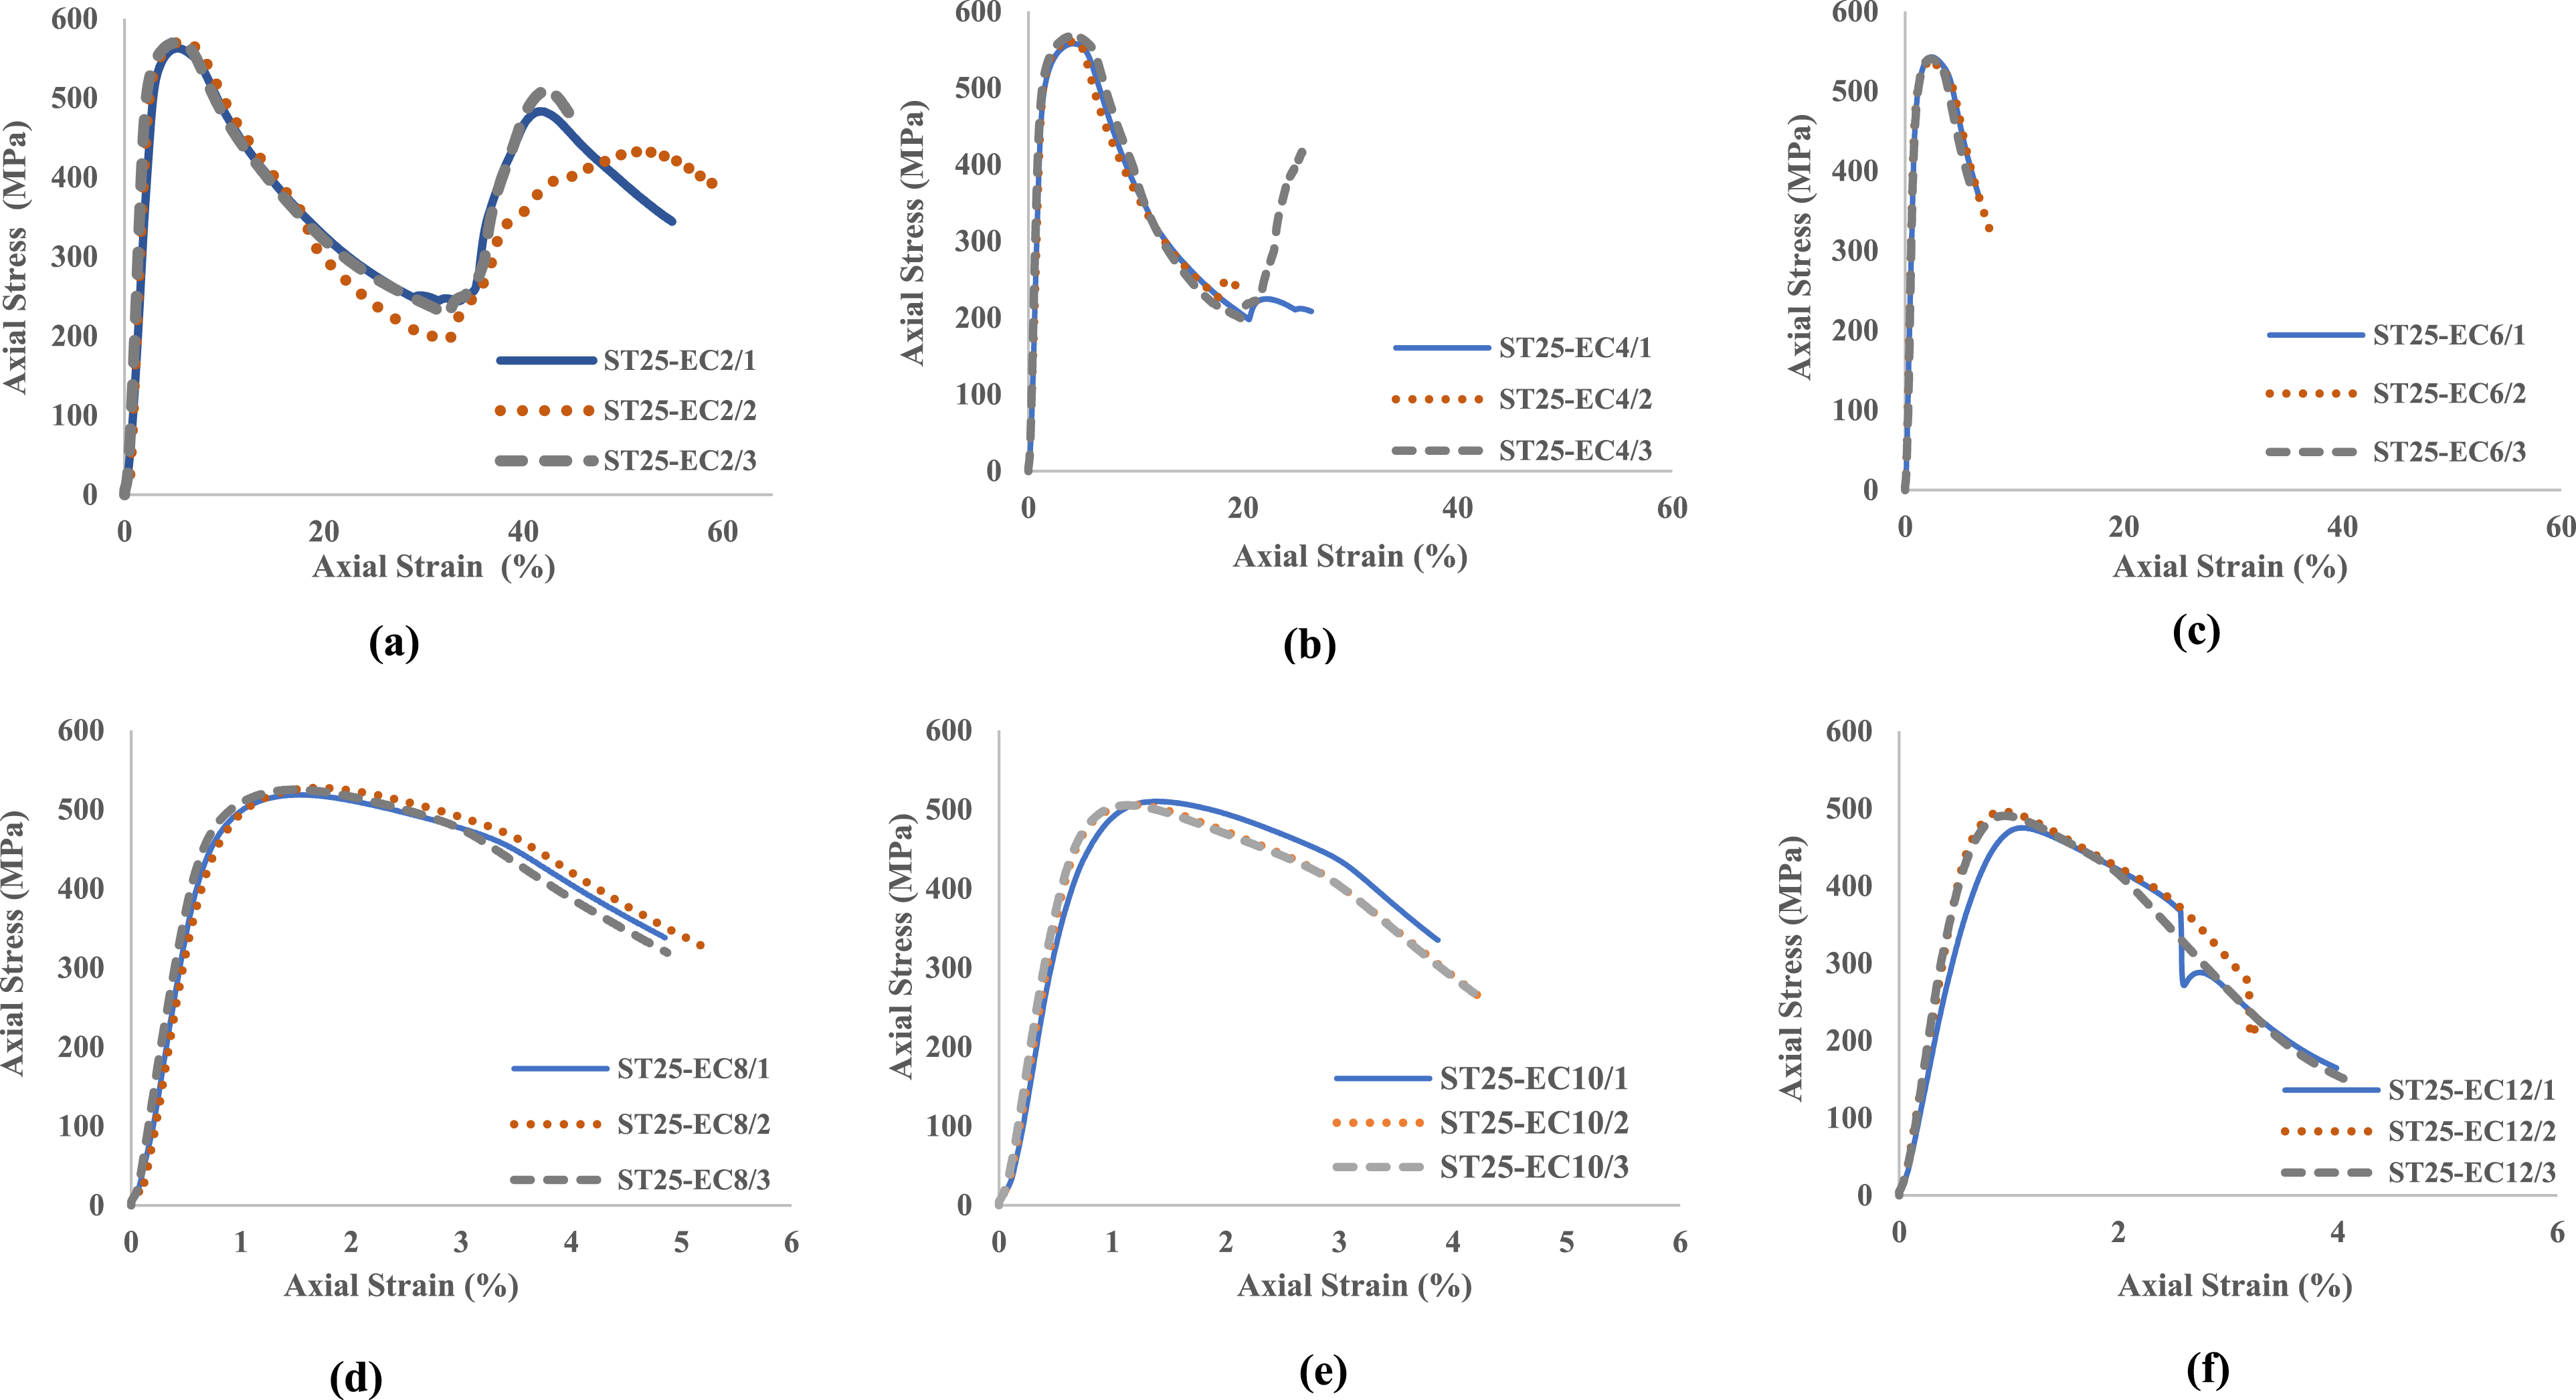
Figure 9 depicts the typical stress-strain response of the first specimen of Group ST25 under axial compressive loading for all six L/B ratios (i.e., 2, 4, 6, 8, 10, and 12). It was observed from the stress-strain curves that for the change of the L/B ratio, the change in yield stress was very slight. For instance, the yield stress of the specimen with the L/B ratio of 12 was only 2.7% lower than the yield stress of the specimen with the L/B ratio of 2. Specimens with other L/B ratios exhibited even smaller differences in yield stress (less than 2.7%). For the ultimate stress, it is evident that the specimens exhibited a significant reduction in the ultimate stress as the L/B ratio increased. Increasing the L/B ratio from 2 to 12 decreased the ultimate stress by 14.5%. The average ultimate stress of the specimens with L/B ratio of 4 was 1% lower than the average ultimate stress of the specimens with L/B ratio of 2, while for specimens with L/B ratio of 6, the average ultimate stress was 4.9% lower than the average ultimate stress of the specimens with L/B ratio of 2. For specimens with L/B ratios of 8 and 10, the average ultimate stress was 7.9% and 10.7%, respectively, lower than the average ultimate stress of the specimens with L/B ratio of 2. Finally, for specimens with L/B ratio of 12, the average ultimate stress was remarkably smaller, 14.26% lower than the average ultimate stress of the specimens with L/B ratio of 2. The average ultimate compressive stress to average yield compressive stress ratio was greater than 1.10 for the specimens with L/B ratio ≤6. This ratio remained below 1.10 for the specimens with L/B ratios >6. The initial elastic modulus for each L/B ratio, as derived from the slope of the initial linear portion of the stress-strain curves in Figure 9, remained largely consistent across all L/B ratios, indicating that the elastic stiffness of the specimens did not change significantly with the variation in L/B ratios. This suggested that the initial stiffness of the material was independent of the geometric ratio of the tube. Stress-strain behaviour of 25 mm square steel tube specimens under axial compressive loading.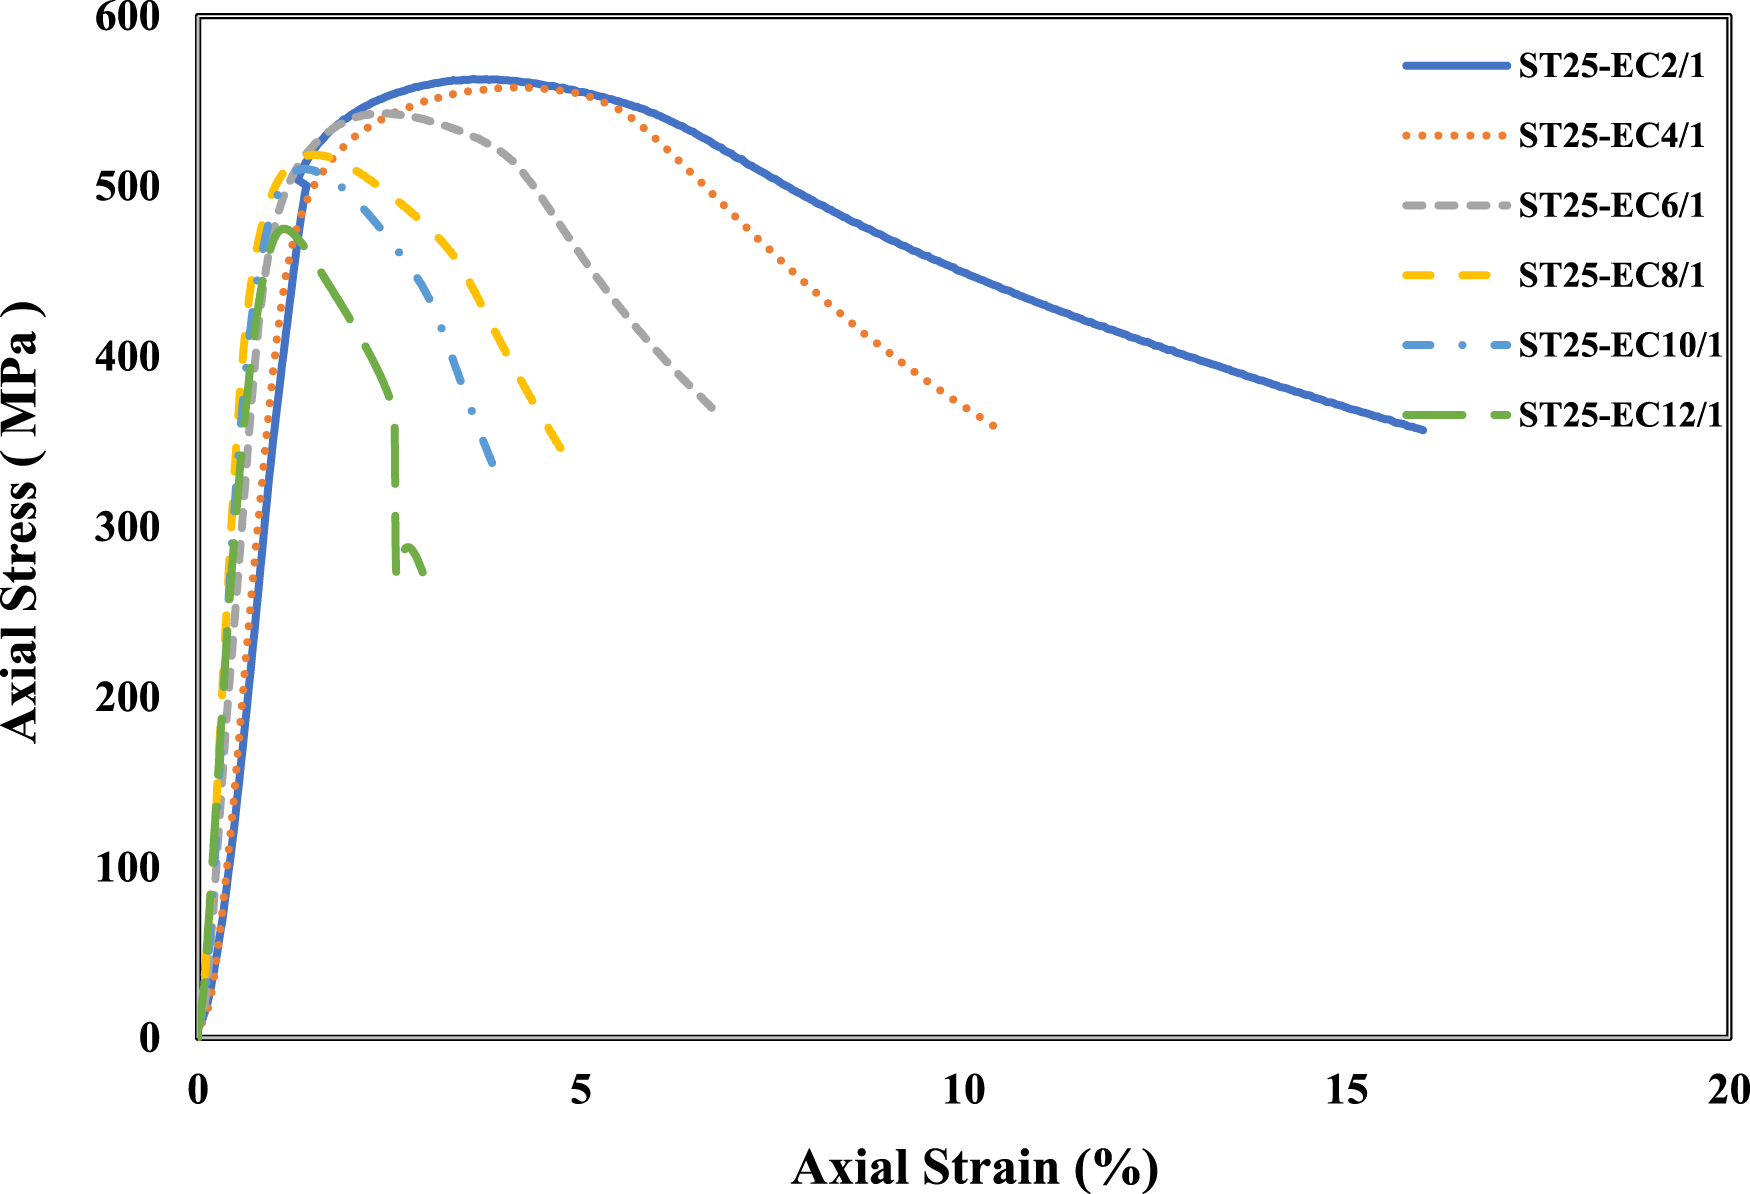
Another significant observation from the stress-strain behaviour of Group ST25 specimens was the noticeable shift from strain hardening to strain softening as the L/B ratios of the specimens changed from 2 to 12. The stress-strain curves for the lower L/B ratios (2 and 4) showed a prominent strain-hardening phase after yield, leading to relatively higher ultimate strains. While the stress-strain curves for L/B ratios of 6 and above exhibited a shift towards strain softening in the post-yield region, as evident from the rapid drop in stress after the ultimate stress. This behaviour highlighted the reduced capacity of longer specimens to sustain load beyond the yield point. It is evident from Figure 9 that as the L/B ratio of the specimens increases, the strain corresponding to the ultimate stress decreases. When the L/B ratio of the specimens increased from 2 to 12, the average ultimate axial strain was reduced by 80%. For the specimens with L/B ratio of 2 and 4, the average ultimate axial strain exceeded 5% and 4%, respectively. For the specimens with L/B ratio of 6, the average ultimate axial strain was below 3%.
For the remaining specimens with L/B ratios of 8, 10, and 12, average ultimate axial strains were below 2%.
30 mm square steel tube
Axial compression test results of 30 mm square steel tube (Group ST30) specimens for six different L/B ratios ranging from 2 to 12 are reported in Table 4. Values reported in Table 4 are extracted from the stress-strain curves for the respective L/B ratio. Similar to Group ST25 specimens, for Group ST30 specimens, three specimens were tested for each L/B ratio, and three stress-strain curves are presented for each specimen. It was observed from the stress-strain curves that all three specimens for each L/B ratio exhibited very similar behaviour. Figure 10 represents the failure modes of ST30 specimens under axial compression for all six L/B ratios. For Group ST30 specimens, elephant’s foot buckling occurred for specimens with L/B ratios of 2 and 4, shifting to global failure for specimens with L/B ratios ≥6. Considering the shift in the failure modes for different L/B ratios of Group ST30 specimens, and to avoid the global buckling failure, it is advisable to keep the L/B ratio under 4 in structural applications. Typical failure modes of 30 mm square steel tube specimens under compressive loading with different L/B ratios: (a) Global failure in the form of buckling and (b) Local failure in the form of elephant’s foot buckling.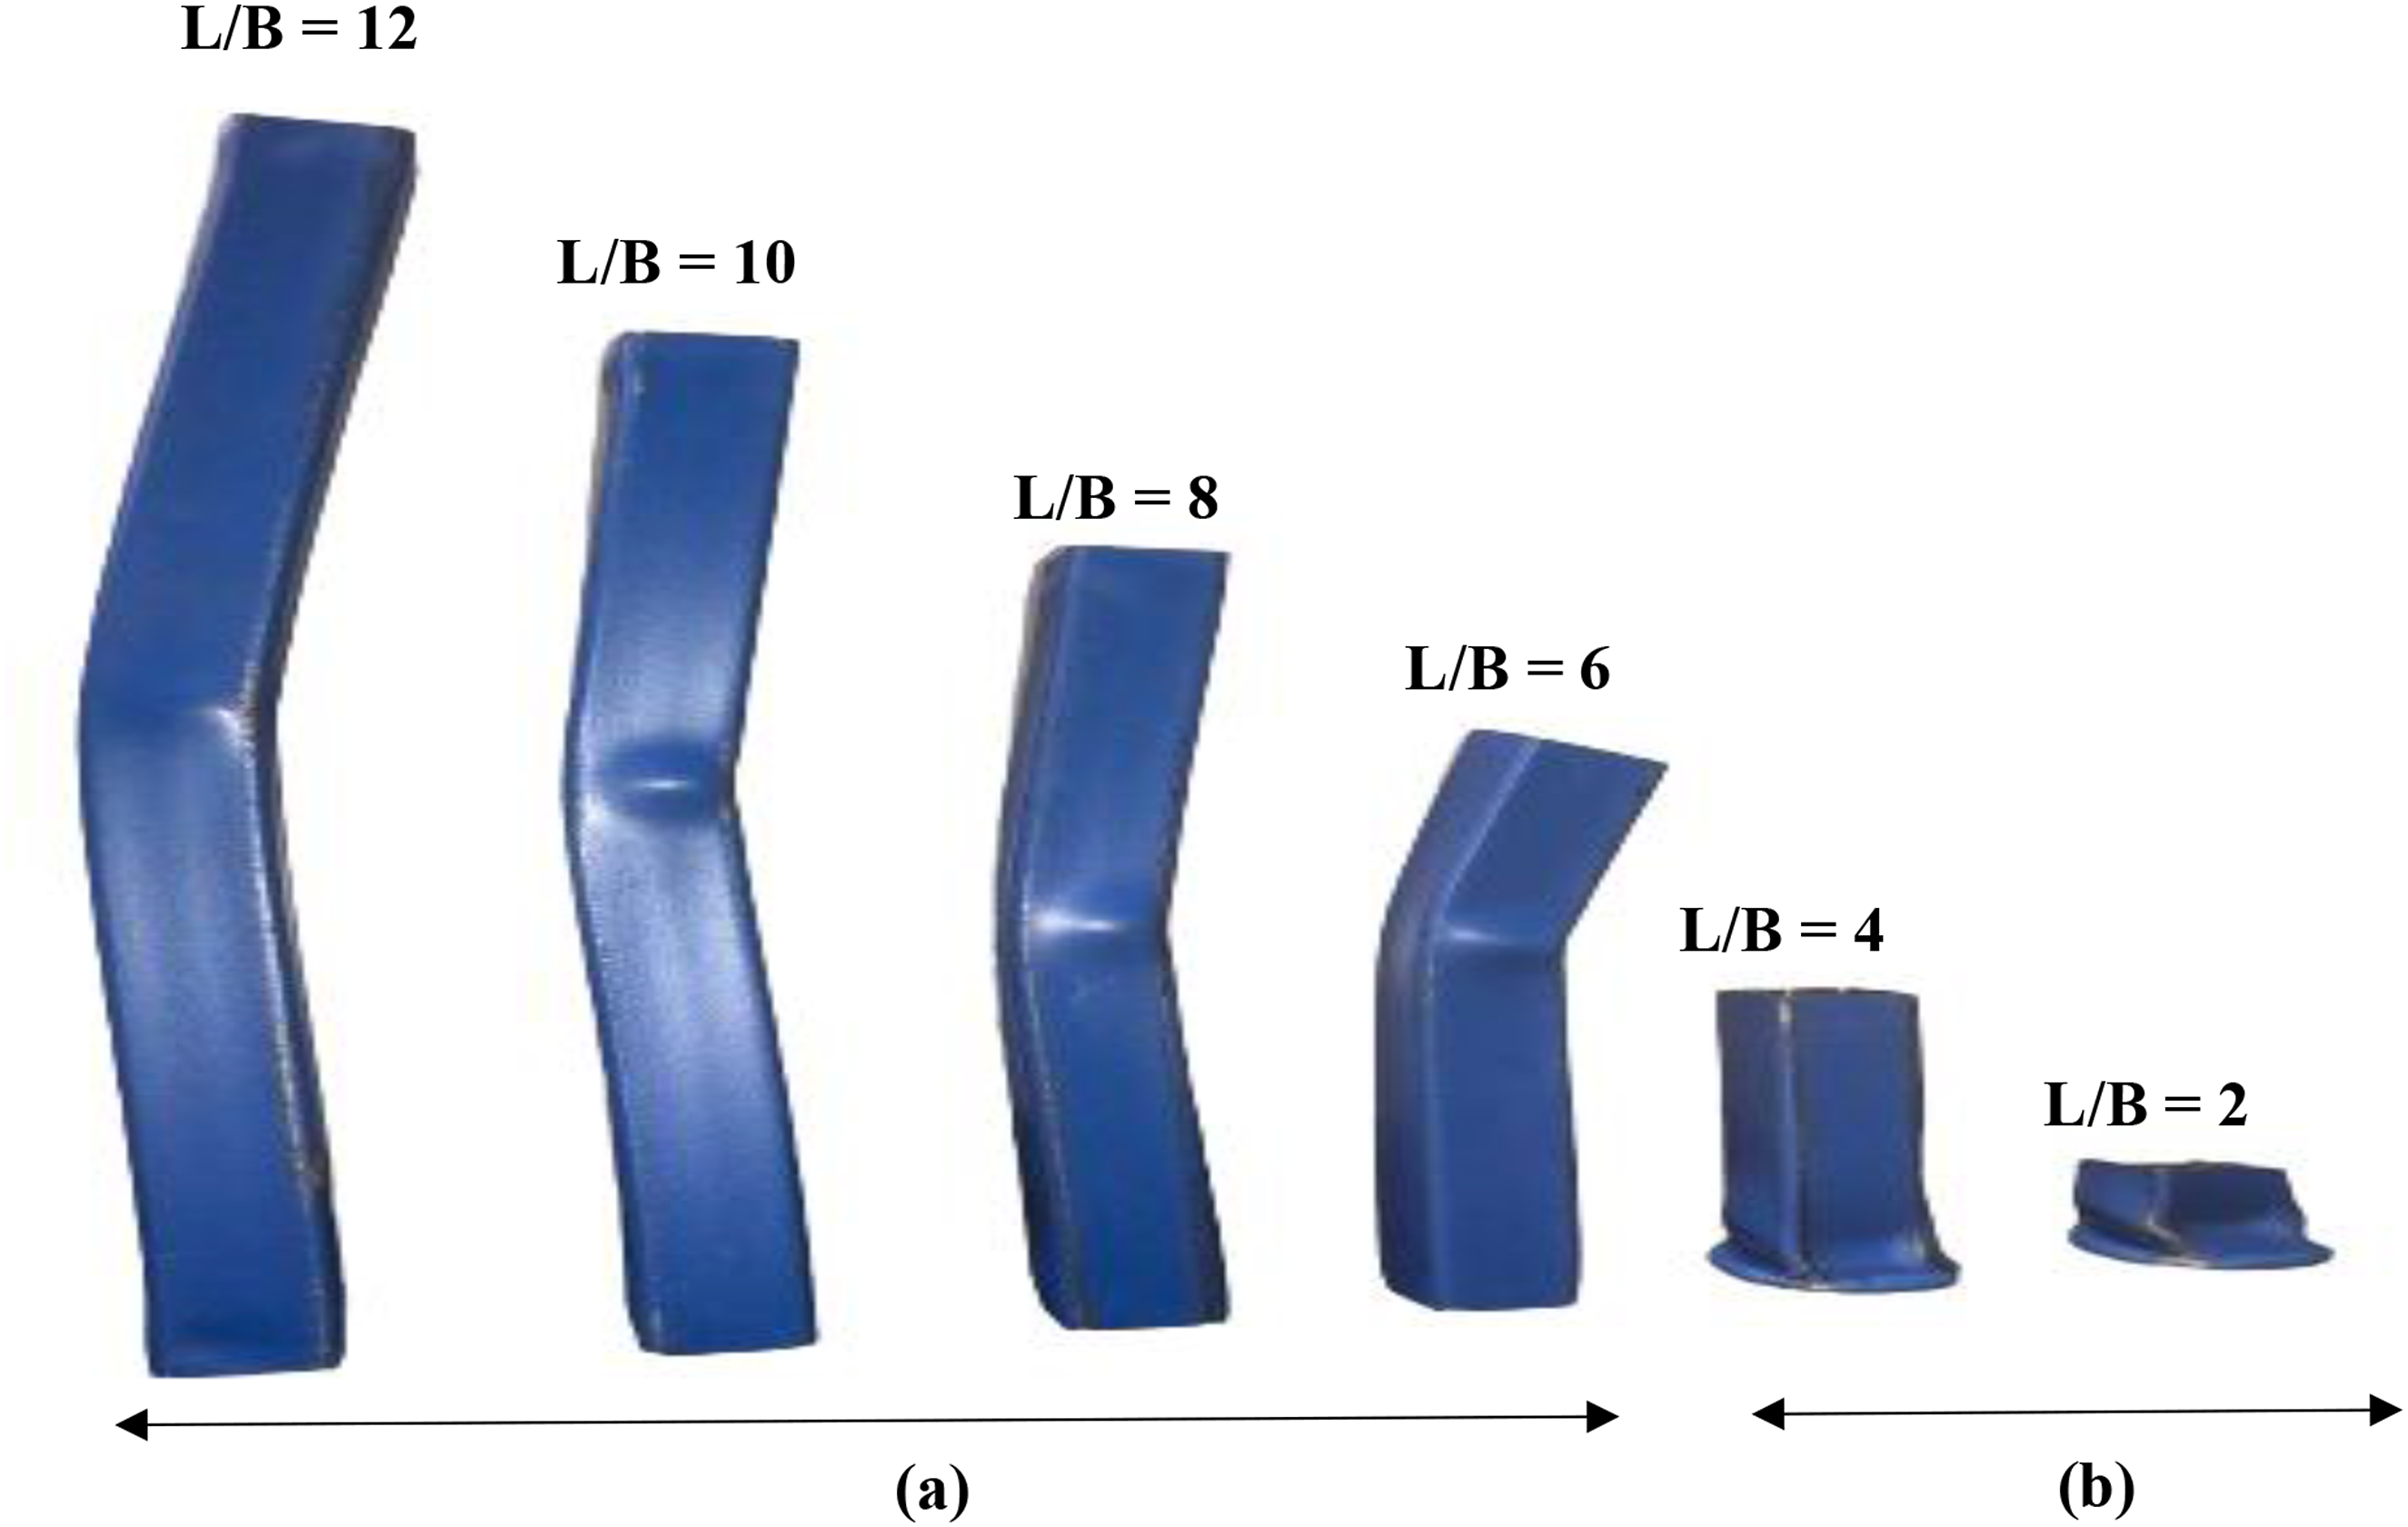
Similar to Group ST25 specimens, the yield points on the stress-strain curves of ST30 specimens were calculated using the 0.2% offset yield strength method and the ultimate stress was determined by extracting the peak stress value from the stress-strain graph for each specimen. It was observed that for specimens with L/B ratios of 2 and 4, where the failure mode was characterised by the elephant’s foot buckling, a square ring started to develop from one end of the specimen. The load continued to increase until the square ring developed at one end of the steel tube specimen, at which the peak stress (ultimate capacity) was recorded. Subsequently, the load began to decrease. However, after the square ring was fully developed, another increasing trend in axial stress-axial strain response was observed for specimens with L/B ratios of 2 and 4 (as shown in Figure 11). Nevertheless, the peak axial stress was lower than the initial peak stress value (ultimate capacity). For specimens with L/B ratios ≥4, the specimens failed in the form of buckling that occurred after reaching their peak capacity. For specimens with L/B ratios of 2 and 4, the compressive yield stress was slightly greater than the tensile yield stress. However, for specimens with L/B ratios ≥4, the compressive yield stress was lower than tensile yield stress (Tables 2 and 4). Additionally, the ultimate compressive stress was greater than the ultimate tensile stress for specimens with L/B ratios ≤6 and the ultimate compressive stress was smaller than the ultimate tensile stress for specimens with L/B ratios > 6 30 mm square steel tube specimens with different L/B ratios under axial compressive loading: (a) L/B = 2, (b) L/B = 4, (c) L/B = 6, (d) L/B = 8, (e) L/B = 10, and (f) L/B = 12.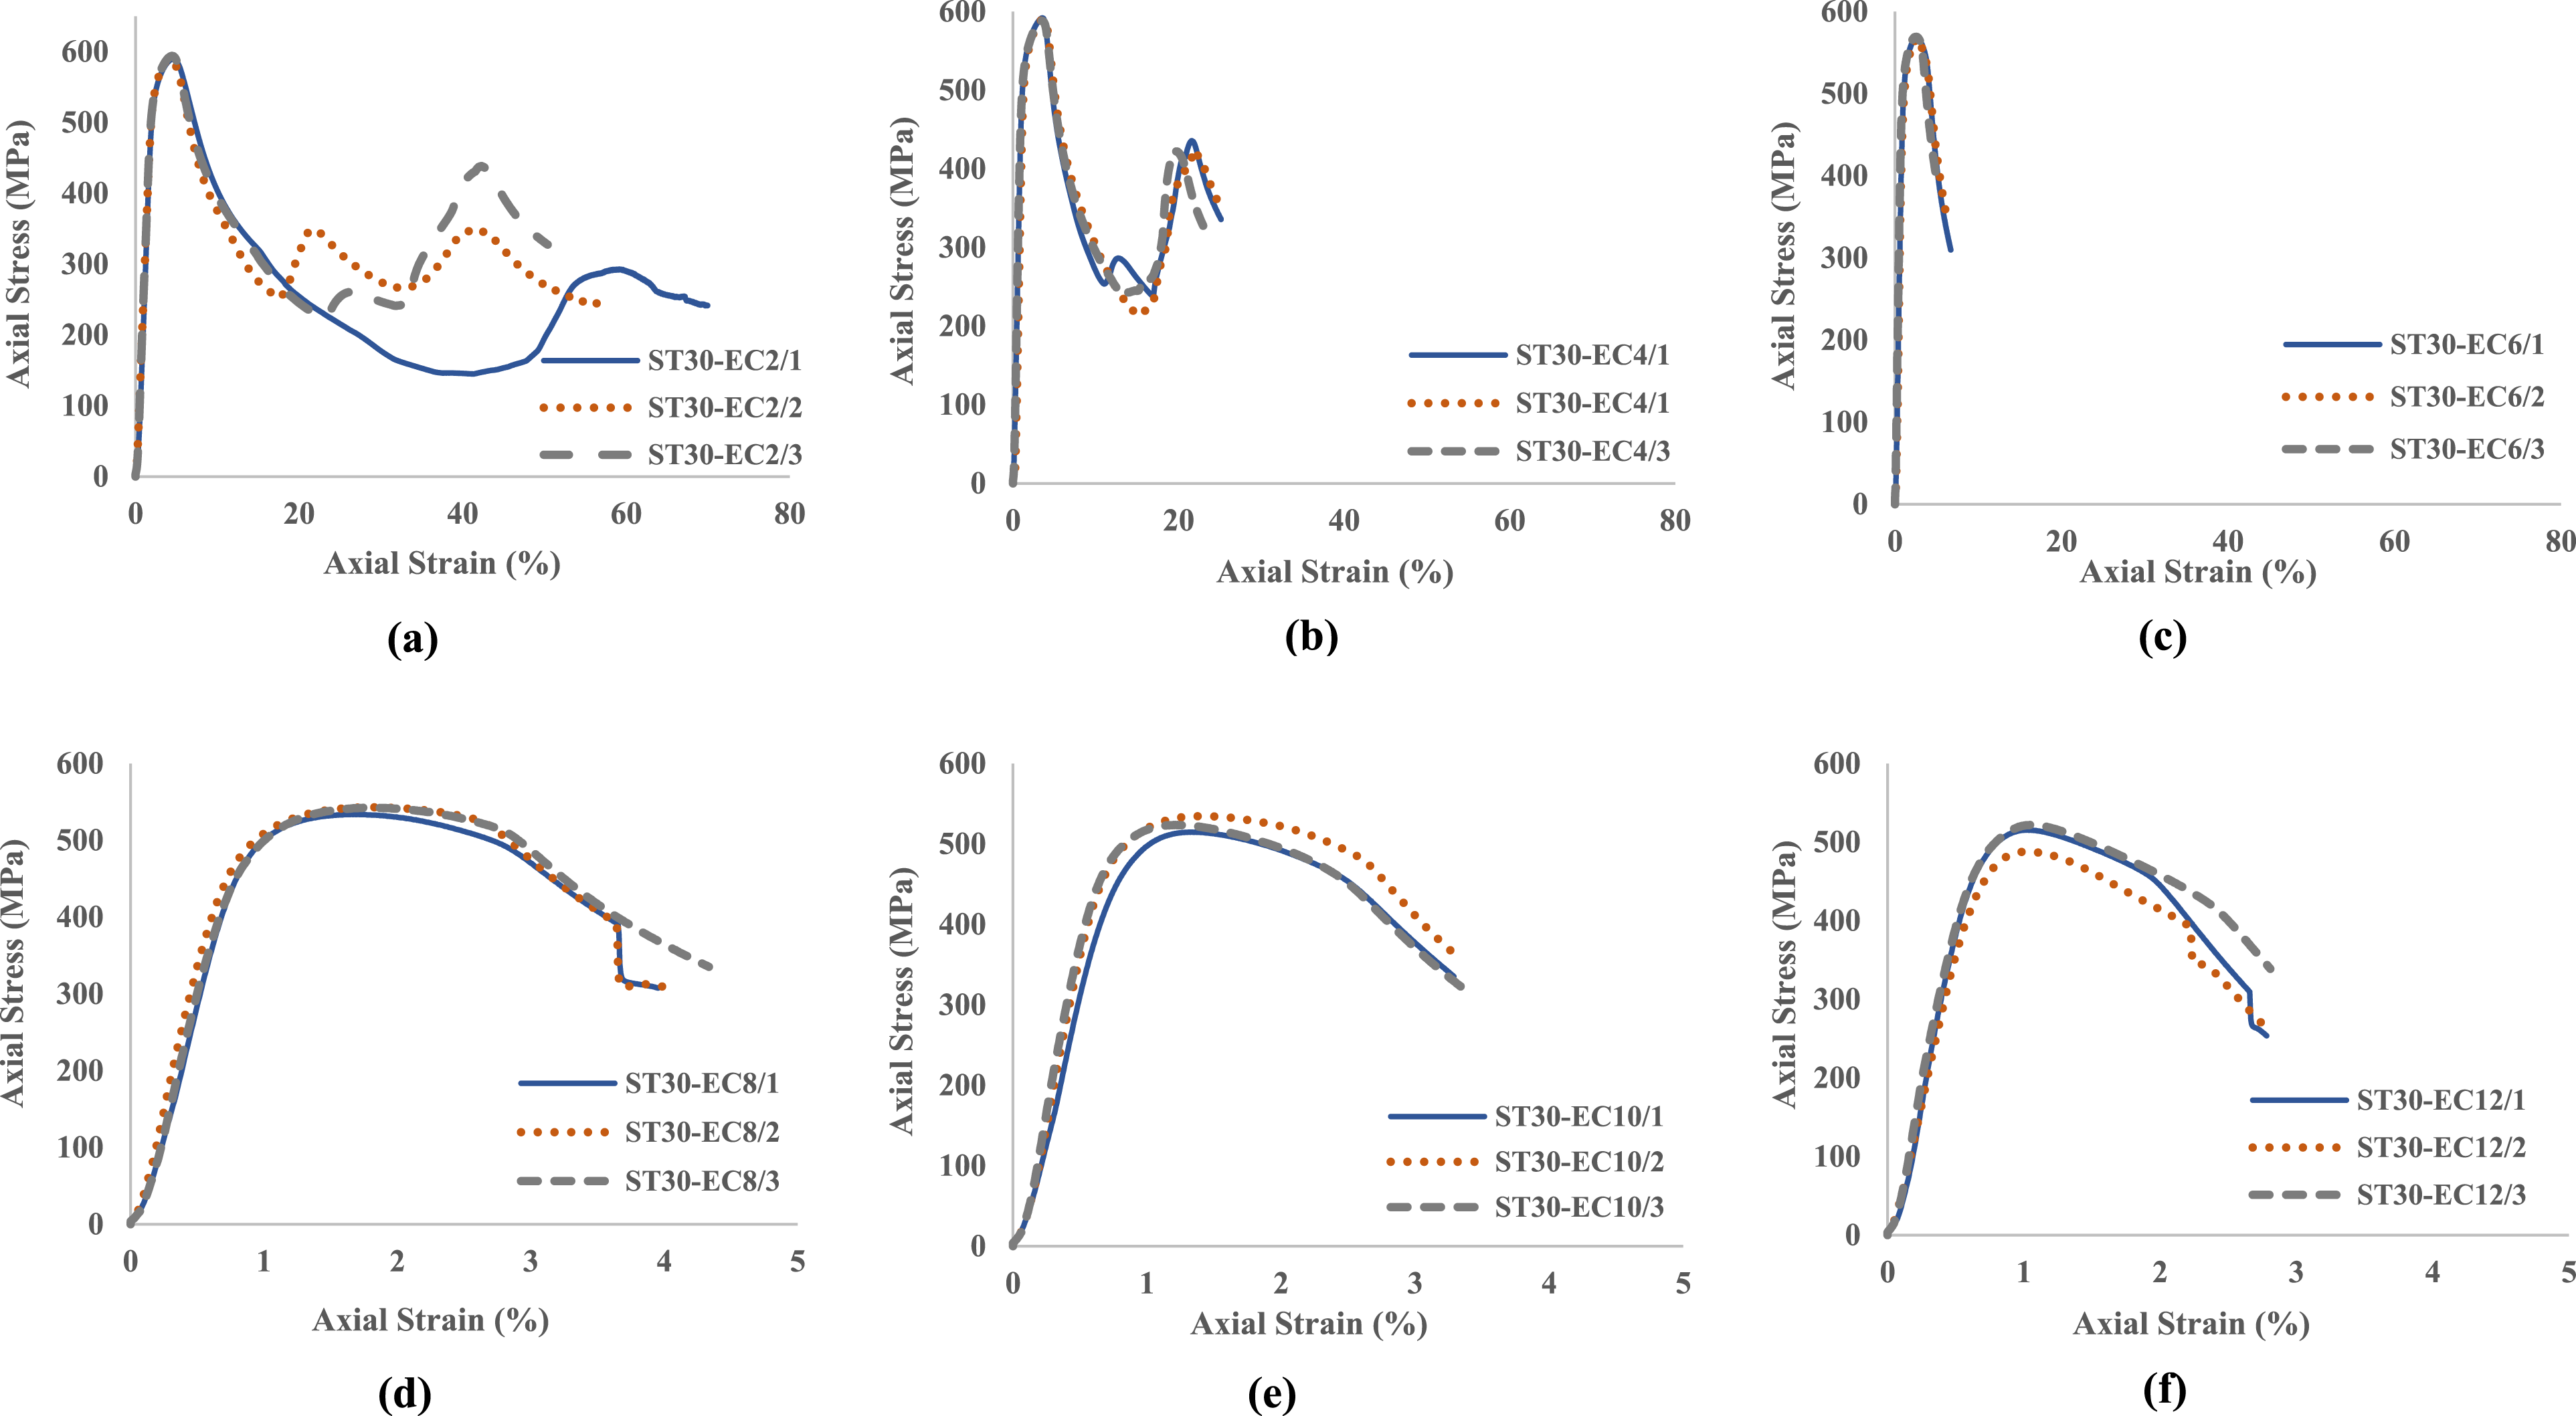
The stress-strain response of Group ST30 specimens with six different L/B ratios is presented in Figure 12. It is evident from Figure 12 that all the curves have almost identical slopes, which are a direct representation of elastic modulus. This observation demonstrated that the elastic stiffness of the ST30 specimens did not change significantly with the variations in the L/B ratios. It was observed that as the L/B ratio increased, the yield stress of the specimens slightly decreased. Specifically, the yield stress of steel tube specimens with the L/B ratio of 12 was approximately 6% lower than that of steel tube specimens with the L/B ratio of 2. With an increase in the L/B ratios from 2 to 12, the reduction in the ultimate stress of the specimens was more prominent in comparison to compressive yield stress. For instance, the average ultimate stress of the specimens with L/B ratio of 12 was 14% lower than the average ultimate stress of specimens with L/B ratio of 2. Stress-strain behaviour of 30 mm square steel tube specimens under axial compressive loading.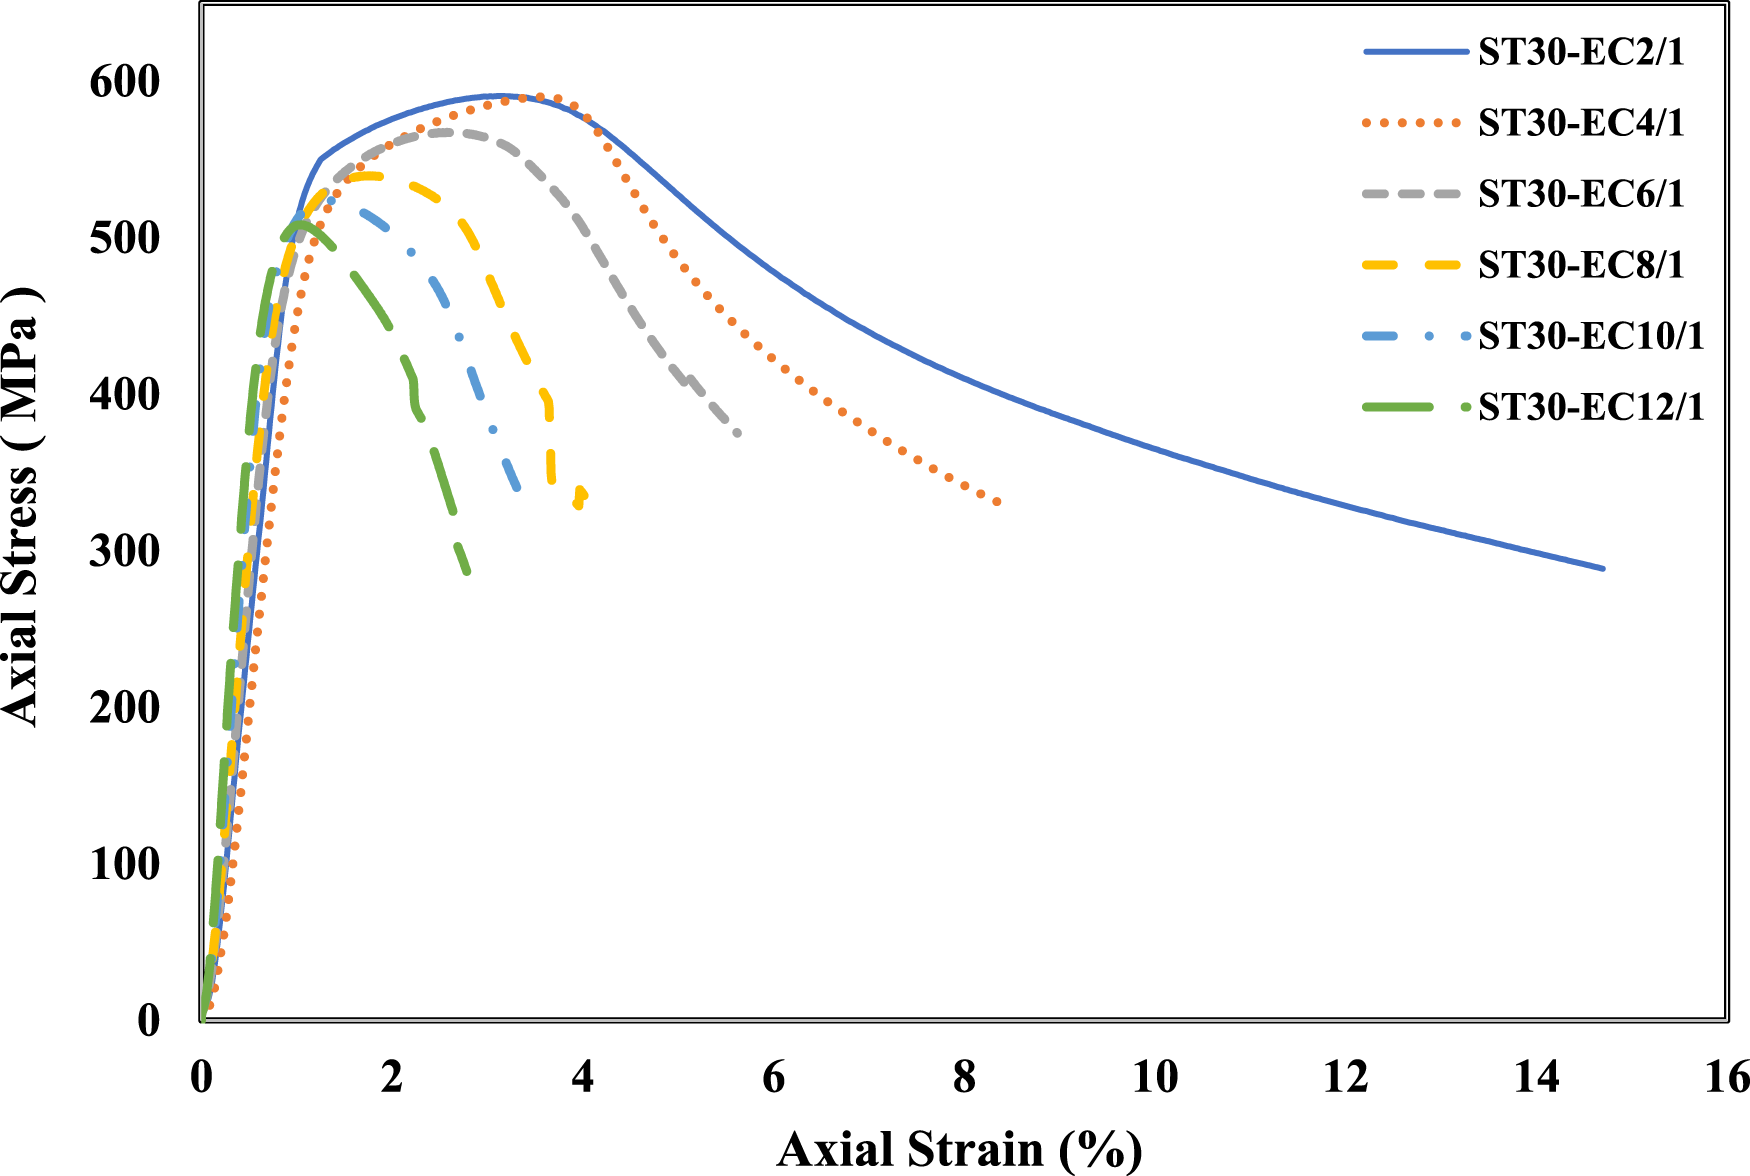
The average ultimate compressive stress to average yield compressive stress ratio of the specimens was greater than 1.10 for L/B ≤6. This ratio was below 1.10 for the L/B ratios >6.
Another significant observation from the stress-strain behaviour of Group ST30 specimens was the shift in strain behaviour from strain hardening to strain softening as the L/B ratios of the specimens changed from 2 to 12. The stress-strain curves for the lower L/B ratios (2, 4 and 6) exhibited a strain-hardening phase after yield, leading to relatively higher ultimate strains. In contrast, the stress-strain curves for the higher L/B ratios (8, 10 and 12) displayed more prominent strain-softening, which is evident from the rapid drop in the ultimate stress after reaching peak stress. This behaviour highlighted the reduced capacity of longer specimens to sustain load beyond the yield point. Figure 12 also shows that the axial strain corresponding to the ultimate axial stress of the steel tube specimens decreased as the L/B ratio increased. For specimens with L/B ratio of 2, the average ultimate axial strain exceeded 4.4%, while for specimens with L/B ratios of 4 and 6, the ultimate axial strain was below 4%. Furthermore, for specimens with L/B ratios of 8, 10, and 12, the ultimate axial strain was under 2%. The average ultimate axial strain of the specimens was reduced by 76% when the L/B ratio was increased from 2 to 12.
35 mm square steel tube
Axial compression test results of 35 mm square steel tube (Group ST35) specimens for the six different L/B ratios ranging from 2 to 12 are reported in Table 5. Values reported in Table 5 are extracted from the stress-strain curves of ST35 specimens for the respective L/B ratio. Three specimens were tested for each L/B ratio as well, and three stress-strain curves were plotted (Figure 13). It was observed from the stress-strain curves that all three specimens for each L/B ratio exhibited very similar behaviour. The axial compressive stress of ST35 specimens, based on different L/B ratios of square steel tube specimens ranging from 2 to 12, was assessed by evaluating the yield stress and ultimate strength capacity of the steel tube specimens from the stress-strain response. Similar to the results obtained for Group ST25 and Group ST30, the yield stress point on the stress-strain curve of ST35 specimens was calculated using the 0.2% offset yield strength method. A visual representation of the failure modes for specimens, ST35 specimens under axial compression for all six L/B ratios is depicted in Figure 13. Typical failure modes of 35 mm square steel tube specimens under compressive loading with different L/B ratios: (a) Global failure in the form of buckling, and (b) Local failure in the form of elephant’s foot buckling.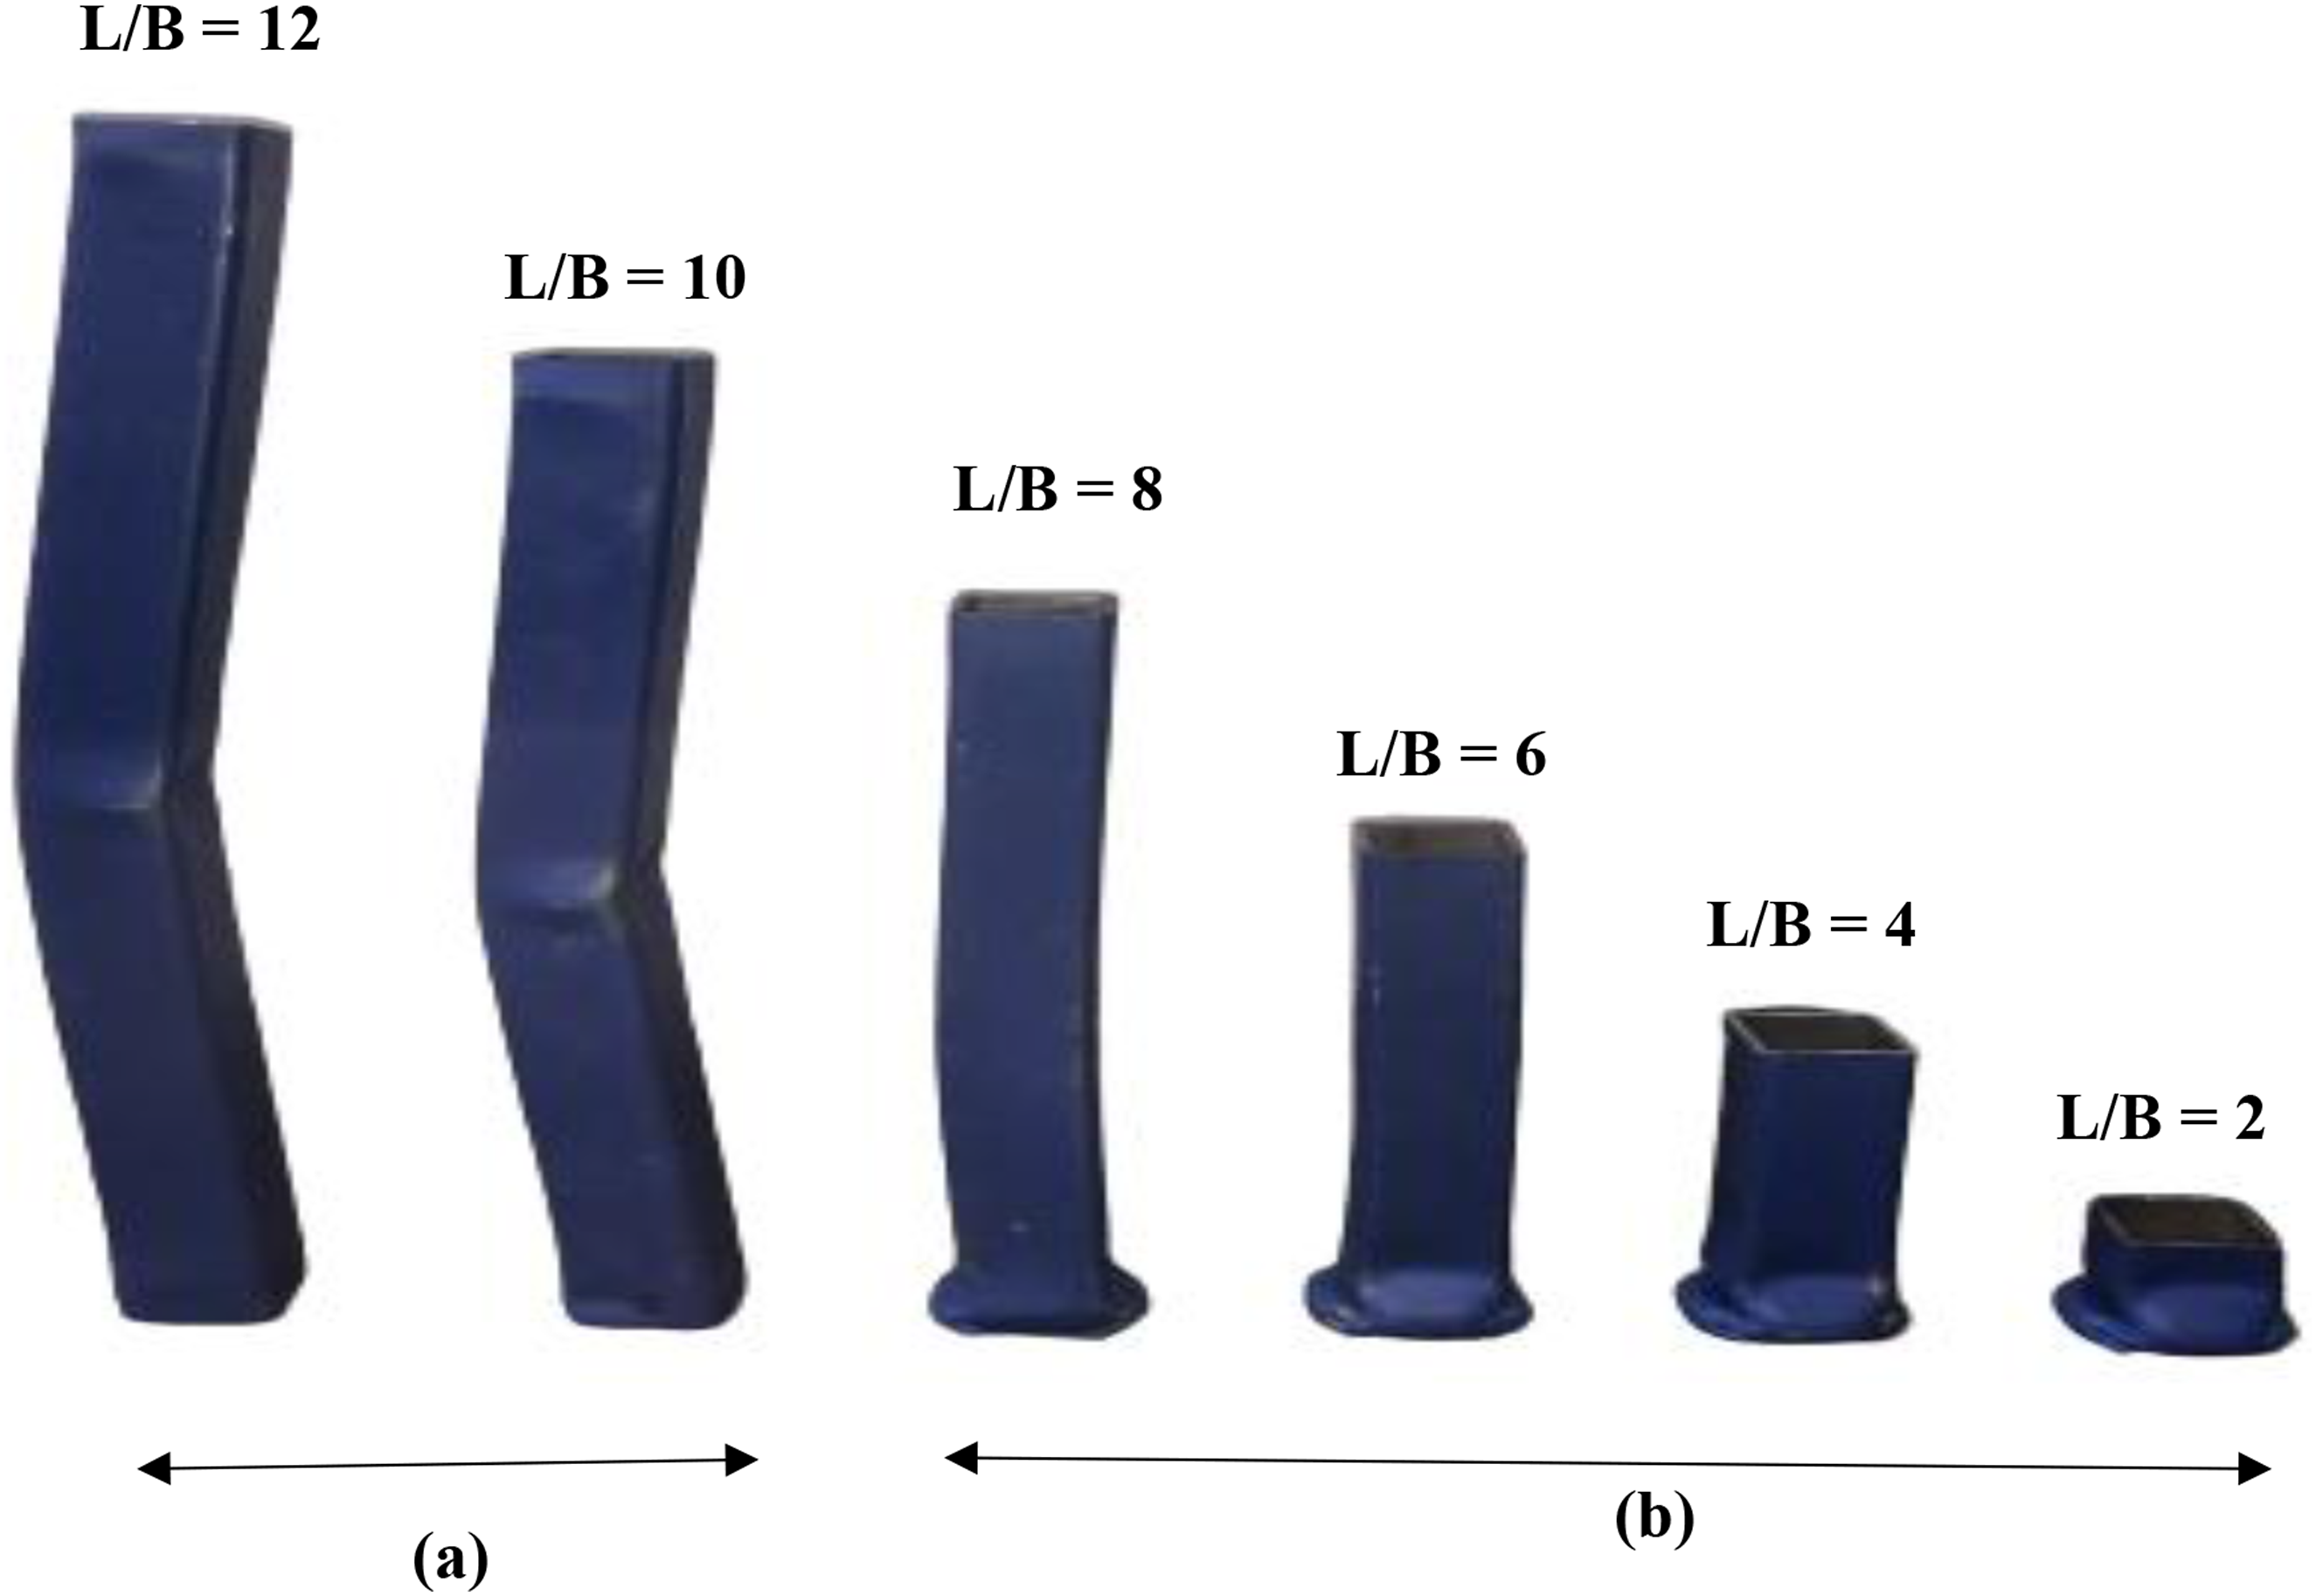
It was observed that for specimens with L/B ratios ≤6, the specimens experienced the elephant’s foot buckling failure, while for the L/B > 6, the entire was buckled. These observations were consistent with the stress-strain response shown in Figure 14, where multiple peak values of axial stress were observed for specimens with L/B ratios ≤6, and a single peak value of axial stress was observed for specimens with the L/B ratios > 6. Therefore, it is recommended to use ST35 tubes with an L/B ratio of up to 6 to prevent global buckling and enhance ductility. The average yield tensile stress of the specimens was slightly greater than their average yield compressive stress (Tables 2 and 5). Additionally, the average ultimate tensile stress was found to be greater than the average ultimate compressive stress for all the L/B ratios (2–12). 35 mm square steel tube specimens with different L/B ratios under axial compressive loading: (a) L/B = 2, (b) L/B = 4, (c) L/B = 6, (d) L/B = 8, (e) L/B = 10, and (f) L/B = 12.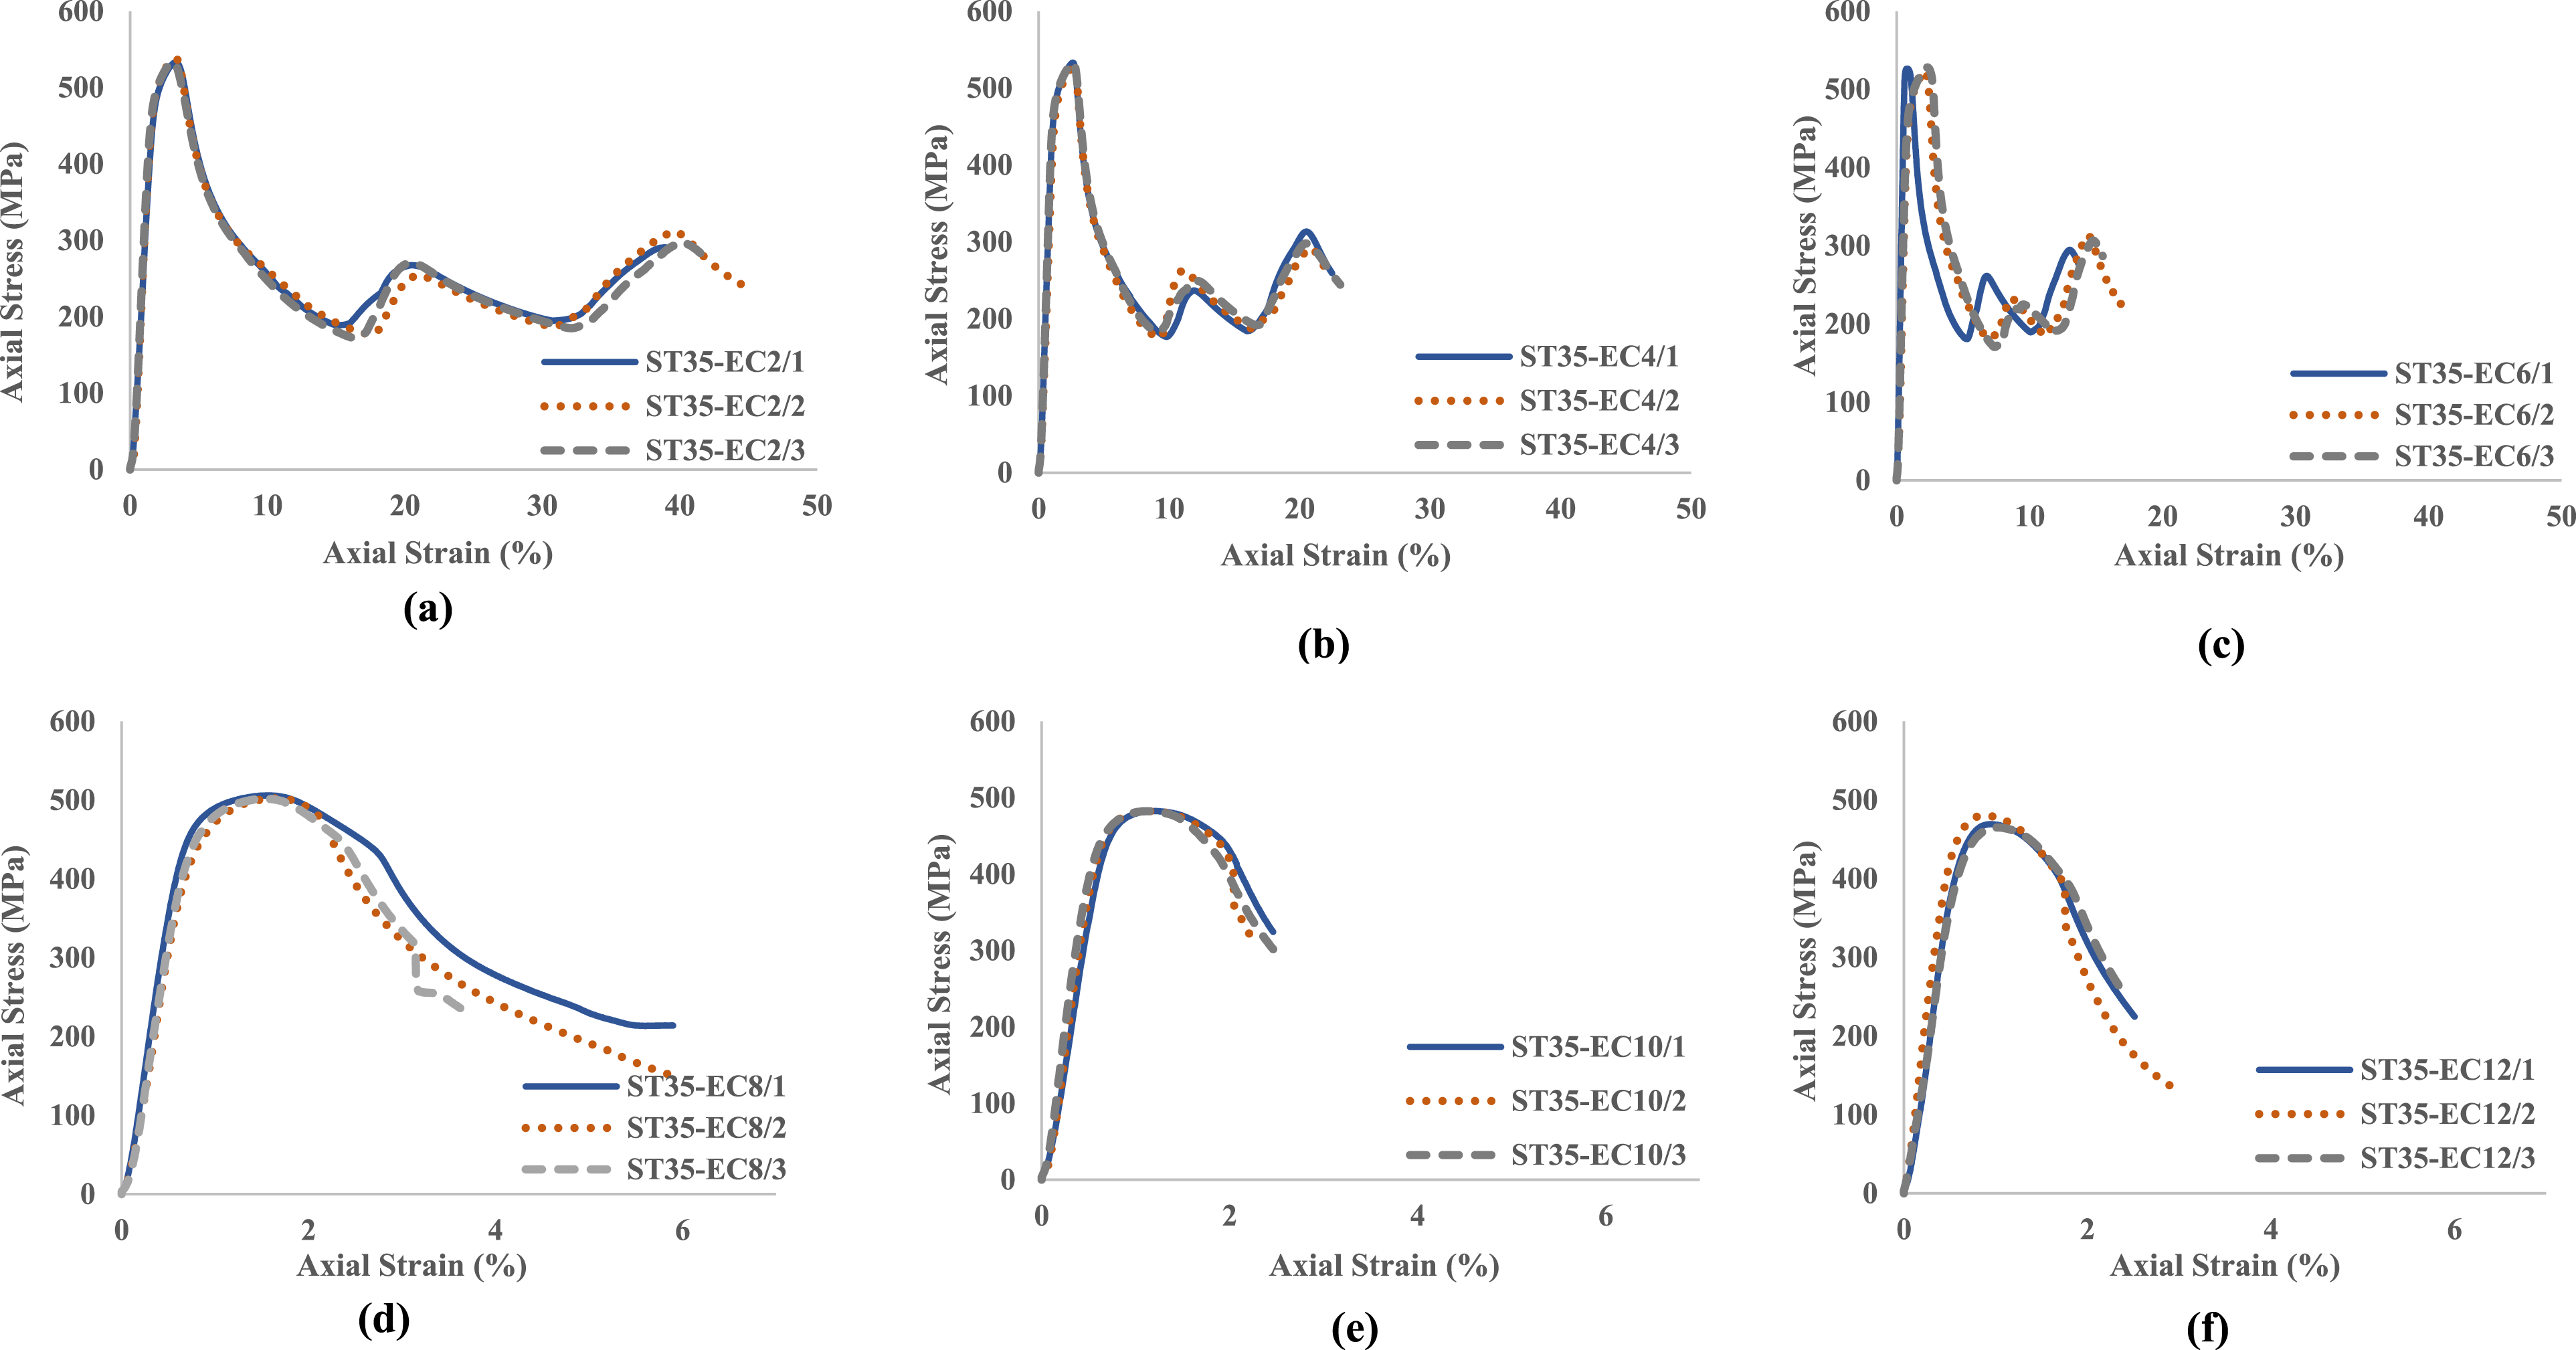
The stress-strain behaviour of the steel tube specimens, corresponding to all six L/B ratios, is illustrated in Figure 15. This figure presents six distinct stress-strain curves, with each curve representing stress-strain response of the tested specimens for one of the six L/B ratios. Figure 15 shows that all six curves exhibited identical initial slopes in the elastic region. This observation demonstrated that the elastic stiffness of the ST35 specimens did not change significantly with the change in the L/B ratios. It was also observed from Figure 15 that as the L/B ratio increased, both the yield stress and ultimate stress decreased. A reduction of 4 % in yield stress was observed for the specimen with the L/B ratio of 12 compared to the specimen with the L/B ratio of 2. Following the same trend, the ultimate stress of the specimen with L/B ratio of 12 was 12% lower than the ultimate stress of the specimen with L/B ratio of 2. The average ultimate compressive stress to average yield compressive stress ratios of the specimens was greater than 1.10 for L/B ratio ≤6. This ratio was below 1.10 for the remaining specimens with the L/B ratios >6. Stress-strain behaviour of 35 mm square steel tube specimens under axial compressive loading.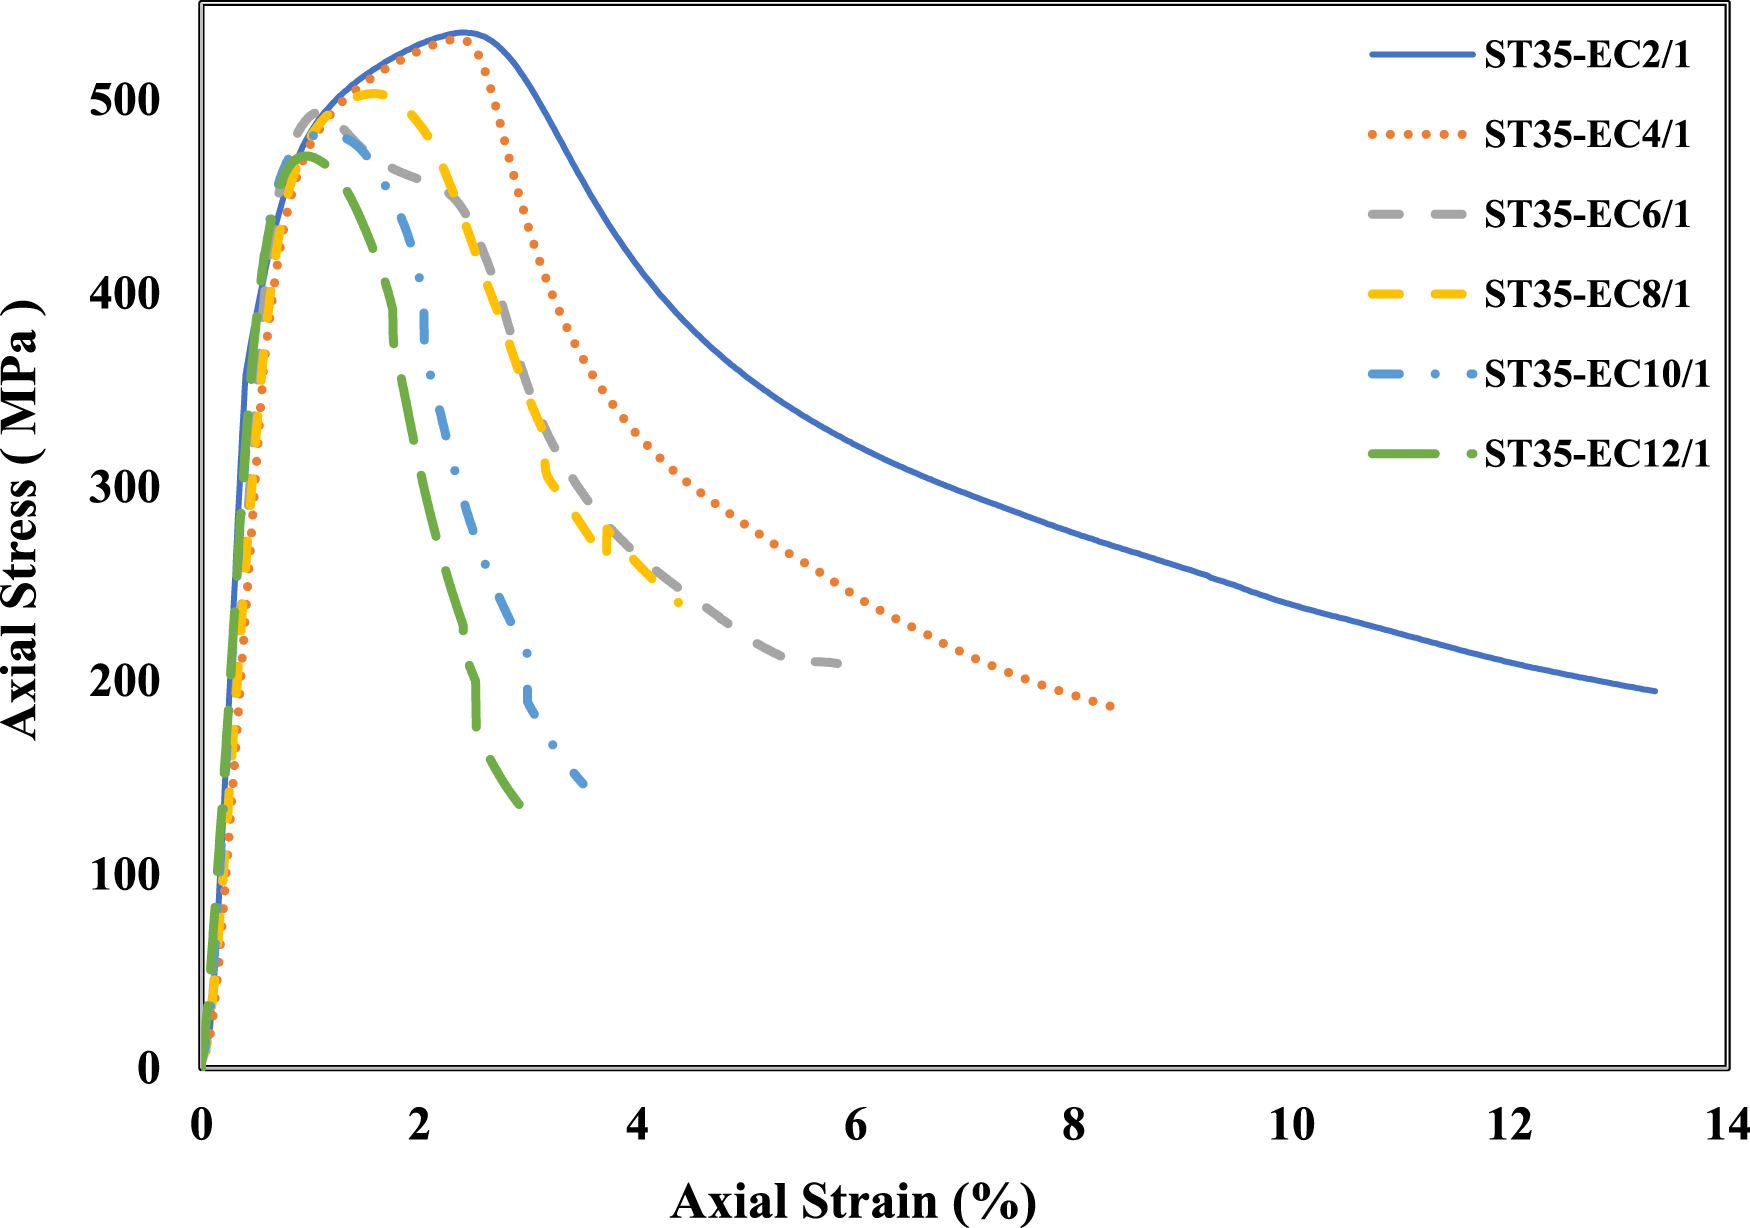
Another significant observation from the combined behaviour was the shift in strain behaviour from strain hardening to strain softening as the L/B ratios of steel tube specimens changed from 2 to 12.
The stress-strain curves for the lower L/B ratios (2 and 4) exhibited a prominent strain-hardening phase after yield, leading to relatively higher ultimate strains. The stress-strain curves for the specimens with L/B ratios of 6 and 8 displayed an intermediate behaviour between strain hardening and strain softening. In contrast, the specimens with higher L/B ratios (10 and 12) showed behaviour dominated by strain softening. The change in the axial strain behaviour demonstrated that the magnitude of the axial strain corresponding to ultimate stress also decreased with an increase in the L/B ratios. For instance, for specimens with L/B ratio of 2, the average yield strain and average ultimate strain were 1.52% and 3.26% respectively. However, for specimens with L/B ratios > 2, the average yield strain and the average ultimate strain progressively decreased, reaching as low as under 1%. Increasing the L/B ratio of the specimens from 2 to 12 decreased the yield strain and ultimate strain by 63% and 71%, respectively.
Comparative analysis
A comparative analysis of all tested specimens was conducted by plotting a chart of ultimate axial stress across different L/B ratios and cross-sectional dimensions. Figure 16 presents the comparison of the ultimate axial stress for all specimens. It can be observed that the ultimate axial stress decreased with increasing L/B ratio for all three cross-sectional dimensions, highlighting the significant influence of slenderness on axial load capacity. Additionally, the ultimate axial stress values indicate that the failure of specimens with lower L/B ratios (2 and 4) was governed by local buckling, whereas the reduced ultimate axial stress values in specimens with higher L/B ratios confirms the increasing influence of global buckling. Among all specimens, 30 mm square steel tube specimens consistently exhibited the highest axial stress, followed by 25 mm and then 35 mm tubes. This trend suggests that the overall performance of small square steel tubes under axial compression is governed by the balance between cross-sectional dimension and slenderness, which determines the resistance of the specimens to local and global failure. Ultimate stress comparison of all tested specimens across different L/B ratios.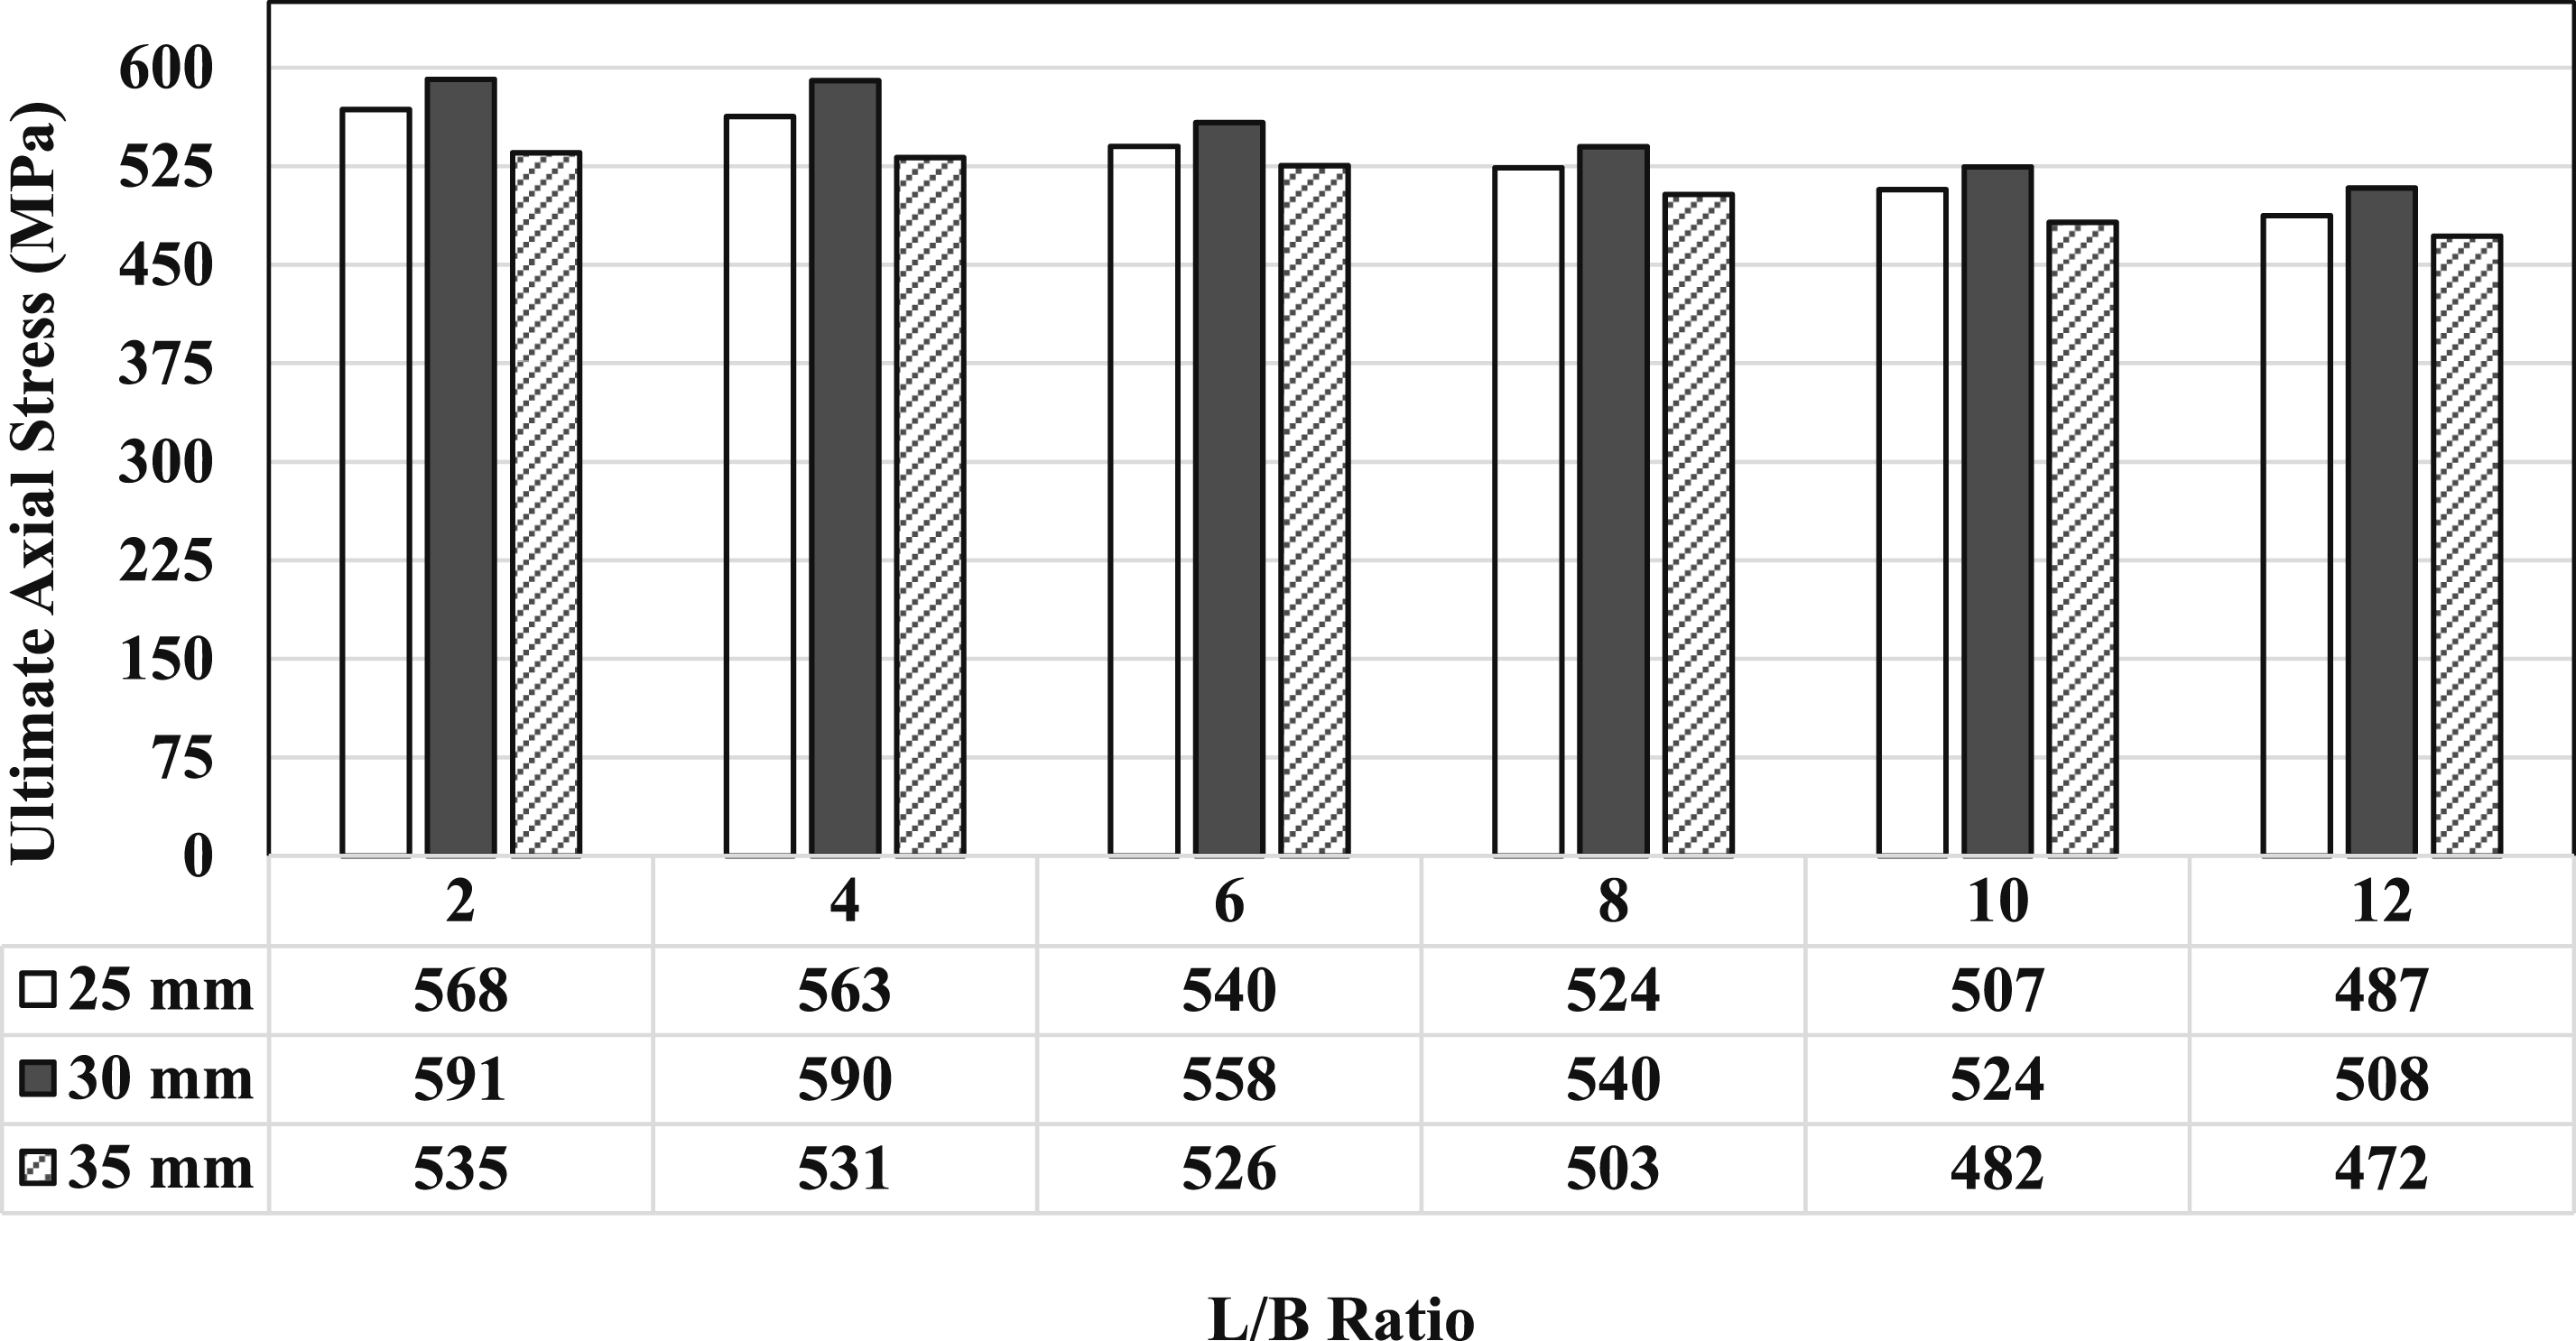
Conclusions
Considering the outcome of the experimental investigation presented in this study, the following conclusion can be drawn:
The unsupported length to width (L/B) ratios significantly influence the failure mechanism of small square steel tubes. For 25 mm and 30 mm square steel tube specimens (ST25 and ST30), elephant’s foot buckling occurred for specimens with L/B ratios of 2 and 4 and global failure occurred for specimens with L/B >4. For 35 mm square steel tube specimens (Group ST35), elephant’s foot buckling occurred for specimens with L/B ≤6 and global buckling occurred for specimens with L/B >6. (1) The failure mechanisms in the form of elephant’s foot buckling and global buckling indicated that the use of small square steel tubes with higher L/B ratios (particularly L/B ≥4) could result in the global failure of the structure. (2) There was no identifiable yield point on the stress-strain curves for 25 mm, 30 mm and 35 mm square steel tube specimens under axial tension and compression. The 0.2% offset yield strength method was employed to identify yield points. It was also observed that as the L/B ratios increased, the stress-strain behaviour shifted from strain hardening to strain softening for all steel tube specimens. This observation depicts the importance of using controlled L/B ratios of under 6 for small square steel tubes in structural applications. (3) The average ultimate compressive stress to average yield compressive stress ratios for all tested steel tubes was greater than 1.10 for the L/B ratio of up to 6. This ratio was below 1.10 for the tube specimens with L/B ratios higher than 6. (4) The yield tensile stress was slightly greater than the yield compressive stress for 25 mm and 35 mm square steel tube specimens, across all tested L/B ratios. However, for the 30 mm square steel tube, the yield compressive stress was slightly higher than the yield tensile stress at L/B ratios of 2 and 4, while the yield tensile stress was greater than the yield compressive stress at L/B ratios of ≥6. (5) The ultimate compressive stress was higher than the ultimate tensile stress for ST25 and ST30 specimens with L/B ratios ≤6. However, for ST35 specimens with all six L/B ratios, the ultimate compressive stress remained lower than the ultimate tensile stress.
Footnotes
Acknowledgement
The authors pay special gratitude to the University of Wollongong, Australia, for providing the research funding and to the technical officers of the High Bay Laboratories of the University of Wollongong, Australia, especially Mr Duncan Best and Mr Ritchie McLean, for their help in preparing and testing specimens for this study. Also, the first author would like to acknowledge the Higher Education Commission, Pakistan, for their financial support in the form of PhD Scholarship. The first author would also like to acknowledge the University of Wollongong, Australia, for their financial support in the form of a fee waiver and a top-up scholarship for the duration of PhD study.
Funding
The authors pay special gratitude to the University of Wollongong, Australia, for providing the research funding and the first author would like to acknowledge the Higher Education Commission, Pakistan, for their financial support in the form of PhD Scholarship.
Declaration of conflicting interests
The author(s) declared no potential conflicts of interest with respect to the research, authorship, and/or publication of this article.