
Abstract
This paper aims to study probabilistic seismic demand models (PSDMs) of intake tower structures under the forward-directivity effects of near-fault earthquakes numerically using finite element method. The relationship between earthquake parameters and structural response was depicted to investigate the onset of damage to the structure. Furthermore, seismic demand hazard curves were developed to indicate the annual possibility of surpassing a particular EDP for any certain IM while taking into account the hazard level of the site or area. Finally, seismic fragility curves for estimating the initial vulnerability of intake towers after the occurrence of earthquakes with and without the FD effect are demonstrated. The results show that near-fault records with NFD effects provide more predictivity in measuring potential hazards induced by the intake towers and choosing optimal IM criteria than those with FD effects. It is also demonstrated that, unlike earlier studies in the literature in which peak ground acceleration and spectral acceleration at the first natural period were commonly chosen as optimal IMs, ASI, Cordova Intensity, and Two-period Intensity can also be appropriate IMs for seismic vulnerability assessment of intake towers.
Keywords
Introduction
As an essential subsystem with multiple functions, including controlling water diversion, level, quality, and drainage, the intake tower is critical to the operation of dams (Somerville et al., 1997). Any damage to these structures during an earthquake may result in excessive seismic demand in the dam body (Wang et al., 2002). The possible failure of the dam may result in a massive volume of water flowing downstream, causing catastrophic events for the human population and facilities. On the other hand, the majority of intake towers and dams are being or will be built in seismically active areas, where they may be placed on rock or firm soil foundations with active faults nearby (Bray and Rodriguez-Marek, 2004). Therefore, establishing a method for evaluation of these structures against incoming loads mainly caused by near-fault earthquakes is crucial.
Several major ground motions in recent years, revealed motion characteristics that were recorded near a ruptured fault rather than ones recorded farther from the earthquake source. One of these characteristics is the forward-directivity (FD) effect that occurs when the fault rupture slip direction is aligned with a site, and its velocity when it propogates toward a site is equal to the shear wave velocity (Zhang and Iwan, 2002). This effect results in displacement amplitudes and extended period velocity pulses (Sehhati et al., 2011). Two key parameters in checking the performance of structures in near-fault areas are the pulse’s amplitude and duration (Dicleli and Buddaram, 2007). Furthermore, the velocity pulses cause a huge quantity of energy to be exposed to the structure at the beginning of the earthquake, resulting in substantial seismic demand and structural damage. These distinctive features of near-fault earthquakes are better accounted for structural analysis and design, and have attracted the attention of earthquake engineers in recent years.
In a series of studies conducted by Wang et al. (2014), the influences of near-field and far-field earthquakes on the seismic performance of concrete gravity dams were investigated. They found that near-field movements had significant impacts on the nonlinear response and accumulated damage of concrete gravity dams, especially the dam body, compared to far-field movements. Yazdani and Alembagheri (2017b) numerically examined the response of a gravity dam under FD and NFD near-field earthquakes. They addressed two types of nonlinearity in the material’s properties and geometric base joints in their work. Chen et al. (2020) used forward-direction and fling-step pulses to investigate the response of an intake tower to near-field movements. The intake tower’s lateral curvature was found to be an excellent measure for assessing the onset of damage’s location and quantity. Furthermore, there were other studies that focused on the response of structures under near-fault ground motions and pulse-like excitations (Elias and Djerouni, 2024; Manna et al., 2024).
Several researchers have discussed vulnerability assessment in the context of performance-based earthquake engineering (PBEE) for different structures (e.g., (da Silva et al., 2023; Ozsarac et al., 2023; Yang et al., 2023)). Hariri-Ardebil and Saouma (2016) investigated PSDMs for concrete gravity dams by selecting optimal IMs and illustrating fragility curves in two methods. They implemented incremental dynamic analysis with scaled ground motions first and then compared the results to those obtained by probabilistic seismic demand analysis with unscaled records. Yazdani and Alembagheri (2017b) examined the seismic susceptibility of gravity dams in near-field zones using cloud analysis and pulse-like and non-pulse-like records. They found the most appropriate IM and analyzed seismic fragility curves. The optimal IMs for a concrete intake tower with octagonal geometry by considering material nonlinearity and structure-water-soil interaction were investigated by Haghgou et al. (2021).
The seismic behavior of intake tower structures under NFD and FD near-fault earthquakes has not been assessed so far. Despite various studies on dams and their related structures, less attention has been paid to the uncertainties included in these problems, such as material properties and record-to-record variability. Moreover, the nonlinear behavior of material properties in numerical analysis and how to model it in finite element-based software is fundamental and crucial for reaching a reliable conclusion. Furthermore, near-fault earthquake events are filled with more uncertainty and are proven to be more destructive than ordinary far-field earthquakes. Any degradation of these structures may result in excessive seismic demand in the dam body. As a result, thorough research on the performance assessment of such structures with intricate behavior during near-fault earthquakes is required.
The primary objective of this study was to evaluate the impact of near-field earthquakes, considering both forward directivity (FD) and non-forward directivity (NFD) effects, on the seismic vulnerability of intake tower structures. The analysis incorporated tower-reservoir-foundation interaction and material nonlinearity. Two sets of unscaled near-fault earthquake records (120 NFD and 72 FD) were selected and applied to a 3D finite element model. Probabilistic seismic demand models (PSDMs) were developed using intensity measure-engineering demand parameters (IM-EDPs) to identify the most effective intensity measures for predicting structural responses and characterizing induced damage. The selection of optimal IMs was based on criteria such as goodness of fit, efficiency, practicality, proficiency, and sufficiency. Seismic fragility curves were then generated and analyzed for different conditions, including FD and NFD records, to assess the vulnerability and initial damage potential of the intake tower. Additionally, the temporal occurrence of earthquake events, represented by the annual rate of exceedance at a given site for specific structural demands, was evaluated using seismic demand hazard curves. This research provides valuable insights for the seismic design, initial damage assessment, and retrofitting of submerged intake tower structures subjected to near-fault earthquakes.
Seismic vulnerability assessment
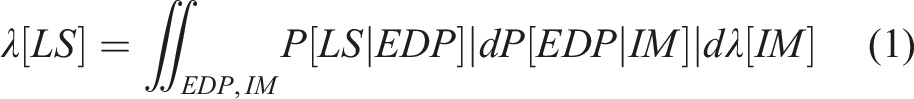
The seismic vulnerability estimates how often a certain EDP surpasses different levels for a specified limit state at a given IM. It could be implemented in performance forecasting to take into consideration intrinsic randomness (an evaluation of the lack of ability to adequately comprehend seismic and structural attributes) and uncertainty (a measure of flaws incorporated into computing models and methods as a result of inability). The vulnerability assessment of the PEER performance-based evaluation technique is mathematically defined in eq. (1) (Krawinkler and Cornell, 2000).
Probabilistic Seismic Demand Model (PSDM)
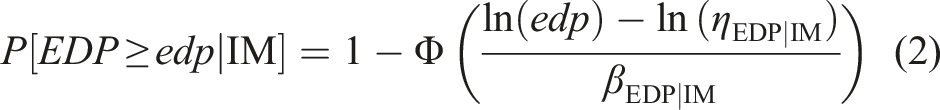
The PSDM uses cloud analysis to demonstrate a relationship between structure demands and seismic IMs. This method suggests a connection between structural and seismic hazard analyses. Cornell and Shome (2002) introduced the baseline to formulate the structural demand applied to the structure in a probabilistic framework. A lognormal distribution was used to model conditional seismic demands, as shown in eq. (2). This equation is called the fragility function.

Eq. (3) provides the regression coefficients a and b. The seismic demand model can be modified to do linear regression on the IM logarithms and structural response, as depicted in eq. (4).

Eq. (5) presents the logarithmic standard deviation, often known as dispersion.
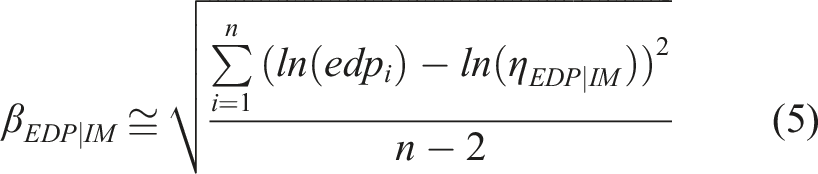
In eq. (5),
Near-fault ground motion records
As input ground motions, a set of 72 un-scaled FD near-fault earthquakes and 120 near-fault earthquakes without FD effects were considered. The study uses Baker’s database to identify ground motions with strong velocity pulses (Baker, 2007b). A method is developed to extract the largest velocity pulse from ground motion using wavelet transform to specify the dominant pulse frequency and amplitude. The amplitude and period of the pulse are determined by extracting the wavelet that best matches the dominant pulse. The Daubechies wavelet of order four is selected as the mother wavelet in the analyses. Using numerous earthquake records highlighted aleatory uncertainty due to record-to-record variability. This reflects differences in duration, frequency content, and other earthquake characteristics. The earthquake records were taken from the PEER database (PEER Ground Motion Database, 2016) and were oriented fault-normally. The following criteria were used to pick these earthquake records: (1) a fault distance of less than 20 km, (2) a magnitude of
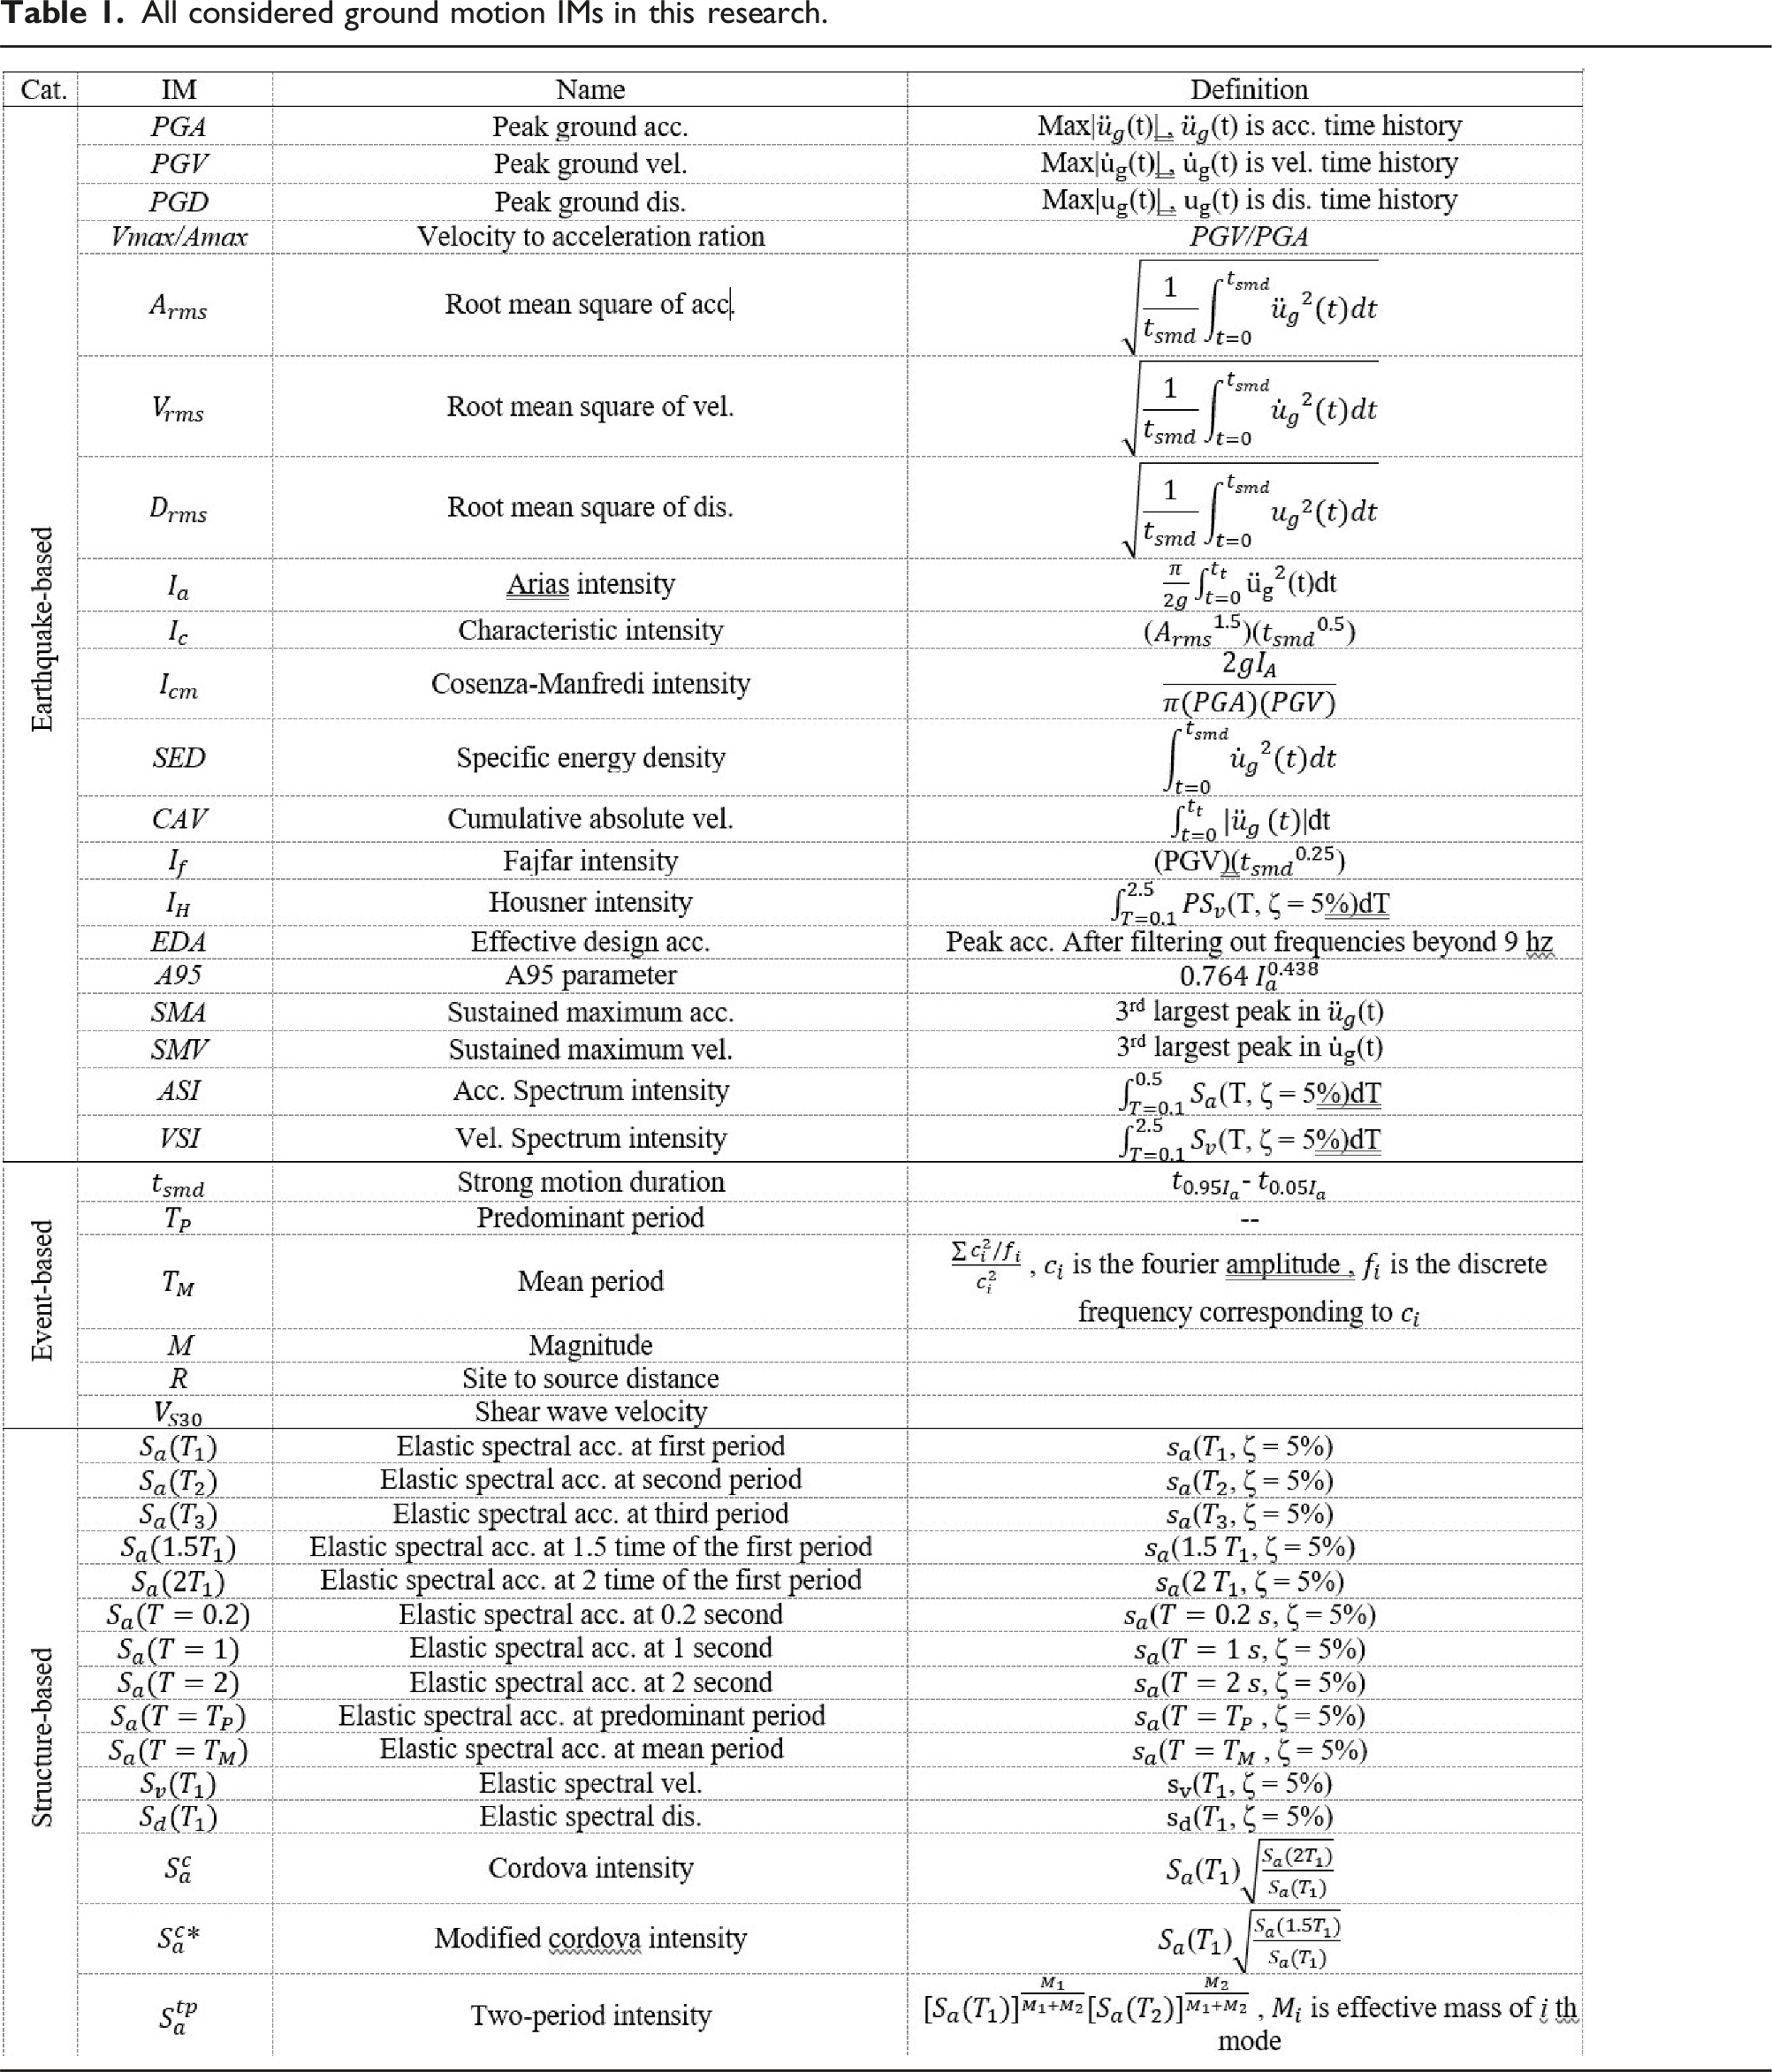
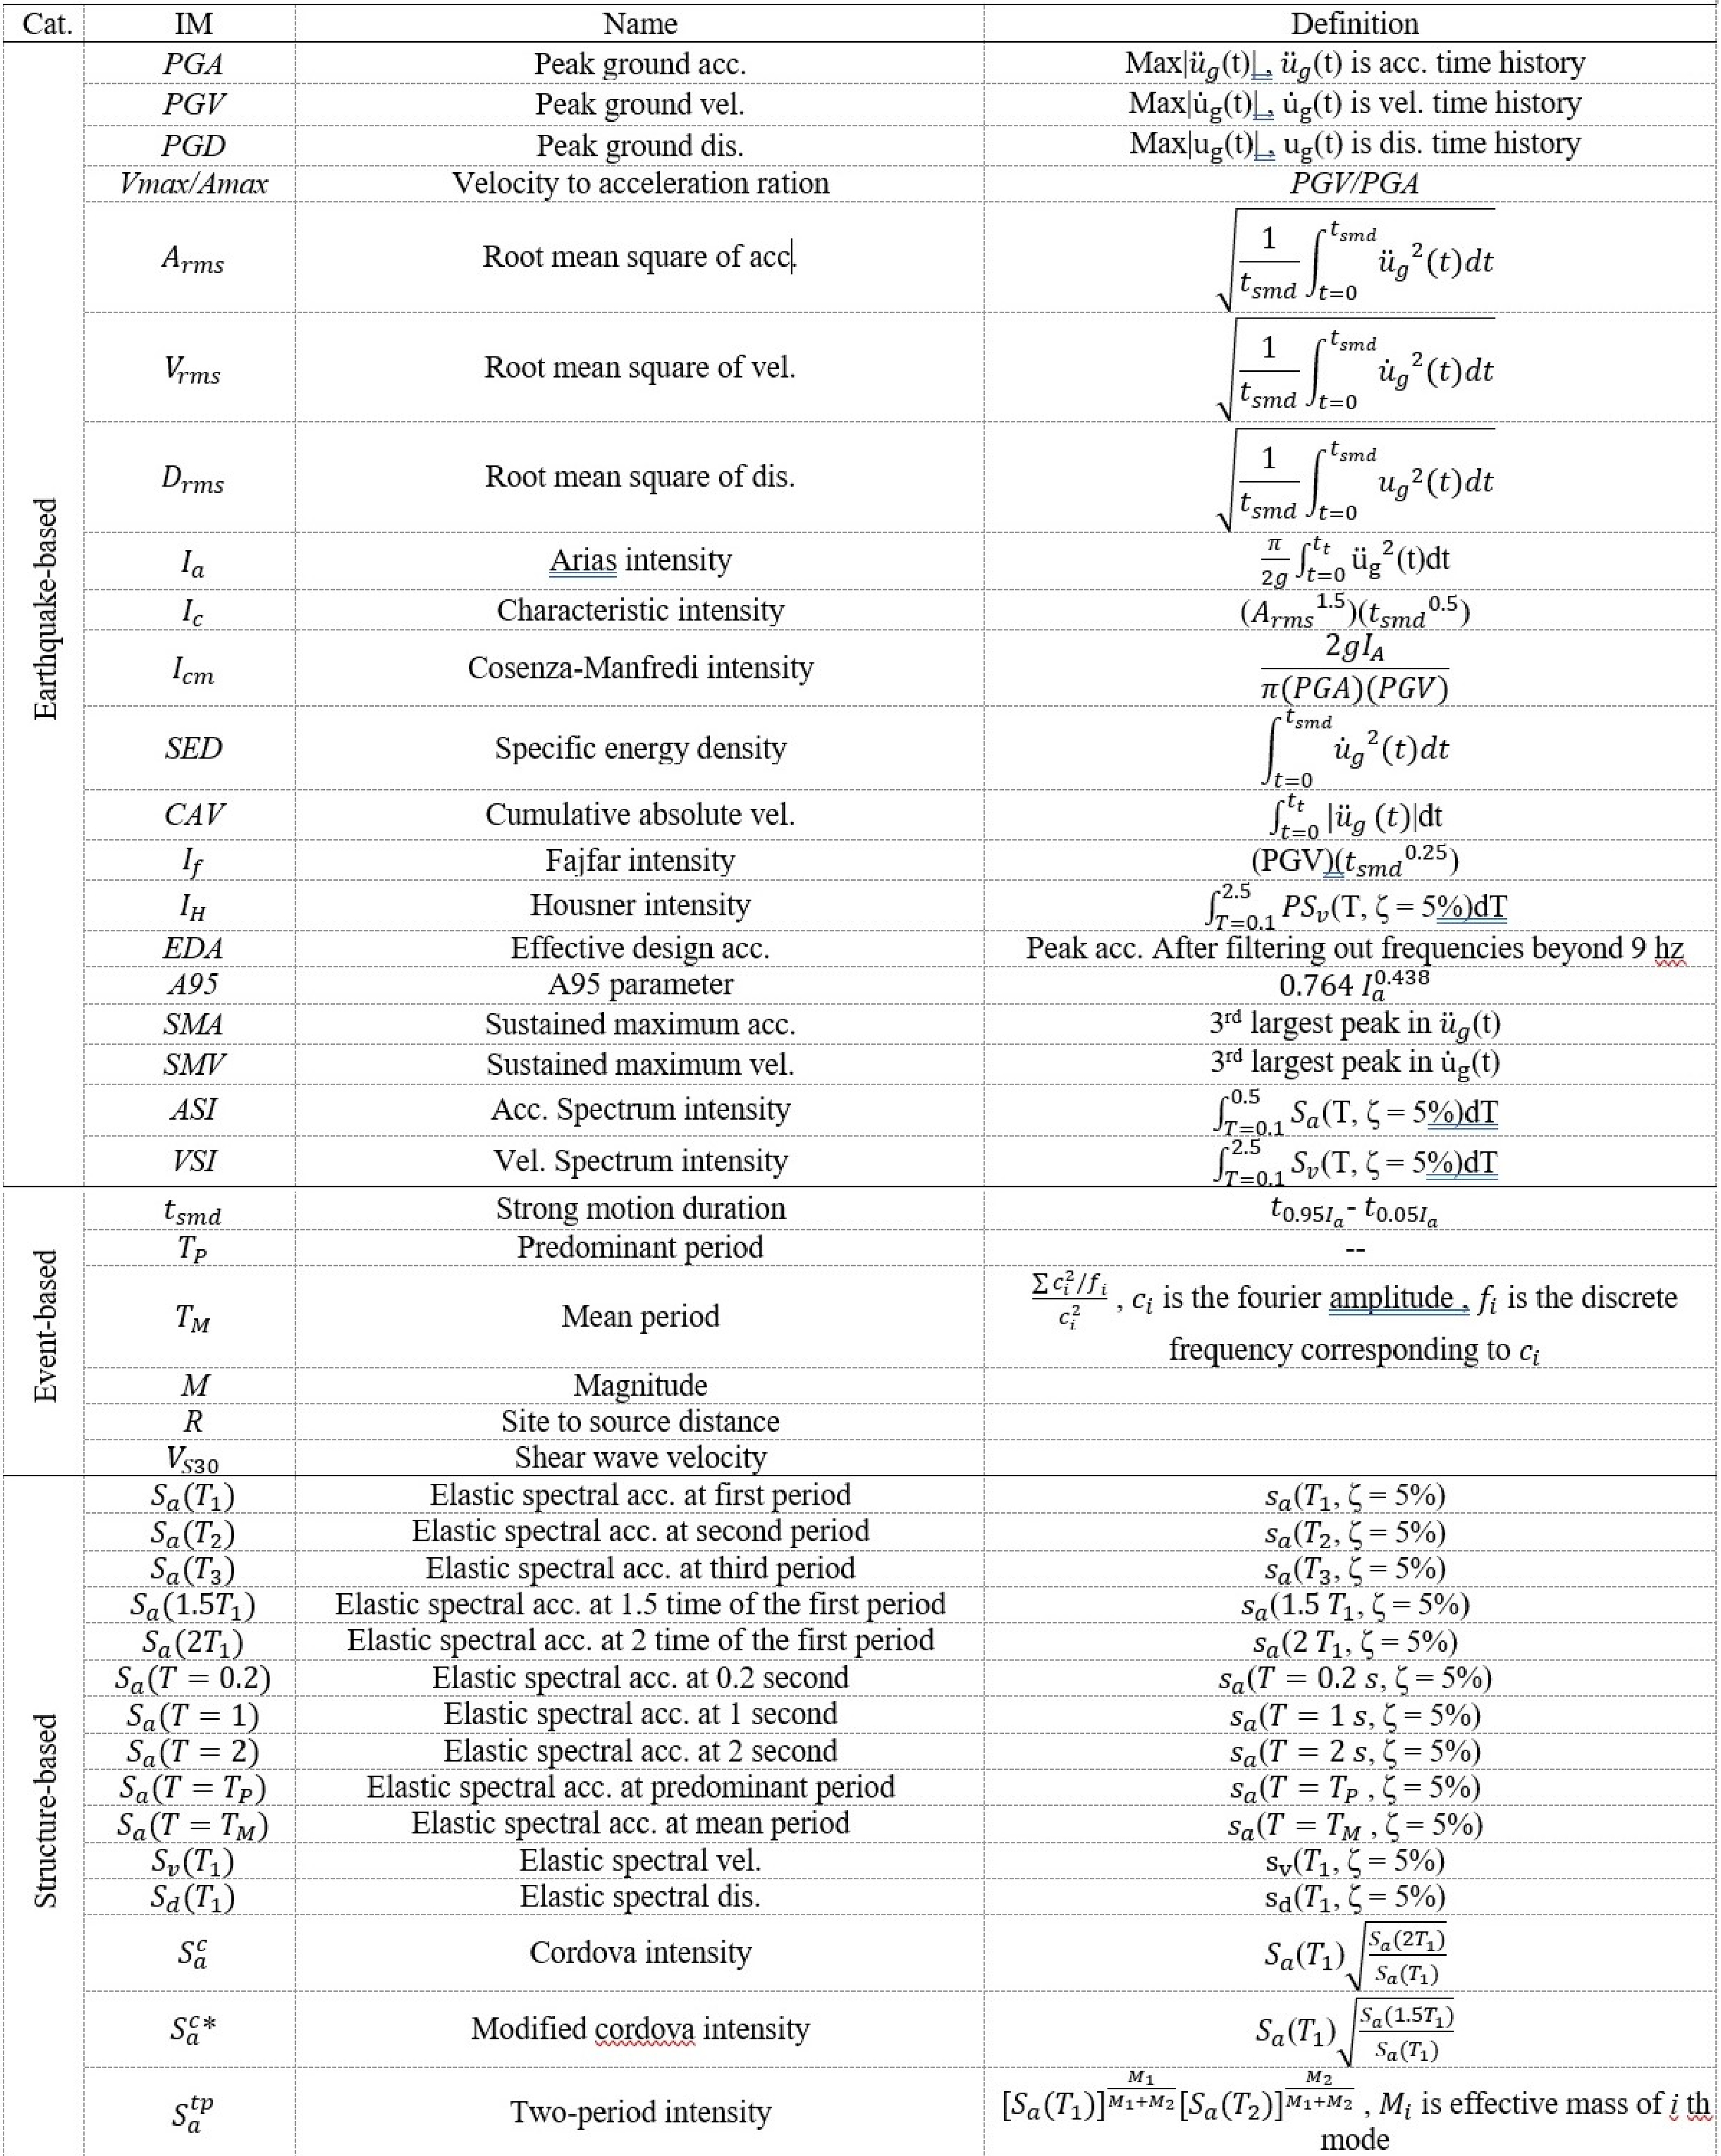
All considered ground motion IMs in this research.
Engineering Demand Parameters (EDPs)
It is crucial to specify the responses produced from time-history studies in such a way that they may be used to demonstrate demand in the structure. To calculate the seismic demands applied to the intake tower structure, the EDPs were defined as nonlinear finite element analysis results. The EDPs can show structural damage in two ways of locally and globally. The EDPs chosen for this study were classified into three types based on: (1) displacement, (2) damage-based including tower’s local tensile damage index (DT index) and local equivalent plastic strain index (PEEQ index) and maximum equivalent plastic strain in steel bar (max PEEQ R ), and (3) energy-based including energy dissipated in steel bar due to plastic deformation (ALLPD R ) and in the tower due to cracking damage (ALLDMD T ) and plastic damage (ALLPD T ). A more detailed description of these energies can be found in ABAQUS’ user manual (Dassault Systèmes, 2016).
Local EDPs can better characterize the structural response in comparison to global EDPs. To address these issues, the EDPs such as the intake tower’s local tensile damage index (DT index) and the intake tower’s local equivalent plastic strain index (PEEQ index) were developed. Eq. (6) defines the calculation of these EDPs, where dt is the value of tensile damage and peeq is the value of equivalent plastic strain in each element with a volume of V that are derived as outputs of finite element structural analysis (Gavabar and Alembagheri, 2018).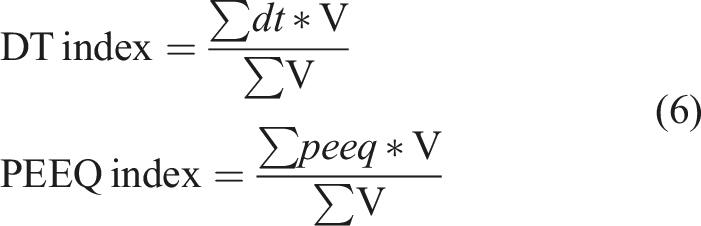
If the values of eq. (6) approach zero, it indicates that there are no concrete element cracks. If they approach one, it indicates that the crack has pierced the whole structure of the intake tower. Damage to steel bars was detected utilizing the maximum equivalent plastic strain in steel bars (
Seismic Demand Hazard Curves
The probabilistic seismic hazard analysis (PSHA) calculates the probability that the mean annual value of an intensity measure such as spectral acceleration (
Assuming that the size hazard curves can be estimated in the span of quantities in the range of hazard levels in the vicinity of limit states probability 
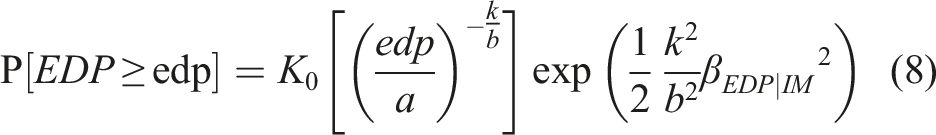
Seismic demand hazard curves are built using eq. (8), where exp (.) is the exponential function. It may be used to calculate the mean yearly likelihood of surpassing any EDP, whose dynamic behavior may be very nonlinear for any given ground motion IM with substantial dynamic response variability. Coefficients a and b were derived from eq. (3), and the dispersion value in which the curve is lognormally distributed was defined by eq. (5). In this study, it was assumed that the submerged intake tower was located in an area with high seismicity and a high probability of earthquake occurrence. Thereby, the coefficients
The fragility and seismic demand hazard curves are similar in that they both depend on seismic intensity measures. The two types of curves are crucial to seismic risk assessment and management, providing probabilistic measures of earthquake performance and damage. However, fragility curves differ from earthquake demand hazard curves in focus and application. Based on seismic intensity, fragility curves provide probabilistic damage assessments of a structure. Seismic demand hazard curves, on the other hand, depict the relationship between seismic demands (such as displacements or forces) and their annual exceedance probabilities. Fragility curves are intended to assess vulnerability and estimate loss; seismic demand hazard curves are intended to estimate expected seismic demands over a structure’s lifespan.
Optimal IM selection criteria
The next step is to compare the appropriateness of each IM regression relationship with structure response parameters. Based on several criteria that have already been presented, such as practicality (Mackie and Stojadinović, 2002), efficiency, the goodness of fit, proficiency (Padgett et al., 2008), and sufficiency (Luco and Cornell, 2007), the appropriate IMs will be selected. The goodness of fit criterion describes the proportion of the variance between dependent and independent variables by the mean of the R-squared coefficient in the linear regression of PSDMs (Chicco et al., 2021). If this number approaches one, the goodness of fit parameter will improve. The practicality test assesses the direct relationship between an IM and an EDP using coefficient b in the linear regression formula of PSDMs on a log-log space. A lower value indicates impracticality, while a higher value indicates practicality (Padgett et al., 2008).
The efficiency is defined by the standard deviation in PSDMs, which demonstrates dispersion as formulated in eq. (5). In addition, how much it becomes lower shows a more efficient IM that reduces variability and dispersion in seismic demand (Giovenale et al., 2004). The proficiency reflects both practicality and efficiency and is calculated by modified dispersion (ζ). A lower ζ value indicates a higher proficiency and denotes the uncertainty in PSDM. The sufficiency investigates whether optimal IM is statistically independent of ground motion features, like magnitude (M), epicentral distance (R), and predominant period (
Intake tower-water-soil numerical model
The finite element approach using a finite-element based software ABAQUS (Dassault Systèmes, 2016), was utilized to model the selected submerged reinforced concrete intake tower and its interior water, full reservoir, and foundation soil. The rectangular intake tower was 45.5 m in height with an outside cross-section of 11 m by 8.5 m. The concrete thickness of the tower was 1 m, which was assumed to be constant along the tower height. The concrete was reinforced with steel bars with a diameter of 22 mm. 0.5 m height of the tower from the bottom was filled with concrete and it was expected to be rigid for restraining reinforced concrete bars. The reservoir outside the tower was supposed to be endless from all sides of the intake tower, with a width of 50 m, a length of 100 m, and a depth of Hi = 40 m. The tower’s inlet water was considered to be at the same depth as the surrounding reservoir. The foundation width, length, and height were taken into account in the same way as the reservoir was.
The reinforcing plan, 2D geometry of the system, and 3D image of the tower-water-soil system and mesh employed in this work are depicted in Figure 1. A massless foundation is postulated to avoid amplification of the ground motion from the foundation base to the ground level (Aghaeipoor and Alembagheri, 2022). When the selected near-fault records were uniformly applied to the tower underneath in a longitudinal orientation, only its elasticity was addressed. The reservoir truncated far ends were given non-reflecting (transmitting) boundary conditions, and a zero-pressure condition was assumed for the reservoir free surface as well as inside water, suggesting that surface waves were not considered. There was no water flow at the water-tower interface. This assumption was based on the fact that the tower’s surface is impermeable, which implies no relative velocity in the direction perpendicular to a shared boundary between the tower and the water (Hajirezaei and Alembagheri, 2020). (a) Intake tower reinforcement design, (b) 2D geometry of the intake tower-reservoir-foundation system, (c) 3D finite element mesh of the intake tower, and (d) finite element mesh of the whole system.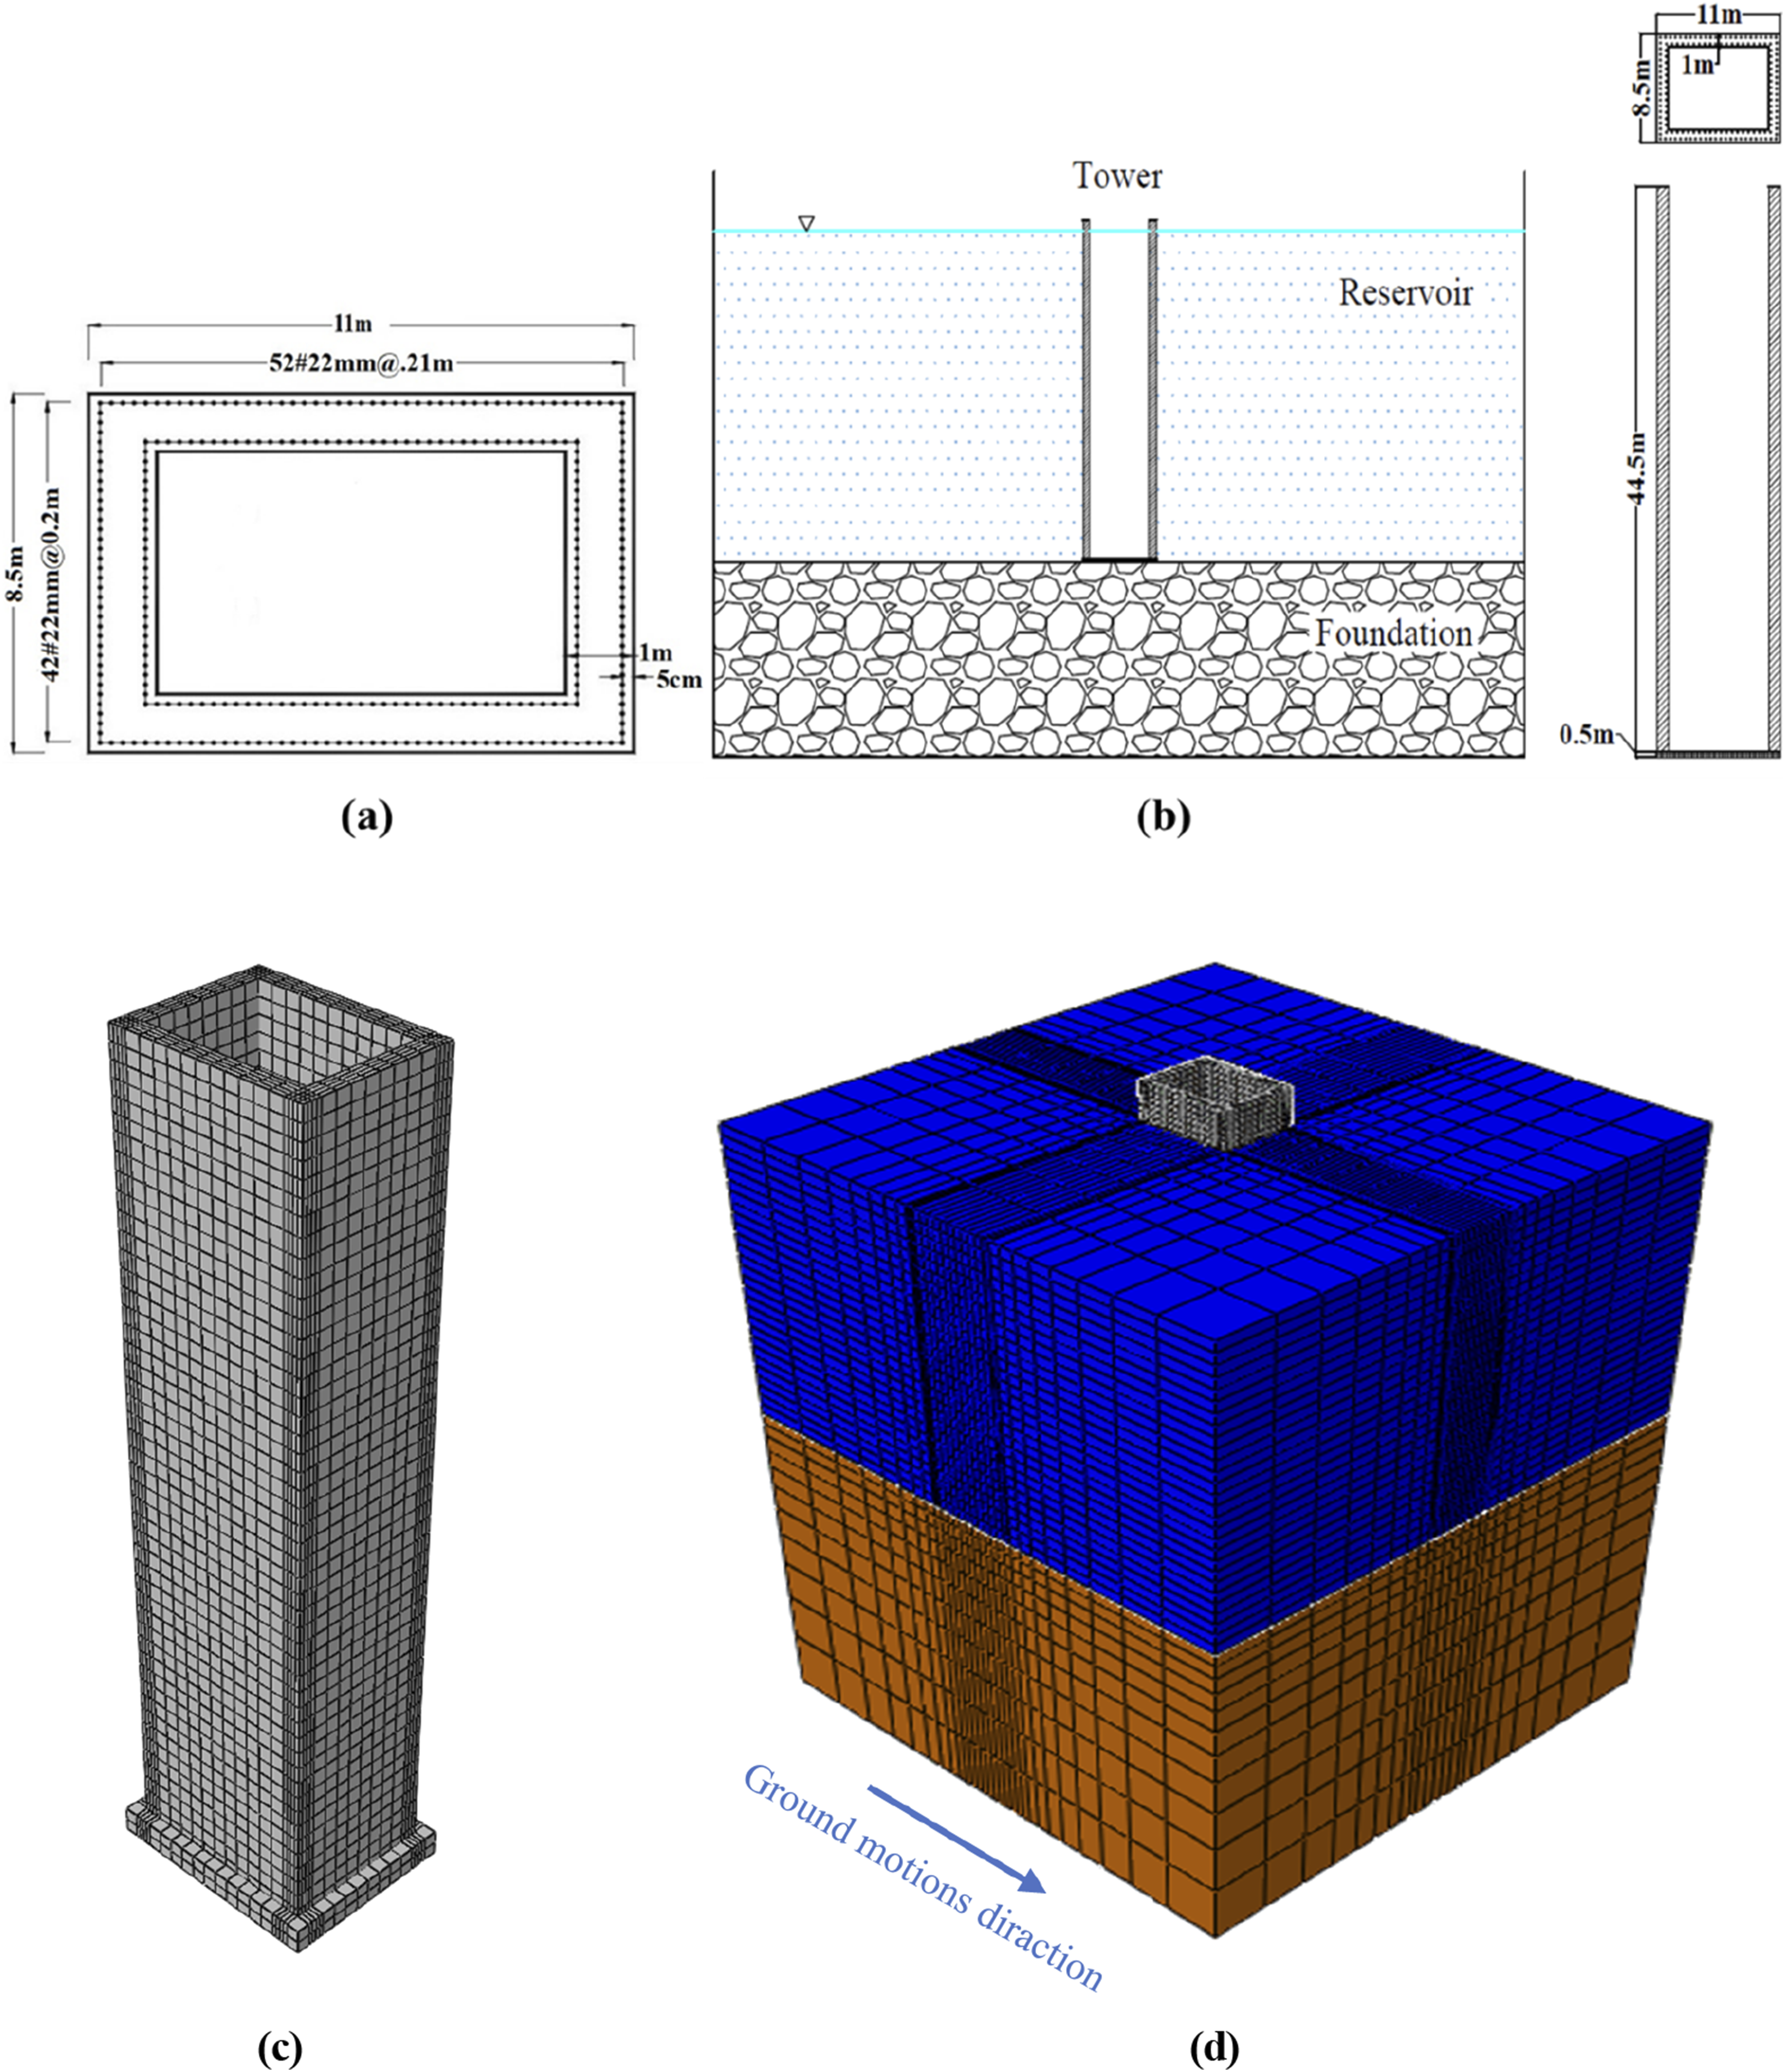
The Eulerian-Lagrangian formulation was adopted to account for the dynamic interaction of soil, water, and structure. The outside reservoir and inner water were represented using the Eulerian formulation (pressure-based linear elements), whereas the tower and soil foundation were modeled using the Lagrangian displacement-based formulation. The element type for the outside reservoir and inner water was 8-node linear acoustic brick with reduced integration (AC3D8R). The element type for the intake tower and foundation was 8-node linear brick with reduced integration (C3D8R) and the 2-node linear beam (B31) element type was used for reinforcement. Finally, using the surface-based tie constraint in the software, the structure-water-soil interaction was modeled and simulated.
Figure 2 shows the constitutive behavior of the concrete material of the intake tower structure for tensile cracking and compressive crushing used in this study. The curves and parameters for concrete’s nonlinear behavior in tension and compression were obtained from a previous experimental study (Kachlakev et al., 2001). That study modeled the nonlinear behavior in finite-element software and compared the predictions with the experimental results. The key material characteristics for concrete are density (2400 kg/m3), Poisson’s ratio (υ
c
= 0.17), and compressive strength (30 MPa) for both static and dynamic analysis. Water has a unit mass of 1000 kg/m3, and its bulk modulus (K
w
) is considered to be 2.07 GPa, indicating that it is compressible. The tower’s dynamic analysis takes advantage of the massless foundation model, which has a Young’s modulus of elasticity (E
r
) of 27 GPa and a Poisson’s ratio (v
r
) of 0.33. The unit mass ρs = 7850 kg m−3, the Poisson’s ratio v
s
= 0.3, and the Young’s modulus of elasticity Es = 200 GPa are the material parameters of steel reinforcement. It should be noted that the precision of ABAQUS software in modeling structure-soil-water interaction and the nonlinear behavior of reinforced concrete were previously examined using experimental and numerical studies. The detailed description of these verifications is available in the references (Bigdeli et al., 2023; Haghgou et al., 2021). Concrete’s constitutive behavior: (a) uniaxial compression and (b) uniaxial tension (Kachlakev et al., 2001).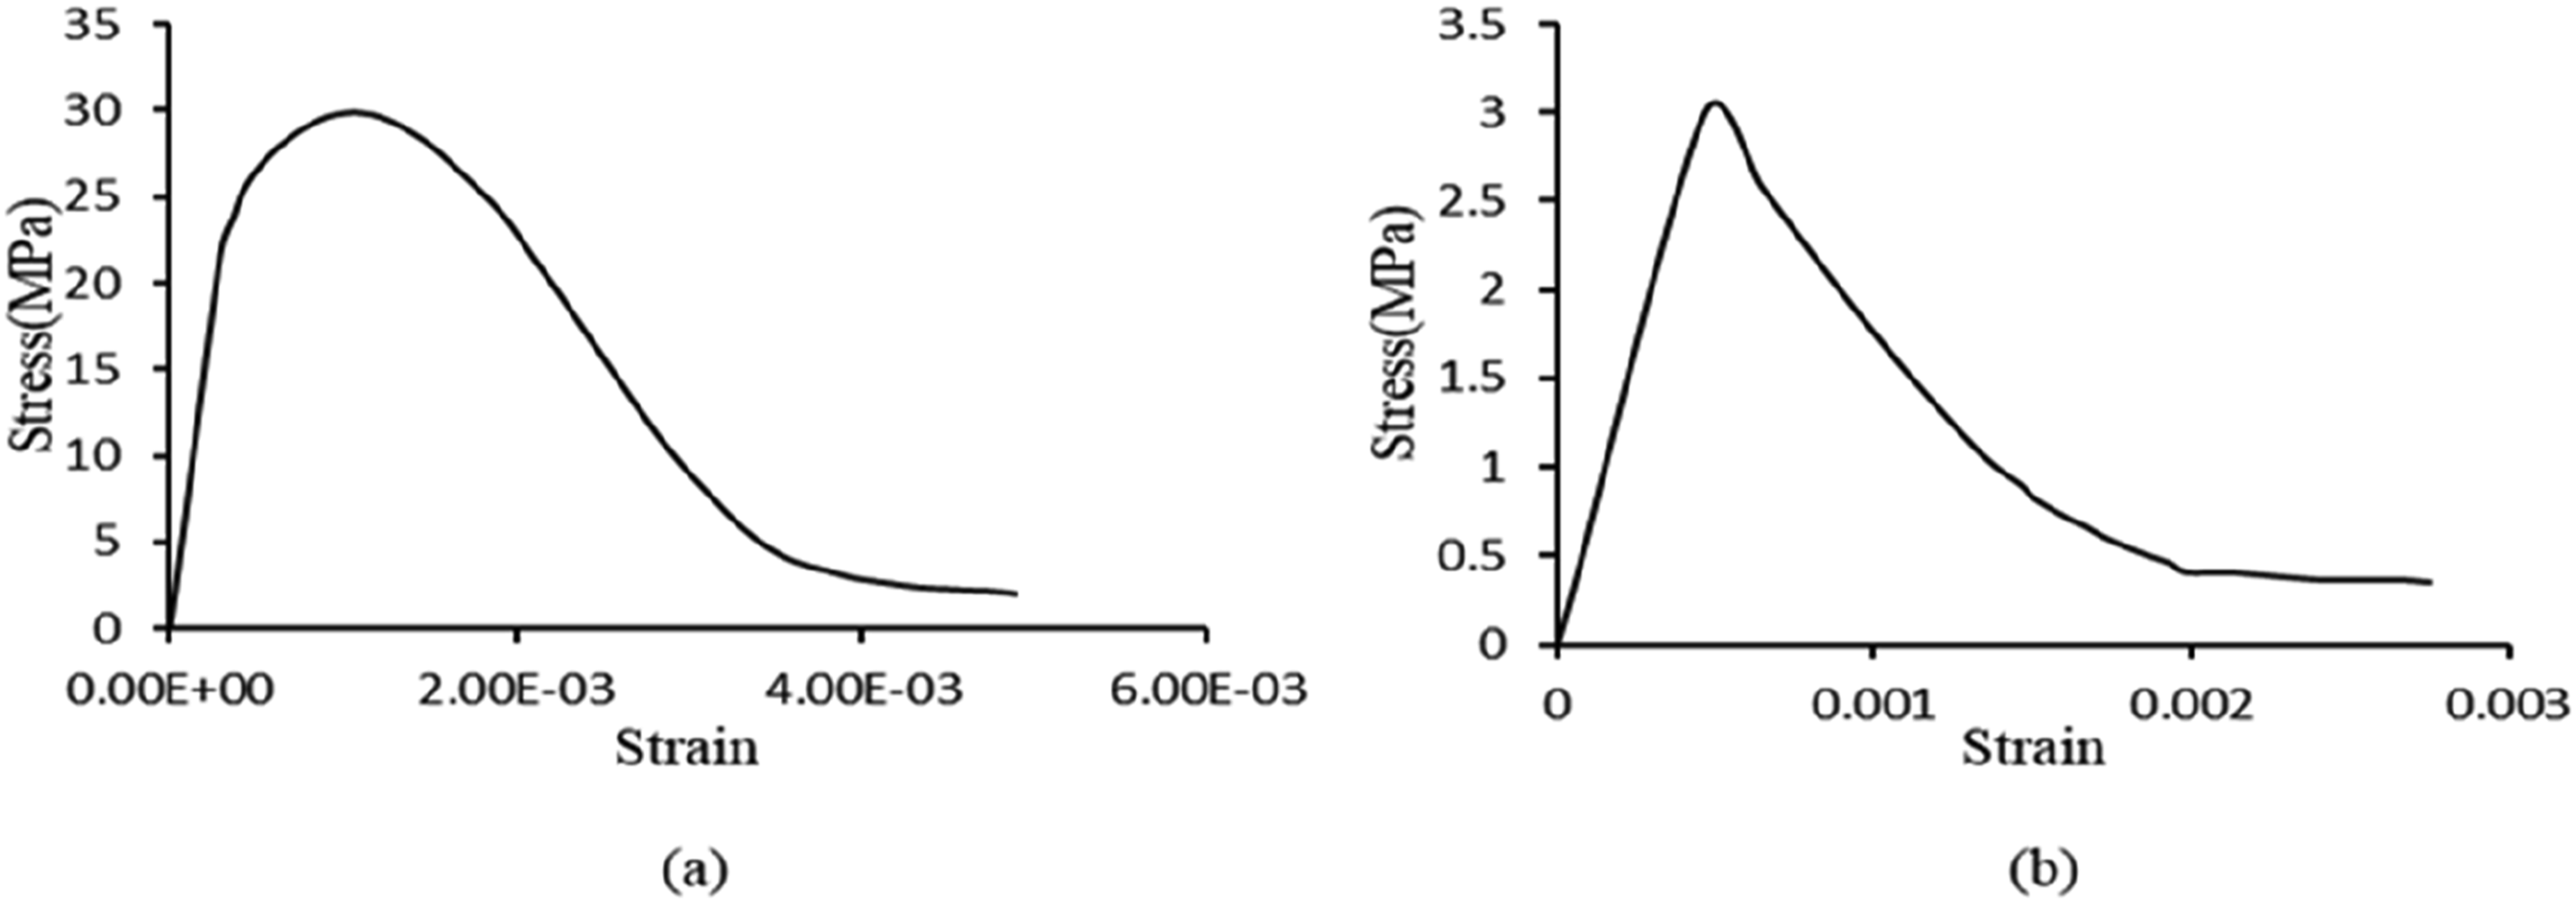
In the first step of the analysis, the intake tower’s own weight load (gravity) and the reservoir’s hydrostatic pressure (inlet water and surrounding reservoir) were taken into account to analyze the model statistically. It was then dynamically analyzed using the chosen near-fault records. The structural elements in the first and third vibration modes of the intact model were dampened with a Rayleigh damping coefficient of 5% critical damping. According to the given parameters, the system’s first three natural periods were T1 = 0.48 s, T2 = 0.10 s, and T3 = 0.064 s.
Results and discussion
In this study, the considered EDPs were calculated for each earthquake record. Because of the nature of some EDP definitions, they might receive zero responses when applying certain records. As a result, zero responses were removed to compare responses more effectively. Then, the PSDMs were constructed, and the optimal intensity measures were chosen among the entire IMs set based on the goodness of fit, efficiency, practicality, sufficiency, and proficiency. Finally, utilizing the PBEE approach, structural fragility curves were presented for better decision-making in the initial vulnerability evaluation of the intake tower structures.
Optimal IM selection: EDP = Disp
Comparison of IMs optimal criterion for maximum intake tower’s top to bottom displacement (Disp).
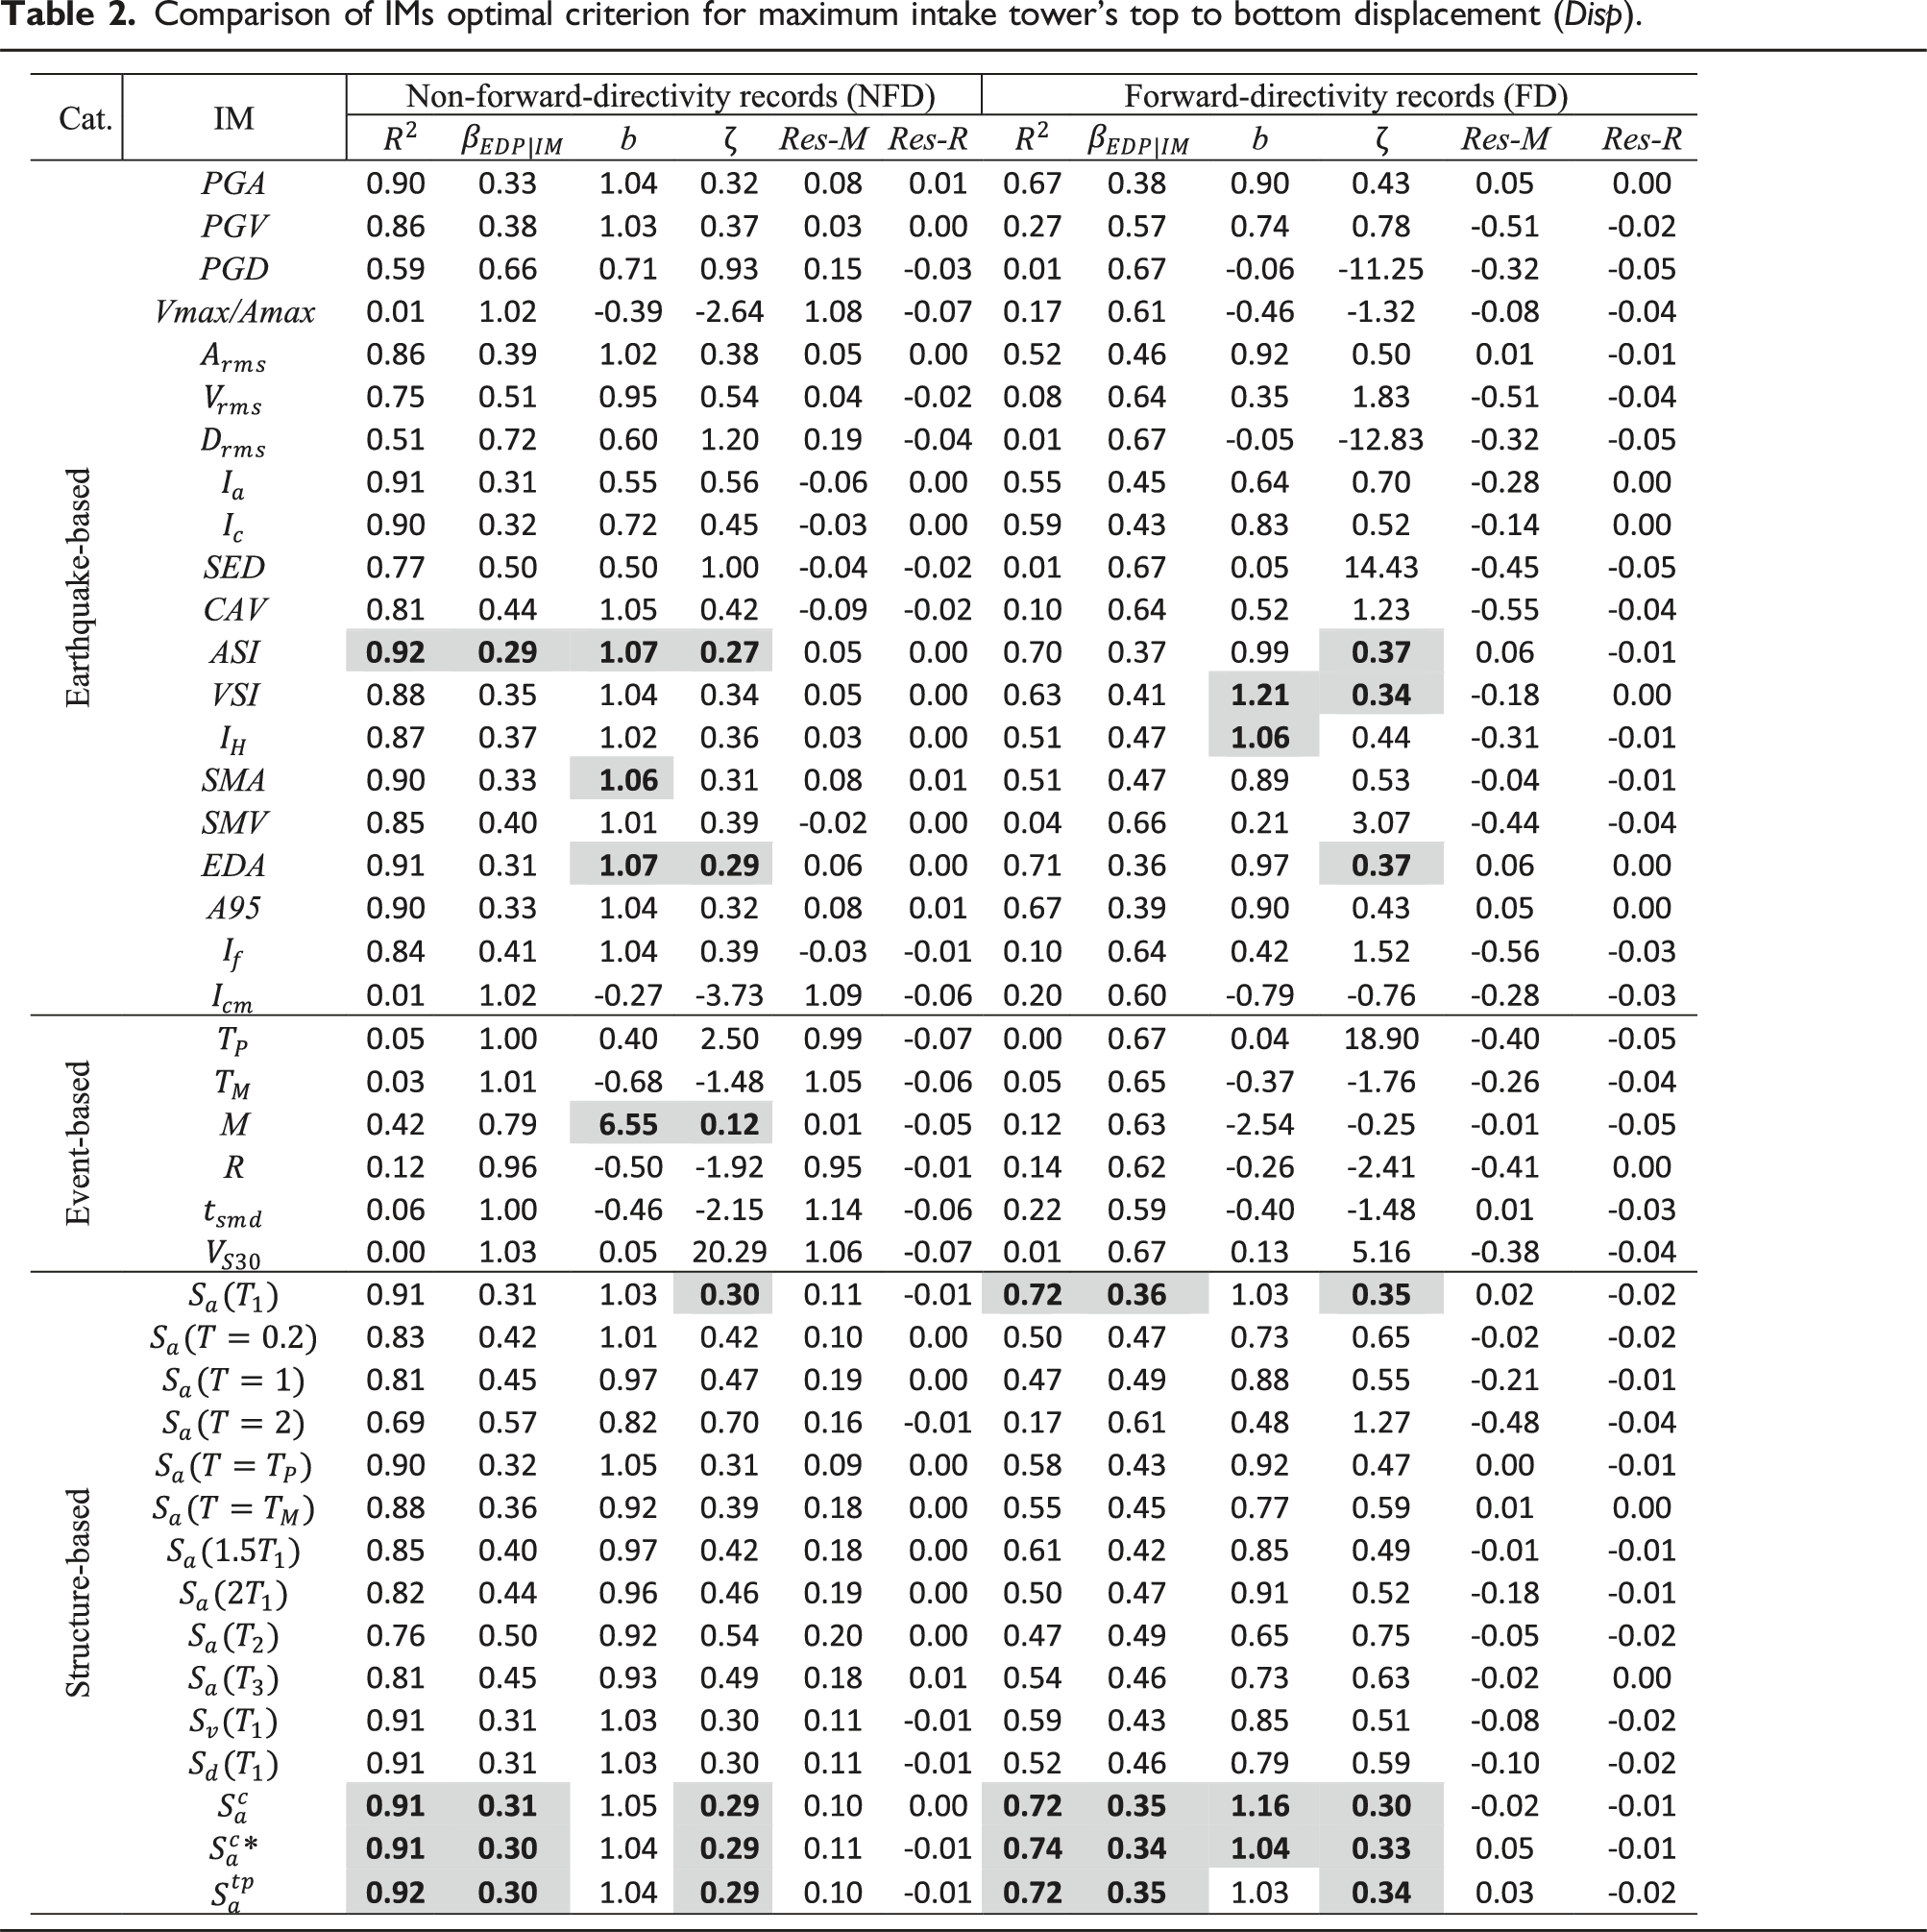
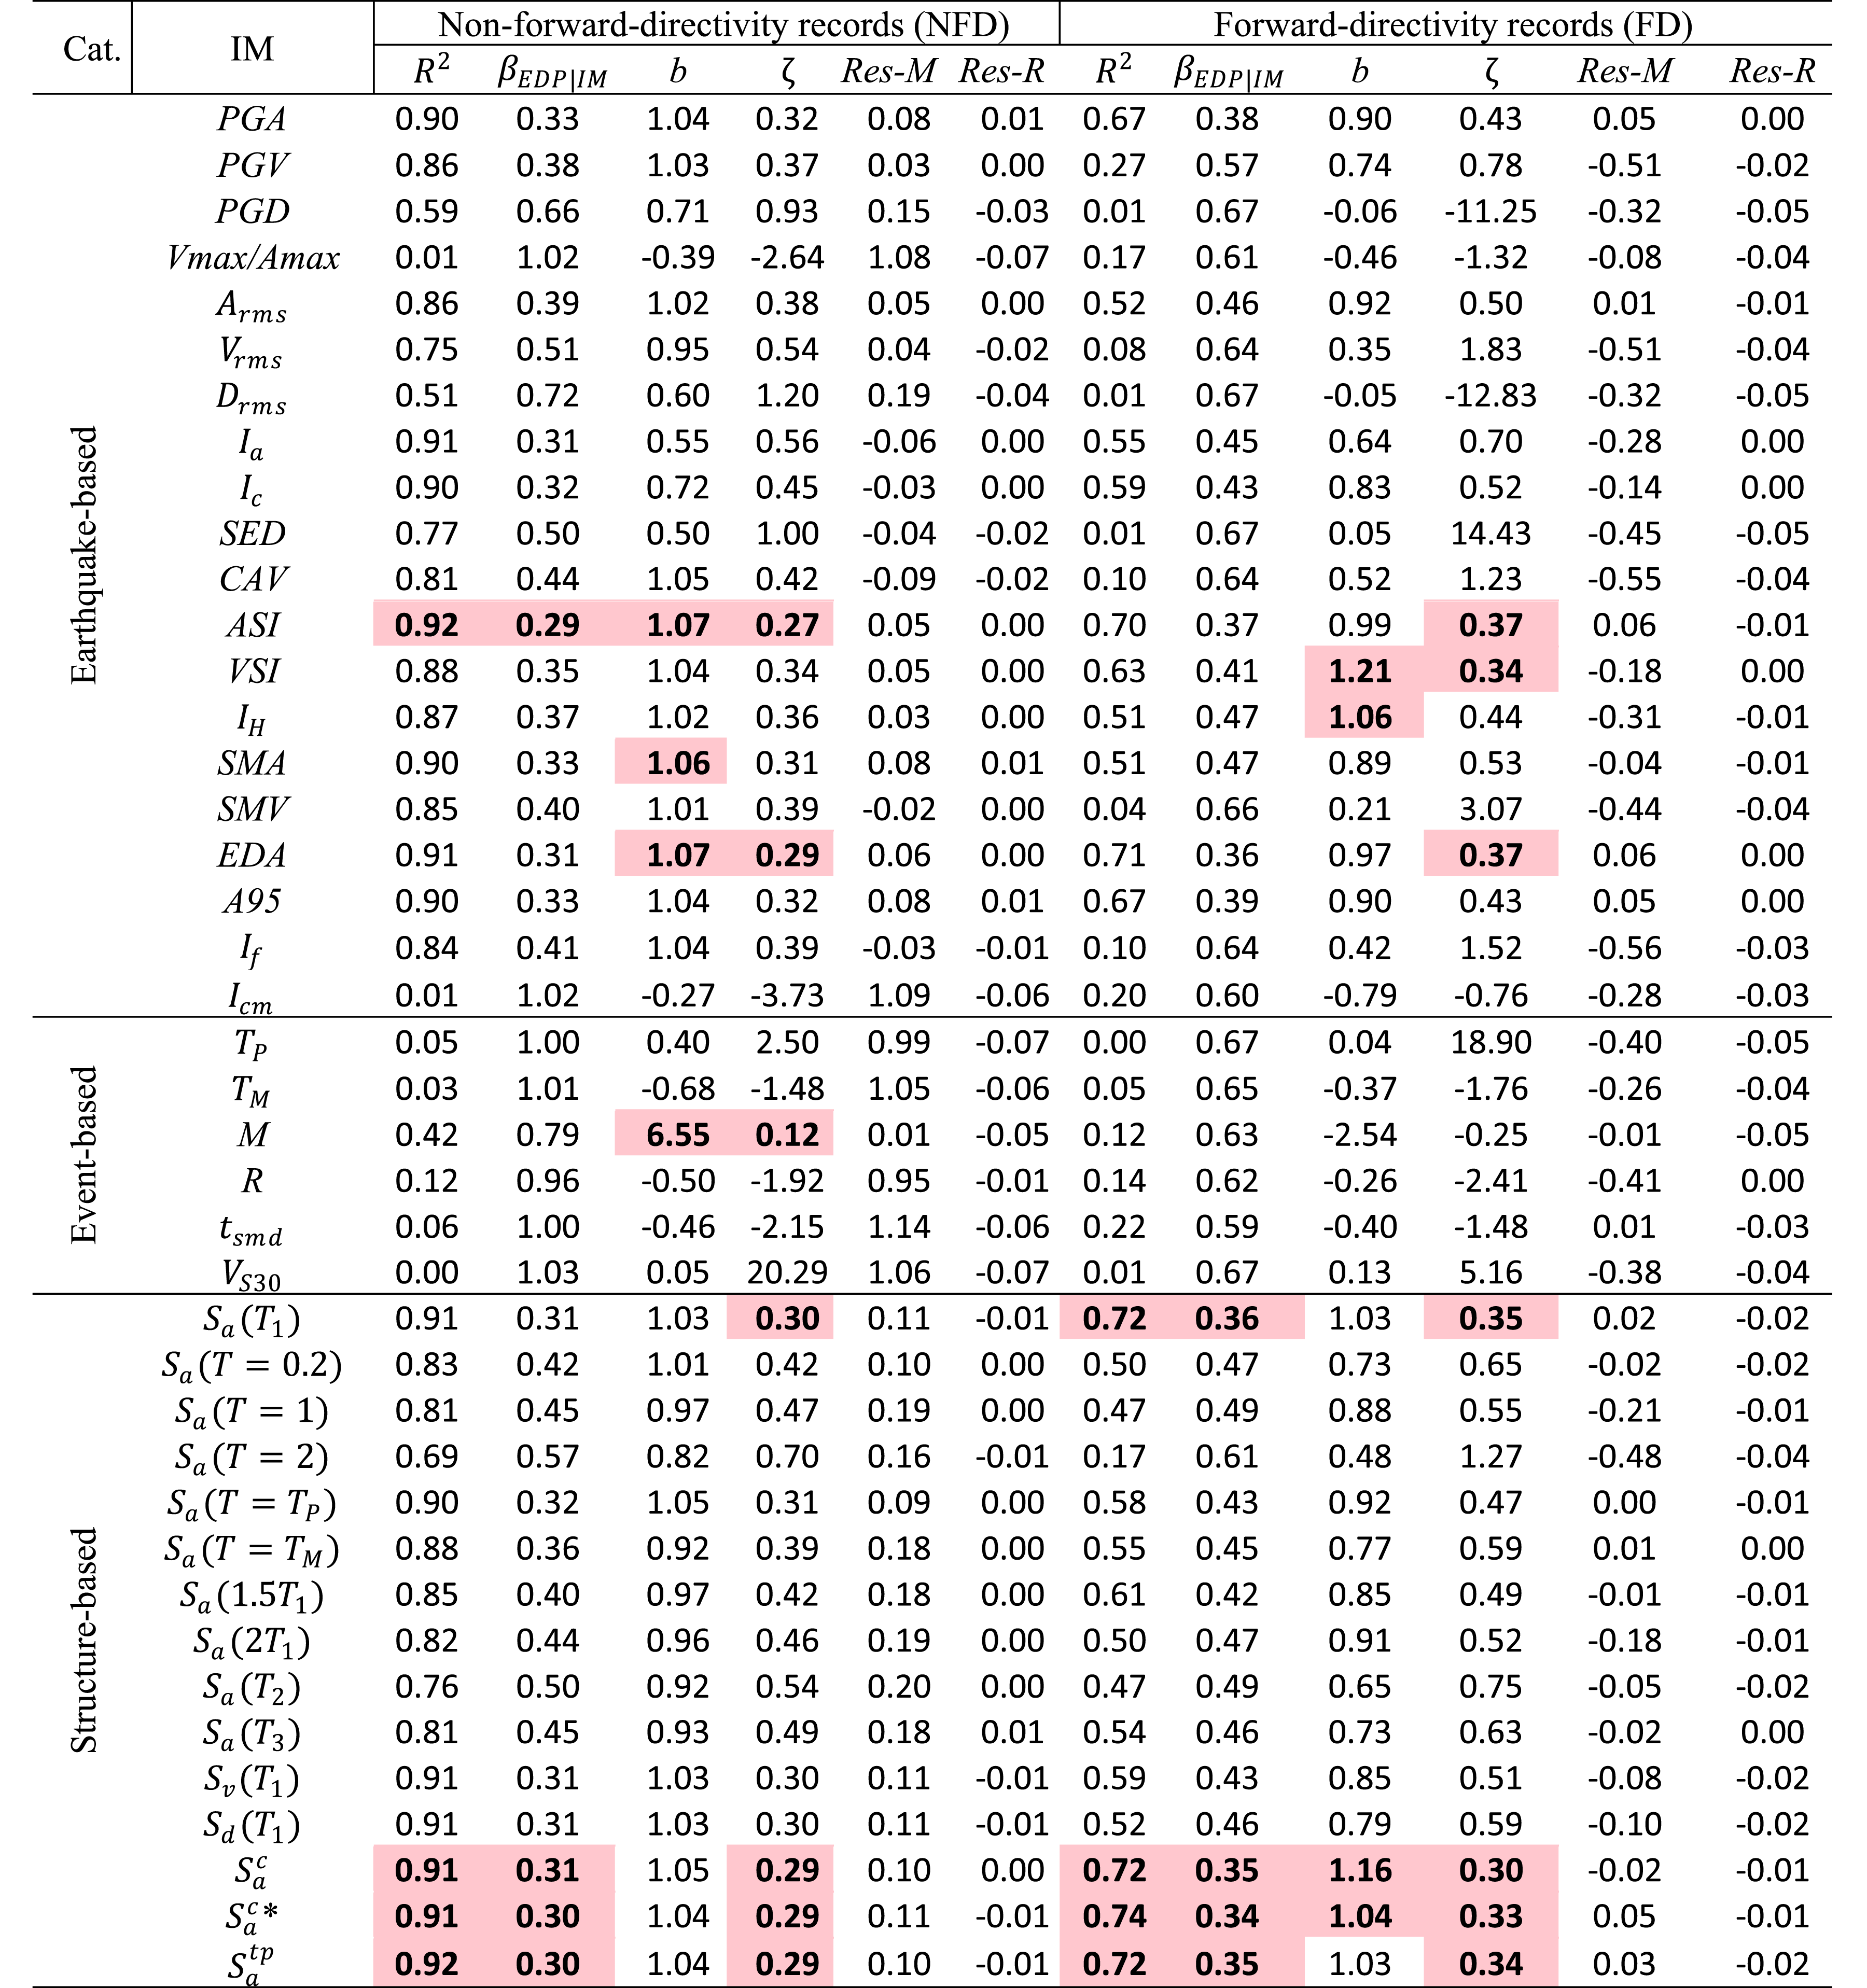
Figure 3 illustrates the results of the PSDMs from the maximum top-to-bottom displacement of an intake tower (Disp) against PGA, ASI, PSDMs of intake maximum top to bottom displacement against (a) PGA, (b) ASI, (c) 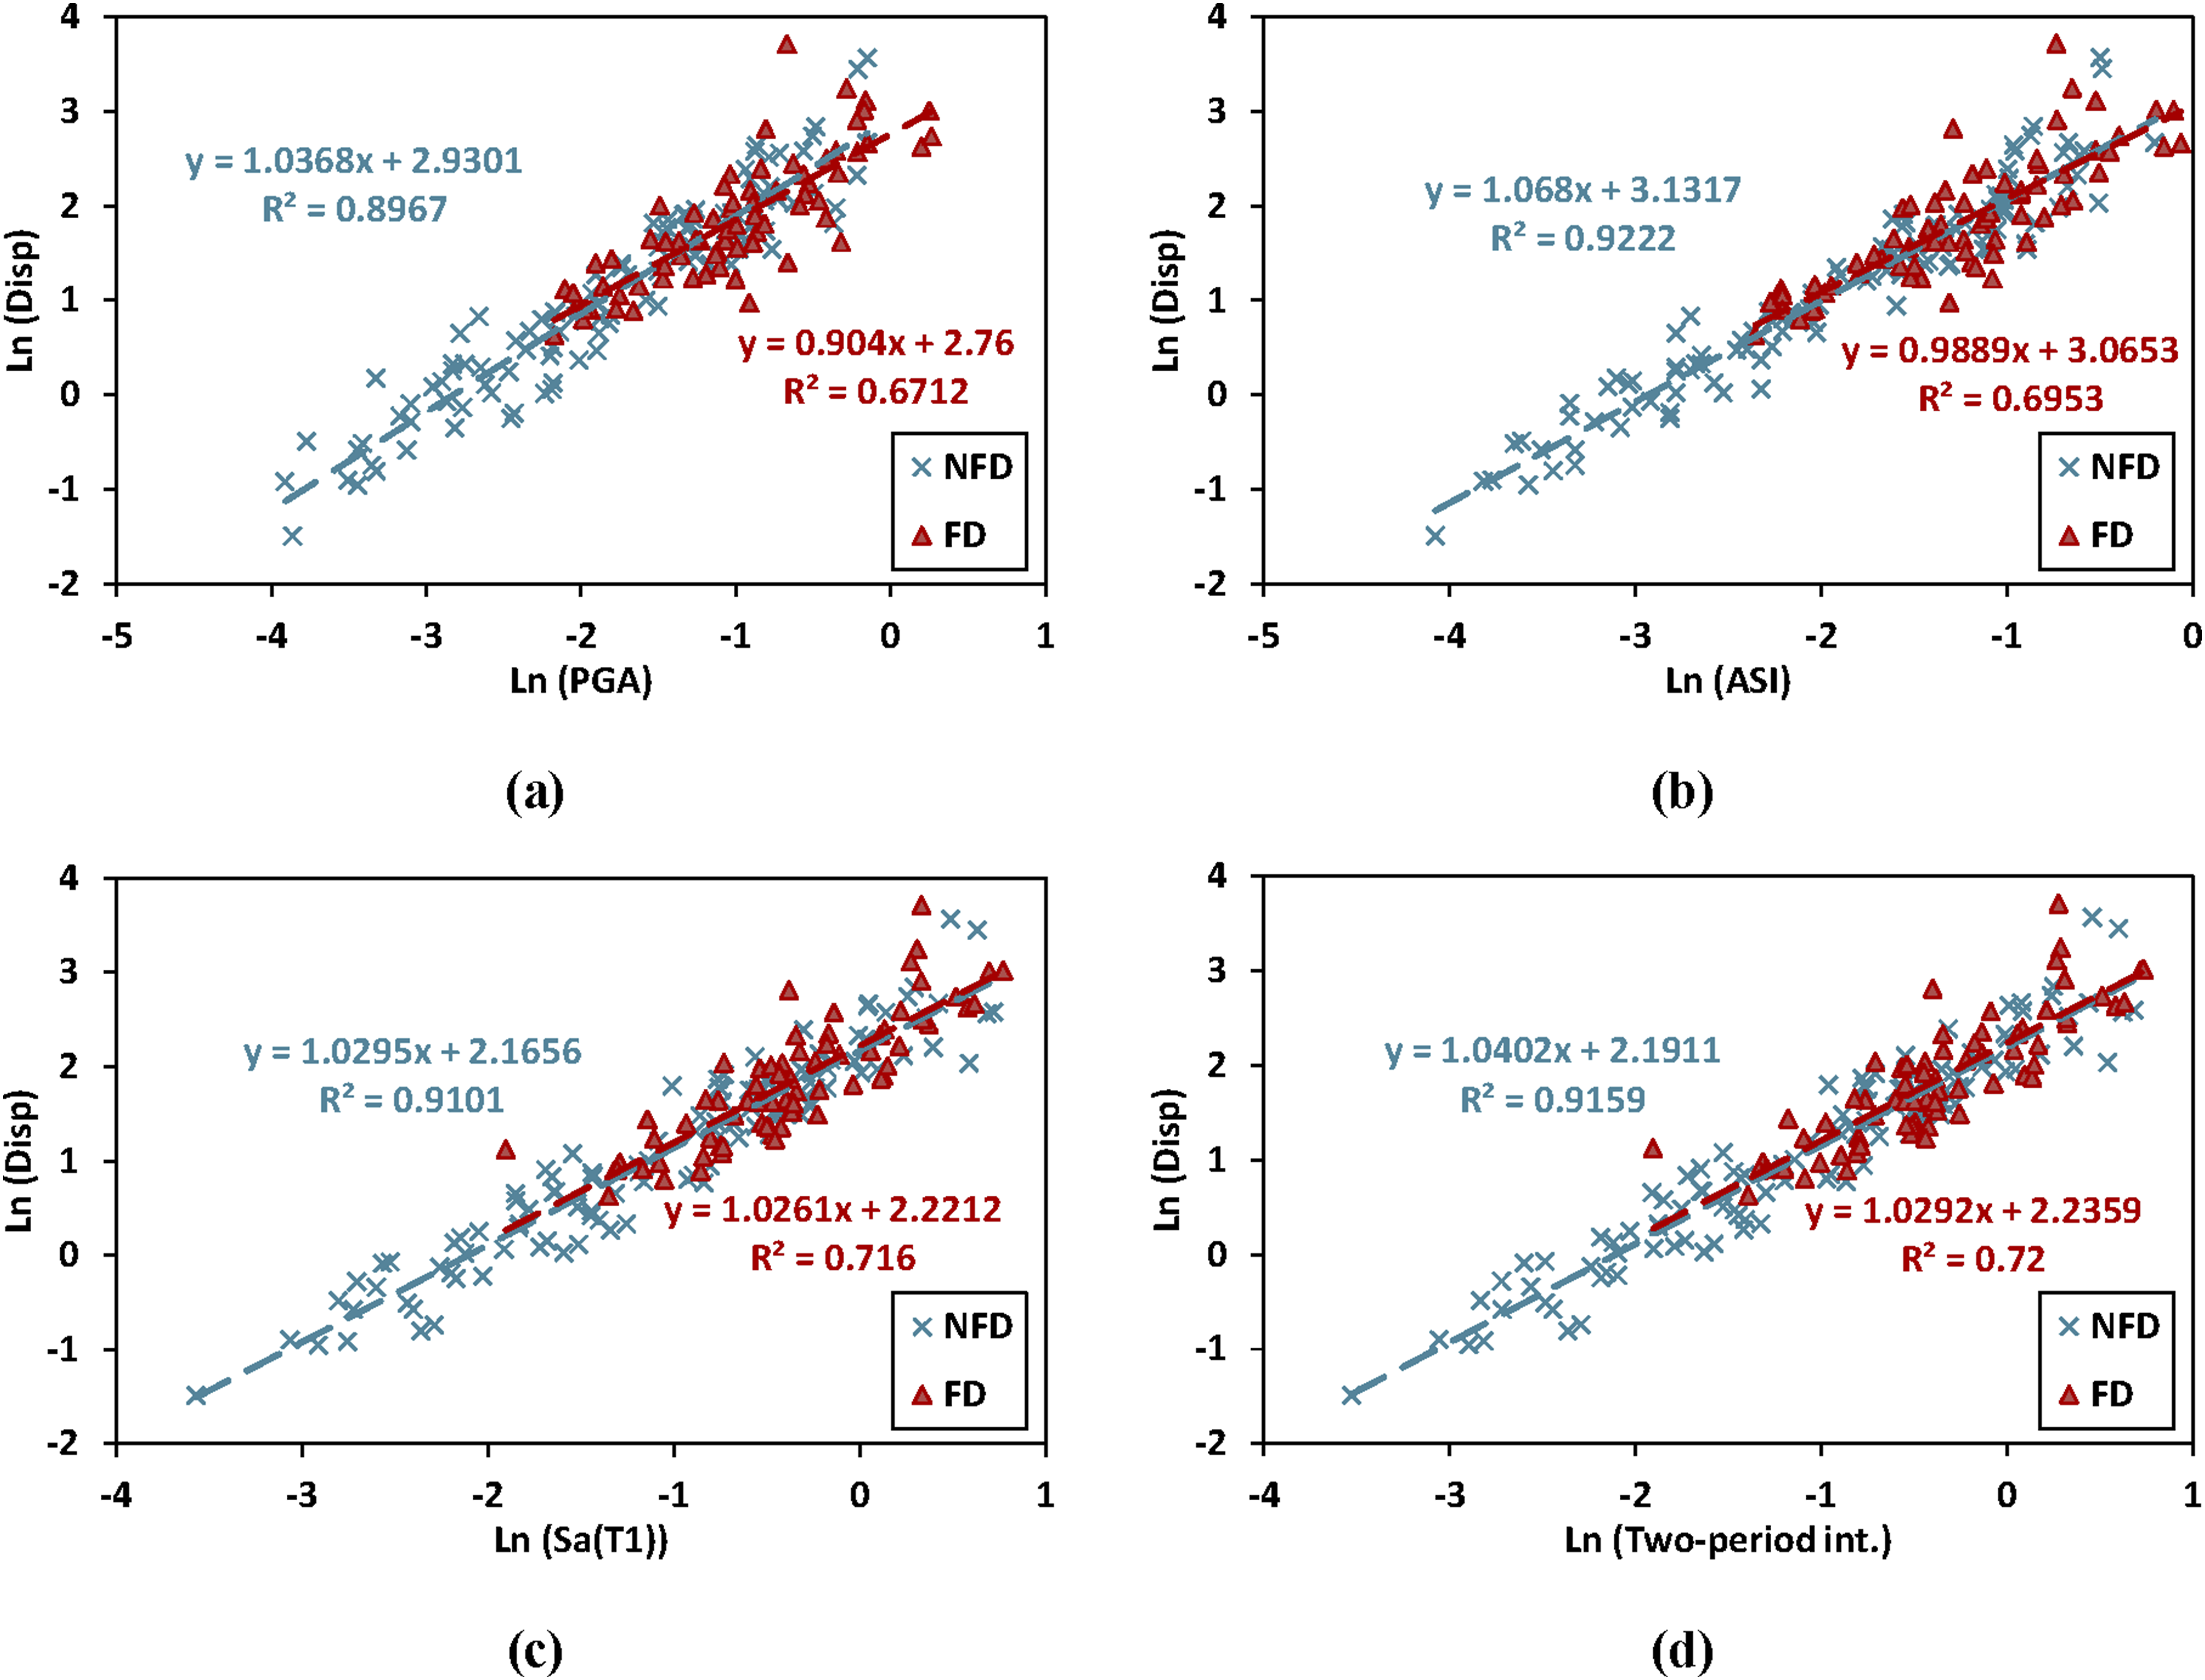
Generally, the goodness-of-fit and efficiency criteria have the same meaning in selecting the optimal IM due to the similarity in their definitions. Therefore, every IM with the least
Table 2 shows that the least
The practicality is measured by the coefficient b in the linear regression of the PSDMs, which denotes the slope of the line. It cannot be a suitable method for picking the optimal IMs on its own and should be utilized in conjunction with other selections’ criteria. It is preferable for different IMs to have a regression slope line close to unity when evaluating their practicality. Thus, based on these explanations and the data presented in Table 2 for the coefficient b (slope of linear regression), the majority of IMs were almost practical, with the exception of those with negative b values and high slopes with values far greater than one. When the results of NFD and FD records were compared, NFD records produced more practical IMs than FD records.
It can also be seen in Table 2 that ASI, EDA, and PGA could be appropriate earthquake-based IMs for NFD records. Besides
The sufficiency criterion was used in the final step to show how much the selected IMs were dependent on ground motion event characteristics. To determine the IM sufficiency, the IM-EDP residuals linear regression on M and R was examined. A lower regression line slope suggested a sufficient IM independent of the ground motion features and demonstrated that the demand models were enough to neglect the conditional probability. The residuals of Disp are illustrated in Figure 4 in terms of M and R for both NFD and FD records. According to Table 2, the linear regression slope of the IM-EDP residuals was smaller when R was considered rather than M in the majority of IMs. This observation confirms the widely held belief (e.g., (Hariri-Ardebili and Saouma, 2016; Yazdani and Alembagheri, 2017a)) that in most cases R is preferable to M. Residual responses of the Disp in terms of M and R for (a) NFD records and (b) FD records.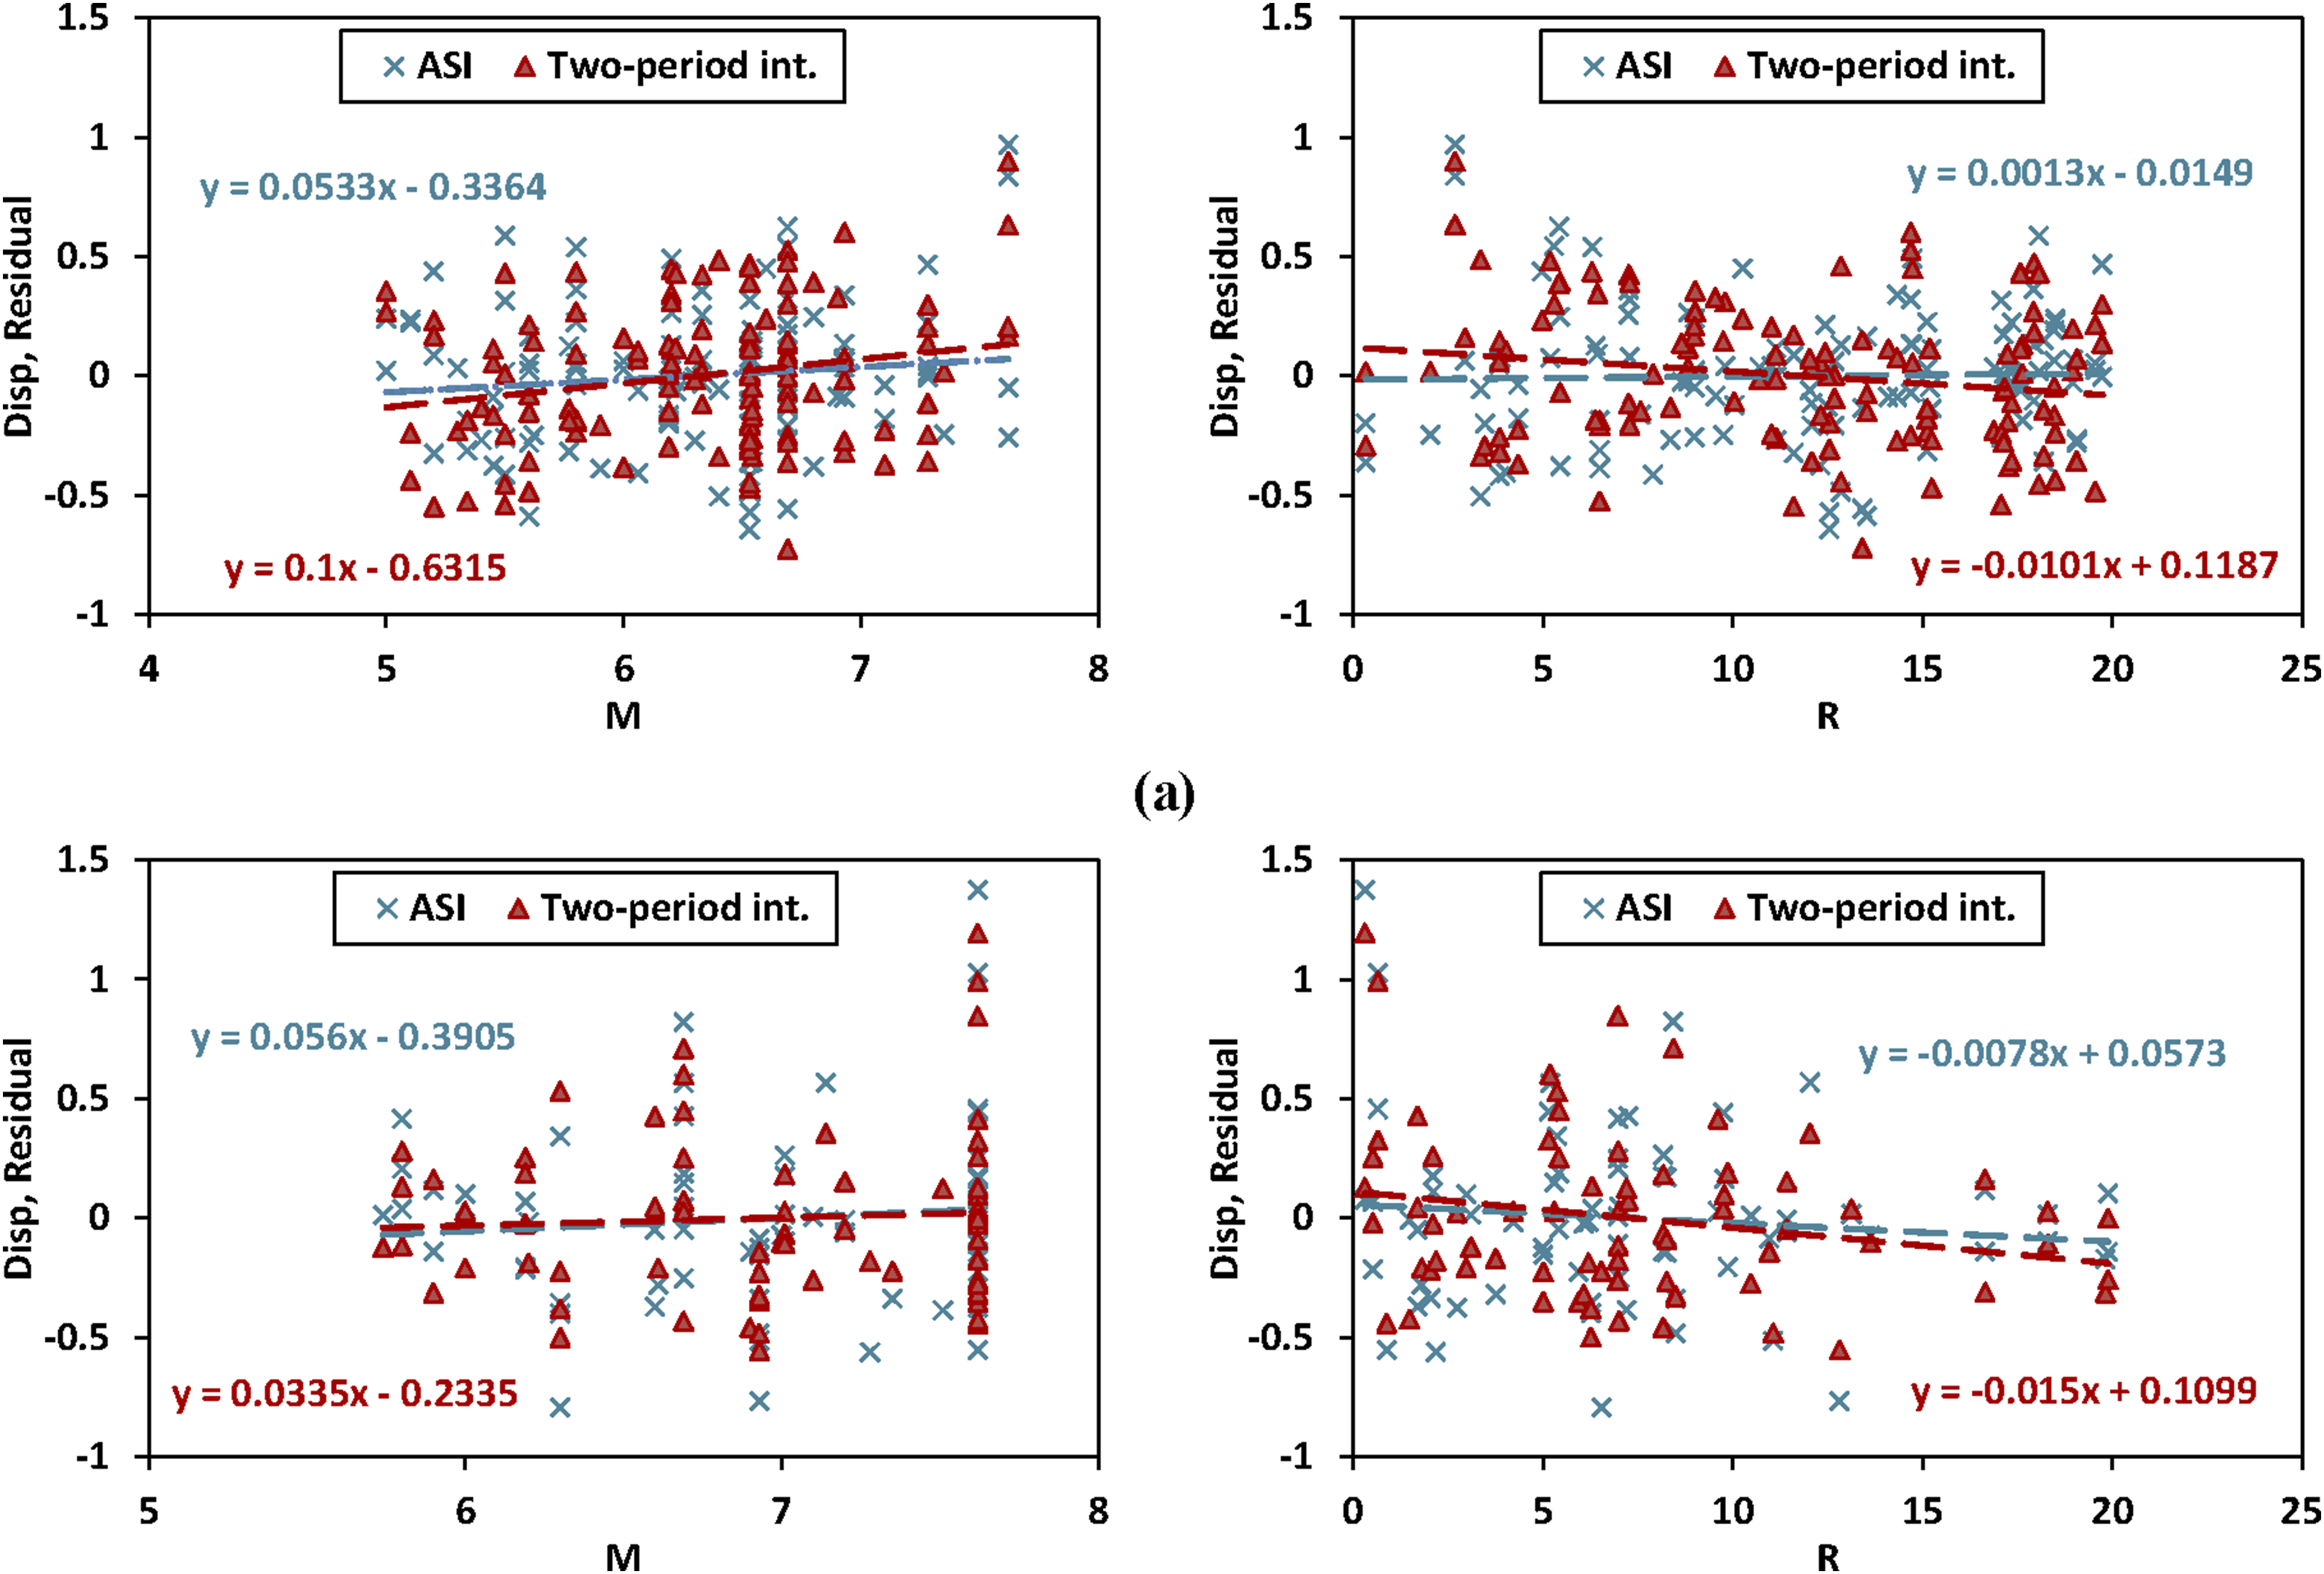
The following points can be summarized according to the findings made above: • According to previous studies, PGA and • NFD records provided better results than FD records in terms of optimal measurement criteria. The optimal IMs under NFD records were more accurate and reliable than those under FD records for assessing the seismic vulnerability of rectangular intake towers. • Event-based IMs were insufficient for seismic assessment of the intake tower structure because they did not account for frequency content and other characteristics. They also did not produce satisfying results when analyzing the structure’s optimality. These observations reveal that the characteristics of earthquake events alone cannot be used to estimate earthquake damage and vulnerability. • In general, IMs that reflect both structural traits and earthquake characteristics simultaneously can better forecast possible structural damage to the system.
Optimal IM selection: Impact of EDP
In the previous section, the optimal IMs were selected based on only one EDP of Disp. In this section, the impacts of other EDPs, such as Results of efficiency (β) and goodness of fit (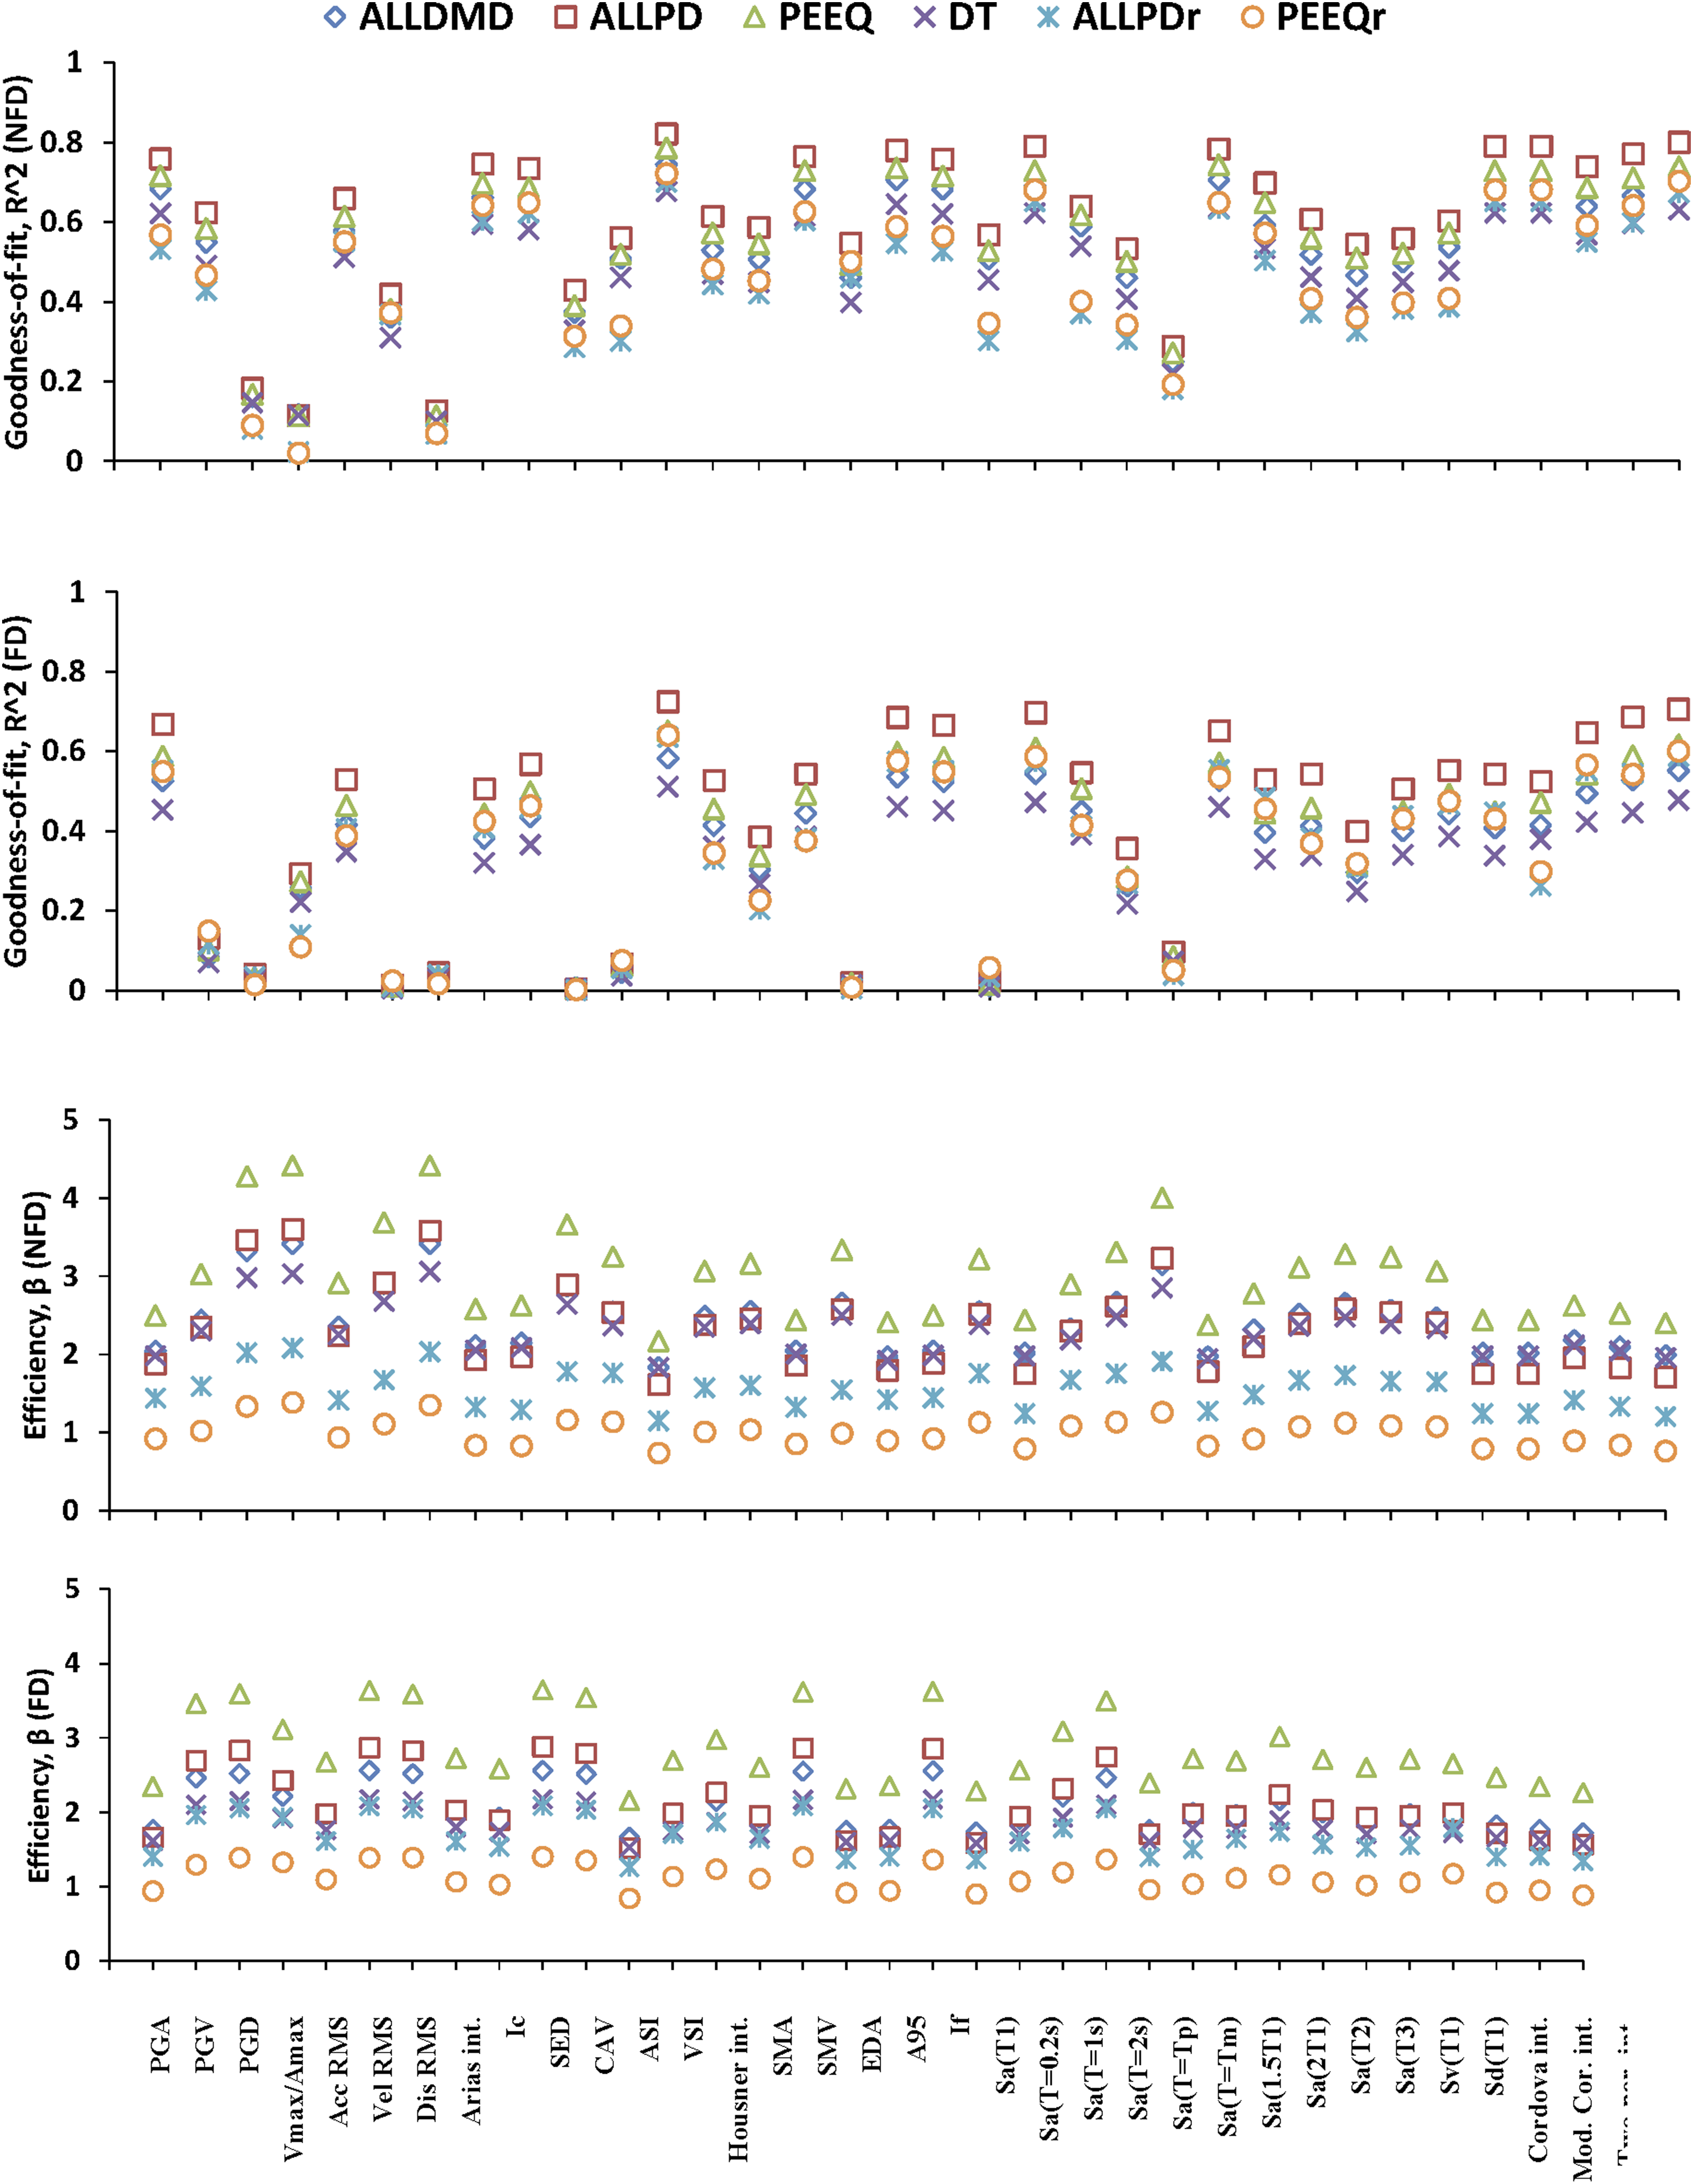
It can be seen in Figure 5 that IMs for NFD records generally had a higher
The practicality and proficiency of entire IMs for all EDPs, except Disp, are illustrated in Figure 6 under NFD and FD earthquakes. It can be observed that, for both NFD and FD records, the highest practicality belonged to IMs for the PEEQ index, while the lowest practicality belonged to the Comparison of practicality and proficiency coefficients of all EDPs (except Disp) for NFD and FD records.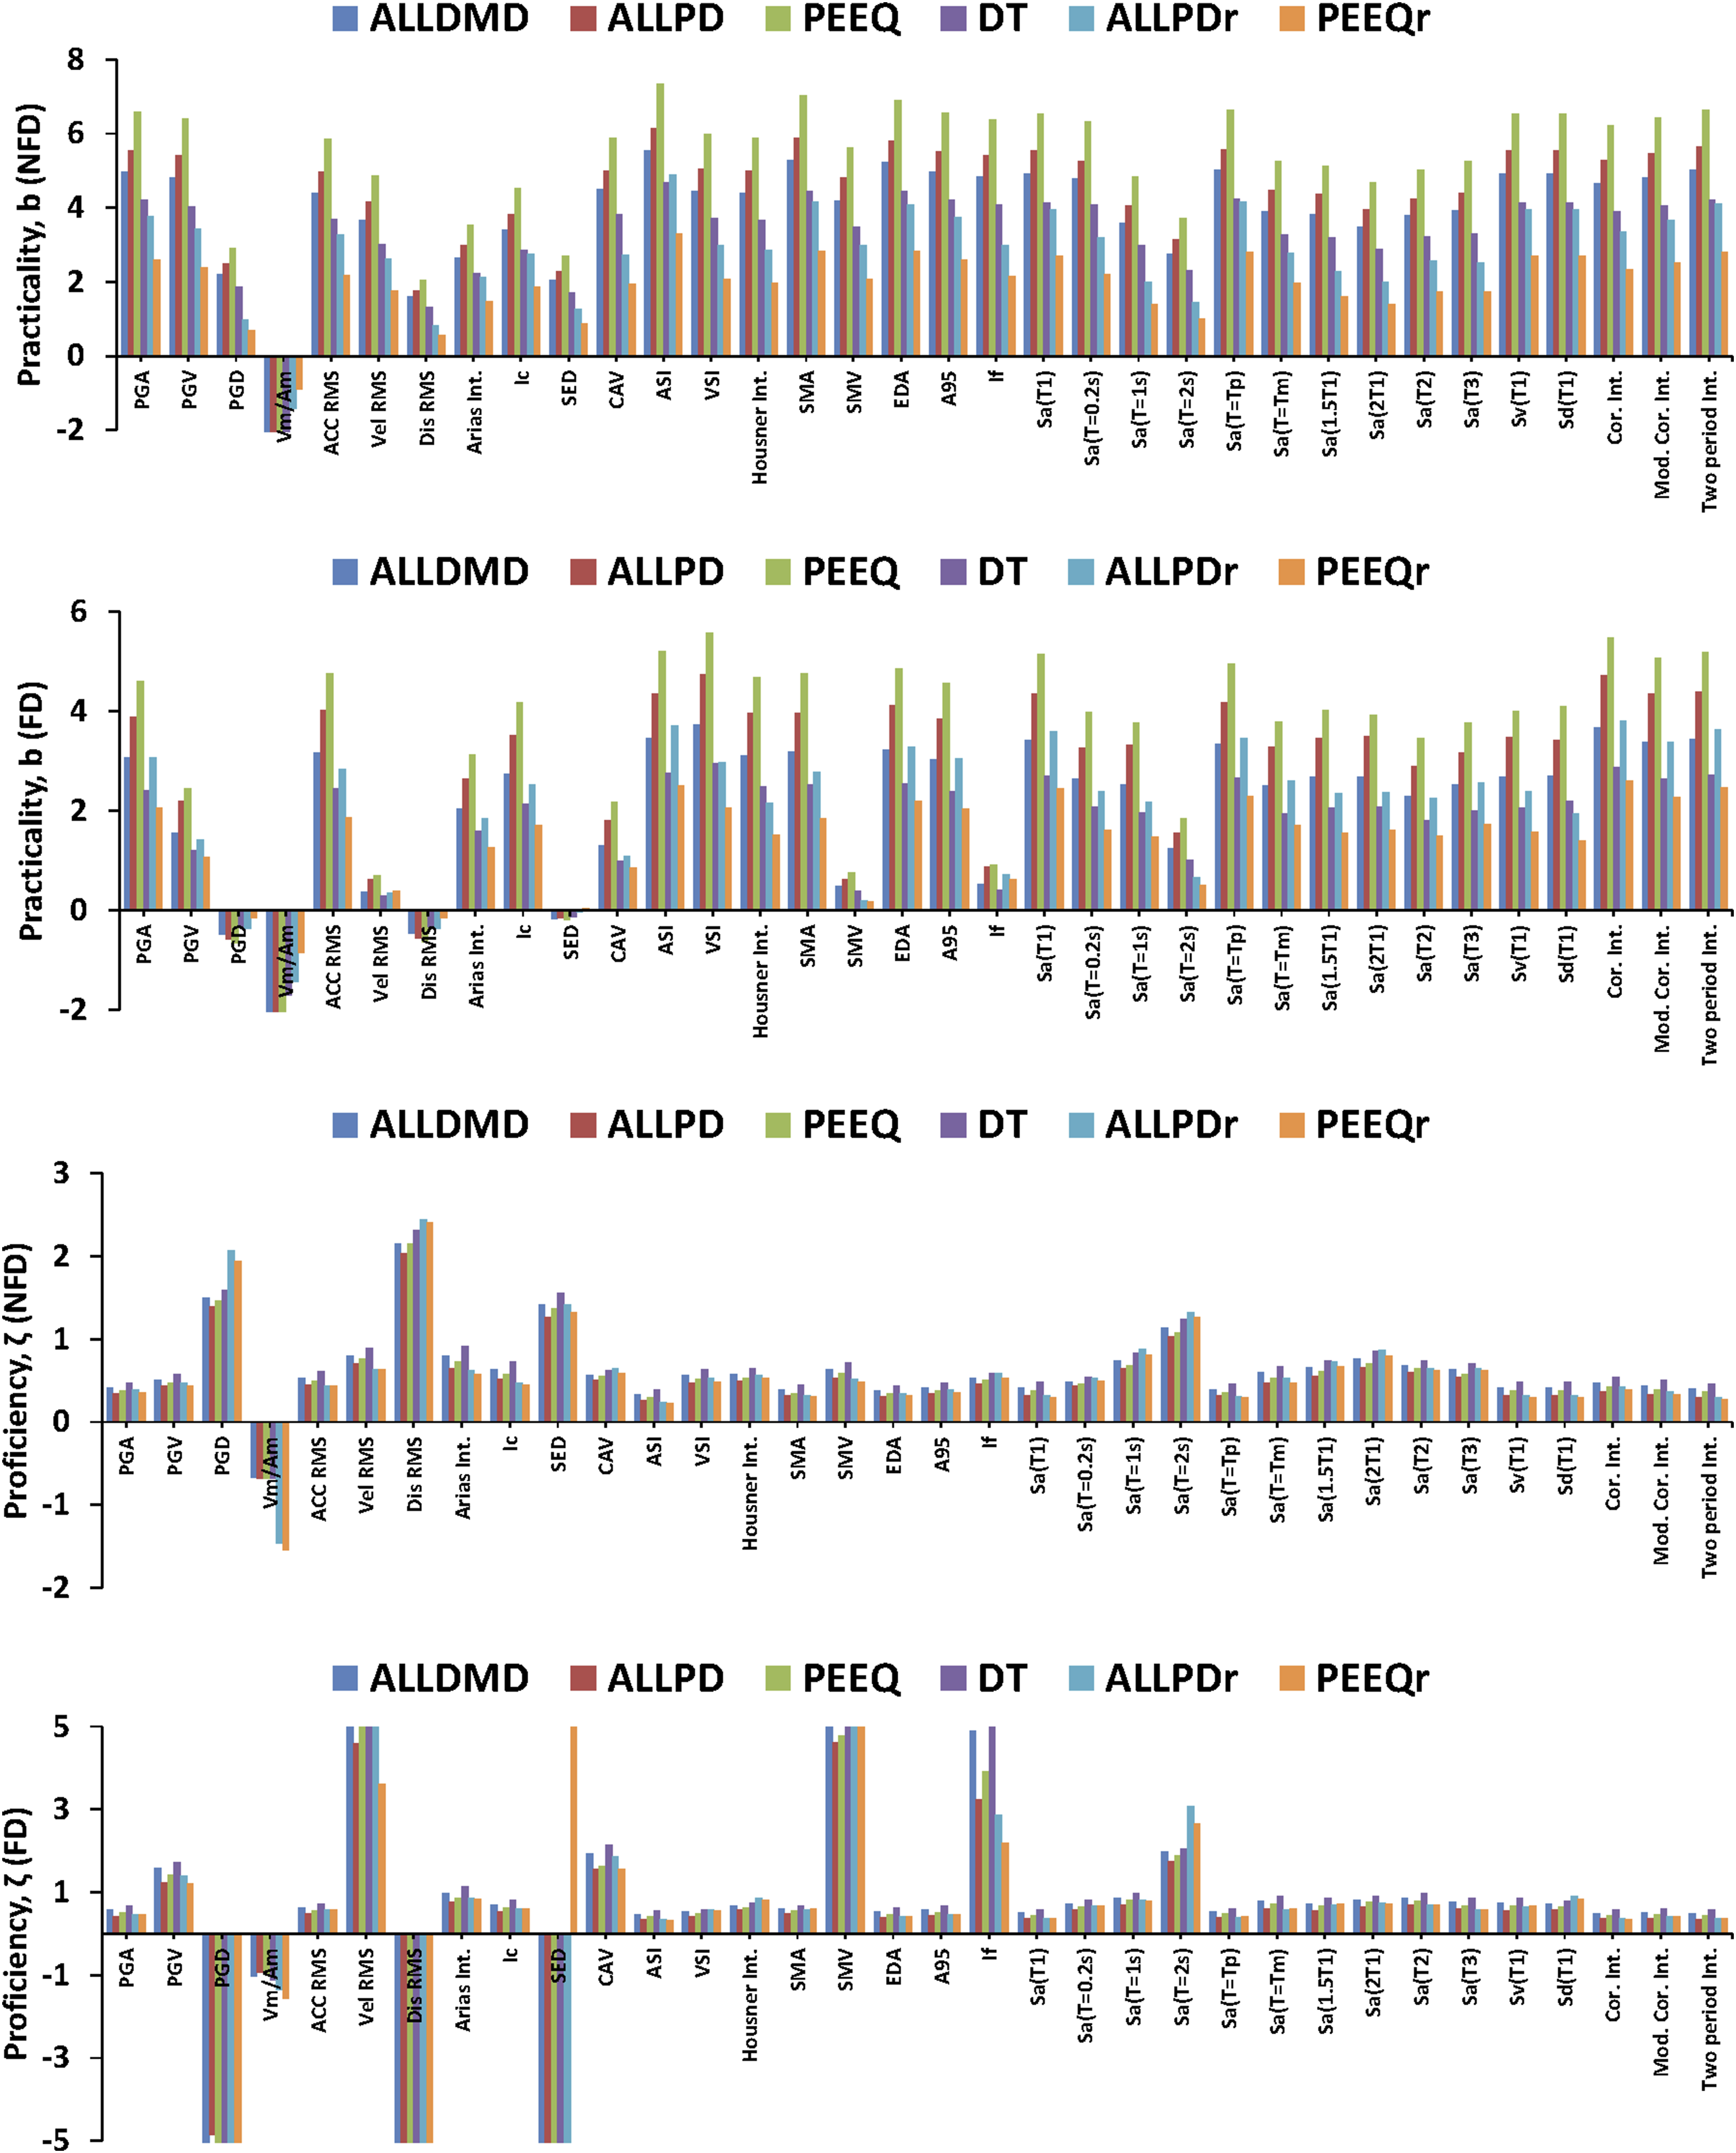
Finally, the sufficiency of IMs was tested in the last step. Figure 7 shows the sufficiency measured by the regression slope line on EDPs residual to M and R. According to Figure 7, for the other considered EDPs like the Disp, the regression slope line to R offered lower values than M for both NFD and FD records. This indicates that R was superior to M in most cases. Furthermore, PEEQ index and ALLPD provided a higher slope to M and R, indicating insufficiency. The comparison of different IMs-EDPs’ sufficiency using residual regression slope line on M and R for both NFD and FD near-fault records.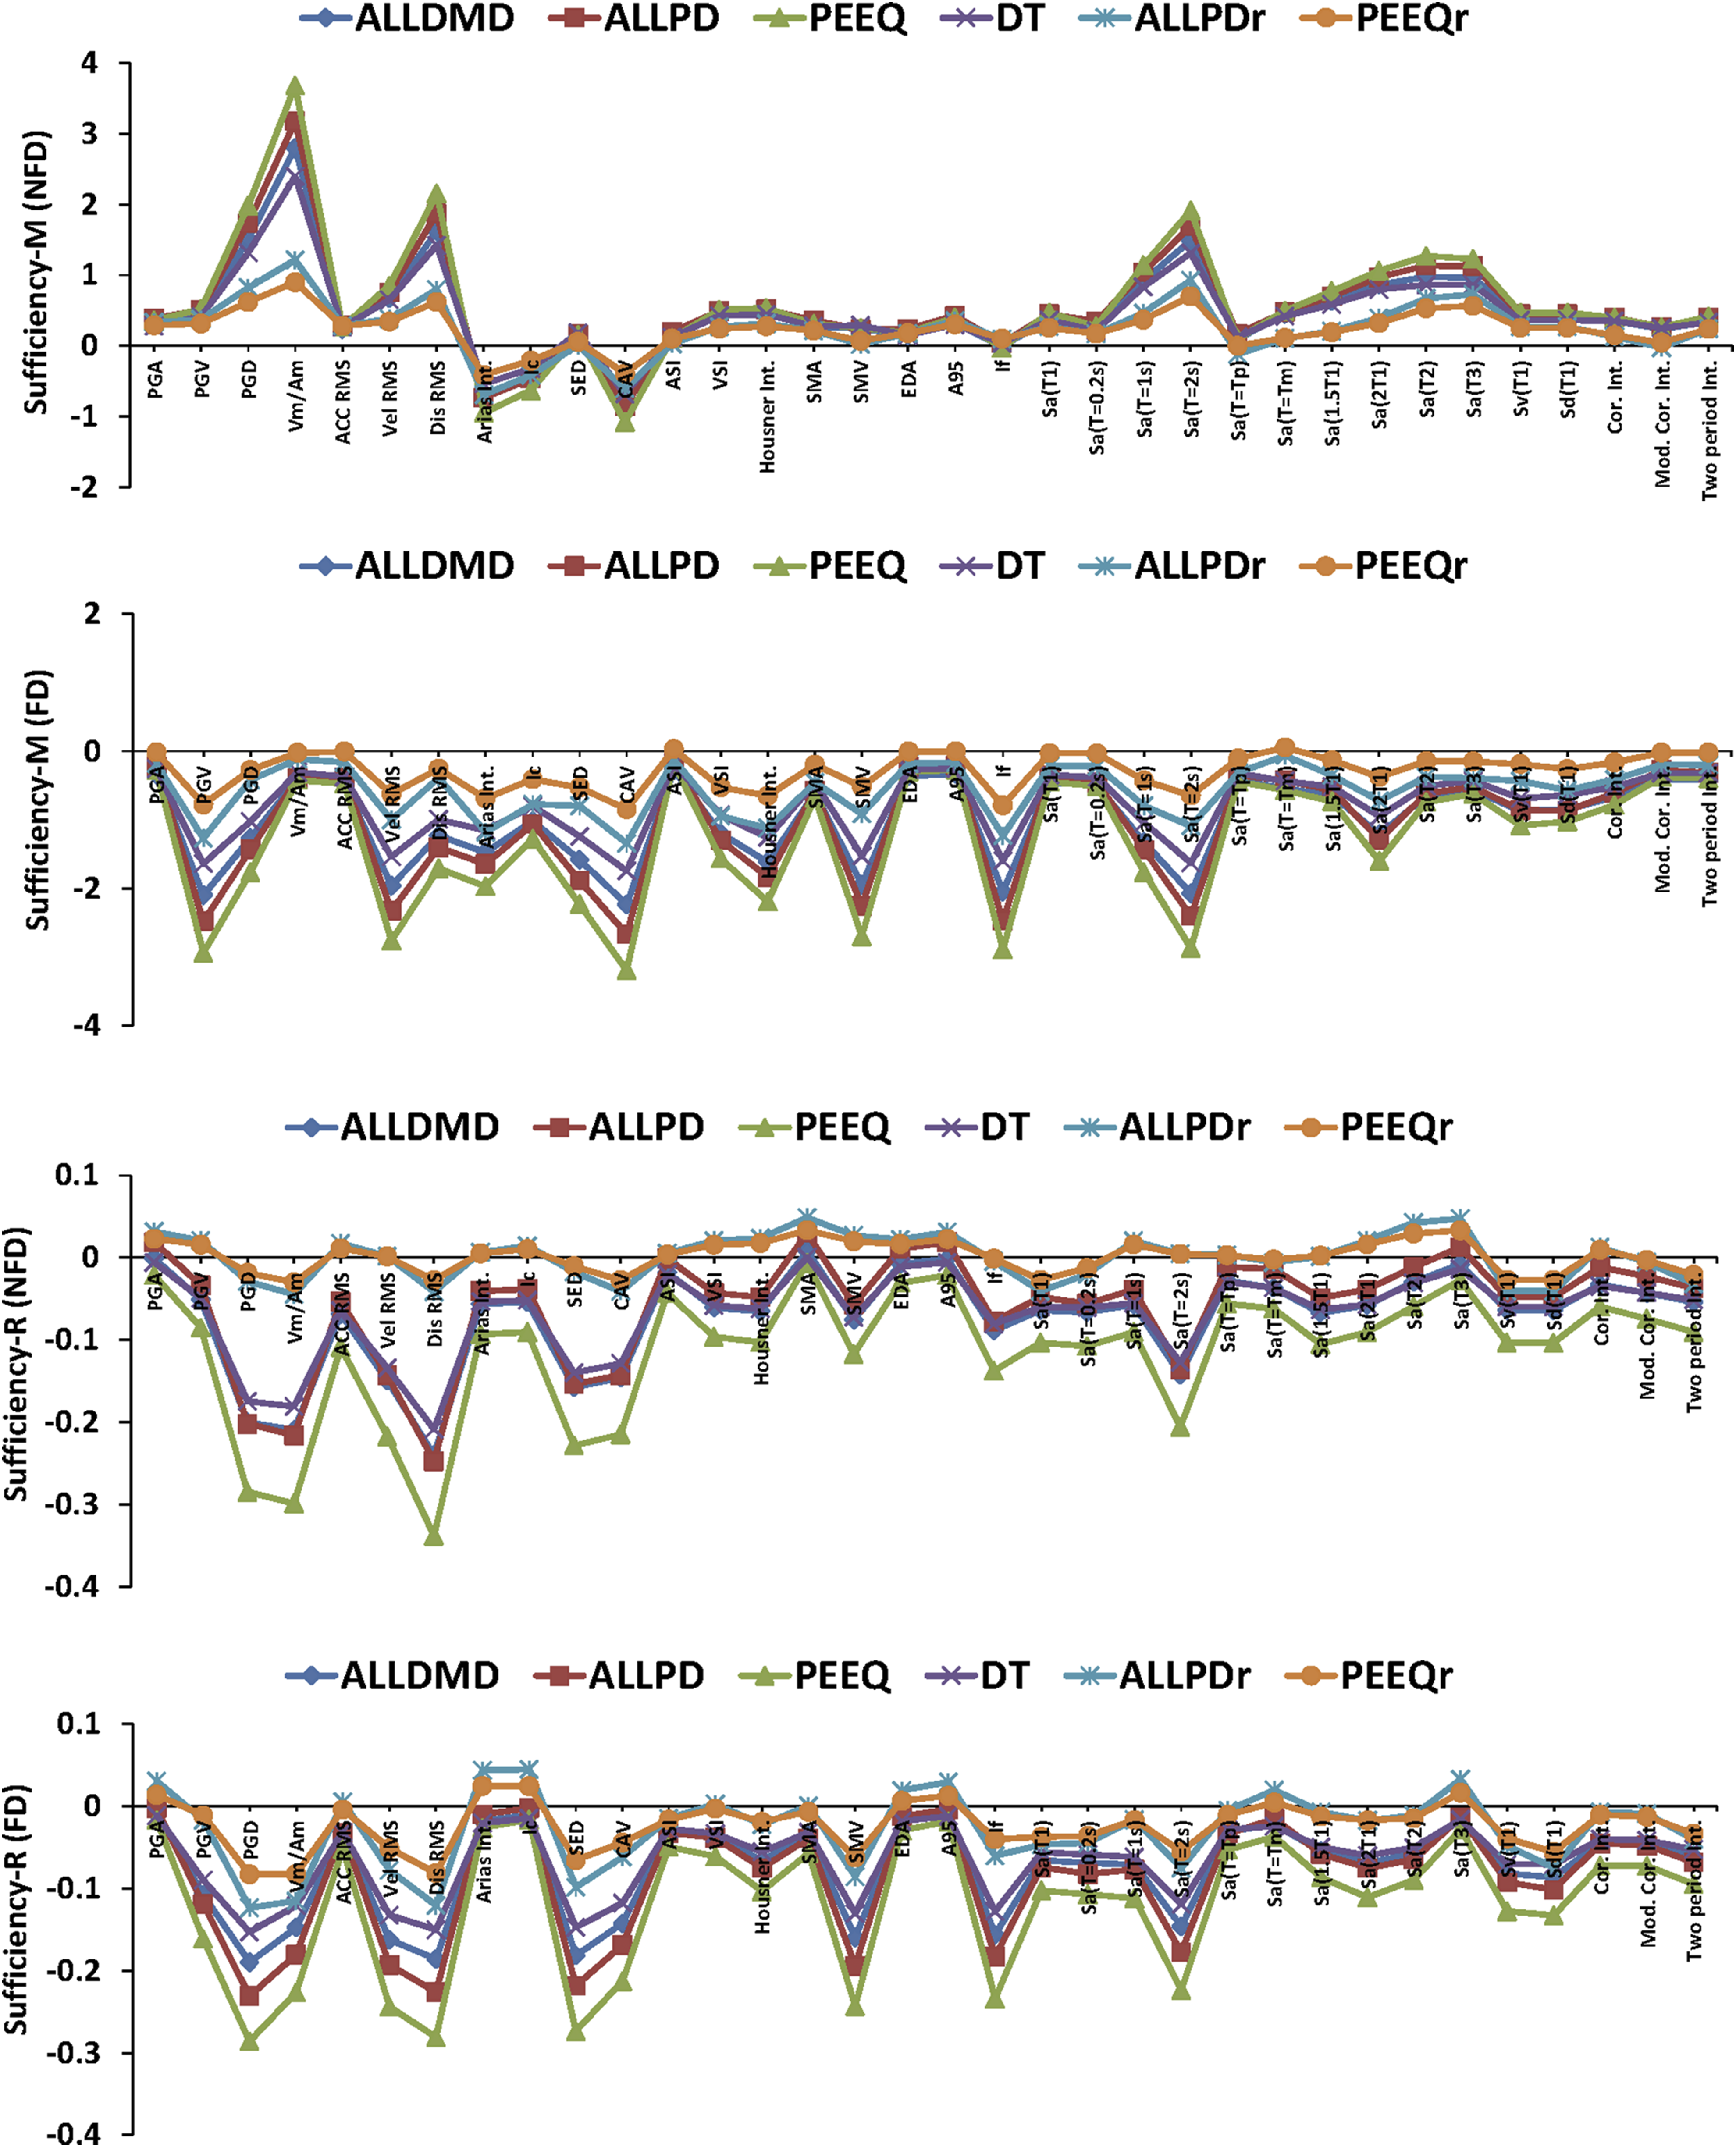
Fragility Curves
In this section, fragility curves for the created PSDMs were produced and various capacity limit states were generated using the fragility function formulation described in eq. (2). EDP was defined in this equation as a limit value that reflects a limit state. These limit values were subjective and their precise description was outside the bounds of this research. In addition, the fragility curve was utilized to quantify the initial damage caused by an earthquake to a structure.
The maximum relative displacement (Disp) calculation was a simple and accessible method for determining the responses and initial damages induced to the structure following the occurrence of near-fault records. Furthermore, the Disp did not contain a zero response value. Therefore, the Disp was chosen for the purpose of drawing fragility curves and comparing the probability of damage exceedance between different IMs in various limit states. Initially the fragility curves were plotted for the EDP = 35 mm as the limit state for both NFD and FD near-fault earthquakes, including Fragility curve comparison for maximum relative top displacement as EDP for both NFD and FD near-fault earthquakes based on PGA, 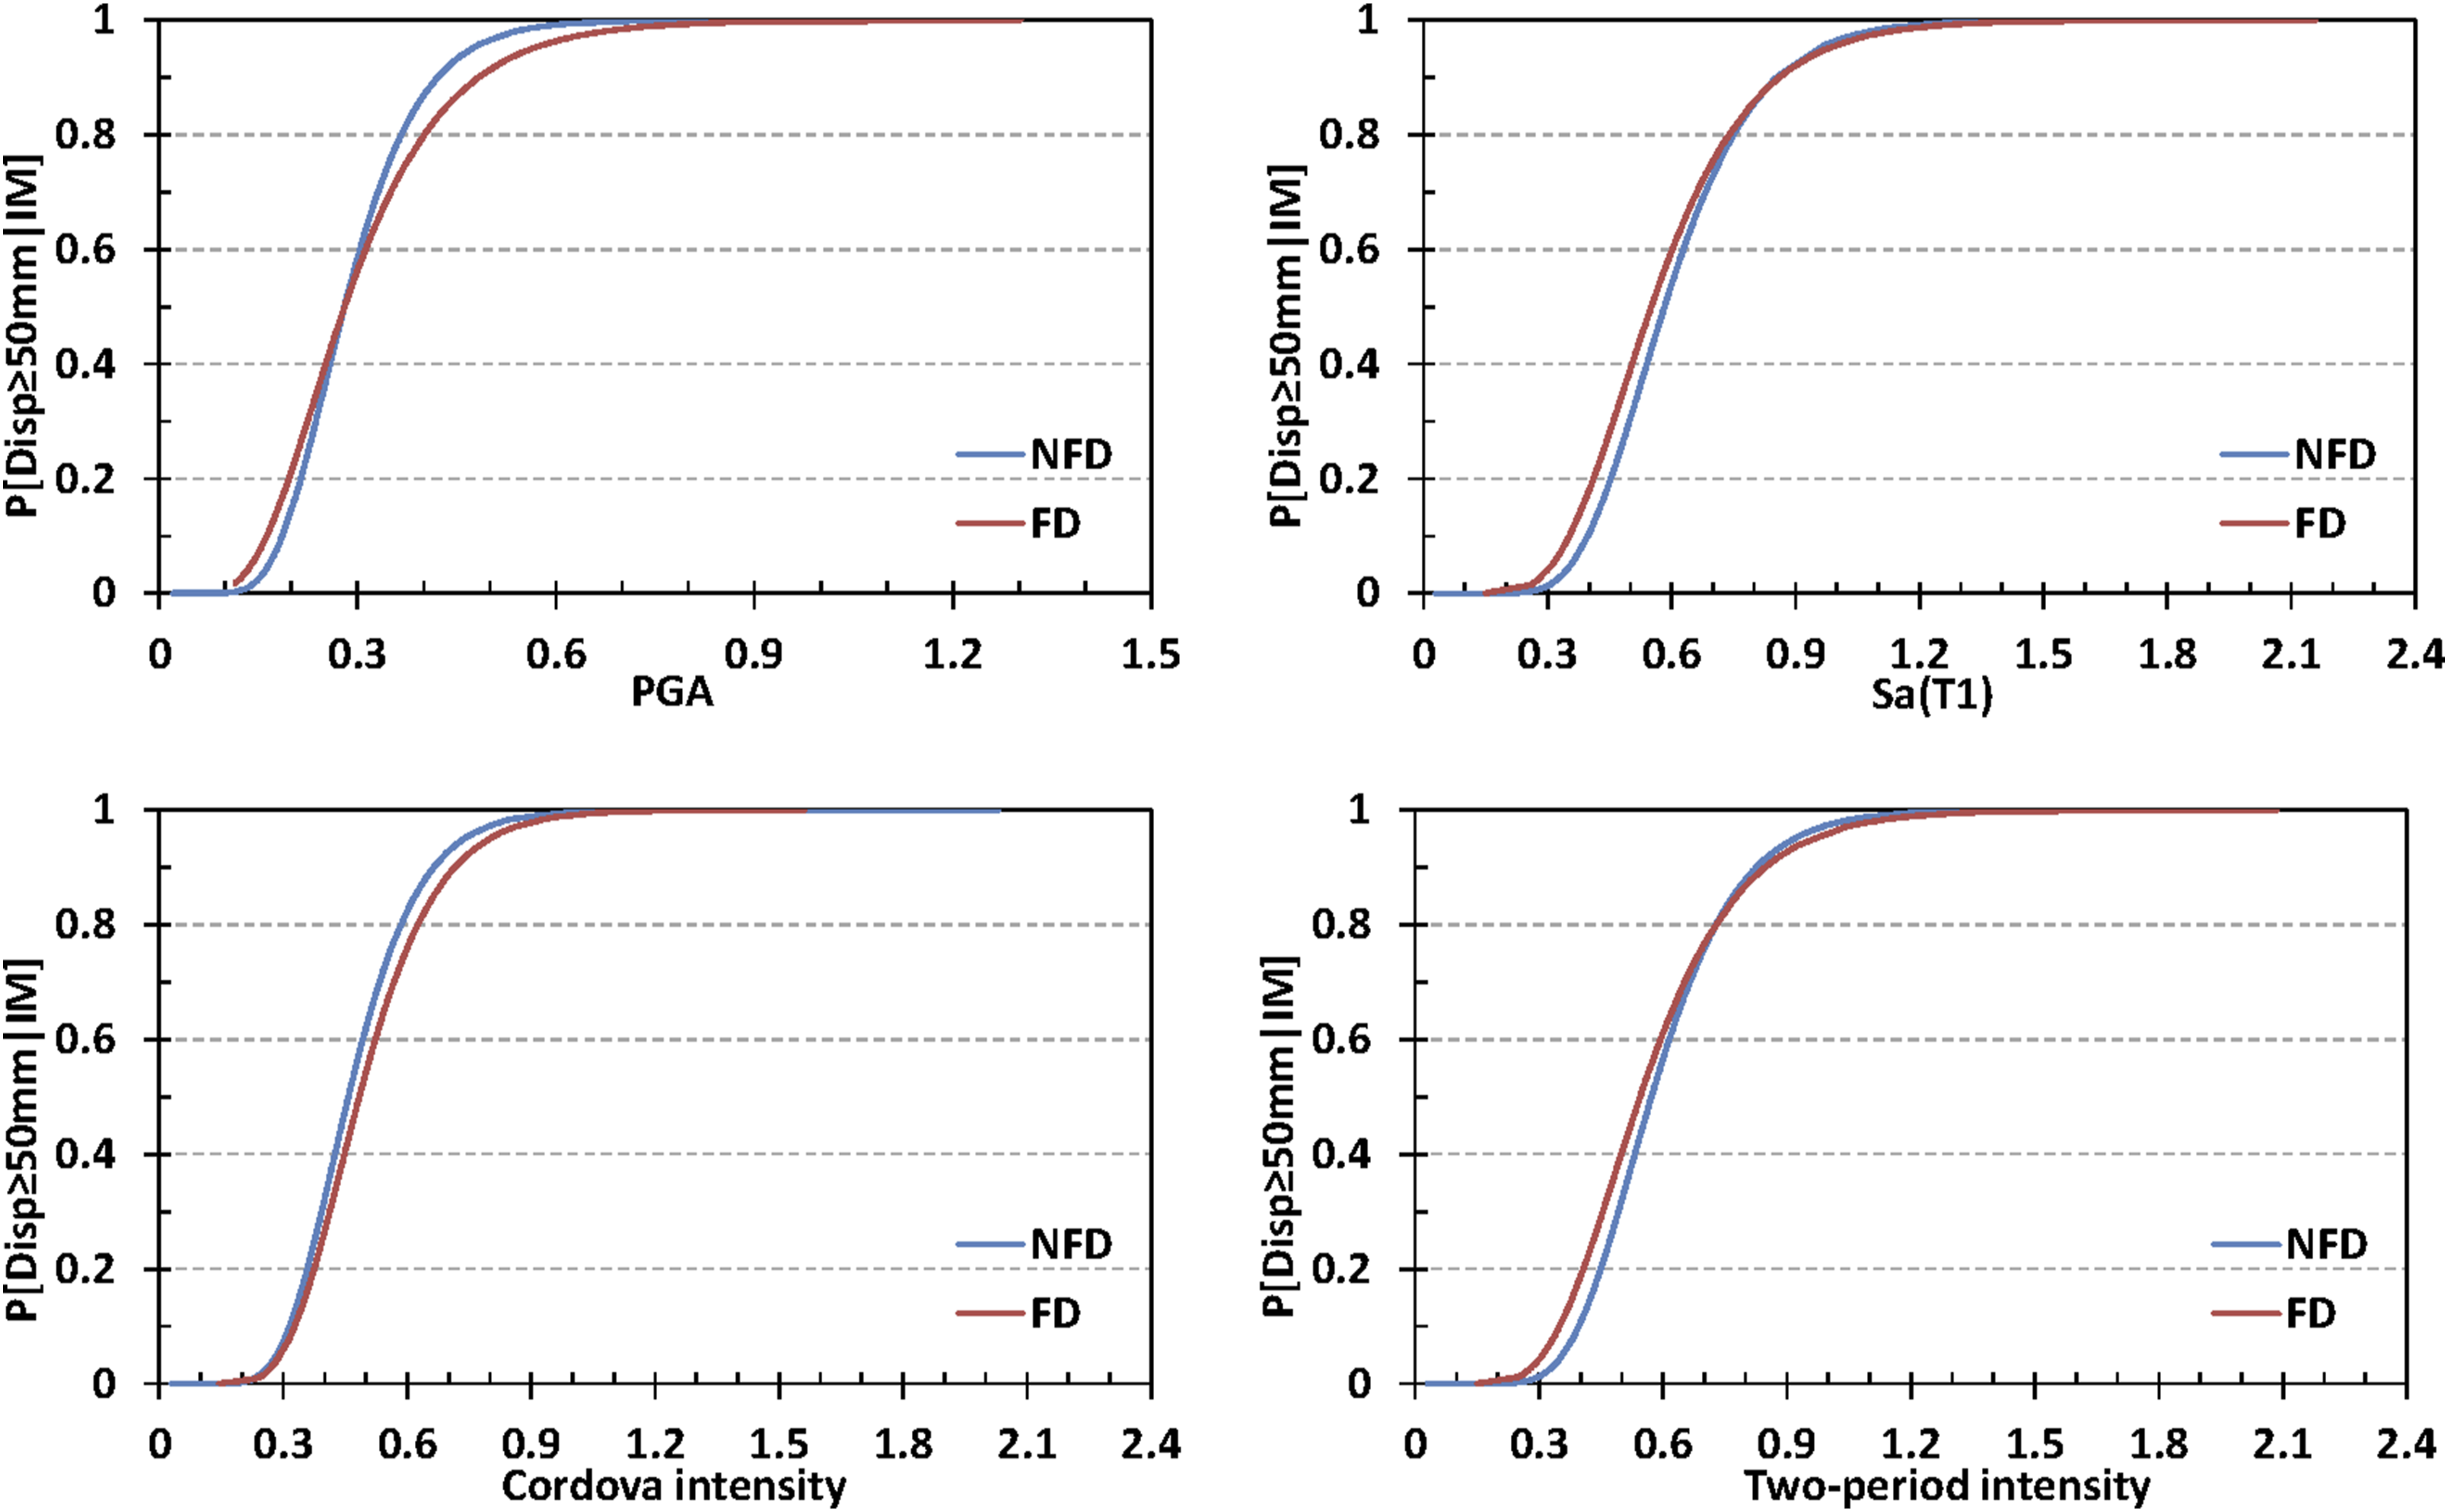
Seismic Demand Hazard Curves
The seismic demand hazard curves for both near-fault records with FD and NFD impacts were generated using eq. (8). The maximum top-to-bottom displacement in the intake tower (Disp) was selected as the EDP for plotting the curves. The reason of this selection is due to the fact that this EDP leads to more rational results in describing the intake tower’s performance and induced damages after the occurrence of various earthquakes. By considering the earthquake’s hazard, the curves for the Disp output under near-fault earthquakes for both FD and NFD records are demonstrated in Figure 9. As can be observed, NFD near-fault records include a wide variety of records, and their seismic demand hazard curves comprise a higher probability of demand’s exceedance. Furthermore, since the probability of exceedance is defined in the logarithmic space, some data may lead to irrational results with probability values of higher than one or negative. Therefore, they should be omitted from the whole results. By considering the occurrence of earthquakes at the site, it is shown that the probability of the maximum top-to-bottom displacement of the intake tower being higher than 10 mm was less than 11% for Comparison of seismic demand hazard curves for maximum relative top displacement as EDP for both FD and NFD near-fault earthquakes based on PGA, 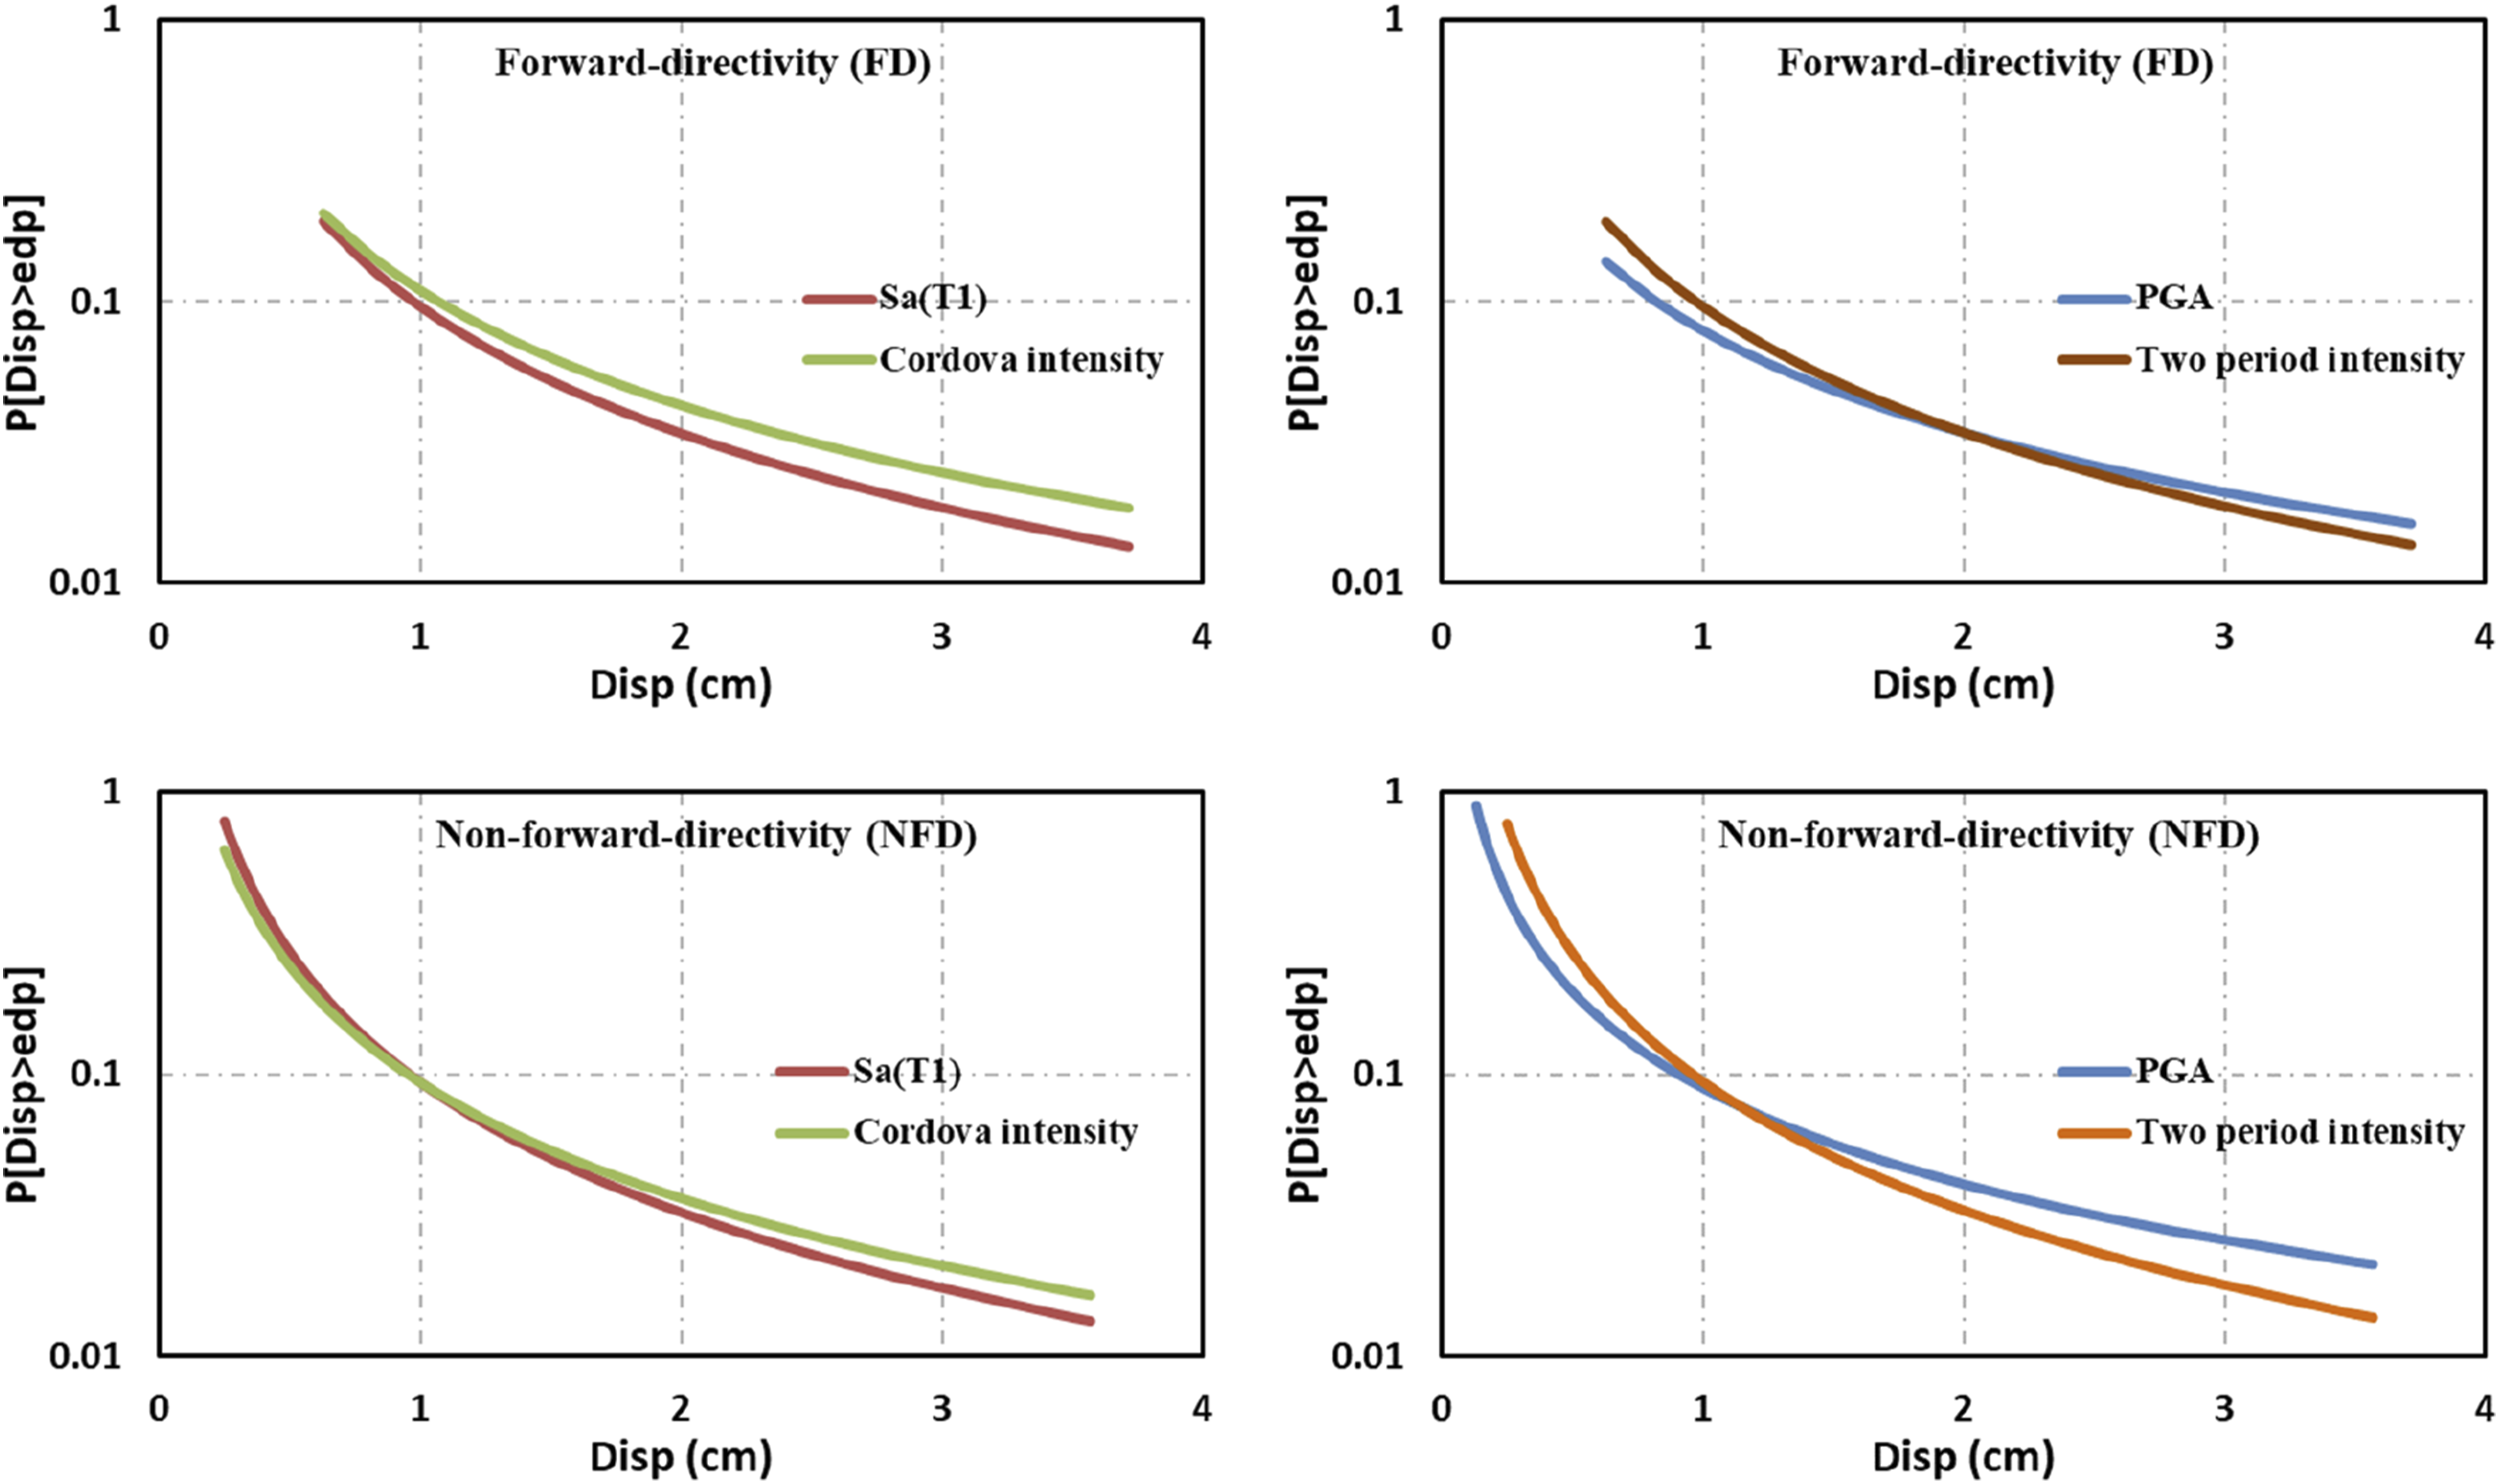
It should be noted that the horizontal and vertical elongation in the seismic demand hazard curves for NFD near-fault records were higher than those of FD records. This reflects the higher ability of NFD records in estimating seismic demand induced to the structure by combining it with the site’s hazard. Based on Figure 9, the probability of Disp reaching greater than 20 mm under the near-fault records by considering
Conclusions
In this study, probabilistic seismic demand models (PSDMs) have been used to evaluate the seismic vulnerability of a submerged intake tower structure located in the near-fault area. The following conclusions can be made based on the findings: • Near-fault records with non-forward-directivity (NFD) effects provided more accurate predictions for measuring potential hazards induced by the rectangular intake towers and choosing optimal intensity measure (IM) criteria than those with forward-directivity (FD) effects. • The whole trend of ranking different IMs based on their optimality criteria from the best to the worst for various engineering demand parameters (EDPs) did not change considerably by switching EDPs from Disp to other EDPs. The considered EDPs in the PSDMs might differ in their values for each optimal criterion. However, they reach a similar trend in demonstrating the probable damages to the structure. Much work is needed to define novel IMs for relating the dissipated energy and damage in the system with the ground motion input. • Unlike earlier studies in the literature, in which PGA and • Due to the high effects of frequency content and amplitude in unscaled earthquake records, event-based IMs were not suitable for optimal IM selection. They performed poorly in depicting structural damage resultant from earthquakes because damage does not depend solely on an earthquake’s event characteristics. • The fragility curves for all EDPs, including both near-fault NFD and FD earthquakes, show that forward-directivity effects can influence response and intensity measure values for smaller probability exceedance values. However, as the probability of exceedance increases, records with forward-direcitivity effects have higher intensity measure values. But it is worthy to mention that, in general speaking, pulse effects do not significantly influence the response of rectangular intake towers, suggesting that other properties of near-field records are more effective. It is recommended that in future studies, the effect of progressive damage and after-schocks be considered since it is more common in related structures in dam systems. • The seismic demand hazard curves for NFD near-fault records showed higher horizontal and vertical elongation compared to FD records, indicating their superior ability to estimate seismic demand induced by the structure. The probability of Disp reaching over 20 mm under NFD and FD records by considering
Footnotes
Declaration of conflicting interests
The author(s) declared no potential conflicts of interest with respect to the research, authorship, and/or publication of this article.
Funding
The author(s) received no financial support for the research, authorship, and/or publication of this article.