
Abstract
Hybrid fibre reinforced polymer (FRP)-timber (HFT) thin-walled structural members are a novel technology developed recently as a sustainable alternative to thin-walled steel and aluminium structures. HFT structures are made by forming thin timber veneers and FRP laminates into efficient cross-sectional geometries. While existing studies have demonstrated the potential of HFT thin-walled members to be used as structural elements, a systematic study to investigate the behaviour of HFT thin-walled structures is yet to be carried out. This paper presents a study aimed at investigating the behaviour of HFT C-section columns under concentric axial loading. In total five HFT C-section specimens each from 700 mm to 2000 mm lengths were fabricated and tested. It was found that shorter HFT C-section columns failed due to local buckling while increase in length changed the failure mode to global buckling. Effect of GF orientation and density on load carrying capacity of the HFT C-section columns was investigated numerically. It was found that it’s necessary to provide adequate GF volume in transverse to axis direction, but further increase in GF volume in transverse direction did not significantly increase the load carrying capacity. Increase in GF density in parallel to axis direction increased the load carrying capacity.
Keywords
Introduction
Thin-walled light-weight structures have become popular within the construction industry due to their lightweight, ease of assembly, and ease of transportation (Loughlan 2018). Many structural typologies made from steel, aluminium, and fibre reinforced polymers (FRPs) exist in existing literature (Barbero and Raftoyiannis 1993; Qiao et al., 1998; Schafer 2000; Yu and Schafer 2003; Moen and Schafer 2009; Ascionie et al., 2013; Boscato et al., 2015; D’Aguiar and Parente Junior 2018; Loughlan 2018; Ye et al., 2018; Higginson et al., 2021), with steel and aluminium thin-walled structures are the most widely used. Such thin-walled steel and aluminium structural elements predominantly fail due to buckling failure modes, thus such buckling failures have received significant research attention (Schafer 2000; Yu and Schafer 2003; Moen and Schafer 2009; Zhu and Young 2009; Liu et al. 2015a, 2015b; Talebian et al. 2018a, 2018b; Ye et al., 2018). Open cross-sections, such as C- and Hat-sections, as well as closed cross-sections, such as rectangular, square, or circular shapes, are often used in thin-walled steel and aluminium sections. Section improvements, such as inclusions of lips, and web and/or flange stiffeners, have been introduced to increase the local and distortional buckling capacities (Huang et al., 2018; Yan and Young 2002; Zhou and Shi 2011). While thin-walled steel and aluminium structural members are widely used in construction due to their many advantages, they are high in embodied energy and more sustainable alternatives are desired to reduce embodied energy in construction.
Use of FRPs to fabricate thin-walled structural members as an alternative to thin-walled steel and aluminium structural members have also been investigated (Ascionie et al., 2013; Barbero and Raftoyiannis, 1993; Boscato et al., 2015; D’Aguiar and Parente Junior, 2018; Debski et al., 2016; Higginson et al., 2021; Keller, 2011; Qiao et al., 1998). FRP thin-walled structural members are also made with similar cross-sectional shapes to those used in thin-walled steel and aluminium structural members. Ability to use FRP thin-walled members in structural systems have been successfully demonstrated (Boscato et al., 2015). While FRP thin-walled structural elements provide many advantages such as high corrosion resistance and high weight specific strength over the thin-walled steel structural elements (Boscato et al., 2015; Keller 2011), FRP thin-walled elements are also high in embodied energy and relatively expensive (compared to steel and aluminium), thus have shown a slower market uptake.
To the best of the author-group’s knowledge, the lowest carbon alternative to thin-walled steel and aluminium sections existing is the wood veneer-based (VB) thin-walled structural system proposed by Gilbert et al. (2014). VB thin-walled structural elements are made using cross laminated wood veneers formed in efficient cross-sectional geometries similar to those of thin-walled steel and aluminium thin-walled structural members. Use of wood veneers have kept the embodied carbon to a minimum, making them a low carbon structural product. While VB thin-walled structural members were found to provide good structural performance, they are difficult to manufacture as bending of the veneers along the grain direction is challenging and may result in cracking for tight bends.
Overcoming the disadvantages of VB thin-walled structural members, while keeping the embodied carbon low, Fernando et al. (2018) recently developed novel hybrid FRP-timber (HFT) thin-walled structural members (Figure 1). Instead of cross laminated wood veneers, wood veneers with grain direction parallel to member axis are combined with FRP fabrics with fibres perpendicular to transverse direction of the member axis, thus making it easy to bend into efficient cross-sectional shapes while reinforcing timber in transverse to grain direction. Based on the findings of existing studies on the effectiveness of FRPs to enhance the performance of low-quality wood (Fernando et al., 2016), only a small amount of FRPs is used in HFT thin-walled structural elements, therefore keeping the embodied carbon low (Fernando et al., 2018). Existing studies have demonstrated the ability to use HFT thin-walled structural elements as load bearing structural members (Fernando et al., 2018; Gattas et al., 2018; Min et al., 2020, 2021a), and HFT C-section columns were found to have a higher weight specific load capacity than thin-walled steel structural members (Min et al., 2021a). Existing studies have clearly demonstrated the potential of HFT thin-walled structures as a promising sustainable alternative to steel and aluminium thin-walled structures (Fernando et al., 2018; Min et al., 2021a). Concept of the HFT thin-walled structural members (arrow heads indicate the FRP fibre and the timber grain directions): (a) example Hat section; (b) example C-section structural members (reproduced with permission from Fernando et al., 2018).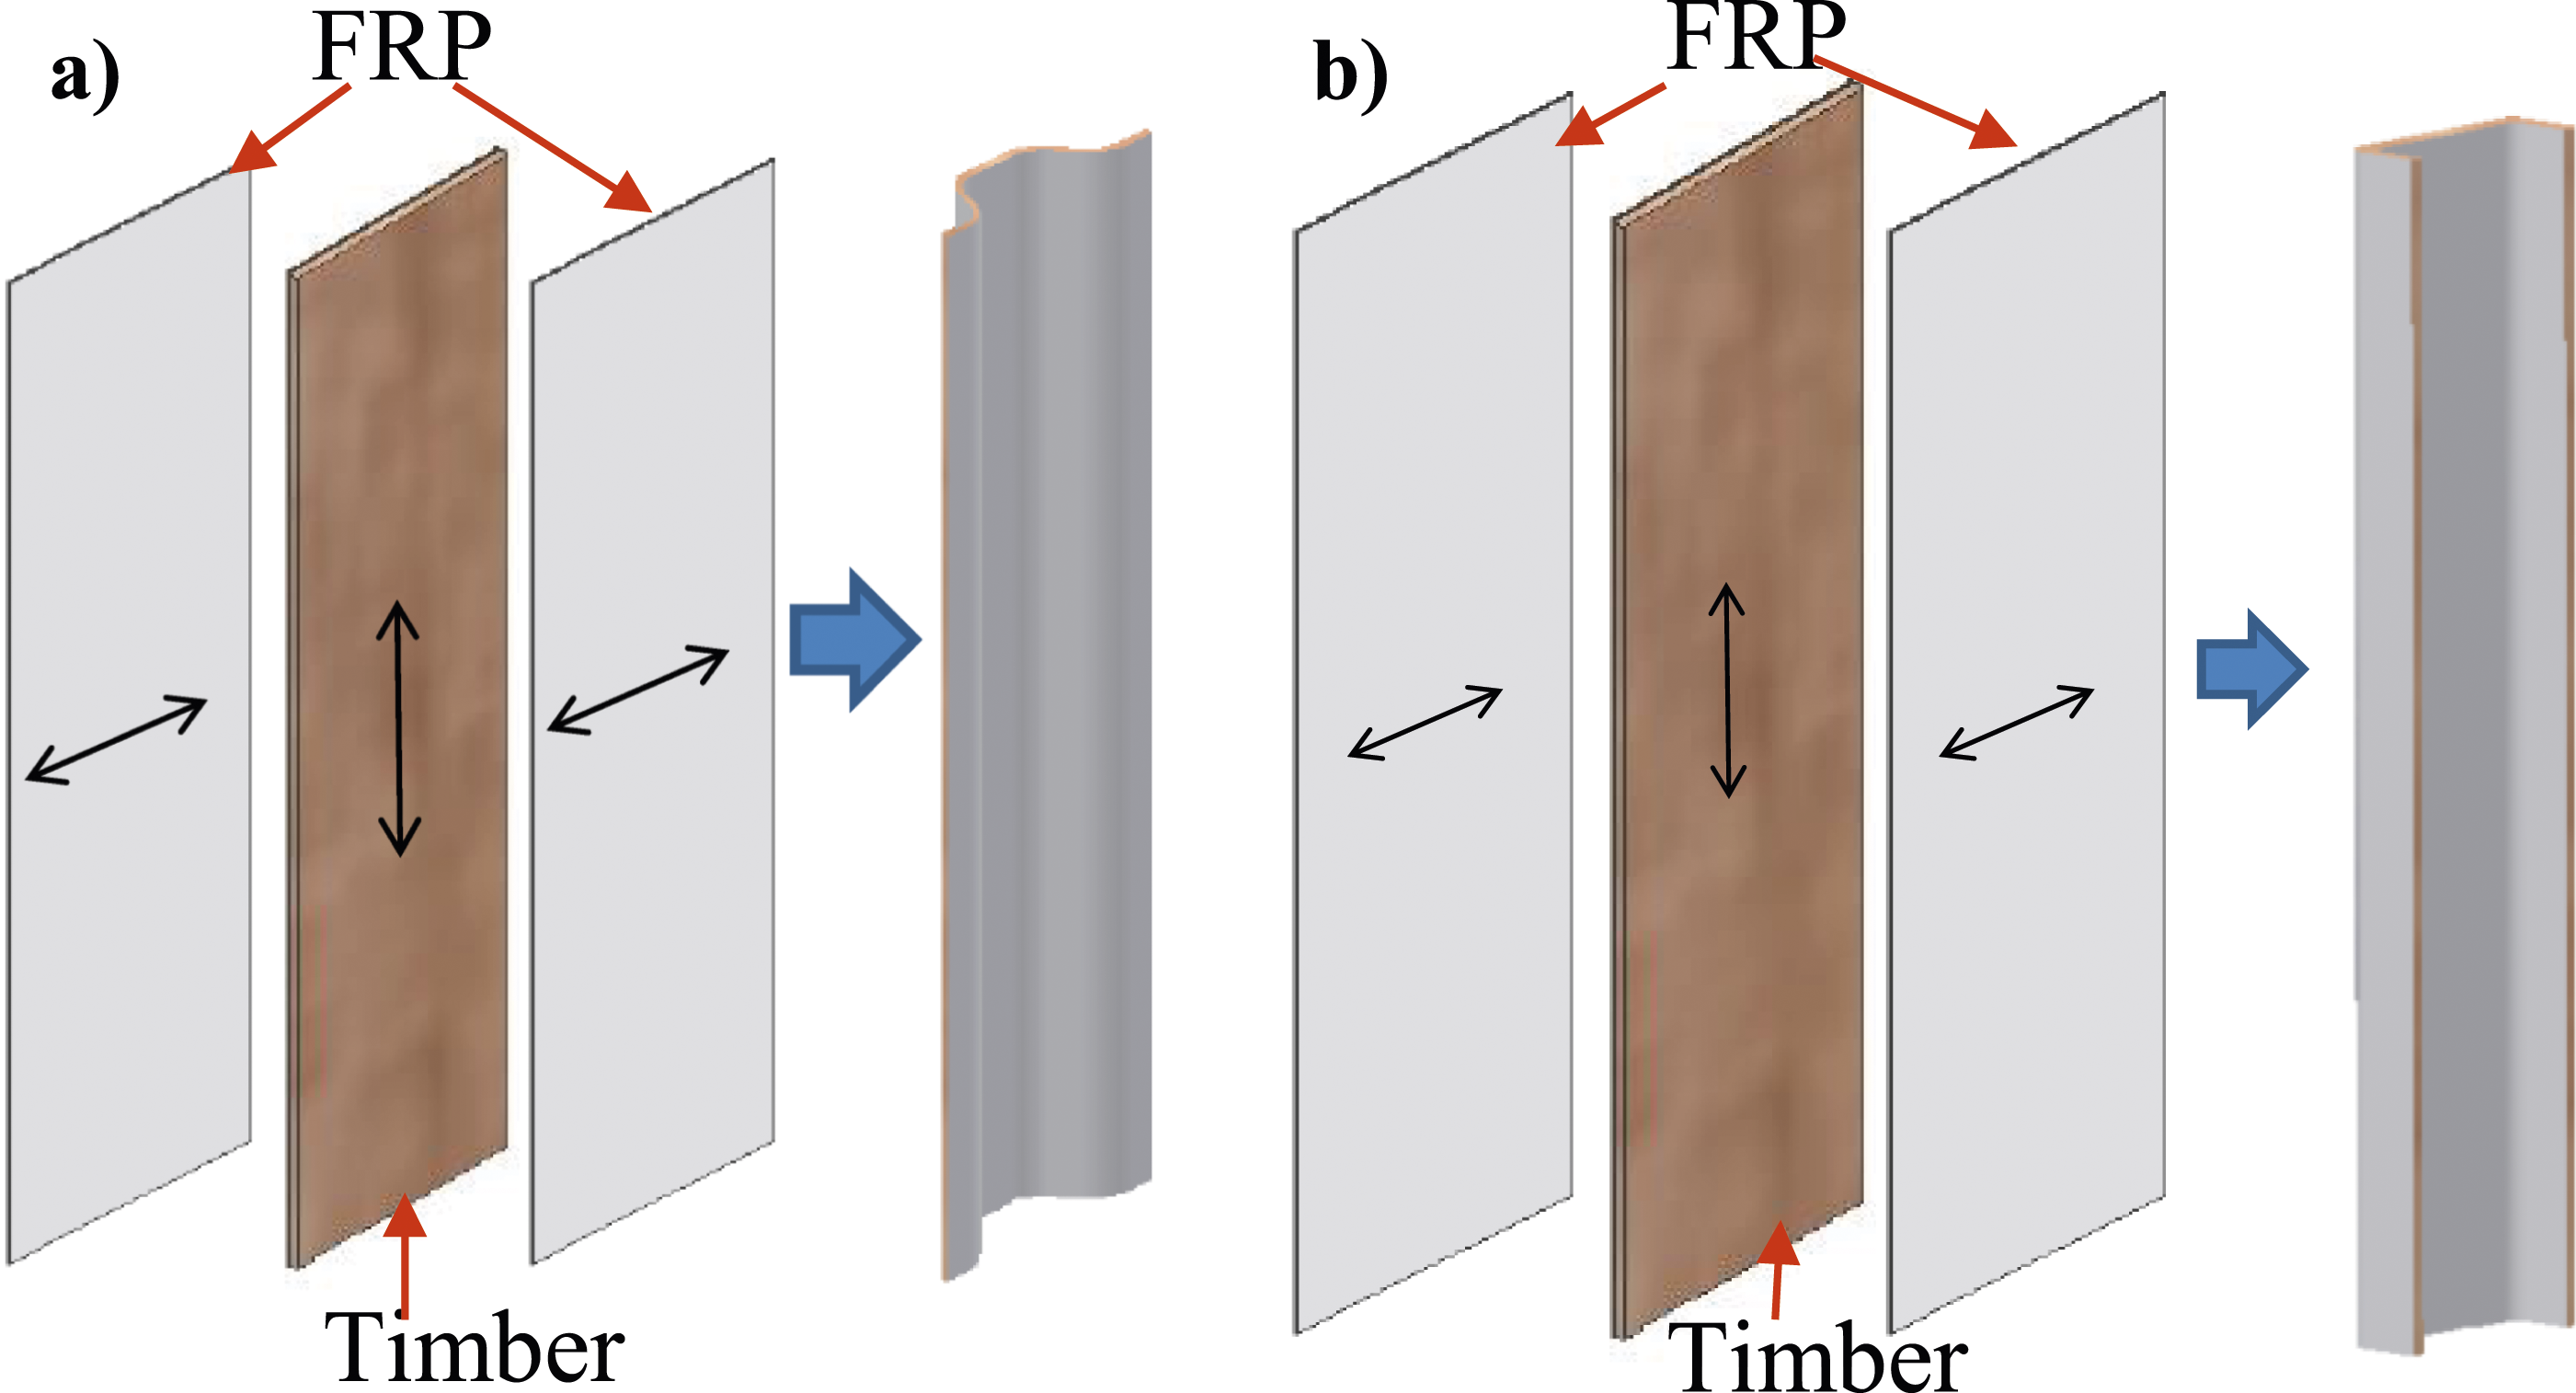
While HFT thin-walled structures were found to be a promising sustainable structural product, being a new concept, only handful of studies have been carried out so far on HFT thin-walled structural members. Existing studies focused on demonstrating the potential of HFT thin-walled structural members have fabricated and tested HFT thin-walled wall panels (Fernando et al., 2018) as well as square and quasi-circular cross-section columns (Gattas et al., 2018). Those studies have demonstrated the significant improvement in load carrying capacity of such HFT thin-walled structural elements compared to their pure timber counterparts. Several studies have also been carried out on investigating the manufacturing aspects of HFT thin-walled structural members (Fernando et al., 2018; Gattas et al., 2018; Miao et al., 2019, 2022; Min et al. 2020, 2021a, 2021b). Compression moulding technique was found to successfully manufacture good quality HFT C-section columns (Fernando et al., 2018; Min et al., 2021a). Manufacturing pressure during compression moulding was found to affect the laminate properties (Min et al., 2021b), and a pressure of 1 MPa was found to provide the best properties for HFT C-section columns (Min et al., 2021a). Flexural and membrane properties of the HFT laminates were found to be affected by the type of fibres used (Min et al. 2021a, 2021b), with glass fibres (GFs) providing the best performance in terms of weight specific load capacity (Min et al., 2021a).
Use of HFT thin-walled members as load bearing members require sound understanding of the behaviour of such structural members under various loading and support conditions. While existing studies have demonstrated the potential of HFT thin-walled structural members, detailed studies investigating the behaviour of HFT thin-walled structural members are yet to be carried out. Early studies on HFT thin-walled C-section columns showed that buckling of plates is a common failure mode in such members (Min et al., 2021a), and both the flexural and membrane properties of the HFT laminates significantly affect the behaviour of HFT C-section columns. Such buckling failures are also often observed in thin-walled metallic (Moen and Schafer 2009; Schafer 2000; Ye et al., 2018; Yu and Schafer 2003) and FRP (Barbero and Raftoviannis 1993; Ascionie et al., 2013; D’Aguiar and Parente Junior 2018; Higginson et al., 2021) structural members. However, existing knowledge in thin-walled metallic structural members cannot be directly applied to the HFT thin-walled structural members due to significantly different material behaviour between metal and HFT laminates. While FRP laminates also show orthotropic behaviour similar to HFT laminates, constitutive models used for timber are significantly different from those used for FRP lamella, thus direct application of the knowledge in FRP thin-walled structural members to HFT structural members is also not possible. In addition, many FRP thin-walled cross sections consist of sharp corners (Barbero and Raftoviannis, 1993; Ascionie et al., 2013; D’Aguiar and Parente Junior 2018; Higginson et al., 2021) unlike rounded corners in HFT thin-walled cross sections (Min et al., 2021a), a feature which could affect the buckling of the plates. Investigations are necessary to understand the behaviour of HFT thin-walled structural members before evaluating the applicability of concepts in metallic and/or FRP thin-walled members to HFT thin-walled structural members.
In addressing the above highlighted research gap, this paper presents the first ever systematic study aimed at investigating the behaviour of HFT C-section columns under concentric axial loading. In total 10 HFT C-section specimens were manufactured and tested. In addition, six thin-walled steel C-sections were also tested for comparison with the HFT C-section results.
Specimen design, manufacturing and testing
Preliminary design
As HFT thin-walled C-section columns may fail due to either global or local buckling, capturing both failure modes was desired. Therefore, a preliminary finite element (FE) study was carried out to design the specimens to ensure both global and local buckling modes were captured under uniaxial compression loads. Cross-sectional shape and dimensions of the C-sections were kept similar to those of commercially available cold-formed steel thin-walled C-sections. This was done to facilitate the comparison between the performance of the HFT C- section columns and similar steel C- section columns. An FE modelling technique similar to as proposed in Min et al. (2020) was used for the preliminary design of the test specimens. Details of the preliminary design methodology can be found in Wen (2024).
The nominal cross-section geometry of the chosen HFT C-section from the preliminary design is shown in Figure 2. The nominal thickness of the C-section walls was 4 mm (three 1 mm timber veneers and two 0.5 mm thick GFRP layers). The external width of the C-section web was 130 mm, while the external width of the flange was 40 mm. As the manufacturing of the HFT C-sections used existing cold-formed steel parallel flange channels (PFC’s) as a mould, matching of the exact dimensions of existing thin-walled steel C-sections was not possible. C15012 and C15015 thin-walled steel C-section members were the closest matching for the resulted HFT cross section. HFT C-section members with two different lengths (700 mm and 2000 mm) were considered in this study. Cross sections design (unit: mm).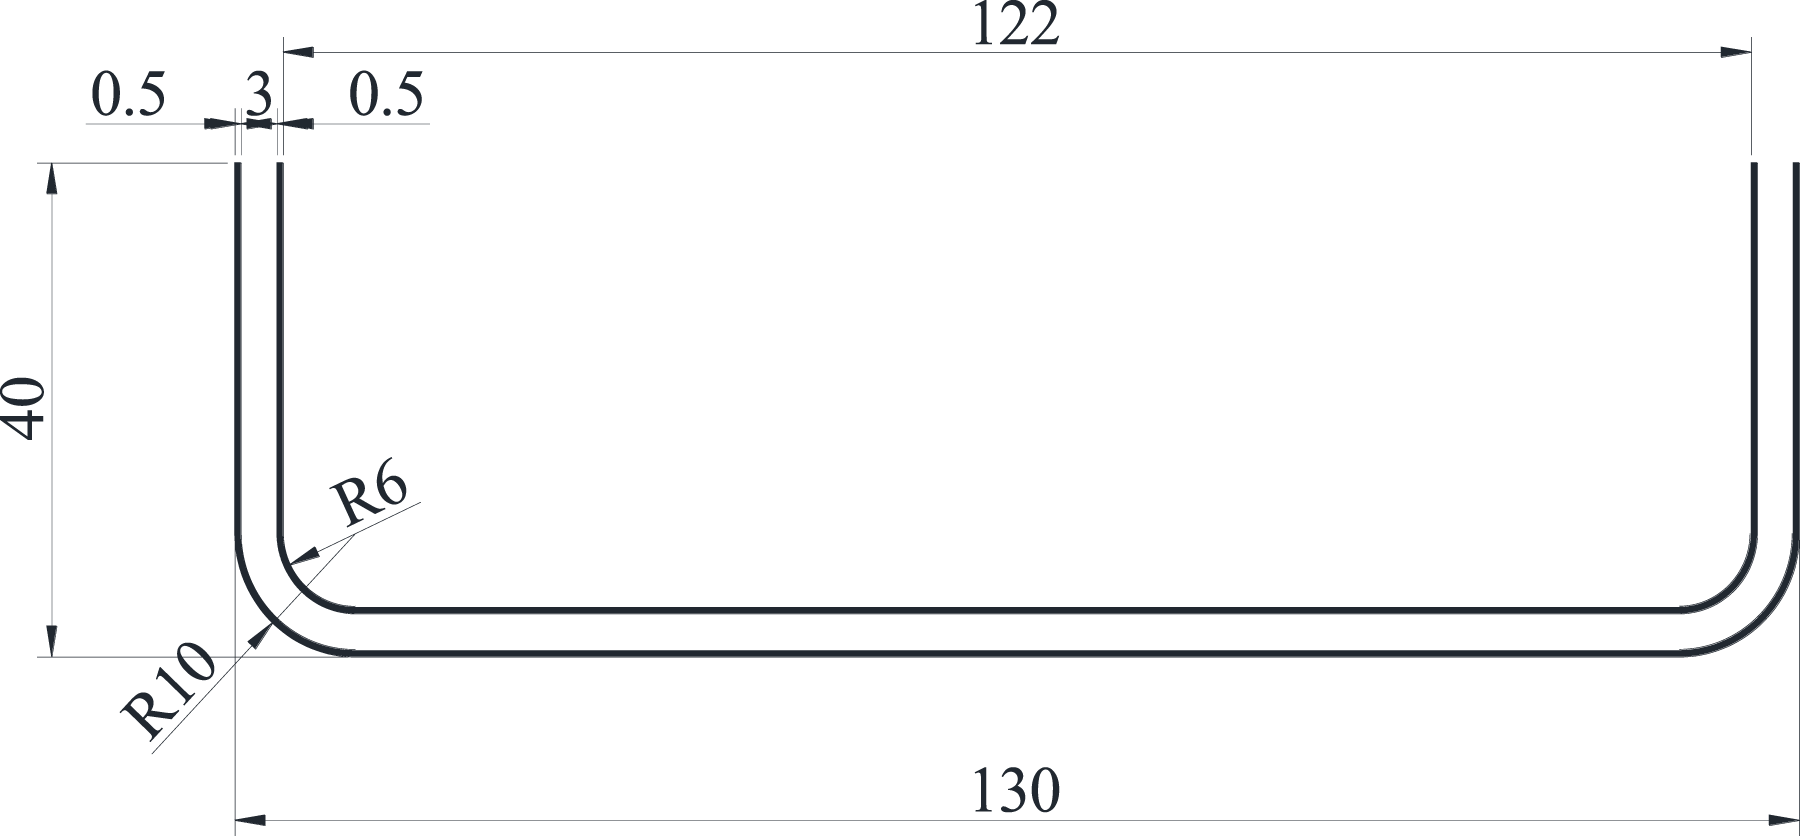
Failure mode shapes of the 700 mm long and 2000 mm long HFT C-sections predicted from the preliminary FE analysis are shown in Figure 3, while the elastic buckling load of each column was calculated as 36.45 kN and 4.13 kN, respectively. HFT columns of 700 mm length failed due to local buckling (Figure 3(a)), while the failure mode of the 2000 mm long HFT columns was global buckling (Figure 3(b)). Predicted failure mode shapes for HFT Cee section columns. (a) 700 mm (b) 2000 mm.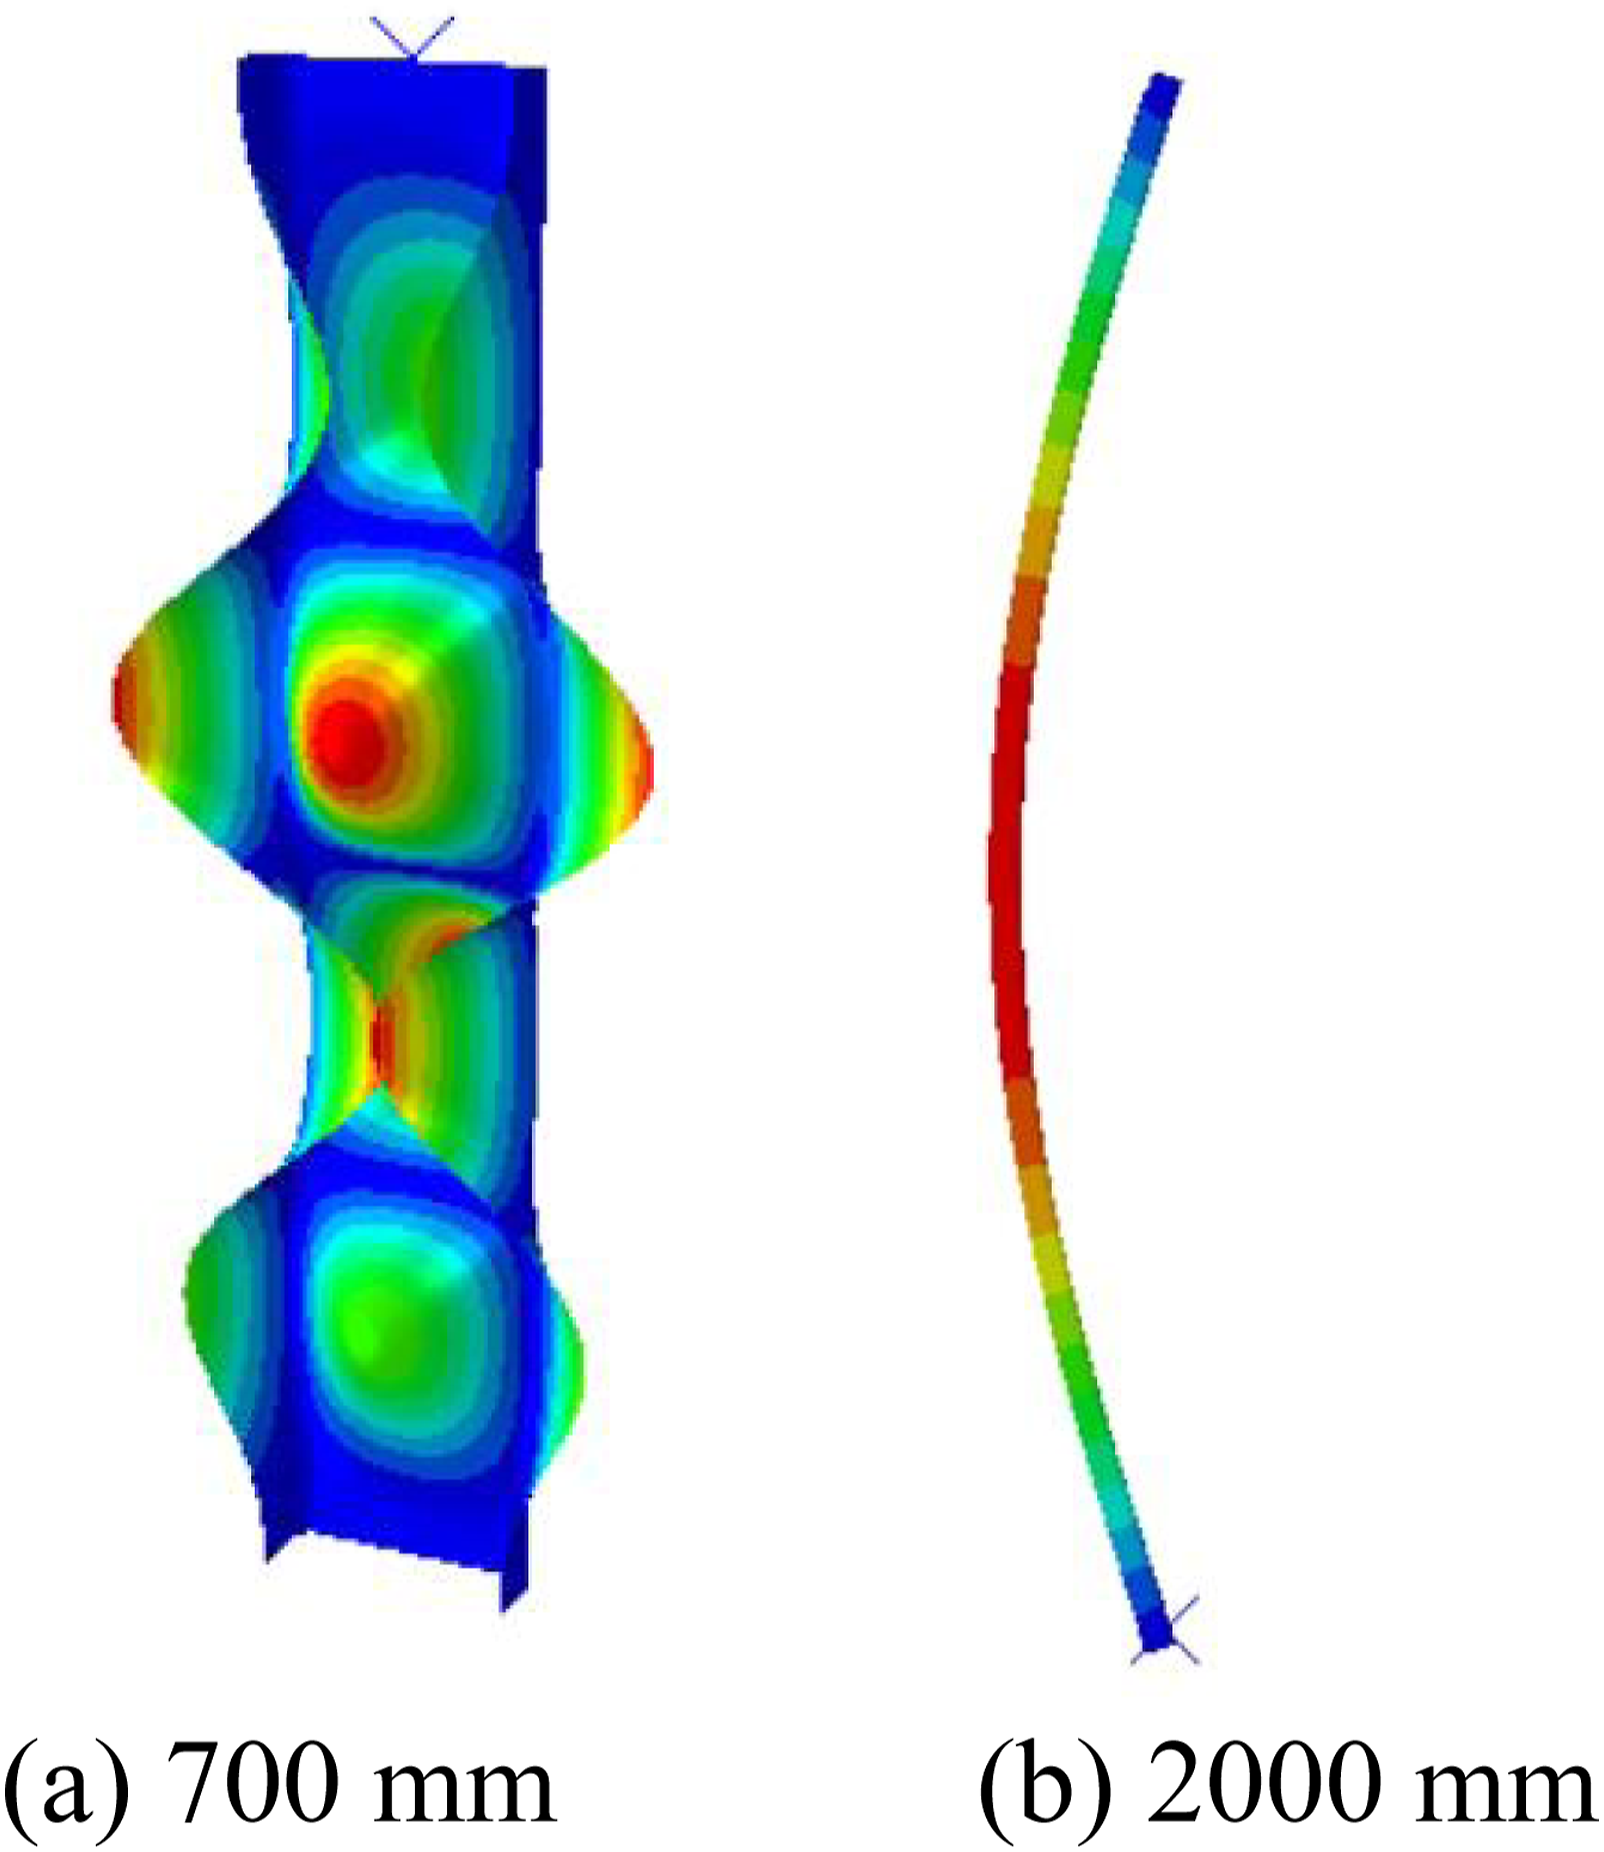
Specimen fabrication
Manufacturing jig
In this study, a compression moulding technique, as suggested by Fernando et al. (2018), was used for the manufacturing of the specimens. The manufacturing jig used is shown in Figure 4. The jig consists of several elements, namely: (a) bottom and top steel PFC’s with steel channel caps matching the cross-section shape fixed by bolts at both ends, (b) inner silica mould, (c) water bag, (d) junction tube, and (e) steel clamps (Figure 4). Manufacturing jig. (i) Cross-section view, (ii) Side view.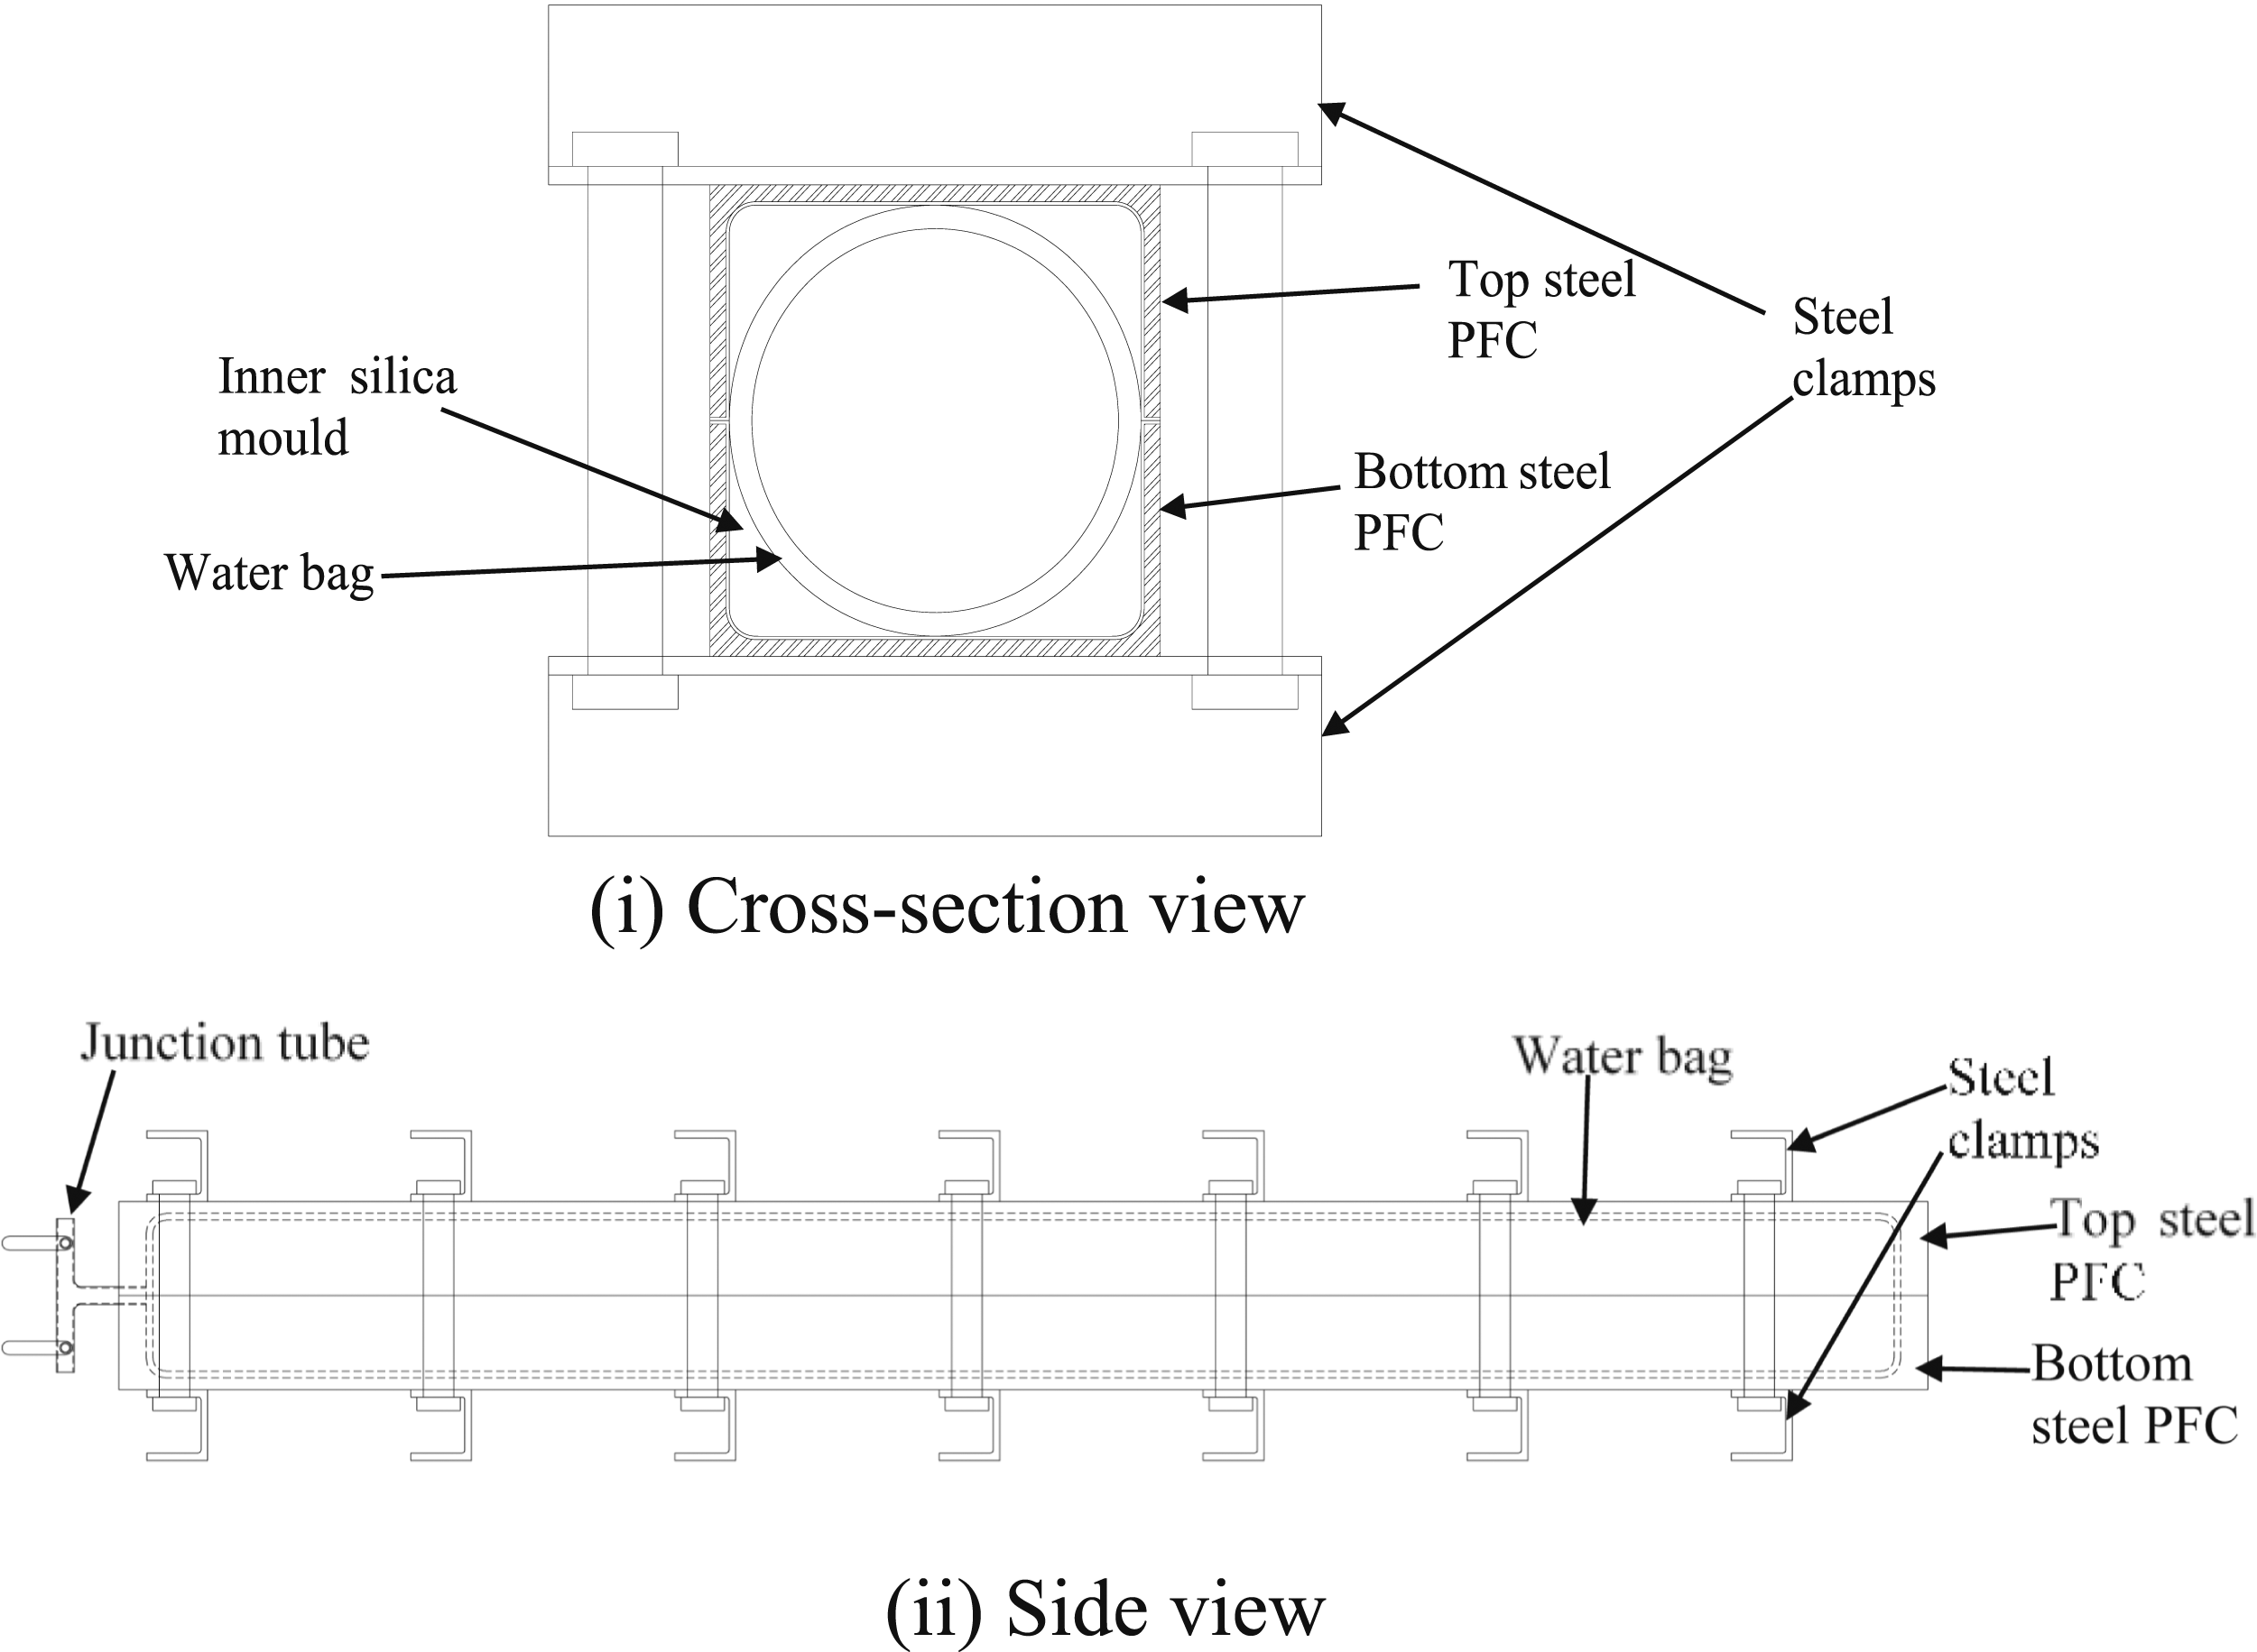
The bottom and top steel PFC sections formed a closed section encasing the: (i) water bag, (ii) inner silica moulds, and (iii) the specimen, and resisted the pressure from the water bag on the steel PFC walls. The bottom PFC sections’ inner dimensions were taken to match the outer section dimensions of the HFT C-section. Inner silica moulds were made by pouring liquid Silicone into a thin-steel C-section mould, made with inner dimensions to match the inner dimensions of the HFT C-section, and letting it solidify in that shape. Inner silica moulds ensured sufficient pressure applied on the corner regions of the HFT C-section. Inner and outer moulds also ensured accurate dimensional control of the HFT C-section.
A water bag with a length of 2900 mm and an idle radius r = 50 mm was used to apply pressure on the specimen while curing. Following the findings of Min et al. (2021a), a minimum of 1 MPa pressure was used in the manufacturing of the HFT C-section columns. A junction tube was used to feed the water into the water bag and to connect the pump to control the water pressure. Steel clamps were used at 170 mm on centres to lock the top and bottom PFCs together and to minimize their movement.
Materials
For this study, 1 mm thick Hoop Pine veneers were used as the timber veneers. For each HFT C-section, three veneers were used. Veneers for the specimens were cut from 2400 mm by 1200 mm veneer sheets. A layer from 329 gsm bi-directional GF fabric was used on each side of the core veneers of the HFT. Based on the recommendation of Miao et al. (2019), the commercially available polyurethane adhesive Purbond was used to bond all surfaces. For each HFT C-section, additional flat HFT plates were manufactured using the cut-outs from the same veneer sheets as used to obtain veneers for the specimens, to obtain material coupons.
Mechanical Properties.
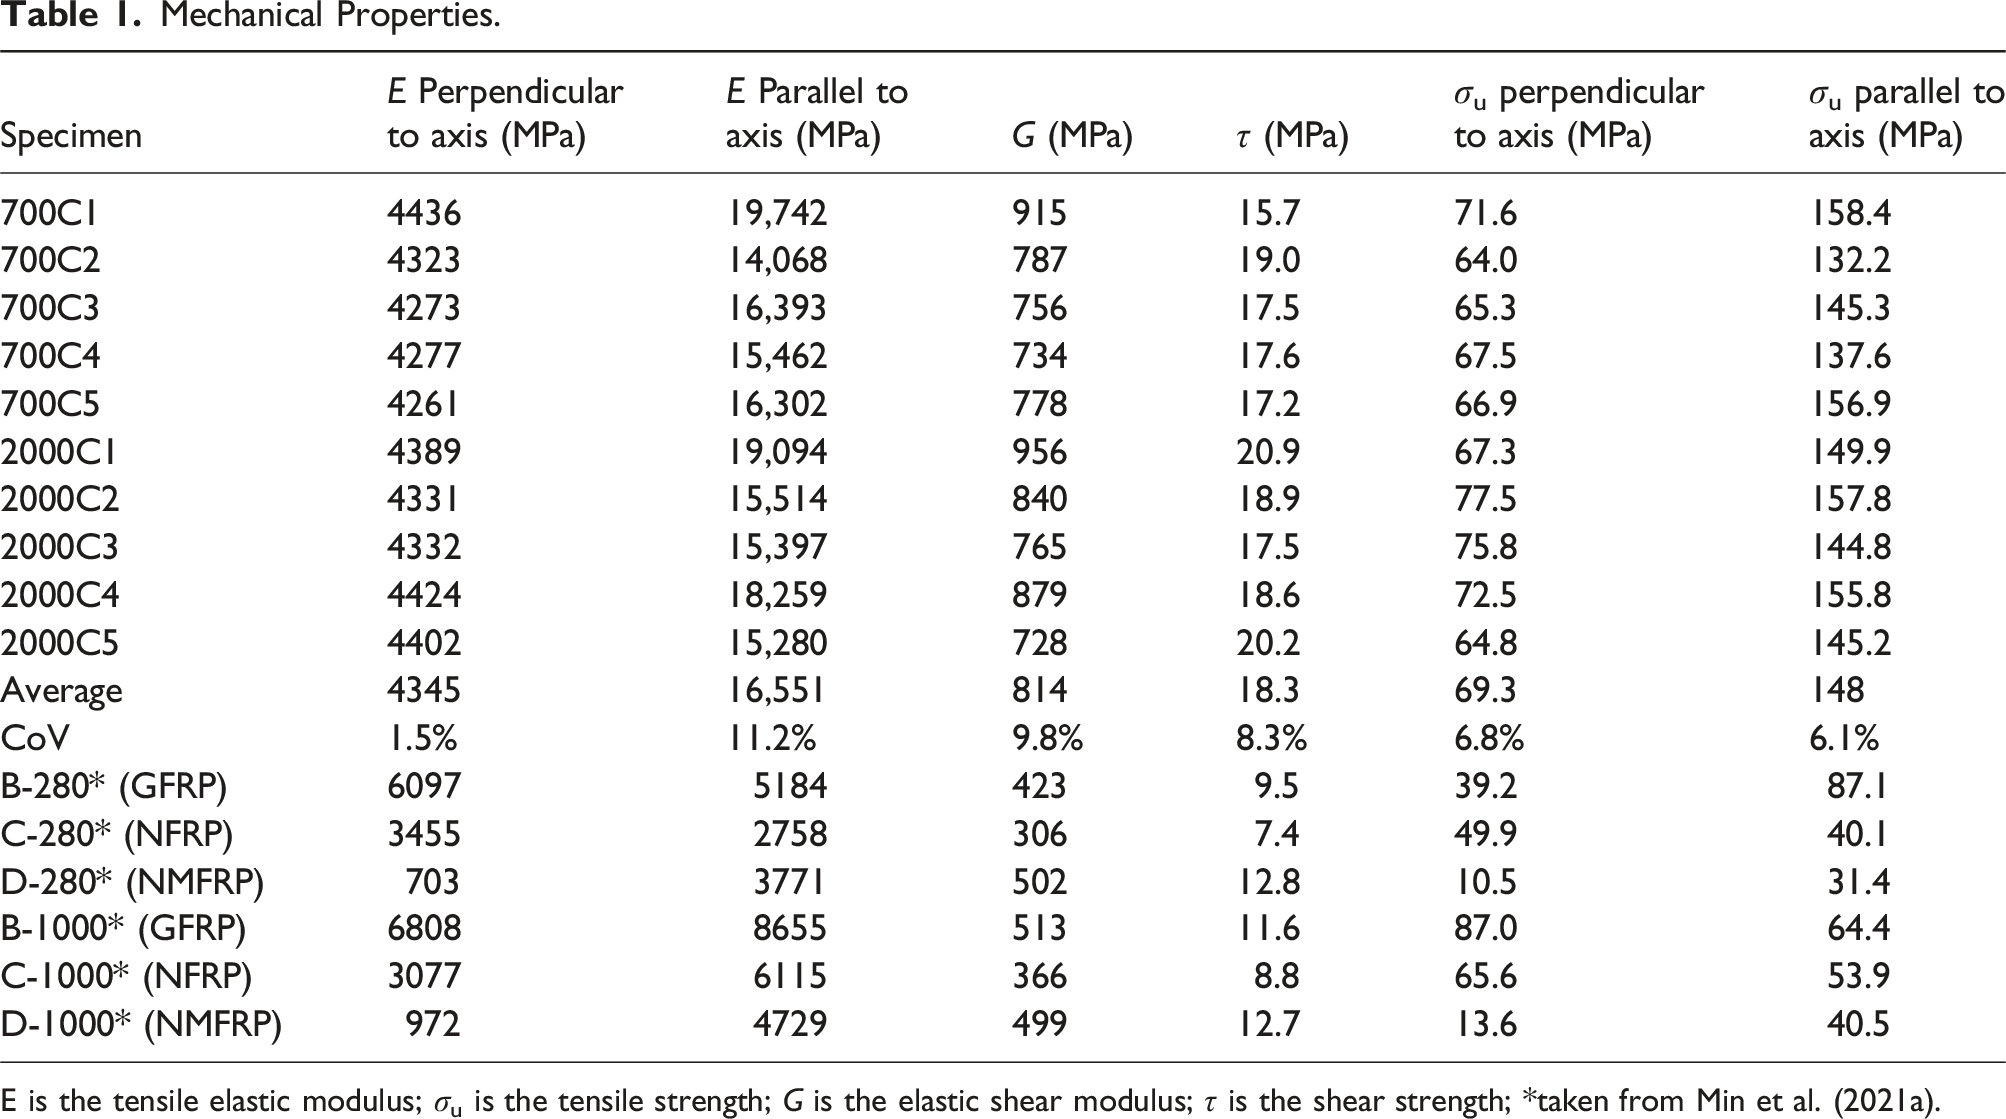
E is the tensile elastic modulus; σu is the tensile strength; G is the elastic shear modulus; τ is the shear strength; *taken from Min et al. (2021a).
In Table 1, five of the 700 mm long specimens are given names 700C1, 700C2, 700C3, 700C4, and 700C5, while five of the 2000 mm long specimens are given the names 2000C1, 2000C2, 2000C3, 2000C4, and 2000C5.
In addition to tensile coupons, shear coupon tests were also carried out as per ASTM D7078/D7078M-12 (2012). For each HFT C-section, six coupons (three coupons in parallel to timber grain direction and three coupons in perpendicular to timber grain direction) were prepared and tested. Average properties between the six shear coupons (i.e., three coupons in each perpendicular and parallel to timber grain directions) for each specimen are listed in Table 1. Shear stress was calculated by dividing the applied load by the measured cross-sectional area across the notch, and the shear strains were calculated form the deformation measurements across the notch measured using a DIC system.
For comparison purposes, HFT specimen mechanical properties from Min et al.’s (2021a) tests are also given in Table 1. The parallel-to-axis properties of the HFT specimens in the current study showed better results than the parallel-to-axis properties of the HFT specimens in the study by Min et al. (2021a). However, the perpendicular-to-axis properties of the HFT specimens in the current study were lower than the perpendicular-to-axis properties of the HFT specimens with GFRP presented by Min et al. (2021a).
For all the other types of HFT specimens (i.e., HFTs made using natural fibres) presented by Min et al. (2021a), perpendicular to axis properties were also lower than the similar direction properties of the current HFT specimens. The shear modulus of the current HFT specimens was found to be higher than those presented in Min et al. (2021a).
Manufacturing process
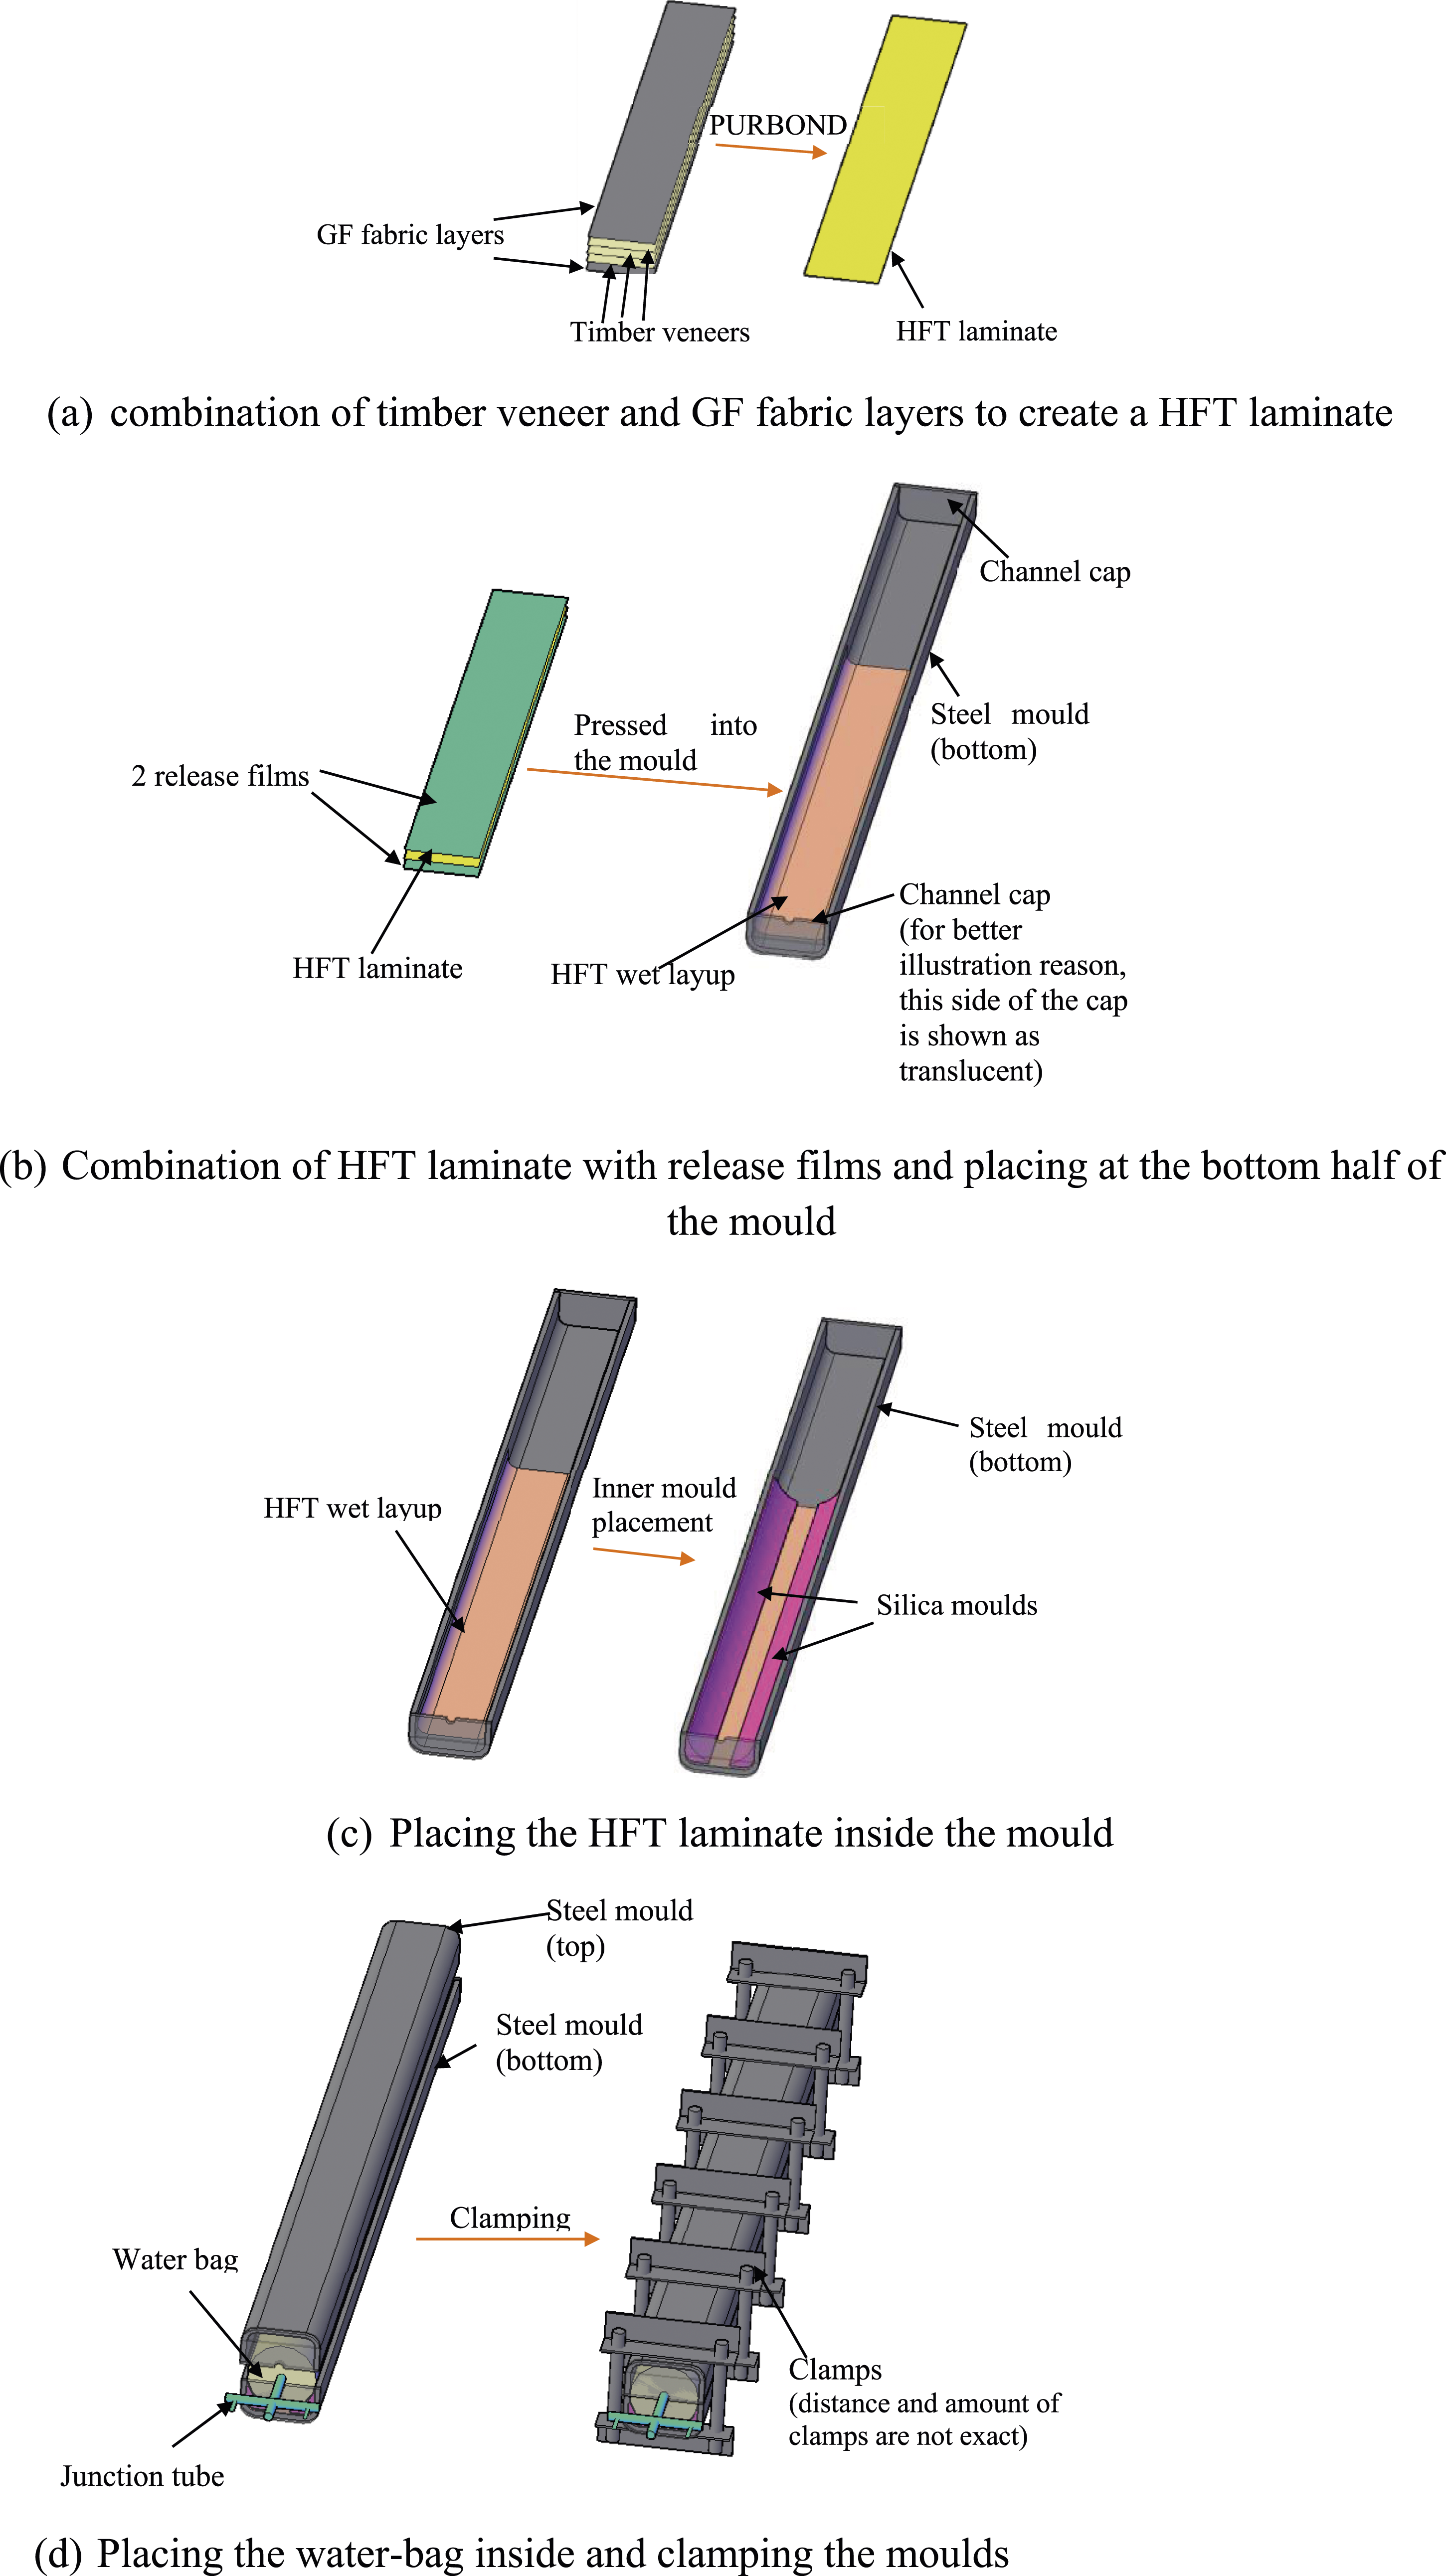
The steps of the manufacturing process used for the HFT C-sections in this study are given below: • First the timber veneers and GF fabrics were cut into the required dimensions. For each HFT C-section, three layers of timber veneer and two layers of GF fabrics were used. Adhesive was applied on each face of the timber veneers, as well as on the GF fabric. An even adhesive spread of 310 gsm was used on all surfaces. • Timber veneers and GF fabrics with adhesives applied on each of the bonding surfaces were assembled as shown in Figure 5(a), and release films were placed on both outer surfaces to avoid bonding of the HFT laminate to the moulds (Figure 5(b)). The assembled sheets (HFT and release films) were then placed onto the bottom half of the mould and pushed into shape (Figure 5(b)). • The inner silica moulds were then placed on top of the assembled sheets, and lightly pressed to form the correct shape (Figure 5(c)). Once the inner silica moulds were in place, the water bag was placed, and the mould was closed by placing the top steel PFC and tightening the steel clamps (Figure 5(d)). • Once the mould was closed, water was injected into water bag to a water pressure of approximately 0.8 MPa. The water pump was then used to increase the pressure up to 1 MPa to ensure a more precise control of the water pressure. With the applied pressure of 1 MPa, the specimen was left for 24 h for the adhesive to cure. After 24 h, pressure was released, and the specimen was de-moulded. Then the edges of the flanges were carefully trimmed to remove any excess materials, and to achieve straight edges. Manufacturing steps of the HFT Cee section columns (a) combination of timber veneer and GF fabric layers to create a HFT laminate (b) Combination of HFT laminate with release films and placing at the bottom half of the mould (c) Placing the HFT laminate inside the mould (d) Placing the water-bag inside and clamping the moulds.
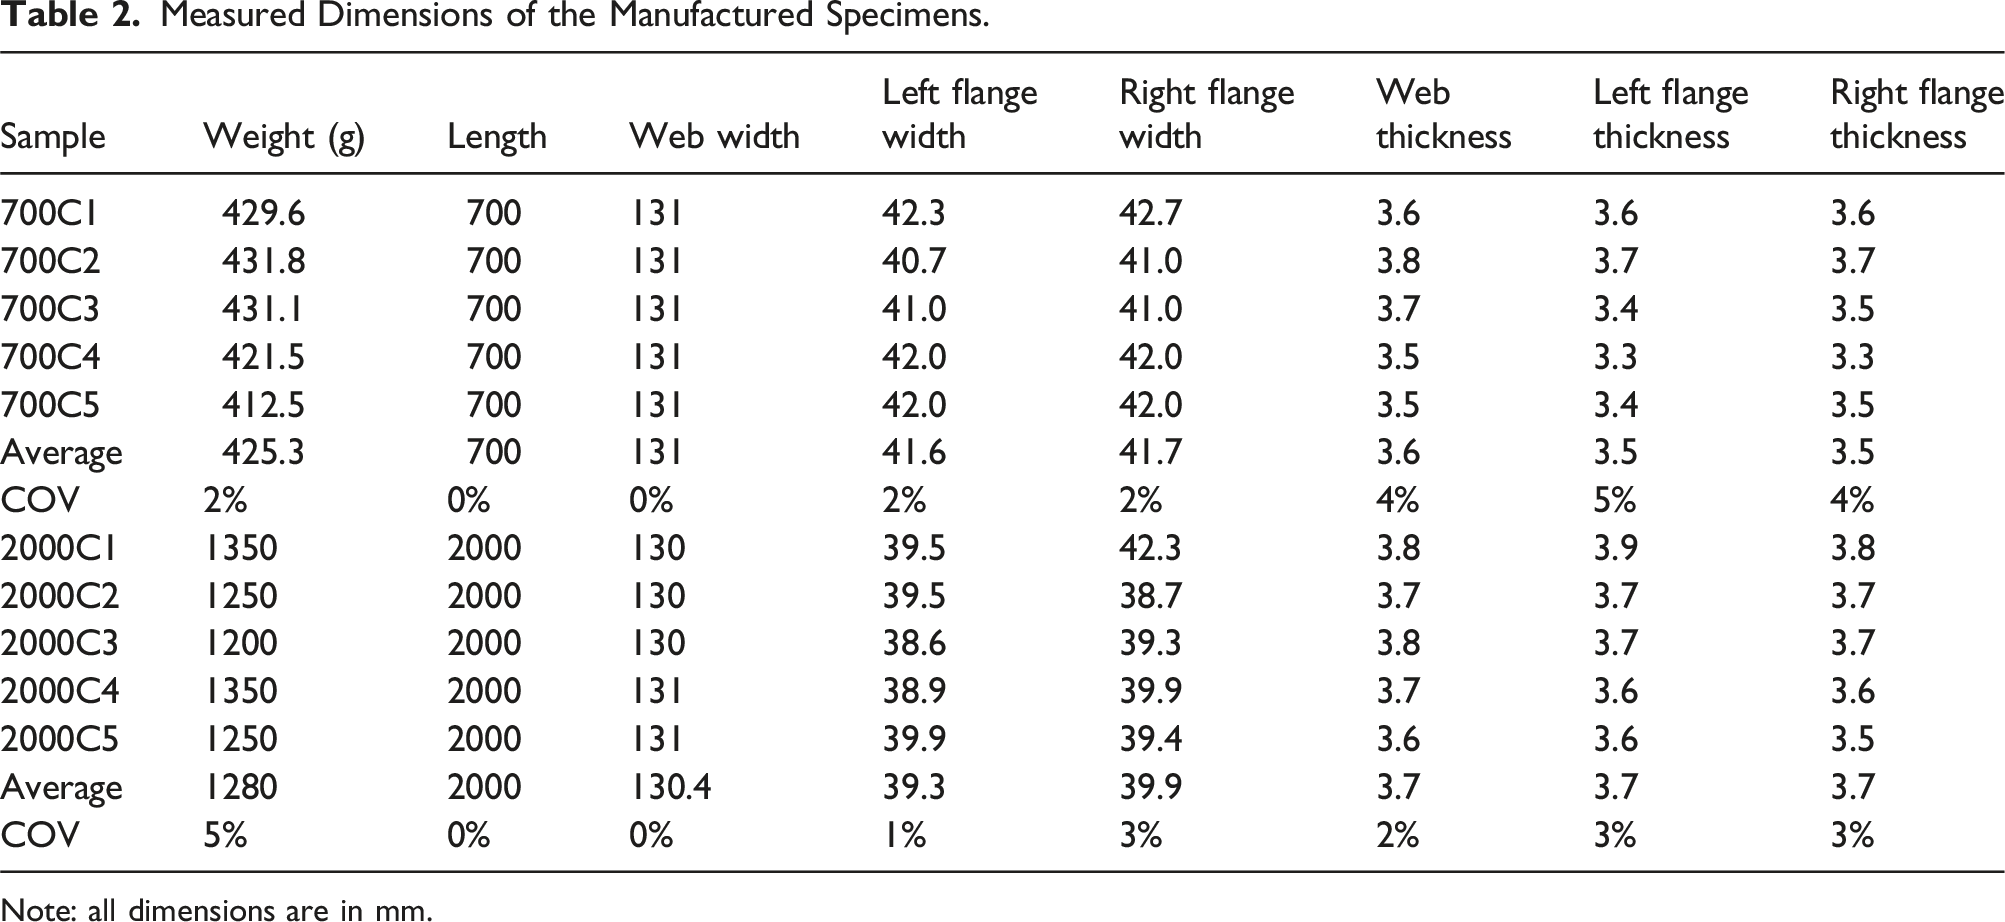
De-moulded samples manufactured using the above process are shown in Figure 6. Excellent quality and consistency were achieved. To quantify the dimensional accuracy, all the specimens were scanned using a FaroArm® 3D laser scanner. Dimensions obtained through the scanning process for all the specimens are given in Table 2. The highest coefficient of variation (COV) of the dimensions was 5%, showing the excellent dimensional accuracy. This was a significant improvement compared to the variations in thickness and weight reported in Min et al. (2021a) (COVs as high as 23%). Manufactured HFT Cee section columns (left: 700 mm samples; right: 2000 mm samples). Measured Dimensions of the Manufactured Specimens. Note: all dimensions are in mm.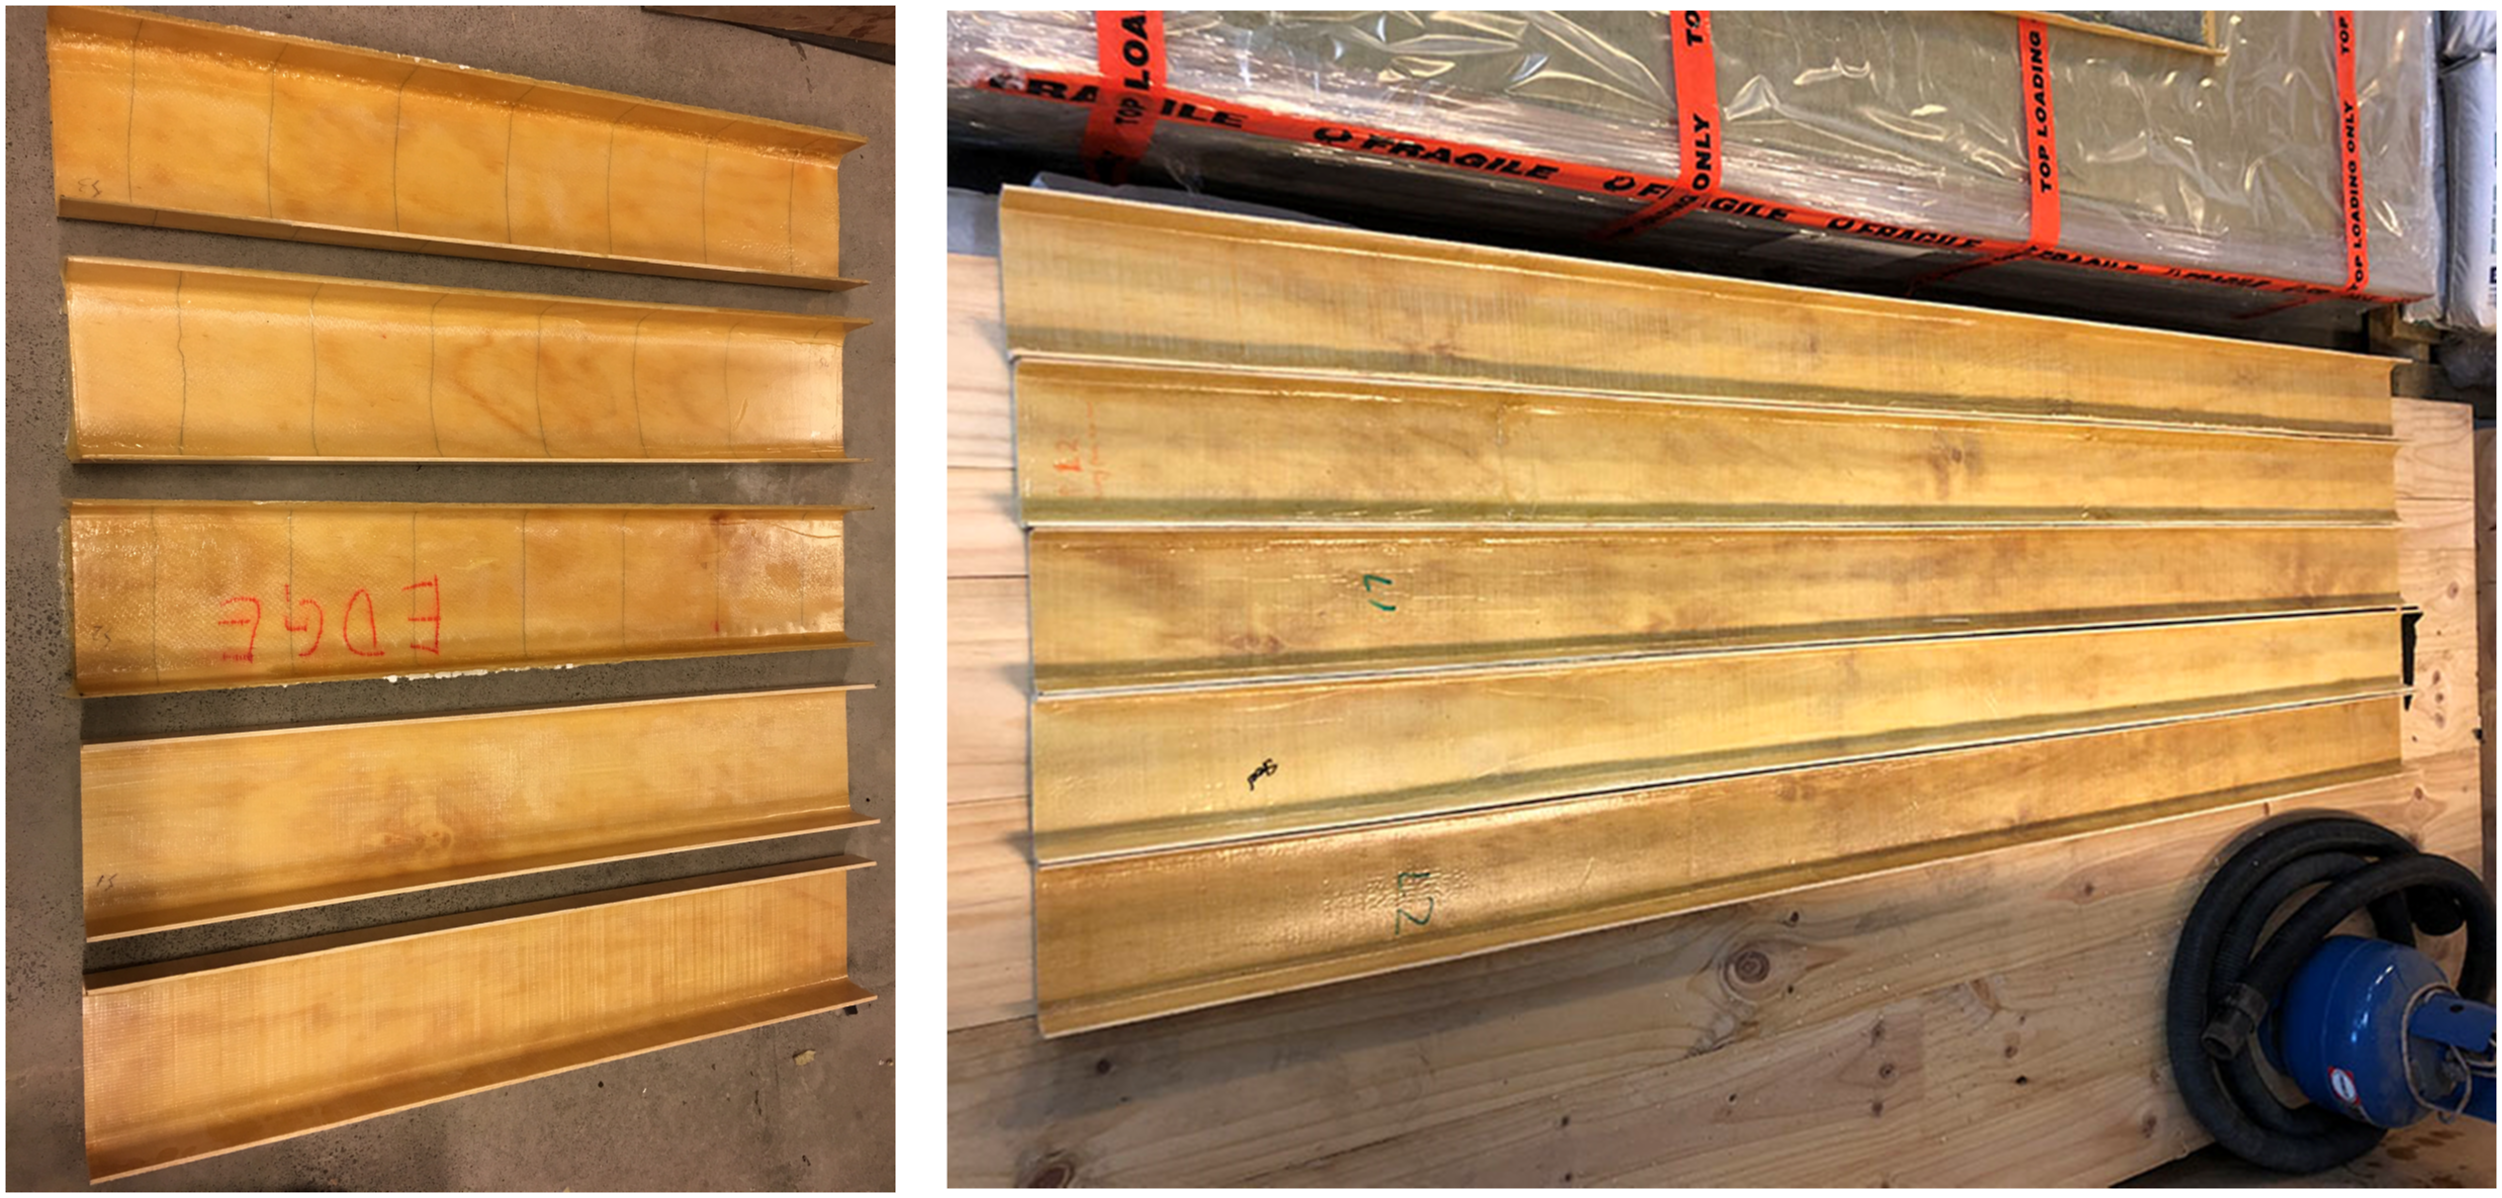
Instrumentation and test set-up
End refinement: During compression loading, if the C-section directly rests on loading plates, differential rotation of the cross-section from the loading plate and distortion of the specimen cross-section are possible (Min et al., 2021a). Therefore, such a boundary condition can neither be taken as a pinned nor fixed boundary condition (Gilbert et al., 2022). In order to avoid such differential rotation and distortion of the cross-section, a 25 mm thick rigid plate using 6 MPa strength cement grout reinforced with a steel mesh (13 mm hex aperture with 0.56 mm of wire diameter) was cast at each end of the specimens (Figure 7). While inclusion of this thin plate may change the boundary conditions slightly from perfect pinned conditions, they ensured symmetric boundary conditions at both ends, avoided distortion of the cross section, and ensured consistent boundary conditions between all specimens. End refinement (a) front view (b) side view.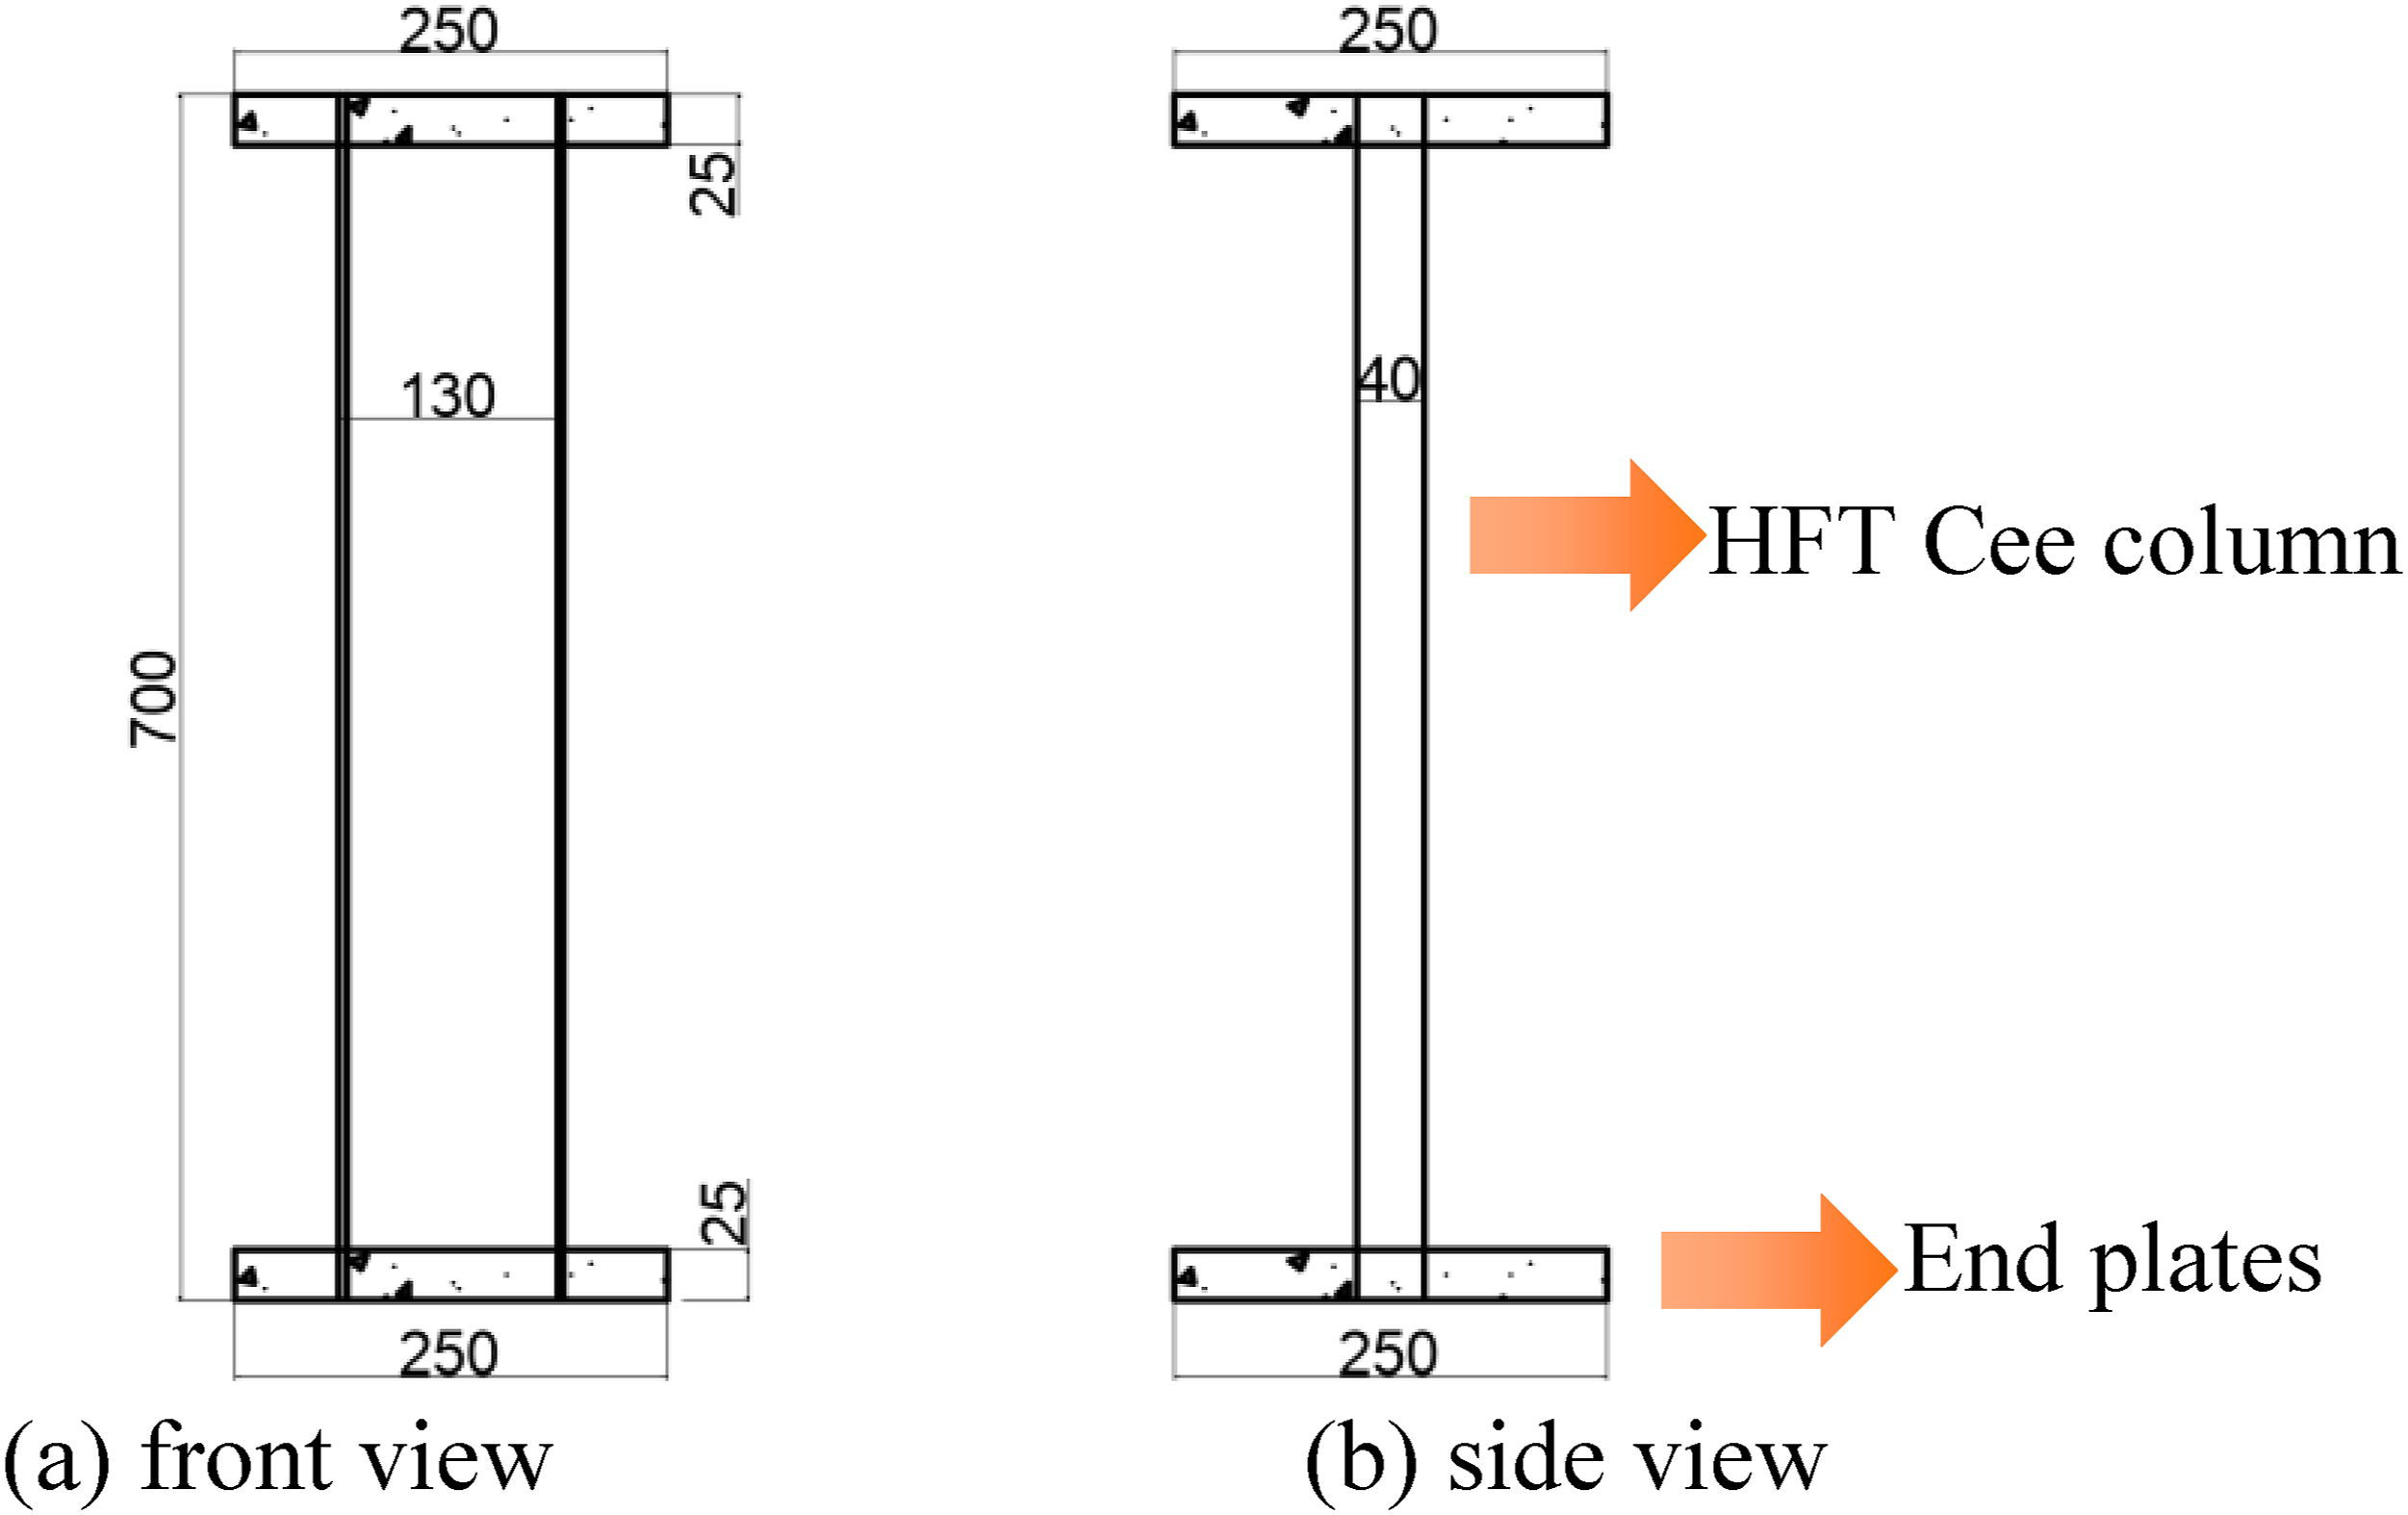
Test set-up: All tests were conducted using a 1 MN capacity MTS universal testing machine. Hinged end bearings were used at both top and bottom to apply load and support to the specimen (Figure 8). Each of top and bottom bearing systems consisted of a 360-degree rotatable hinge (C6/200 T/ZK from HBM) and a bearing plate, which were both made from stainless-steel. The 360-degree rotatable hinge consisted of a stainless-steel hemisphere and a concave holder matching the shape of the hemisphere. The bearing plate was 500 mm × 500 mm × 50 mm in dimension (item one in Figure 8), which was fixed with the hemisphere of the 360-degree rotatable hinge. The concave holder of the top plate was fixed on the loading cell while that of the bottom plate was fixed on the base of the 1 MN MTS testing machine. The geometric centres of the components were all aligned vertically. Illustration of bearing system.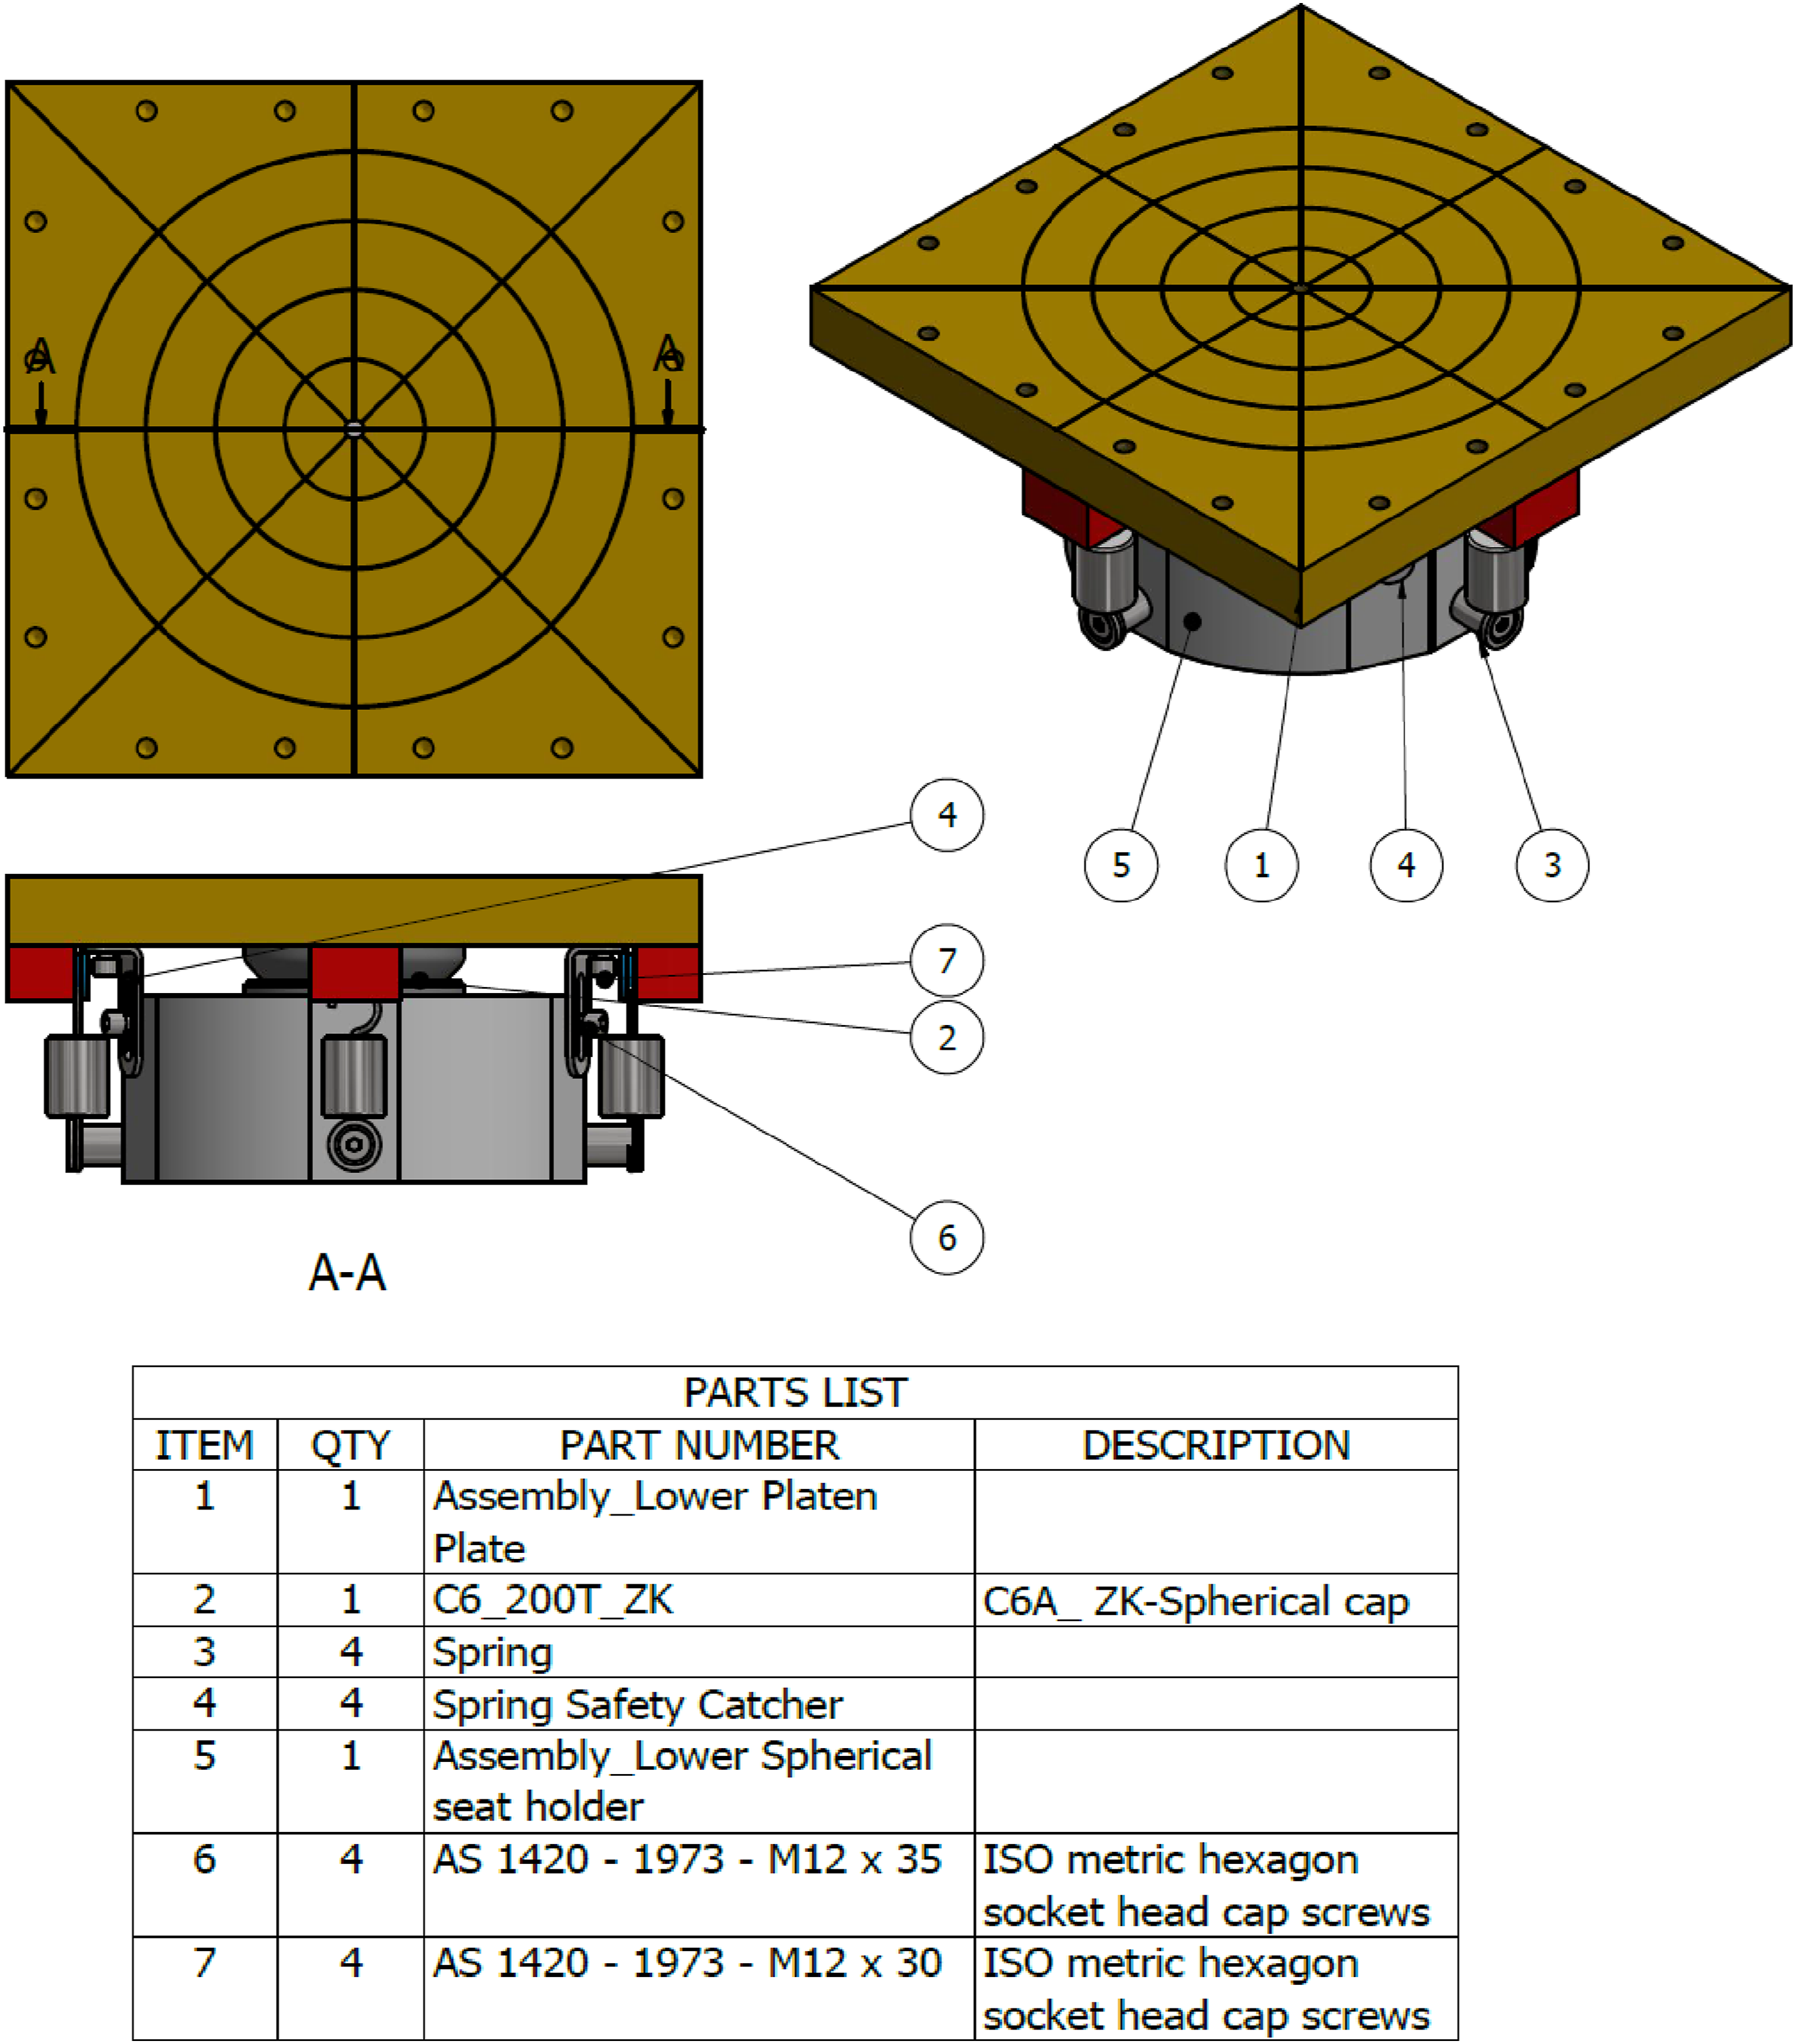
Considering that the applied load was relatively small, a 50 kN load cell was used for test control. Thick timber blocks were mounted on the top and bottom plates to restrain the end plates from any lateral movement (Figure 9). Four laser transducers were attached to the four corners of the top plate to measure the relative displacement between the top and bottom plates. The average displacement of the four displacement readings was taken as the overall axial shortening of the specimen. All the specimens were tested under displacement control mode. For the 700 mm specimens, loading was applied at a rate of 1 mm/min. From the observations made during the testing of 700 mm long specimens, this 1 mm/min displacement rate was found to take unrealistically long time to complete the test, thus a displacement rate of 2 mm/min was adopted for 2000 mm long specimens. Clamping system and laser transducers set-up.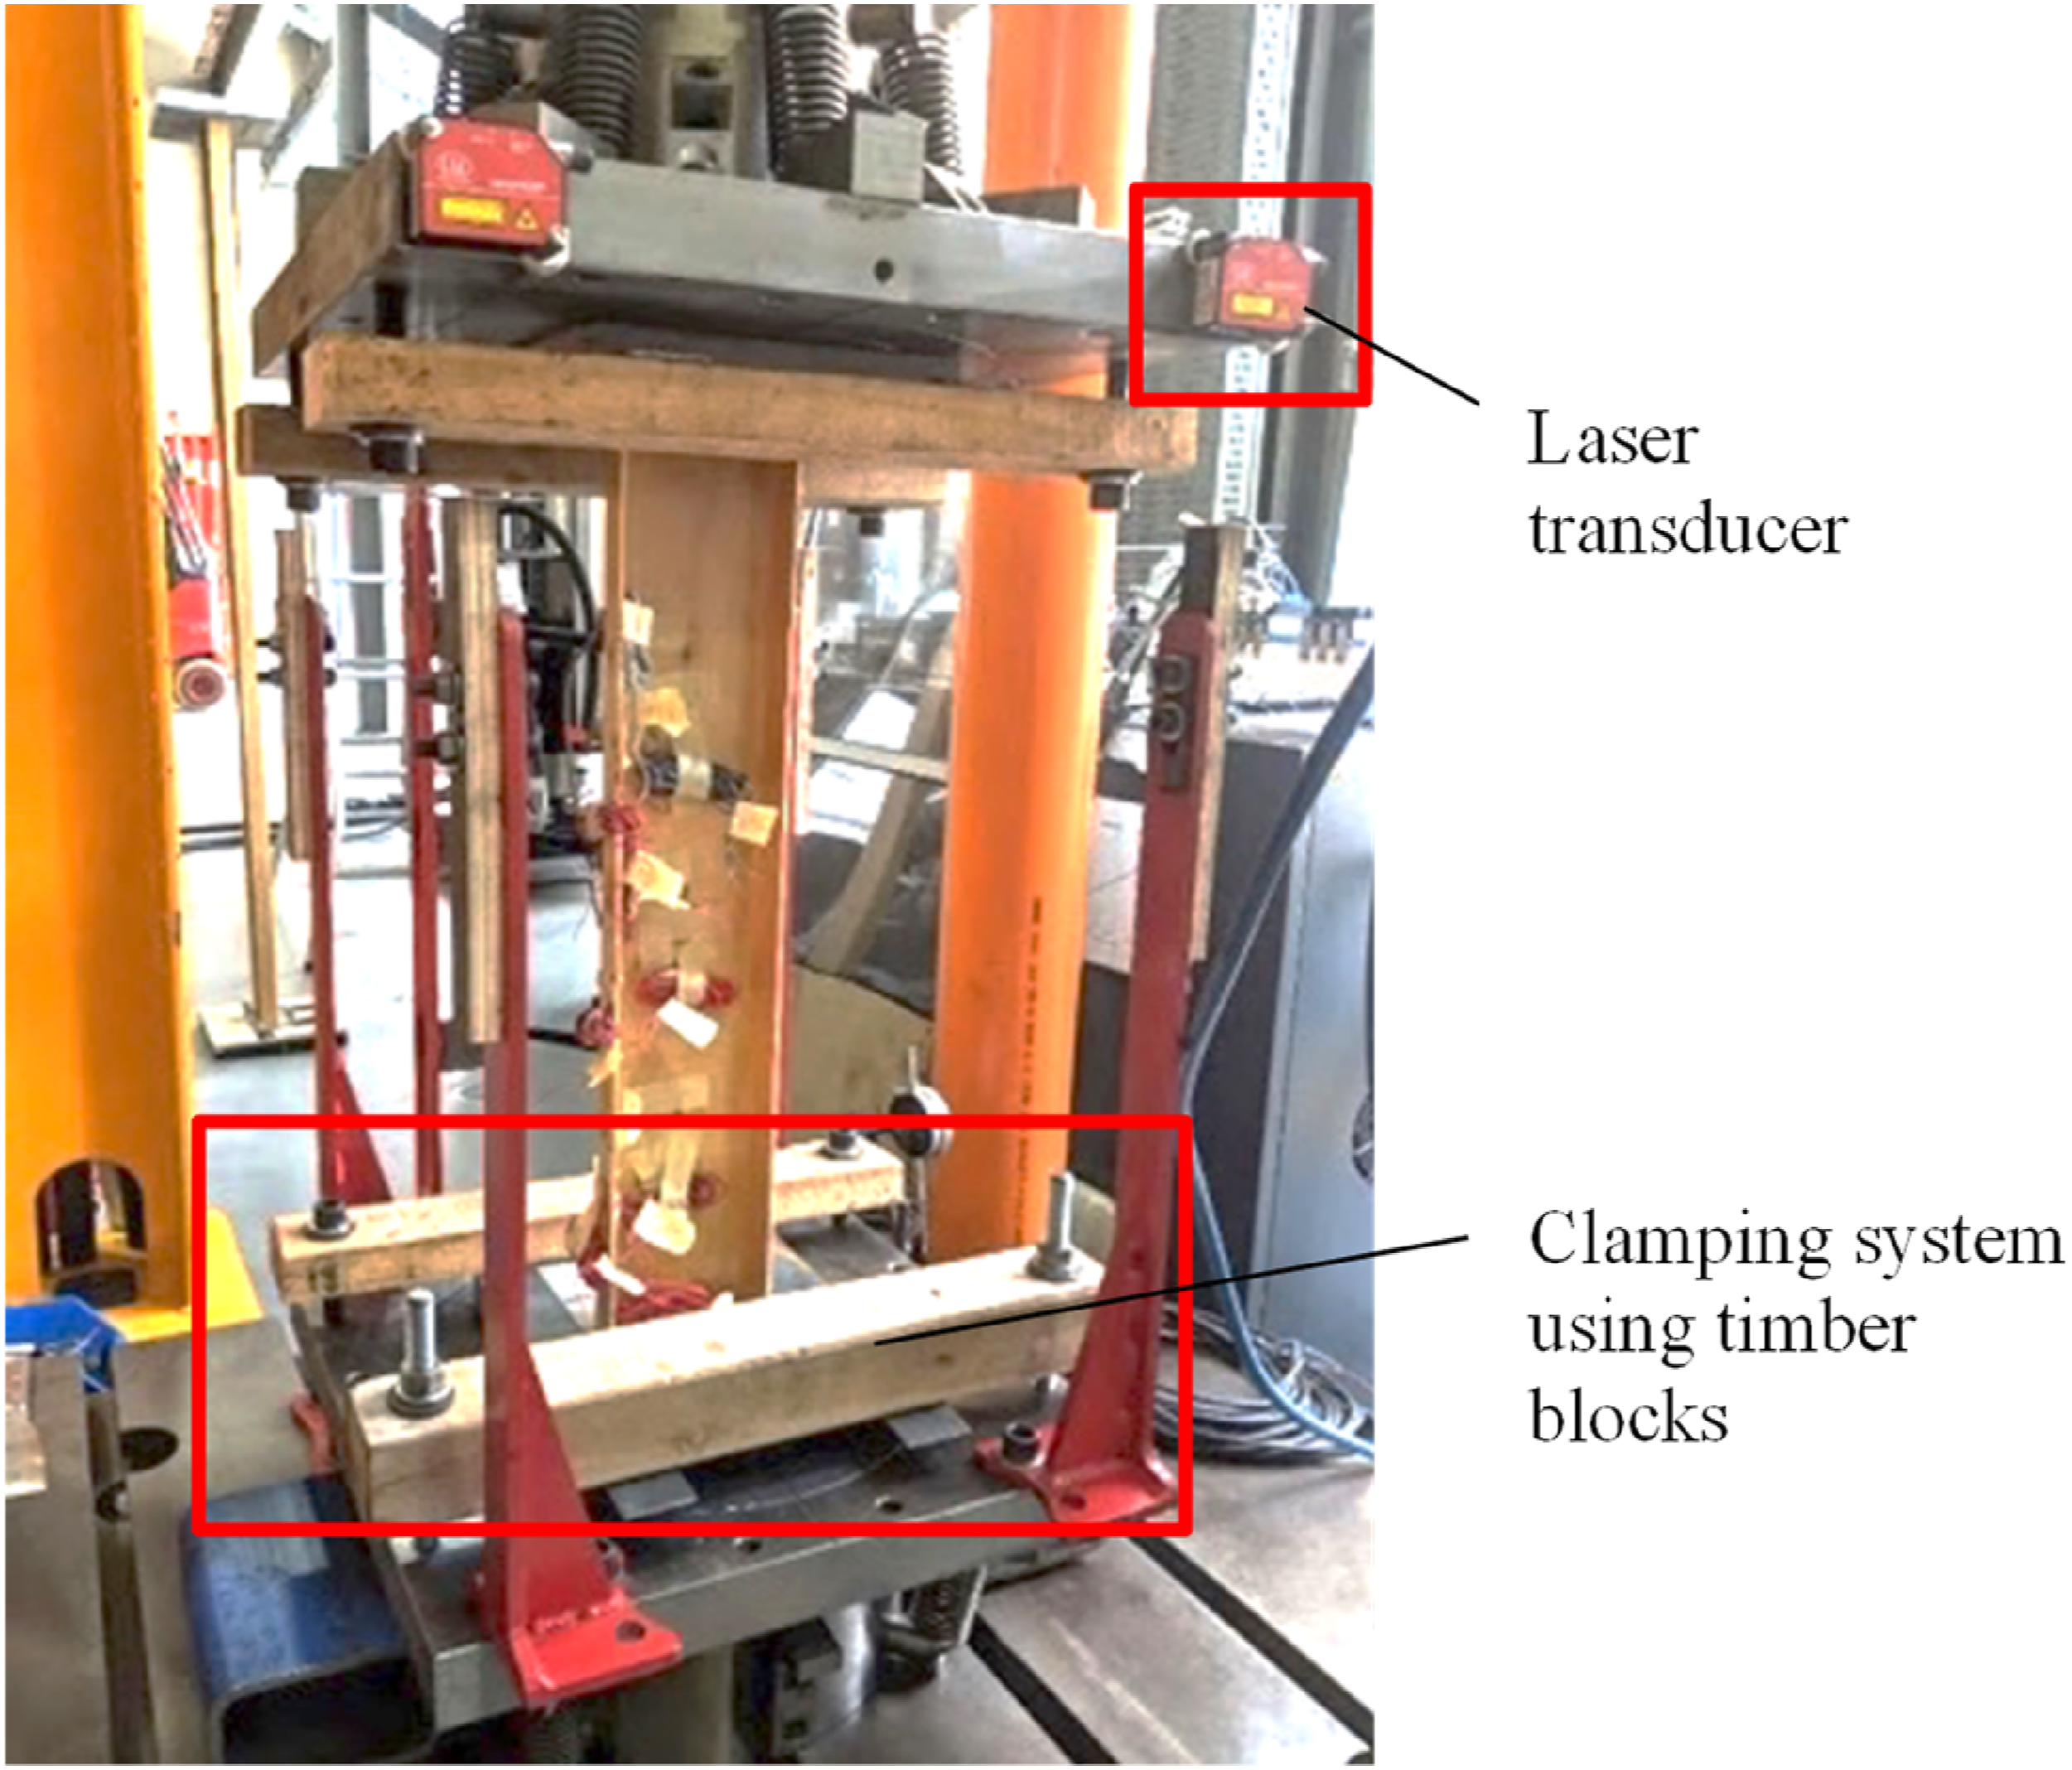
Test results
Failure modes
Buckling failures of the specimens during the tests are shown in Figure 10. All the 700 mm long HFT specimens failed due to local buckling (Figure 10(a)-(e)). Multiple half-sine waves (mostly three with some specimens showing five) were clearly visible on both flanges during buckling. As the deformation of the flanges kept increasing, failure began to localize and eventually led to localized material failure resulting in fracture of the flanges (Figure 11(a)-(e)). Upon unloading almost all the deformations, except for deformations at the localized fracture region, recovered. Buckling modes (a) 700C1 (b) 700C2 (c) 700C3 (d) 700C4 (e) 700C5 (f) 2000C1 (g) 2000C2 (h) 2000C3 (i) 2000C4 (j) 2000C5. Local failure modes (a) 700C1 (b) 700C2 (c) 700C3 (d) 700C4 (e) 700C5 (f) 2000C1 (g) 2000C2 (h) 2000C3 (i) 2000C4 (j) 2000C5.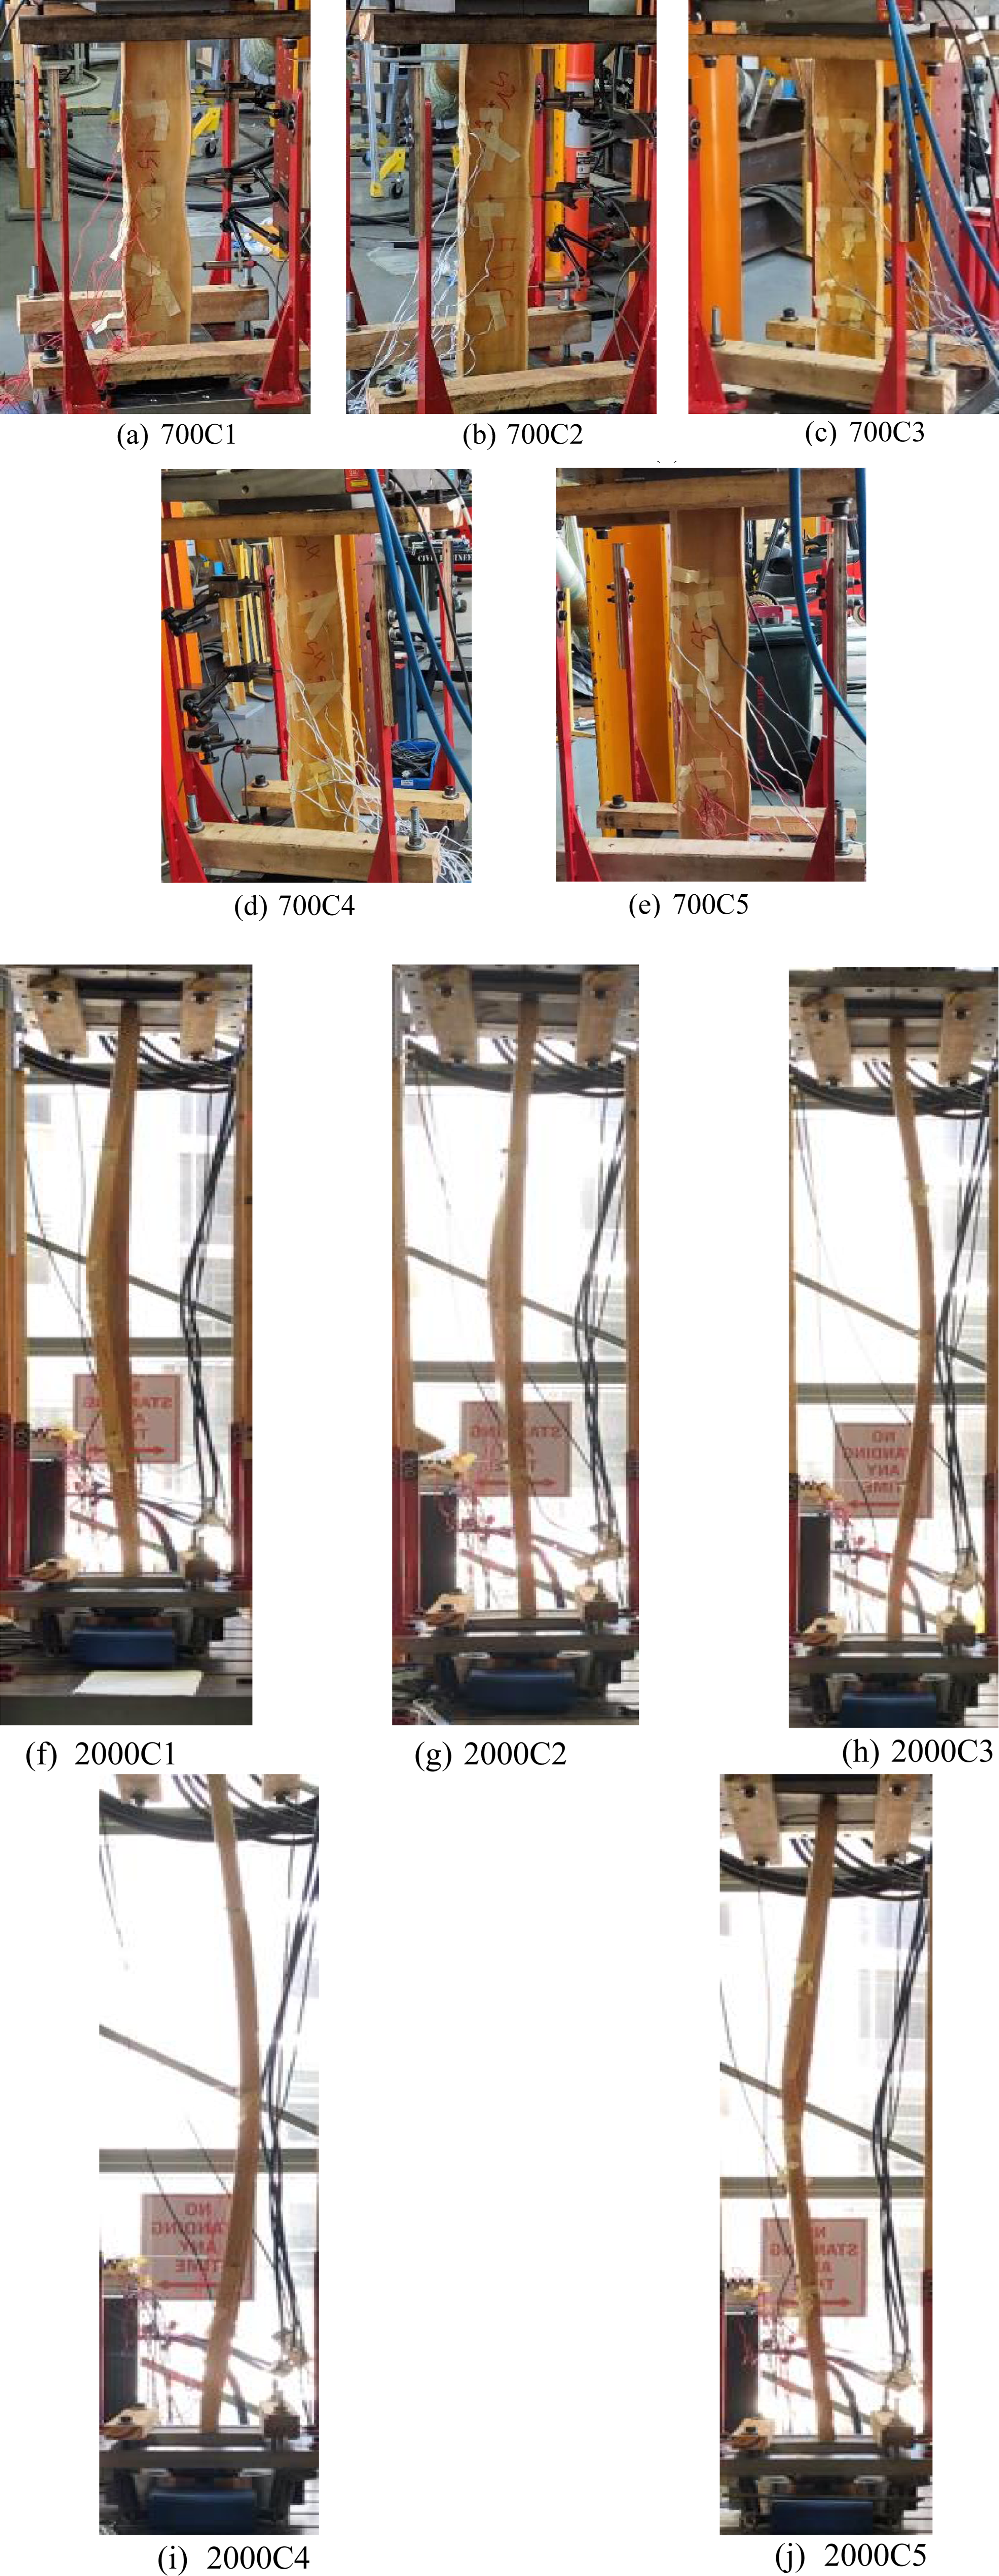
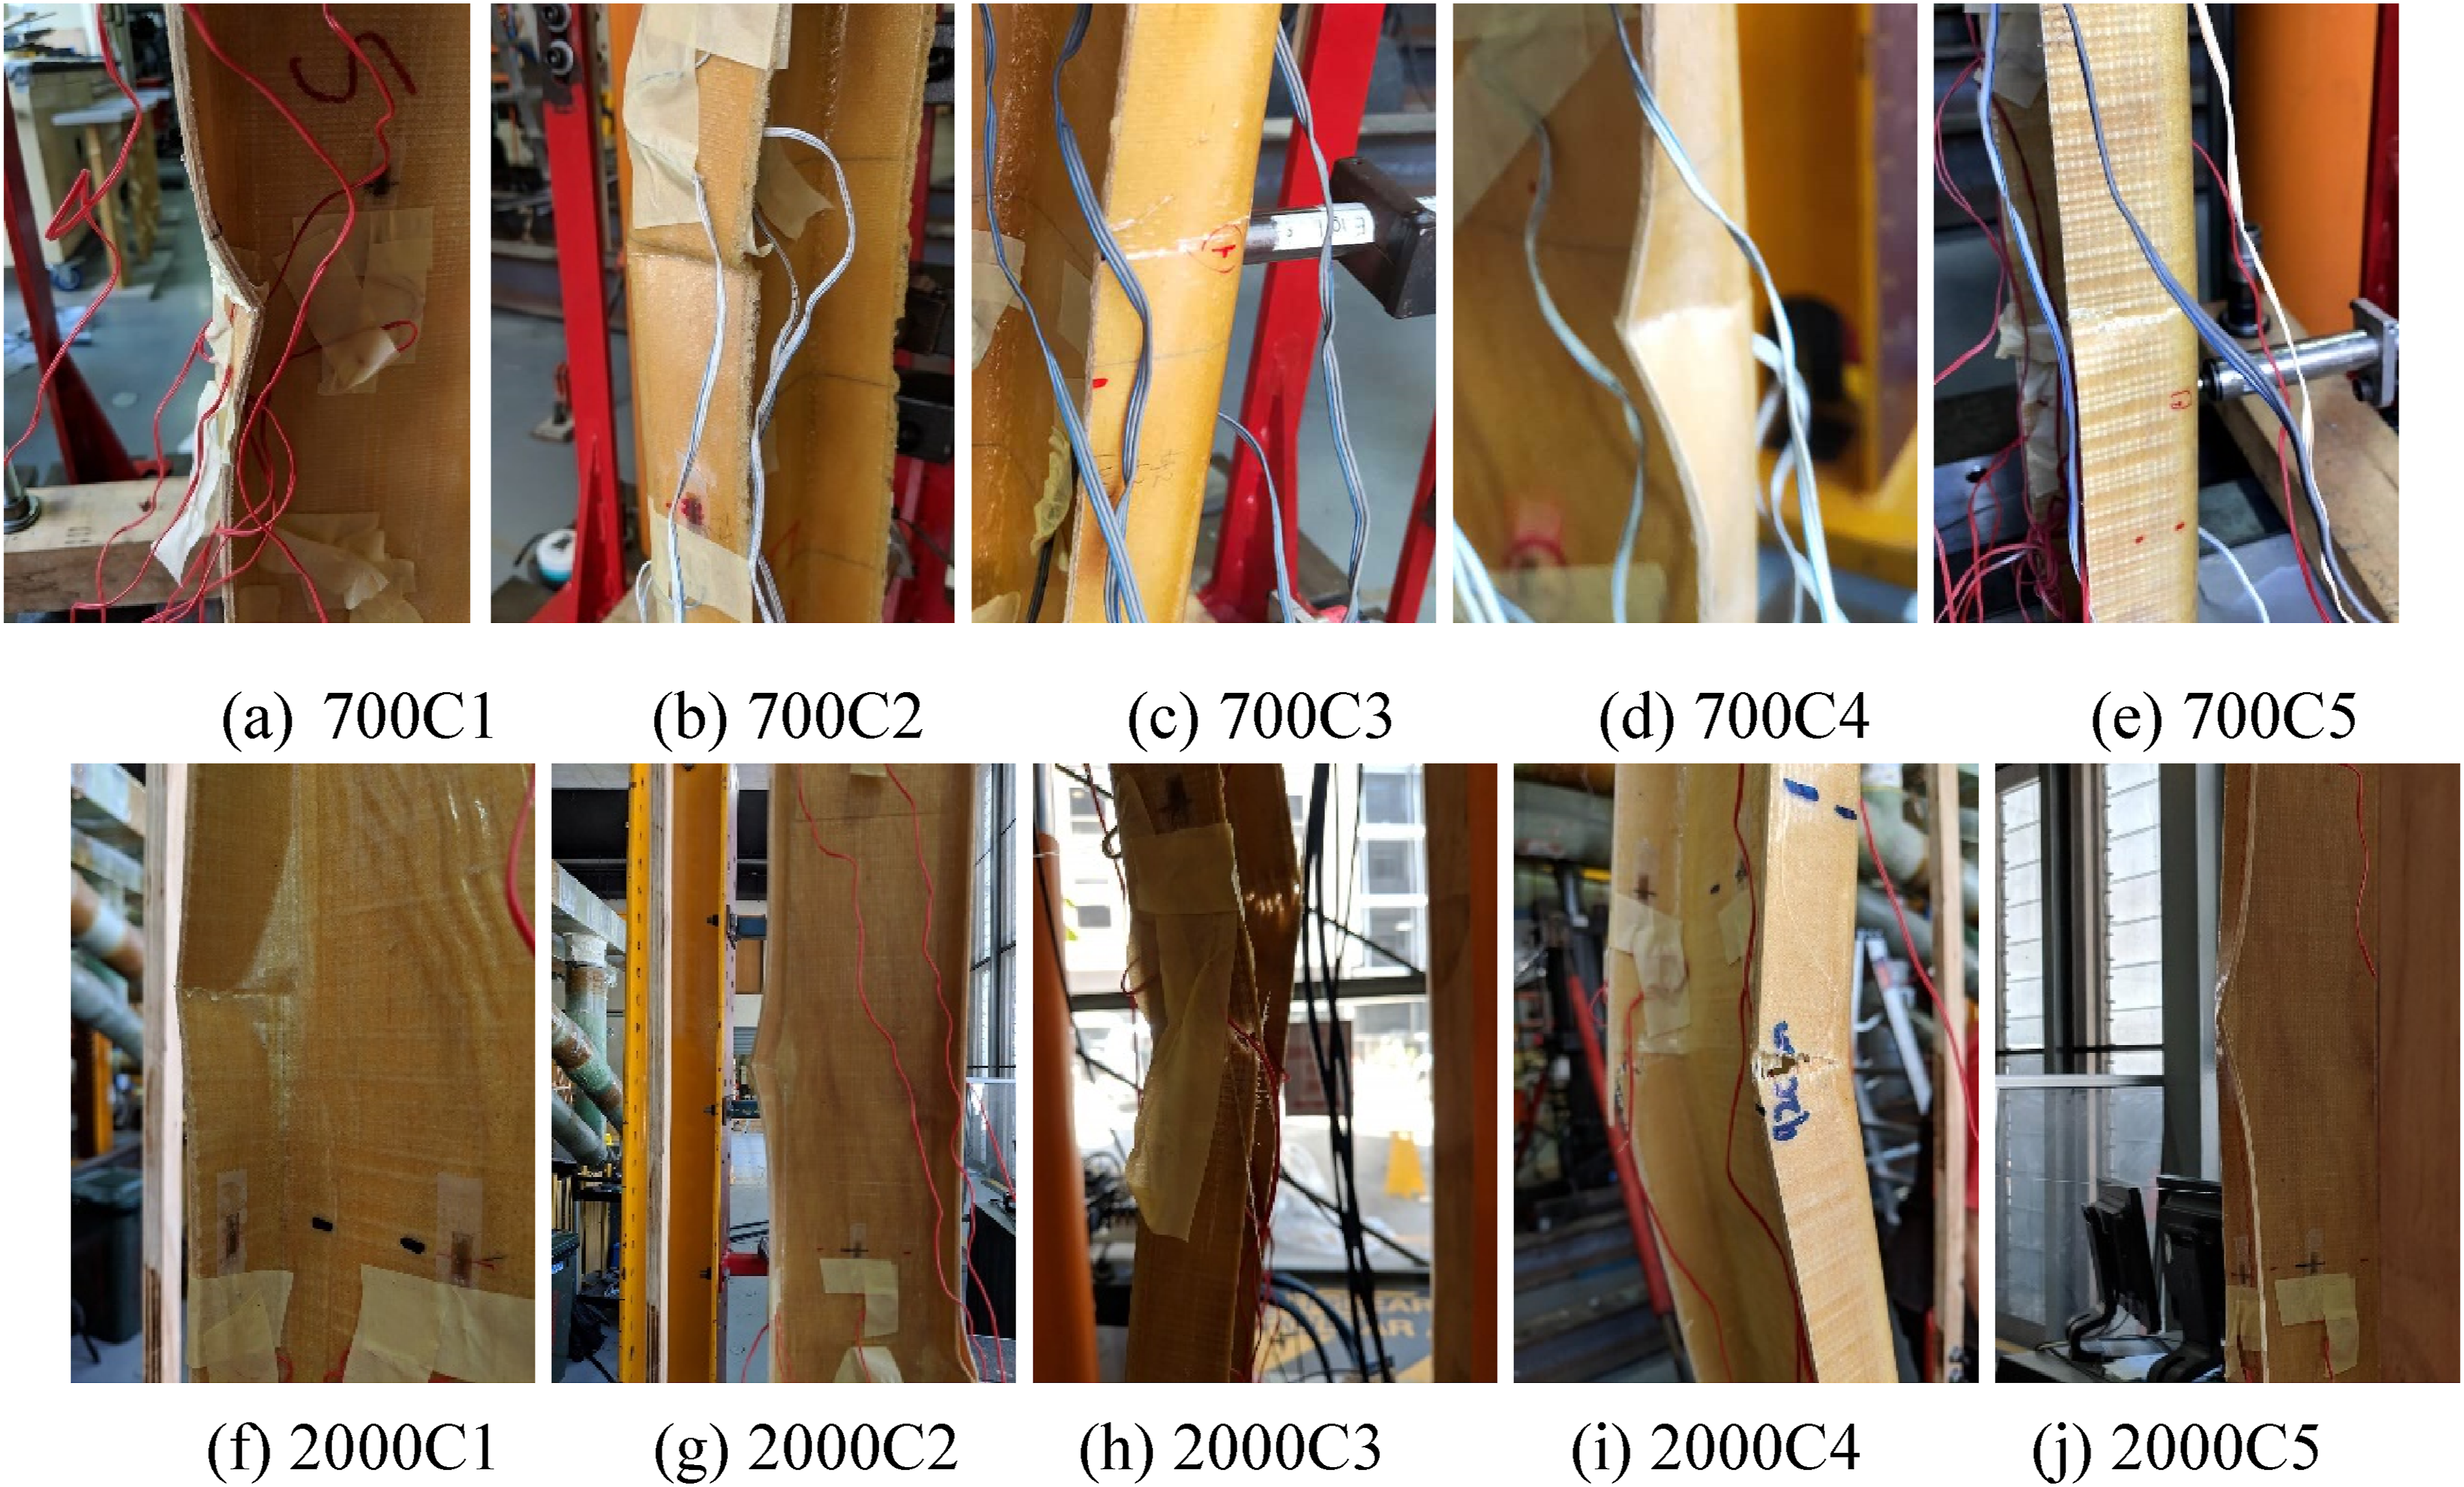
All the 2000 mm length specimens failed due to global buckling (Figure 10(f)-(j)). Specimens buckled through movement either in the positive or negative y-directions (positive y-direction is the direction towards the flanges from the web-as shown in Figure 14). For the specimens that moved in a positive y-direction, final failure was due to tensile rupture of the flanges (Figure 11(h), (i)), while for specimens that buckled in a negative y-direction, local buckling followed by fracture of the flanges (Figure 11(f), (g), (j)). Observation of the buckled shape of the 2000 mm specimens revealed some deviations of the curvatures of the specimens from the general shape towards the top and bottom ends, indicating possible rotational restraint (Figure 11(f)-(j)).
The HFT C-section columns reported by Min et al. (2021a) also failed due to local buckling, irrespective of the types of fibres used. HFT C-section specimens of 280 mm length made using GFRP failed with two half-sine wavelengths, while GFRP HFT specimens with 1000 mm length failed with five half lengths (when manufactured using 1 MPa pressure). The half-sine wavelength observed in the current specimens closely matched the half-sine wavelength observed in GFRP HFT specimens of 1000 mm length in Min et al. (2021a). In contrast with Min et al.’s (2021a) specimens, the specimens in the current study consisted of GF also in the parallel-to-axis direction, thus providing higher mechanical properties in this orientation while providing weaker properties in the perpendicular-to-axis directions. In the 1000 mm specimens tested by Min et al. (2021a), the ratio between elastic modulus in the parallel-to-axis and perpendicular-to-axis directions was 1.29, while in the 700 mm specimens in the current study this ratio was 3.80 on average. However, this difference in the ratio of properties in different directions did not change the buckling mode shapes of the specimens. Final failure of the 700 mm long specimens in the current study through localized fracture of the flanges was also consistent with observations of failure modes by Min et al. (2021a).
The local buckling observed in the 700 mm specimens and the global buckling observed in 2000 mm specimens confirmed the predictions made by the preliminary FE models used for specimen design. However, the transverse deformations (of the flanges for the 700 mm specimens and for the overall transverse deformations for the 2000 mm specimens), which appeared before the ultimate load was reached, indicated nonlinear buckling. Therefore, bifurcation buckling loads predicted by elastic analysis in the preliminary FE model can expected to be higher than the actual loads of the HFT thin-walled C-section columns.
Load-displacement curves
Axial load-displacement curves of the 700 mm and 2000 mm specimens are presented in Figure 12a and b respectively. The initial stiffness of the 700 mm specimens showed some variations between specimens (Figure 12a). The elastic modulus in the parallel-to-axis direction of the 700 mm HFT specimens showed a COV of 12.8%, with the maximum value being 40% higher than the minimum value (Table 1). Therefore, even though all the specimens showed reasonable consistency in geometry, differences in the parallel-to-axis elastic modulus are likely to have contributed towards the differences in initial axial stiffness observed amongst 700 mm specimens. Between 10 kN and 12 kN axial loads, a clear stiffness change of the specimens was observed (Figure 12a). This load corresponded to when the buckling deformations of the flanges started to occur. Once the maximum load was reached, a sudden drop in the load occurred. Axial load-displacement curves (a) 700 mm specimens (b) 2000 mm specimens.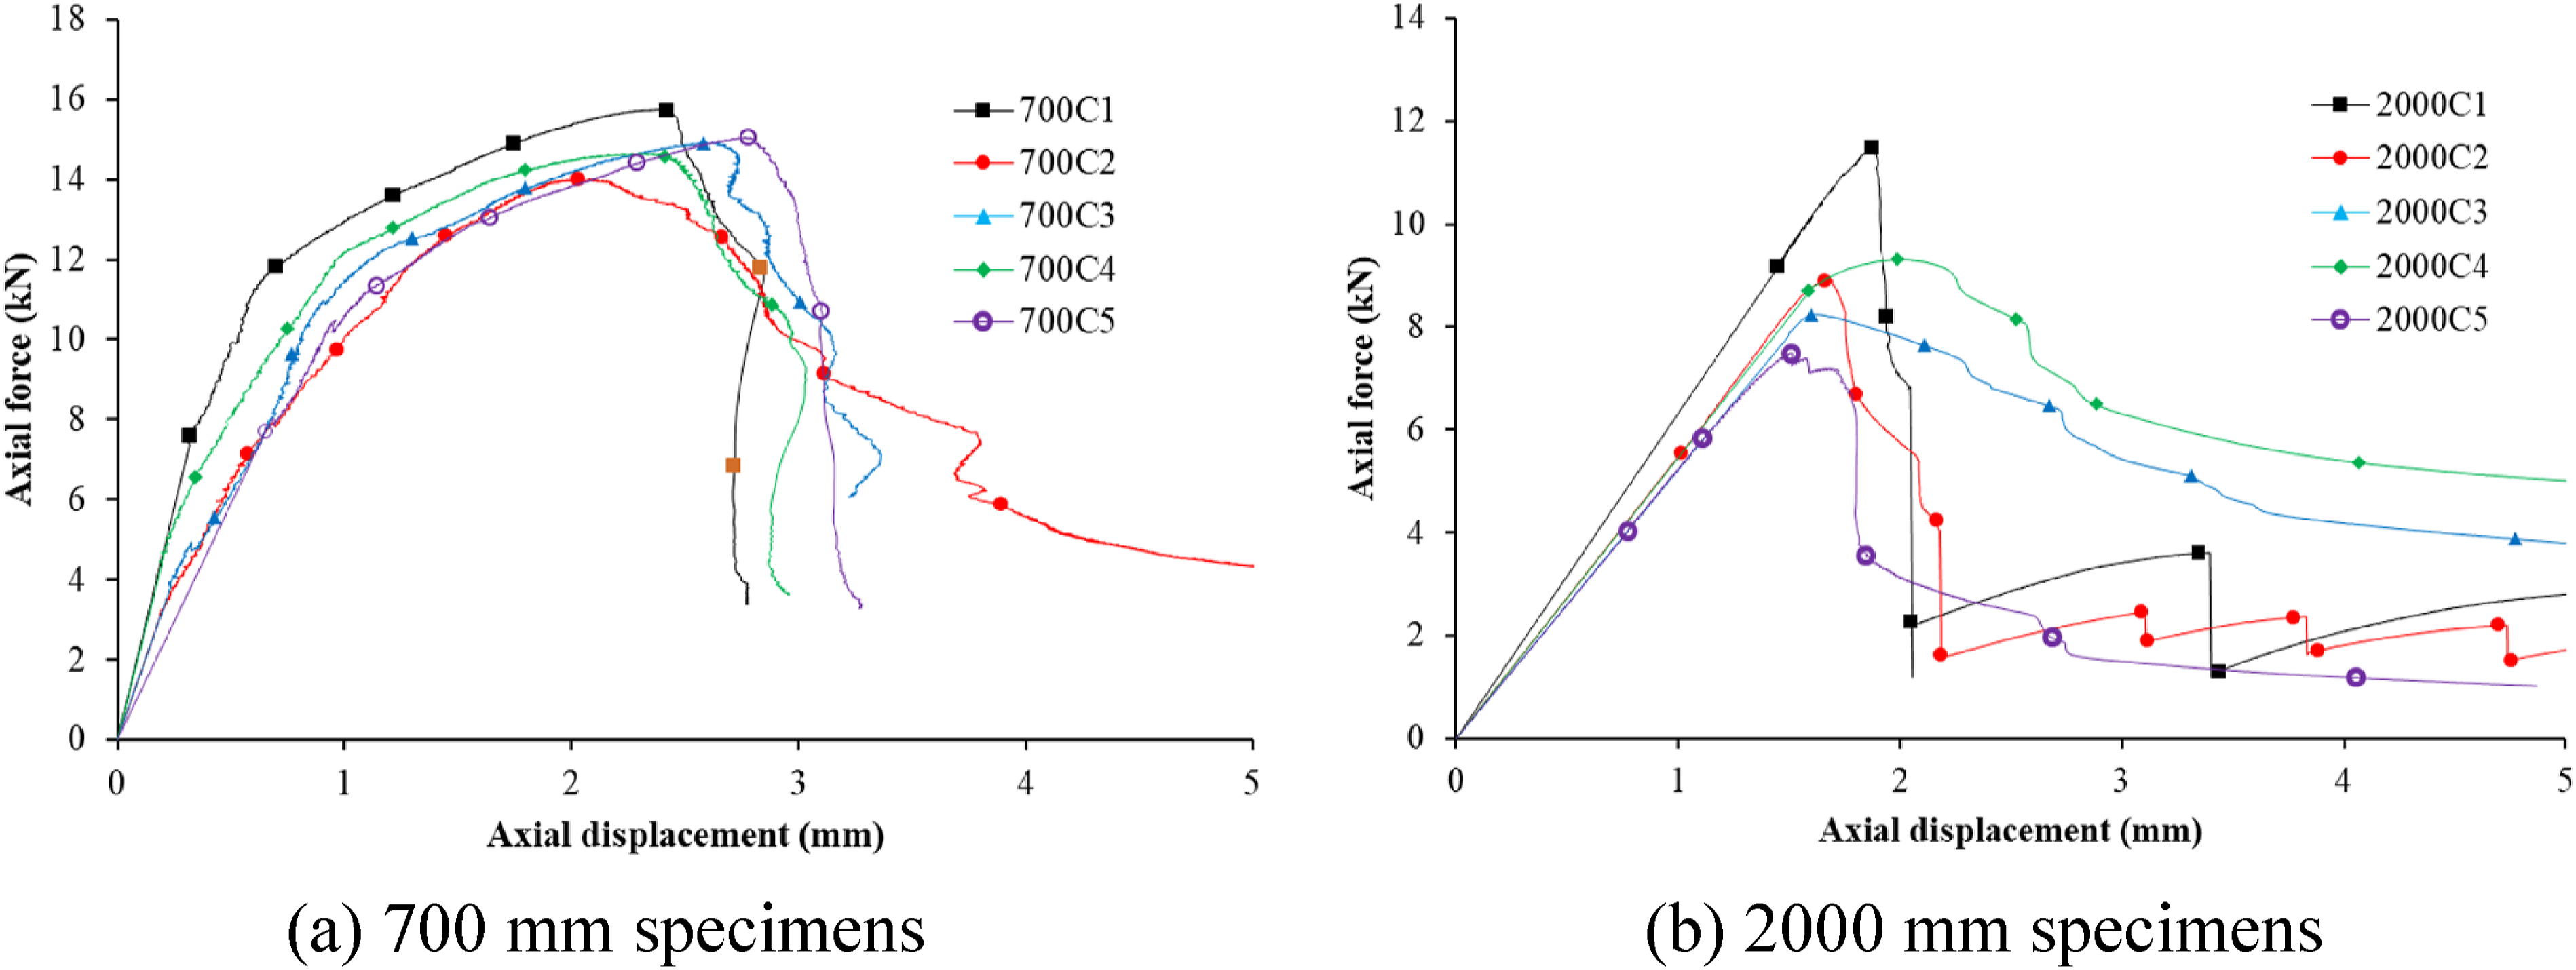
The initial axial stiffness of the 2000 mm long HFT specimens showed much less variation (Figure 12b) than for the 700 mm long specimens. Specimen 2000C1, which had the highest parallel-to-axis elastic modulus showed the highest initial stiffness, while all the other specimens showed similar initial axial stiffness (Figure 12b). Excluding specimen 2000C1, the parallel to axis elastic modulus of the other 2000 mm specimens showed COVs of 9%, with the maximum being only 19% higher than the minimum. Thus, more uniform behaviour observed in the 2000 mm specimens can be expected. Unlike the 700 mm long specimens, the load-axial displacement behaviour of the 2000 mm long specimens was approximately linear almost until the maximum load (Figure 12b). Three of these specimens (specimens 2000C1, 2000C2, and 2000C5) showed deformations in the negative y direction along with crushing of the flanges and a sudden load drop soon after the peak load was reached. The other two specimens (specimens 2000C3 and 2000C4) showed deformations in the positive y direction and failed due to tensile fracture of the flanges. They also showed more gradual load reduction after the peak load was reached (Figure 12b). While no obvious effect of buckling mode shape on peak load was observed, post peak behaviour was clearly affected by the direction of the lateral movement. Tensile fracture of the flanges, which was a gradual process, resulted in gradual reduction of the load. Nonetheless, the direction of lateral movement of the specimens is difficult to predict, and thus the sudden drop in load soon after the peak load is a more conservative assumption for designs.
Axial load capacity
Capacities for HFT Cee Section Columns.
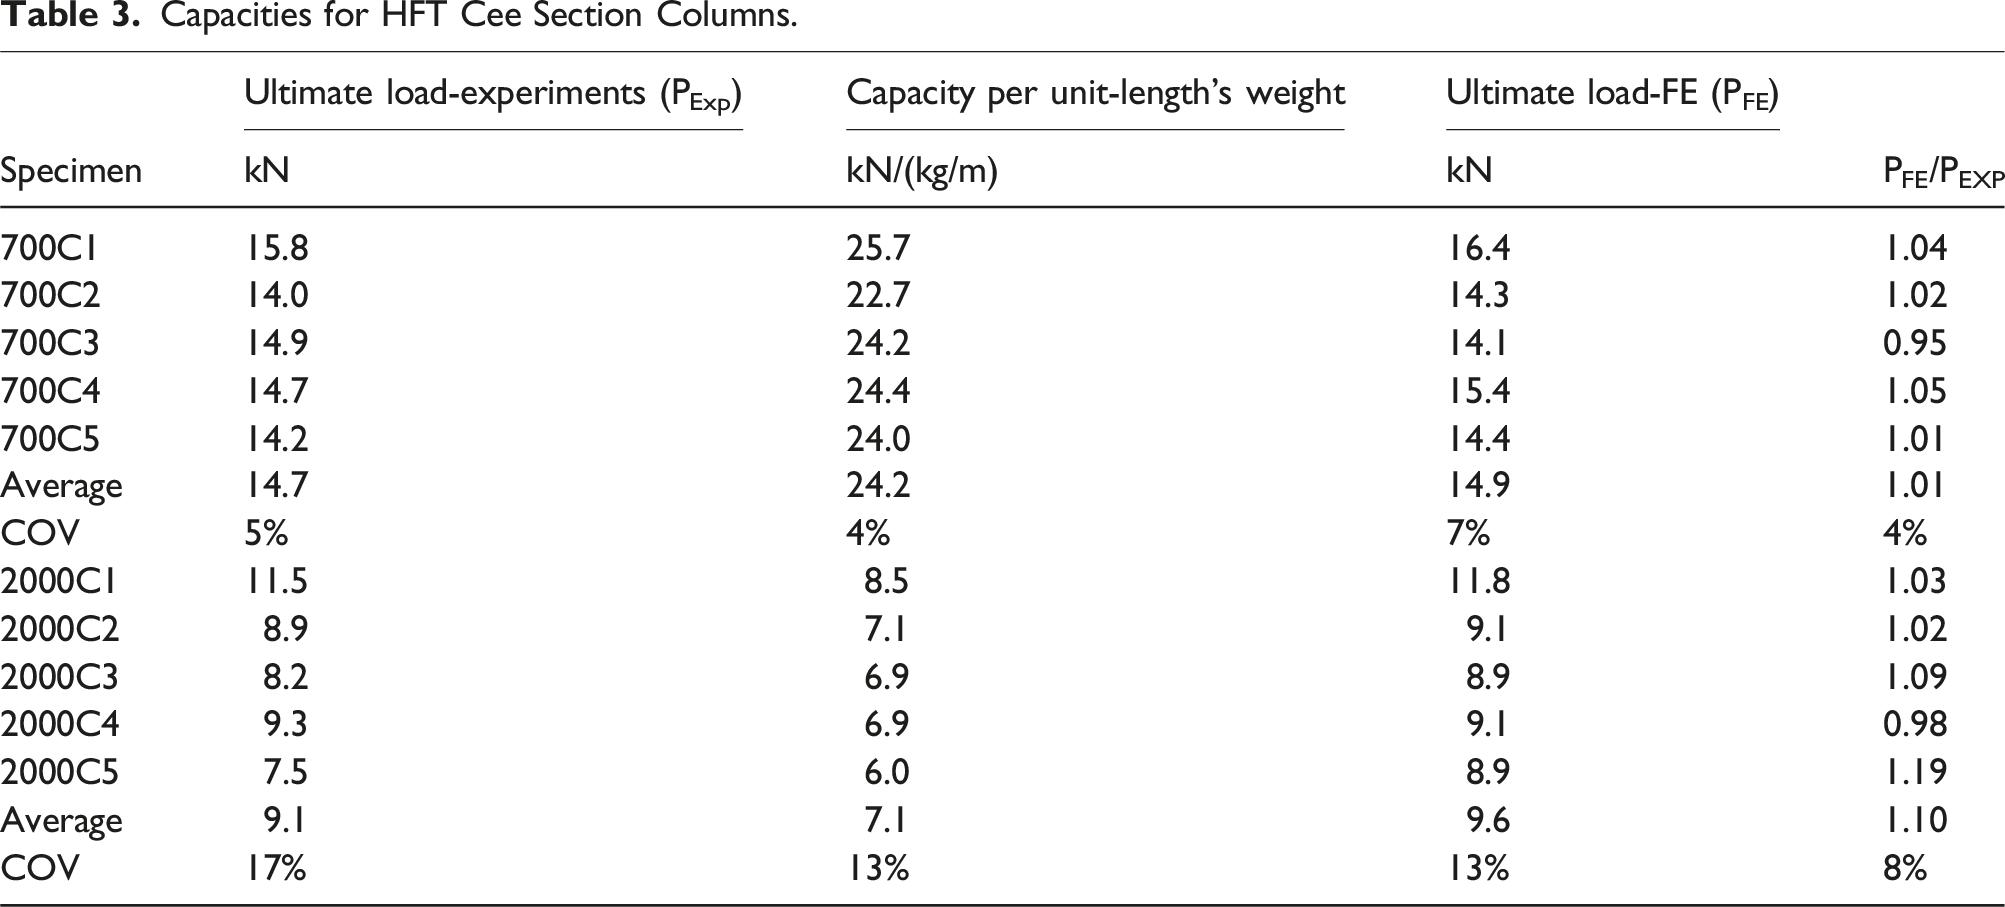
The average weight specific axial load capacity of the 700 mm long specimens was 24.2 kN/(kg/m) (Table 3). This weight specific capacity was in fact higher than the weight specific capacity of the 280 mm long and 1000 mm long GFRP HFT C-section columns tested by Min et al. (2021a), which were 16.30 kN/(kg/m) and 20.01 kN/(kg/m), respectively. However, while the wall thickness of the specimens tested by Min et al. (2021a) was larger than the wall thickness of the current specimens, sectional dimensions of the C-sections tested by Min et al. (2021a) were also larger. Therefore, a direct comparison between the peak load values of the specimens of two studies is not possible.
The current study used 329 gsm bi-directional GF fabric, while Min et al.’s (2021a) study used 556 gsm uni-directional GF fabric. Therefore, the specimens in Min et al.’s (2021a) study contained more GFs than the HFT C-sections in the current study. However, the peak axial loads of the 700 mm long specimens were comparable with those from Min et al.’s (2021a) study, while the weight-specific capacities of the current study’s specimens were higher. Nonetheless, since the sectional dimensions of the specimens from the two different studies are different, a clear conclusion cannot be achieved.
Finite element modelling of the HFT C-sections under axial loading
Finite element model
To further study the behaviour of HFT C-section specimens, and to investigate the effects of fibre volume in each direction, numerical modelling of the HFT C-sections subjected to axial compression was carried out. Numerical modelling was carried out using the commercially available FE modelling software ABAQUS (2013). Min et al. (2020) showed that while both membrane and flexural properties of HFT laminates are required to accurately capture the behaviour of HFT C-section columns numerically, at higher manufacturing pressures (i.e., higher than 1 MPa) the difference between membrane and flexural properties become negligible (Min et al., 2021b), thus using membrane properties alone can provide reasonably accurate results. Therefore, in this study only membrane properties obtained through HFT coupon tests were used in the FE modelling.
S4R, four node reduced integration shell elements available in ABAQUS (2013), were used to model the HFT C-sections. HFT laminates were modelled as a single layer. After a convergence study, an element size of 2 mm by 2 mm was selected for the flat regions, while an element size of 1 mm (in the perpendicular-to-axis direction) by 2 mm was selected for the corner regions. The precise geometry file obtained from 3D surface scanning was used for modelling the FE geometry of each specimen. A typical mesh used for HFT specimens is given in Figure 13. Details of FE meshes.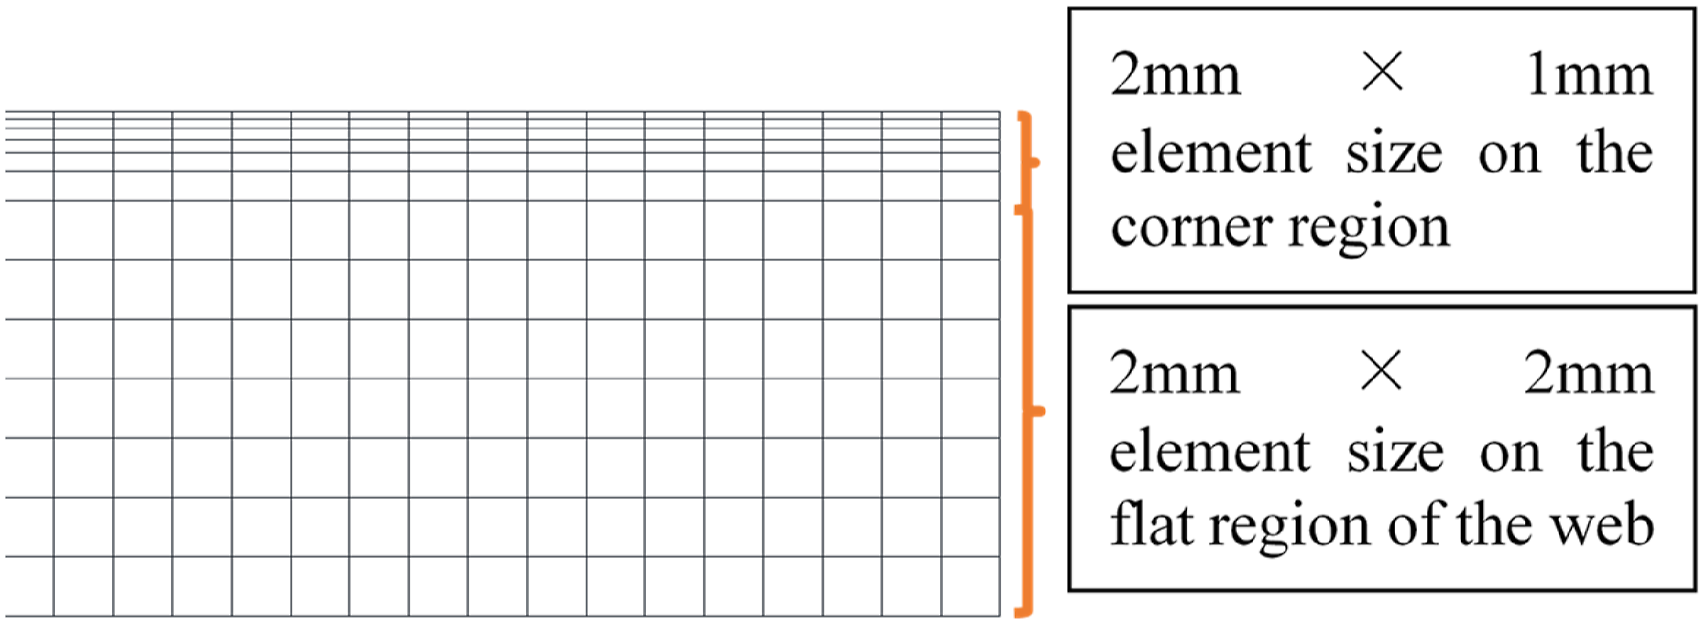
HFT laminates were modelled as orthotropic materials. The material properties of each specimen given in Table 1 were used in FE modelling. The compression properties of the HFT laminates were assumed to be similar to their tensile properties. The well-known Hashin failure criterion (Hashin 1980) was used to define damage initiation, with material strength values obtained from HFT coupon tests (Table 1) for each specimen. Damage evolution was assumed to be linear and was defined based on fracture energy. However, as the fracture energy for HFT laminates is not readily available, a 2 N/mm fracture energy value, used previously by Miao et al. (2019), was used in this study for both failure in perpendicular and parallel to timber grain directions. Miao et al. (2022) and Min et al. (2020), both reported that the fracture energy value has a negligible effect on the peak load but may affect the post peak behaviour of the HFT specimens. In the current study, FE model predictions until the peak load are of primary interest, thus the use of assumed fracture energy was deemed as appropriate.
Two reference points were created at the centroids of the top and bottom cross section planes (Figure 14). The nodes of the top and bottom plane cross-sections were tied to the respective reference points and defined as rigid surfaces. This was done to simulate the boundary conditions imposed by the top and bottom end plates. Vertical and transverse deformations were fixed at the bottom reference point. The transverse deformation at the top reference point was fixed, while a vertical displacement (in the downward direction) was applied at this location. Boundary conditions (i) Top boundary and loading conditions (ii)Bottom boundary conditions.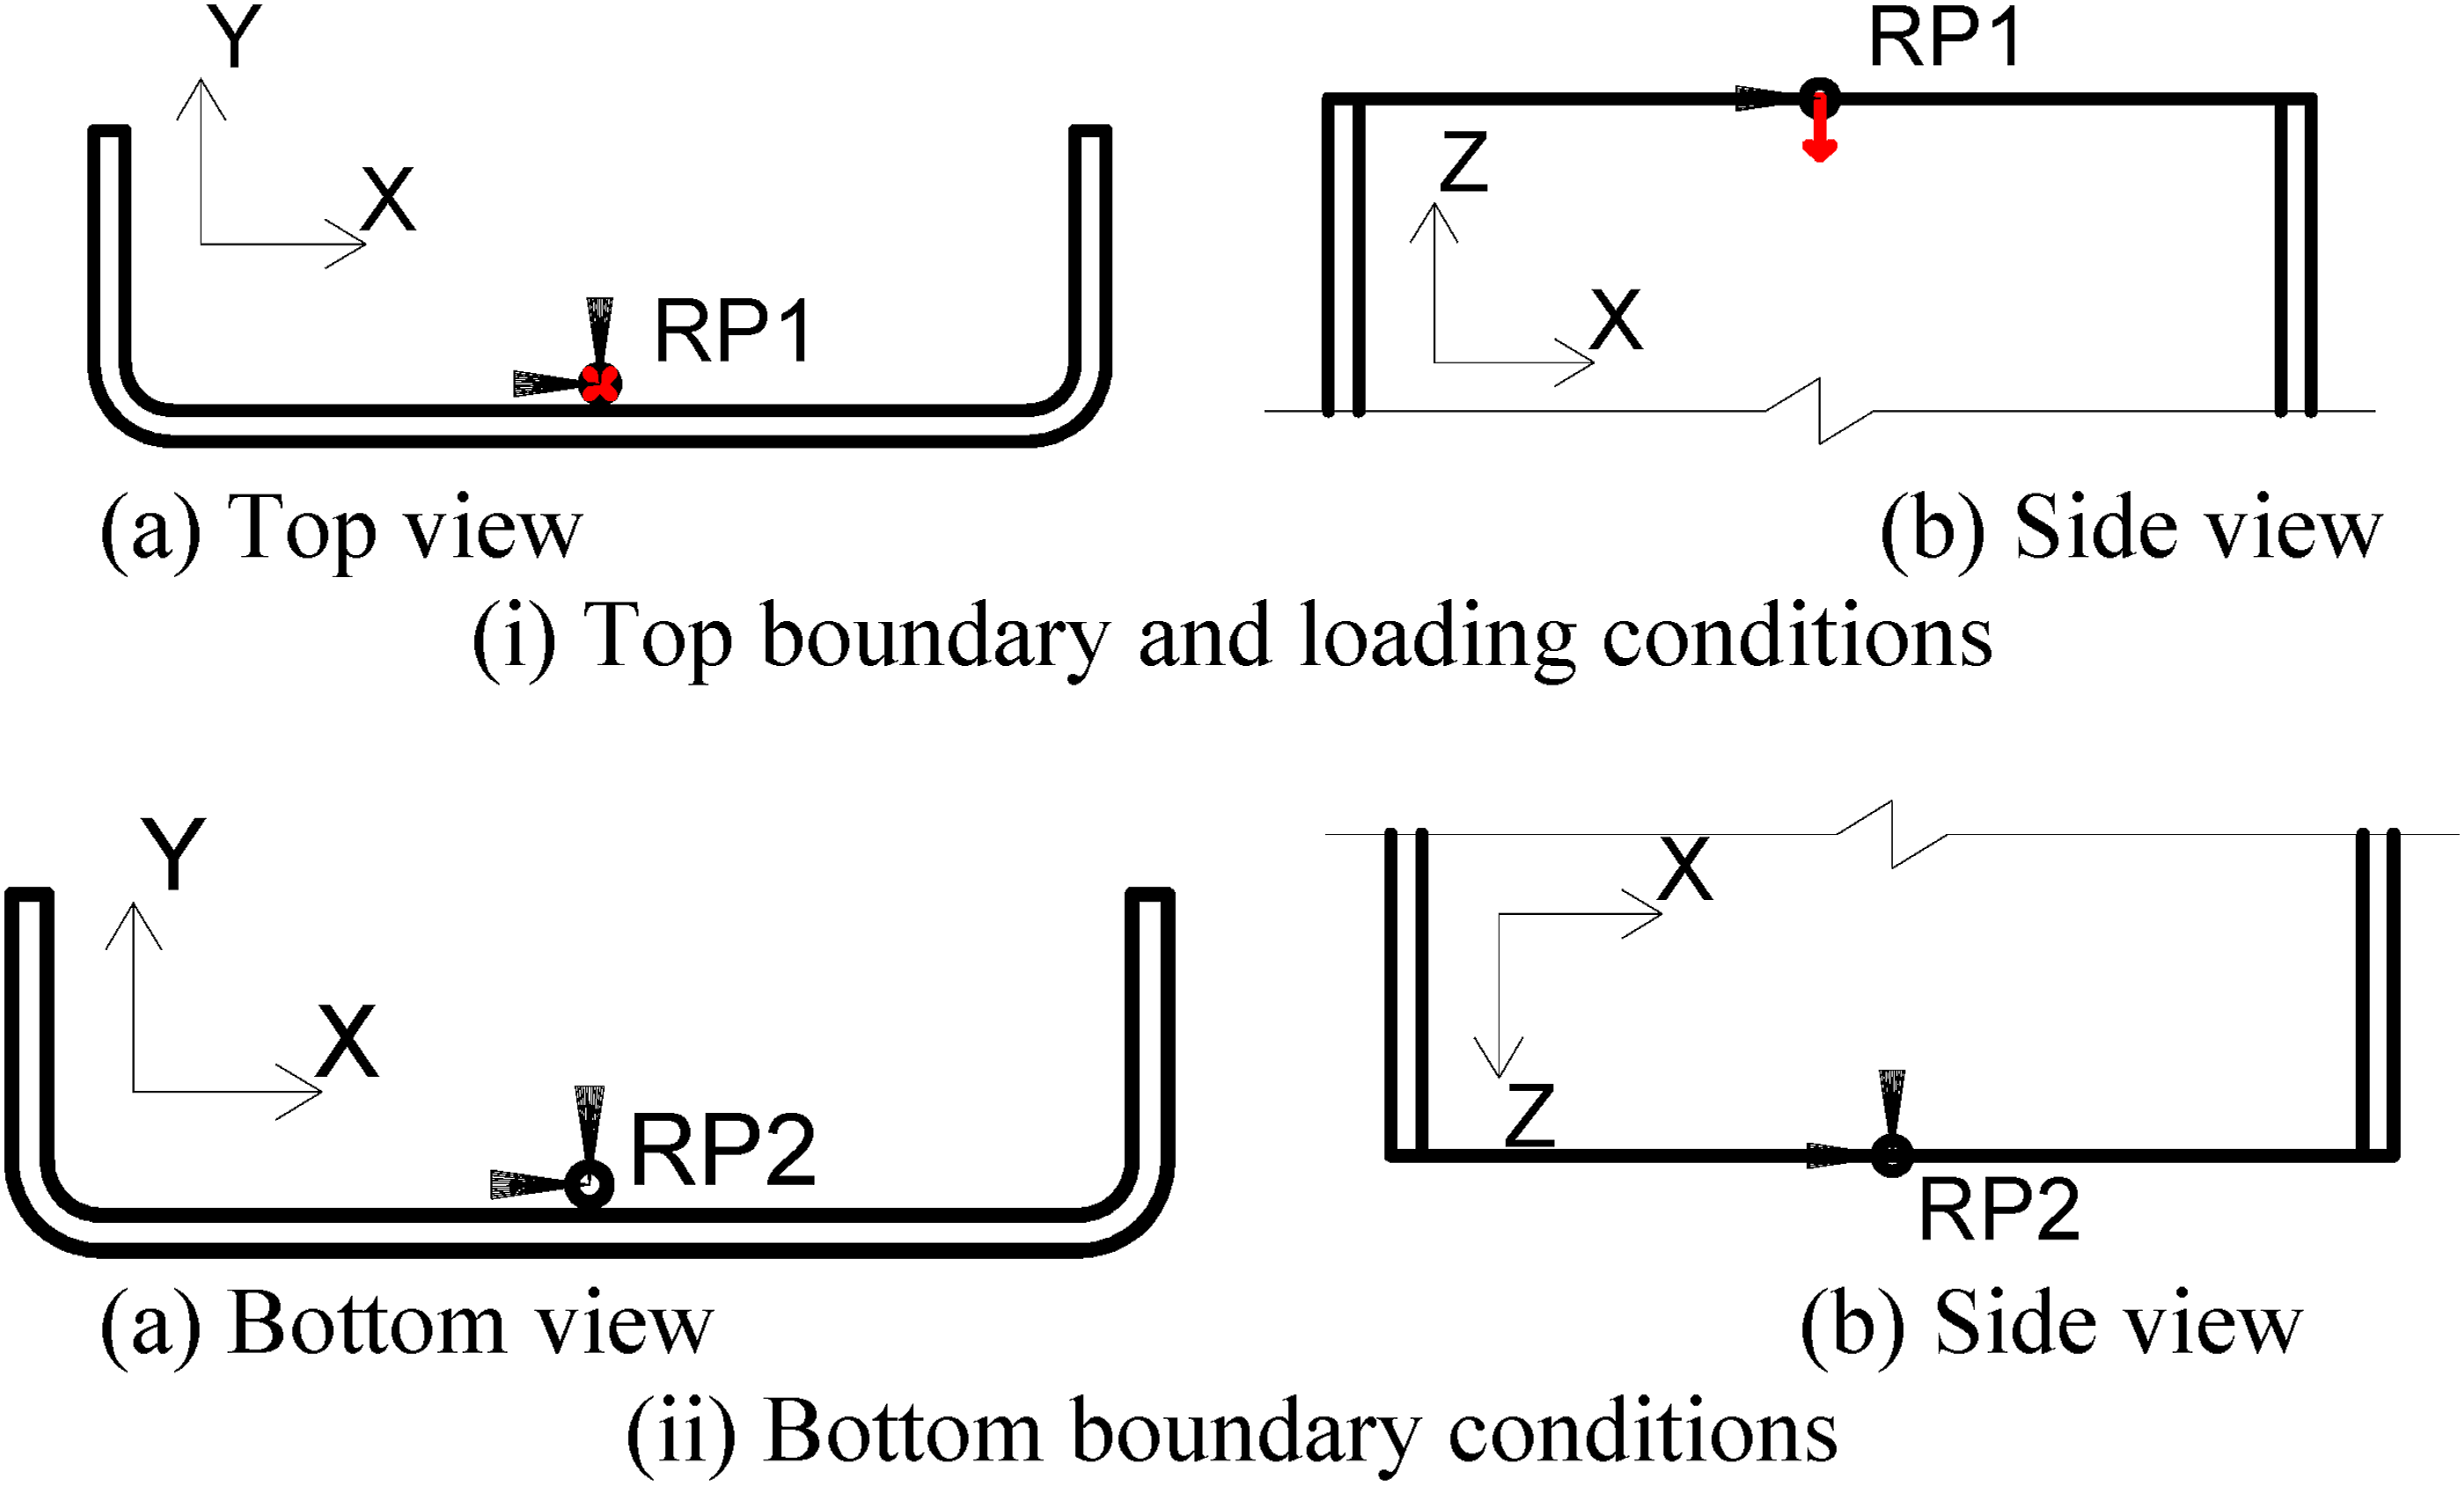
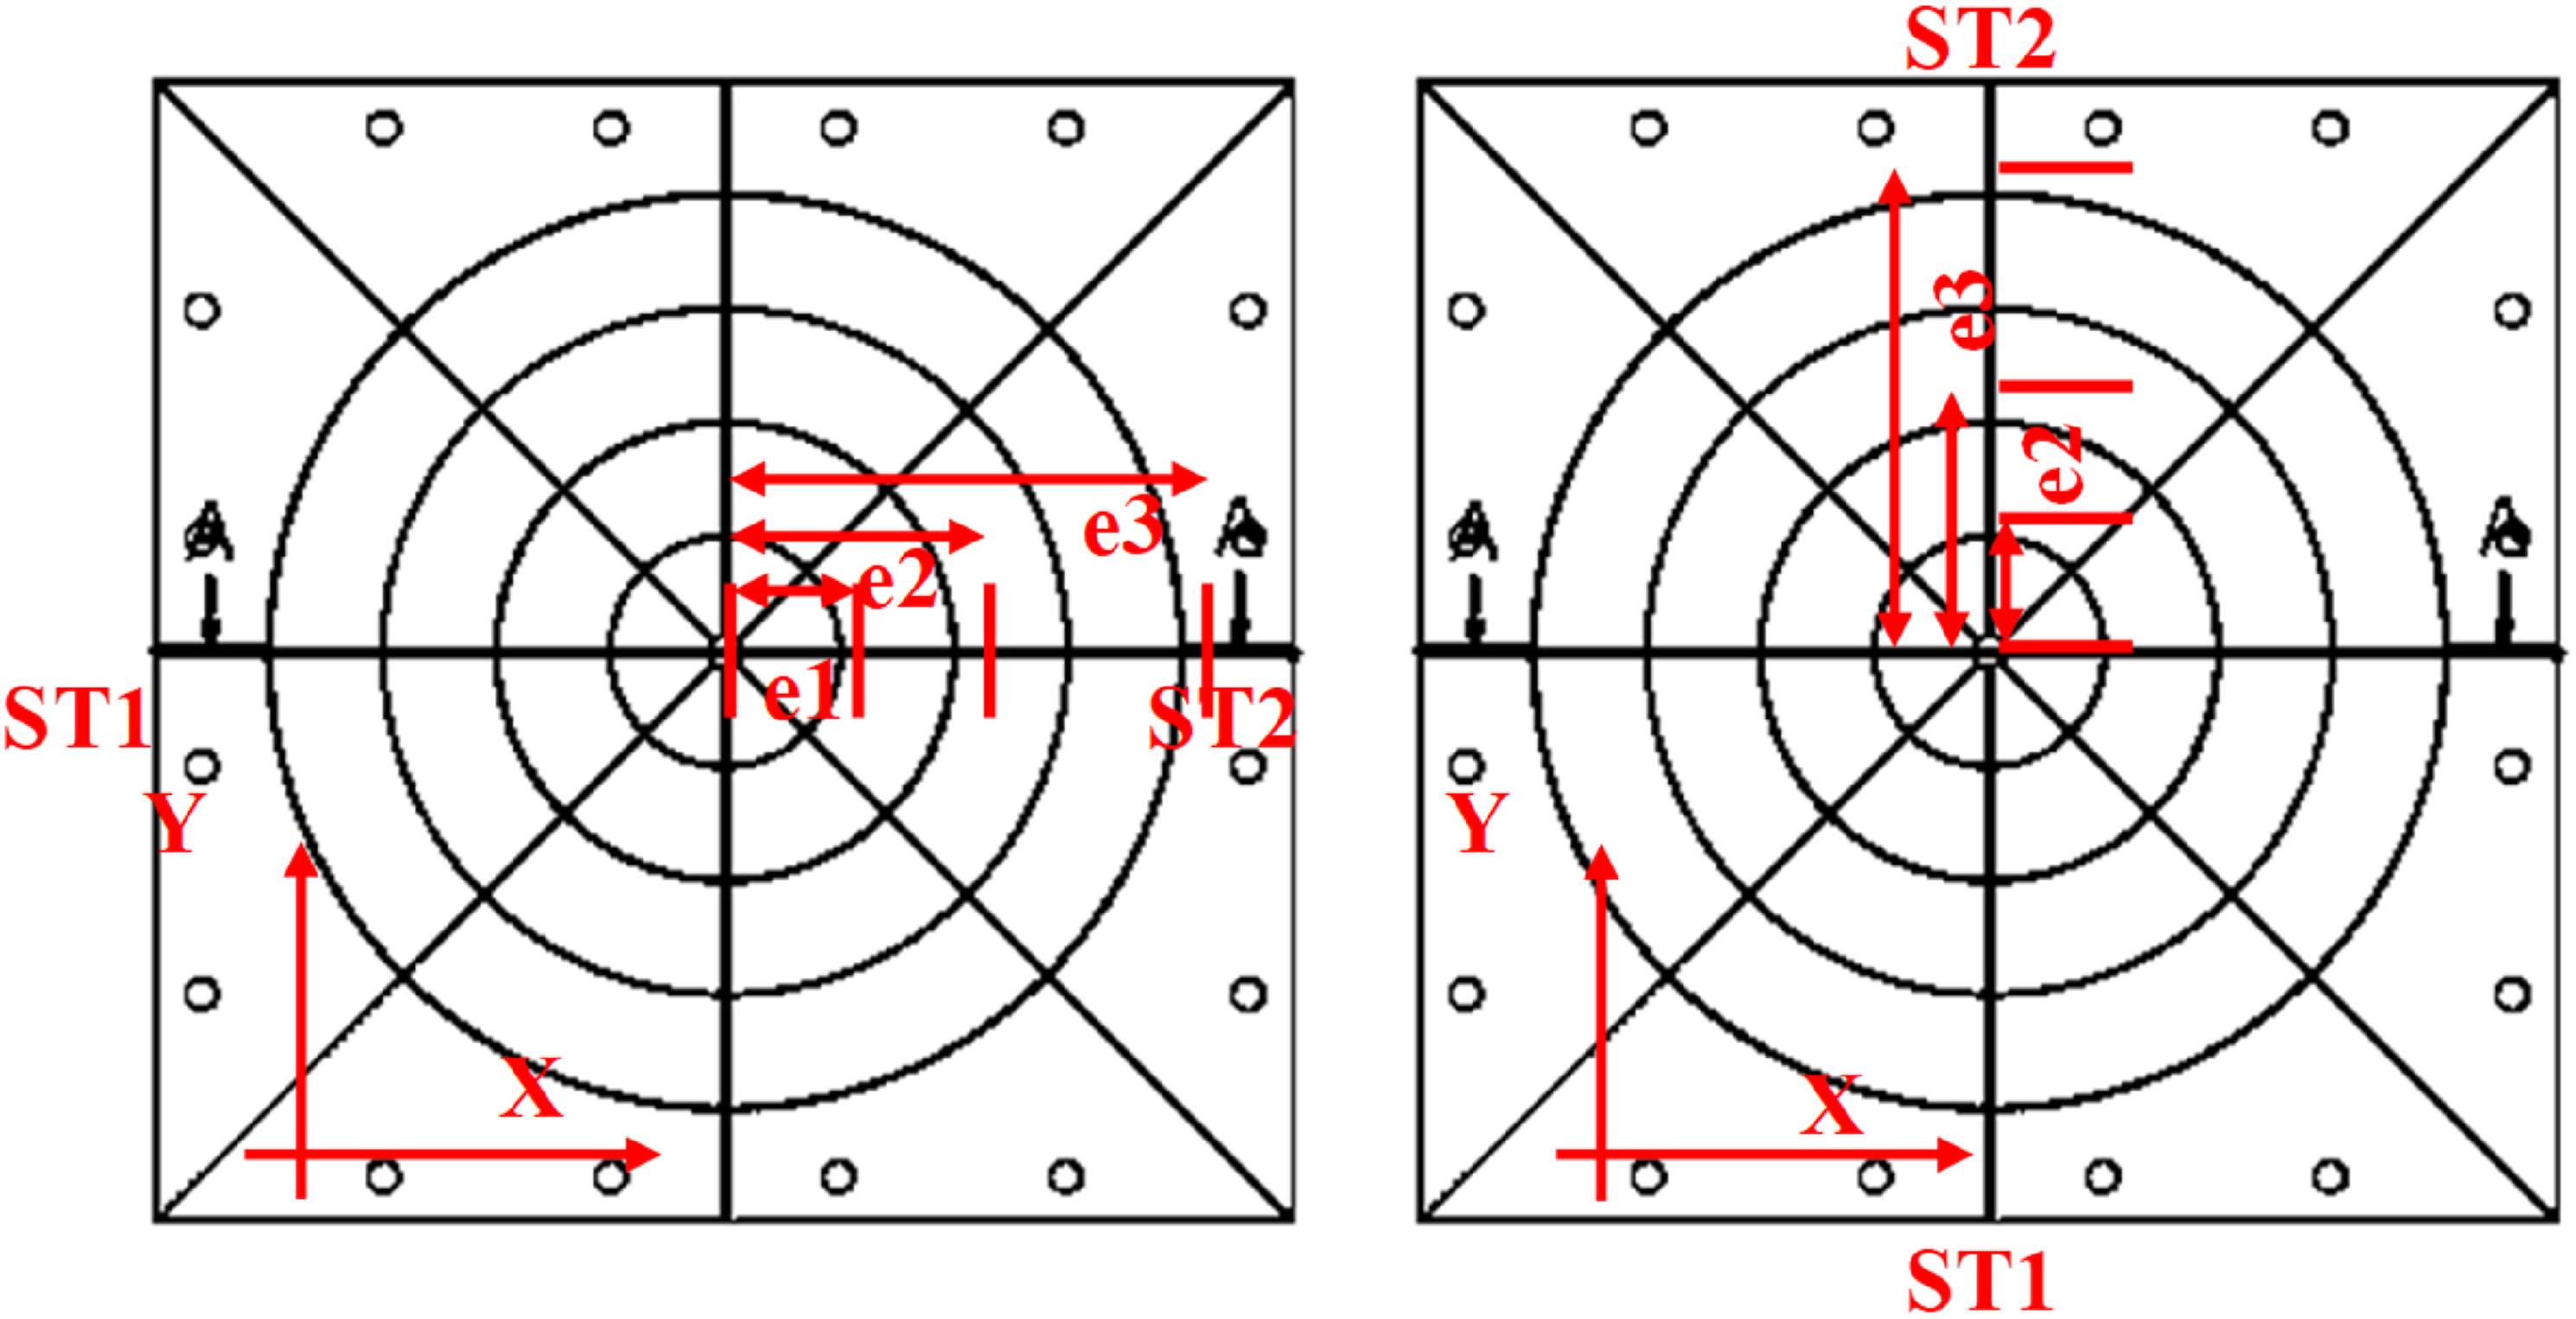
During the experiments (particularly on the 2000 mm long specimens), some rotational restraint at the loading plates was observed. As such, rotational restraints at the ends are considered likely to have influenced the results, and an investigation was carried out to determine the rotational stiffness of the loading platens. Rotation of one loading plate was fixed using clamps while the rotational stiffness of the other was determined. An L-shaped solid steel section with a smooth stainless-steel solid cylinder (diameter d = 30 mm, length l = 100 mm) attached to the fixed plate was used to create eccentric loading on the free to rotate loading plate (Figure 15). The rotational stiffness about the X and Y directions (Figure 16) was measured by applying eccentricity in the X and Y directions, as shown in Figure 16. Three eccentricities (e1 = 30 mm, e2 = 65 mm, and e3 = 144 mm) were used in each direction. Two displacement transducers (ST1 and ST2 in Figure 16) were used to measure the vertical displacements at the centre of the rotating plate. The elastic rotational stiffness was calculated as the ratio between the resisting moment and the rotation angle. Experimentally obtained rotational stiffness values for top and bottom platens in different directions are given in Table 4. The results suggested that the rotational stiffness of top loading plate was noticeably more than at the bottom. Eccentric loading set-up. Eccentric loading test arrangement. Friction Effect Test Results (Rotational Stiffness; N.mm/Rad).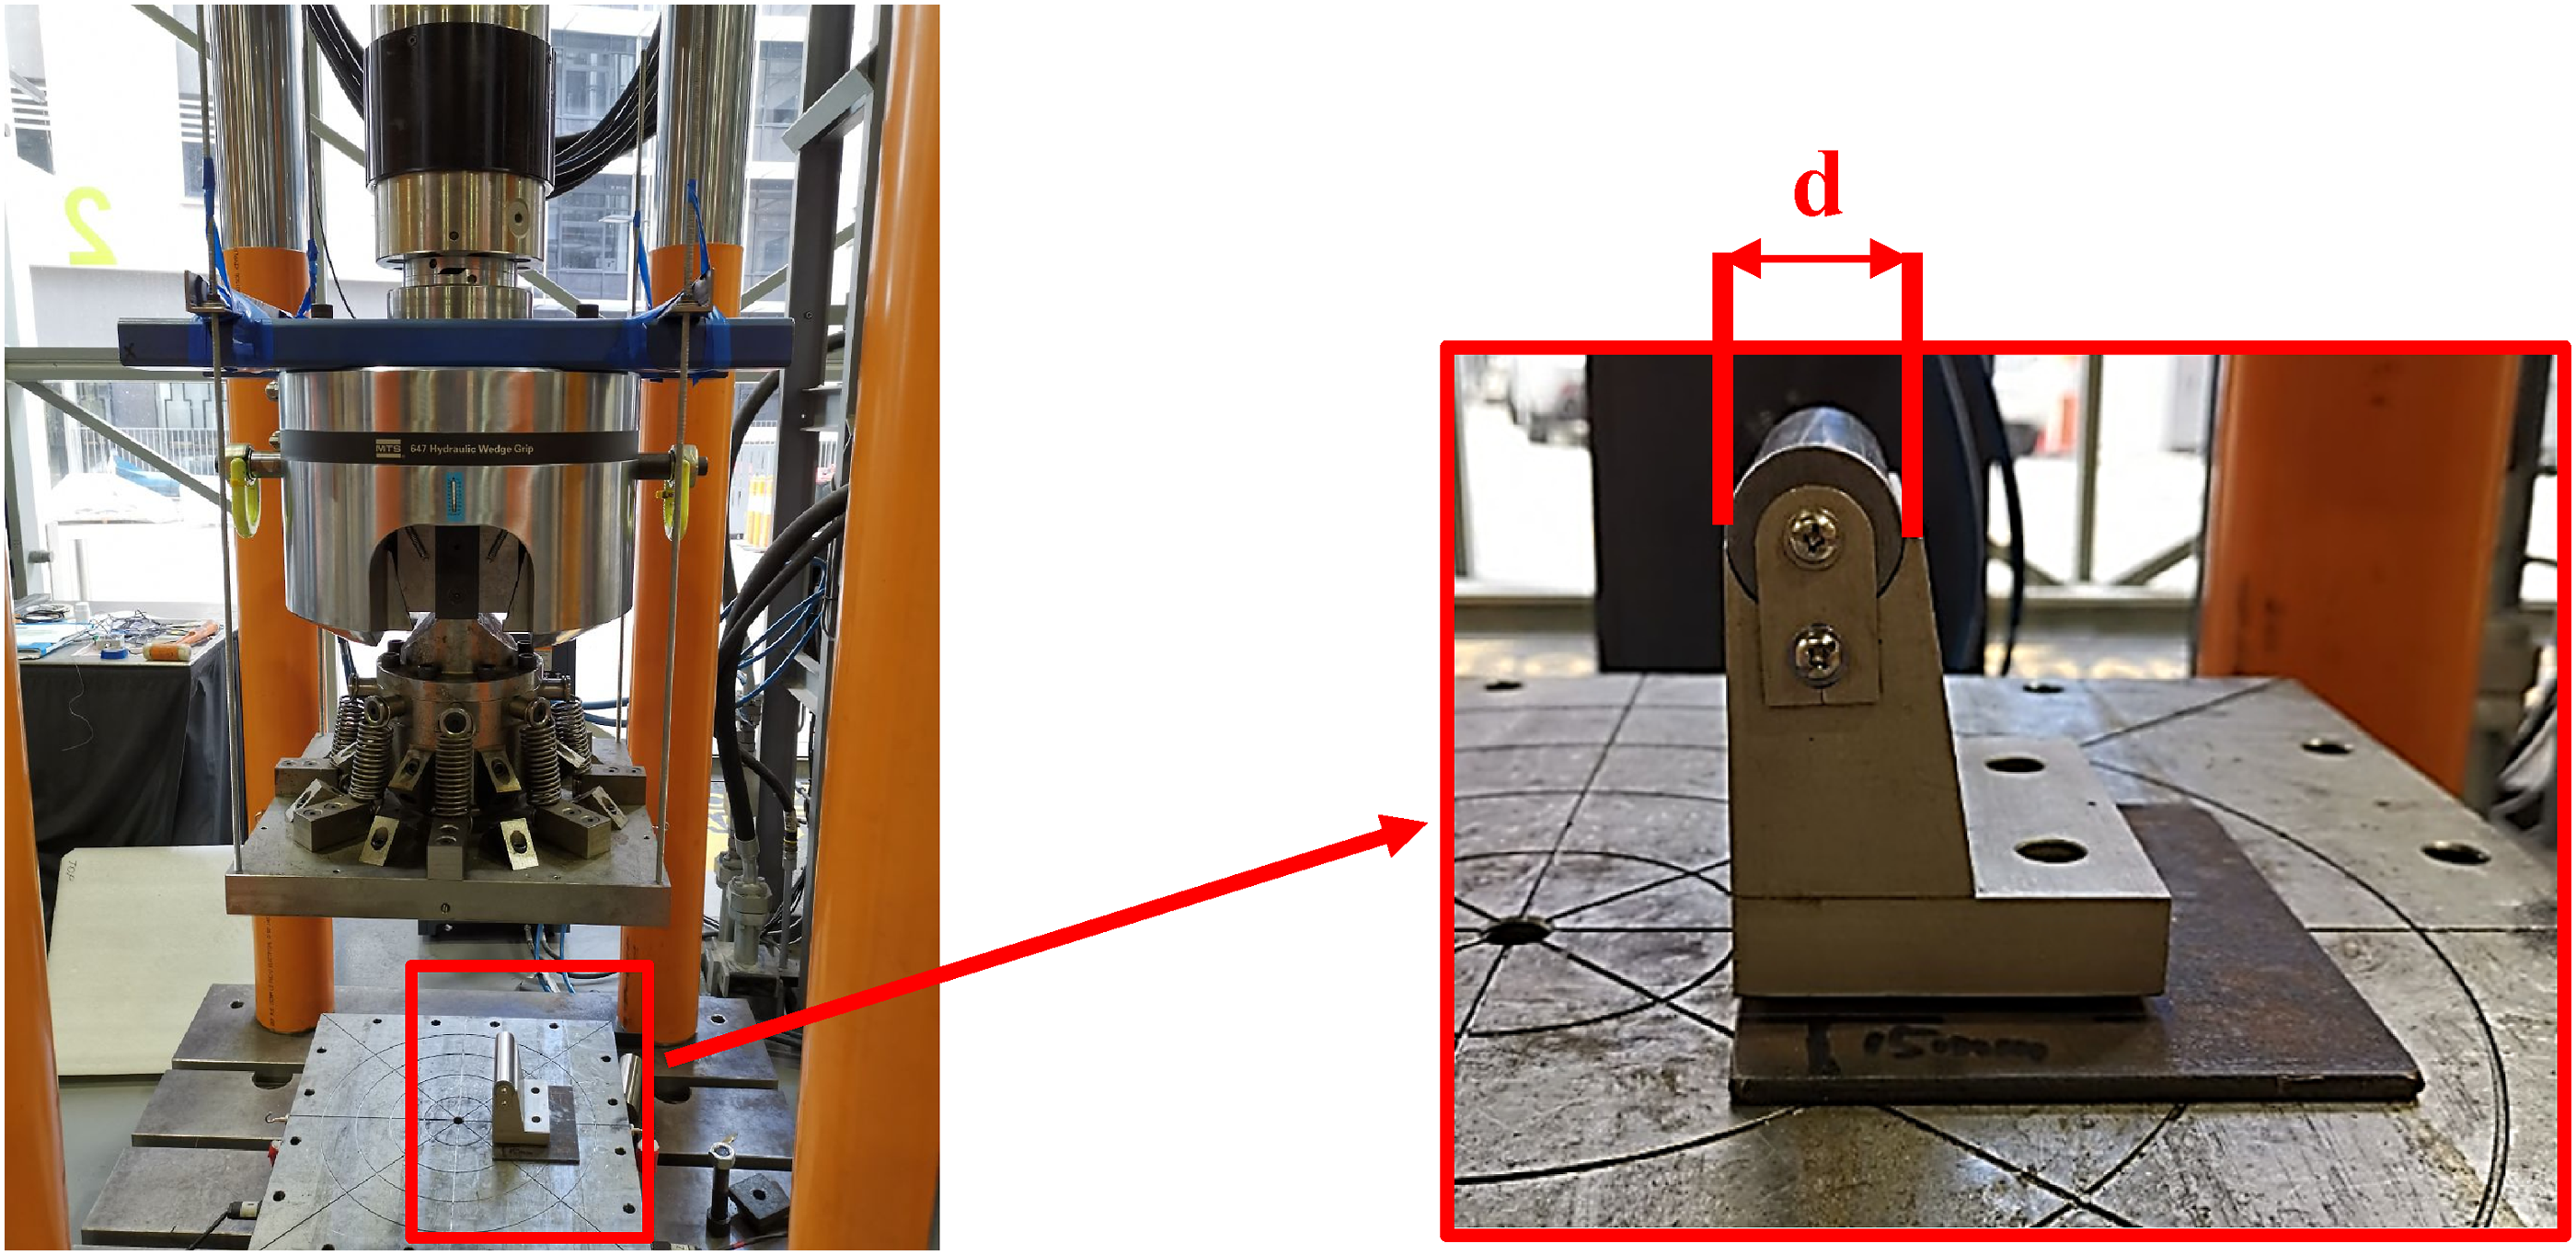
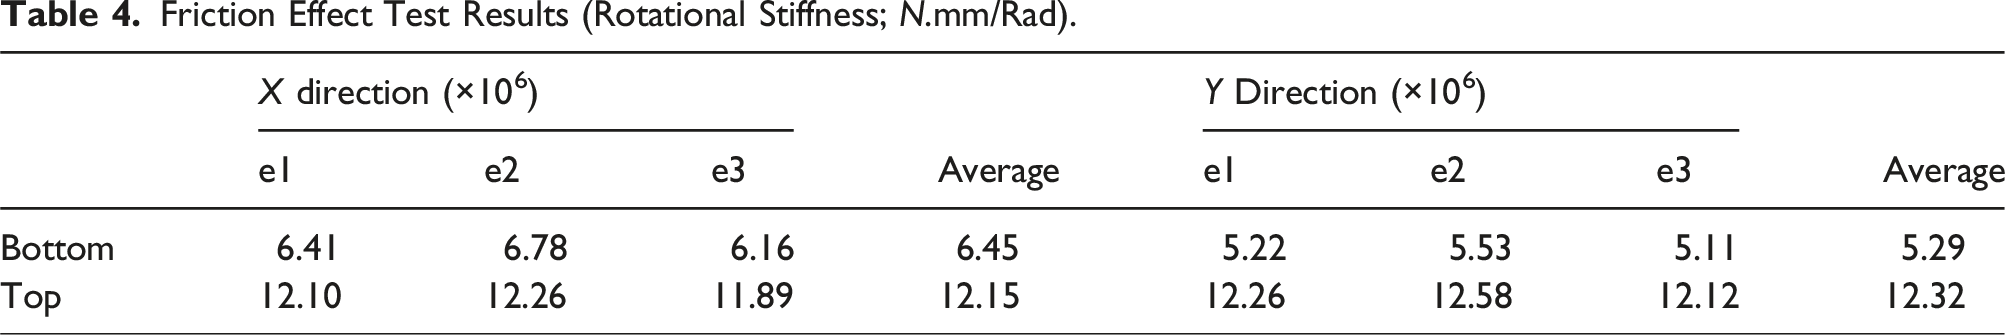
The spring interaction function available in ABAQUS [30] was employed to introduce the rotational stiffness of the top and bottom loading plates into the FE models. Rotational springs were applied on RP1 and RP2 as shown in Figure 12. The rotational stiffness about the X and Y axes were defined using the average measured values in each direction, as specified in Table 4. Geometric and material nonlinear analysis using the “Static Riks” method (ABAQUS 2013) was employed in the FE analysis.
FE results
A comparison of the FE load-displacement curves with the experimental curves is given in Figure 17 for all HFT C-section columns, while the peak axial load predicted by FE models are given in Table 3. For both 700 mm and 2000 mm long specimens, FE predictions of the initial stiffness and the peak axial loads agreed well with the experimental data. The mean value of the ratio between predicted and experimental peak axial load was 1.01 with a coefficient of variation (COV) of 4% for 700 mm specimens and 1.10 with a COV of 8% for 2000 mm specimens. For specimens failing due to local buckling (i.e., 700 mm specimens), the predicted load displacement curves deviated from the experimental curves as the behaviour became nonlinear (Figure 17(a)-(e)). Similar observations were also made by the numerical modelling study of HFT C-section specimens in Min et al. (2020). Once lateral deformations of the flanges occurred, additional bending of the plates resulted in increasing lateral deformation. At higher lateral deformations, progressive failure of the lamella is likely to occur, resulting in stiffness reductions. However, in the current modelling approach, laminate material properties were used, ignoring such progressive failure during bending. This modelling assumption may have resulted in higher stiffness predictions compared to experimental results when local buckling of the flanges resulted in higher lateral deformations of the flanges. When lateral deformations of the laminated plates were lower, a good agreement between the FE and experimental load-displacement curves was achieved, which is evident by the 2000 mm length specimen results and the initial portion of load-displacement curves of 700 mm length specimens. Overall, it can be concluded that the FE modelling approach used in this study could reasonably capture the behaviour of the HFT C-section columns, and particularly the peak axial load could be accurately predicted. Results comparison (a) 700C1 (b) 700C2 (c) 700C3 (d) 700C4 (e) 700C5 (f) 2000C1 (g) 2000C2 (h) 2000C3 (i) 2000C4 (j) 2000C5.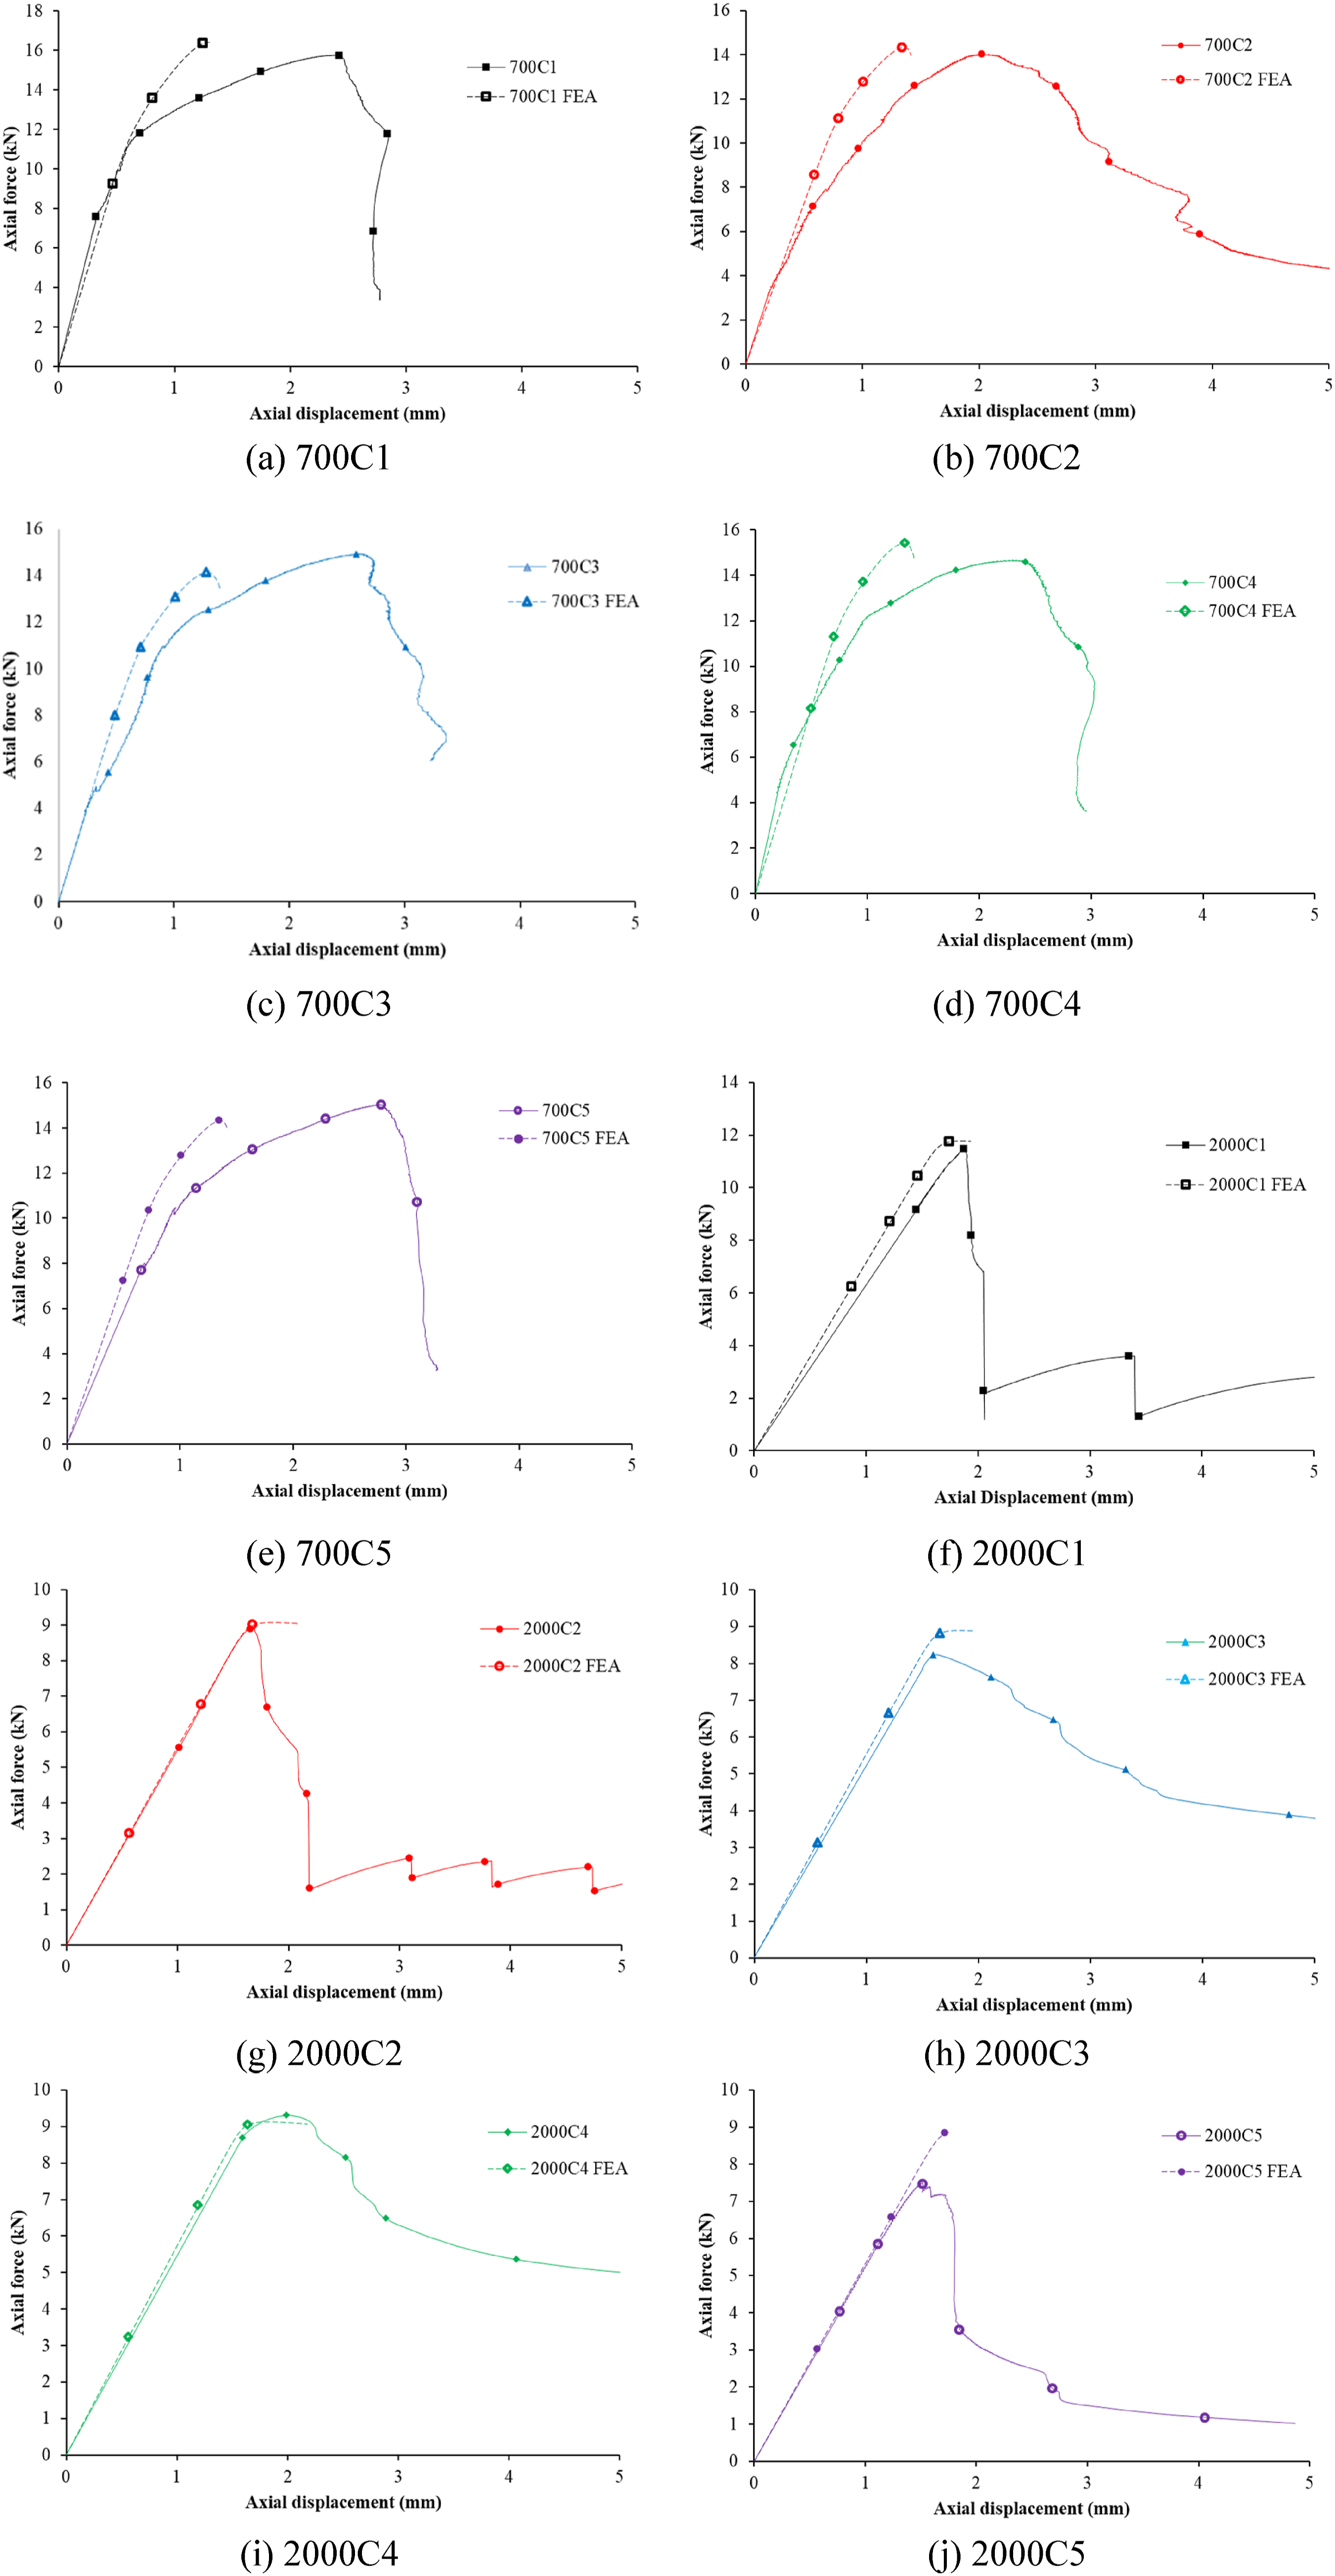
Effect of fibre volume and direction
Mechanical Properties for FE Models in Fibre Effect Study.
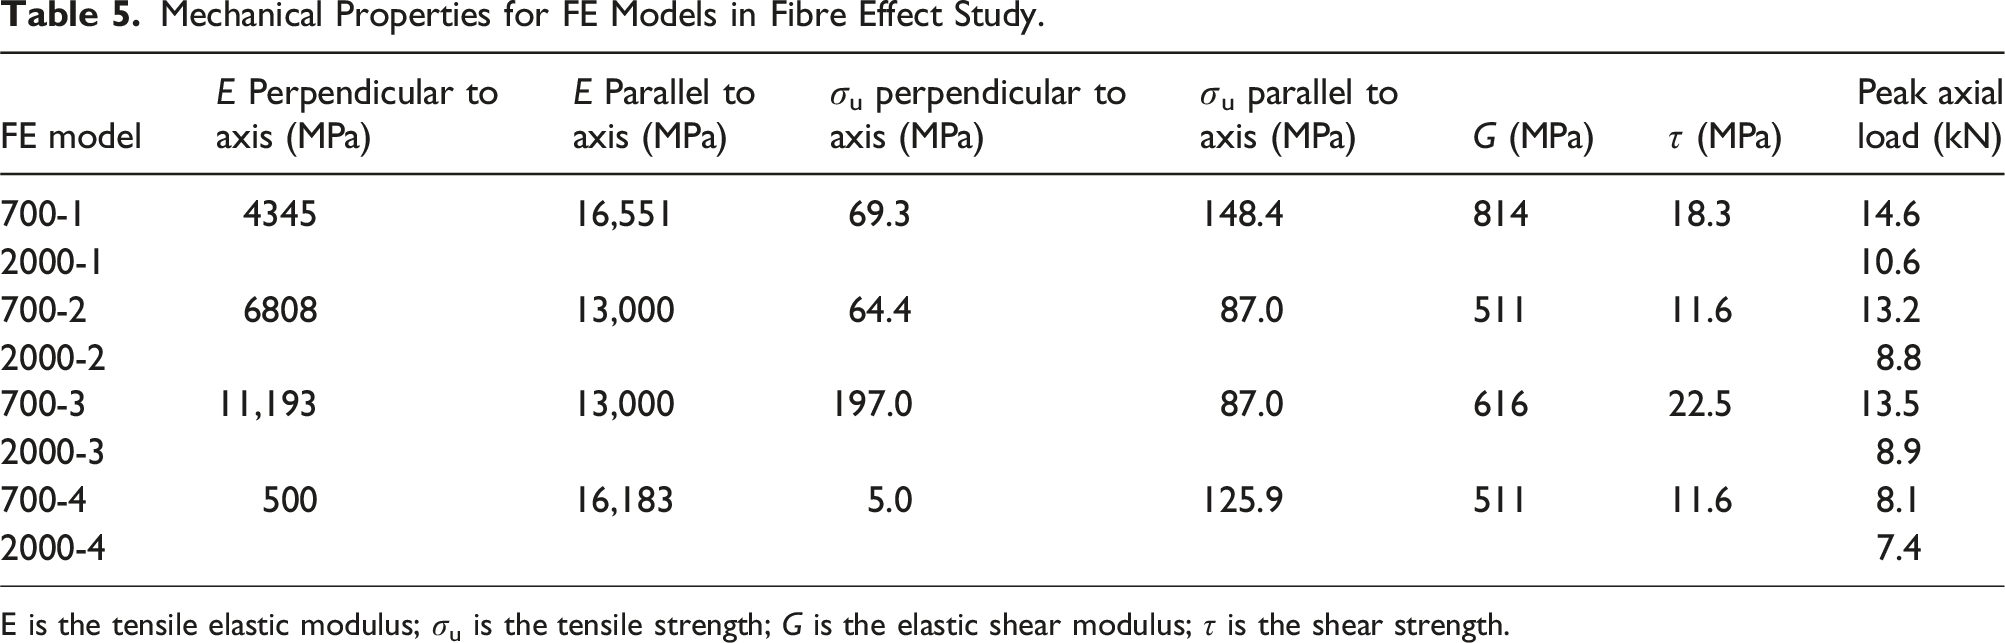
E is the tensile elastic modulus; σu is the tensile strength; G is the elastic shear modulus; τ is the shear strength.
The peak axial load values obtained from the FE results are given in Table 5. Comparing the 700-1 and 700-2 specimens, the inclusion of GFs in the parallel-to-axis direction (while keeping the total fibre density similar) resulted in increase in the peak axial loads. Similar conclusions can be made for the 2000-1 and 2000-2 specimens. Comparing 700-2 and 2000-2 with 700-3 and 2000-3, respectively, a further increase in GF density in perpendicular to axis direction, without having GFs in the parallel to axis direction, only marginally increased the peak axial load. Even with higher GF density in the perpendicular-to-axis directions, without GFs in the parallel-to-axis directions, peak axial loads were lower than the respective samples with bi-axial GFs. However, inclusion of the GFs in the parallel-to-axis direction alone resulted in reduction for the loads (i.e., 700-4 and 2000-4 specimens showed significant reductions in peak axial loads). From the FE results, it was clear that the use of bi-axial GFs provided the best results. Increasing the GF density in the transverse direction had only marginal effects in increasing the peak axial load, however providing an adequate volume of GFs in the perpendicular-to-axis direction is necessary.
Comparison with cold form steel sections
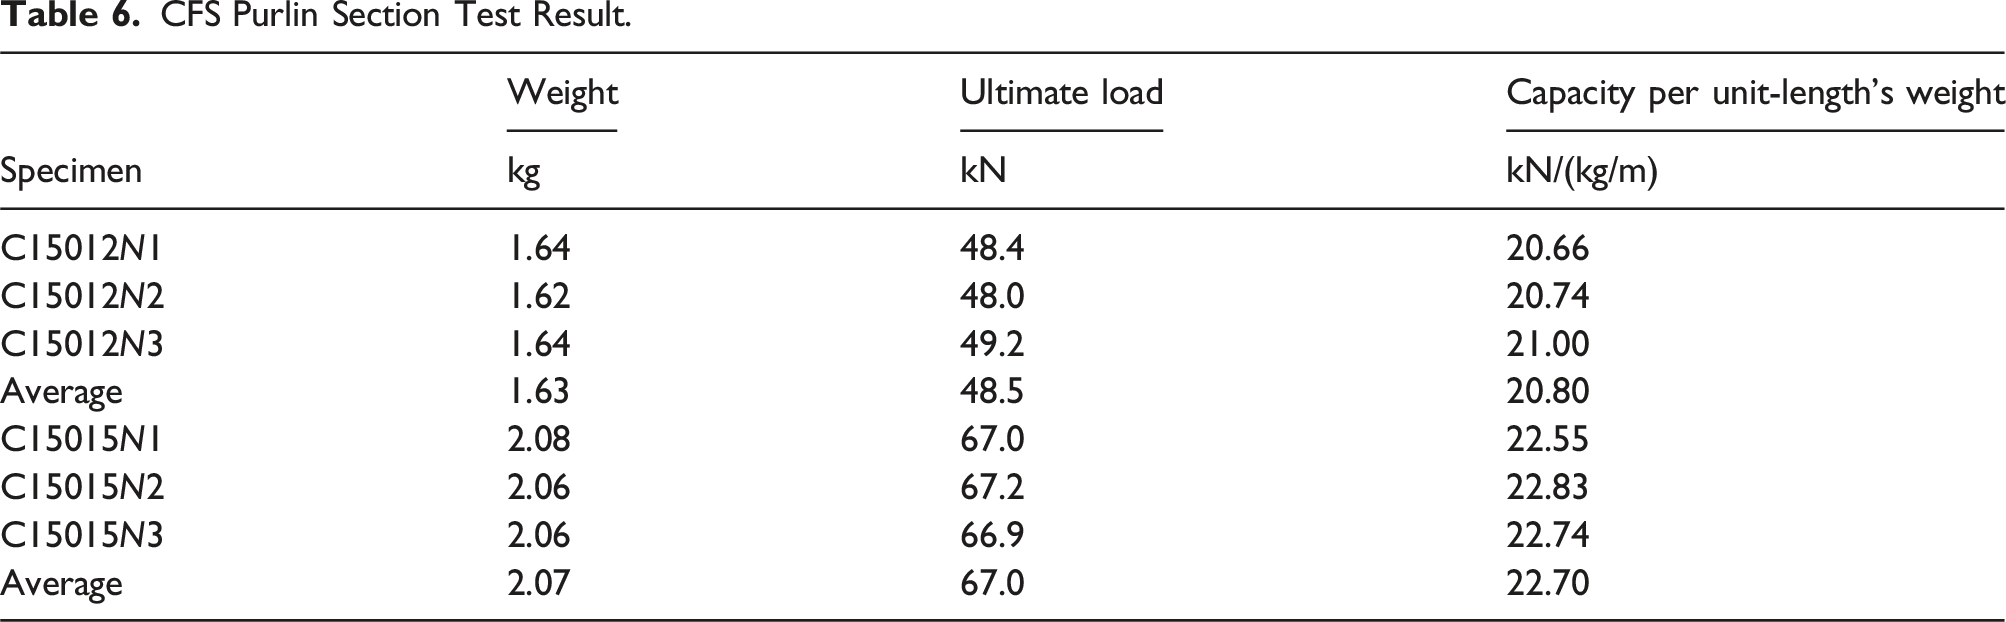
To compare the capacities with cold-formed steel (CFS) counterparts, the local buckling capacity and the flexural stiffness about the minor axis values of the C15012 and C15015 CFS purlin sections from Lysaght® (most closely matched commercially available purlin sections to tested HFT specimens) were compared with the corresponding HFT specimens values. To obtain the local buckling capacity of the steel specimens, 700 mm long specimens were tested using the same setup as for HFT 700 mm long specimens.
CFS Purlin Section Test Result.
Conclusion
This paper presented a systematic experimental and numerical investigation into the behaviour of HFT thin-walled C-section columns. Design of the specimens was done using a preliminary FE model to ensure both local buckling and global buckling modes were captured. A cross-section geometry close to existing steel thin-walled C-sections was selected. Two different specimen lengths, namely 700 mm and 2000 mm, were selected. Bi-axial glass fibre fabrics and hoop pine veneers were bonded together using Polyurethane adhesive to manufacture the HFT C-section columns. Manufacturing was done through a bespoke manufacturing rig under a 1 MPa pressure. The manufacturing method was found to provide good consistency between different specimens. Testing was carried out under concentric axial compression.
All the 700 mm HFT C-section columns failed due to local buckling, while all the 2000 mm specimens failed due to global buckling. The weight specific capacity of the 700 mm length specimens was higher than HFT C-section columns failing due to local buckling reported in the existing literature.
The buckling direction of some 2000 mm long specimens was towards the web, while other specimens buckled away from the web. For those that moved towards the web, final failure was due to flange crushing, while for those that buckled away from the web, final failure was due to rupture of the flanges. This difference in buckling direction may have been caused by inhomogeneities. Final failure was found to be localized, and upon release of the load, deformations returned to the original, except for localized failure regions.
To further investigate the behaviour of the HFT C-section columns, a finite element model was developed. Careful consideration was given to simulating the boundary conditions of the test accurately. Rotational stiffness of the loading and support plates of the test setup was measured and used in the FE model. FE model results were verified against the experimental results of HFT C-section columns in the current study. A reasonable agreement was achieved, demonstrating the accuracy of the FE modelling approach. The verified FE modelling approach was then used to investigate the effects of fibre density and directions on the peak axial load of the HFT C-section columns.
It was found that increase in the glass fibre density in perpendicular to column axis had only a marginal effect in increasing the peak axial load, but providing adequate glass fibres in the perpendicular-to-axis direction was necessary to provide reinforcement against the weaker mechanical properties of the timber in that direction. The inclusion of glass fibres in the parallel-to-axis direction increased the peak axial load.
Footnotes
Declaration of conflicting interests
The author(s) declared no potential conflicts of interest with respect to the research, authorship, and/or publication of this article.
Funding
The author(s) received no financial support for the research, authorship, and/or publication of this article.