
Abstract
Saddle systems are a popular solution for supporting cables in cable-stayed bridges. Fretting fatigue failure of cables at saddle supports is a primary design consideration for these systems. Critical parameters that affect the fretting fatigue life of the cables are the contact forces and the slip displacements at the contact points between the cables and the saddle. Determining these critical parameters is the first step in evaluating the fretting fatigue life of the cables. Wear in the contact points between the cables and the saddle can affect the load distribution in saddle systems and consequently affect these critical parameters. However, the effect of wear has not been studied in the previous works. This paper first discusses the methods proposed in the literature for evaluating contact forces and slip displacements in the contact points between a cable and a saddle. Then, a finite element model of the problem and a framework for modelling the wear are presented. Finally, fretting fatigue life is determined based on the different studied approaches. The main highlights of the current study are considering the effect of wear in the simulation and employing an enhanced FE model for slip displacement calculations. The results of the basic model without wear effects showed that the first contact point between the cable and the saddle is critical for fatigue failure. However, by incorporating wear in the model, the contact force at the first point dropped and the second contact point became critical; this is in line with the observations in large-scale fatigue tests of saddle systems.
Introduction
High-strength steel cables are the main supporting elements in cable-stayed bridges. The stay cables transfer gravitational loads at the bridge deck to tower structures on the bridge called pylons. Reliable anchoring of the stay cables is a primary concern for these structures. The cables, historically, were anchored directly to the bridge deck and the pylons, but recently, saddle systems have become a preferred solution for supporting the cables at the pylons. In these systems, cables are anchored to the bridge deck on one side of the pylon, extended over a radial surface--the saddle--at the pylon, and anchored to the bridge deck on the other side of the pylon. This approach does not require a large operating area at the pylons and greatly reduces the material and anchoring costs. However, these newer systems have more complex designs than the traditional anchoring methods (Di Caronno and Ciccone, 2020; Gawlista et al., 2017; Lavery et al., 2013; Liu et al., 2018; Tamai and Shimizu, 2011). The major challenge in the design of saddle systems is the fretting fatigue failure of cables at the saddle supports (Chehrazi et al., 2023; Fan and Manshadi, 2022). Evaluating the contact forces and the slip displacements at the contact points between the cables and the saddle is the first step in determining the fatigue life.
Fretting fatigue failure is a common issue “when contacting components experience small amplitude relative motion” (Ding et al., 2011). The amplitude of this relative motion is typically less than 100 micrometres (Vingsbo and Soderberg, 1988). Based on the geometry and material properties of the contacting components, the critical amplitude of this relative motion can be as low as 10-20 micrometres (Majzoobi and Abbasi, 2018).
Several attempts have been made to evaluate the slip displacement in saddle systems. Mohareb (2016) presented an analytical solution for slip displacement based on the Eytelwein principle (Eytelwein, 1832). Mohareb et al. (2018) evaluated the effect of slip displacement on the fretting fatigue life of saddle systems.
A large and growing body of literature has investigated the contact pressure distribution between a cable and a saddle. Many scholars hold the view that this distribution for a cable bent over a sheave consists of a uniform region, plus a nonuniform region where the cable first meets the sheave (Seely and Smith, 1952; Feyrer, 2007; Wiek, 1982a; Wiek, 1982b; Molkow, 1982; H¨aberle, 1995). Barlow was the first to present an equation that determines the contact pressure between a rope and a sheave in the uniform region (Seely and Smith, 1952), and Feyrer (2007) discussed different theories regarding the contact pressure in the nonuniform region. A team of researchers at TU Berlin has been progressively working on this problem in the last few years. A series of fatigue tests done at TU Berlin to evaluate the fretting fatigue life of steel cables in saddle systems found that the cables usually fail at the contact points where the cables first meet the saddle (Schlaich et al., 2010, 2016); Mohareb et al. (2016) stated that this phenomenon occurs because of the irregular contact stress distribution at the zone where the cables first contact the saddle, and compared the analytical solutions and the results of a 2D Finite Element (FE) model of a band bent over a saddle. Mohareb et al. (2017) developed a 3D FE model for the contact points between a cable and a saddle to evaluate the fretting fatigue life of the cables. Mohareb (2020) presented a 2D FE model of a band bent over a saddle with discrete contact points. Chehrazi et al. (2020) developed fretting maps and a probabilistic framework for evaluating the fretting fatigue life of the cables in saddle systems.
The evaluation of contact force and slip displacement in saddle systems has also been discussed in studies on other bridge types. Goldack et al. (2016) evaluated the saddle systems in stress ribbon bridges and developed an analytical solution and FE model to evaluate the contact pressure between the stress ribbon and the saddle. Takena et al. (1992) explored slip displacement in saddle systems for suspension bridges. Cheng et al. (2018) presented an anti-slip safety factor for saddle systems in suspension bridges. Shi et al. (2020) explored the fretting behaviour of cables in U-shaped saddle systems.
Details of the analytical approaches available to evaluate contact force and slip displacement for loaded cables bent over circular supports can be found in (Mohareb, 2020; Mohareb et al., 2016, 2017, 2018). Despite the previous efforts to evaluate the contact forces in saddle systems, there is limited work on the slip displacement evaluation and no study has evaluated the effect of wear on the contact forces and slip displacements at the contact points of saddle systems. With this limitation in mind, the current study first compares the results of the previously developed analytical solutions with the results of a 2D FE analysis, and then evaluates the effects of wear on the contact force distribution and slip displacements at the contact points, using an iterative approach for modelling the wear. Finally, a multiaxial stress approach is used to investigate the effects of employing the different discussed methods on the fretting fatigue life of the bridge cables.
Predicting the fretting fatigue life of bridge stay cables at saddle supports is a complex problem, which requires consideration of a number of parameters. While large-scale tests of saddle systems can be helpful, these tests are very costly. Therefore, developing computational methods to predict the fretting fatigue life of the cables can significantly reduce the design costs of such systems. Previous efforts to develop such methods without considering wear failed to correctly predict the failure location along the cable (i.e., the critical contact point). The current work shows how incorporating wear in the analysis can improve prediction accuracy. The analysis performed in this paper is rather unique in that it considers the effect of wear on a system level. Previous studies investigating the effects of wear on fretting fatigue life have largely focused on localized effects at single contact points. However, a methodology for modelling wear at a system level (i.e., where the effect of wear at one contact point can be a change in the contact force at another) turns out to be necessary for a full understanding of the problem investigated in this paper.
Studied saddle system
In saddle systems, a cable and a saddle are in contact at a few points (see Figure 1), and the frictional force at these points accounts for the difference in the axial force of the cable on each side of the pylon. Live loads on the bridge cause a relative motion between the cable and the saddle. This motion and high contact forces at the contact points between the cable and the saddle make saddle systems prone to fretting fatigue failure. Contact points in saddle systems.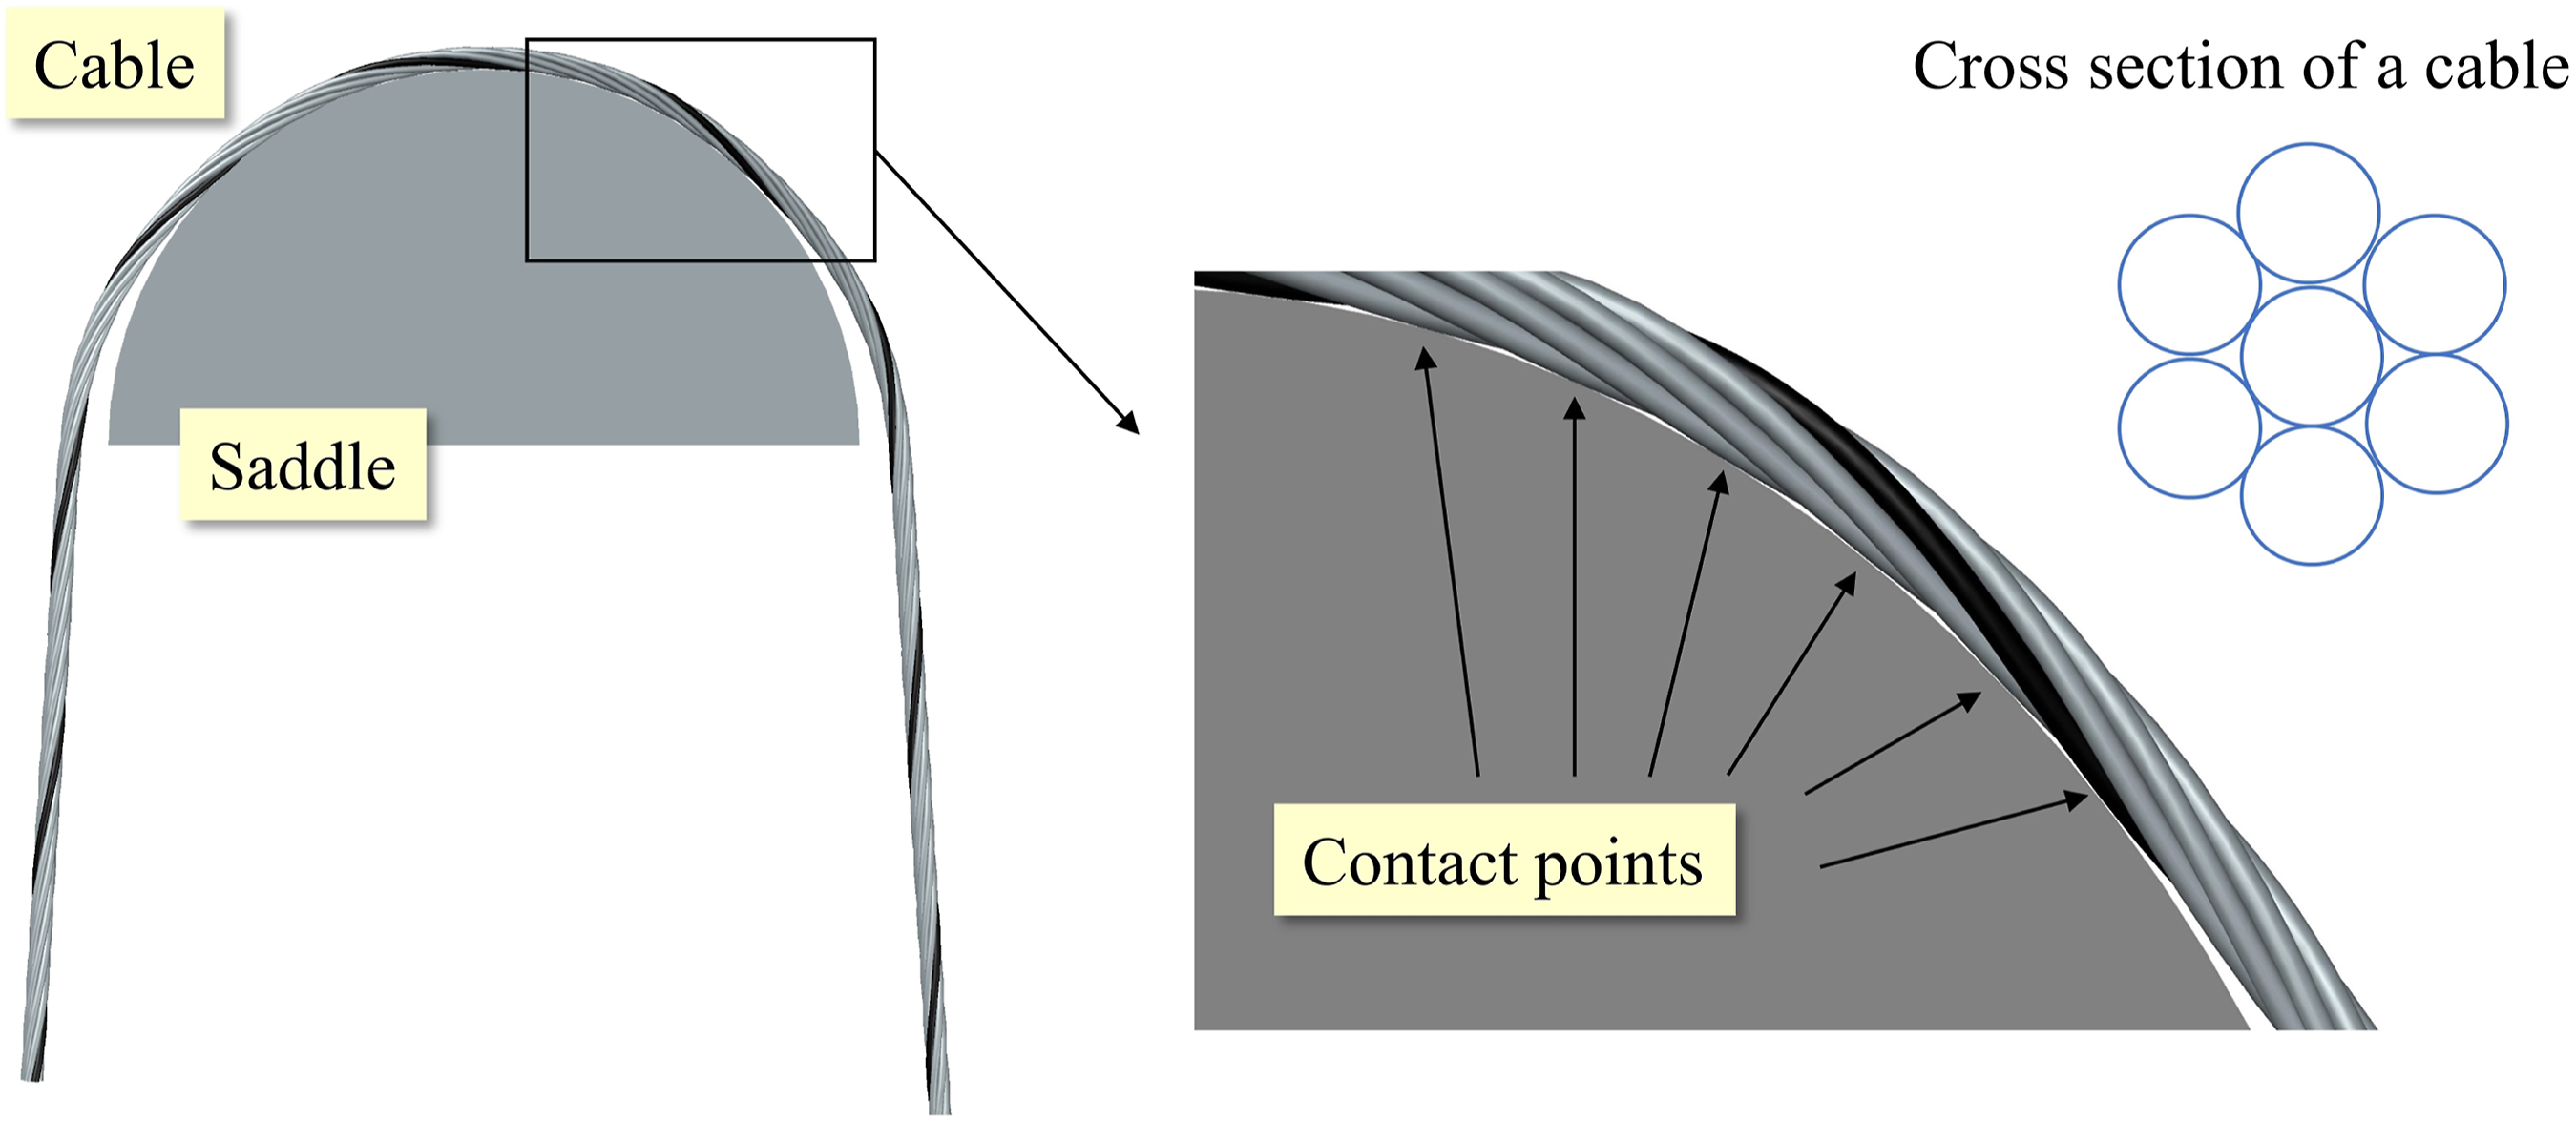
A series of fatigue tests were done on steel cables over saddles at TU Berlin (Schlaich et al., 2016). This paper studies the TU Berlin test rig as a saddle system example. Figure 2(a) shows a schematic view of this test apparatus. The load is applied to the cables using a single actuator at the center of the saddle. Load cells measure the axial loads at two ends of each cable. The saddle design in this test apparatus enables tests to be done for three different saddle radii of 500, 1000, and 1500 mm. Based on (fib 2005), the cables were cycled between a maximum nominal load of 45% of the “guaranteed ultimate tensile strength” or GUTS, which is 126 kN in this study, and a minimum load to result in a stress range of 200 MPa. Based on these criteria, the maximum and minimum stress were 837 and 637 MPa, respectively. The typical condition of the saddle following fatigue testing is shown in Figure 2(b), where significant wear marks are clearly visible. Schematic view of the test rig at TU Berlin (a), wear marks on a saddle wear strip (b), the lay angle and lay length of a cable (c), geometric properties of the cable (d).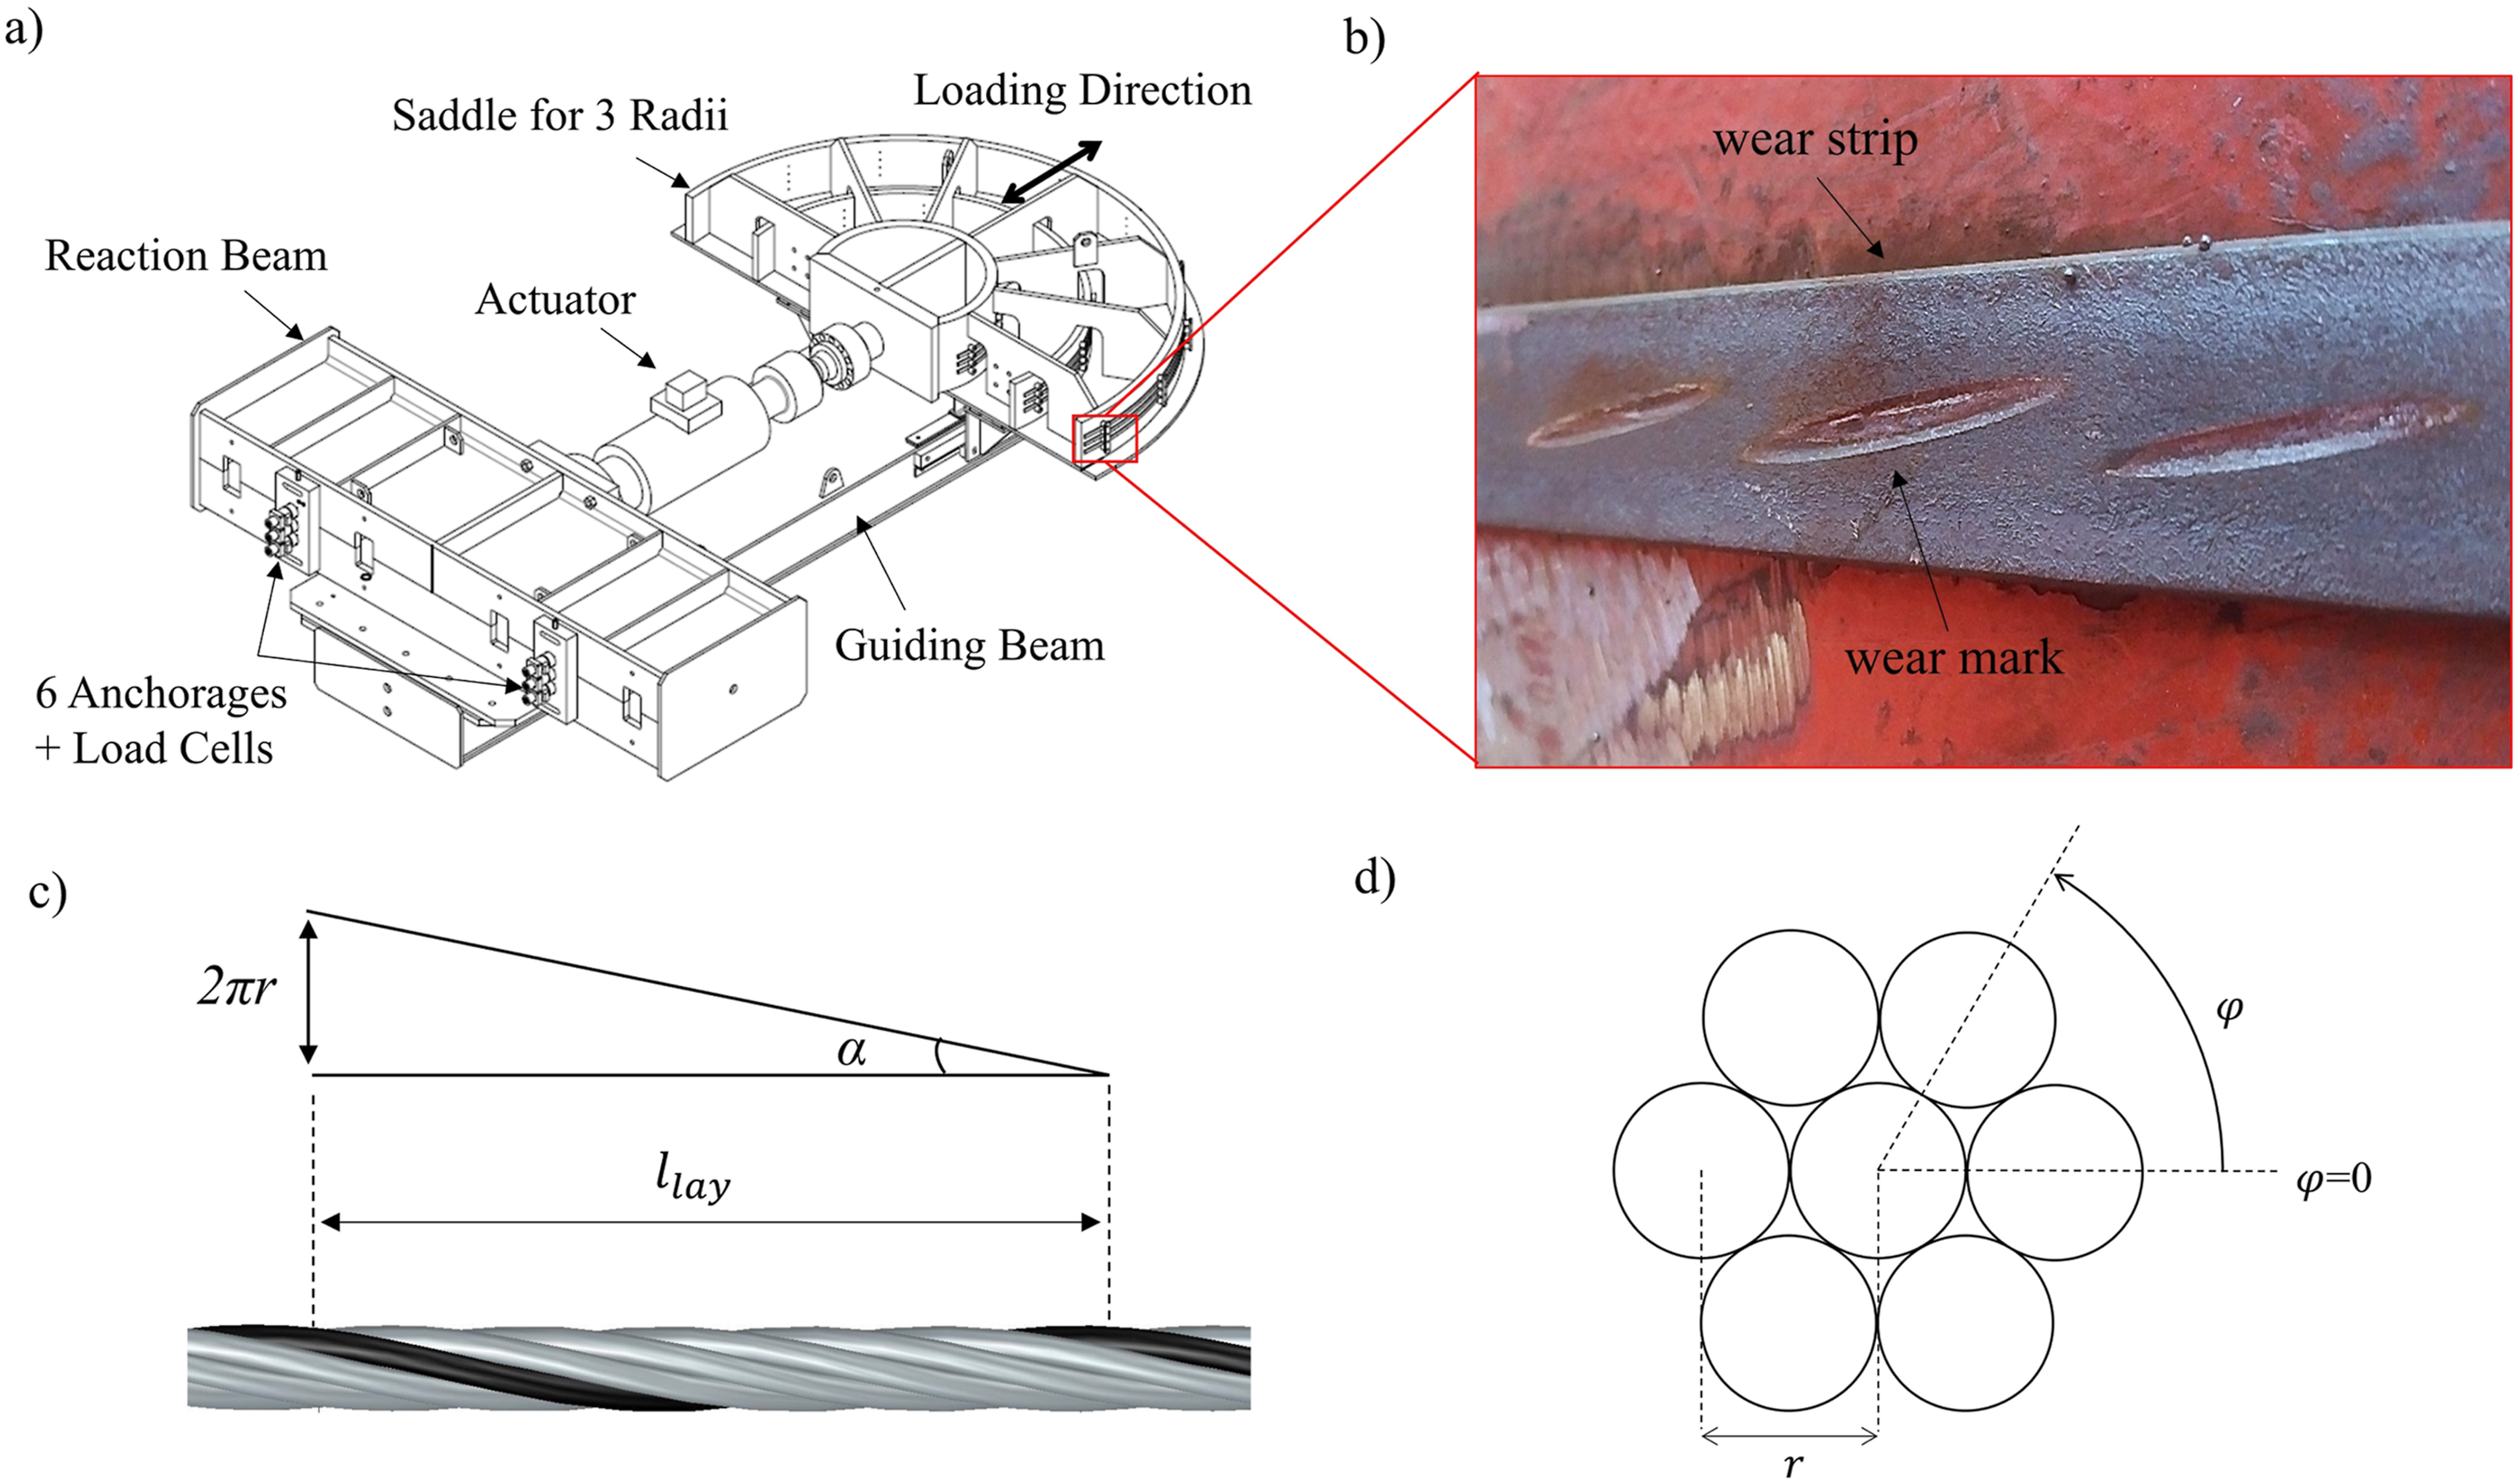
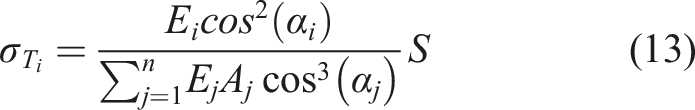
The steel cable used in these tests is a seven-wire strand with a single wire at the center and six wires twisting around the middle wire. The diameters of the central and outer wires are 5.39 and 5.23 mm, respectively. The cable has a cross-section area of 150 mm2, an inter-wire friction coefficient of 0.11, and an elastic modulus of 200 GPa. Lay length, one of the main properties of each cable, determines the number of contact points between a cable and a saddle. This length is equal to the distance required for an outer wire to rotate around the central wire and is a function of the twisting (or lay) angle. Figure 2(c, d) shows the lay angle, α, and the lay length,
Governing equations
This section reviews the governing equations and analytical solutions previously developed for the calculation of the critical parameters at saddle supports, and the fretting fatigue life determination approach based on the SWT parameter.
Slip displacement
Eytelwein (1832) first presented equation (1) to determine the axial force in a cable bent over a sheave. The load applied to one end of a cable over a sheave is not equal to the force at the other end. The frictional loss accounts for the difference between the axial force at the two ends. Given the load applied to the cable end, Schematic view of a band bent over a sheave.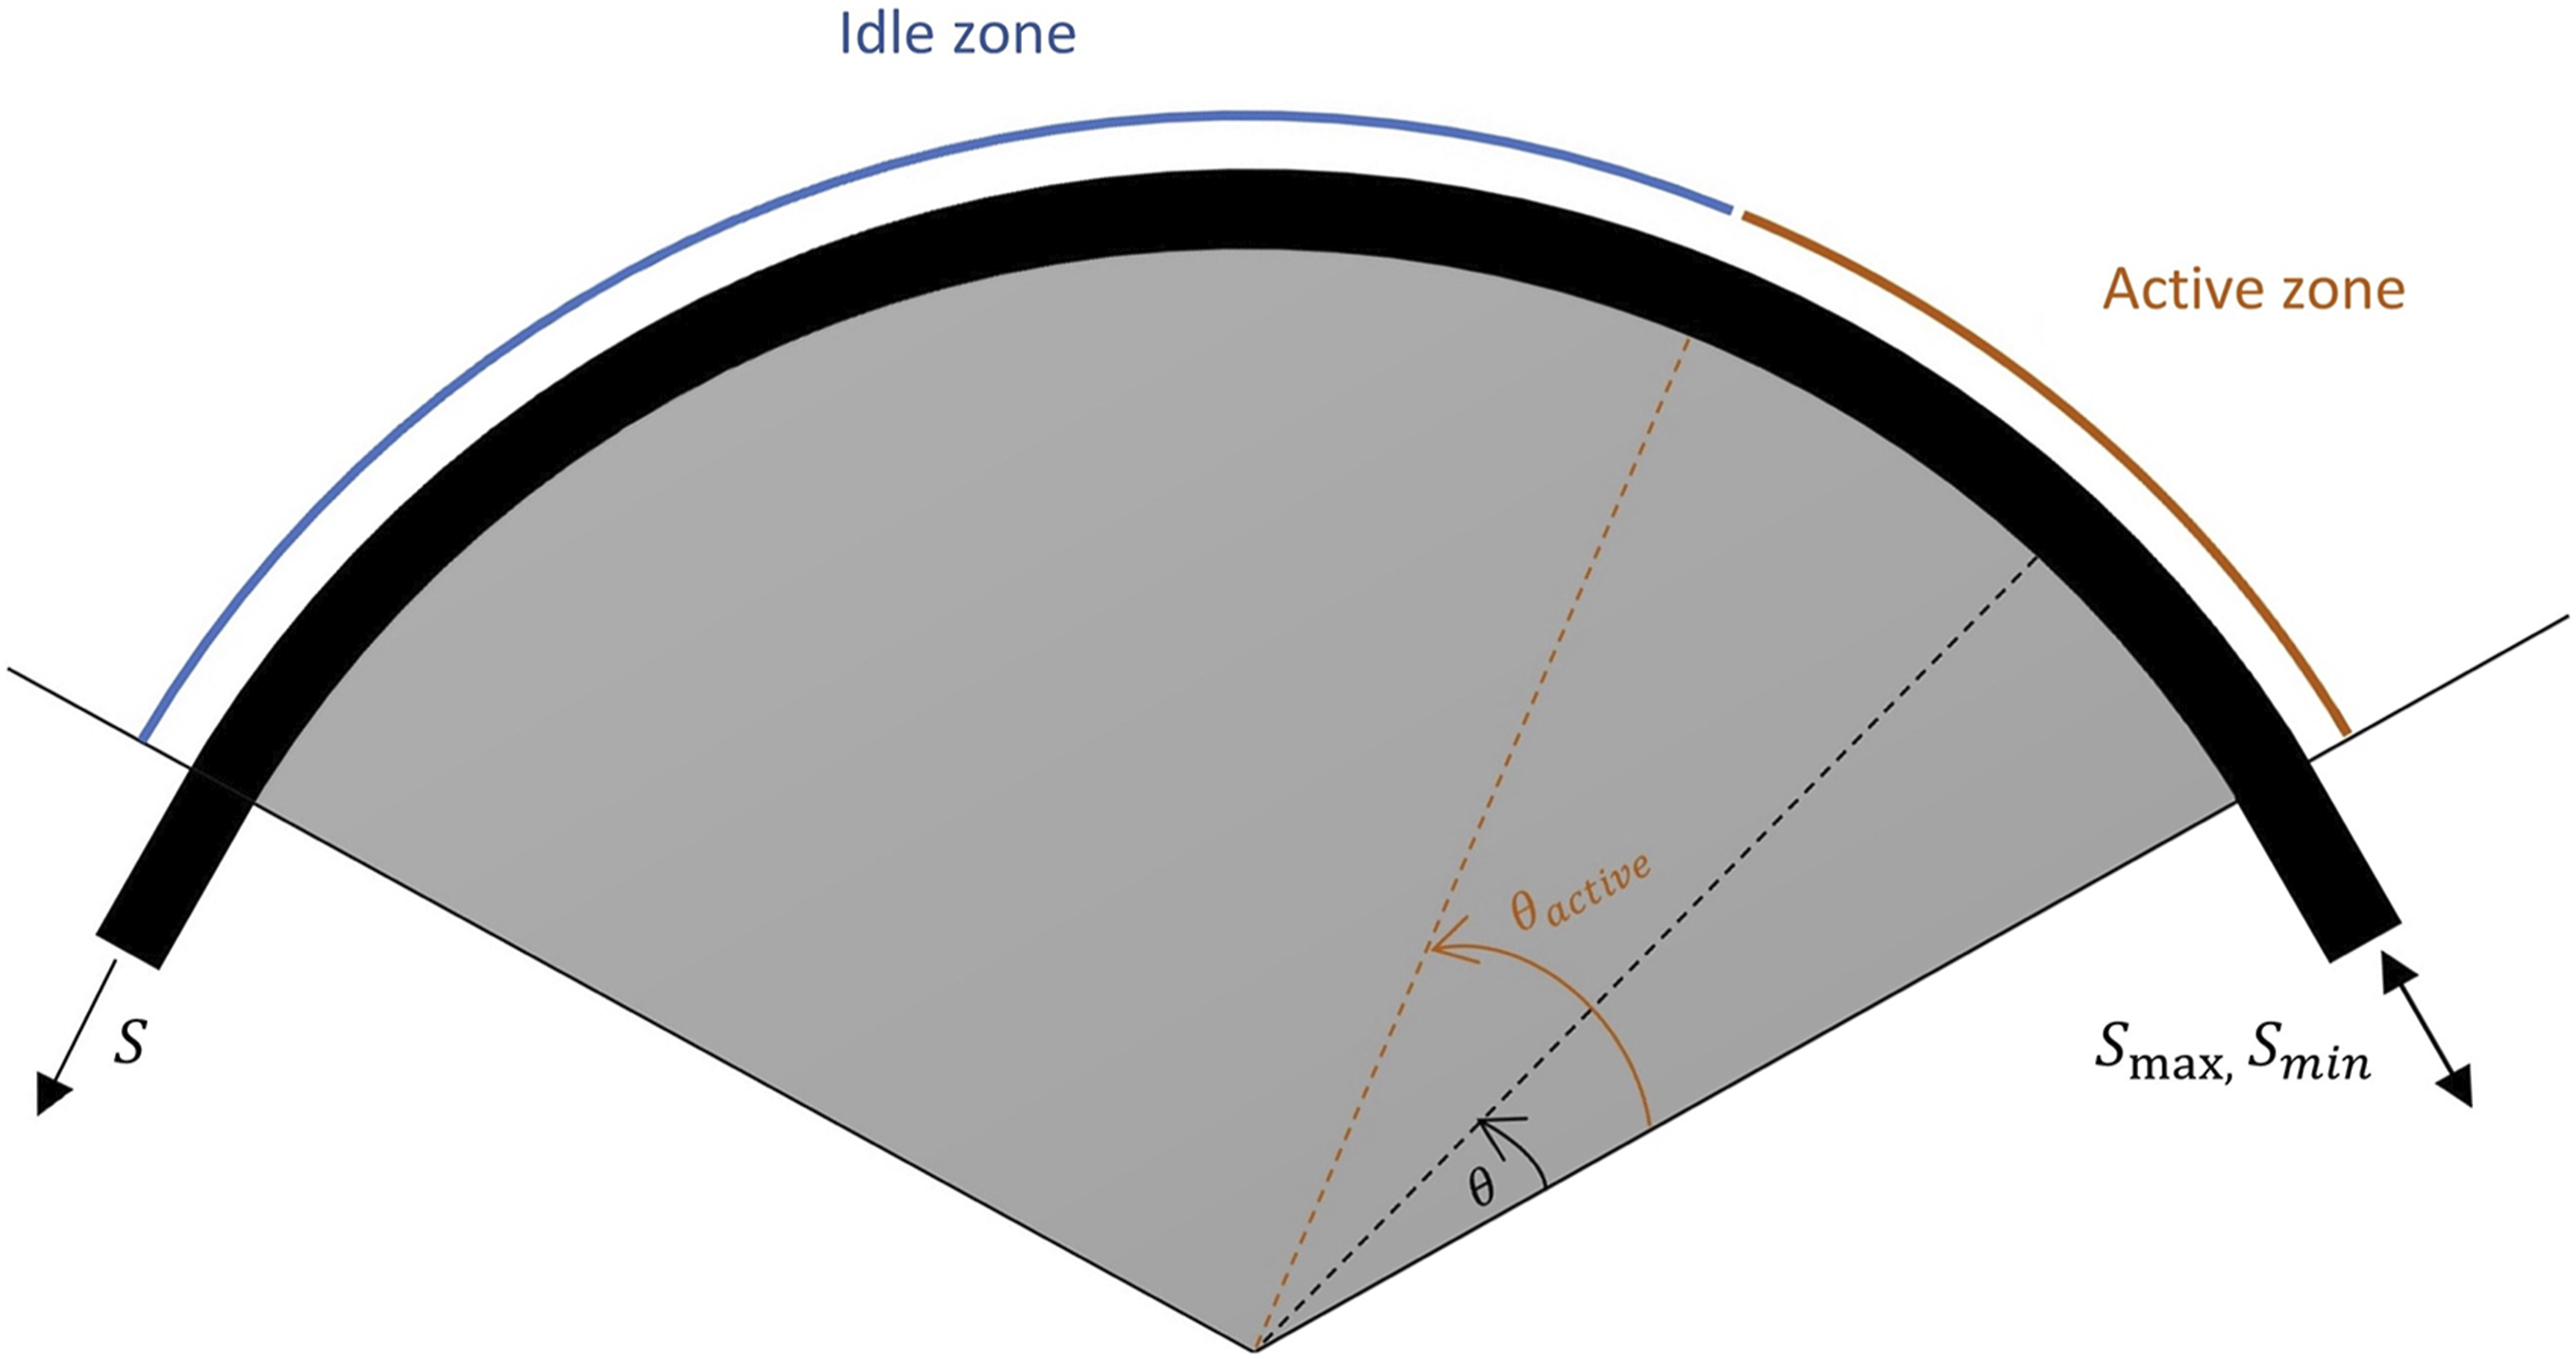

The effect of frictional loss is reversed in the unloading scenario. Given the load at the cable end,

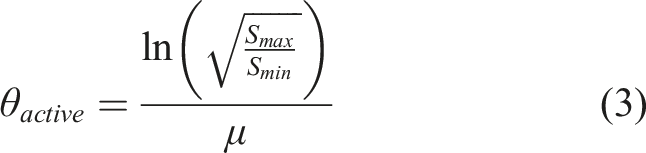
Based on equation (2), the axial force of the cable increases along the saddle. However, this increase cannot exceed the axial force in the loading phase at any location along the saddle. Therefore, an idle zone and an active zone are defined. In cyclic loading, the axial load in the cable changes only in the active region. The central angle
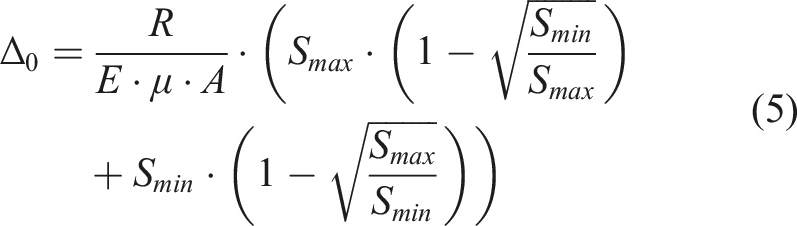
Using equations (1) and (2) and the first principle of axially loaded elastic members, Mohareb (2020) derived the following equation for the relative displacement between the cable and saddle in the loading and unloading stages:
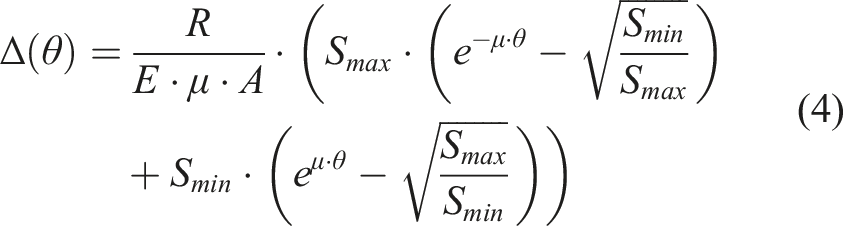
The maximum slip displacement, which occurs at the point where the cable and saddle first meet, can be determined using the following equation:
It must be pointed out that the equation derived for the slip displacement is based on the Eytelwein principle for the problem of a cable over a sheave, in which one of the assumptions is continuous contact between the cable and the sheave. Despite the simplicity of these closed-form equations for evaluating slip displacement, no work has shown that these equations are valid in the case where there are discrete contact points between the cable and the saddle.
Contact force
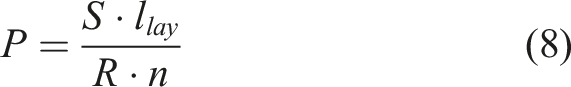
Different studies have shown that the distribution of contact pressure between a band running over a sheave consists of an irregular zone, where the band first contacts the sheave, and a regular zone for the rest of the contact surface (Feyrer, 2007; Wiek, 1982a; Wiek, 1982b; Molkow, 1982; H¨aberle, 1995). Barlow first presented an equation to determine the contact pressure of the regular zone (Seely and Smith, 1952):
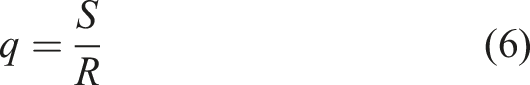
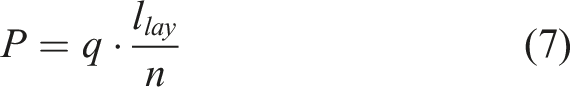
Using Barlow’s equation, equation (7) can be rewritten as follows:
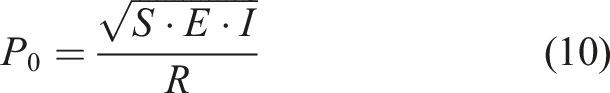
Feyrer (2007) presented an additional term to account for the contact force in the irregular zone. Given the equivalent bending stiffness of the cable,
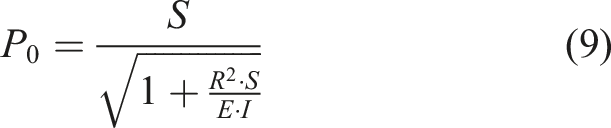
The simplified form of equation (9), confirmed by (Goldack et al., 2016), is as follows:
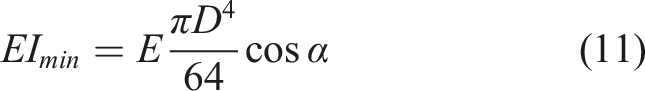
Papailiou (1997) developed the following equations to determine the equivalent bending stiffness of a cable bent over a saddle. The bending stiffness of each wire can be determined by the following equation:
Mohareb et al. (2017) assumed the additional contact force term only applies to the first contact point, while Mohareb (2020) showed that this additional term can be distributed between the first few contact points rather than only the first contact point. An accurate evaluation of the contact forces in the irregular region is a challenging problem. It is not clear how the extra term in the irregular zone is distributed among the contact points in this region; the extra term can in fact be distributed between two or more contact points. Also, the Barlow equation is derived based on continuous contact between a rope and a sheave. However, in saddle systems, the cable and saddle are in contact at discrete points.
Fatigue life determination using SWT parameter
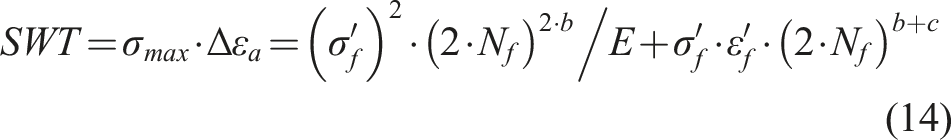
The multiaxial stress approach can be used to determine the fretting fatigue life of cables. The multiaxial stress method is reviewed in several studies. Sum et al. (2005) explained how this method can be employed using Smith-Watson-Topper (SWT) parameter. Based on this method, the fatigue life of a component can be determined using the following equation:
Modelling and analysis
2D FE model for saddle systems
FE models can examine the assumptions of the analytical solutions for the problem of a cable bent over a saddle. Mohareb et al. (2016) first presented a 2D FE model for this problem. The model was employed to determine the maximum contact pressure in the nonuniform contact area. This work modelled the cable and the saddle using a band, whose bending stiffness was equivalent to that of the cable, and a rigid body. This model resulted in continuous contact between the cable and the saddle. Later, Mohareb (2020) presented an enhanced version of this model in which the rigid body for the saddle was replaced by rigid arches, which were used to model the curvature between the saddle and the cable at the contact points. This enhanced model is closer to the real problem of a cable over a saddle in which the cable and the saddle are in contact at discrete points. In the enhanced model, as with the previous model, the cable was represented as a band with a bending stiffness equal to that of the cable. However, in these models, the area of the band was not equal to the area of the real cable. Equations (6)–(9) show that the area of the cable does not affect the contact pressure or force, which were evaluated in (Mohareb, 2020; Mohareb et al., 2016, 2017). The current work, however, aims to study contact forces and slip displacements in saddle systems. Looking at equation (4), the slip displacement is a function of the area of the cable. Therefore, a model using a band with the same area and bending stiffness as the real cable was employed in this study. Such a model enables the evaluation of slip displacements and contact forces in saddle systems.
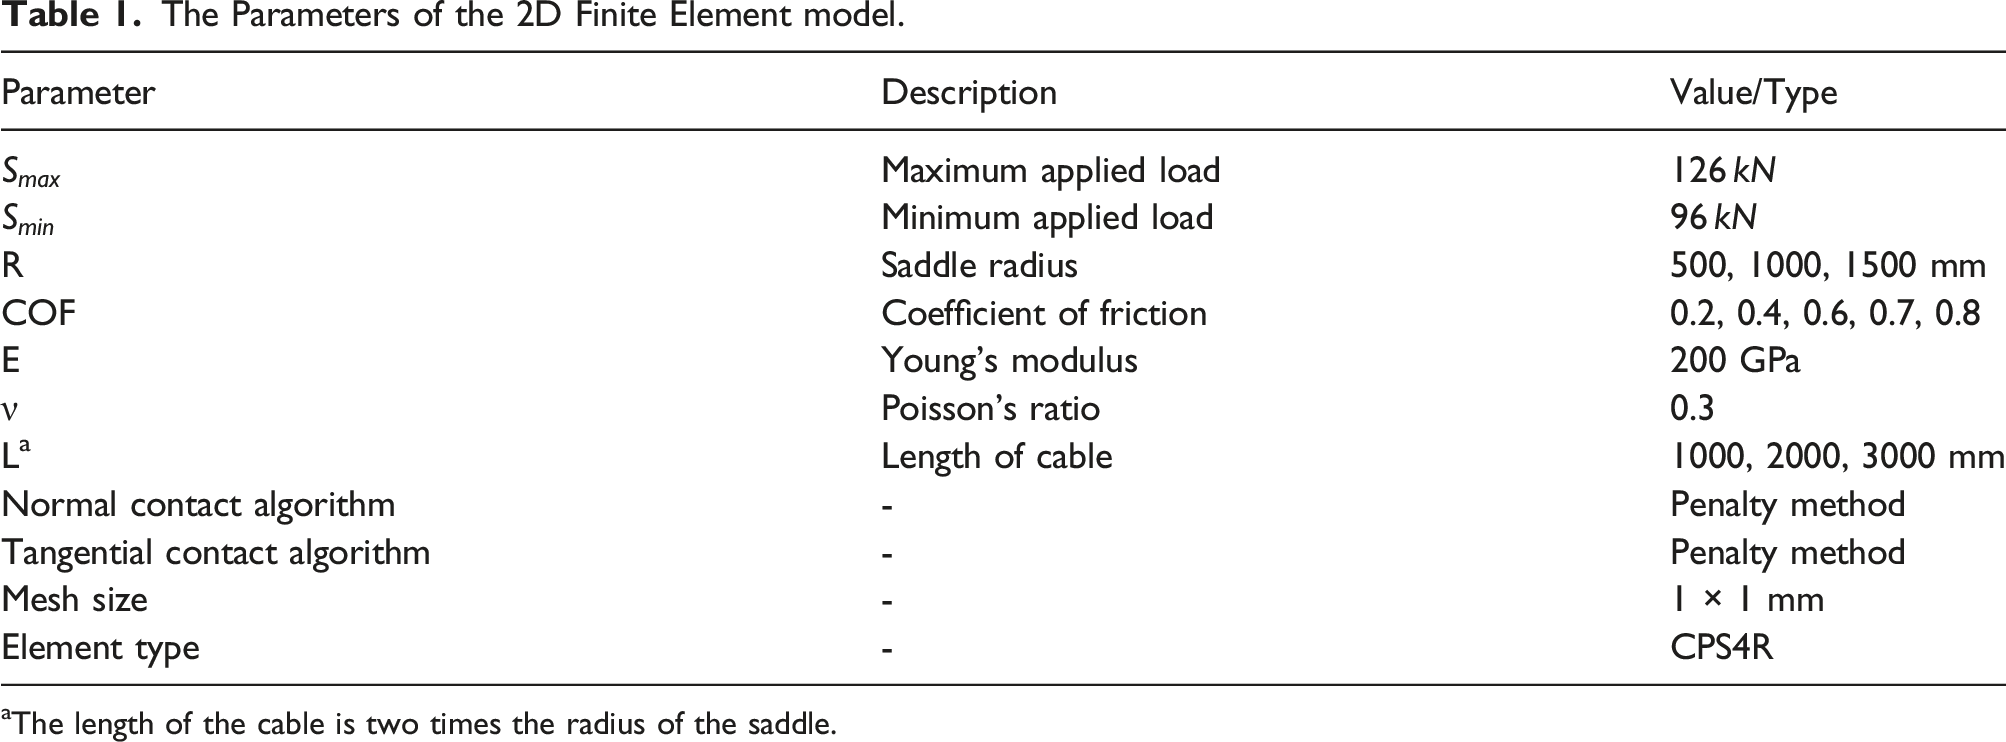
To formulate this problem, the general-purpose FE program ABAQUS was used. The FE model consists of a band, with properties equivalent to those of the cable, and a saddle consisting of a few rigid arches; each rigid arch represents a contact point between the cable and the saddle. Three different saddle radii of 500, 1000, and 1500 mm were modelled. Figure 4 shows the geometry and the boundary conditions for these models. Based on the radius of the saddle, different lengths are used for the band. An elastic material model of steel with a Young’s modulus of 200 GPa and a Poisson’s ratio of 0.3 is used for the band. The band and the saddle are fixed at one end above the saddle center. According to fib (2005), the band is cycled between a maximum nominal load of 126 kN and a minimum nominal load of 96 kN. This load is uniformly distributed between the nodes at the free end of the band and was applied to the cable in two steps. Friction is imposed using the penalty algorithm. Initially, four different COFs of 0.2, 0.4, 0.6, and 0.8 were used in the models. Hard contact was assumed between the band and the saddle, and the normal contact behaviour was controlled using the penalty method. Four node plain stress quadrilateral (CPS4R) elements with an approximate size of 1 mm × 1 mm were employed for meshing the band. To consider large deformations, the analysis was performed using the geometric nonlinear formulation in ABAQUS. Given the changes in COFs and the geometry of the model, a Python script was written to automate the process of modelling. Model parameters are summarized in Table 1. 2D Discrete FE model. The Parameters of the 2D Finite Element model. aThe length of the cable is two times the radius of the saddle.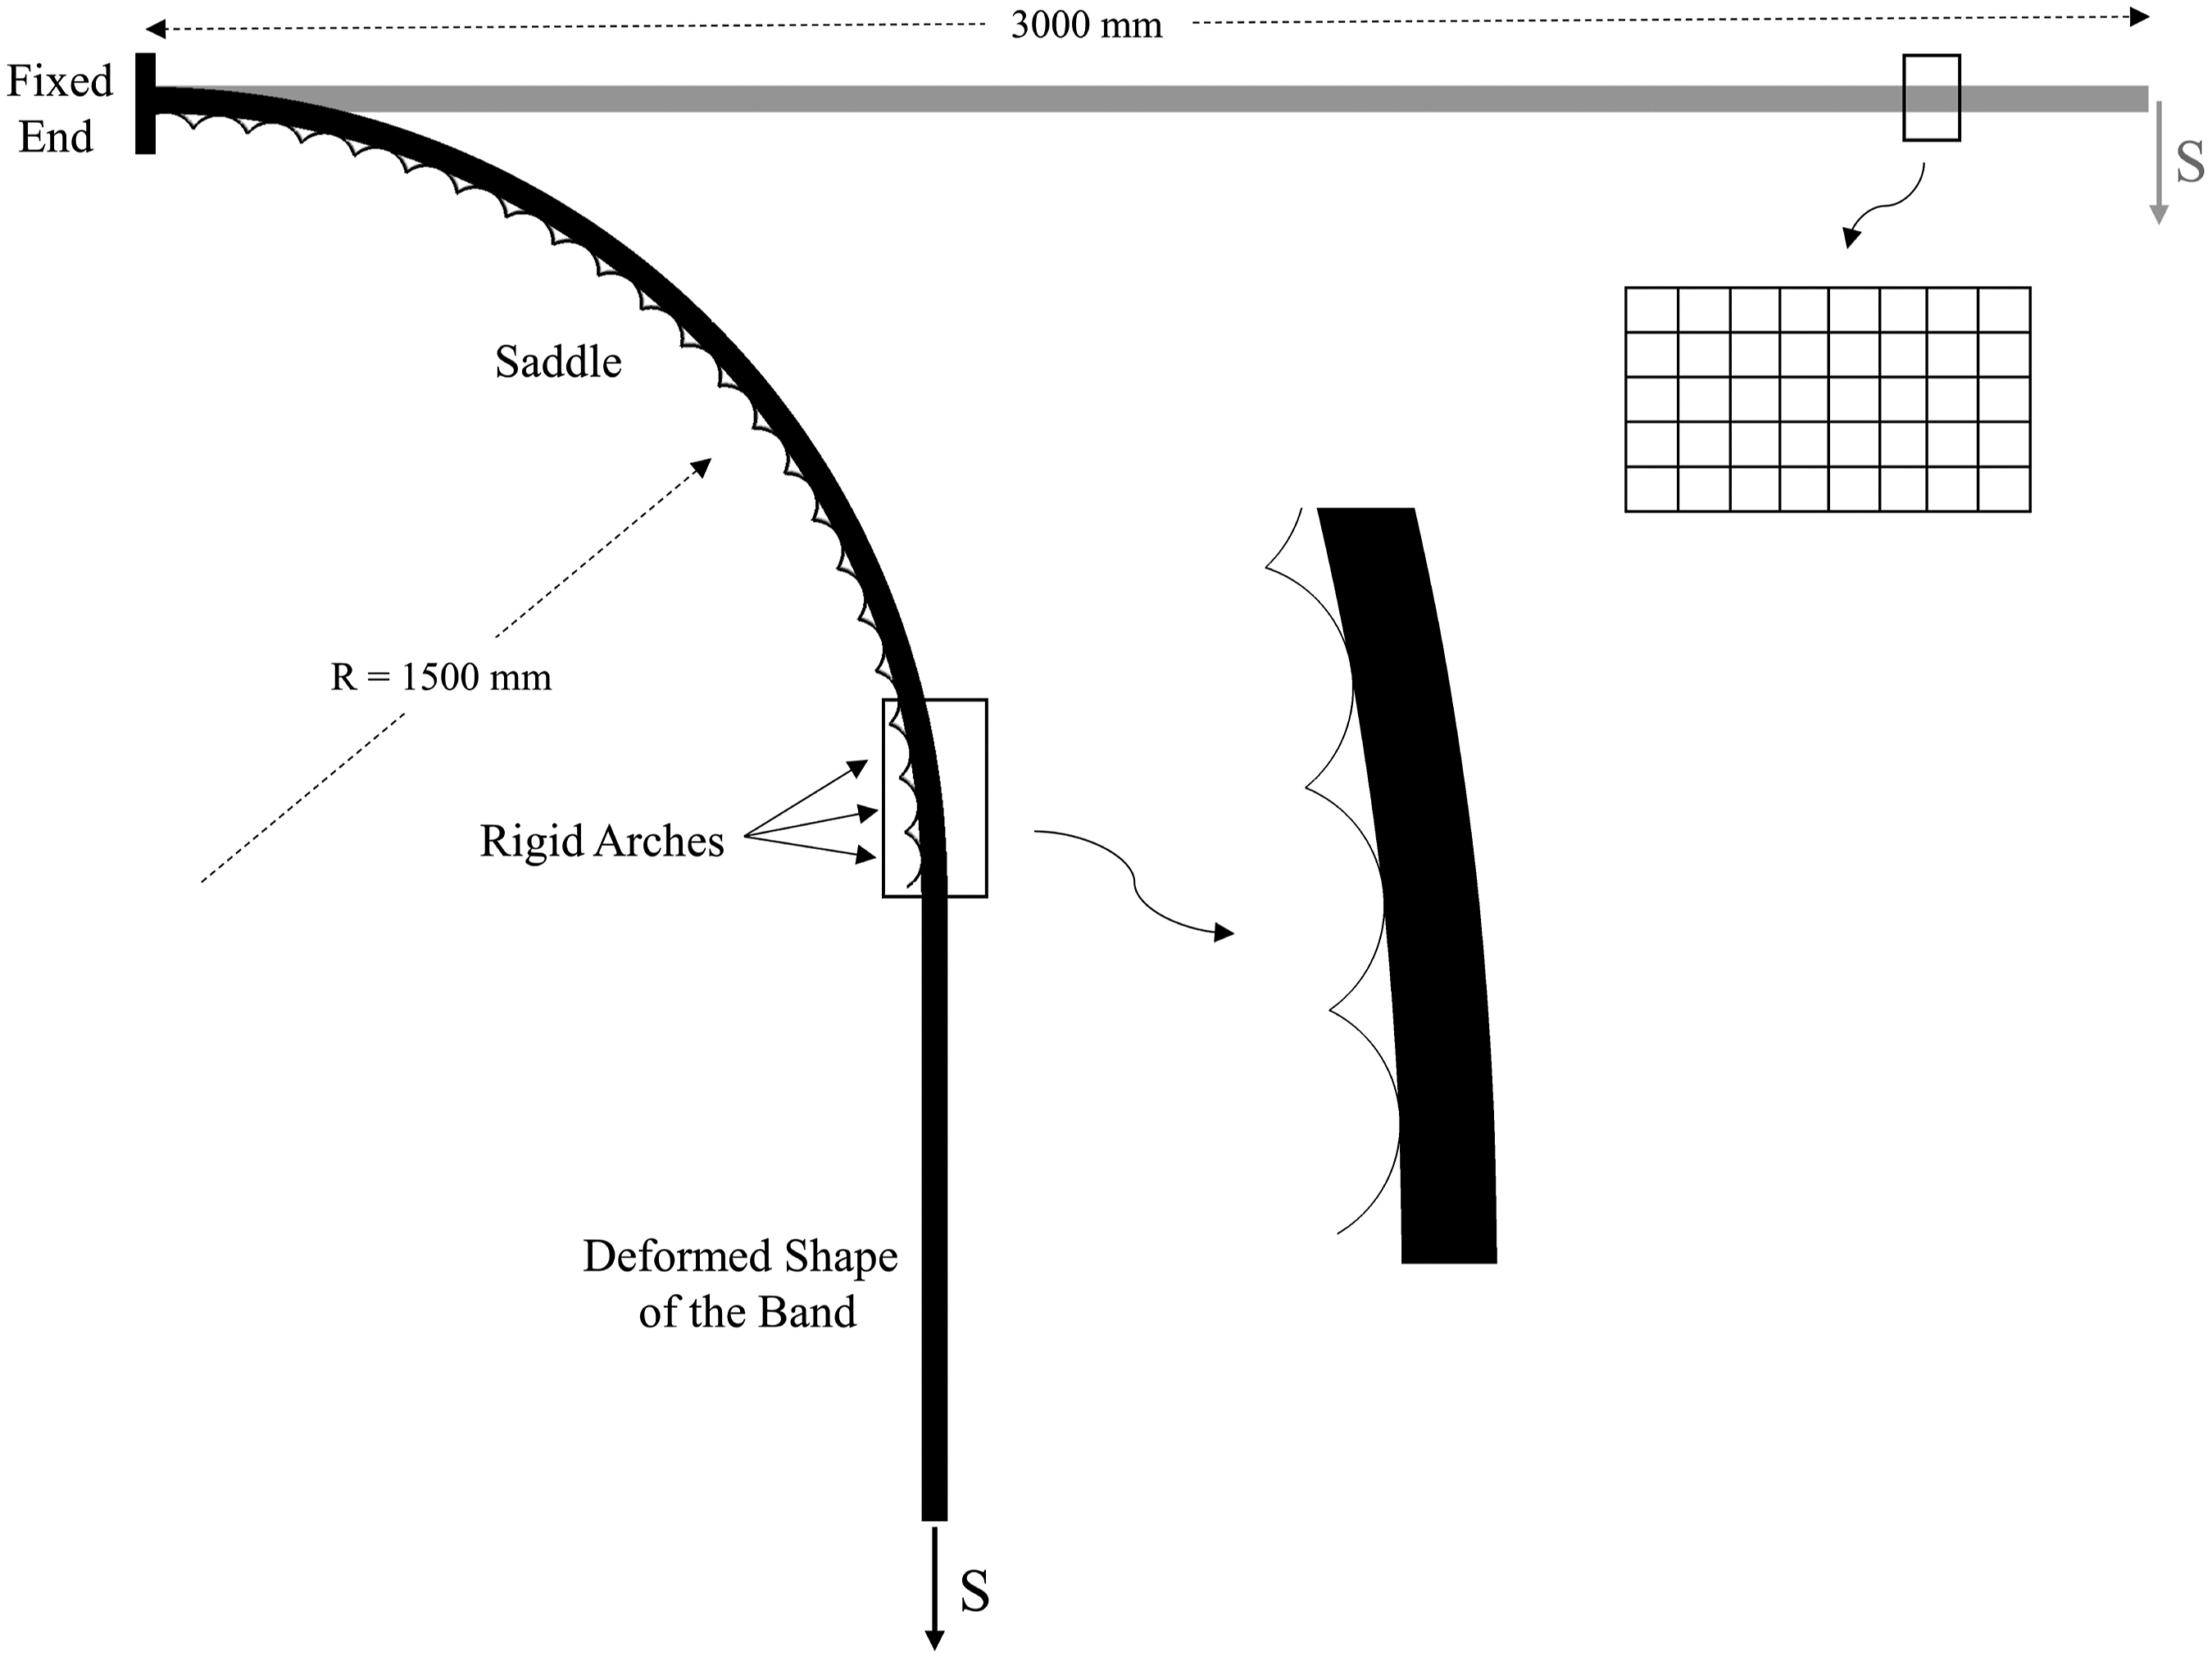
Wear modelling
Archard’s equation has been used in different engineering fields to determine the wear volume in the contact area between two components. In this paper, the numerical approach of Archard’s equation developed by (McColl et al., 2004) was used to model the wear at the contact points of saddle systems. Based on Archard’s equation, the wear volume can be determined using the following equation (Archard, 1953):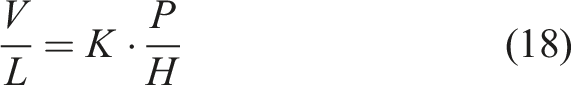

The 2D discrete FE model is used to evaluate the effect of wear on the contact force distribution between the contact points. The wear at each contact point is modelled by displacing the center of each arch in the FE model. Equation (20) is used for wear modelling in this paper. Although we know wear of the saddle material can be significant at saddle supports, based on images and observations reported in (Schlaich et al., 2016), as shown in Figure 2(b), the exact evaluation of the local wear coefficient,
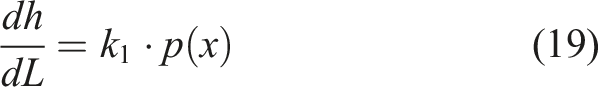
The analysis started with a model without wear. Following each analysis, the contact forces and the slip displacements were stored. Then, a new FE model was created based on the results from the previous model. Based on the slip displacements and the contact pressures at the contact points, the rigid arches on the saddle part were displaced to model the wear. For each contact point, the incremental wear depth was based on the relative wear and the wear increment for each iteration. Using this approach, the distribution of the contact forces can be determined based on the maximum final wear depth at the contact points (see Figure 5). This procedure was implemented employing a Python script. For this approach, a wear increment of 0.02 mm was used and the analysis was performed until maximum wear of 0.4 mm at the first contact point is achieved. This maximum wear depth was chosen based on the observations in the tests at TU Berlin (Mohareb, 2020; Mohareb et al., 2016, 2017; Schlaich et al., 2016). Wear modelling procedure.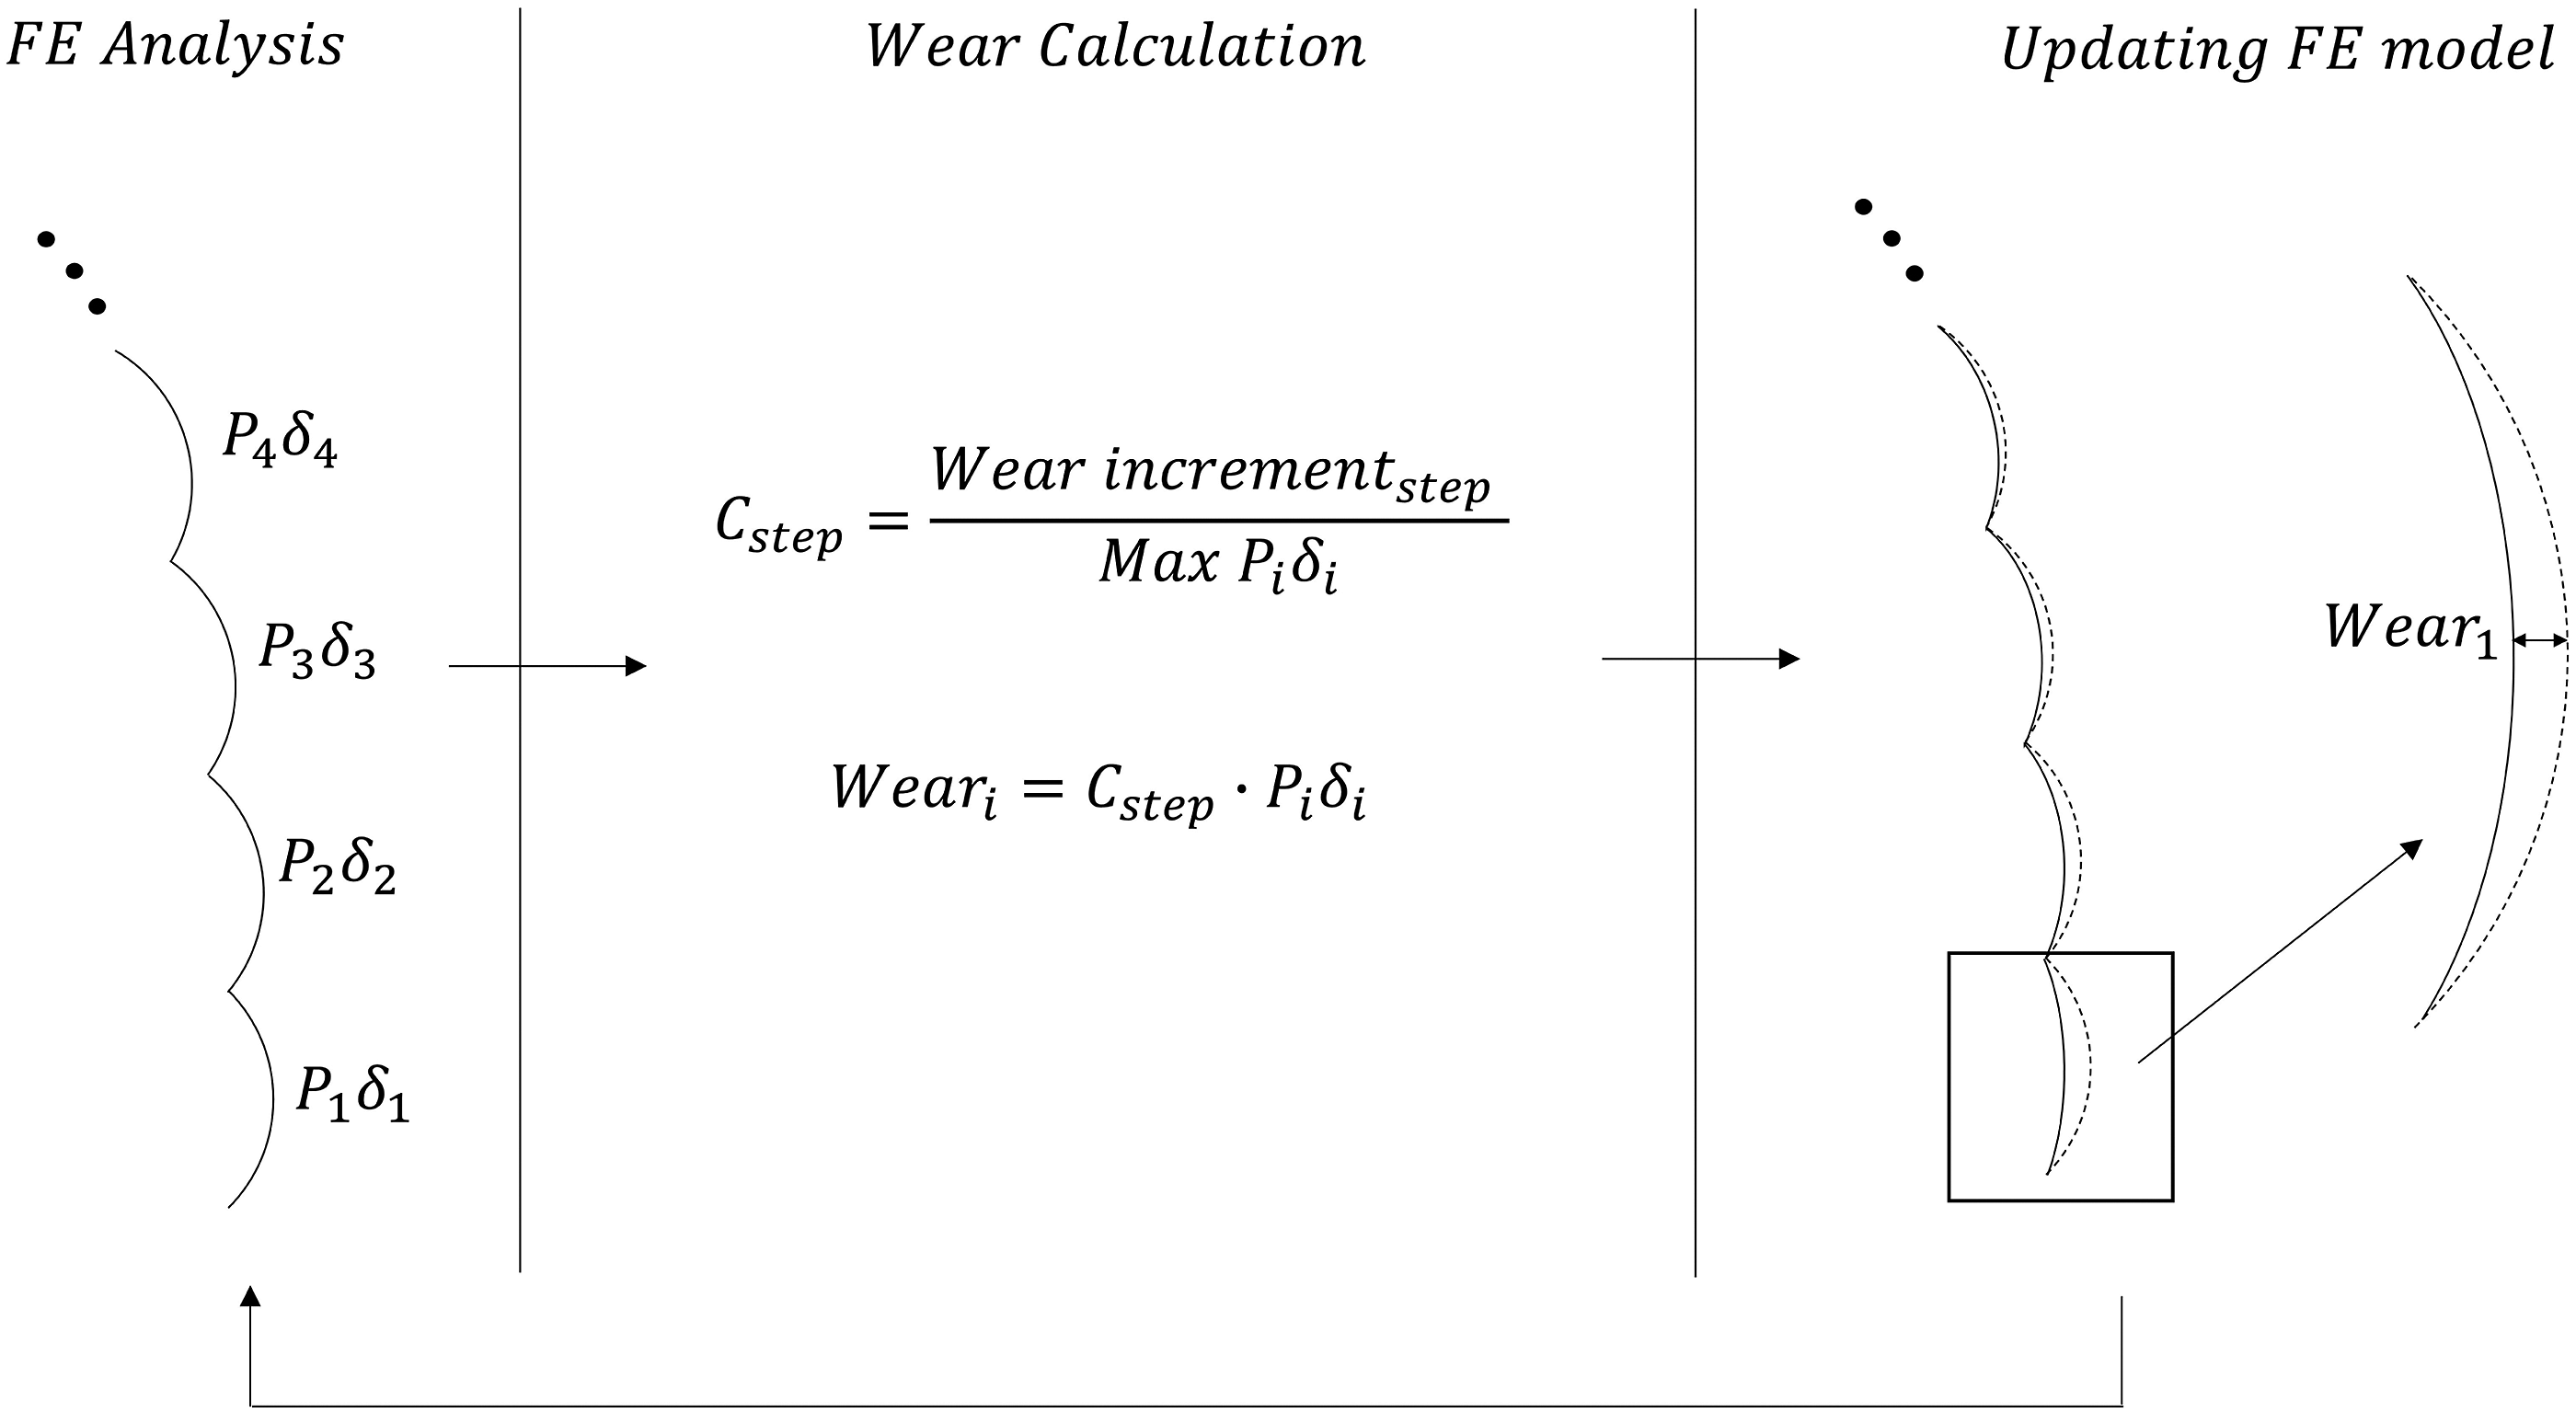
Evaluating the contact pressure and slip displacement at each contact point is a critical step in the proposed wear modelling process. The slip displacement results from the 2D FE model were used for this purpose. Although the 2D FE model results can be used for calculating the contact forces, determining the pressure at a contact point requires a more detailed FE model. Towards this end, the interface model previously presented in (Chehrazi et al., 2020) is employed.
The general-purpose FE program ABAQUS was again used to model in 3D a contact point between a saddle and a cable, with contact force, slip displacement, and normal stress as the model inputs. The boundary conditions are as shown in Figure 6(a). To reduce the analysis time, a plane of symmetry was assumed, and to avoid modelling the full height of the saddle, a 0.5 mm thick stiffened layer was added at the bottom of the saddle part. Both tangential and normal contact surface behaviour were controlled by the penalty method. Eight node linear brick elements (C3D8R) with an approximate size of 25 µm × 25 µm were used in the contact surfaces of both parts. For the high-strength steel cable, an elastic material model for steel with a Young’s modulus of 200 GPa and a Poisson’s ratio of 0.3 was assumed. A nonlinear material model of S235 steel with an elastic modulus of 200 GPa, a Poisson’s ratio of 0.3 and a nominal yield stress of 500 MPa (with no strain hardening) was assumed for the saddle material. The 3D interface mode (a), and the contact pressure vs. contact force results (b).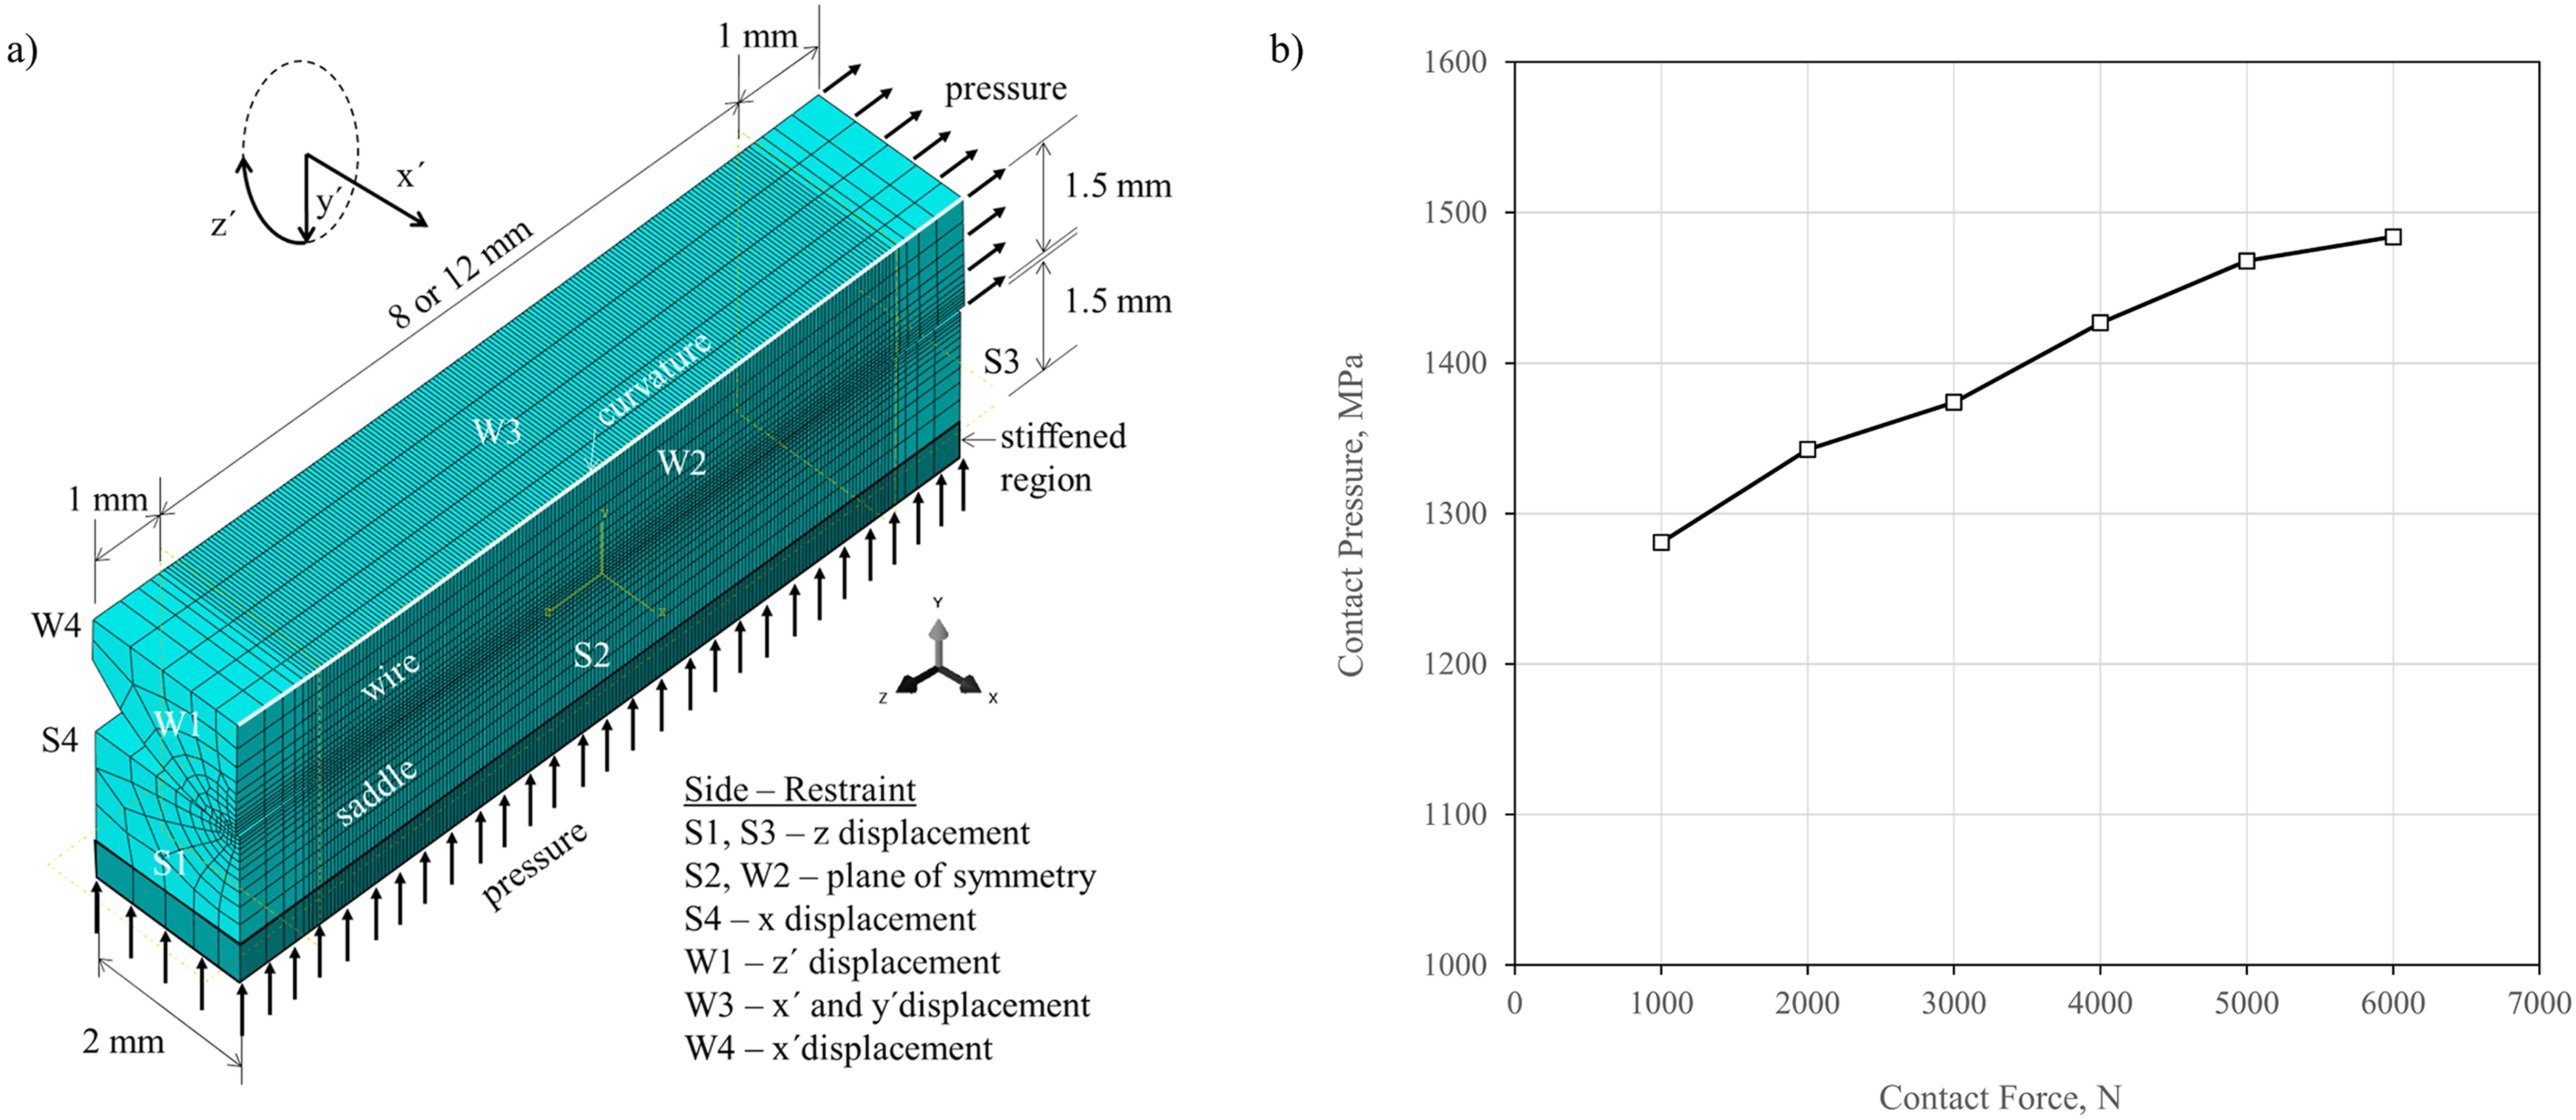
Despite the high accuracy of the 3D model, running the 3D model multiple times after each analysis of the 2D model is time-consuming. To overcome this issue, the contact pressure at the center of the contact point is determined for a few contact forces, and interpolation is used to find the values in between. Figure 6(b) shows the results of contact force vs contact pressure.
Recent tests at TU Berlin and the University of Waterloo show that the COF of cables in contact with the saddle can range from 0.6 to 0.8 (Chehrazi 2022; Mohareb 2020). Therefore, it was decided to perform the wear modelling process and fretting fatigue life evaluation using a COF of 0.7, which falls between the reported COFs in these works.
Finite element model steps required for SWT determination
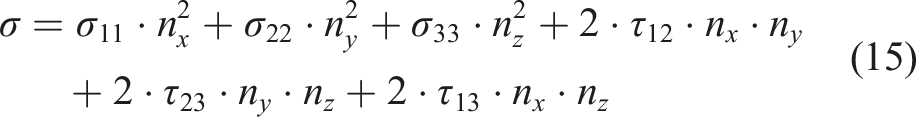
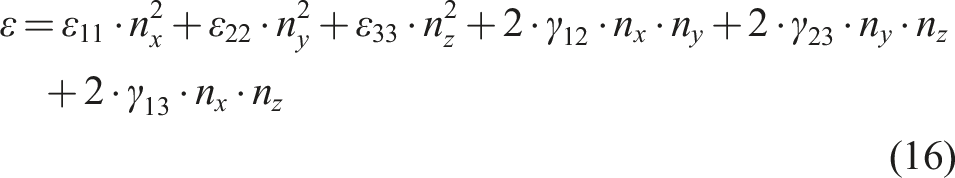
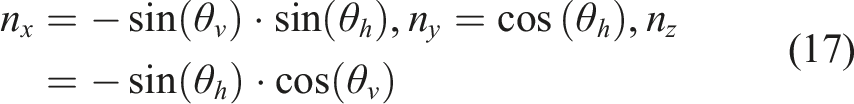
The 3D interface model previously used to determine a map between the contact force and contact pressure was also used for fatigue life determination (See Figure 6(a)). To determine the SWT parameter, the stresses and strains at the end of the loading and unloading stages are required. In this model, three loading steps were employed. First, a small contact force is applied to ensure contact between the cable and the saddle and prevent convergence issues. Next, the contact force and axial stress associated with the loading phase are applied. At the same time, the slip displacement is applied by displacing the saddle part. Finally, the contact force and axial stress are decreased to their value in the unloading phase and the saddle part is returned to its original location. The stresses and strains at the end of the second and third steps were employed to determine the SWT parameter. Calculation of the SWT parameter was done for the points along the wire centerline in the contact area. This calculation was performed according to equations (15), and (16) and the stresses and strains recorded at the end of the loading and unloading steps. To find the maximum SWT value at each point along the surface, a Python script was employed to determine the critical plane by varying
Results and discussions
Analytical vs. FE model results
The discrete FE model was used to evaluate the contact forces and the slip displacements at the contact points. Figure 7 shows the contact force results of the discrete model versus the analytical solutions, based on equation (8). As can be seen, the contact force results of both methods are close for the points in the regular region (after the first few contact points). The FE results in the nonuniform region show that the maximum contact force is at the second contact point rather than the first one. Mohareb (2020) suggested that the position of the first and second arches can considerably change the contact force distribution between these points. Assuming a fixed spot for the additional contact force in the nonuniform region, a slight change in the position of the first arch can move the first or the second arch closer to the point where the force is applied to the saddle and increase the force on that arch. In other words, in the discrete FE model at the first contact point, the cable and saddle might be only in partial contact and not necessarily impose a large amount of contact force on each other. However, in the results based on the analytical solutions, it is assumed that the cable and saddle are entirely in contact at all points. It should be noted that the results in the active region (where there is a cyclic axial stress and slip displacement) are shown in this figure. As the friction coefficient increases, the active region becomes smaller and the number of contact points in this region decreases (see equation (3)). Looking at the contact force results in the uniform region, it can be seen that the contact force decreases along the saddle. This is because the contact force is a function of the axial load (see Equations (6)–(8)), and the axial load decreases due to the frictional loss. Looking at the results for different saddle radii, it can be seen that, the contact force increases by a decrease in the saddle radius (or R). Contact force results based on the FE model and analytical solution for COFs of 0.2 (a), 0.4 (b), 0.6 (c), and 0.8 (d).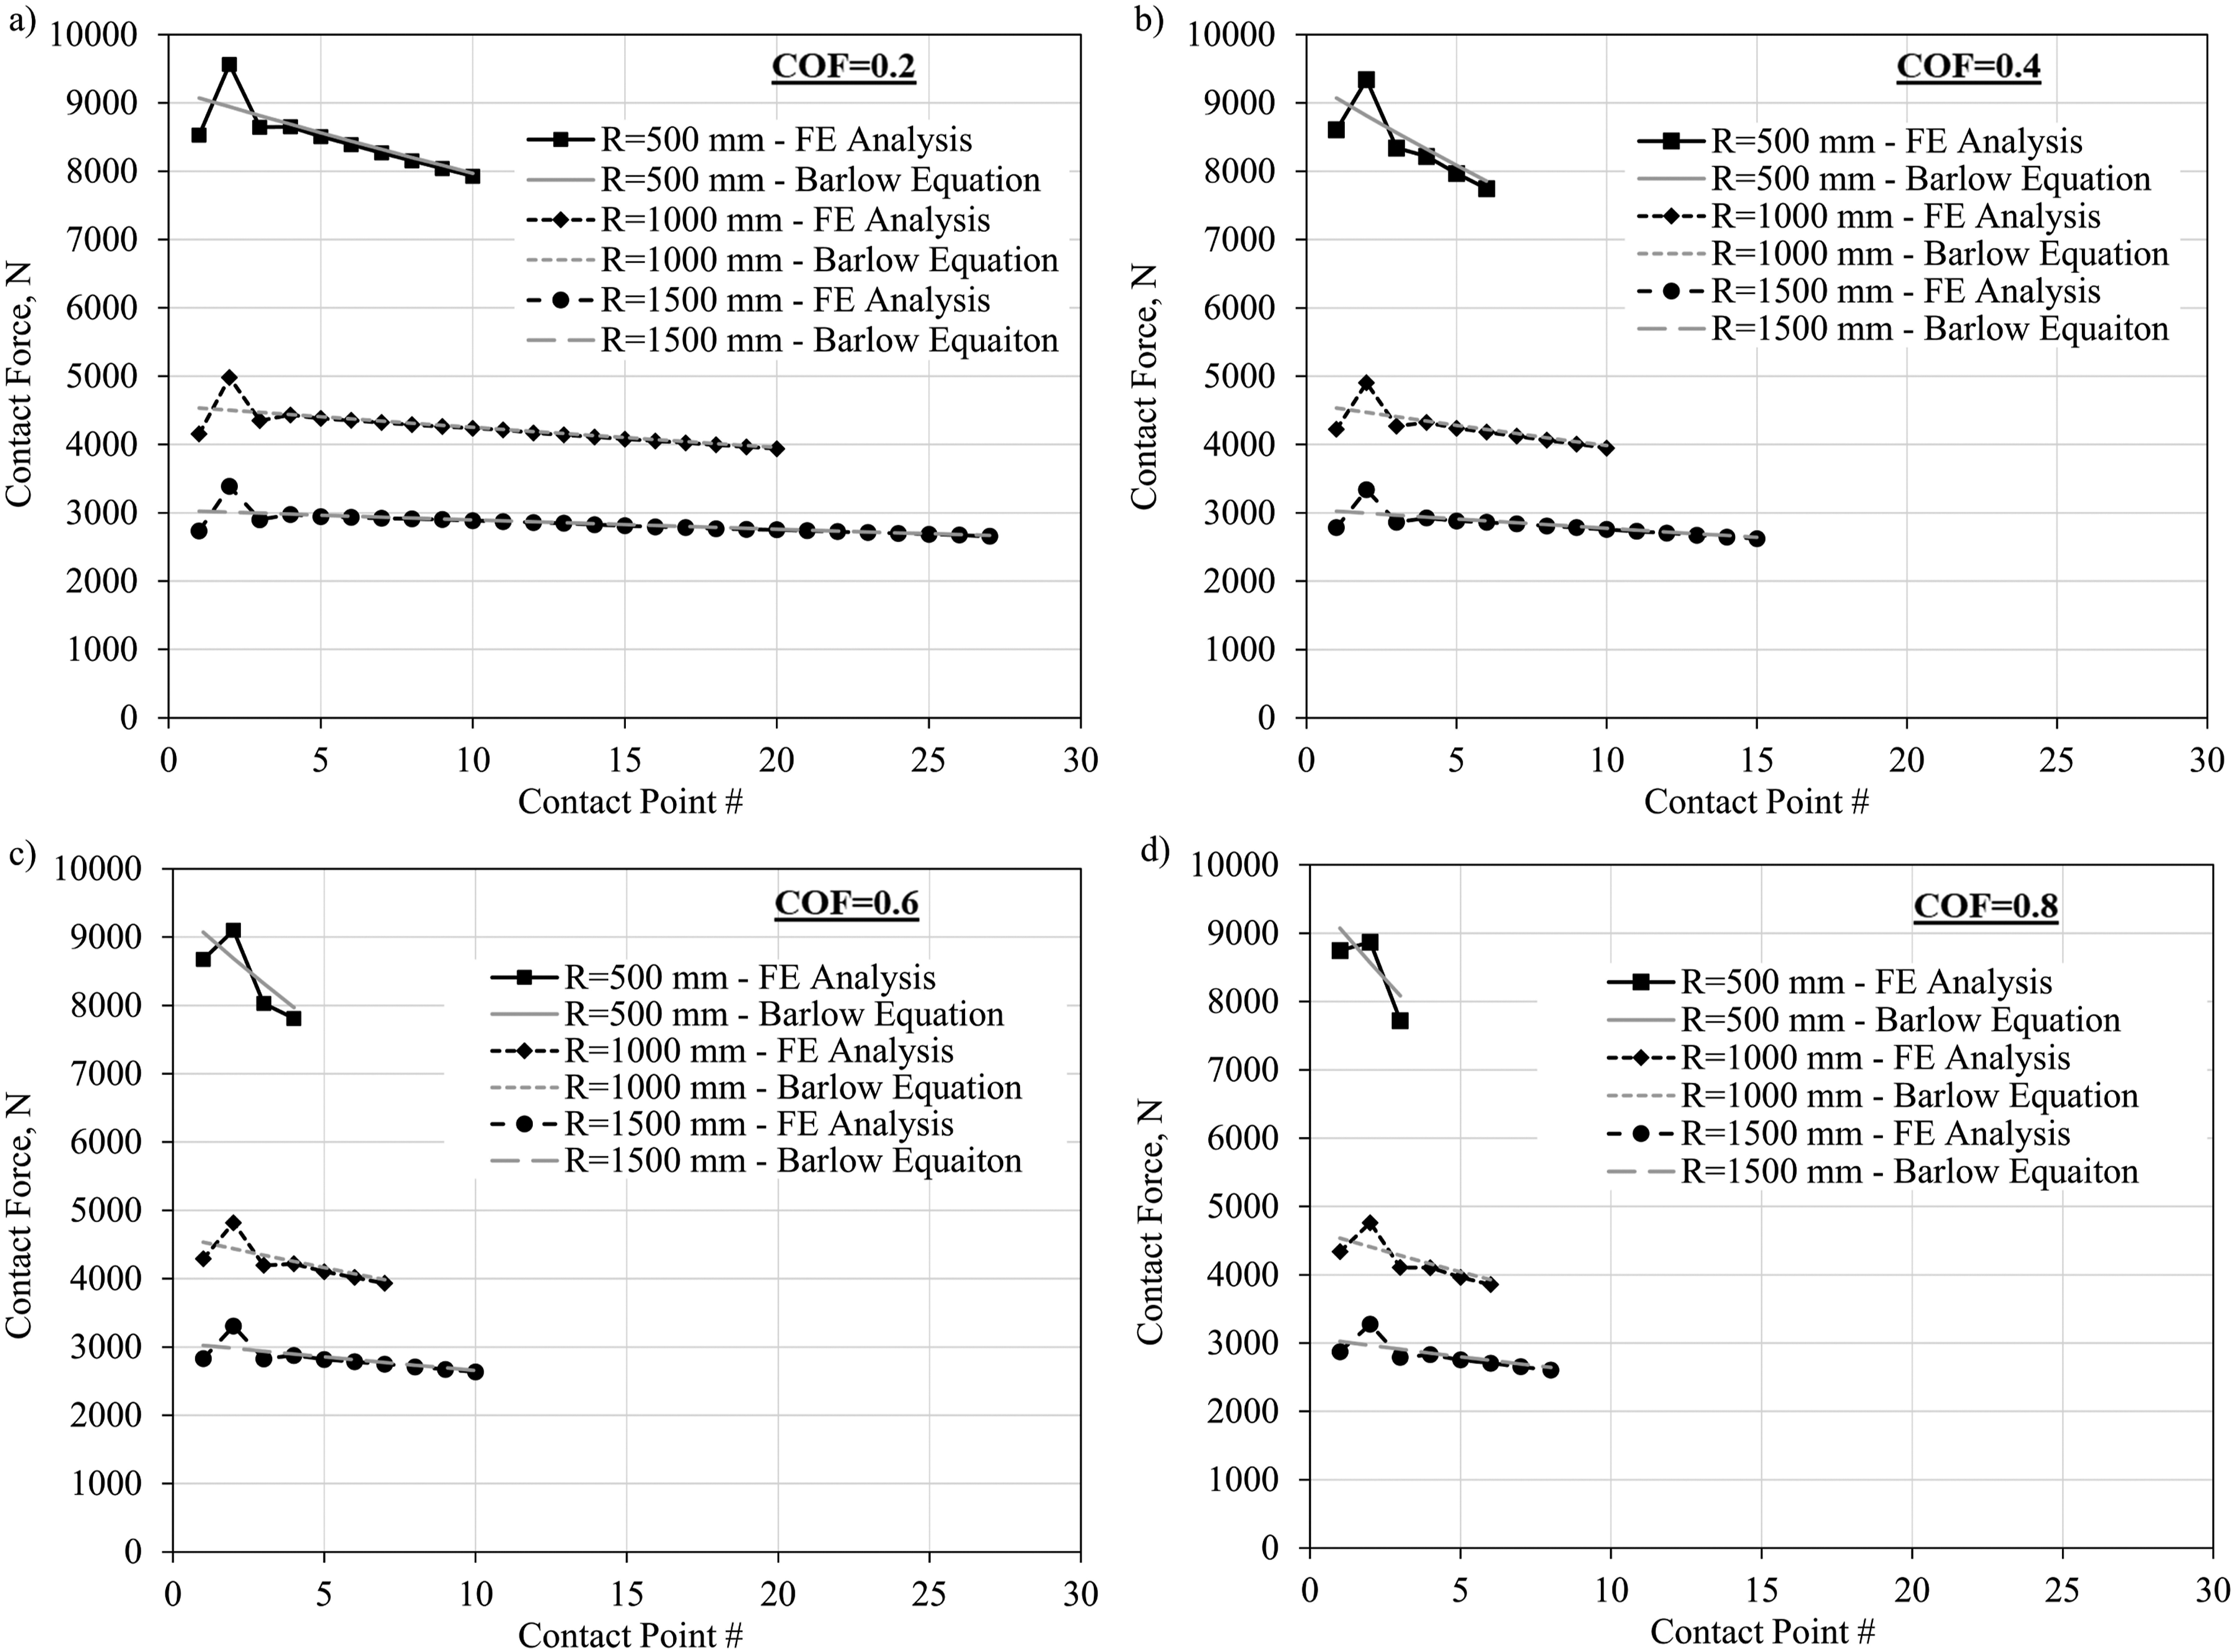
Figure 8 shows the slip displacement results of the discrete model versus the analytical solutions. Looking at the results, the relative slip displacement is higher at the first point (the point that the cable first meets the saddle), and it keeps decreasing until it reaches zero after a few contact points. In other words, it becomes zero for the contact points in the idle zone. Also, it can be seen that a higher saddle radius is associated with a higher number of points in the active region and higher slip displacements. Looking at Figure 8, it can be seen that the FE model results are closer to the analytical solutions after the first two contact points. The difference between the results is smaller for saddle radii of 1000 and 1500 mm. Based on these results, it is concluded that the analytical solution for a cable bent over a sheave can be a good estimate for slip displacements in the regular zone of saddle systems in all cases. Slip displacement results based on the FE model and analytical solution for COFs of 0.2 (a), 0.4 (b), 0.6 (c), 0.8 (d).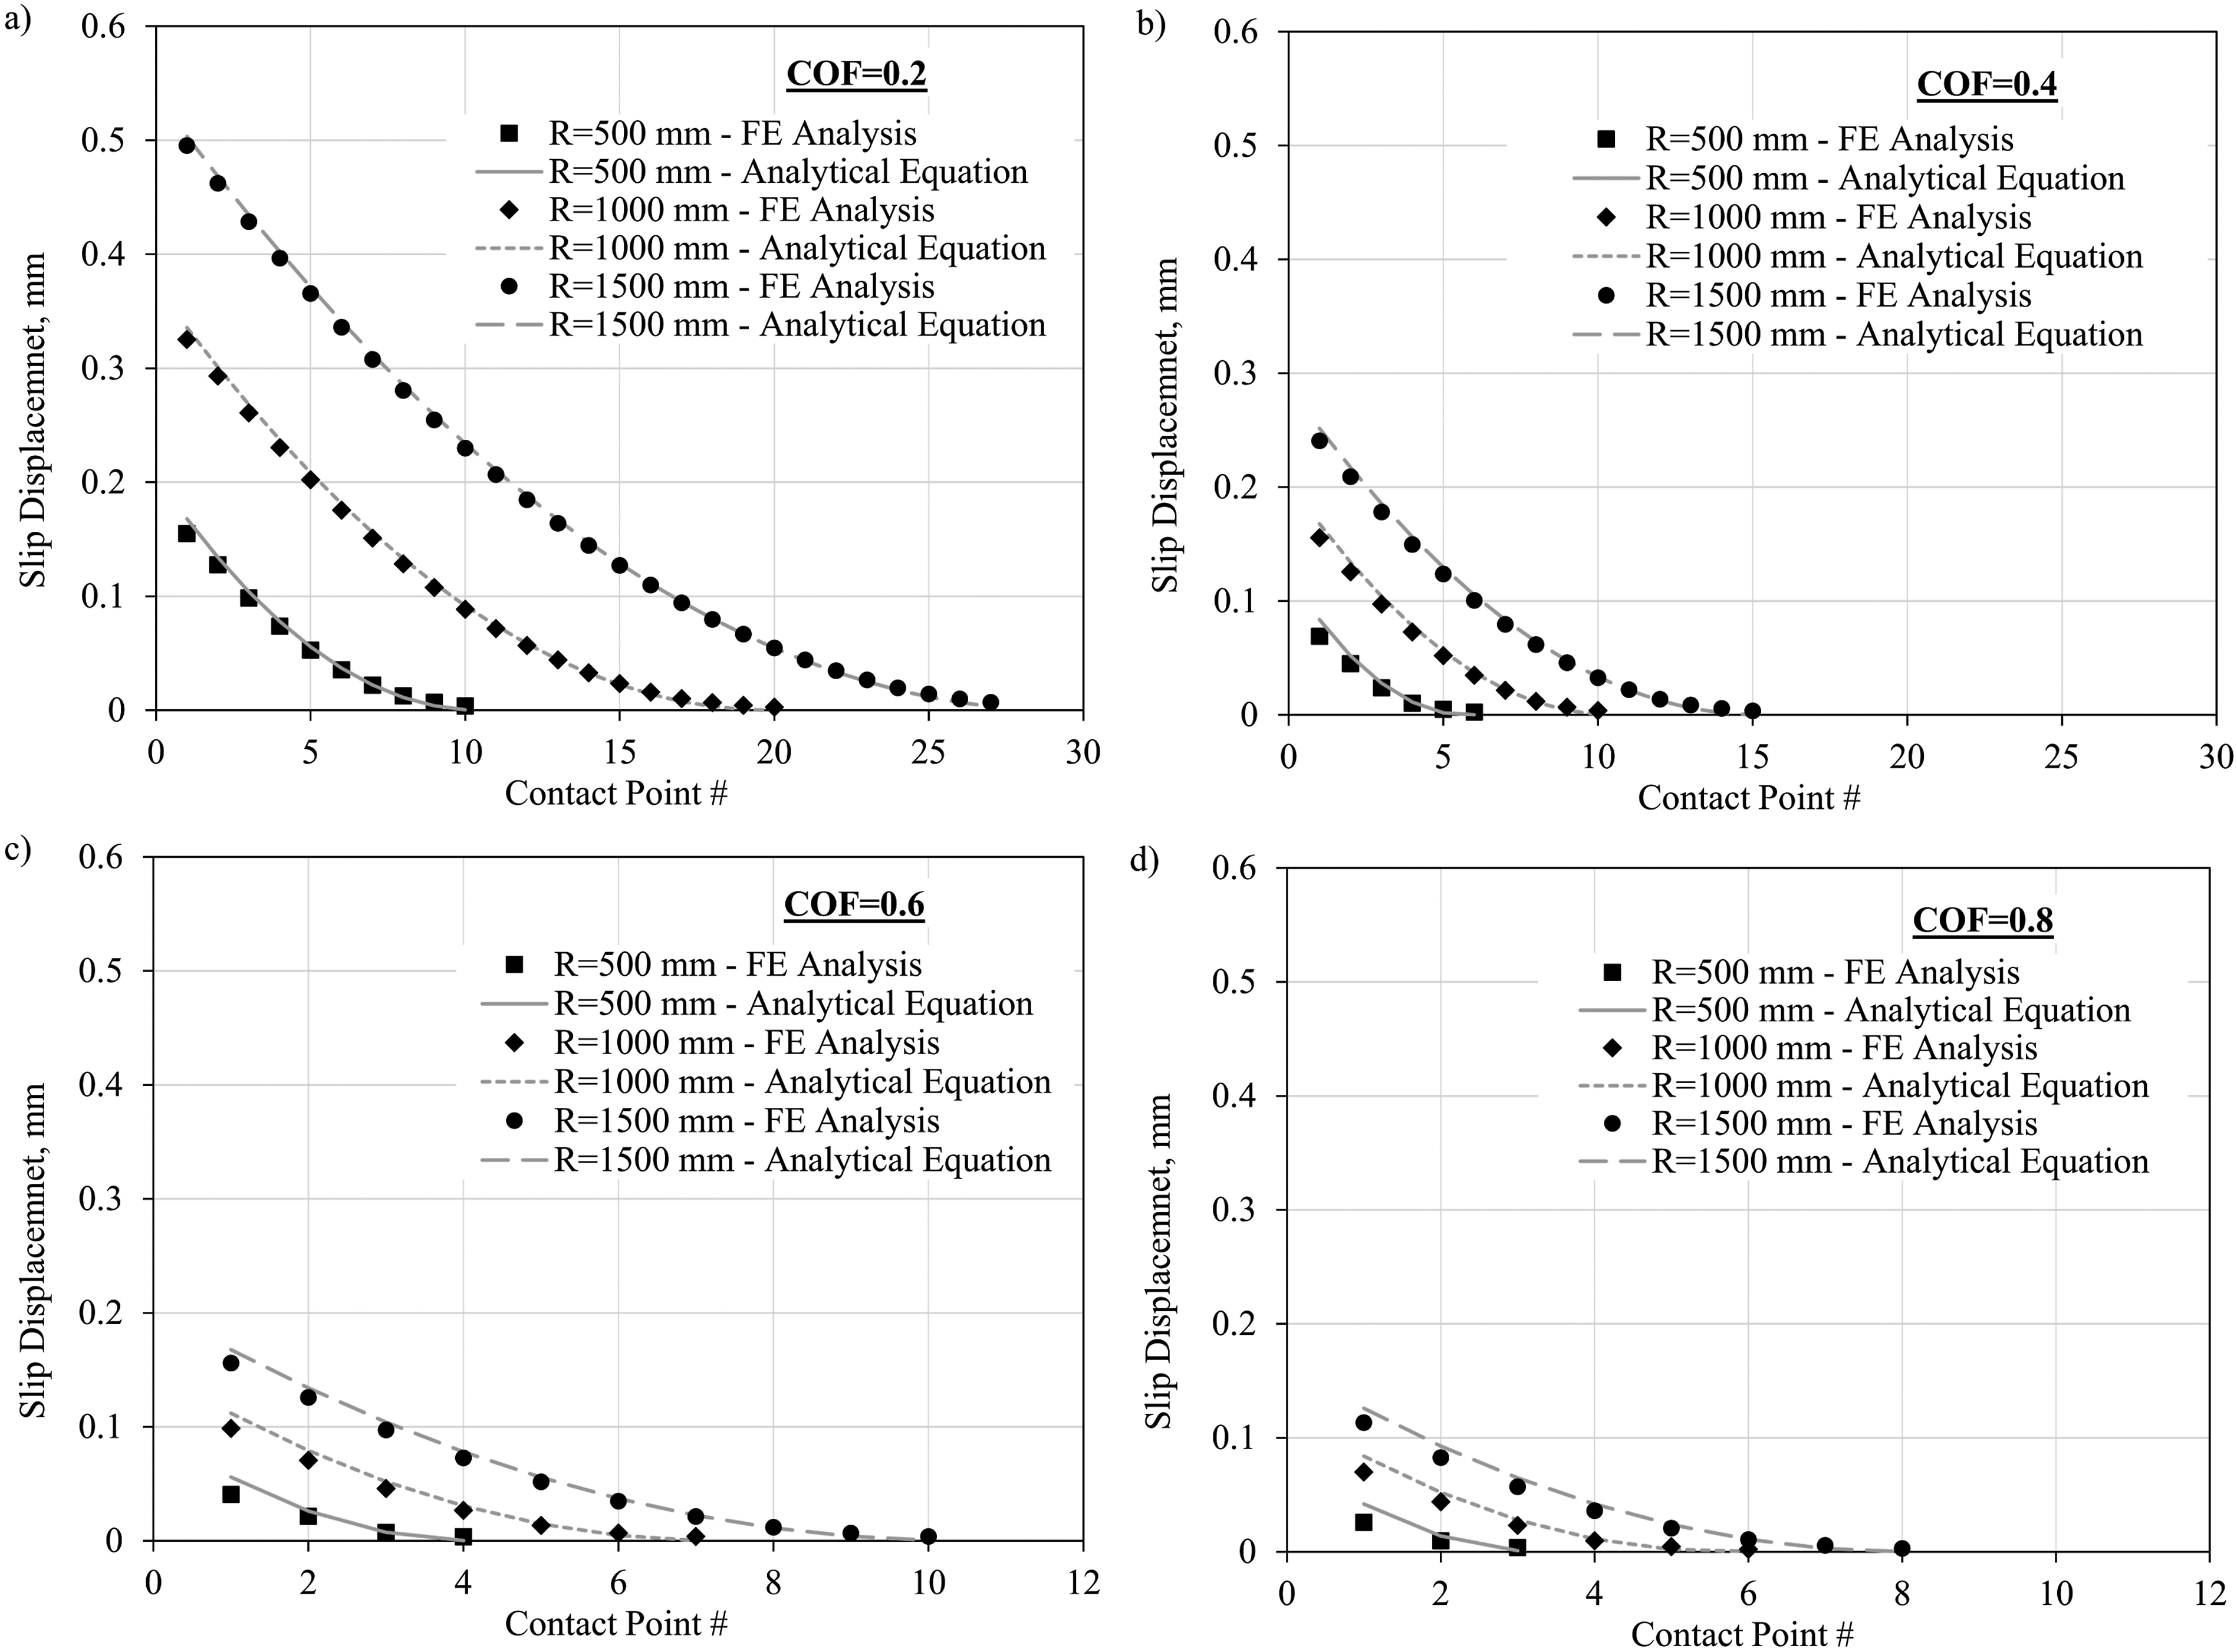
Wear modelling results
Figure 9 shows the effect of wear on the contact force and the slip displacement of a saddle with a radius of 1000 mm and a COF of 0.7. As can be seen, the effect of wear on slip displacement is minimal. However, the contact force results in the irregular region can considerably change by modelling the wear. In this case and other studied cases, the contact forces in the first point decrease while the contact force at the other point increases, especially at the second contact point. Contact force is a critical parameter in determining fretting fatigue life. The fretting fatigue test results at TU Berlin show that the cable usually fails at the second or third contact points. The contact force results presented in Figure 9 can provide an explanation for the failure of the cables at the second or third contact points. The effect of wear on the slip displacements (a) and the contact force distribution (b) for saddle radius of 1000 mm with a COF of 0.7.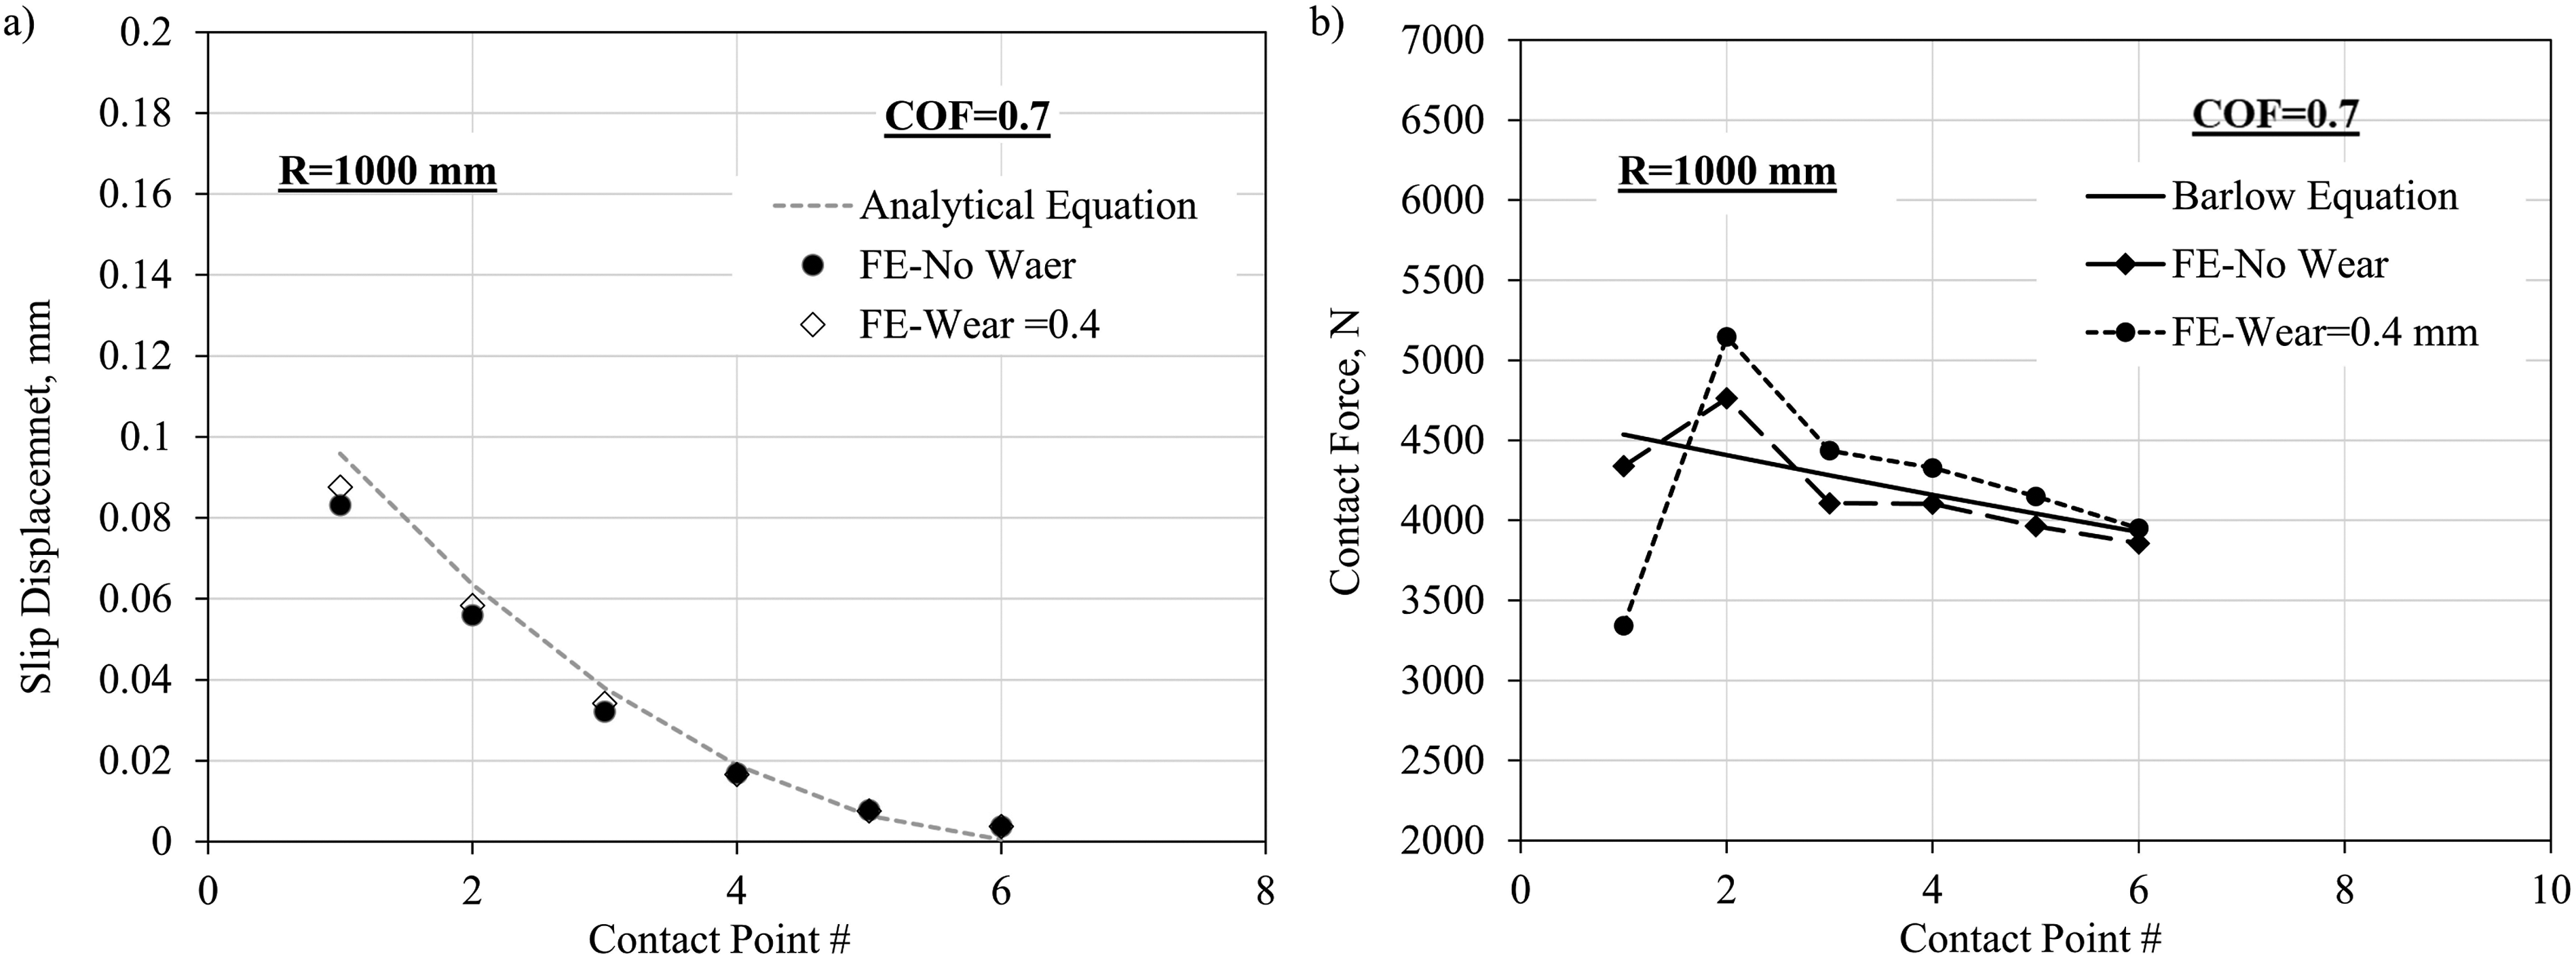
Fretting fatigue life results
Figure 10 shows the SWT results for the saddle radius of 1000 mm and a COF of 0.7 at the first and second contact points. The results are compared for cases with and without wear. As previously discussed, a maximum wear of 0.4 mm was assumed based on the observations in the tests at TU Berlin (Schlaich et al., 2010, 2016). Looking at these figures, it can be seen that the critical location in all cases is at the edge of the contact area, which is very common in fretting fatigue problems. Also, it can be seen that the difference in the results for the first contact point is higher and the critical location of the SWT parameter is slightly different. This is due to the fact that, in the case analysis with wear, the contact force decreases significantly at the first point (See Figure 9(b)) and a lower contact force is associated with a smaller contact area. The closer results in the second contact point can be explained based on Figure 9. Slip displacement and contact force are the determining parameters in these analyses. Looking at this figure, it can be seen that the values of slip displacement and contact force for the second point in cases with and without wear are closer compared to the results for the first point. SWT parameter along the wire centerline for the first (a) and second (b) contact points.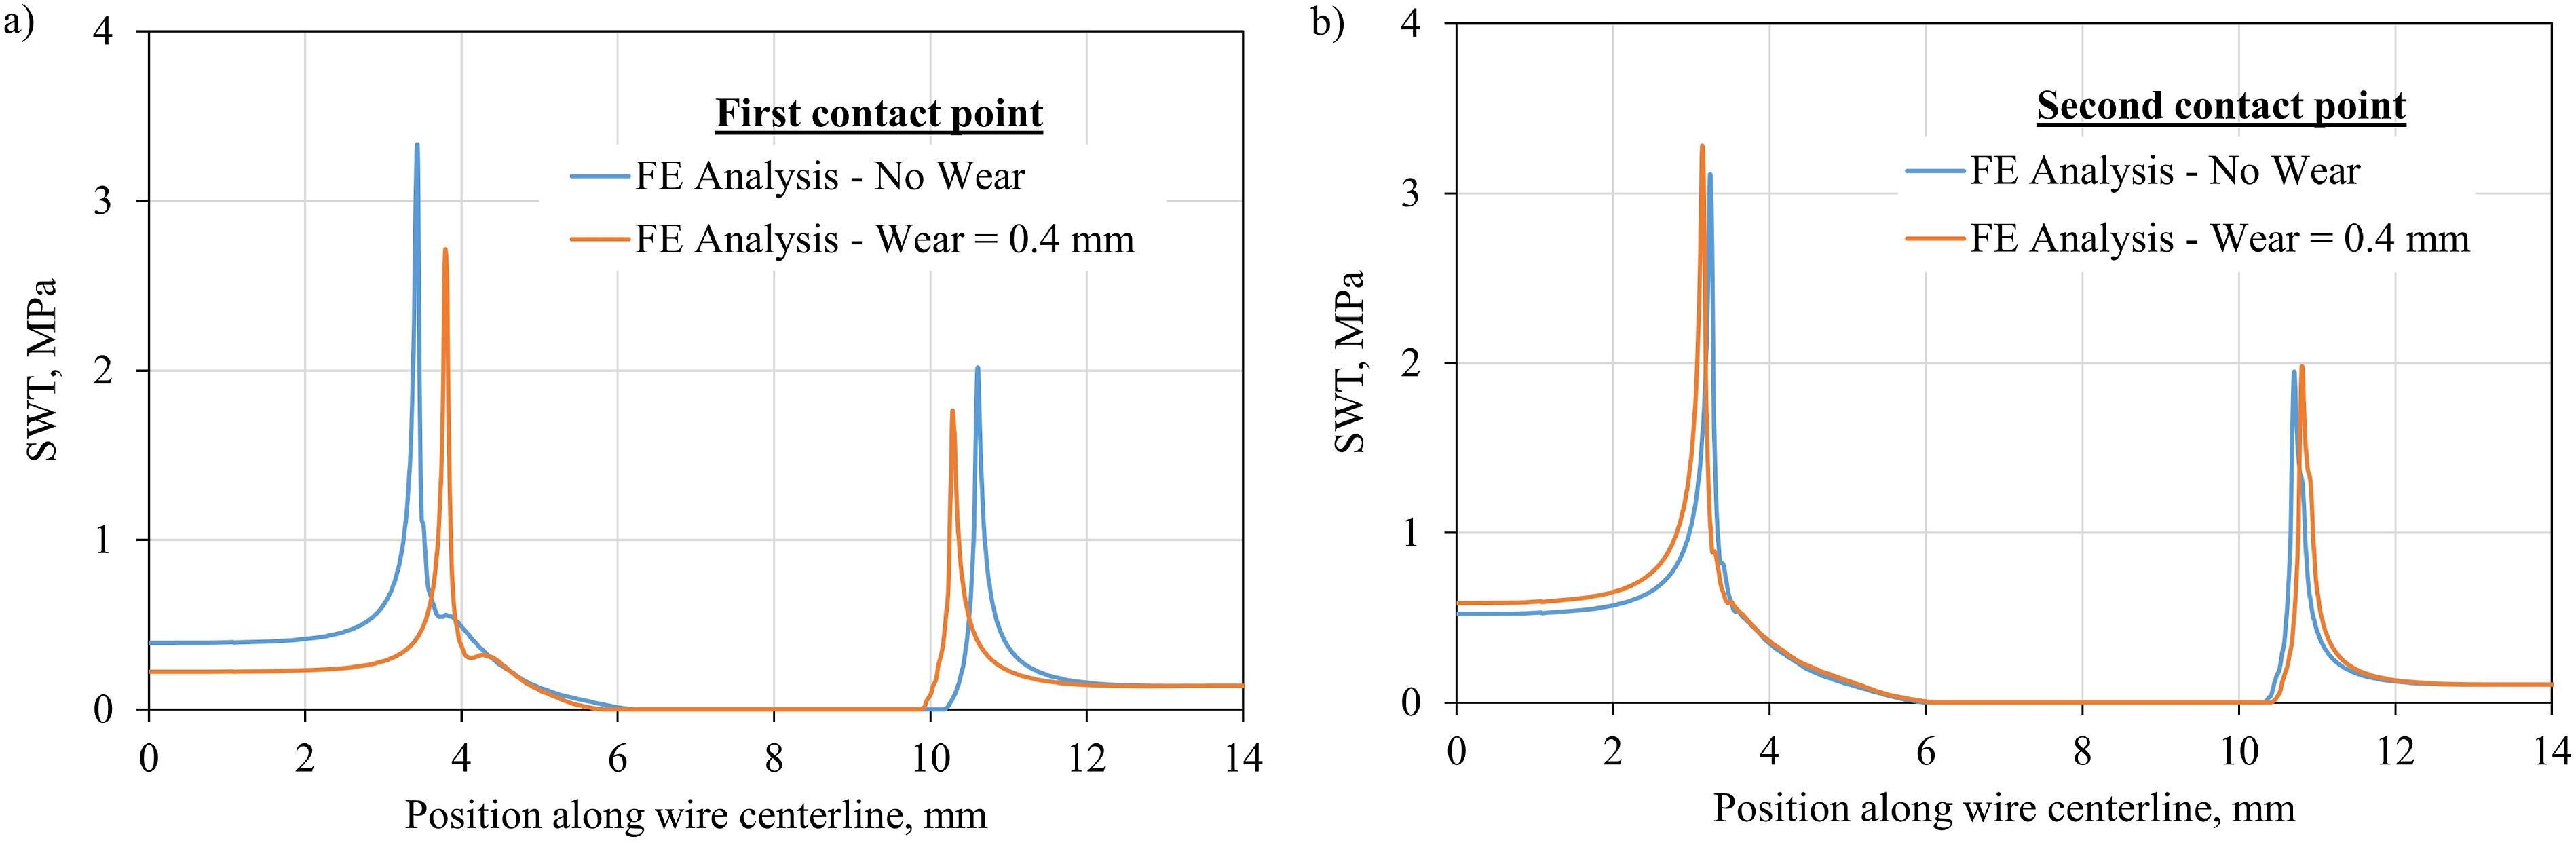
Figure 11(a) shows the SWT parameter results for the first five contact points for the saddle radius of 1000 mm and a friction coefficient of 0.7. The fretting fatigue life results at each contact point is shown in Figure 11(b). It can be seen that the results based on the FE analysis without considering the effect of wear are close to the results based on the analytical models. In both cases, the first contact point is critical. However, when the wear is modelled, the second contact point becomes critical. The fretting fatigue life at the third point is also lower than the life of the first point when wear is modelled, and the life at the fourth point is close to the life at the first point. This prediction is in line with the observation in large-scale tests previously performed at TU Berlin (Moahreb et al., 2016; Schlaich et al., 2016). This trend can be explained by the fact that the high volume of wear at the first contact point decreases the amount of contact force at this point, and consequently, the contact force gets higher at the second contact point. SWT (a) and fretting fatigue life (b) for a saddle radius of 1000 mm and a friction coefficient of 0.7.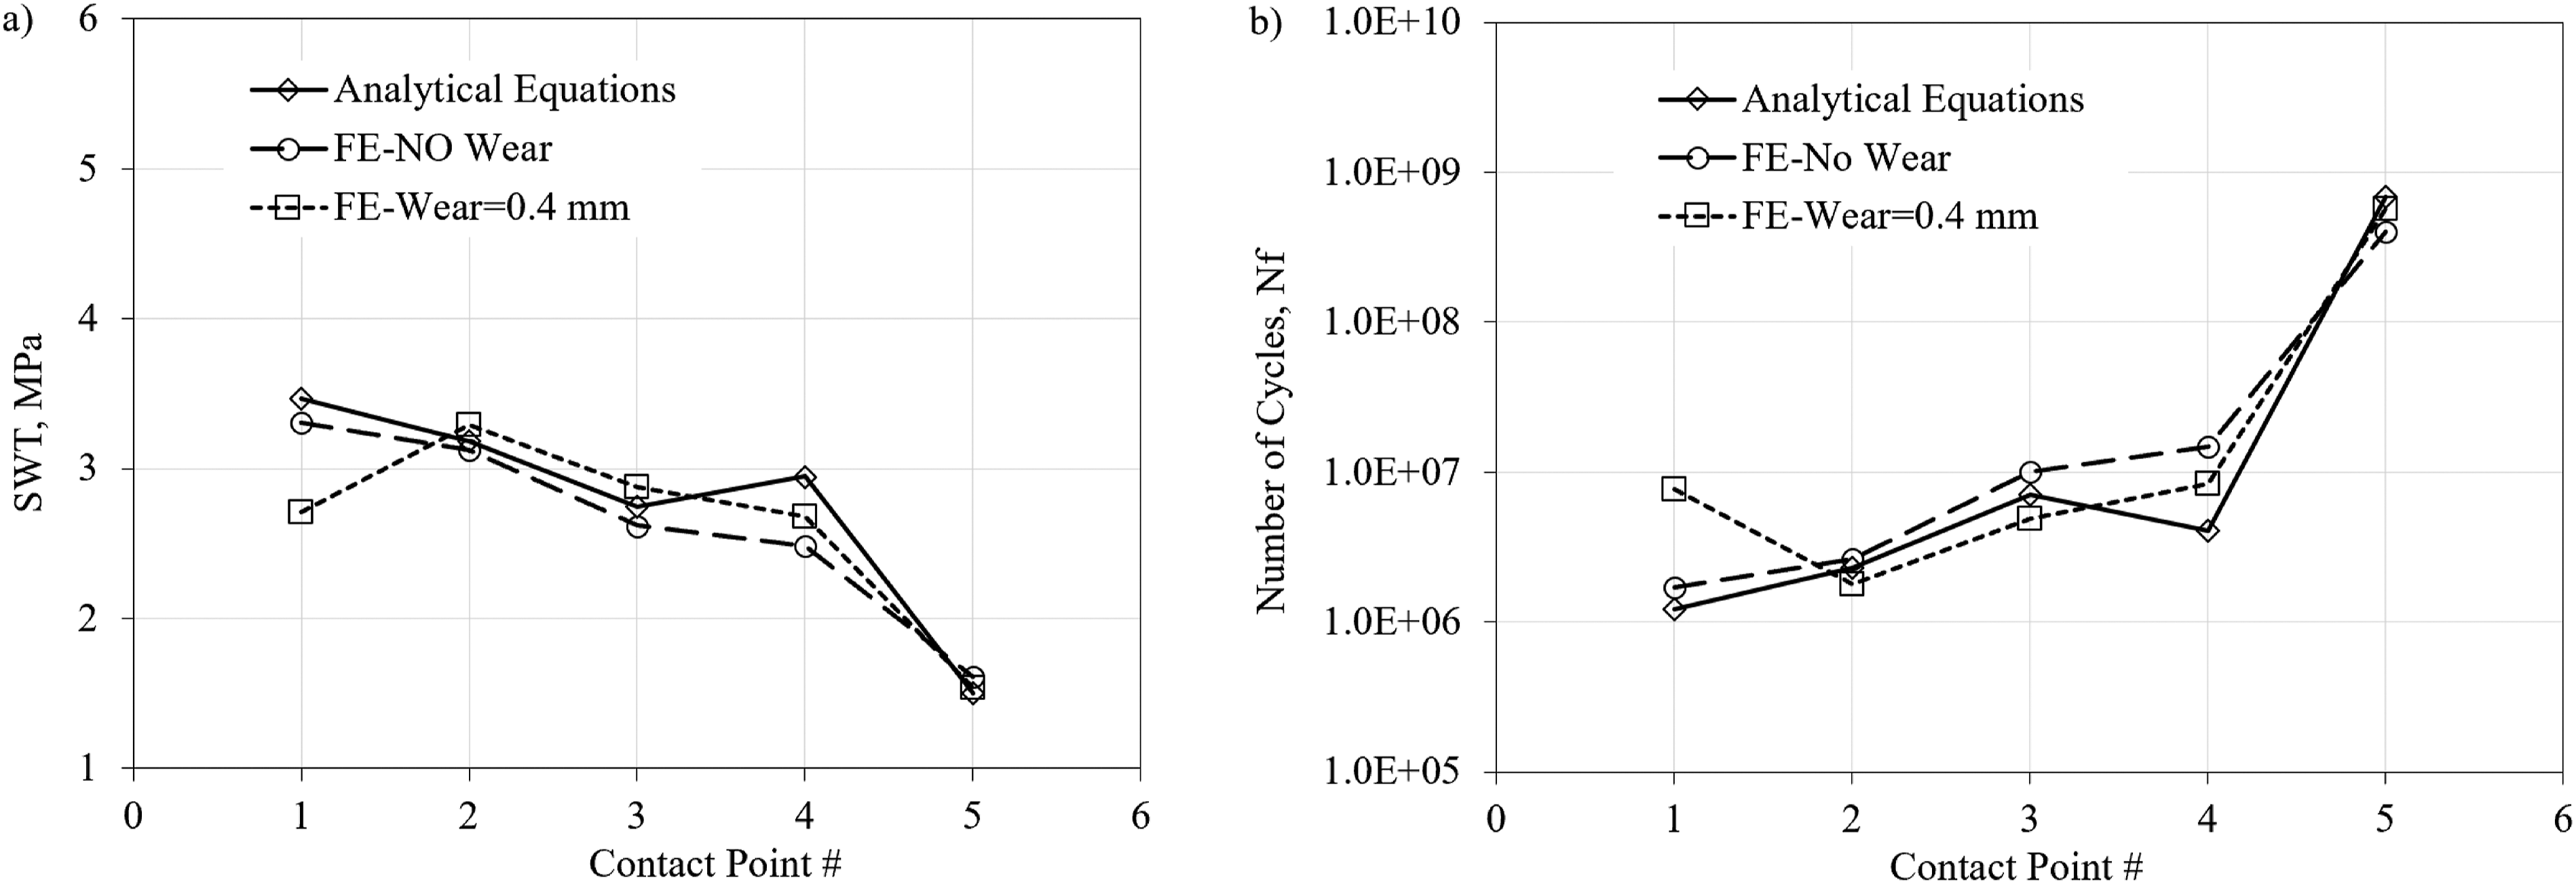
Conclusions
The effect of wear has been previously studied in several engineering problems. However, no previous study can be found on modelling the wear in saddle systems. Also, in typical fretting fatigue problems, wear is usually modelled only at one contact point. However, this paper went over the effect of wear on a system level by modelling it at several contact points. Based on the results of this paper, the following conclusions can be drawn: - The FE model results for the contact forces are close to the results of the closed-form equations in the regular region of the contact area. However, the contact forces in the irregular region cannot simply be determined using the developed analytical solutions. Thus, the use of FE analysis may be necessary for this purpose. - The FE results showed that the additional term for the contact force in the irregular region should not be considered for only a single contact point. This additional component distributes between the first few contact points. Based on the results of this study, the second contact point, typically, has the maximum contact force. - Wear is an important parameter that can affect the contact force distribution at the contact points in the irregular region (i.e., the first few contact points). The results showed that wear decreases the contact force at the first point and transfers it to the next few contact points. The effect of this wear on the predicted fatigue life can be significant. - The analytical solutions for evaluating the slip displacement of a rope bent over a sheave closely match the FE model results for saddle systems. The effect of considering wear was also found to be minimal. Thus, it can be concluded the analytical solutions are sufficient for predicting slip displacements, as the use of more sophisticated methods (e.g., FE analysis) makes little difference. - Initially, the fretting fatigue life at the first contact point was found to be critical. However, when the effects of wear are incorporated, the fretting fatigue life at the second contact point becomes critical as the contact force significantly increases at this point due to the wear process. This finding is corroborated by the failure locations and test observations from full-scale saddle fatigue tests reported in (Schlaich et al., 2016).
Overall, wear is a significant parameter in fretting fatigue behaviour of saddle systems and incorporating that in a finite element model of the problem is required to determine the slip displacements and contact forces with a high accuracy. The models discussed in this paper can be employed in multiple ways. Slip displacement and contact force results can be used as boundary conditions of a 3D interface FE model of a contact point between the cable and the saddle (see Figure 6). This interface model enables fretting fatigue analysis based on several approaches (e.g., multiaxial stress approach using SWT, and linear elastic fracture mechanics). Also, the models discussed in this paper enable us to provide a link between the test results of a full-scale saddle system and the test results of a small-scale test. One can design a small-scale test in which only a wire rubs against two pads (Chehrazi et al., 2023). These models can be used to determine the contact force and slip displacement that should be used in a small-scale test to represent a contact point in a large-scale test.
Footnotes
Acknowledgments
The authors would like to acknowledge Profs. Michael Schlaich and Arndt Goldack and Dr. Sherif Mohareb, as well as the Alexander von Humboldt Foundation, for facilitating the research collaboration in 2016-17 that inspired the research presented in this paper.
Declaration of conflicting interests
The author(s) declared no potential conflicts of interest with respect to the research, authorship, and/or publication of this article.
Funding
The author(s) received no financial support for the research, authorship, and/or publication of this article.
Data availability statement
The data that support the findings of this study are available from the corresponding author, AC, upon reasonable request.