
Abstract
A novel investigation into the impact of the tower road-sign gantry and the tower shielding on double-decker buses and trucks passing by the bridge tower based on a previously validated full-scale CFD model. Two sets of simulations were conducted for comparison of aerodynamic force conditions of vehicles as they pass by the bridge tower: first group of simulations were performed including and excluding the road-sign gantry; and the second group include and exclude the tower shielding. Conditions in different traffic lanes (one on leeward side and two on windward side) considered. The effect of changes in wind yaw angle are also considered. Mechanism exploration on the variation of vehicle aerodynamic force conditions was made based on the numerical visualization of wind velocity field and pressure field. Novel results suggest that the road-sign gantry provides a sheltering effect in some circumstances, but a destabilizing effect in others. In addition, the tower shielding shows significant impact on reducing aerodynamic forces and sudden force changes of the high-sided vehicles while they are passing by the bridge tower.
Introduction
Modern transportation networks are constantly evolving, in which long span bridges have become an essential and pivotal component. Connections over deep valleys and seas reduce travel time and cost significantly. However, due to the open and exposed nature of the areas around long span bridges, complex wind conditions are a major threat for the safety of traffic on bridges. Understanding the aerodynamics of vehicles, especially high-sided vehicles, on bridges is crucial for ensuring that they can be safely operated in various weather conditions (Chen, S.R. and Cai, C.S., 2004). Sudden changes in the aerodynamic force of vehicles can cause increasing risk of accidents such as overturning and sideslip (Snæbjörnsson et al., 2007). Thus, the passage of vehicles by bridge towers, which cause sudden changes in aerodynamic forces, attracts a large amount of interest from engineers and researchers. Devices such as wind shields tend to be located at both the edges of the bridge and next to the bridge tower to mitigate the impact from crosswinds on vehicles (Argentini et al., 2011; Zhang et al., 2021a; Zhu et al., 2023). Variable flows formed by the wind shields, along with the shielding effects of the bridge tower itself, make the wind field near the tower region complicated and unpredictable (Zhou, Q. and Zhu, L.D., 2020) and worthy of detailed investigation. For instance, Yu et al. (2019) created a probability-based model to assess the risk to a vehicle experiencing gusty crosswinds in the wake of abridge tower. Numerical studies of a typical two-axle road vehicle illustrated that sudden changes in wind loads in the wake of a bridge tower significantly contributed to the occurrences of sideslip or overturning accidents. In these instances, drivers need to be able to react quickly to maintain control of the vehicle. Zhang et al. (2015) proposed a method to analyse a coupled wind-vehicle-bridge system taking account of the shielding effect of the bridge tower. It is worth noting that wind loads induced by the bridge tower have a significant effect on the vehicle accelerations, but only a slight effect on the bridge and vehicle vibrations.
Many experimental aerodynamic studies of vehicles passing bridge towers have been performed using wind tunnel tests. For instance, Wu et al. (2022) analysed a high-speed train passing by a bridge tower in a wind tunnel at a scale of 1:30 and studied the effects of wind speed, train speed, and wind yaw angle. The shielding effect of the tower on the train was successfully captured and results showed that the width of the bridge had a greater effect on train aerodynamic coefficients than the width of the tower, and that the train speed had greater effect than the incoming wind speed. Charuvisit et al. (2004) investigated the characteristics of the aerodynamic forces acting on a truck passing through the wake of a bridge tower using wind tunnel experiments with 1:30 scaled models. Various wind speeds, wind directions and types of towers were considered. They found that the corner-cut tower produced a narrower wake than the rectangular and tapered towers when the wind was normal to the bridge. For other wind directions, similar flow separation occurred for all the three towers, which resulted in similar aerodynamic forces acting on the truck. Moreover, the angle of 30 degrees was suggested to be the wind direction which would induce the greatest changes in aerodynamic forces acting on the truck model. Argentini et al. (2011) conducted wind tunnel tests on 1:40 scaled models to study the aerodynamic cross-wind effects on a truck when it crossed the wake of a bridge tower. The forces and surface pressures of the truck model were measured, and results suggested that an amplification of the aerodynamic force can occur when the truck is directly in the wake of the tower. Li et al. (2013) developed a wind tunnel test rig with moving train models to investigate sudden changes in the aerodynamic forces when the train was passing by the bridge tower. Measurement results suggested that drag and lift coefficients were higher when trains were moving along the rail track near to the bridge tower. Further away from the bridge tower higher rates of sudden changes of aerodynamic forces acting on the train were found. In addition, increasing the velocity of the train tended to make the sudden change of the drag coefficient of the train smaller. While wind tunnel tests provide valuable insights into the flow behaviour, they are often expensive and time-consuming. Limitations in wind tunnel tests can result in large differences in the results compared to reality. For instance, details of geometries, such as handrails, tend to be neglected or oversimplified due to small scales. The existence of these secondary structures can cause significant aerodynamic effects (Zhang et al., 2021b). Data collection in wind tunnel tests can be problematic, since the presence of sensors and other apparatus may interfere with the flow (Jing et al., 2017).
With the advancement of CFD methods in recent years, it has become possible to simulate the complex flow field without the aforementioned limitations of wind tunnel tests. CFD simulations can be used to perform detailed analysis of the flow field and can provide insights that are difficult to obtain experimentally. CFD has been widely adopted to investigate vehicle-bridge interaction problems (He et al., 2022; Sterling et al., 2010; Yao et al., 2020), in particular the effects of crosswinds on vehicles (Baker et al., 2009; Wang et al., 2013, 2022). However, very little research has been done on simulating the aerodynamic behaviour of vehicles passing by bridge towers, which has the potential to improve our understanding of vehicle stability and safety on bridges in high winds. Huang et al. (2023) investigated the aerodynamic stability of cars passing through the wake region of a bridge tower at high speed under different road adhesion and crosswind conditions. Results from simulations indicated that lower values of road adhesion coefficient translated into significant deflections and deviations of the vehicle which led to significant change in flow field around the vehicle. Using a similar method, Wang et al. (2021) conducted scaled CFD simulations coupled with multibody dynamics models to investigate the aerodynamic performance and dynamic response of a car passing by a bridge tower in crosswinds. The car was moving in the simulation which was achieved by an overlapping grid technique. Simulation results were validated with wind tunnel tests results and parametric studies. The numerical prediction showed that the car drifted sideways by 2.38 m if driver-action was not taken in time while passing by the tower under 10 m/s crosswinds. Salati et al. (2018) performed CFD simulations on a 1:10 scaled truck travelling at 10 m/s passing by a bridge pylon using a moving mesh approach. The side force and yaw moment acting on the truck were determined for a vehicle approaching and leaving the tower wake under a 10 m/s uniform wind profile. The increase in force conditions was as high as 50%, with a sudden 30% reduction occurring when the truck was in the middle of the wake. Wang et al. (2014) created a 1:25 scaled CFD model of a stationary truck immersed in the wake of a bridge tower of the Xiangshan Port Bridge. Numerical results of aerodynamic force coefficients of the truck were compared with wind tunnel test results. Although significant shielding effects of the tower on the aerodynamic forces of the vehicle were found and validated, the authors suggested that further advanced simulation schemes were required to improve the performance and the verification of CFD simulations.
To the best of the authors’ knowledge, the effects of tower wind shields and road-sign gantries in the wake region of the bridge tower have not been investigated numerically or experimentally, especially at full-scale, which is believed to be more representative of realistic conditions. In this study, the full-scale Queensferry Crossing Bridge CFD model, which was developed and validated previously (Zhu et al., 2023), was used to investigate the impact of road-sign gantries and tower wind-shielding on the force conditions of double-decker buses and trucks as they pass by the bridge tower. Two sets of RANS simulations were conducted for comparison of the aerodynamic force conditions of vehicles (with and without the road-sign gantries and tower wind-shielding). Since the prevailing winds of the site are from the southwest, wind yaw angles between 180 and 270 degrees were selected for analysis. Mechanism exploration on the variation of vehicle aerodynamic force conditions was made based on the numerical visualization of wind velocity field and pressure field. The full-scale CFD simulations showed good potential at providing valuable insights on this problem which are complicated and inconvenient to investigate in the field. Numerical results showed that, as the vehicle passes by the bridge tower, the road-sign gantry provided a sheltering effect to vehicles (increasing on aerodynamic force conditions) in some circumstances, but a destabilizing effect (decreasing on aerodynamic force conditions) can occur as well. Moreover, the tower wind-shielding showed significant efficient on protecting vehicles from complicated wind conditions at the tower region. Therefore, it is worth emphasising the necessity and significance on investigating wind effects of secondary facilities to traffic and bridges.
The Queensferry Crossing bridge
The long-span Queensferry Crossing (formerly the Forth Replacement Crossing) is a road bridge which was opened in August 2017 in Scotland, United Kingdom. Figure 1 It connects the traffic across the Firth of Forth between Edinburgh, at South Queensferry, and Fife, at North Queensferry. It is the longest three-tower cable-stayed bridge in the world with the total length of 2.7 km. It also has the highest tower in the UK and the height of each tower is 210 m. Overall, it is the biggest infrastructure project in Scotland in over a generation. View of the Queensferry Crossing bridge (The Forth Bridges, 2014).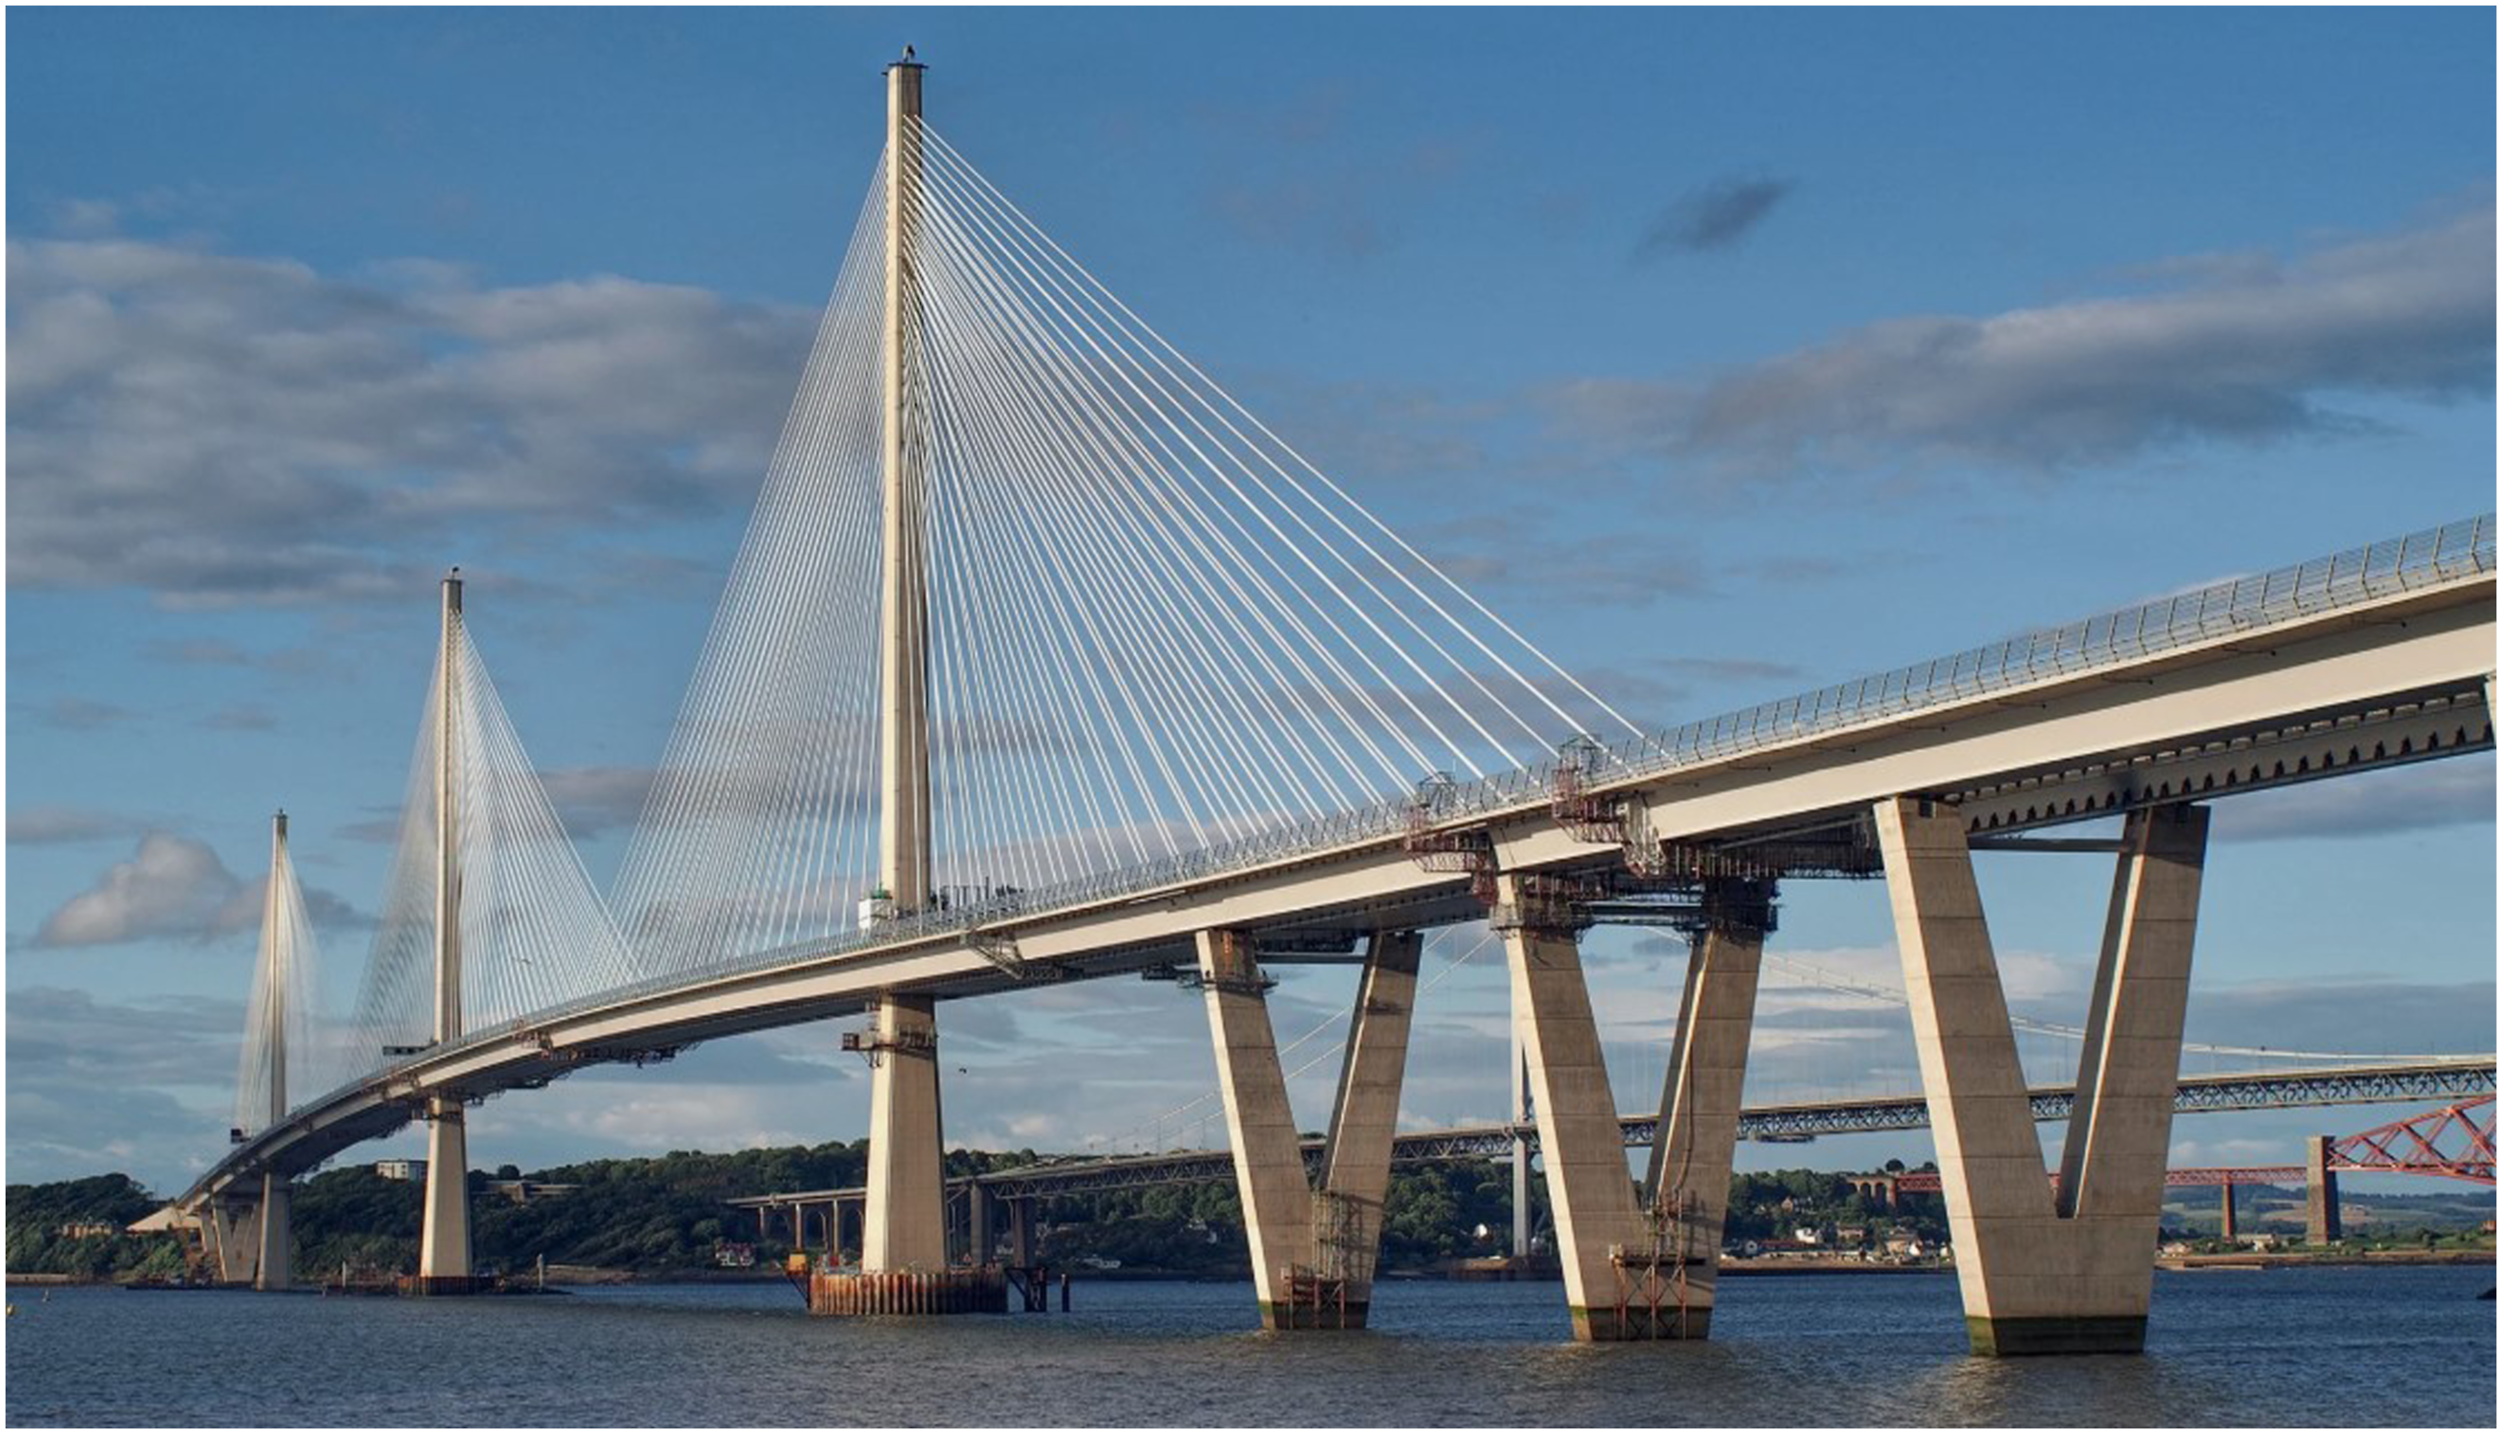
Bridge tower region configuration
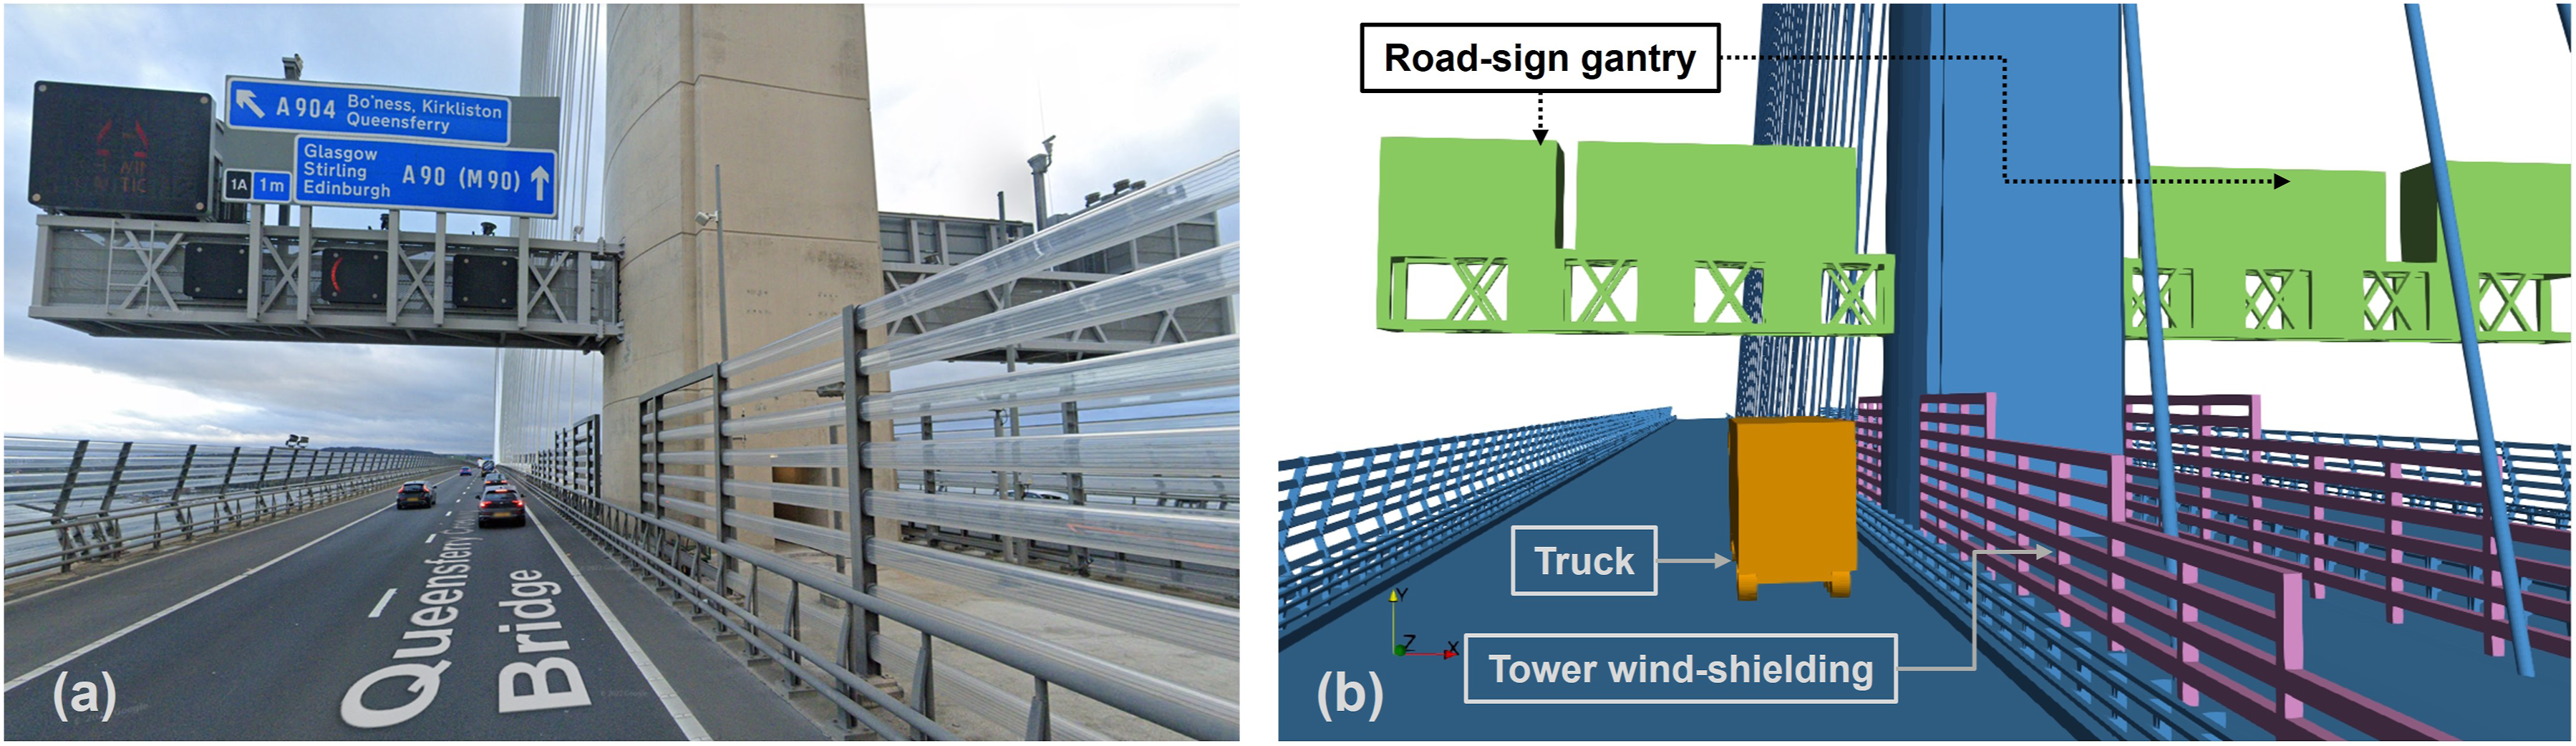
The Queensferry Crossing bridge is a vehicle-only bridge that carries motorcycles, cars, and high sided vehicles. The bridge is built to motorway-standard to carry the M90 across the Forth. It is the biggest infrastructure project in Scotland for a generation as the structure spans 2.7 km making it the longest three-tower, cable-stayed bridge in the world. The width of the deck is 41.7 m with wind shields and guard rails on both sides (Figure 2c). There is a dual two-lane carriageway with hard shoulders on each side of the deck. As shown in Figure 2(a), three lanes were chosen in this study, Lane one was on the leeward side and the other two on the windward side. On each side of the bridge tower, a steel gantry carries the road signs and display screens. Tower wind-shielding has been built along the carriageway at the near tower region to protect the traffic in high winds (see Figure 2(b)). Schematic of full-scale bridge tower region configuration (all dimensions in m): (a) tower region cross section, (b) tower wind-shielding (side view) and (c) deck cross section.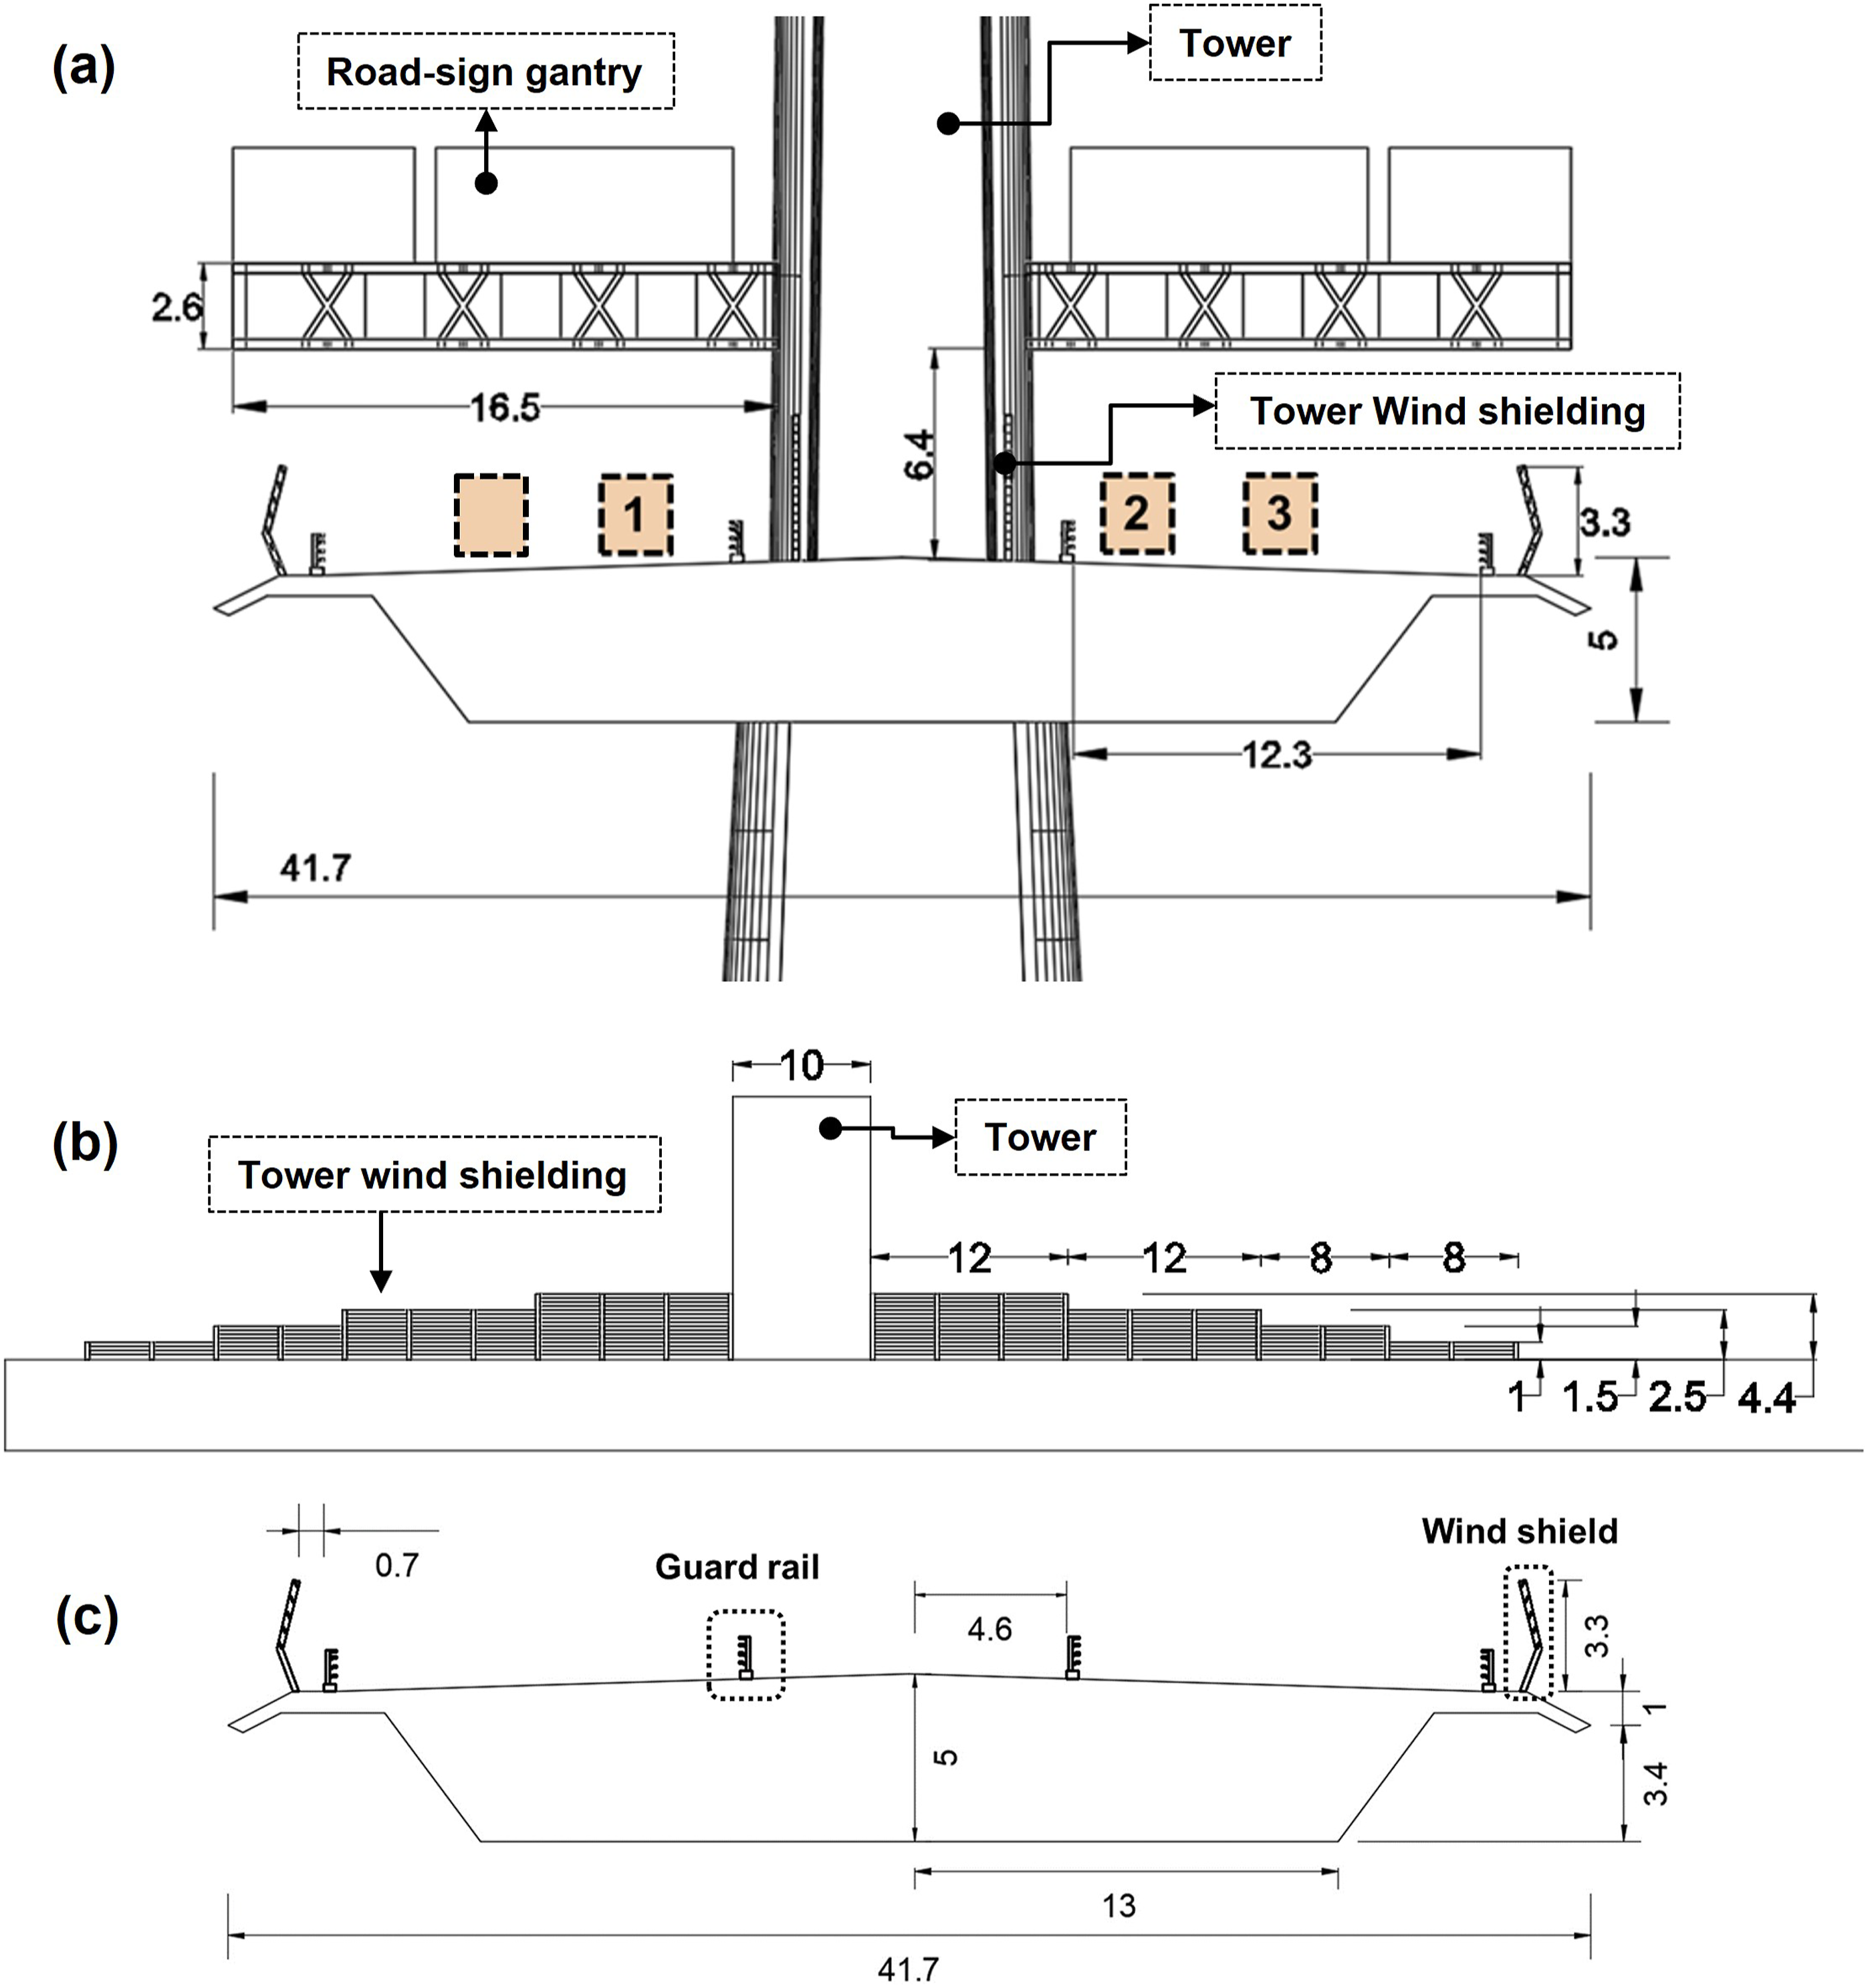
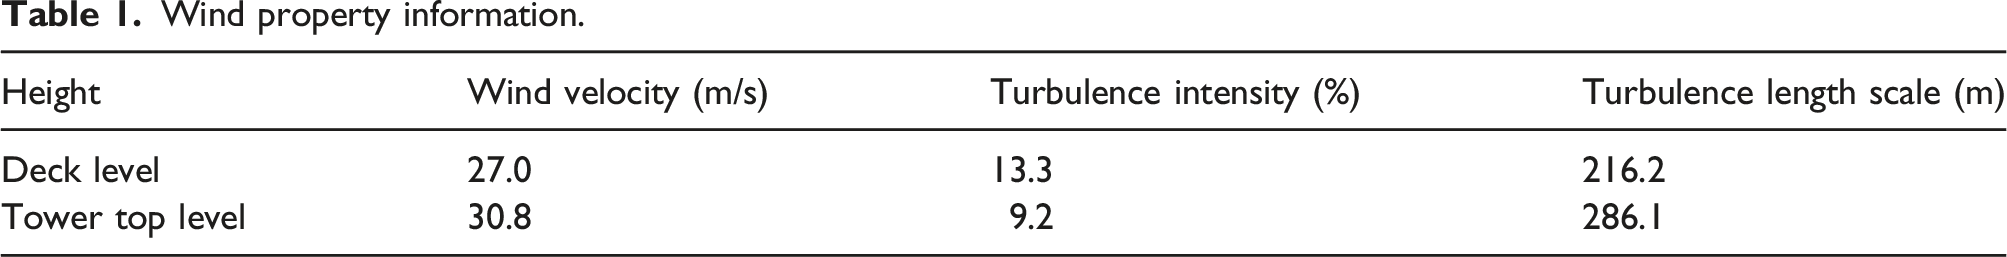
Wind condition at the bridge site
Wind property information.
CFD simulations
The full-scale 3D CFD model used in this study was proposed and validated with field data from the Queensferry Crossing in the authors’ previous work (Zhu et al., 2023). The hypothesis is that analysing wind-vehicle-bridge interaction problems at reduced scales violates the laws of similarity, particularly of Reynolds numbers and Strouhal number. This is a particular challenge in relation to the current practice of using wind tunnel tests, as when the geometry is scaled to fit inside the wind tunnel, it is very challenging to also scale the wind velocity.
Geometries
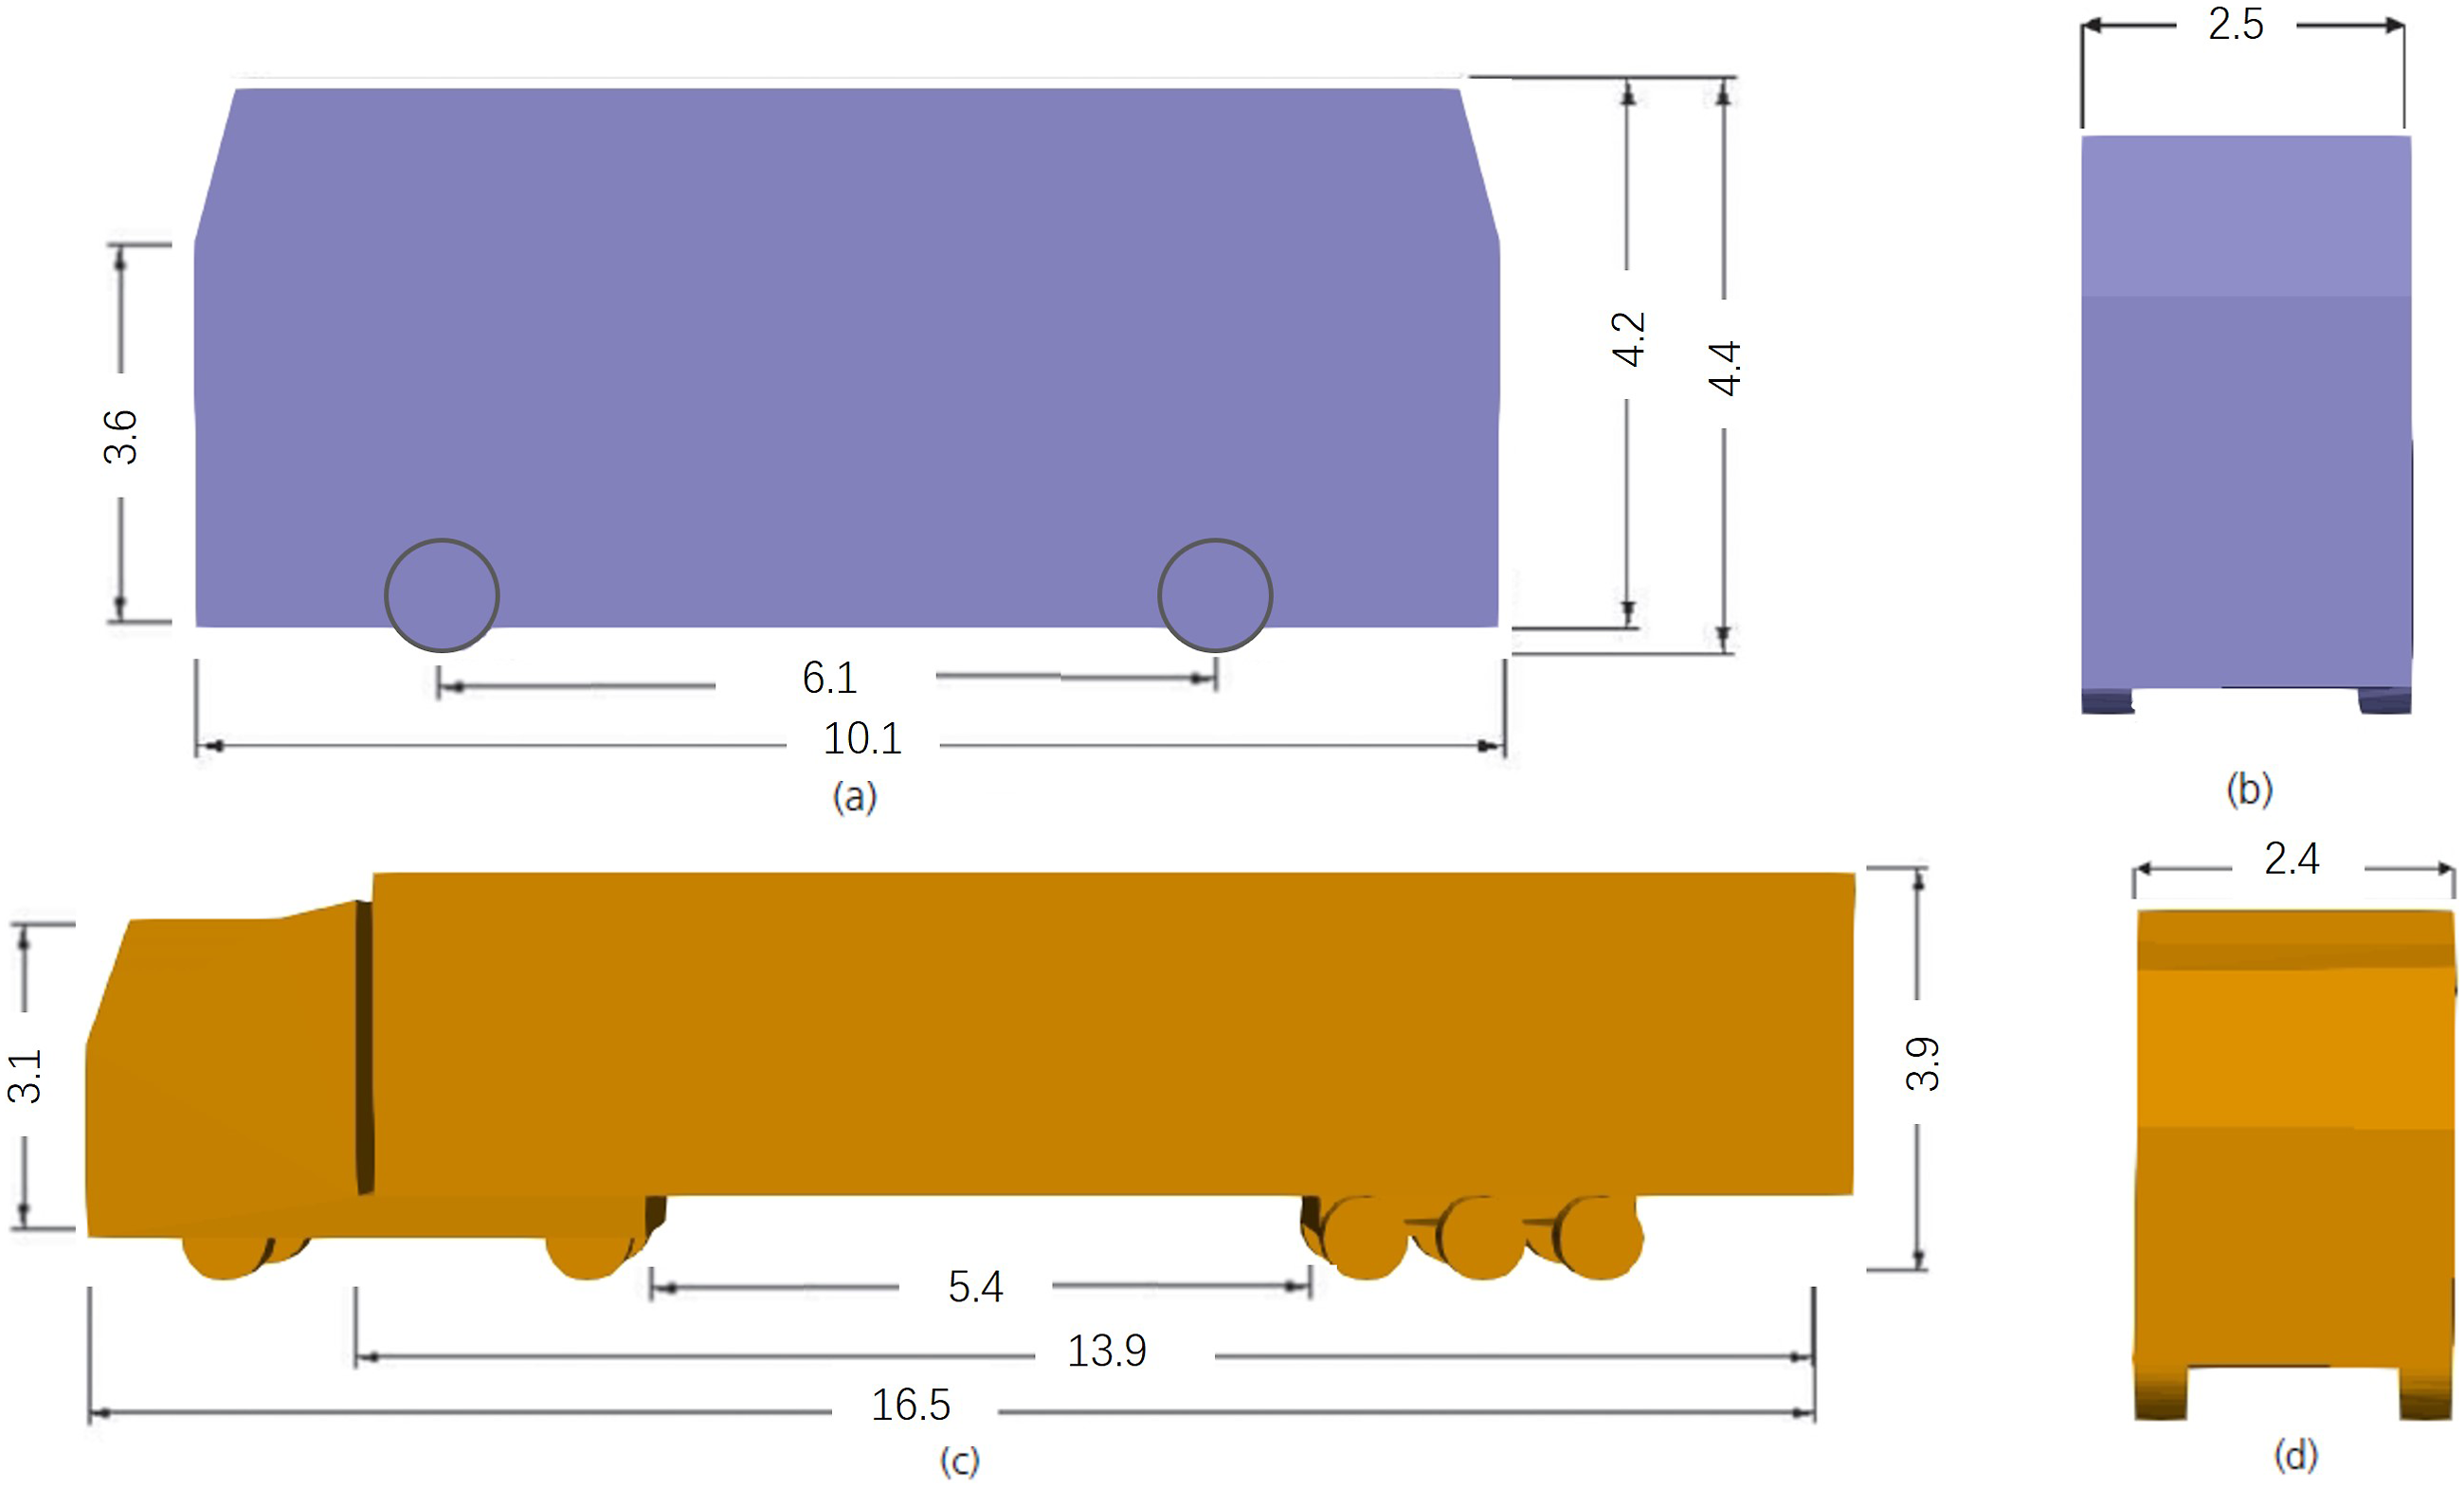
A full-scale geometry of the central tower and central span of the Queensferry Crossing (Figure 3) were created rather than the whole bridge structure due to limitations of computational resources. The bridge tower is 210 m high. The deck hold by cables on both sides of the central tower is 788 m in length and 41.6 m in width. The bridge tower region was especially focused in this CFD study. As shown in Figure 4, there are two elements on the bridge tower, the road-sign gantry, and the tower wind-shielding. The steel gantry is modelled as a hollowed structure. To investigate the effect of these elements on the force condition of high-sided vehicles while they are passing by the bridge tower, geometries without the road-sign gantry or the tower shielding were also created for comparison. The high-sided vehicle models, which are in standard dimensions, are illustrated in Figure 5. The double-decker bus is 4.4 m in height, which is a little higher than the truck (3.9 m). Meanwhile, a noteworthy feature of the truck is its length (16.5 m), which is markedly longer than the bus (10.12 m). Three-dimensional geometry of the Queensferry Crossing Bridge. View of the bridge tower region: (a) photograph approaching the leeward side of the tower in Lane 1 (Google Street View, 2022), and (b) CFD geometry. High-sided vehicle model (VOLVO, nd; Wrightbus, 2022) (dimensions in m): (a) side view of double-decker bus; (b) elevation of double-decker bus; (c) side view of truck; (d) elevation of truck.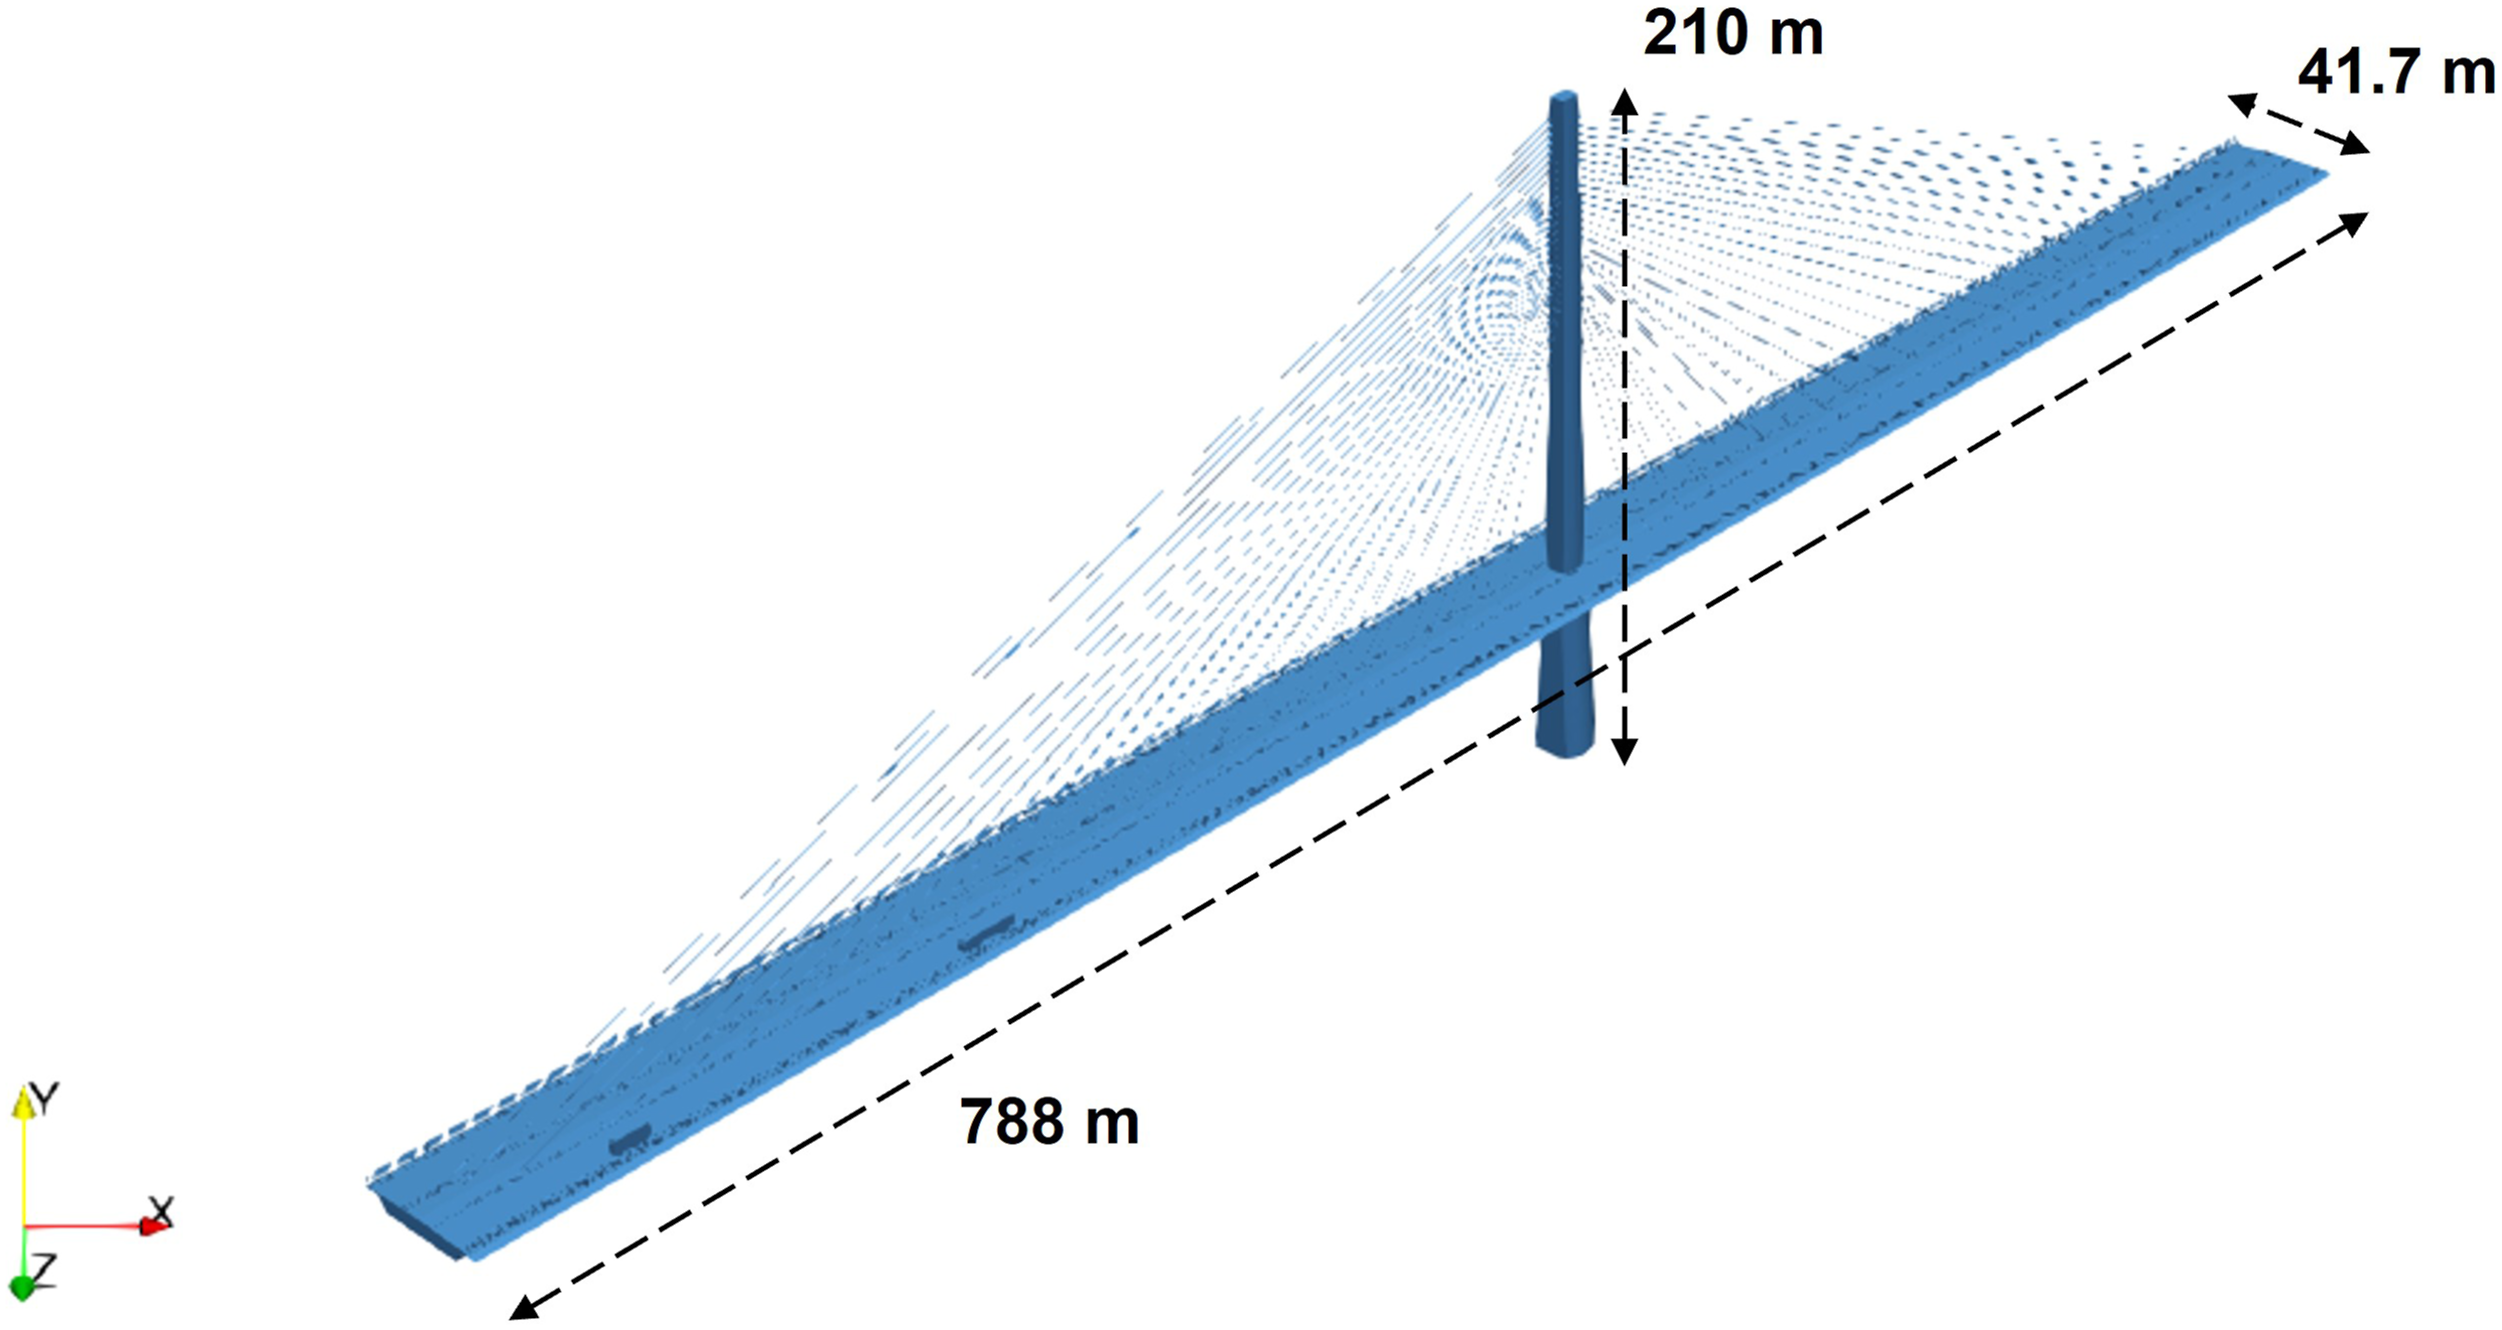
Computational domain and mesh scheme
In this study, wind from four yaw angles was considered according to the prevailing wind directions of the site and the wind climate report data (Transport Scotland, 2022). To alter wind yaw angles conveniently, a cylindrical domain was used in this study which described and validated in the authors’ previous work (Zhu et al., 2023). Positions of inlet face and outlet face were adjusted accordingly to model the different yaw angles without the need to build different domains. To ensure the spatial and temporal consistency of the incoming flow and avoid unnecessary flow interaction, the inlet was modelled as a plane face rather than an arc to ensure that the incoming wind was smooth and stable. As for the side boundary wall, regardless of the cylinder shapes and diameters, the flow expansion in the spanwise direction rarely occurs once the incoming flow and boundary layer flow start interacting (Ikegaya et al., 2020). Thus, the cambered side boundaries would not affect the approaching flow to the bridge geometry. The length of the inlet face was based on the equivalent length of the geometry under a yaw angle accordingly. To ensure appropriate turbulence generation, the radius and the height of the domain was set as 500 m and 630 m respectively.
The structure of the mesh scheme is similar to the one described in the authors’ previous work (Zhu et al., 2023). There are seven levels of refinement with a background mesh of 35m (the largest cell size). In order to reach an average y + value of approximately 120 the refinement region was larger than the ones described in the previous work. The smallest cell (Level 7), which was placed in the region within 3 m of the geometry, had a size of 0.273 m. Level 6, Level five and Level 4 cells were designed to generate in the region within 25 m, 70 m, and 125 m of the bridge, respectively. A close-up view of the local grid partition around the vehicle and road-sign gantry is shown in Figure 6 as well as the structured Level 7 and Level 6 cells. Computational domain and close-up views of mesh scheme.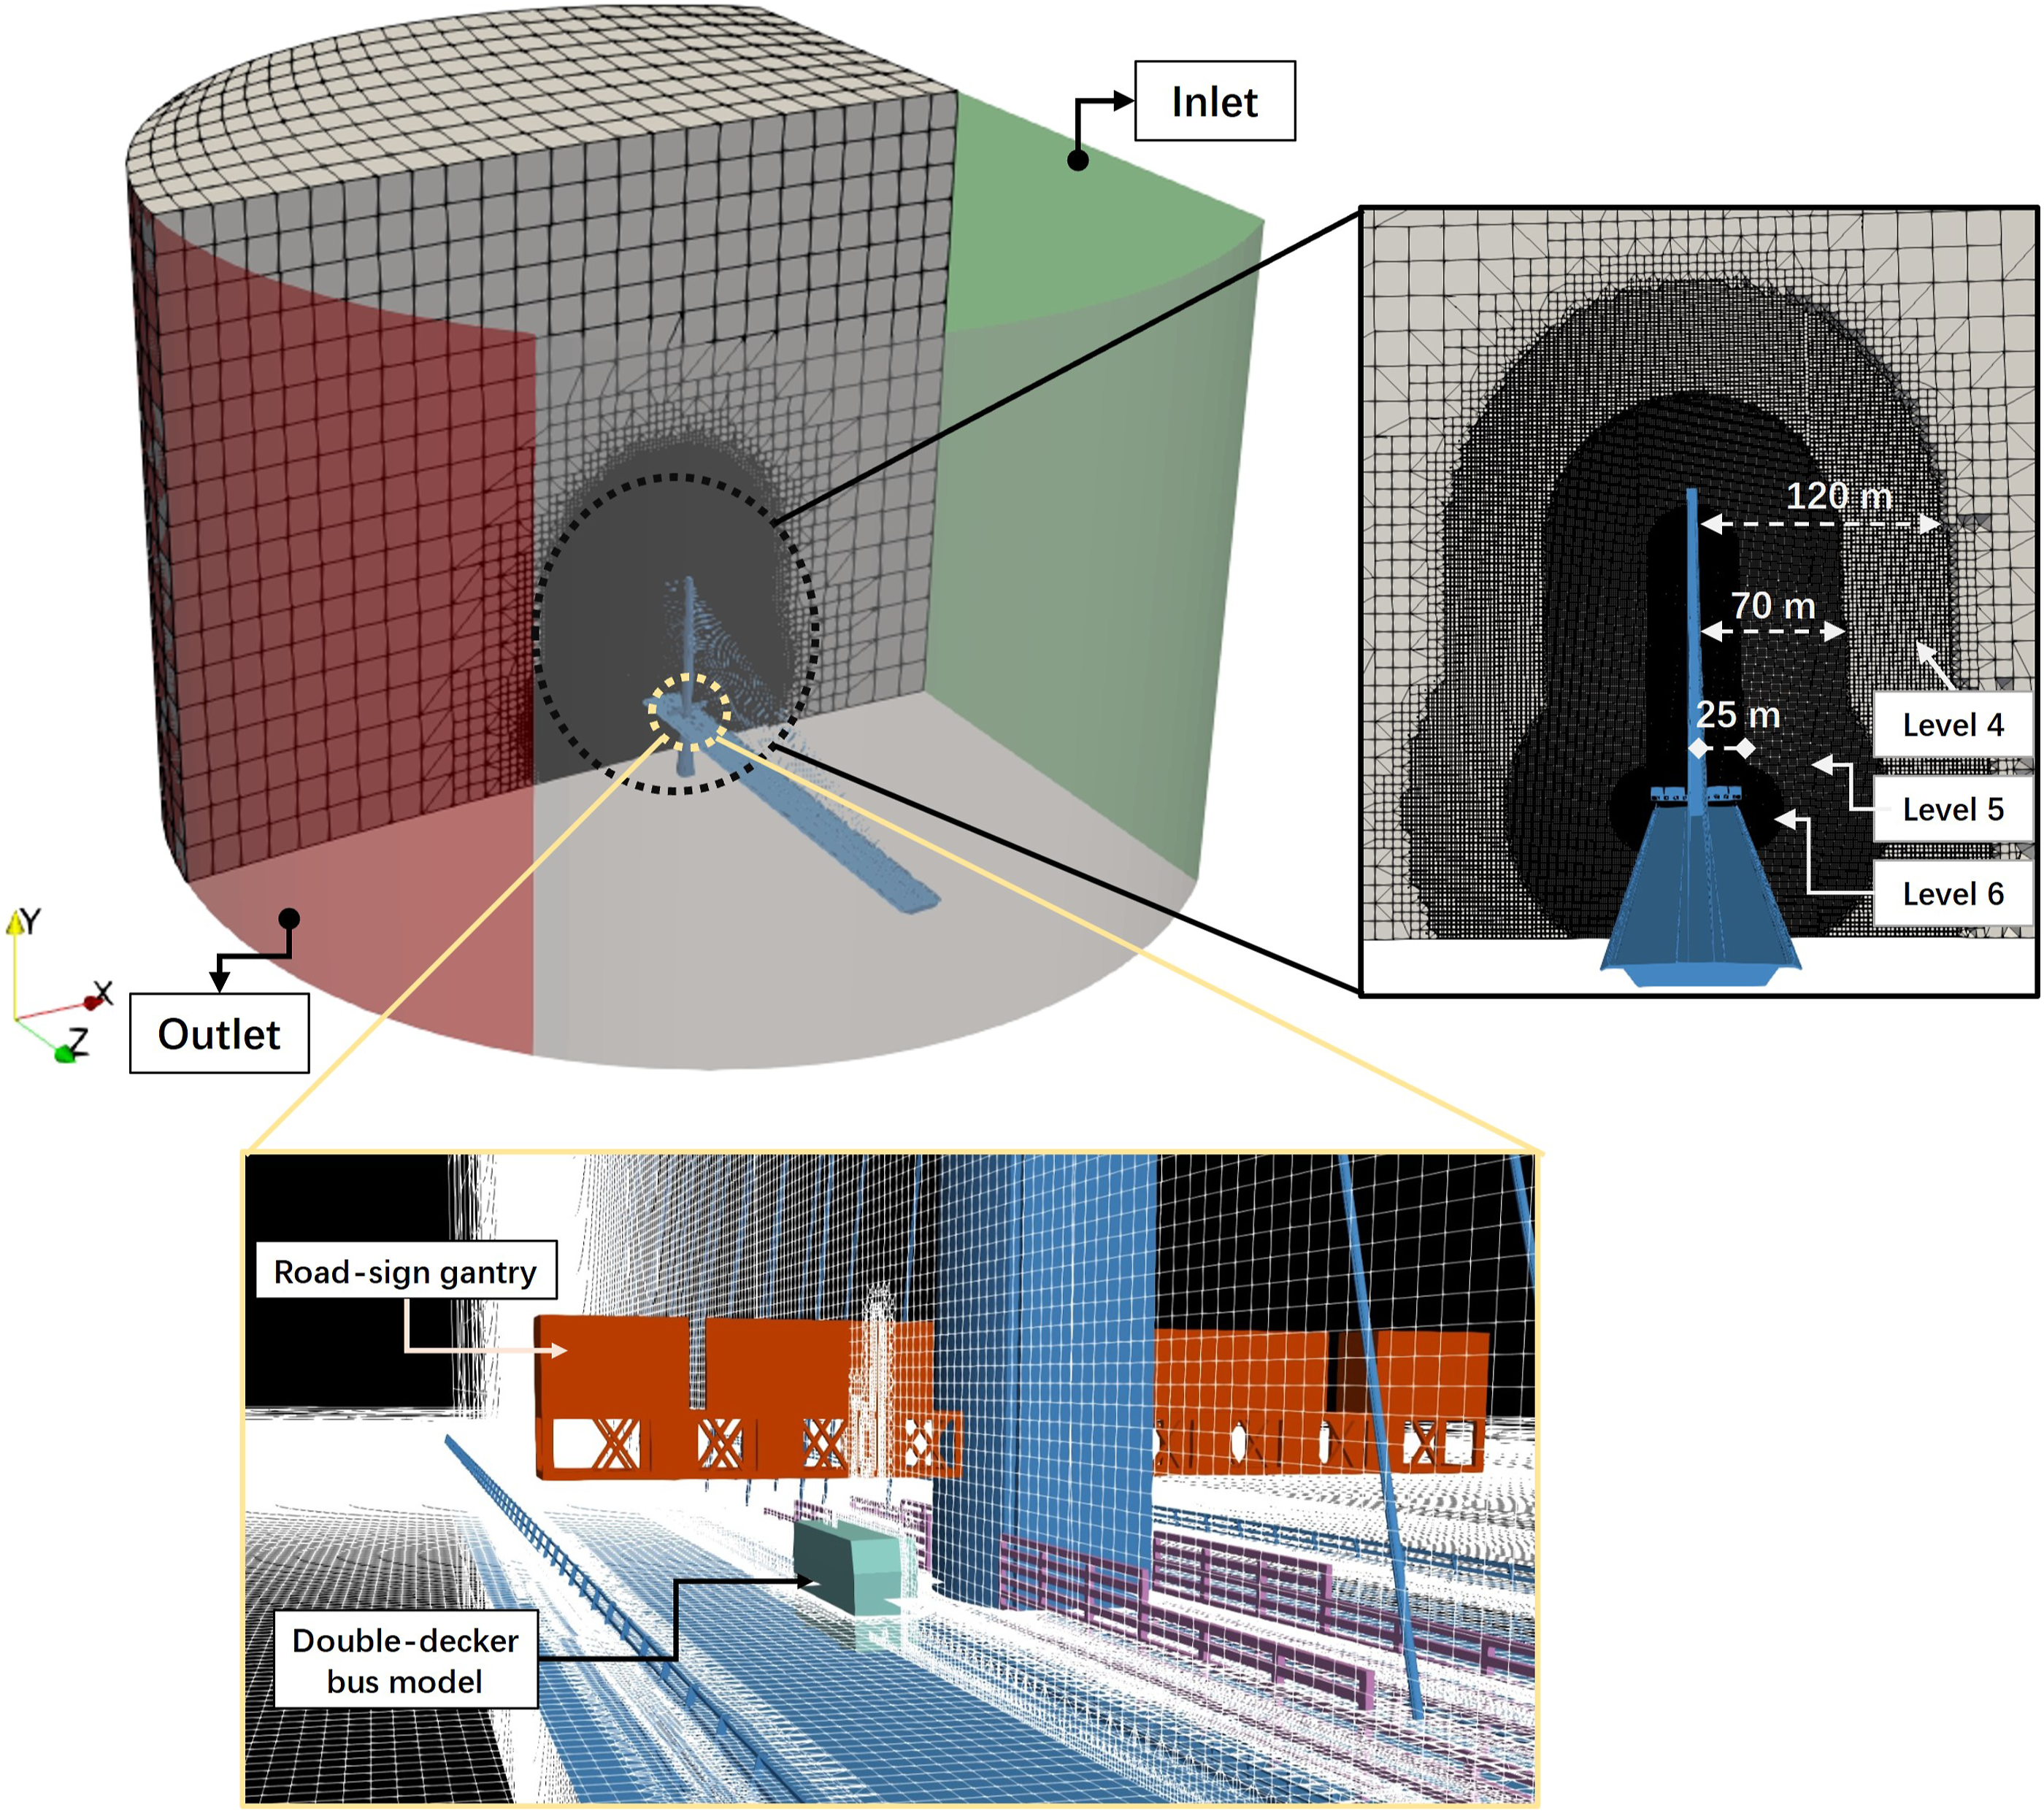
Governing equations
In this study, the air is assumed to be incompressible, Newtonian and statistically steady. Steady simulations assume that all the flow parameters are constant over the time, whereas in unsteady simulations, the flow conditions change with time and assess the time-dependent impact on flow predictions. Thus, steady simulations produce average results without solving oscillating variables, which makes steady results relatively less physically correct than unsteady results. However, the variation trend of vehicle aerodynamic force conditions caused by the existence of these secondary facilities was the main focus rather than the specific aerodynamic performance in the eddies or periodic vortices. Therefore, the incompressible form of the Reynolds-Averaged Navier-Stokes (RANS) equations was adopted:

Simulations on high-sided vehicles near the tower
In this section, the effect of the road-sign gantry and tower shielding on high-sided vehicles passing by the bridge tower was investigated, respectively. Two sets of comparisons were conducted. The first group of simulations was performed with geometries including, and then excluding the road-sign gantry, respectively. The second group of simulations was performed with geometries including, and then excluding the tower wind-shielding, respectively.
Rationale for the choice of road position of high-sided vehicles
In each group of simulations, steady state analyses were performed varying the relative position between the vehicle and the bridge tower. As shown in Figure 2(a), three different lanes were considered in this study. Lane one was on the leeward side of the tower. Lane two and Lane three were on the windward side. As vehicles passed by the wake of the bridge tower under crosswinds, the aerodynamic force conditions of the vehicles would experience sudden variations, especially for side force and rolling moment (Rocchi et al., 2012; Salati et al., 2018). It was hypothesised that the side force and rolling moment of vehicles would be increasing as they approach the tower, decreasing instantly once vehicles reach the tower and then increasing again as they leave the tower. Therefore, the three positions where these extremes occurred were chosen for investigation (see Figure 7) where static vehicles were analysed in steady state simulations. The impact of moving vehicles at various velocities is worth investigating in future simulations as the turbulence formed by interactions between the vortex around moving vehicles and the wake flow may affect the aerodynamic conditions of vehicles as well. Vehicle and tower relative position on lane 1: (a) approaching the tower; (b) middle of the tower, and (c) leaving the tower.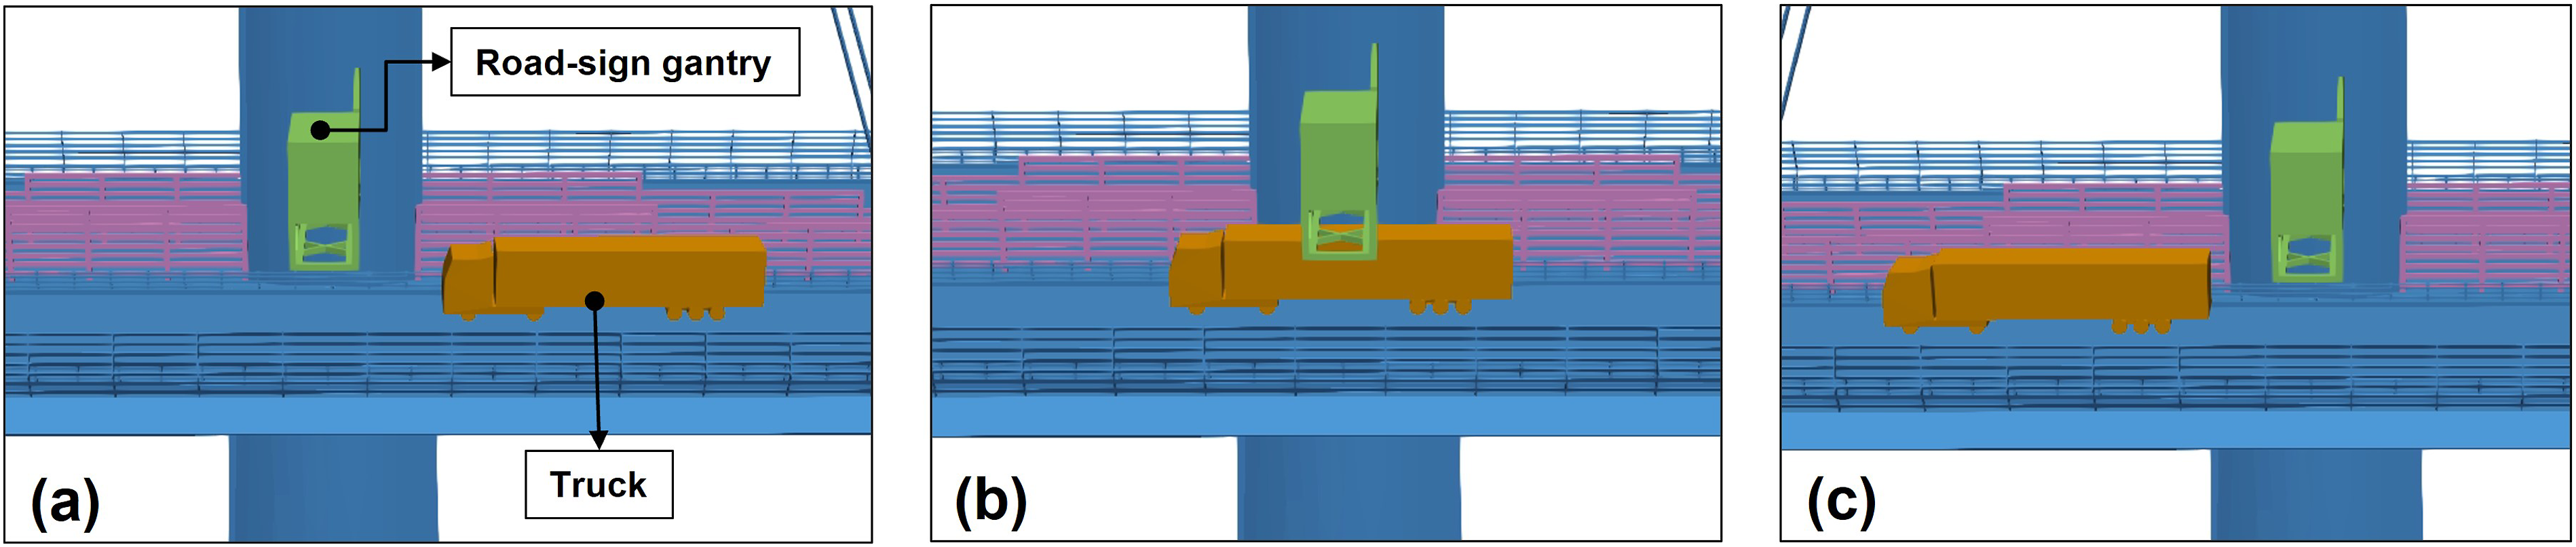
Results of the effect of the road-sign gantry
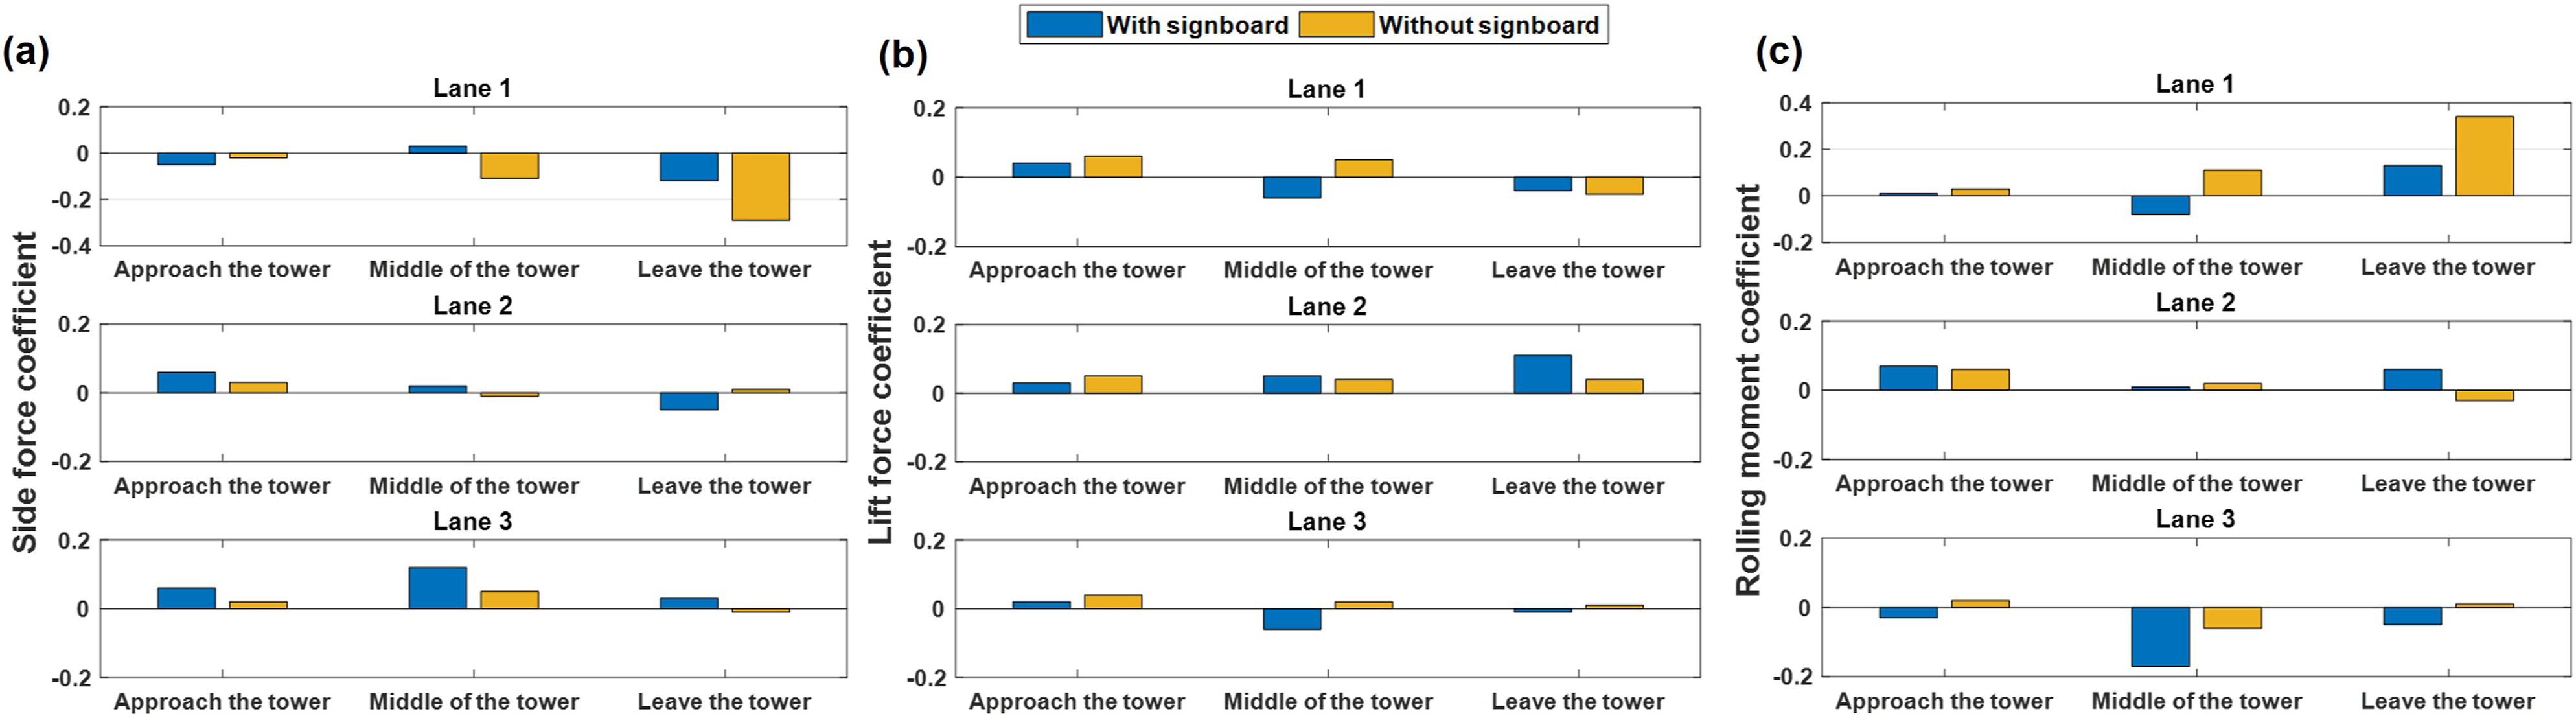
Two groups of simulations with different bridge geometries were conducted: one group including the road-sign gantry and the other, without. The location of the road-sign gantry is shown in Figure 2(a). The impact of the road-sign gantry on aerodynamic force conditions of the double-decker bus and the truck in high winds was investigated from four wind yaw angles: 180, 210, 240 and 270 degrees. The results obtained from the CFD simulations for aerodynamic forces are then input into the equations below to determine the dimensionless force coefficients: Aerodynamic force conditions of the double-decker bus under wind yaw angle of 270 degrees: (a) side force coefficient, (b) lift force coefficient, and (c) rolling moment coefficient.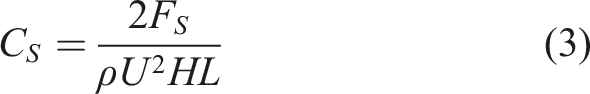
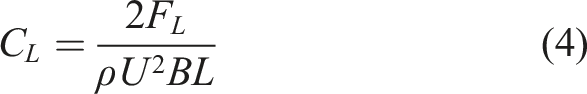
Overall, results suggested that the road-sign gantry did not have a significant impact on the double-decker bus when wind blew from the west (yaw angle of 270 degrees) as shown in Figure 8. Comparing the aerodynamic force coefficients of the bus on conditions on the bridge tower with and without the road-sign gantry, the difference of standard deviations on each lane were less than 0.02, except for the side force coefficient and rolling moment coefficient in Lane 2. Standard deviations of side force and rolling moment coefficients on condition with the road-sign gantry on the tower were 0.03 and 0.04 higher than without it, respectively.
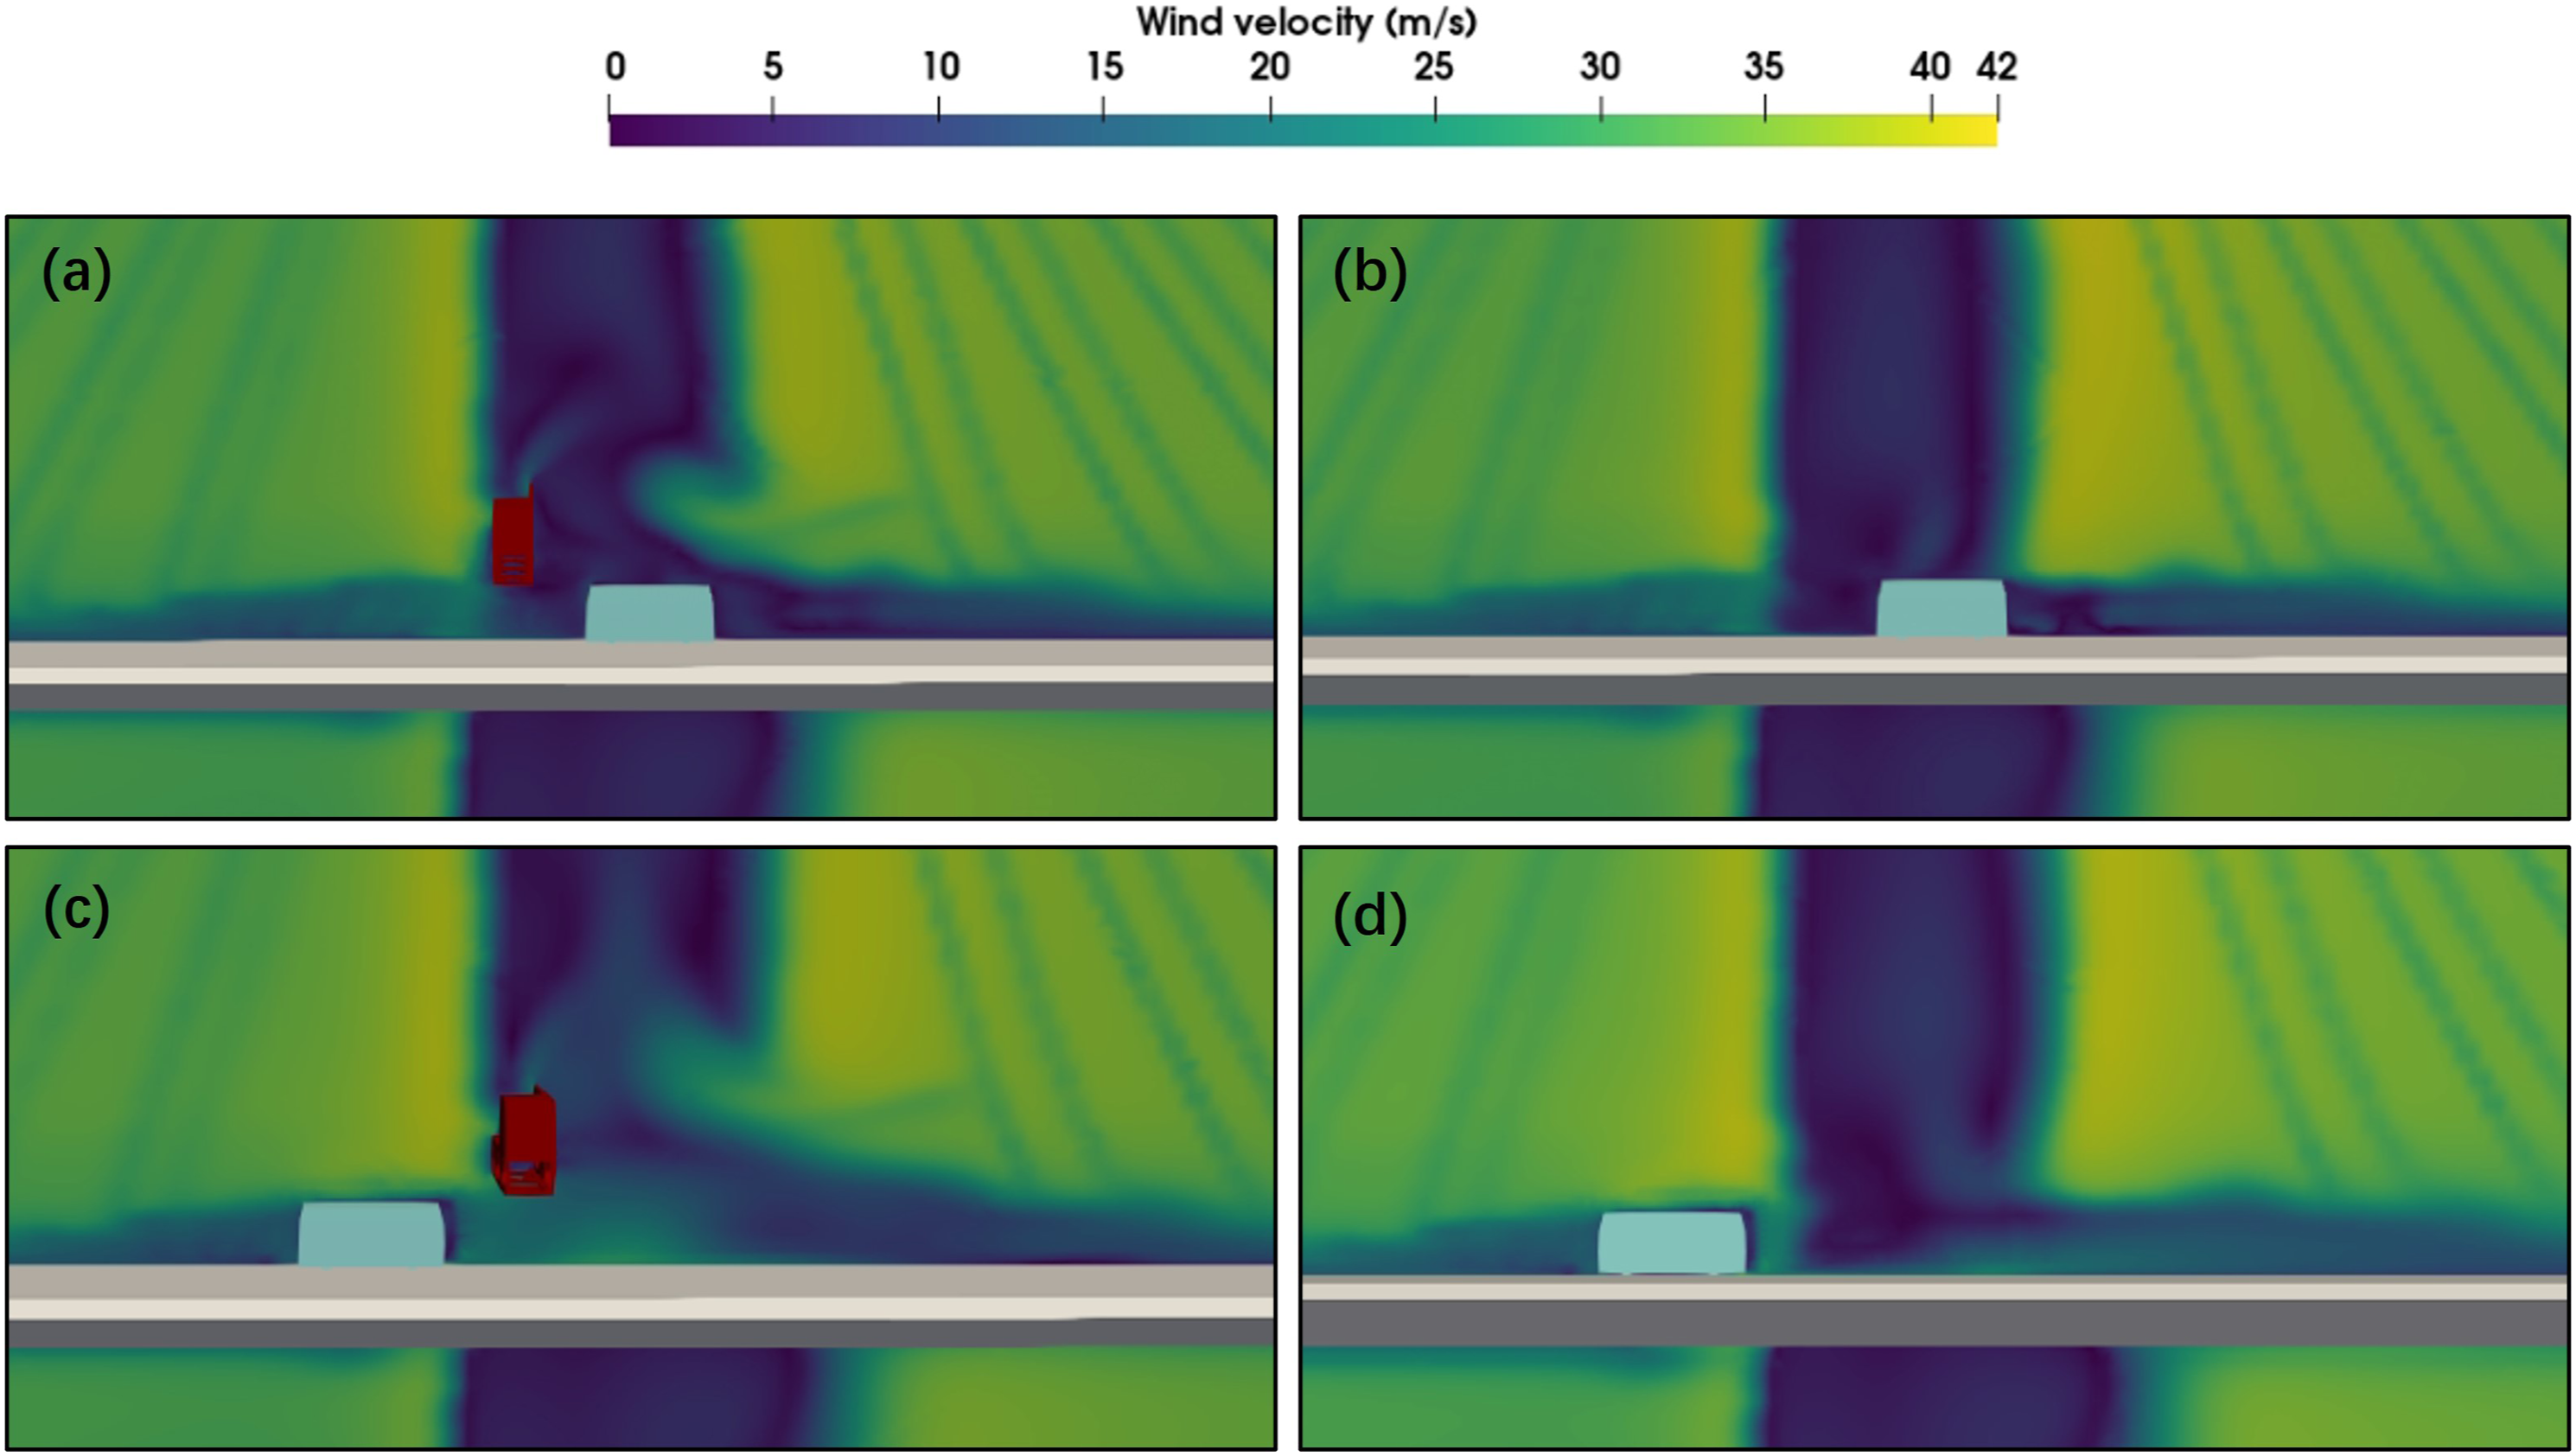
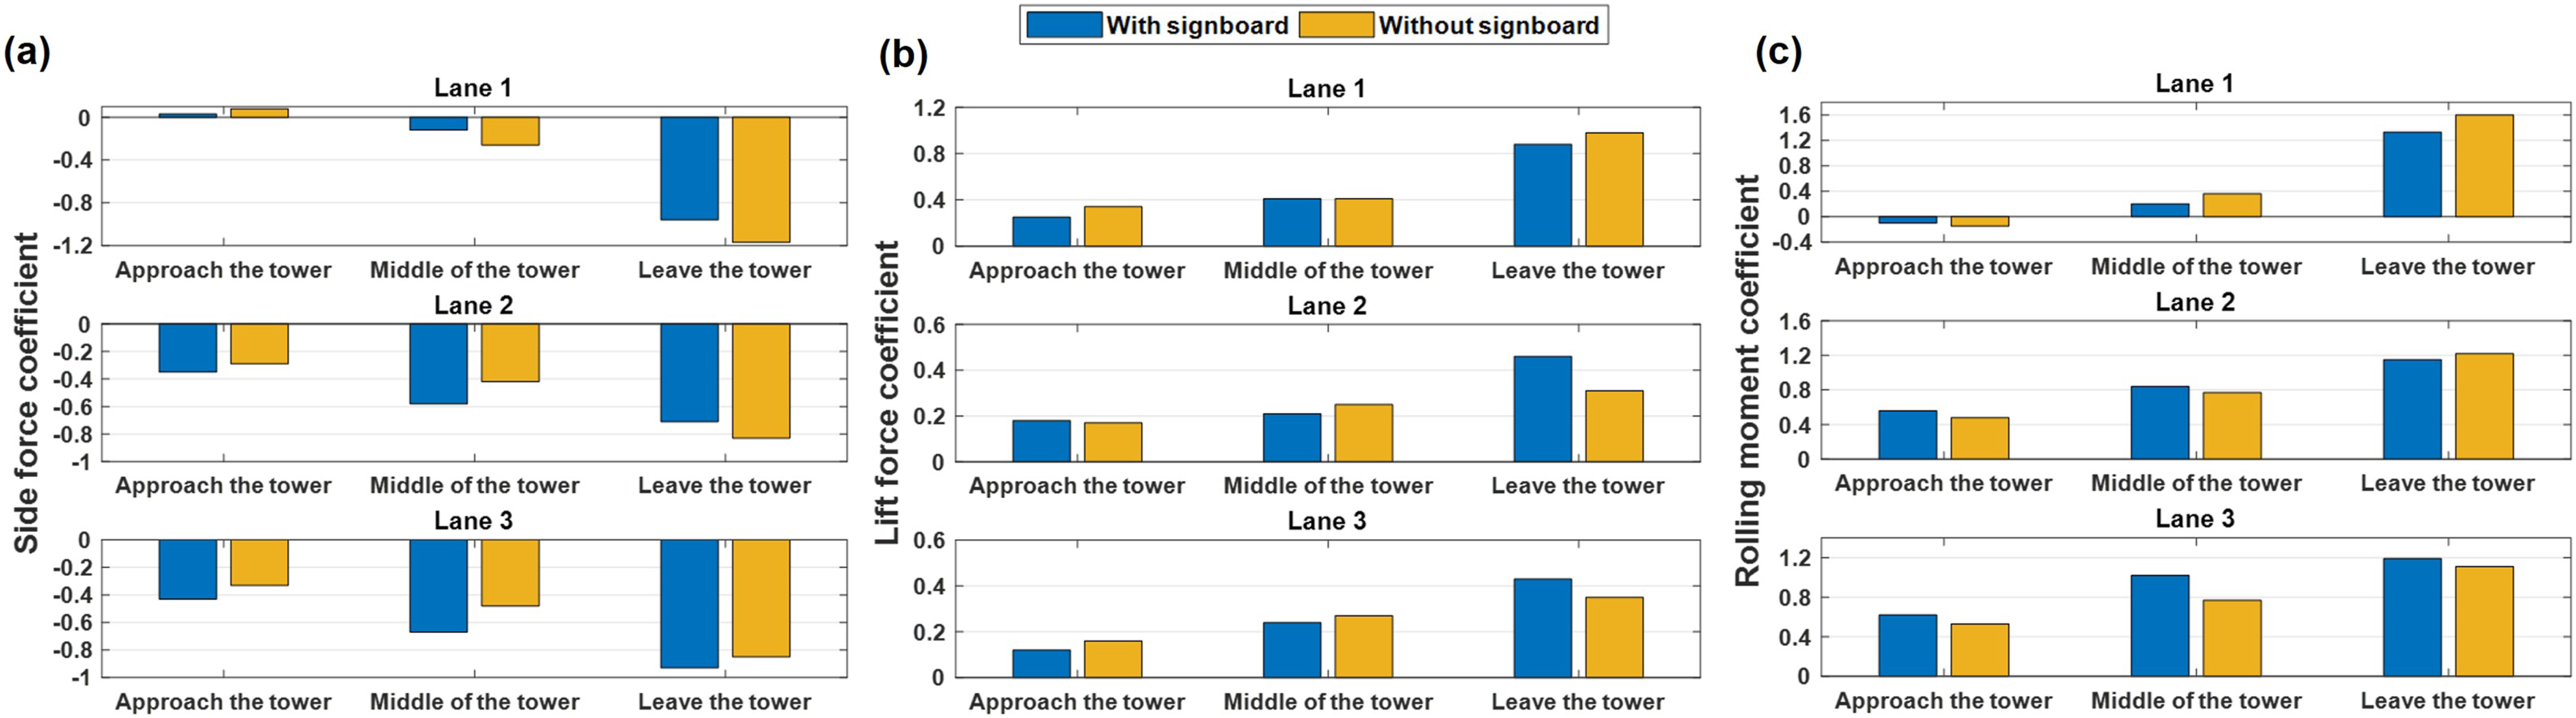
The impact of the road-sign gantry is more evident as the wind yaw angle changed to 240 degrees (Figure 9), especially for Lane one and Lane 2. On Lane 1, which is the leeward side, the road-sign gantry protected the double-decker bus from winds (all force coefficients are lower all the way through the tower region compared to the force conditions without the gantry). From the side views of wind velocity contours (Figure 10), it can be noticed that the road-sign gantry further intercepted crosswinds which were blocked but skirted around the bridge tower. Prominent eddies were generated along the edge of upper gantry, meanwhile, a larger lower wind velocity zone was created around the bus compared to the condition without the gantry. When the bus was at the point of leaving the wake region of the tower, the existence of the sign gantry produced a gentler hierarchical spectrum of wind velocity variation on the deck level, which could be a more stable aerodynamic condition. Standard deviations of side force and rolling moment coefficients on condition with the road-sign gantry on the tower were 0.12 (18.5%) and 0.15 (16.7%) lower than without it, respectively. Differences of standard deviations of the lift force coefficient was 0.03 (8.6%) which is less significant. On the windward Lane 2, existence of the road-sign gantry increased the aerodynamic forces of the double-decker bus when it approached the tower, and then provided a sheltering effect when it left the tower, particularly for side force and rolling moment. The lift force coefficient increased remarkably when the bus left the tower with the road-sign gantry included. Figure 11 shows side views of wind velocity contours of the double-decker bus in Lane two under a yaw angle of 240 degrees. Differences in the wind field around the bridge tower region can be observed depending on the presence of the road-sign gantry. On the windward side, the approaching bus would encounter turbulence which attached to the gantry. Complex flow conditions (especially at the front of the vehicle body) compared to the condition without the gantry could be a major cause of the increase in aerodynamic forces experienced by the bus. As the bus leaves the tower, a tepid wind profile produced by the interception of the sign gantry resulted in lower aerodynamic force conditions on the vehicle, which was the sheltering effect as mentioned. In the case of 270 degrees, the road-sign gantry lowered the standard deviations of side force and rolling moment coefficients of the double-decker bus on lane two by up to 35.7% and 18.9% respectively but it doubled the fluctuation of the lift force condition at the same time. The impact was similar when the bus was in Lane 3, however, the reduction rate caused by the road-sign gantry was receding as the vehicle was closer to the edge of the deck. Fluctuations in side force and rolling moment coefficients were 7.4% and 3.4% lower respectively. Aerodynamic force condition of the double-decker bus under wind yaw angle of 240 degrees: (a) side force coefficient, (b) lift force coefficient, and (c) rolling moment coefficient. Side views of wind velocity contours of the double-decker bus on Lane one under 240 degrees wind yaw angle: (a) the bus approaches the tower with the road-sign gantry exist, (b) the bus approaches the tower without the gantry, (c) the bus left the tower with the road-sign gantry exist and (d) the bus left the tower without the gantry. Side views of wind velocity contours of the double-decker bus on Lane two under 240 degrees wind yaw angle: (a) the bus approaches the tower with the road-sign gantry exist, (b) the bus approaches the tower without the gantry, (c) the bus left the tower with the road-sign gantry exist and (d) the bus left the tower without the gantry.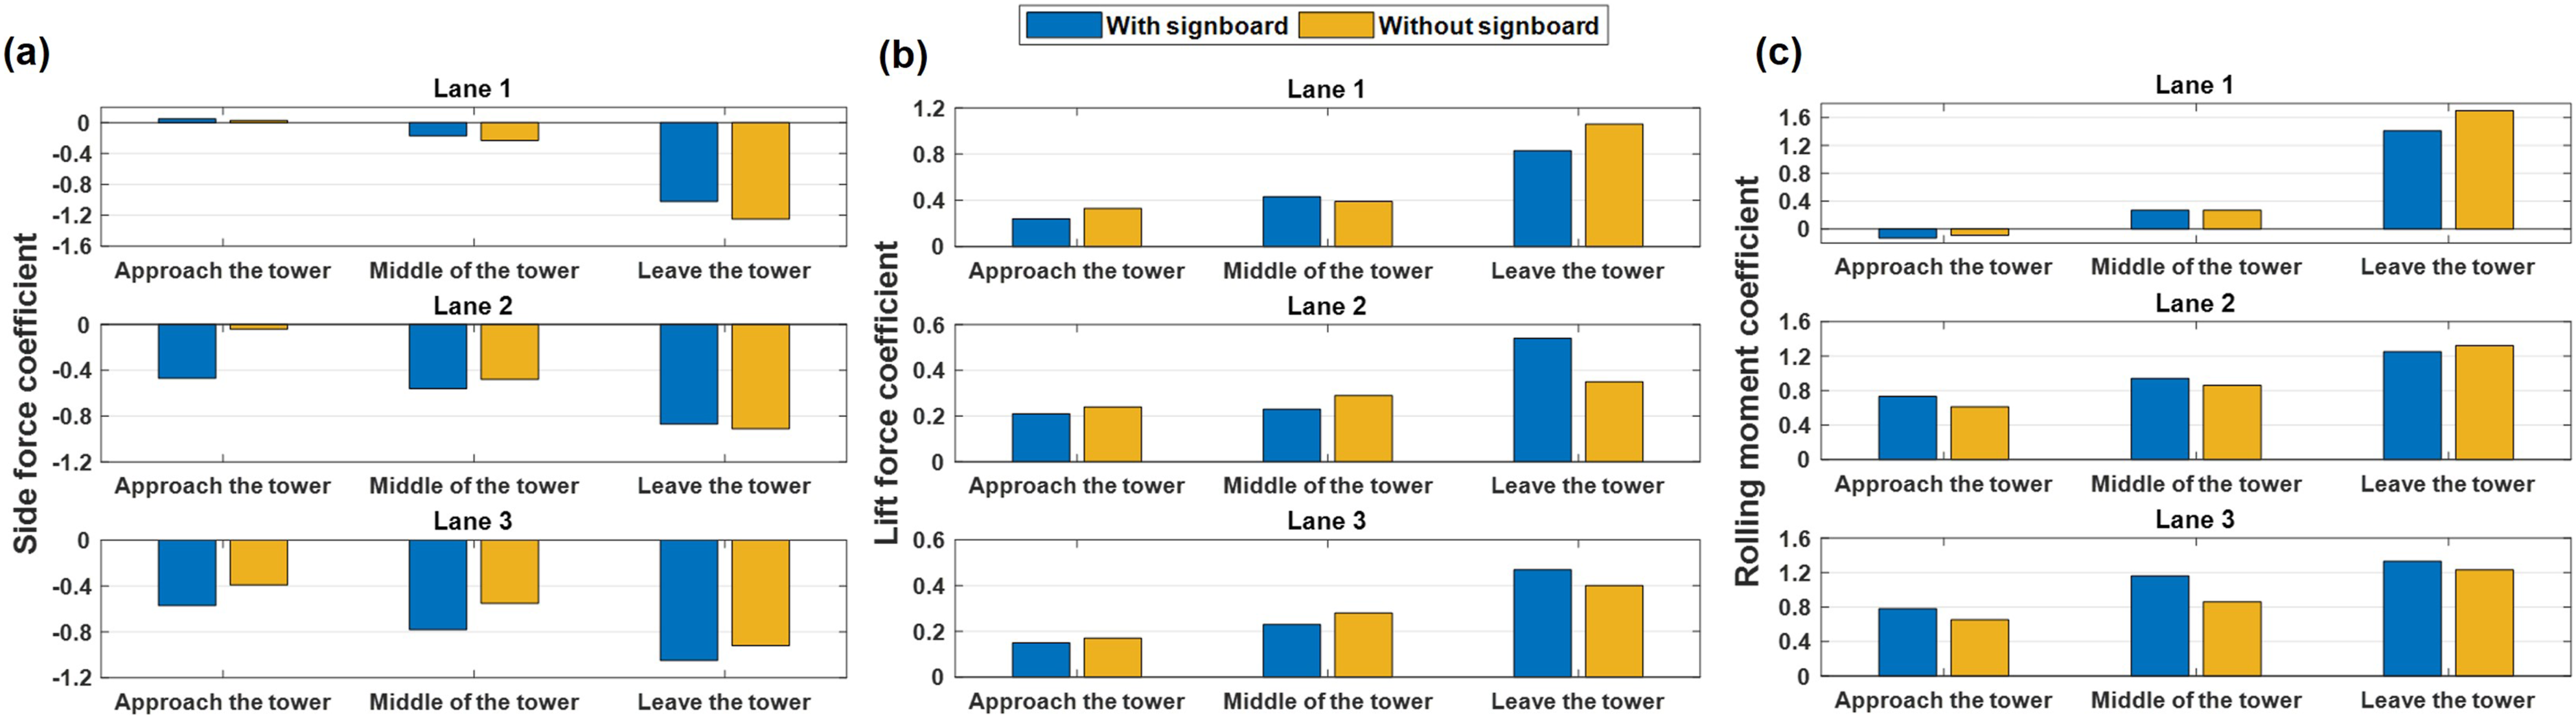
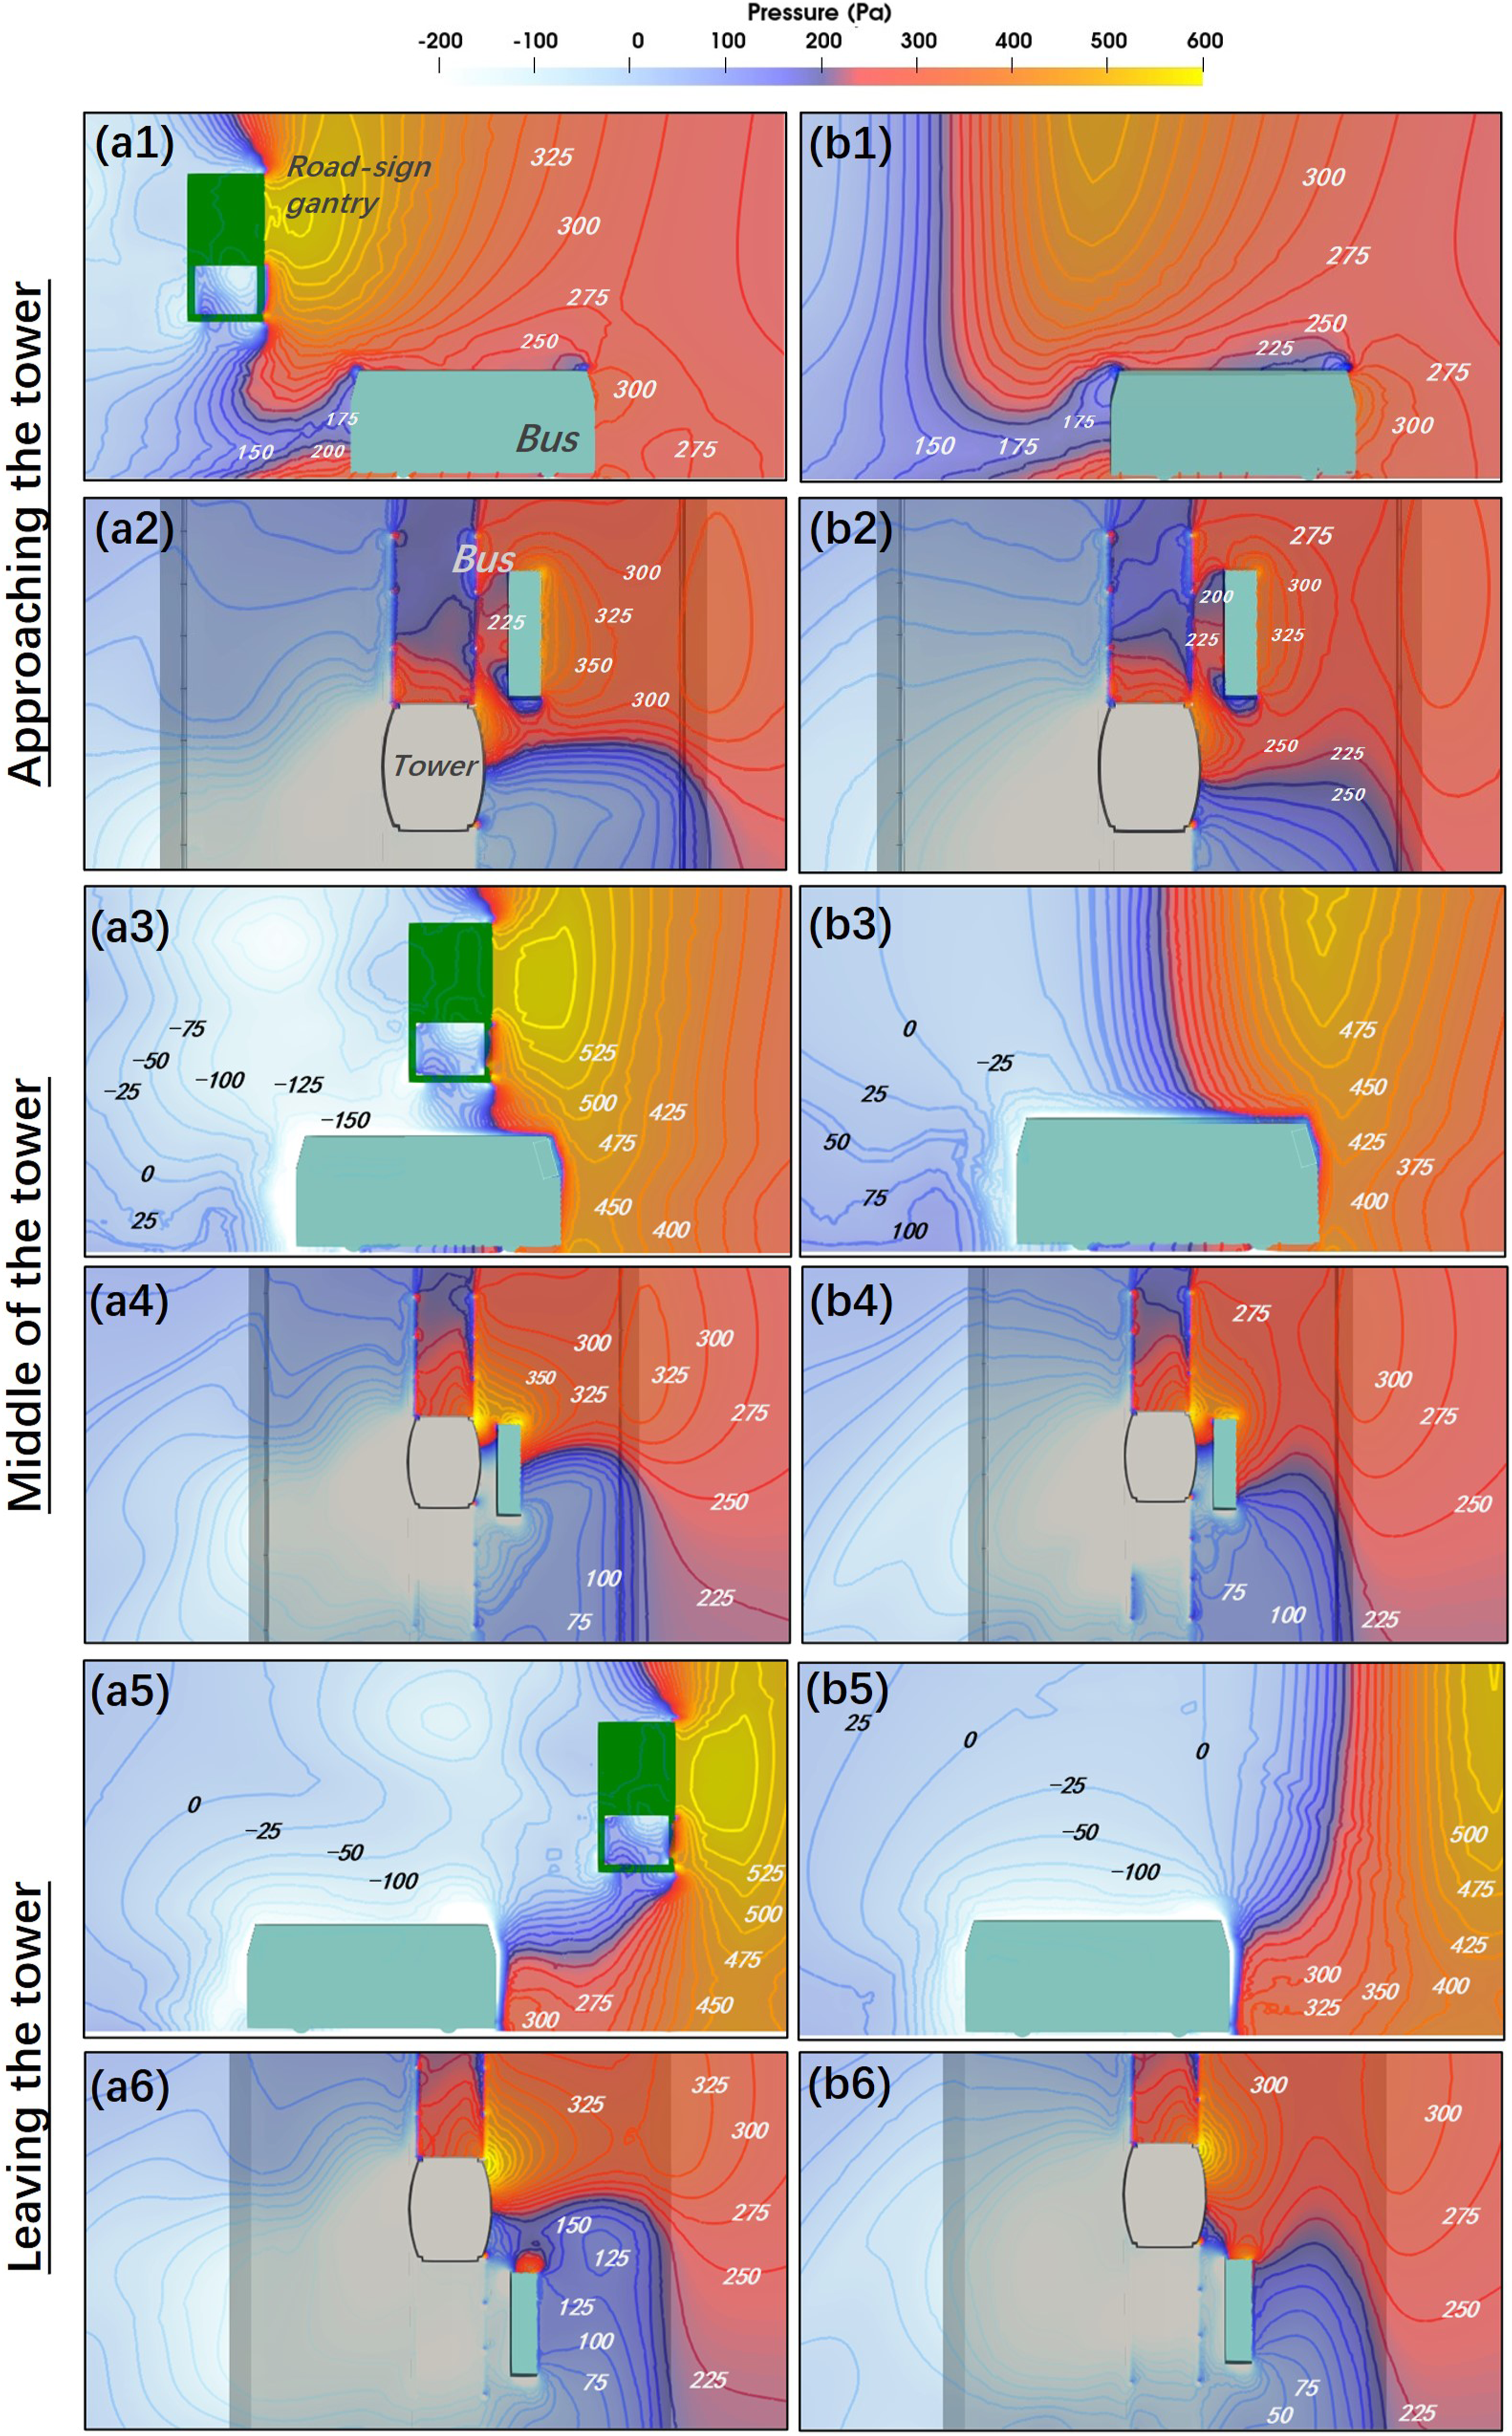
The road-sign gantry had a similar effect on the double-decker bus when the wind yaw angle changed from 240 degrees to 210 degrees (see Figure 12), where the bus experienced an average increase of 6% in aerodynamic forces. Compared with the results in the 240-degree case, when the bus approach the bridge in Lane 2, the side force coefficient of the bus showed sensitivity to the variation of the wind angle if the tower excluded the road-sign gantry. Such a characteristic suggests that the existence of the road-sign gantry stabilizes the side force condition of the double-decker bus in Lane 2. Pressure field contours of the double-decker bus in Lane two under wind conditions with a yaw angle of 210 degrees are illustrated in Figure 13. The difference between adjacent isosurface is 25 Pa. It is evident that the presence of the road-sign gantry changes the pressure field around the vehicle. Comparing the plots in Figure 14 (a1) and (b1) demonstrates that the road-sign gantry alters the airstream around the top edge of the double-decker bus, which results in a rapid rise of the pressure field. Thus, the lift force acting on the bus in the presence of a road-sign gantry nearby would be lower than the condition without it, as the bus approaches the tower. Moreover, the plots in Figure 14 (a2) and (b3) show that the windward side pressure-field of the double-decker bus, which is influenced by the road-sign gantry, was in higher gradient than the one without the gantry. Furthermore, the plots in Figure 14 (a4)/(b4) and plots in Figure 14 (a6)/(b6) provided an intuitive perspective on the shielding effect from the road-sign gantry on the bus as the high-pressure field was observably backward inclined to the bus. In the case of the 180 degrees yaw angle, the road-sign gantry structure continued to influence the aerodynamic force condition of the double-decker bus, although the magnitude of aerodynamic force coefficients was very small. The road-sign gantry lowered the fluctuation of the aerodynamic force condition of the bus in Lane one by 30% on average. However, when the double-decker bus travelled in Lane two and lane 3, which are downwind direction, the gantry tended to enlarge the fluctuation of the aerodynamic force, changing it by almost 50% on average. Aerodynamic force conditions of the double-decker bus under wind yaw angle of 210 degrees: (a) side force coefficient, (b) lift force coefficient, and (c) rolling moment coefficient. Aerodynamic force conditions of the double-decker bus under wind yaw angle of 180 degrees: (a) side force coefficient, (b) lift force coefficient, and (c) rolling moment coefficient. Pressure field contours of the double-decker bus in Lane two under wind yaw angle of 210 degrees in elevation views and plan views: (a1∼a6) with the road-sign gantry and (b1∼b6) without the road-sign gantry.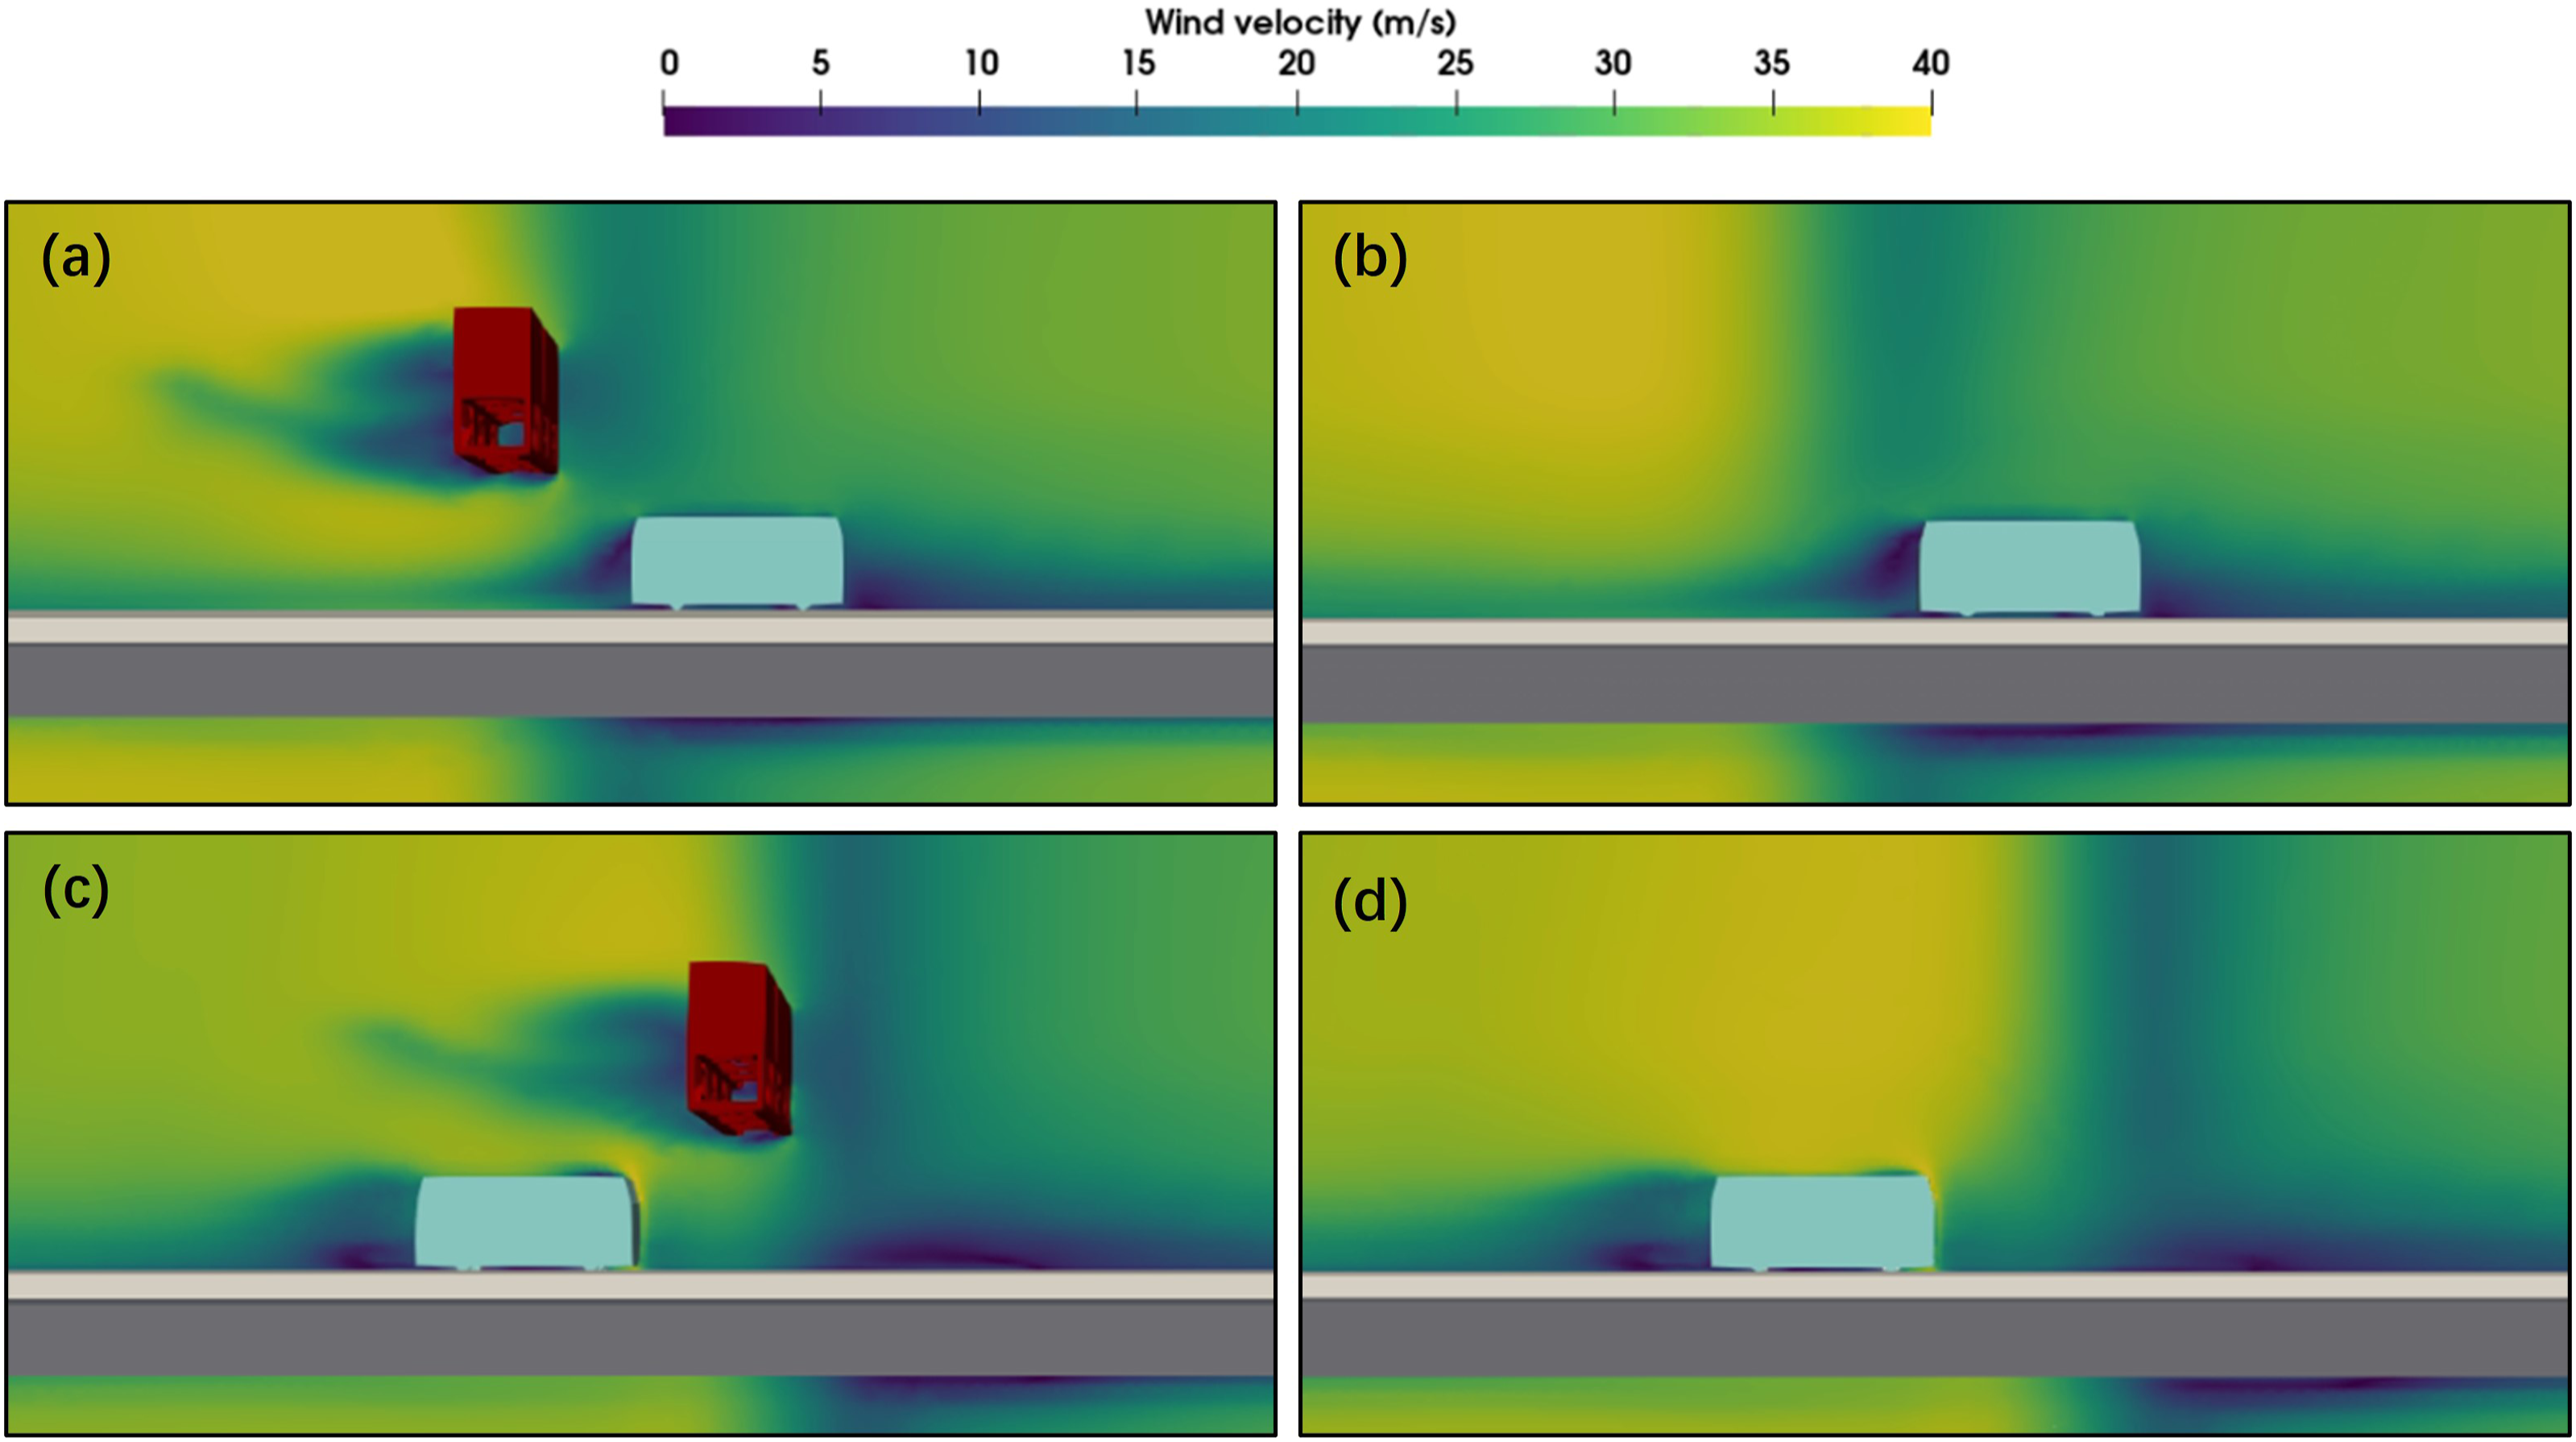
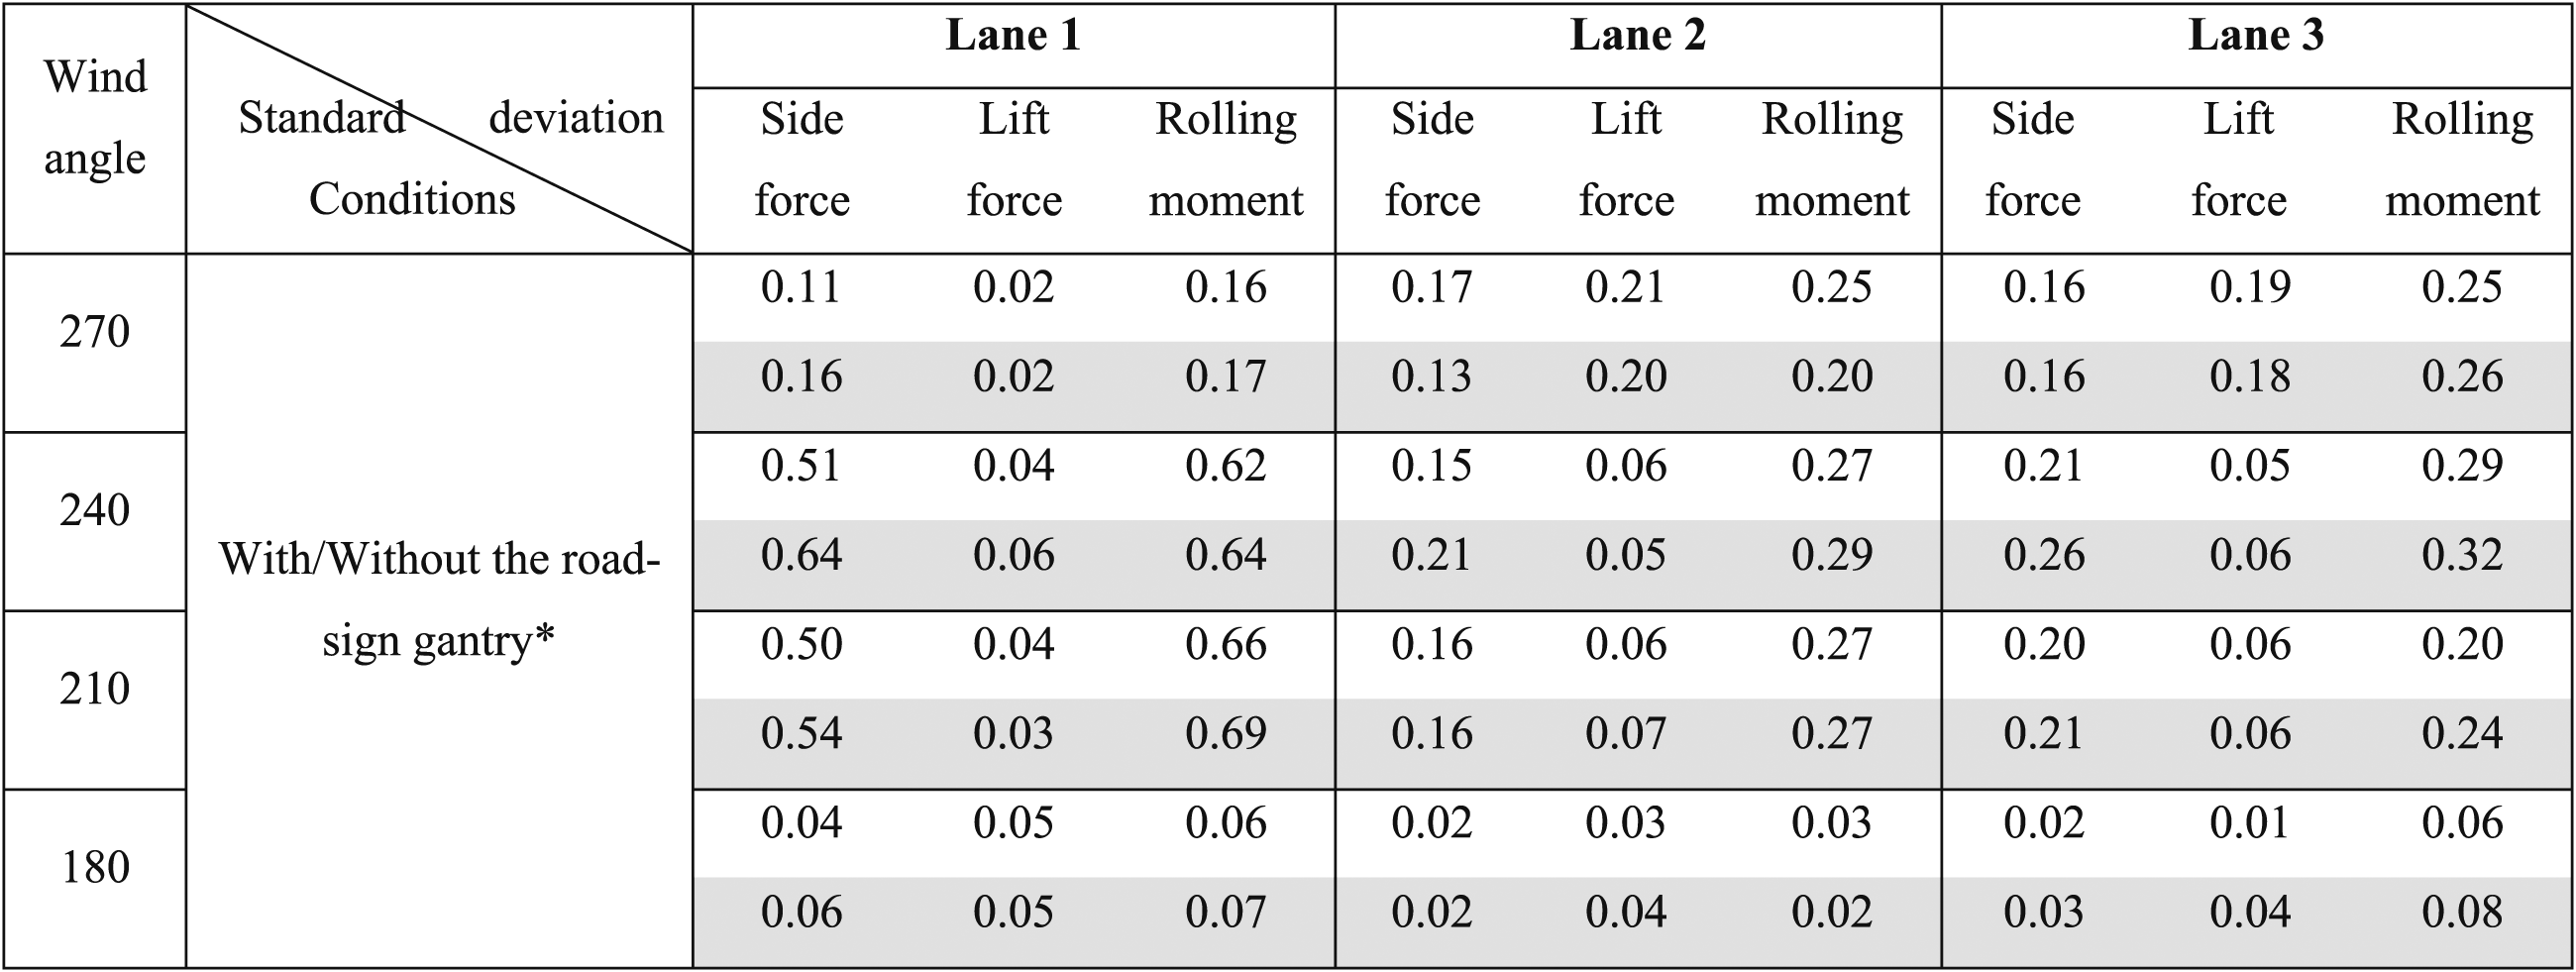
Results of standard Deviation of force Coefficients of the Double-decker bus.
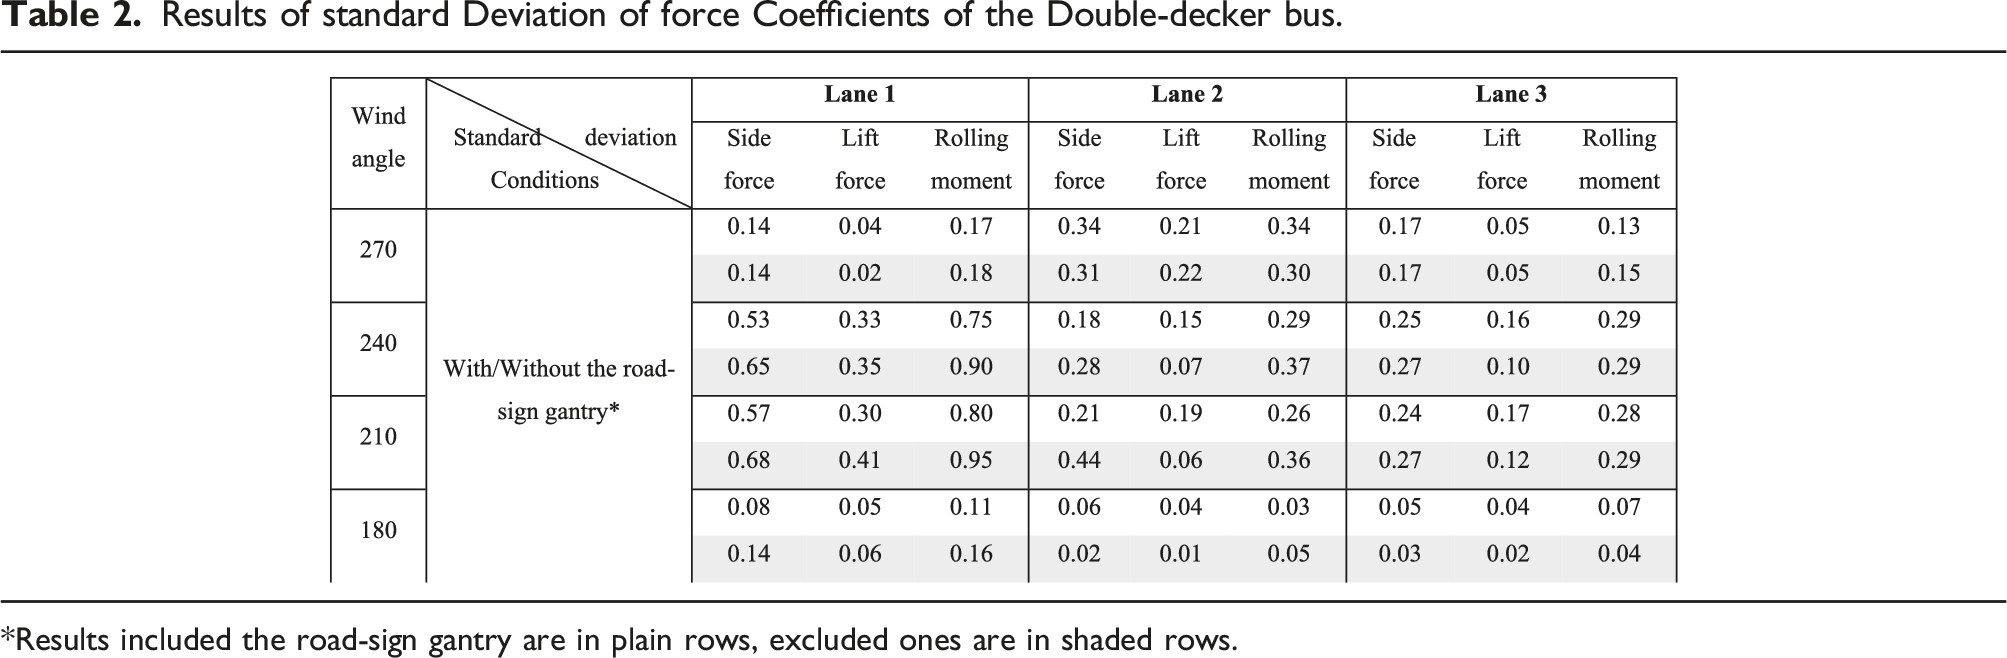
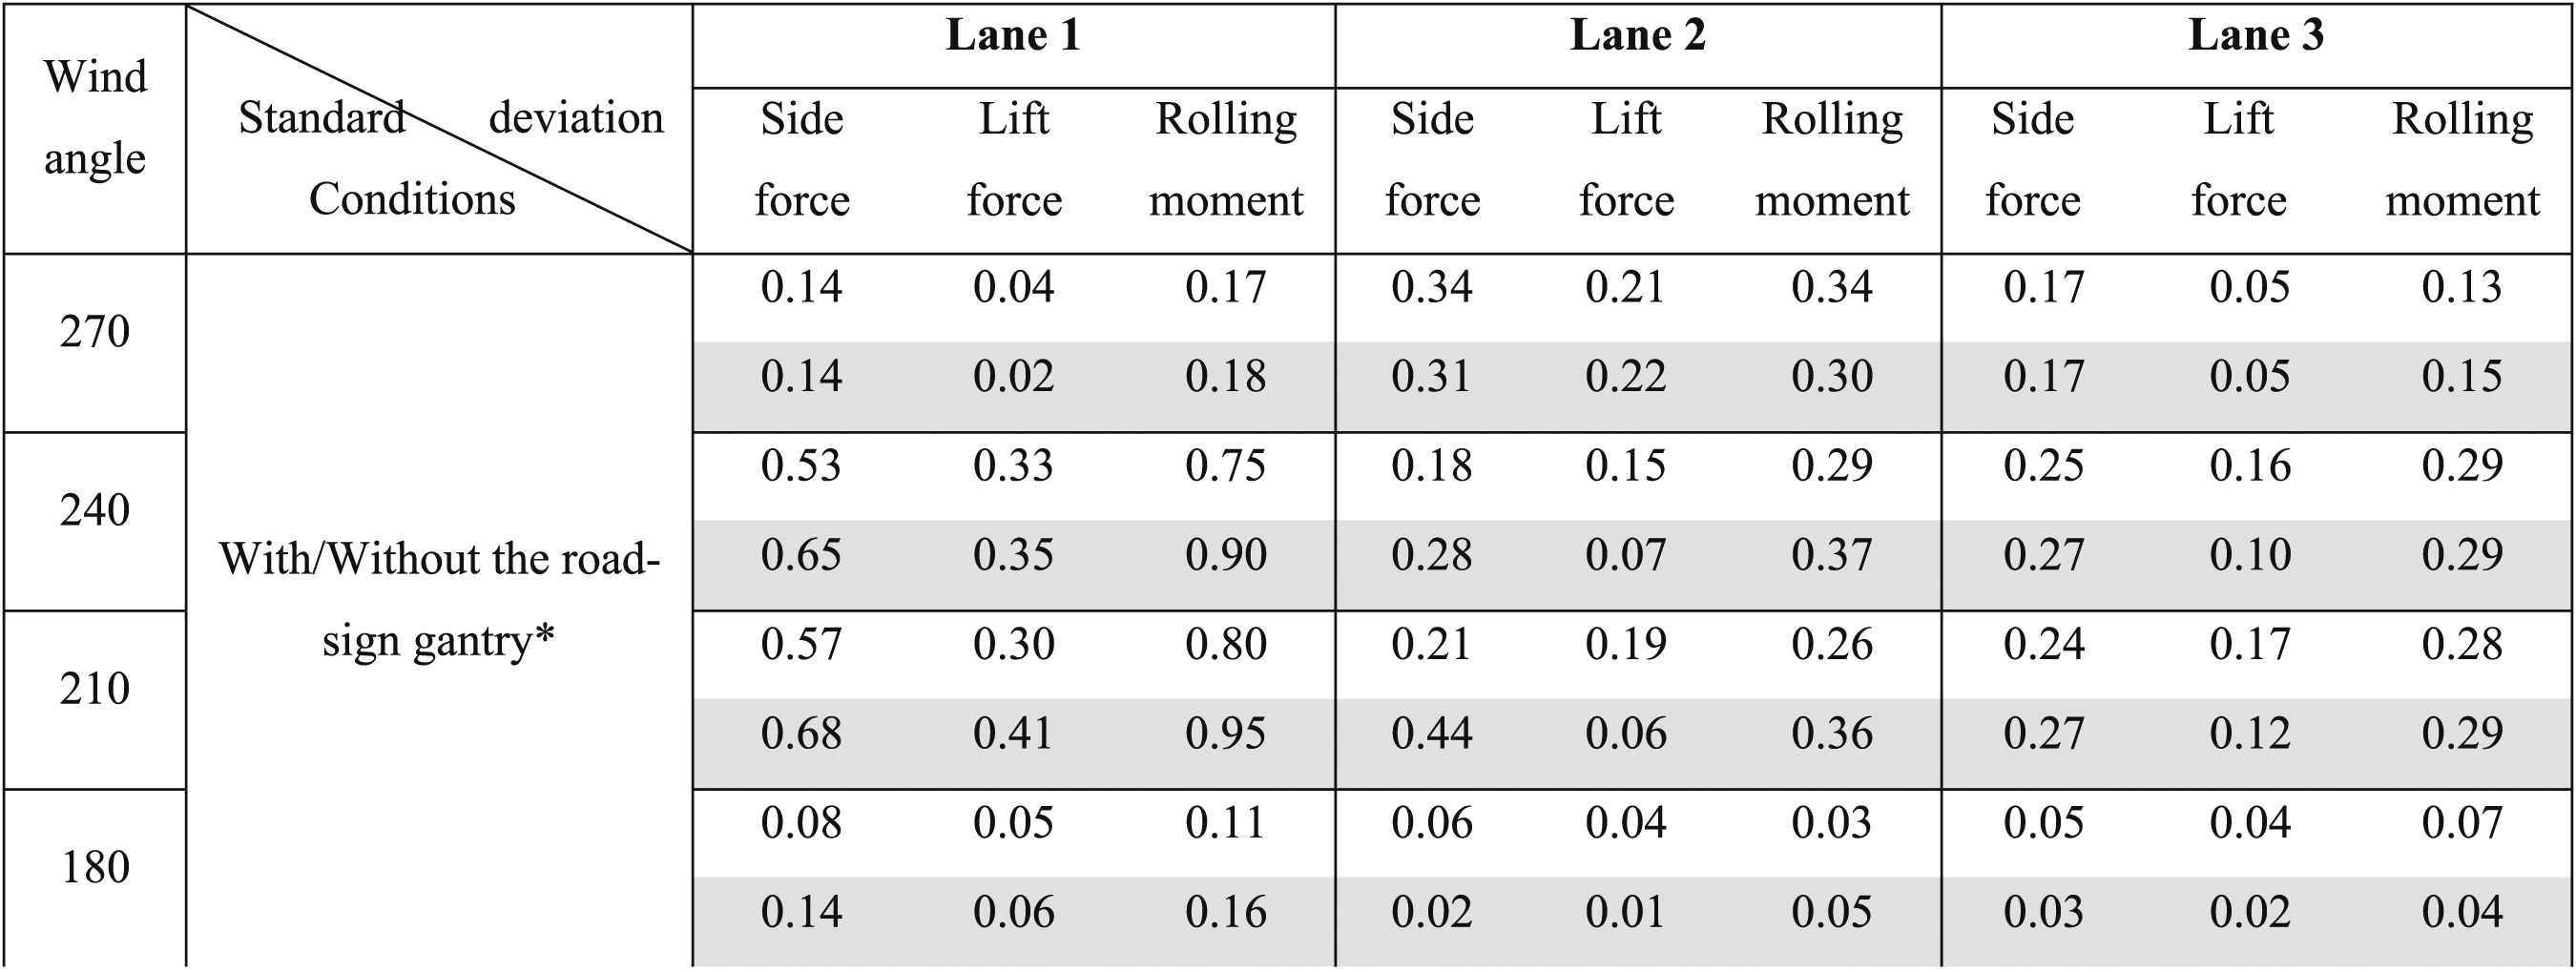
*Results included the road-sign gantry are in plain rows, excluded ones are in shaded rows.
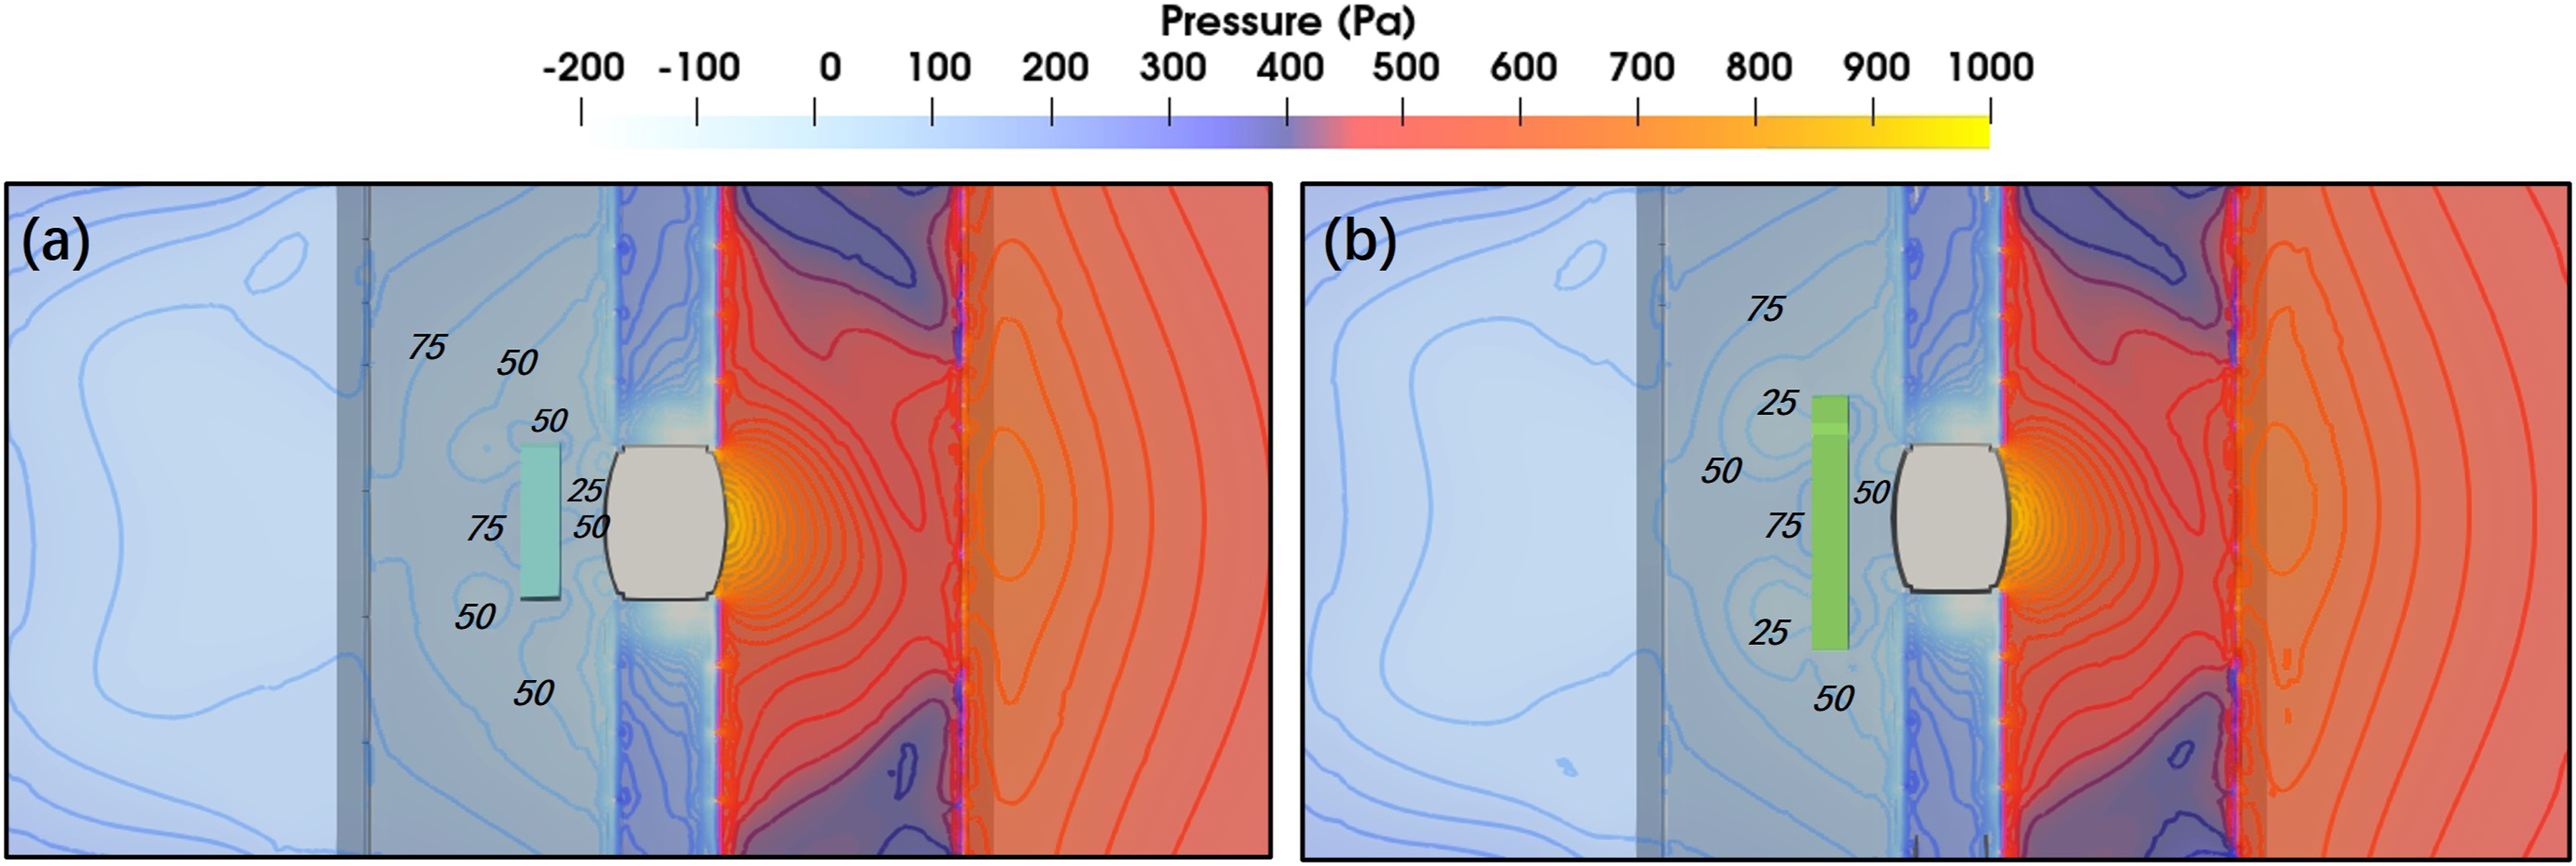
Pressure field contours of vehicles on Lane one under wind yaw angle of 270 degrees: (a) the double-decker bus and (b) the truck.
Results of the effect of the tower shielding
Results of aerodynamic force conditions of the Truck.
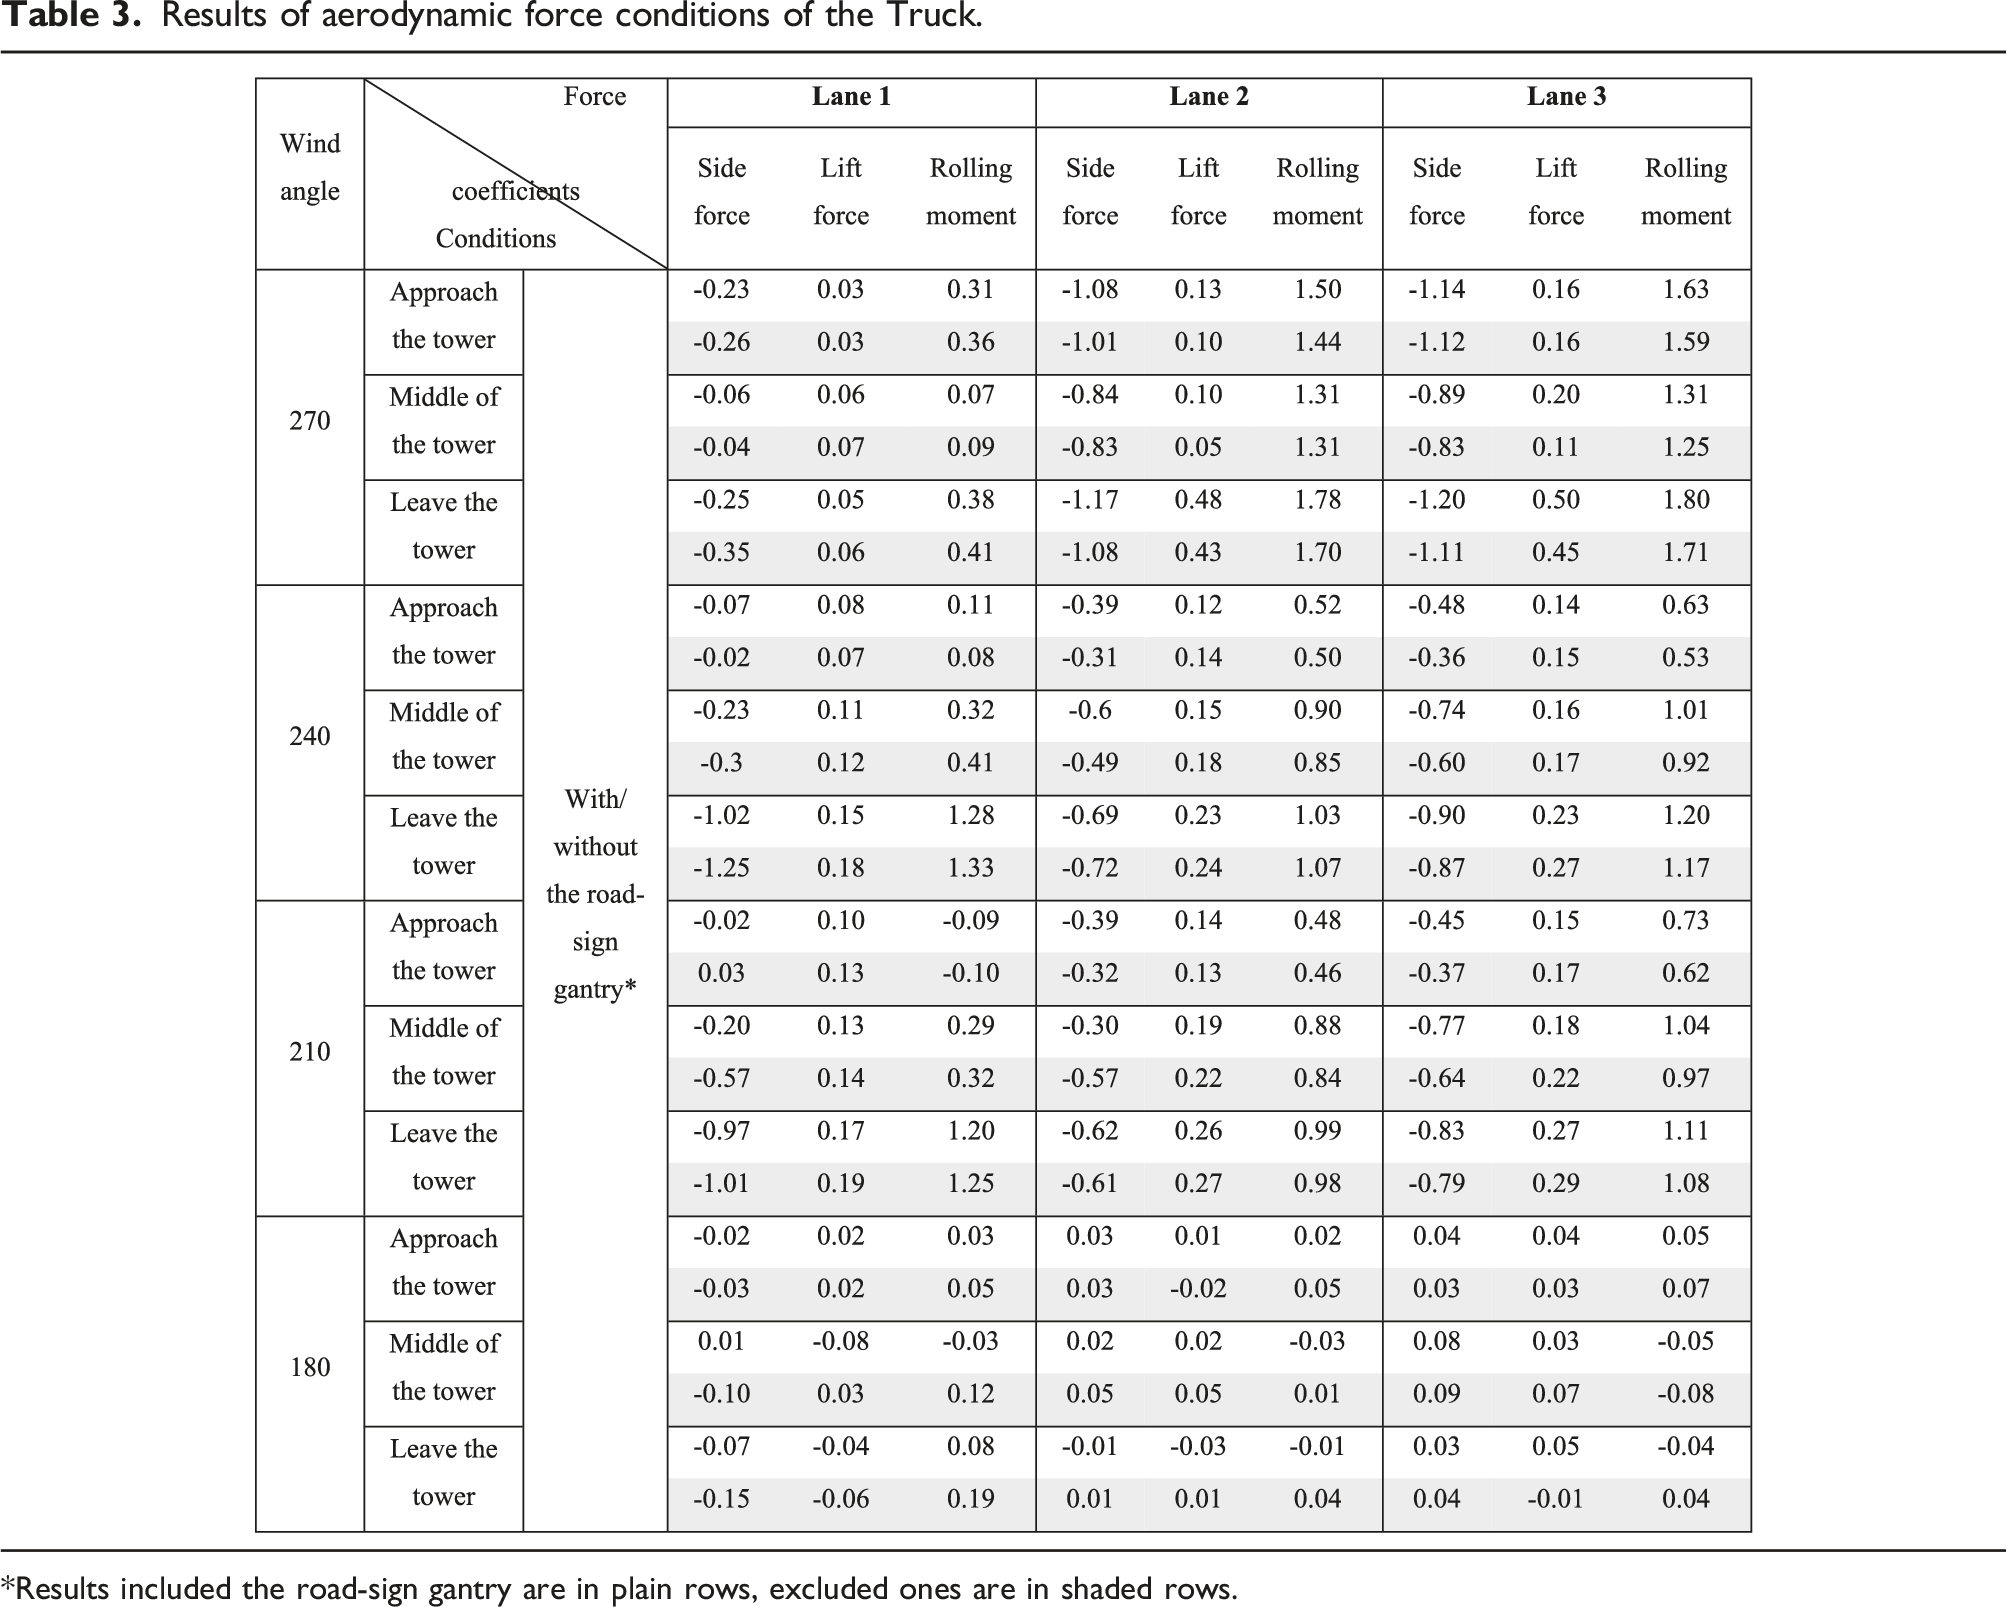
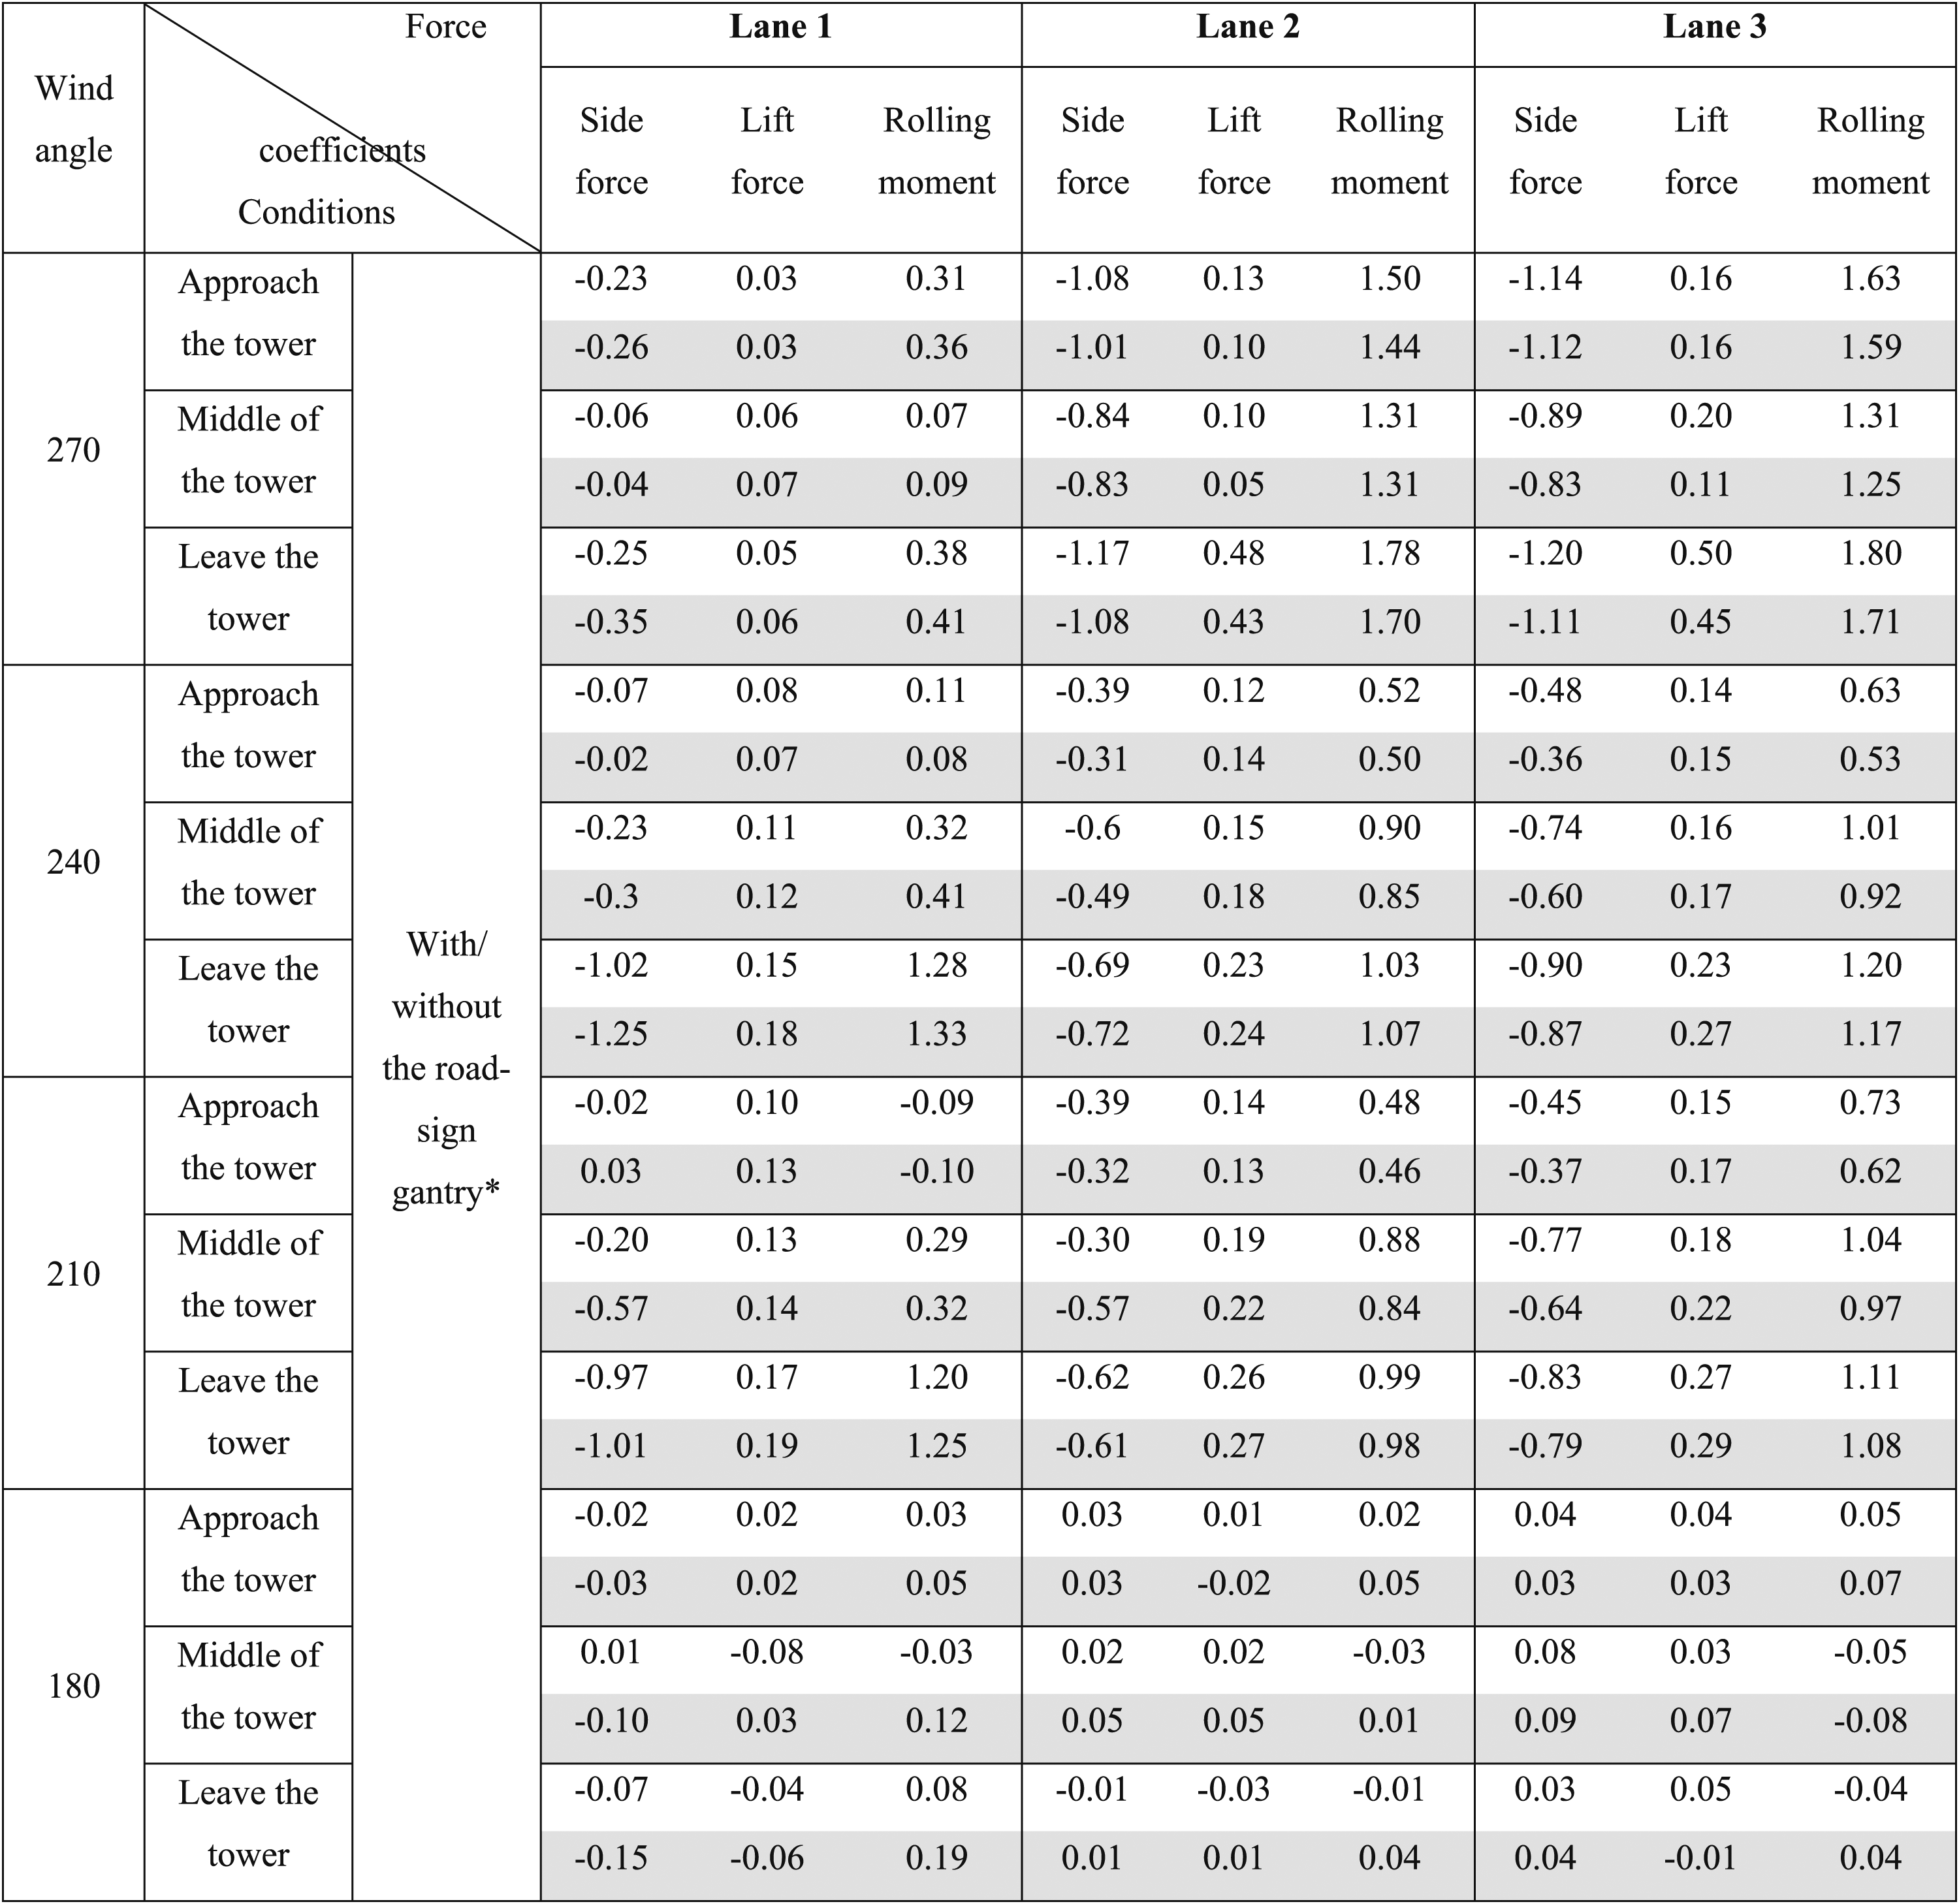
*Results included the road-sign gantry are in plain rows, excluded ones are in shaded rows.
Results of standard Deviation of force Coefficients of the Truck.
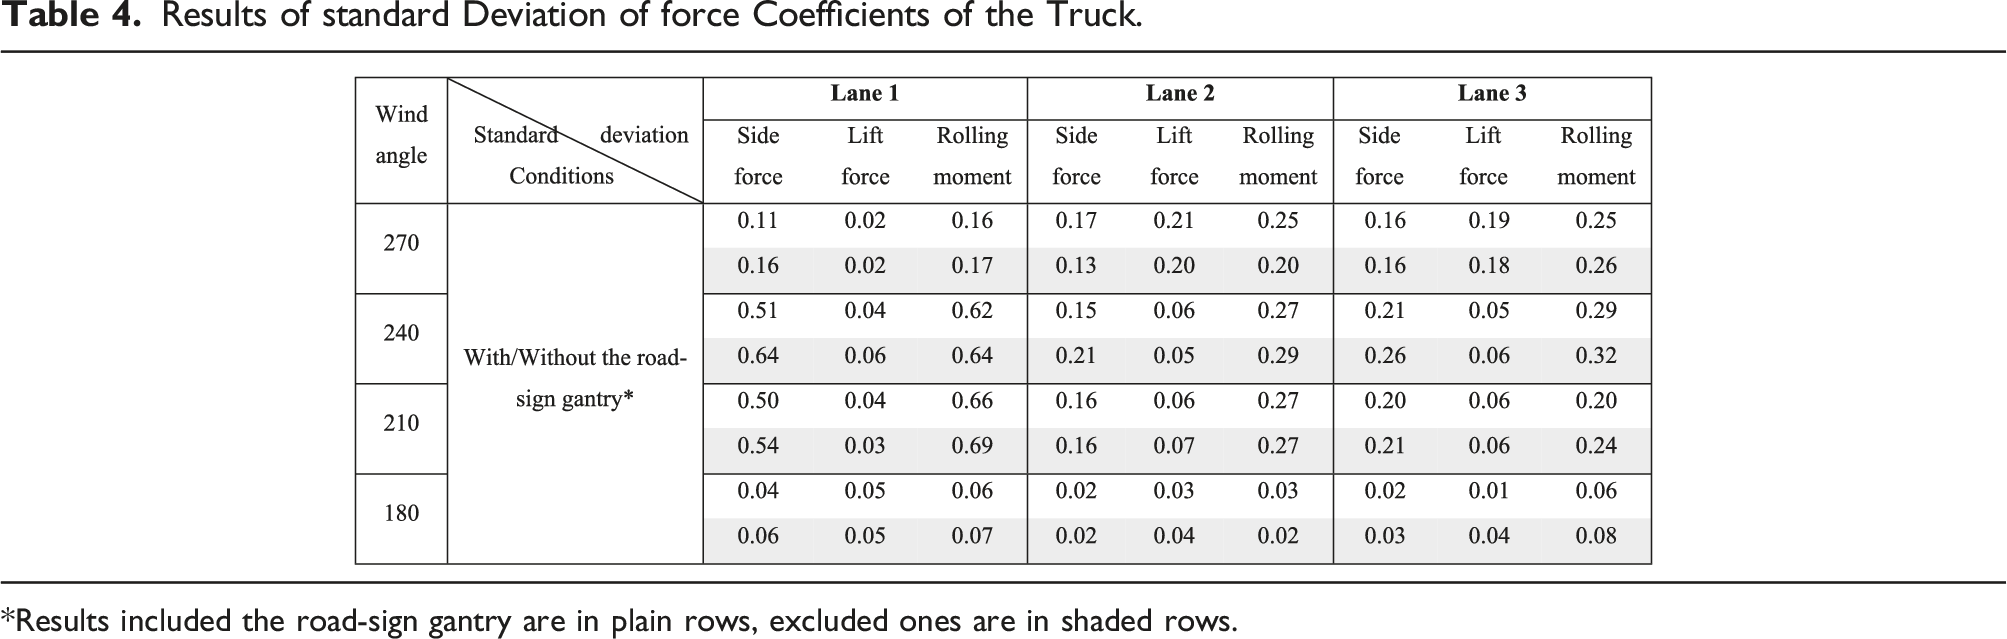
*Results included the road-sign gantry are in plain rows, excluded ones are in shaded rows.
Results of aerodynamic force conditions for the tower Shielding Study.
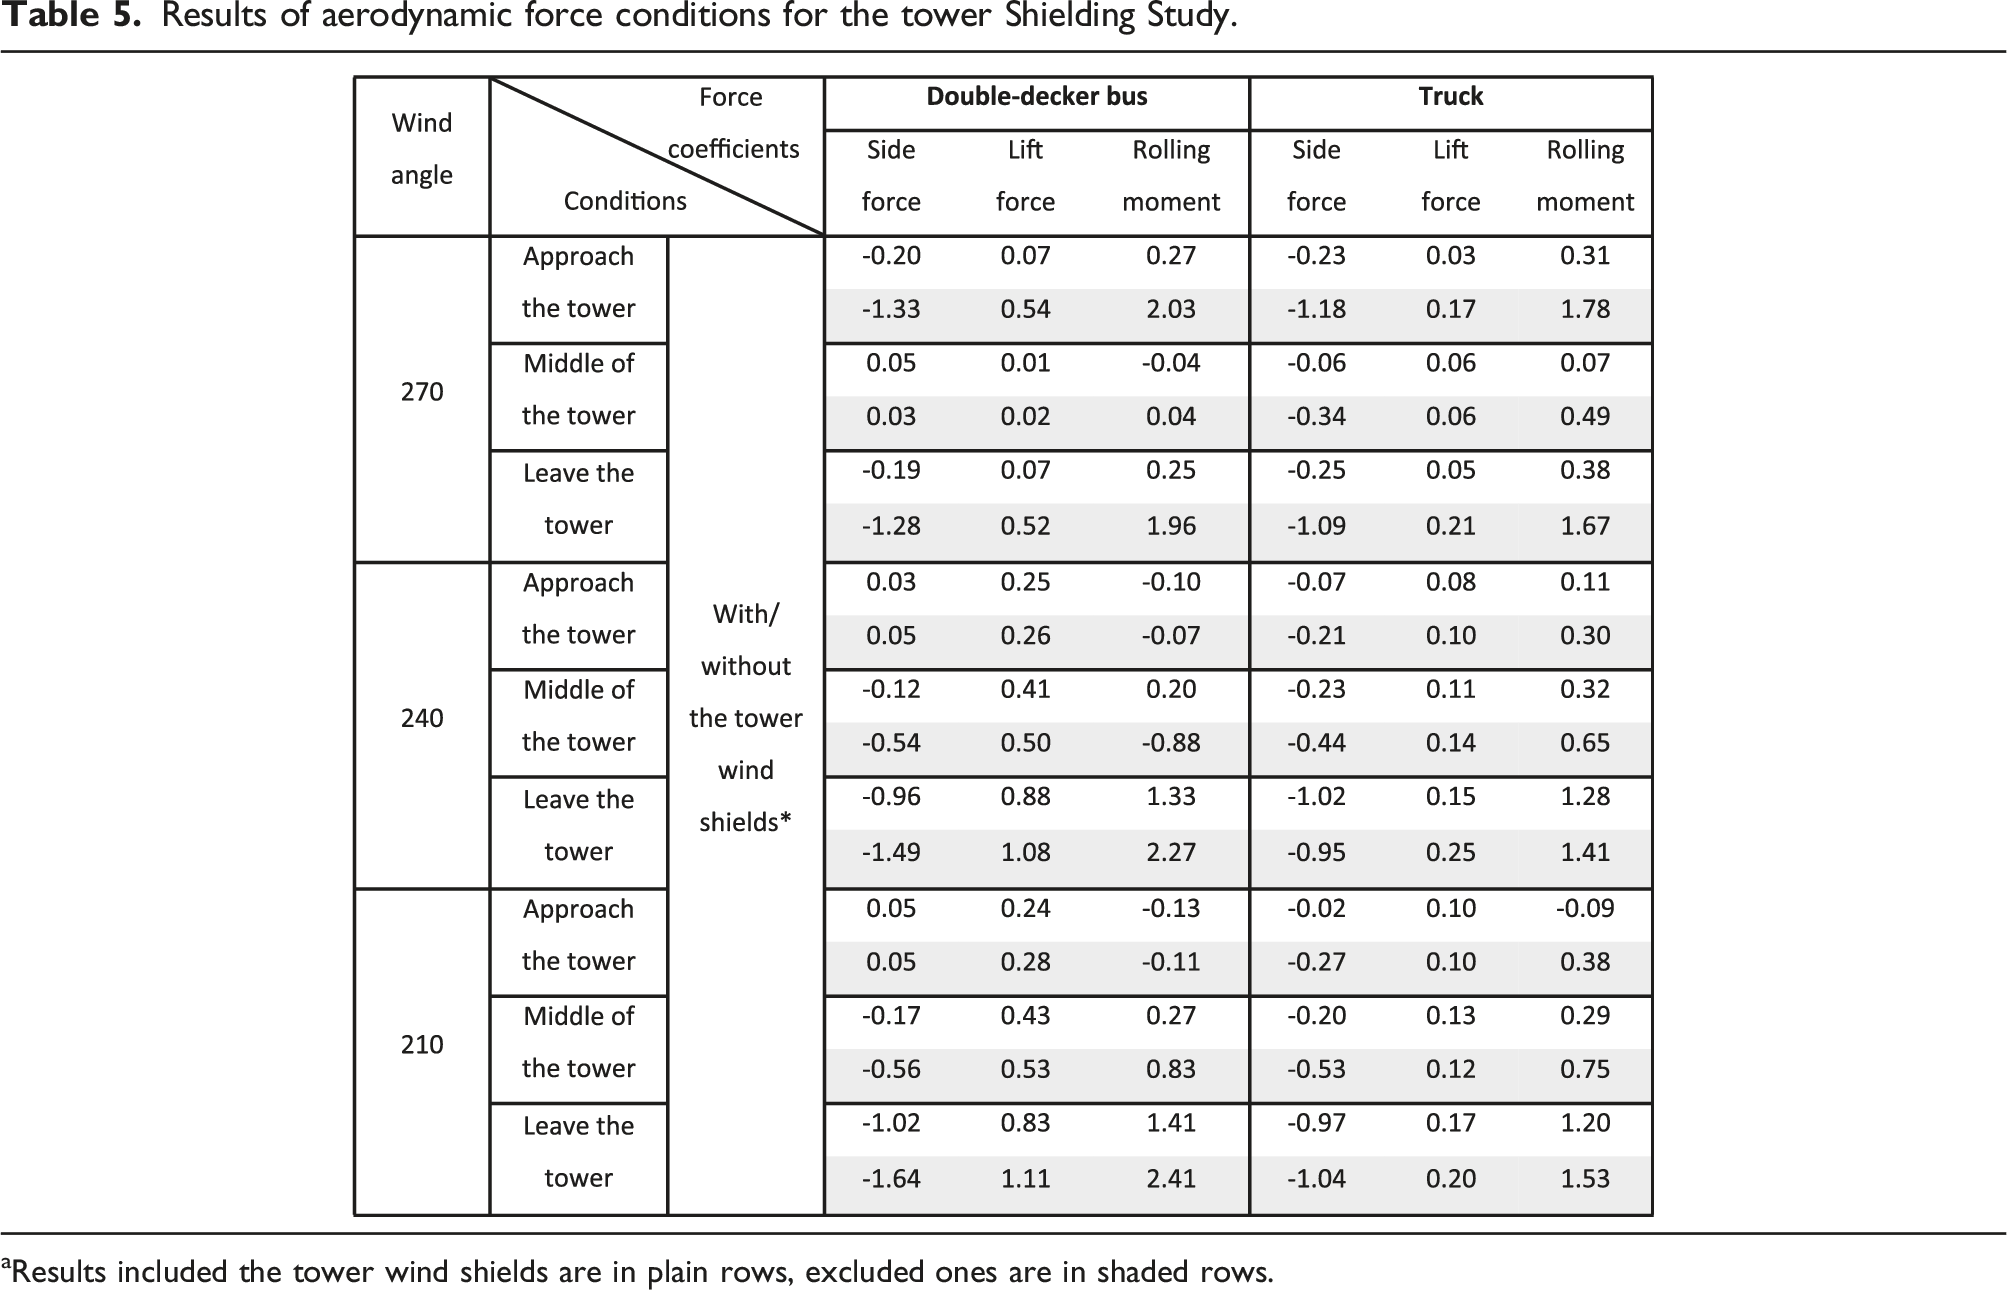
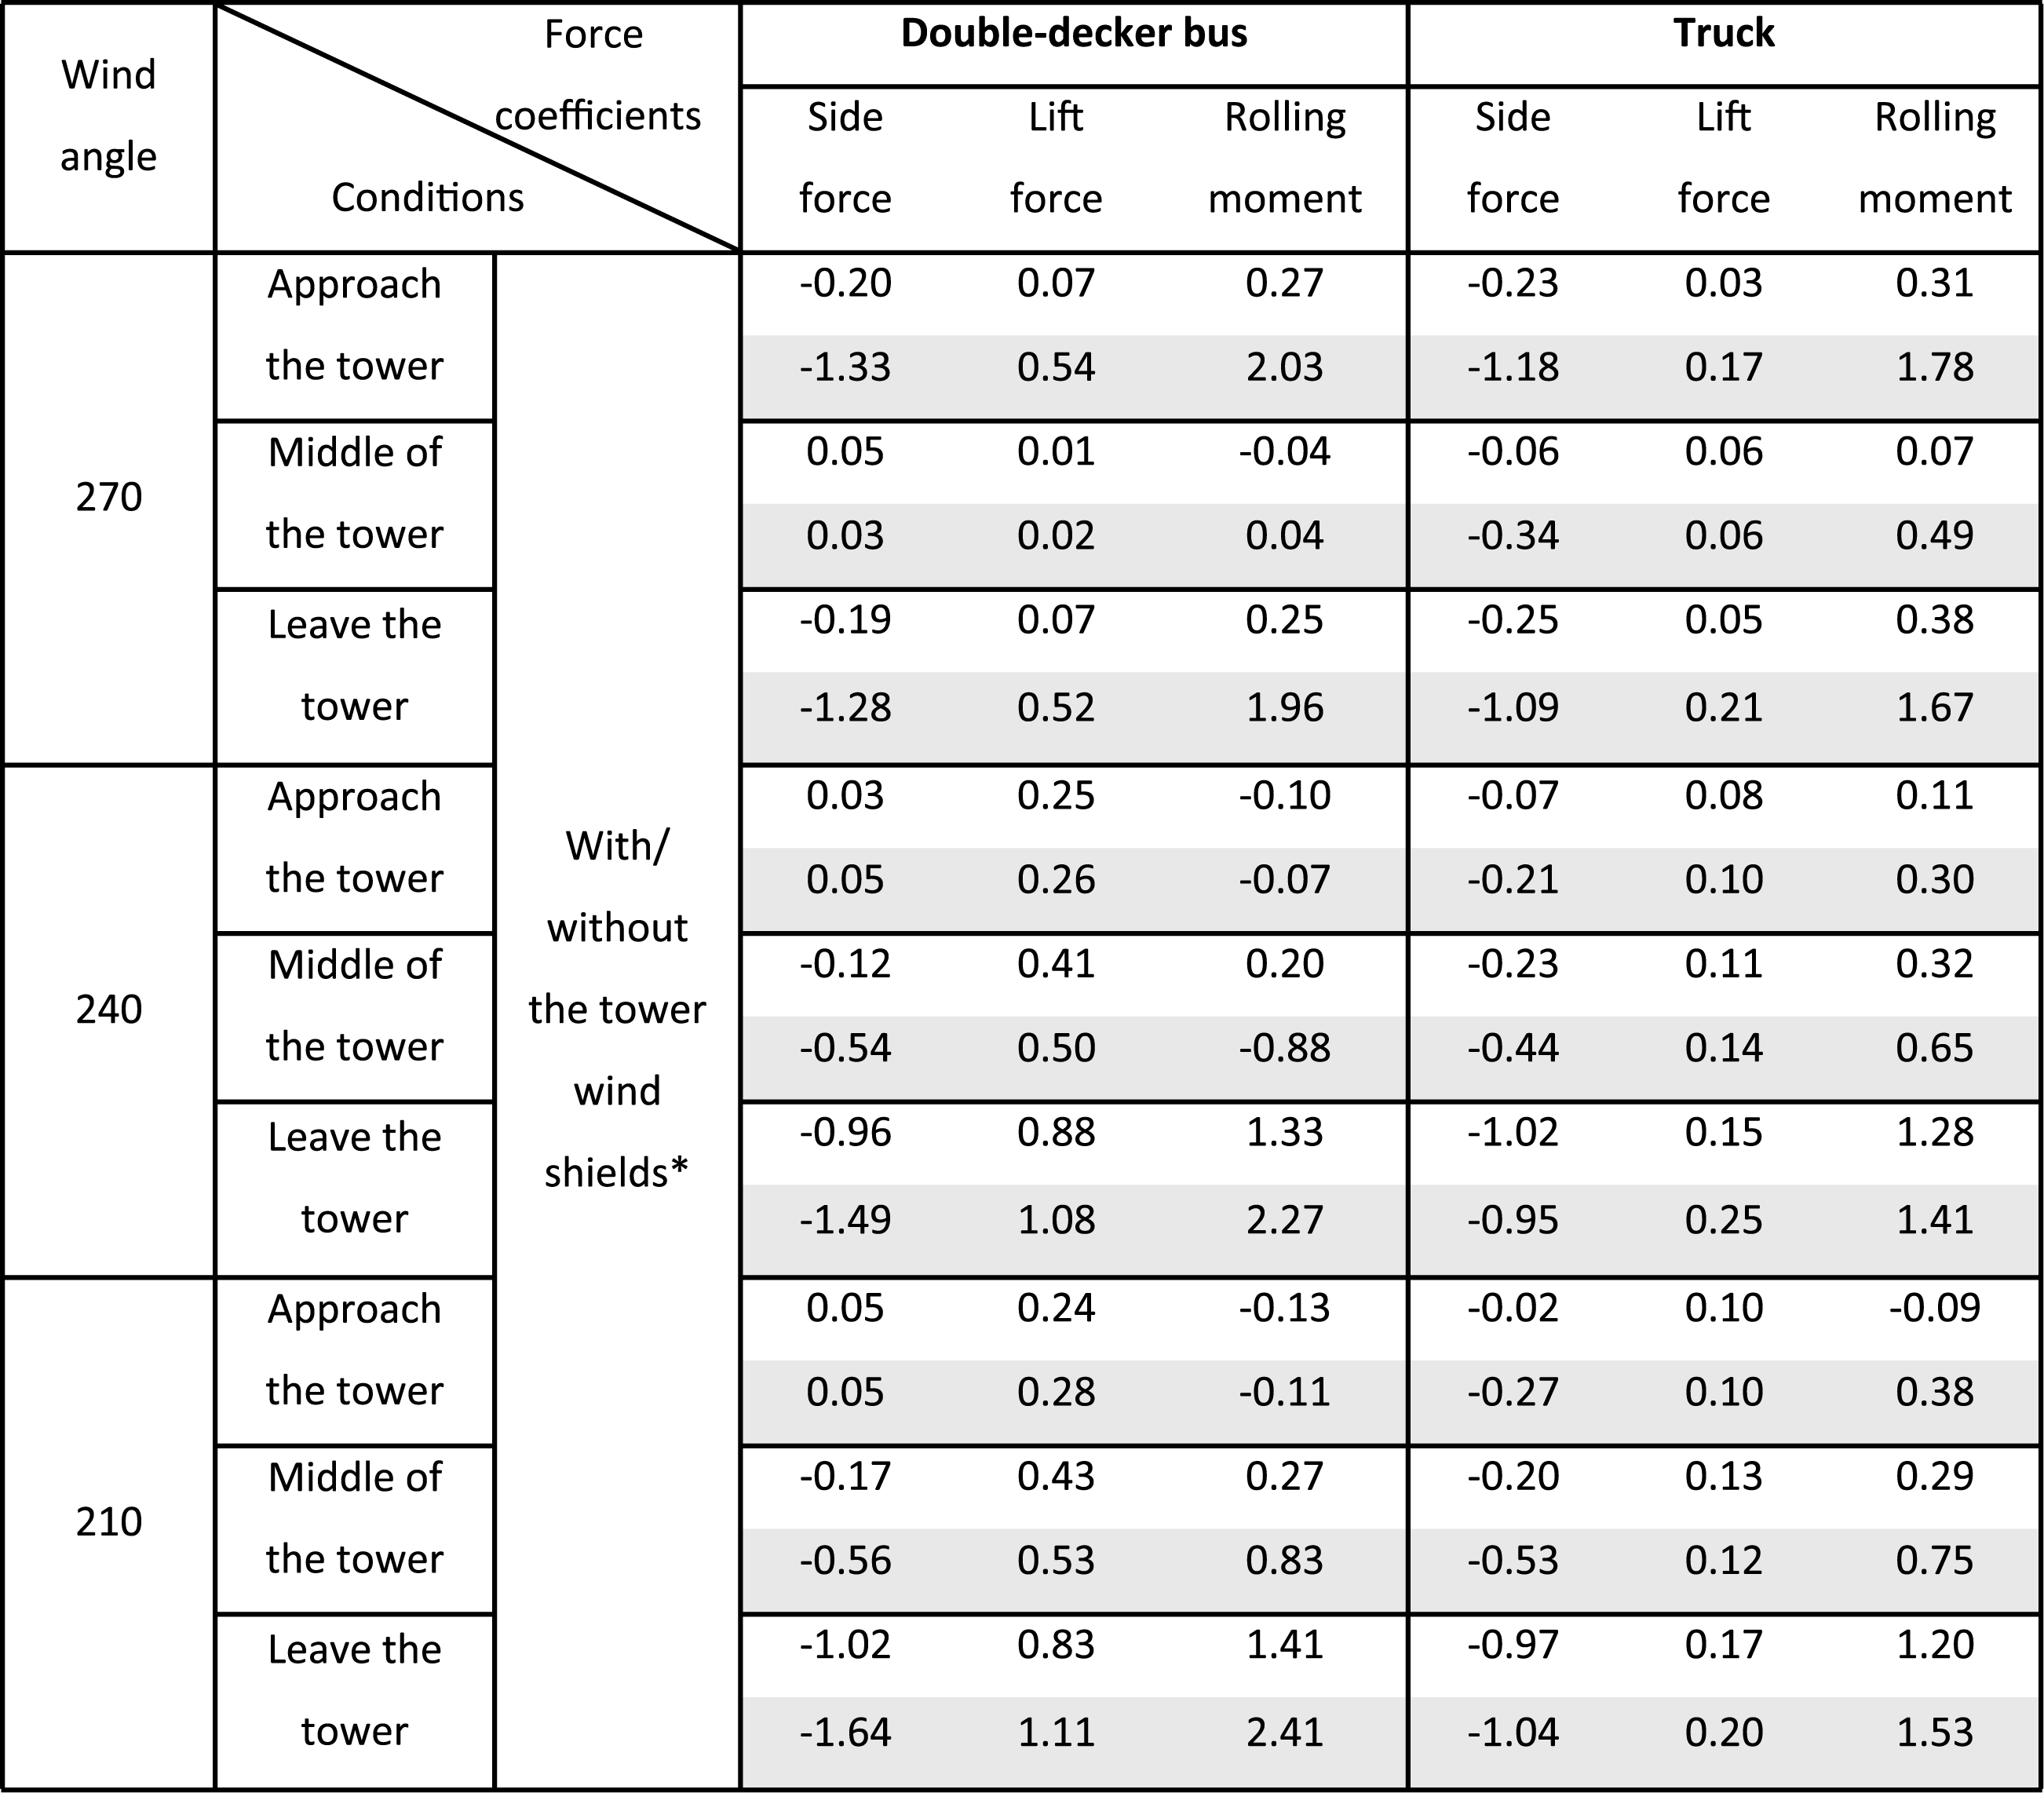
aResults included the tower wind shields are in plain rows, excluded ones are in shaded rows.
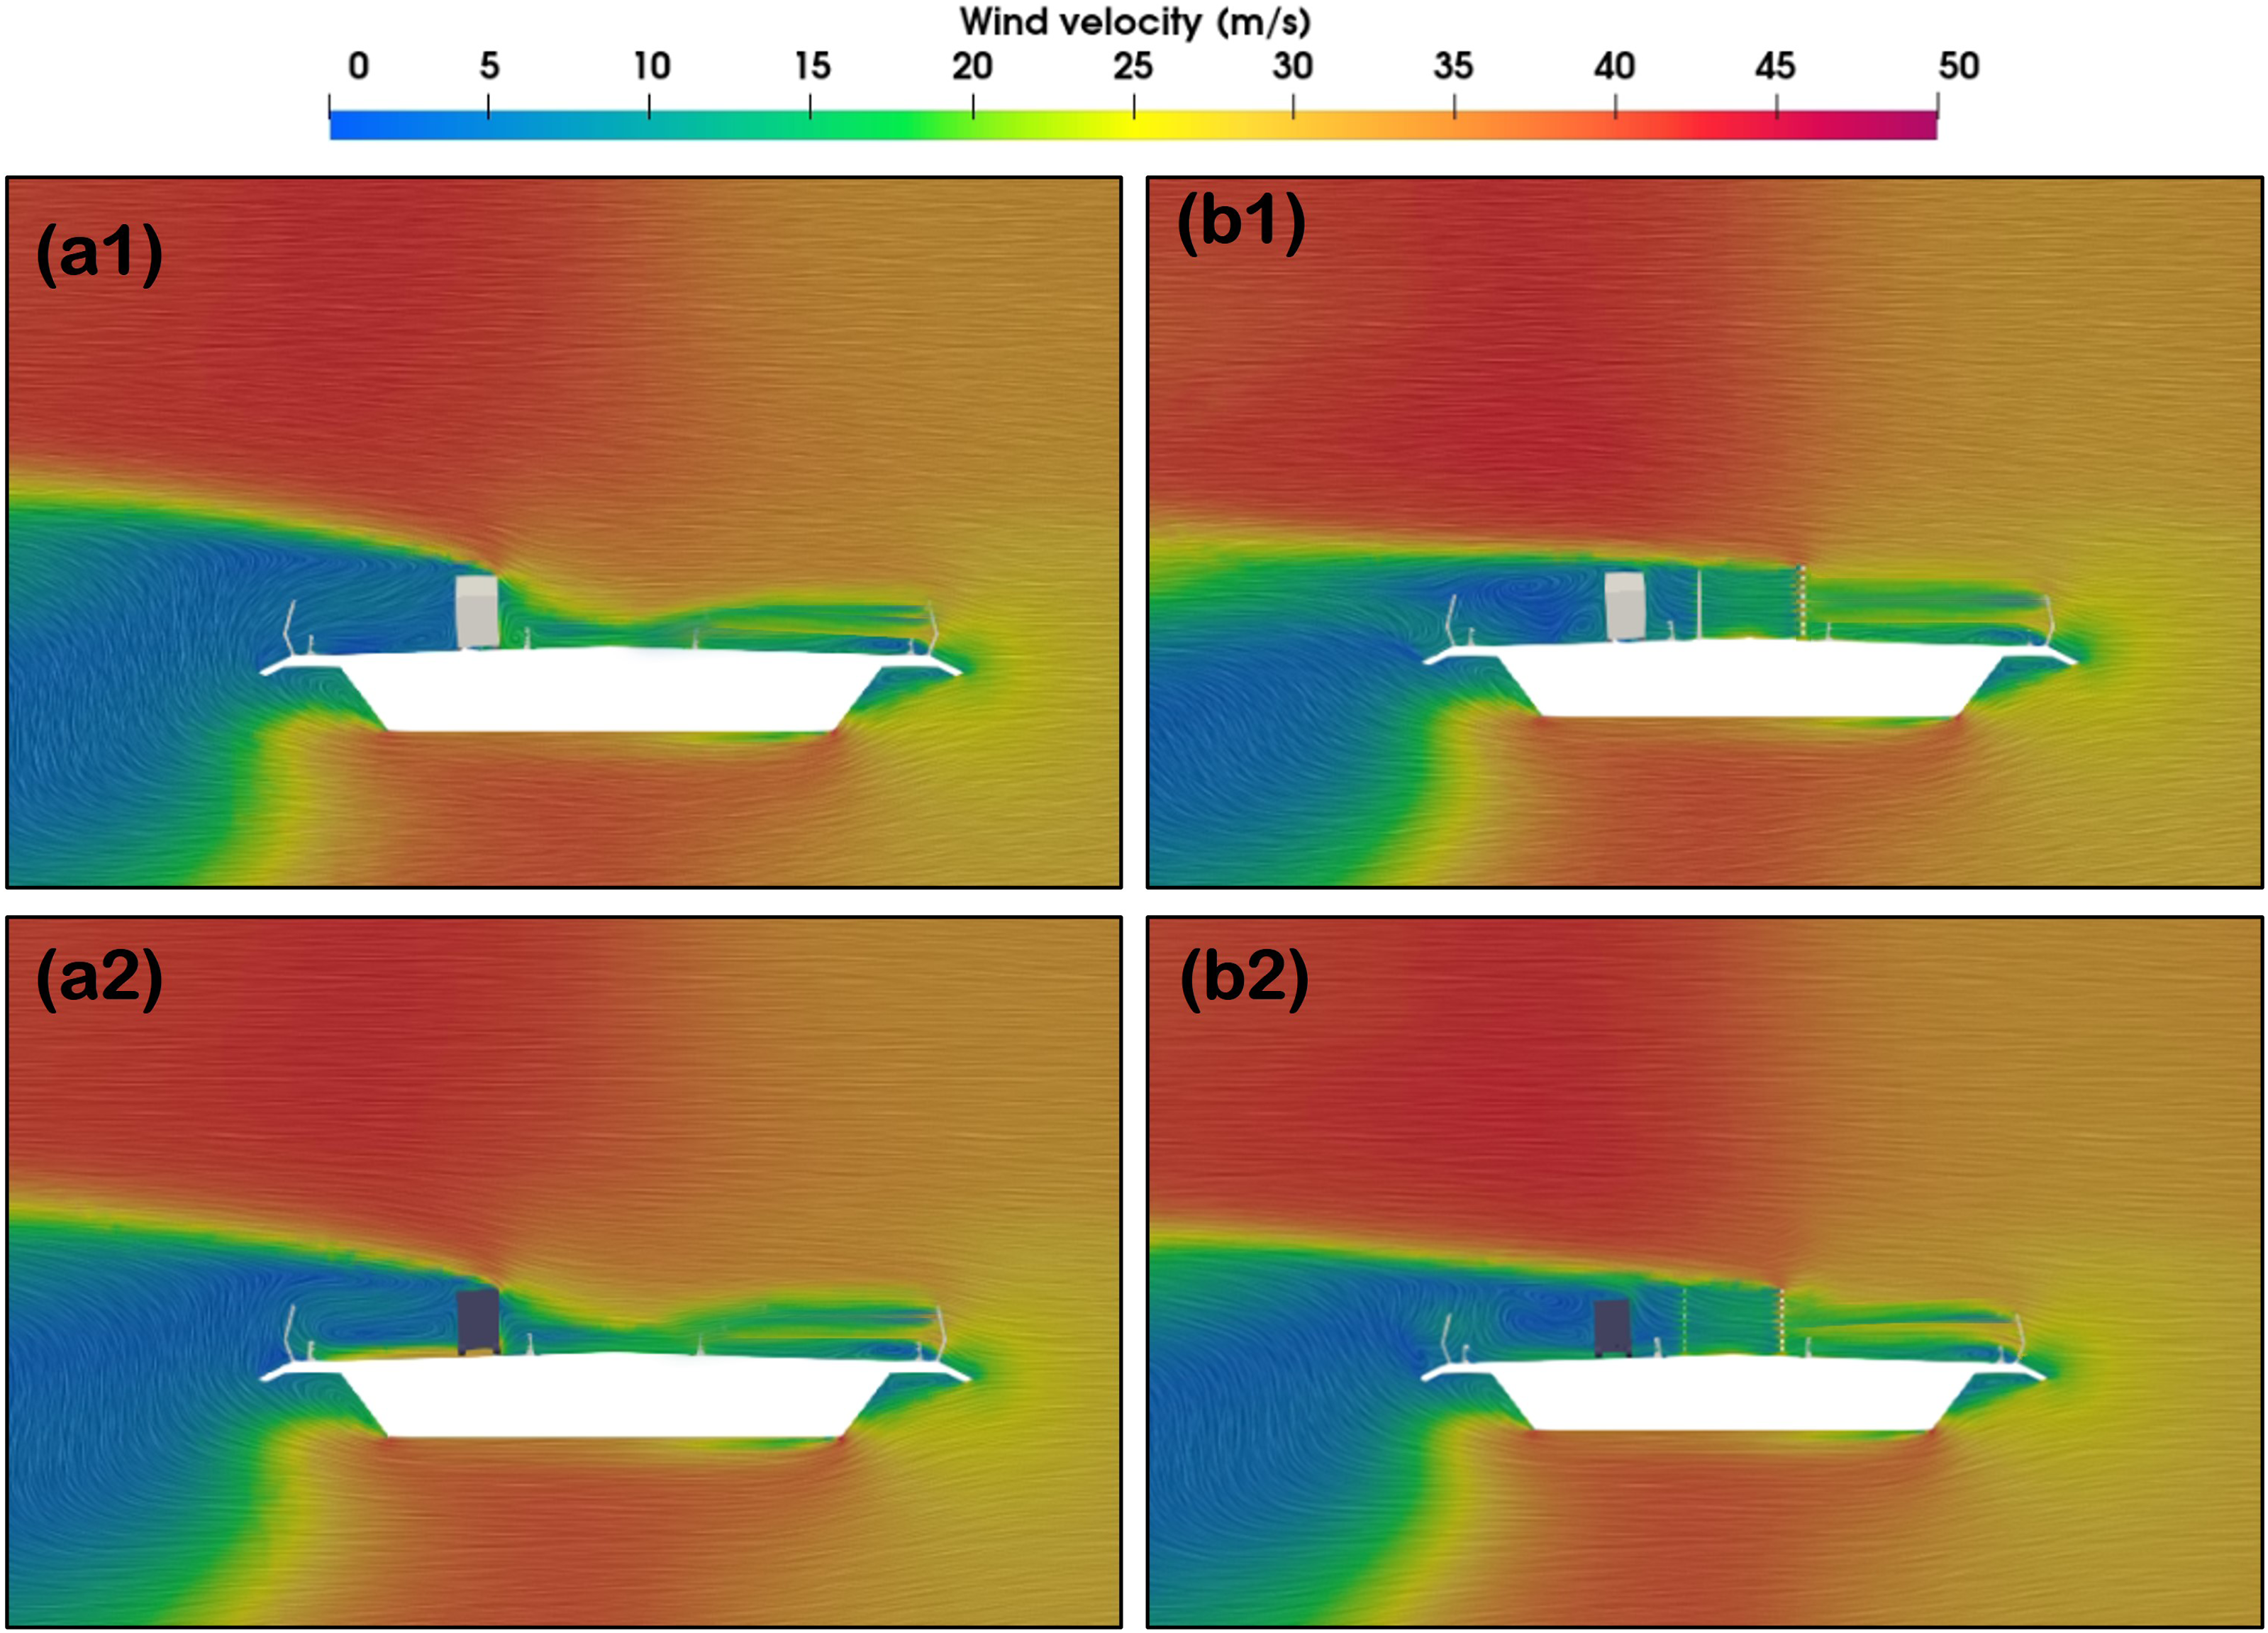
Cross-section views of wind velocity contours for the double-decker bus (white) and the truck (black) in Lane one under wind yaw angle of 270 degrees: (a1, a2) without the tower wind shields and (b1, b2) with the tower wind shields.
Conclusion
In this study, CFD simulations were performed on the full-scale Queensferry Crossing Bridge model in local high wind conditions. Tower wind-shielding and road-sign gantries near the bridge tower region were included. The impact of these on double-decker buses and trucks as they pass by the bridge tower were investigated, respectively. The effect of the road-sign gantry on vehicle aerodynamics in wind yaw angles of 270, 240, 210 and 180 degrees was investigated with the vehicle considered in three different traffic lanes. In the case of the analysis of the tower shielding, simulations were carried out for the leeward side Lane one under yaw angles of 270, 240 and 210 degrees.
For both the double-decker bus and the truck, the road-sign gantry showed similar effects on them while they passed by the bridge tower. Significant impacts were found when the wind yaw angles were 240 and 210 degrees. The road-sign gantry tended to shelter the leeward side of the high-sided vehicles from high winds as the fluctuations in vehicle force coefficients was lower by 18.5% on average. When the high-sided vehicles were on the windward side, the presence of the road-sign gantry increased the aerodynamic forces of the vehicles as they arrived at the bridge tower and then sheltered them as they left. Therefore, the road-sign gantry has the potential to benefit drivers in creating relatively stable driving conditions. The tower shielding was found to protect high-side vehicles from high winds also. The average reduction rate for both double-decker bus and truck on aerodynamic force coefficients was 82.1% when winds blew from the west (270 degrees). Force fluctuations were lowered by 63.8% on average. Although the effectiveness of the tower shielding reduced as the yaw angle altered from 270 degrees to 210 degrees, the average reduction rate of the aerodynamic force coefficients and force fluctuations were not lower than 38% and 40.2%, respectively.
Furthermore, this study has shown the necessity and significance on investigating wind effects of secondary facilities on traffic and bridges. Combinations of different deck of decks, towers and wind posts with various secondary facilities may result in unpredictable wind effects. To mitigate the potential risk from complex wind conditions around bridge tower regions to the traffic, results from this work demonstrated that tower shielding is a valid and efficient protection which ought to be designed and installed on other bridge structures. Besides, considering the inevitable existence and complicated effects of road-sign gantries, conspicuous warnings may be required to reminder drivers to be cautious or slow down driving speed in high wind conditions. This work also showed the feasibility and significance of full-scale CFD applications on engineering of long-span bridges. Full-scale CFD simulations could be applied for investigations which are inconvenient to conduct on site. The practical insights provided by full-scale simulations could directly be a valuable reference for bridge engineers.
Footnotes
Acknowledgments
The authors would like to acknowledge the PhD scholarship awarded jointly by University College Dublin and the China Scholarship Council (No.201908300012). The authors would like to acknowledge the support given by Transport Scotland and Arup Consulting Engineers to this work. The authors also wish to acknowledge the Irish Centre for High-End Computing (ICHEC) for the provision of computational facilities and technical support.
Declaration of conflicting interests
The author(s) declared no potential conflicts of interest with respect to the research, authorship, and/or publication of this article.
Funding
The author(s) disclosed receipt of the following financial support for the research, authorship, and/or publication of this article: This work was supported by the China Scholarship Council, (201908300012).