
Abstract
The performance research based on numerical and experimental studies on ultra-high performance concrete (UHPC) generally considers it as an isotropic material, which is obviously different from what it really is in practical engineering. A database of UHPC compressive strength was investigated, having the same UHPC mix proportion as the field blast experiment, to show how the strength of UHPC varies in compression. It is found that Weibull distribution is the best fit of its probability model. A combination of Monte-Carlo and Finite Element method is used, adopting the available UHPC compressive strength, to reproduce the field blast test on UHPC columns. Both the non-spatial and spatial variability of material properties of the UHPC columns are under consideration to conduct the UHPC column strength prediction under blast loads. The residual loading capacity, damage index and failure mode of UHPC columns with different sizes damaged by different explosion severities are obtained by non-spatial simulation and spatial simulation respectively. It can be concluded that compared with the non-spatial model, the numerical simulation results of the spatial model are closer to the experimental situation. Therefore, inclusion of spatial variability is recommended for reliability-based blast-resistant design for UHPC column.
Keywords
Introduction
Ultra-high performance concrete (UHPC) is a relatively new material formulated by combining Portland cement, silica fume, silica flour, silica sand, superplasticizer, water and steel or organic fibers. It has been used internationally (Bajaber and Hakeem, 2021; Du et al., 2021; Li et al., 2020) in the civil engineering due to its high strength, high ductility and high durability compared with normal strength concrete materials in the recent decade.
The development of novel UHPC material with nanotechnology and fibre reinforcements has recently attracted great research attention. Steel fibres produce great impact, abrasion and shatter resistance in concrete (Soufeiani et al., 2016; Sun et al., 2018), thus reduce flexural, shear and spall damage which are quite common in normal strength concrete (Li and Hao, 2013, 2014). Furthermore, owing to the ultra-fine size of nano materials, addition of nanoscale particles results in significantly improved material properties without change in the material composition (Su et al., 2016). There has been a growing interest in use of nanoscale materials in concrete (Amin et al., 2021; Faried et al., 2021; Jalal et al., 2013; Li et al., 2004; Onaizi et al., 2021; Qing et al., 2007), and it is reported that the inclusion of nanoscale particles into the concrete matrix favours its mechanical performance (Jo et al., 2007; Liu et al., 2012). Jo et al. (2007) found that the compressive strengths of mortars with Nano-SiO2 particles were higher than those of mortars containing silica fume at 7 and 28 days during his experimental investigation. Liu et al. (2012) added Nano-CaCO3 into the cement paste and the experimental results revealed that the compressive strength and flexural strength increased with the addition of Nano-CaCO3 at the age of 7 days and 28 days.
It is widely believed that the large variation exists in normal concrete materials (Stewart and Mullard, 2007; Xu and Li, 2018), while some researchers reported that the similar variation lies in UHPC as well (Graybeal, 2007). Graybeal (2007) has performed an experimental program on 138 cylinders cast within 22 batches and 88 cylinders cast within 13 batches, indicating that the coefficient of variations of the ultra-high performance fibre reinforced concrete (UHPFRC) specimens is as high as 0.10 and 0.09 for steam-treated and untreated compressive strengths, respectively. Graybeal and Davis (2008) conducted an experimental program including different dimensions of UHPFRC cylinders and cubes, confirming that the coefficient of variations of these specimens ranging from 0.01 to 0.09. Reeves (2004) has conducted eight flexural tests in his study and found these flexural load capacities of the UHPC beam tested ranging from 33.87 kN to 70.28 kN with coefficient of variation (COV) being 0.26. Awinda et al. (2016) stated that the maximum load capacity is much higher than the minimum data - as high as 56.4% - based on the test results among the only three of 100-mm deep UHPFRC test specimens.
Stewart (2004) found that the material and dimensional properties of concrete structures would not be homogeneous due to the spatial variability of workmanship environment and other factors. Shi and Stewart (Shi and Stewart, 2015a, 2015b) conducted the strength design and reliability analysis for reinforced concrete columns and panels subjected to explosive blast load, considering the variability of concrete, steel reinforcement, and blast loading. They found that the spatial model (considering the spatial variability of the materials) can lead to more accurate predictions of damage and safety risks. Hao et al. (2010) considered the variability of column size, reinforcement ratio and material strength, the reliability of three concrete columns under random explosion load was analyzed. The numerical results revealed that the influence of statistical change in explosion load was more significant than that of column characteristics. Ignoring the random variation in reinforced concrete column characteristics had the least impact on the prediction of failure probability, but ignoring the random fluctuation of explosion load, the collapse probability of column under different explosive masses would lead to the wrong prediction of failure probability. Low and Hao (2001, 2002) calculated the failure probability of components by considering the variability of blast loads and reinforced concrete slabs. To determine the parameters which have great influence on the performance of the slab, parametric studies were carried out. It is noted that the length of the slab had no effect on the failure probability, but increasing the thickness of the slab, the percentage of steel reinforcement and reducing the stiffness of the slab by changing its supported conditions all had positive effects on the flexural response of the reinforced concrete slab.
The present study predicts the strength of UHPC columns under blast loads, considering the variability of the UHPC columns and blast loads, using a validated 3-D Finite Element Model (FEM), combined with the Monte-Carlo simulation (MCS). Firstly, the random variation law of the compressive strength of UHPC was experimentally studied. Secondly, using the collected compressive strength database and Ls-Dyna software, a 3-D FEM of UHPC column under blast loads was established, and the model was validated based on the field blasting test. Then, MCS method was used to establish the non-spatial and spatial 3-D FEM of UHPC columns under blast loads. The residual loading capacity, damage index and failure mode of UHPC columns after explosion were obtained, and the strength prediction of UHPC columns under blast loads and the comparison results of non-spatial simulation and spatial simulation were realized. Finally, three UHPC columns with different sizes were designed according to relevant specifications. The residual loading capacity, damage index and failure mode of the three UHPC columns were simulated and predicted by using the established non-spatial model and spatial model.
Ultra-high performance concrete
Preparation of ultra-high performance concrete
Mix Proportions of UHPC (unit: kg/m3).
Compression test of ultra-high performance concrete
Compression test
The toughness of UHPC is significantly enhanced by incorporating steel fibers and nanomaterials, in comparison to normal strength concrete. In order to determine the key mechanical properties of UHPC, compression tests were conducted on cube specimens.
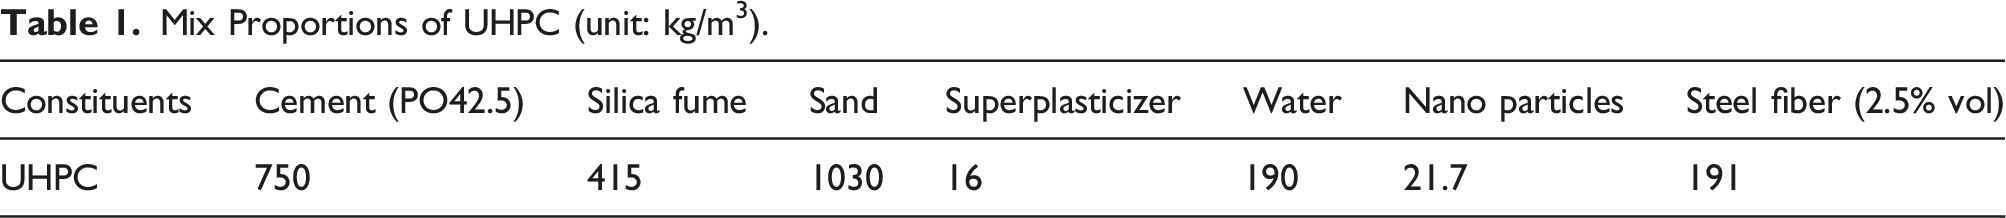
Mix all the mixture in dry conditions for 5 min and another 3 min after adding about 70% water. Then add the superplasticizer, and add the remaining 30% water. After stirring for another 5 min, add the fibre. To avoid clumping, disperse the fibres manually and add them to the mixer. All cube specimens shall be concreted in accordance with the Chinese standard (2005). Then, based on Chinese standard (2019), uniaxial compression test was carried out on the UHPC cube specimen of 100 mm × 100 mm × 100 mm in the electromechanical servo-hydraulic testing machine controlled by the computer of 3000 kN, as shown in Figure 1. Compression test setup.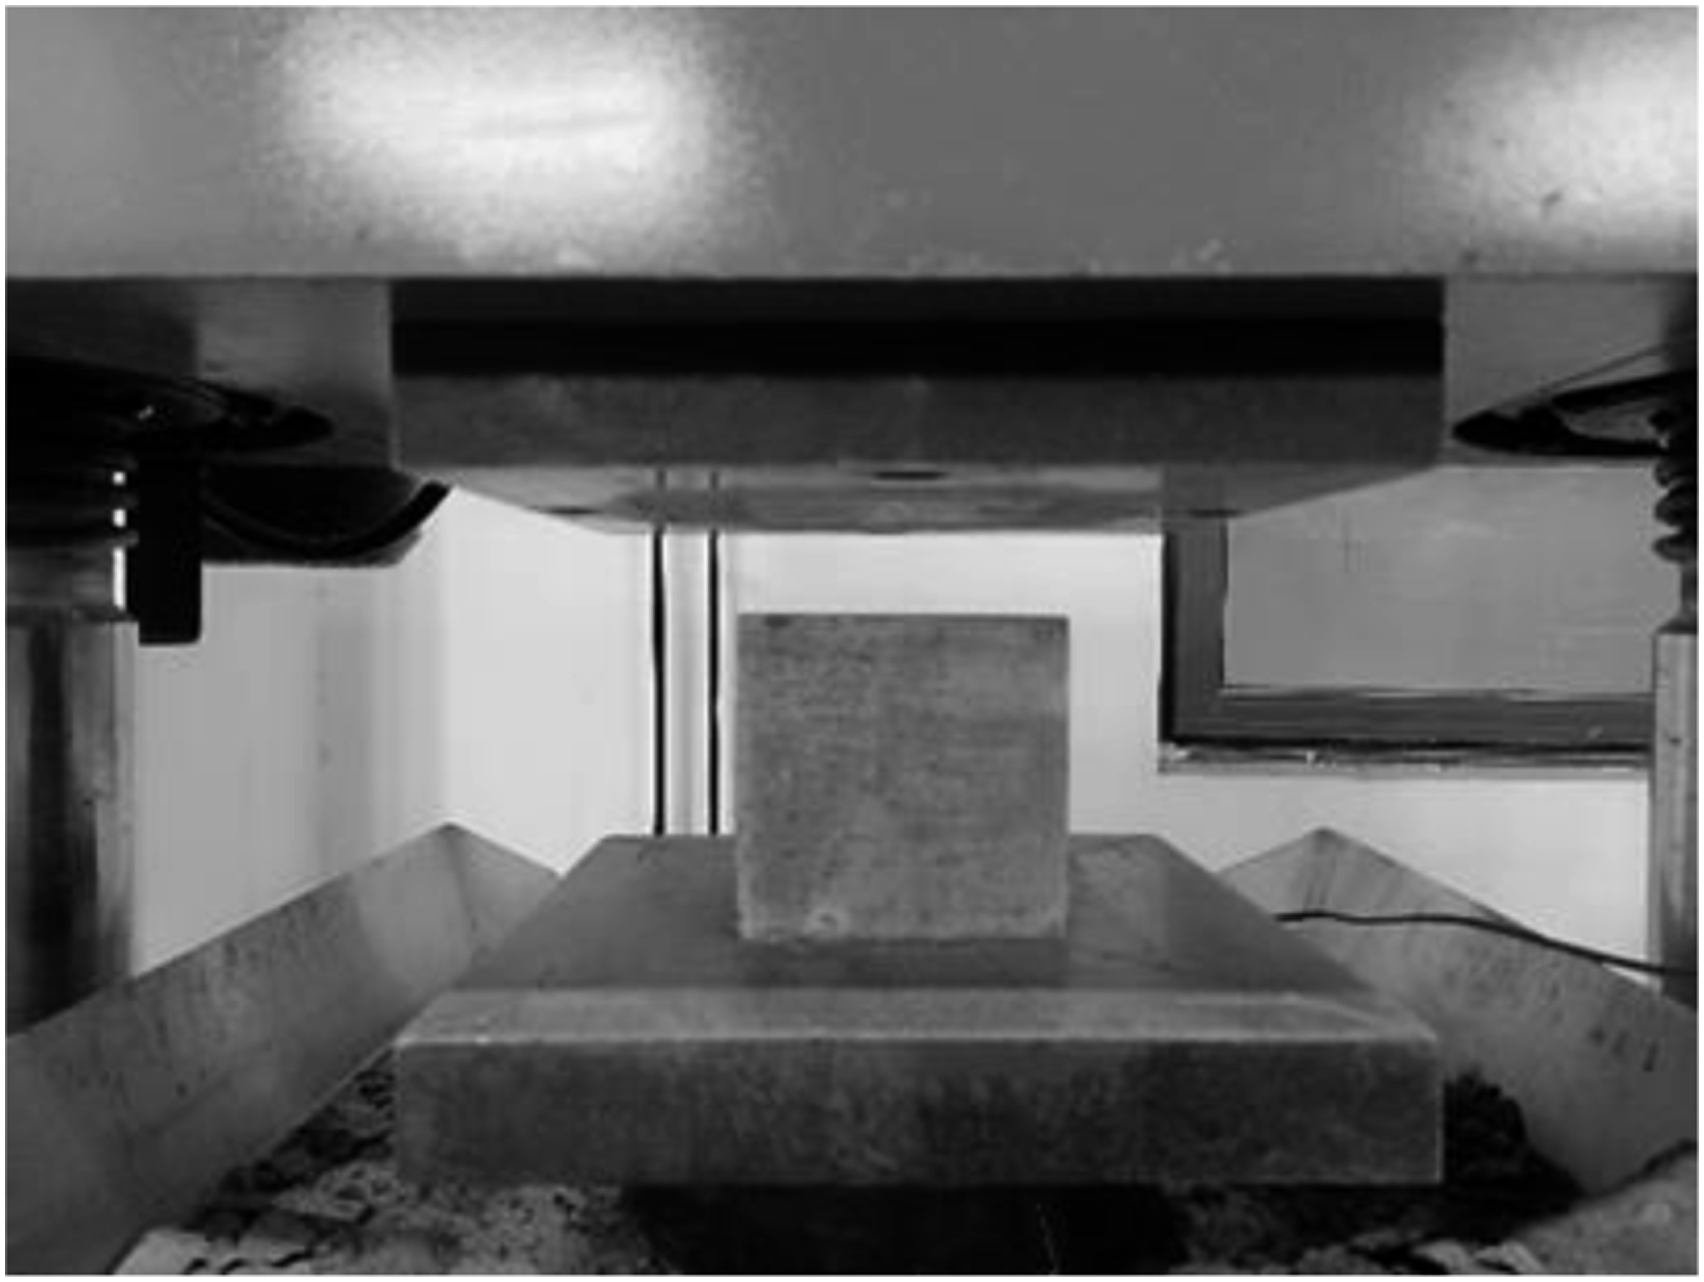
The failure mode of one UHPC cube specimen is shown in Figure 2, and its stress-strain curve is shown in Figure 3. Failure mode of cube specimen. Stress-strain curve of UHPC.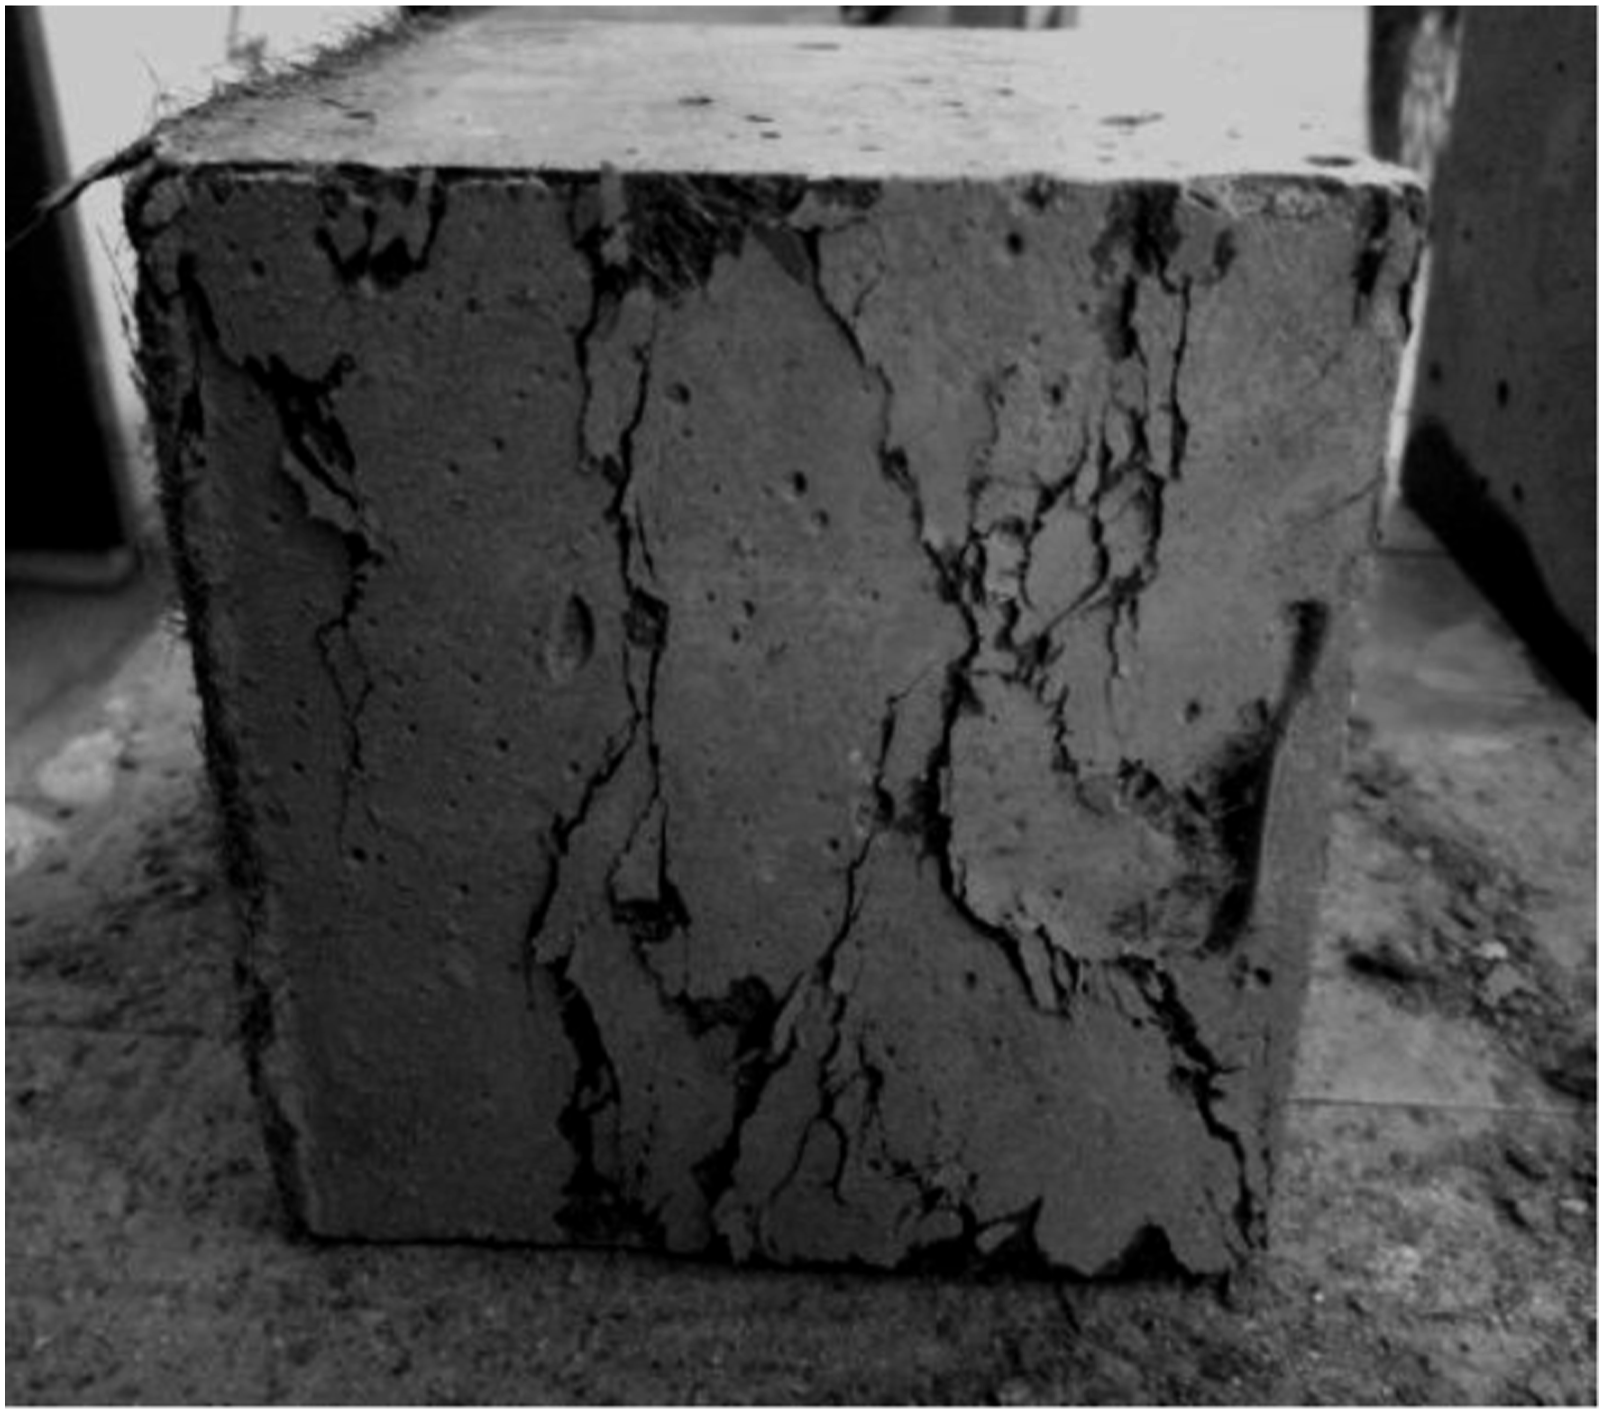
During the test, it is found that the compressive strength of UHPC has been improved significantly due to the incorporation of steel fibres. The cube specimens initiate cracks from the beginning of compression to a certain load, and the compressive strength continues to rise with the development of cracks. After the cube specimens is destroyed, only the UHPC surface spalling, but still maintains a good integrity, which belongs to the foreboding ductile failure.
Experimental result
Statistics of compressive strength of UHPC specimens.
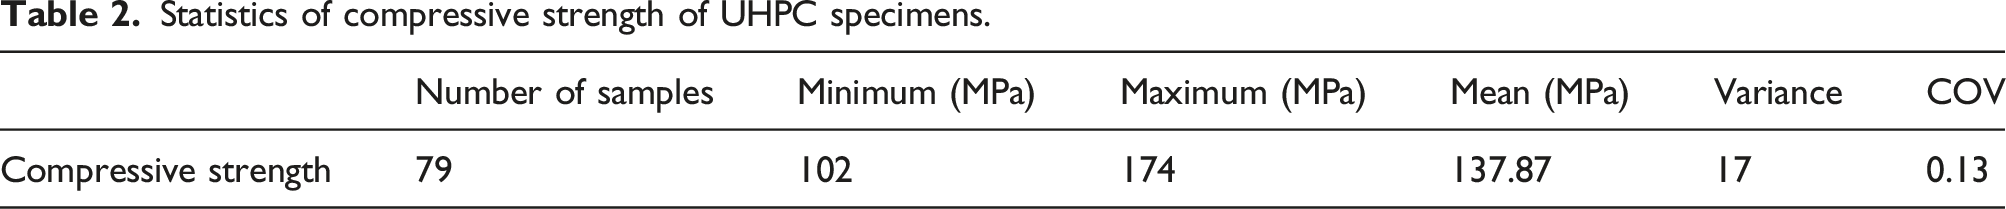
The database of 79 experimental static compression test results was applied to derive the statistics of the UHPC compressive strength and its best fit distribution. The sources of the strength variation can be broadly categorized into three parts: materials, manufacturing of test specimen and testing. Hence, the variation in the strength owing to the variability of materials can be obtained as:
The histograms and various fitted probability distributions for UHPC specimens in compression are shown in Figure 4(a). The Kolmogorov-Smirnov test found that no probability models were rejected at the 5% significant level. Figure 4(b) is used to select the best fit probability distributions of the UHPC according to the relative distribution (CDF−1) plot and the 1:1 line. When the CDF−1 of a particular probabilistic model sits on the 1:1 line then this indicates that the probabilistic model is a good fit to the data (see Figure 4(b)). Figure 4(b) show that the Gumbel distribution of UHPC overestimates the lower tail of the histogram as starting from the lower part of the best fit line, the Lognormal, Gamma, Normal and Weibull distributions underestimate the lower tail of the UHPC, while the Weibull distribution sits closest to the best fit line compared with the other distributions. Hence, the Weibull distribution is recommended for UHPC in compression. Best fit for the compression test results of UHPC specimen. (a) Probability distributions. (b) Inverse CDF plot.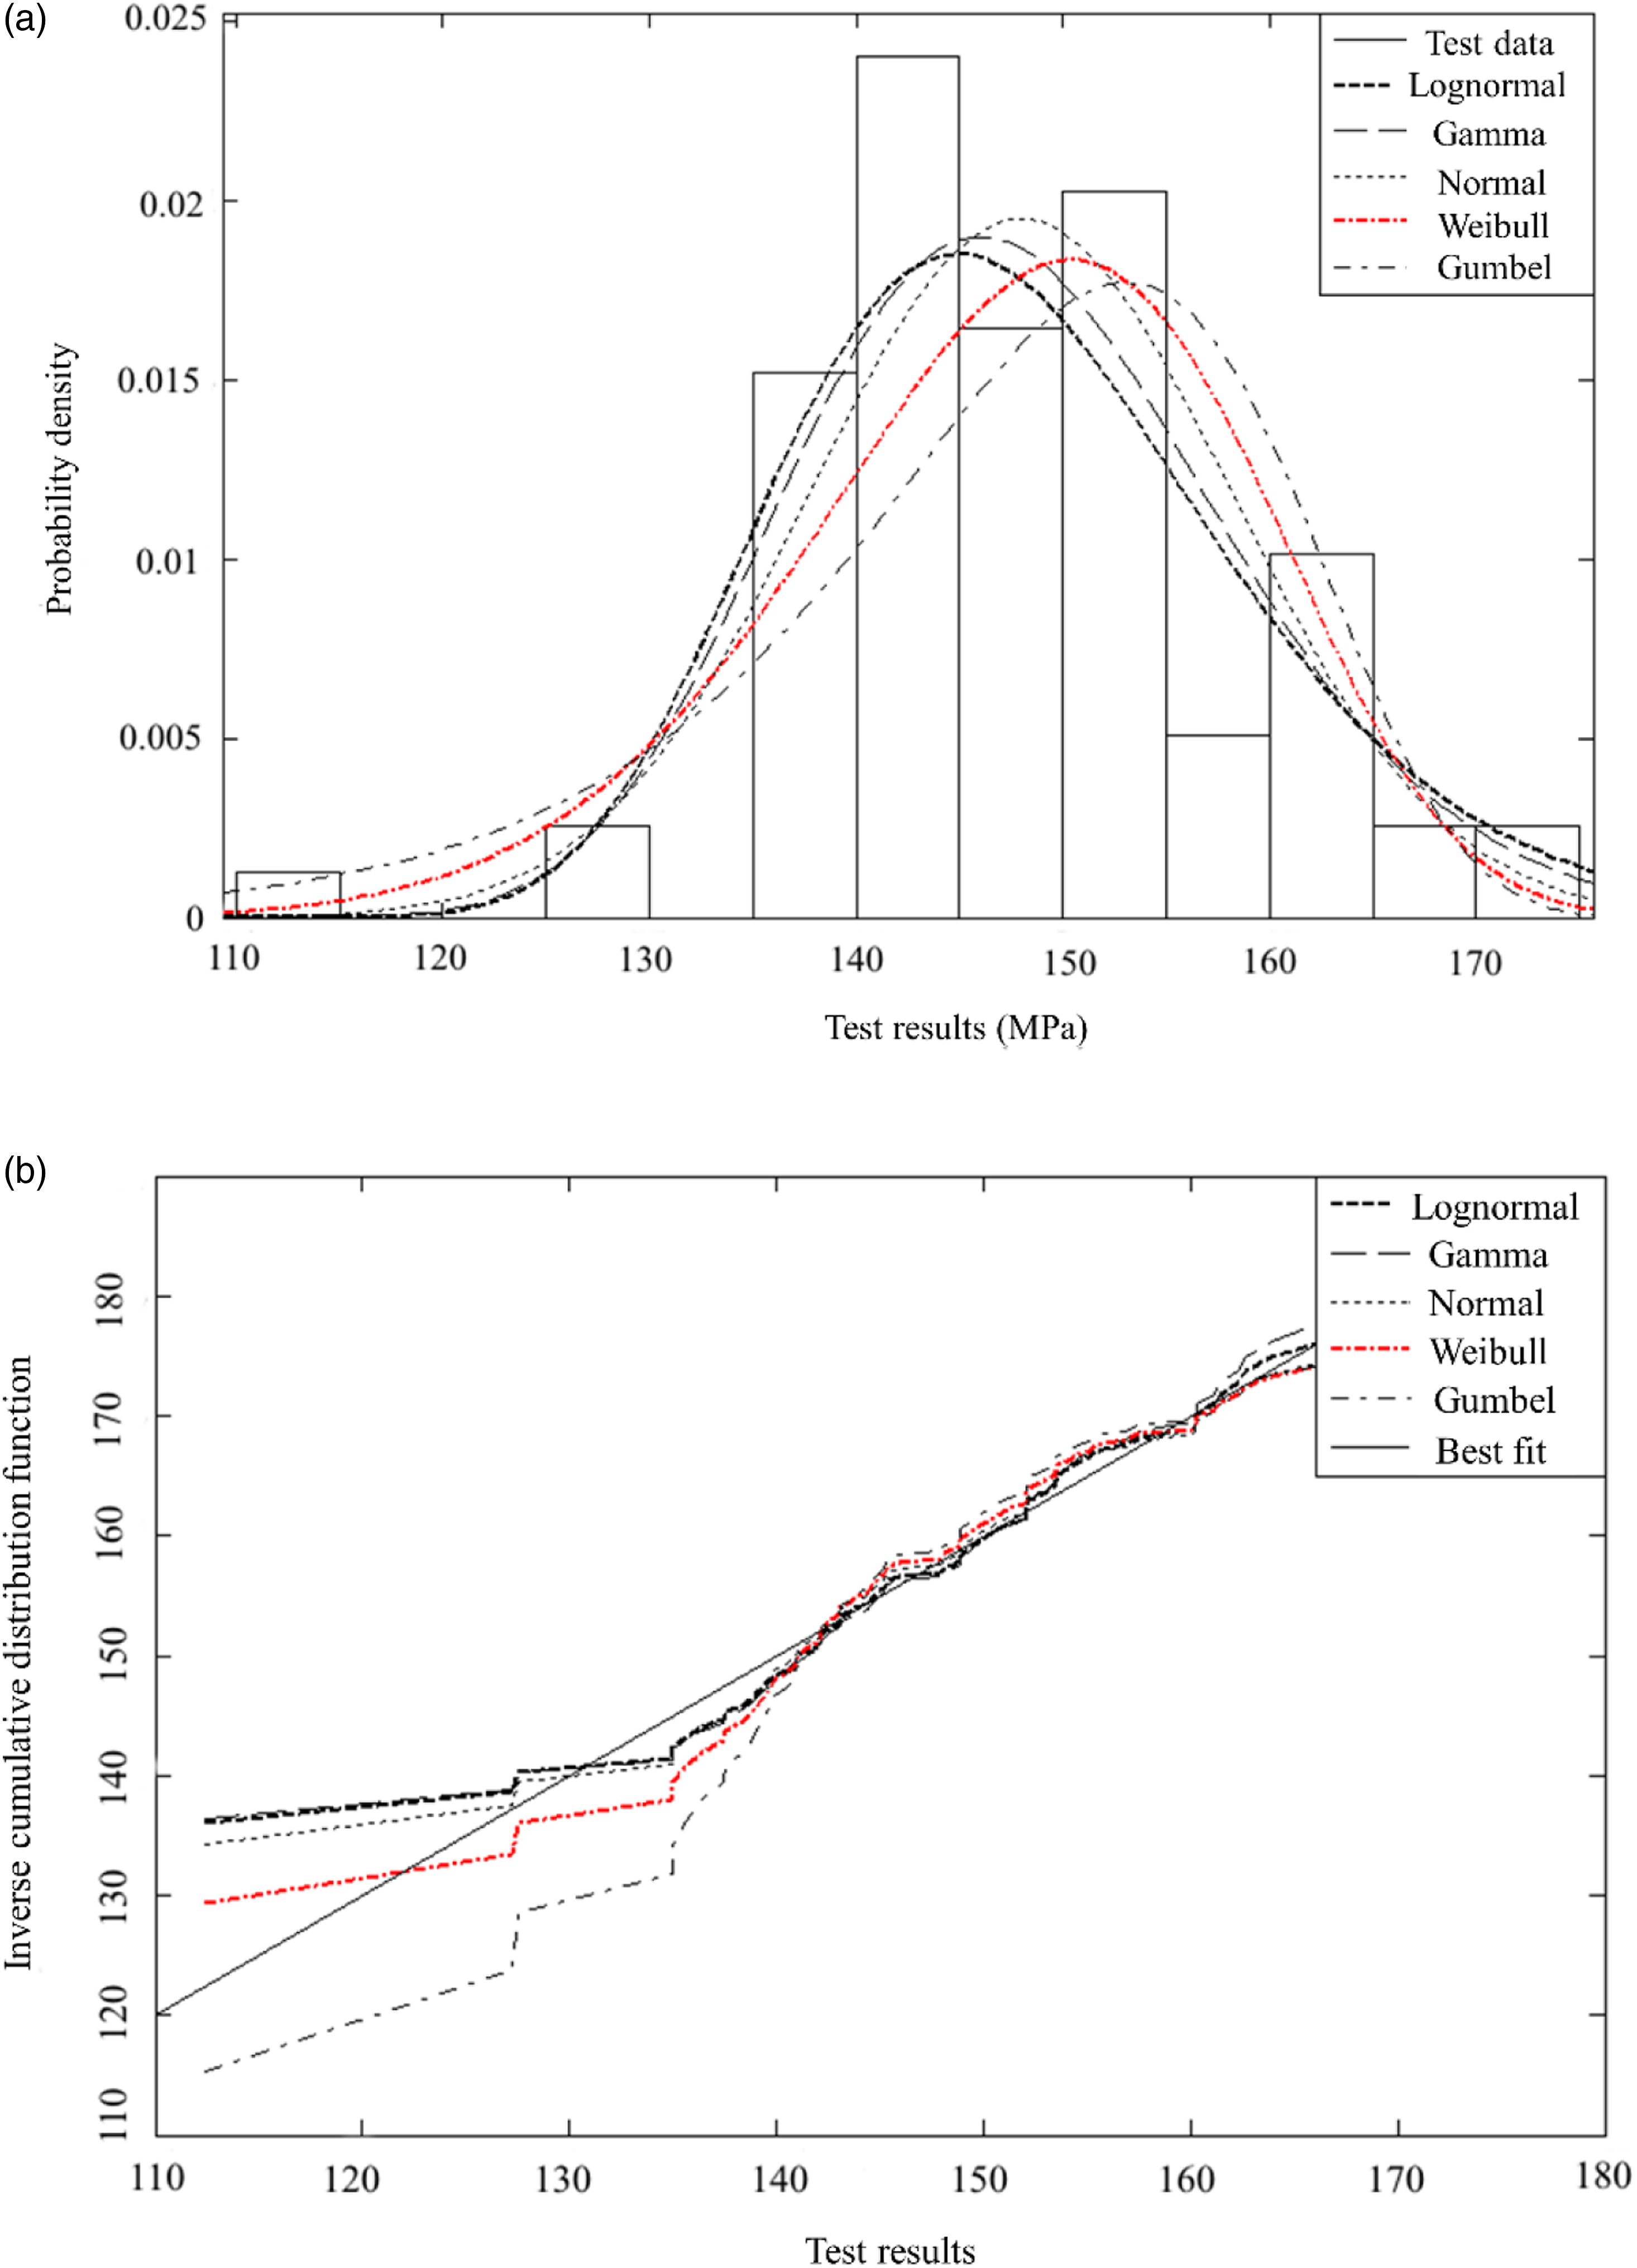
Numerical simulation
Ultra-high performance concrete column finite element model verification
Material constitutive model
The Karagozian and Case (K&C) material type 72R3 (*MAT_CON-CRETE_DAMAGE_REL3) is a commonly used constitutive model of concrete to simulate the dynamic response of reinforced concrete structures under blast loads, and it is utilized in this study to model concrete. The steel was simulated by Hughes-Liu beam element. *MAT_PIECEWISE_LINEAR_PLASTICITY, *MAT_PLASTIC_KINEMATIC and *MAT_SIMPLIFIED_JOHNSON_COOK are the most commonly used constitutive models for steel. The latter two constitutive models do not support user-defined stress-strain curves and strain rate effects. Therefore, the *MAT_PIECEWISE_LINEAR_PLASTICITY model is adopted in this paper, which allows the user to customize stress-strain curves and strain rate effects.
The perfect bonding between steel bars and UHPC is adopted without considering the bond-slip relationship between them. In order to simulate the failure and fracture of UHPC and steel bars, the Erosion algorithm is considered in the numerical simulation by adding *MAT_ADD_EROSION to the keyword file.
The finite element model establishment
The FEM of UHPC columns is mainly composed of steel bars, UHPC, column head, column foot and upper and lower splints. The UHPC, splints, column head and column foot all adopt 10-mm 3-Deight-node constant stress solid element, and the nodes of the element have three translational degrees of freedom. 10-mm beam elements are used for steel bars and bolts.
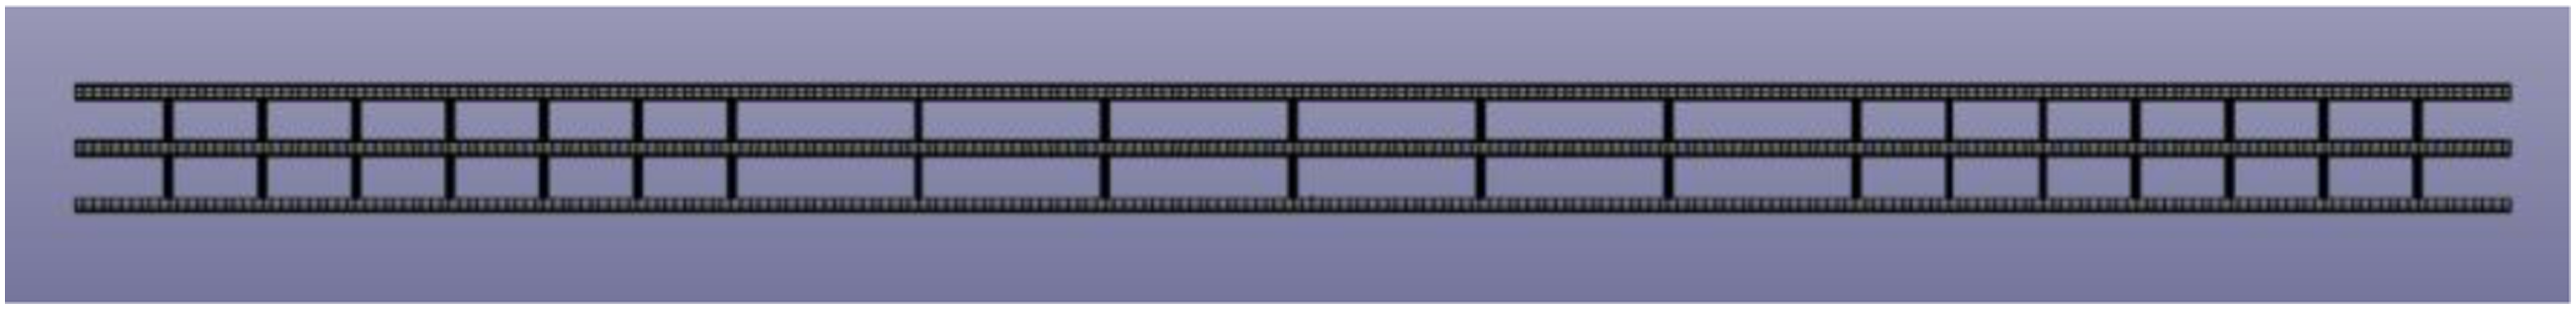
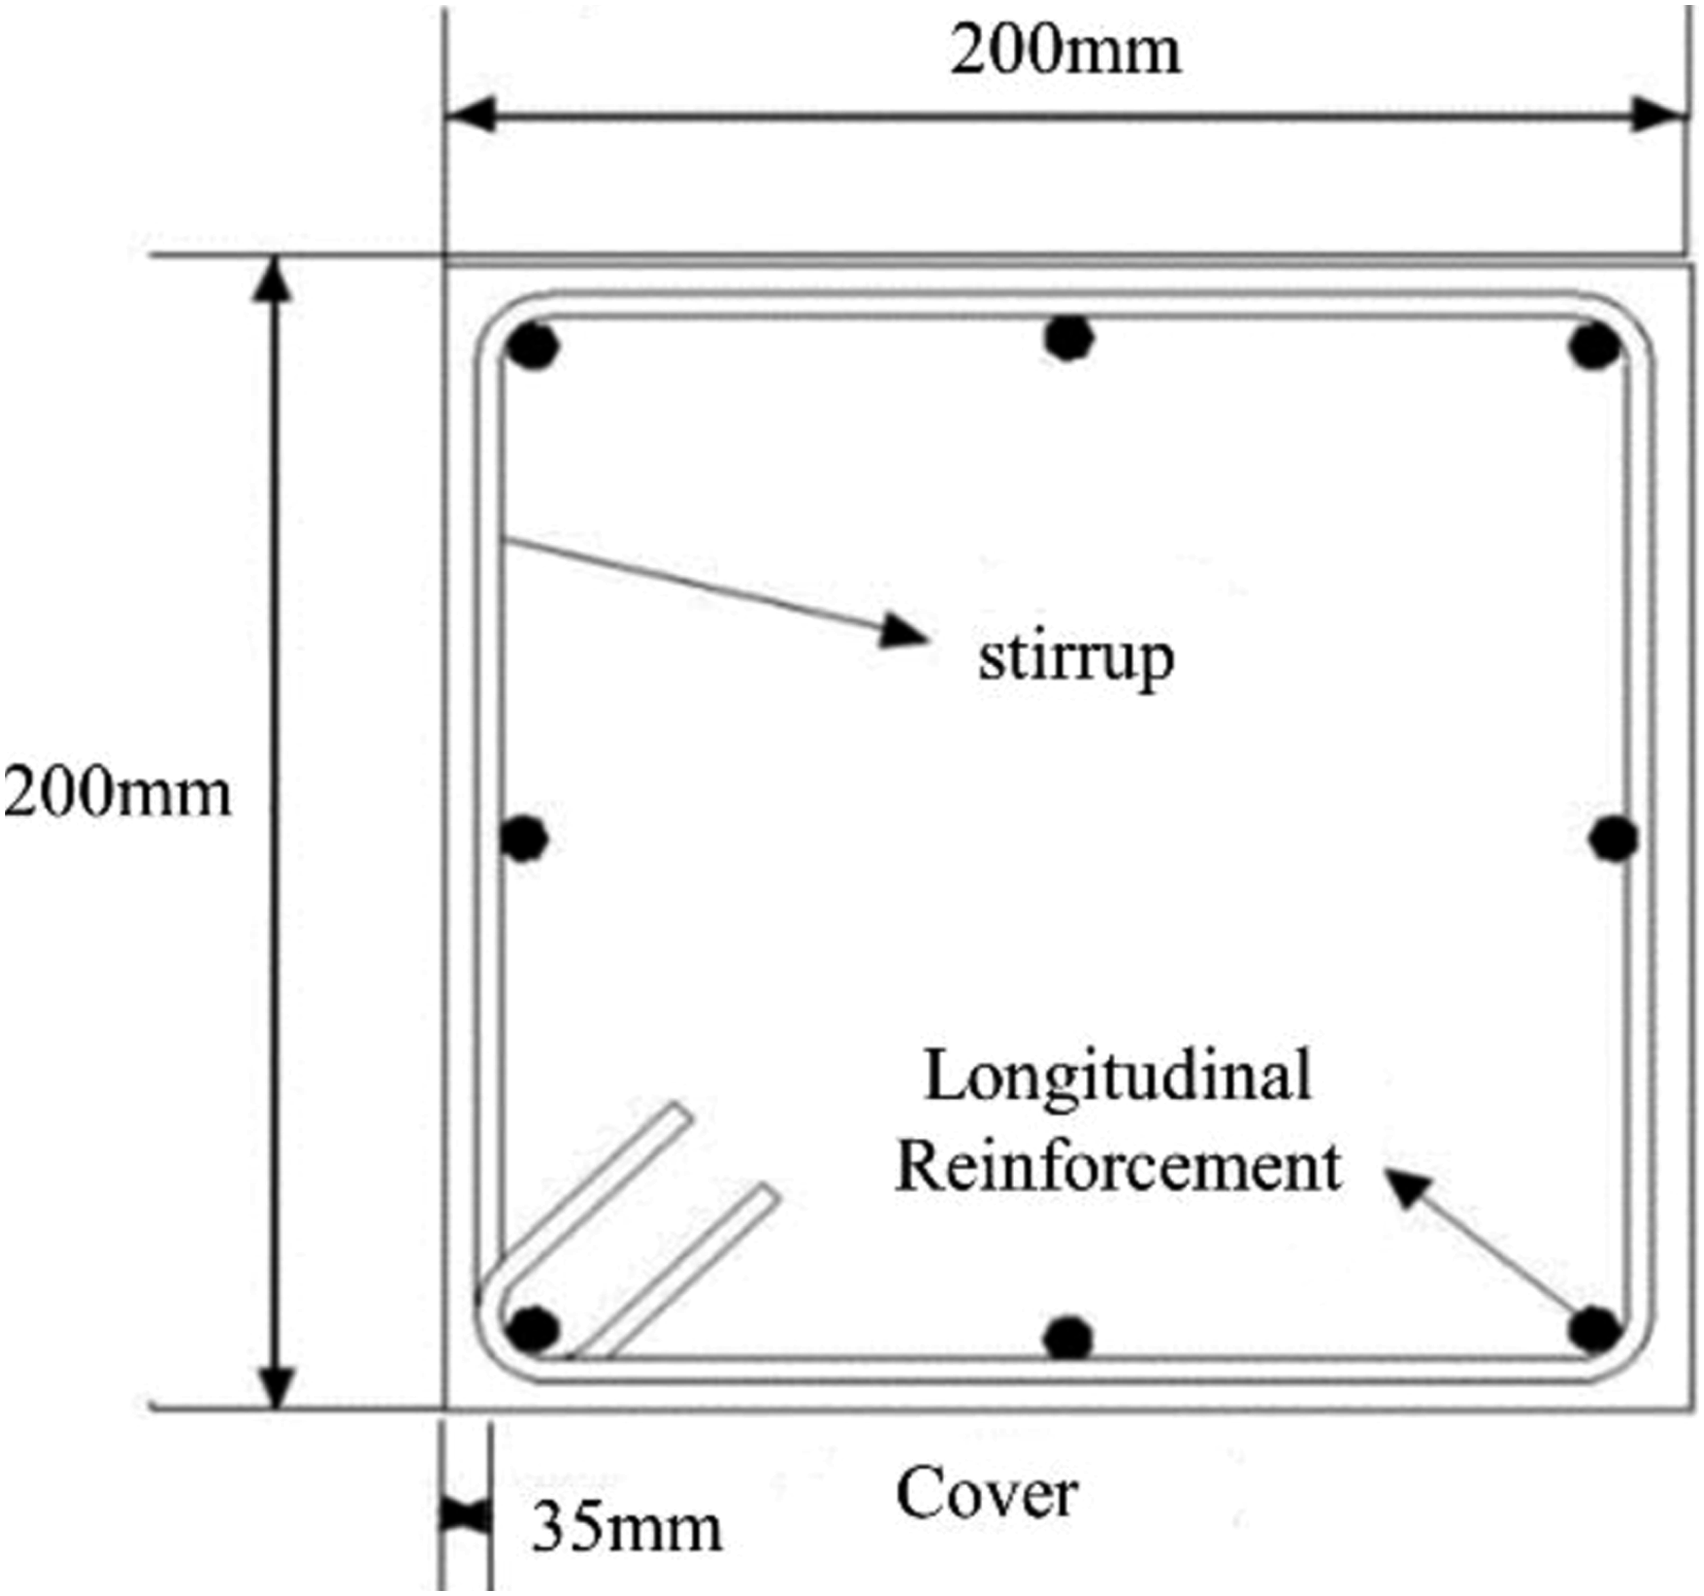
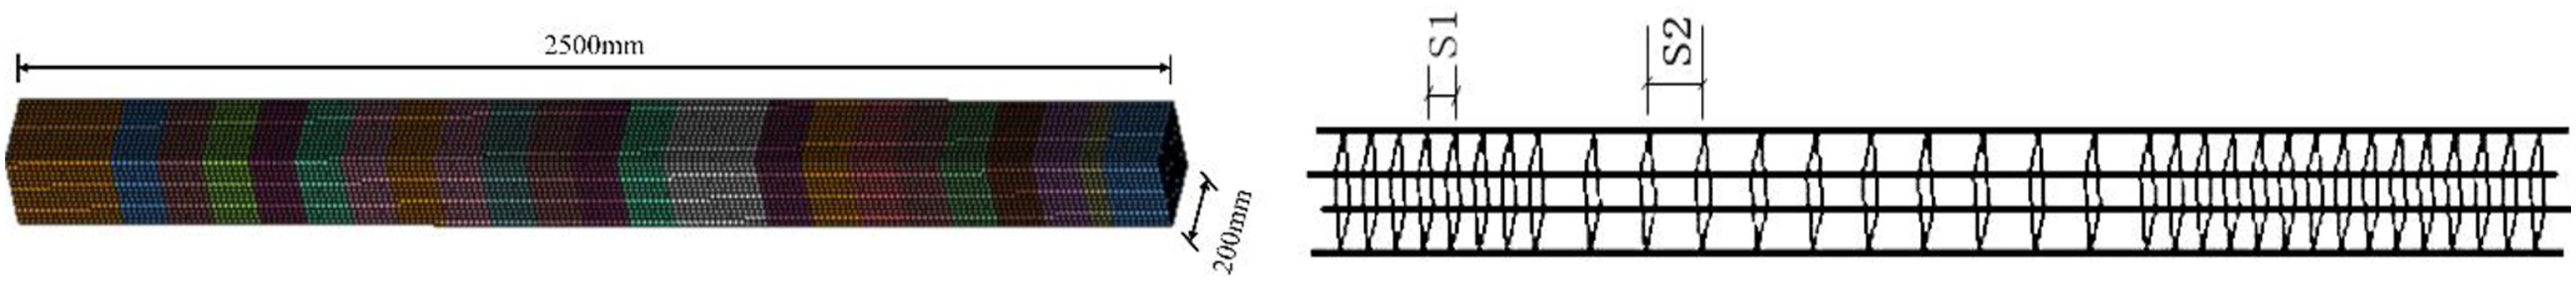
The column head and the column foot in the FEM are rigid bodies, and the translation and rotation of the column foot are constrained in all directions, while the translation and rotation of the column head are constrained in all directions except the translation along the column axis to apply the axial load to the UHPC column. Figures 5 and 6 present the finite element model and rebar layout of UHPC column, respectively, and the section view of the UHPC column is shown in Figure 7. FEM of UHPC column. Rebar layout of UHPC column. Schematic diagram of UHPC column section.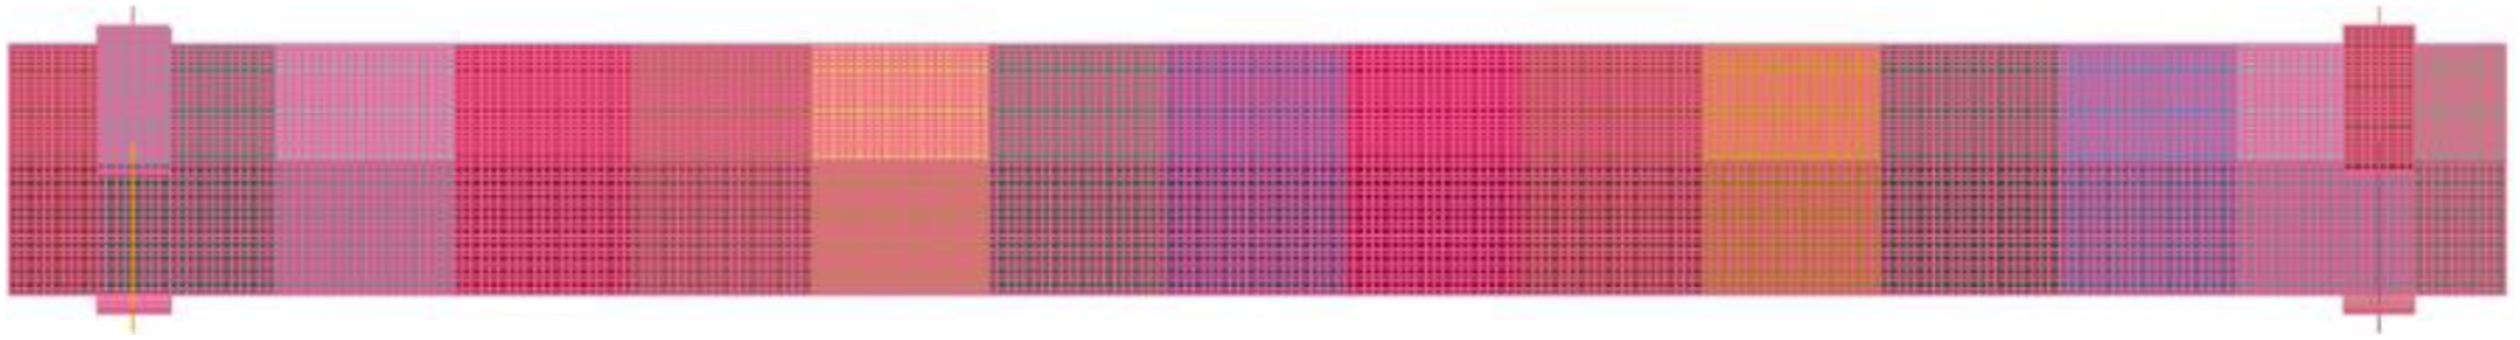
In the process of explosion simulation, the method of subsection loading is adopted: (1) Before explosion, the axial load is implicitly applied to the UHPC column at the top of the column; (2) The axial load is kept unchanged while the explosion load is applied, and the computational algorithm in this stage is switched from implicit to explicit.
Finite element model verification
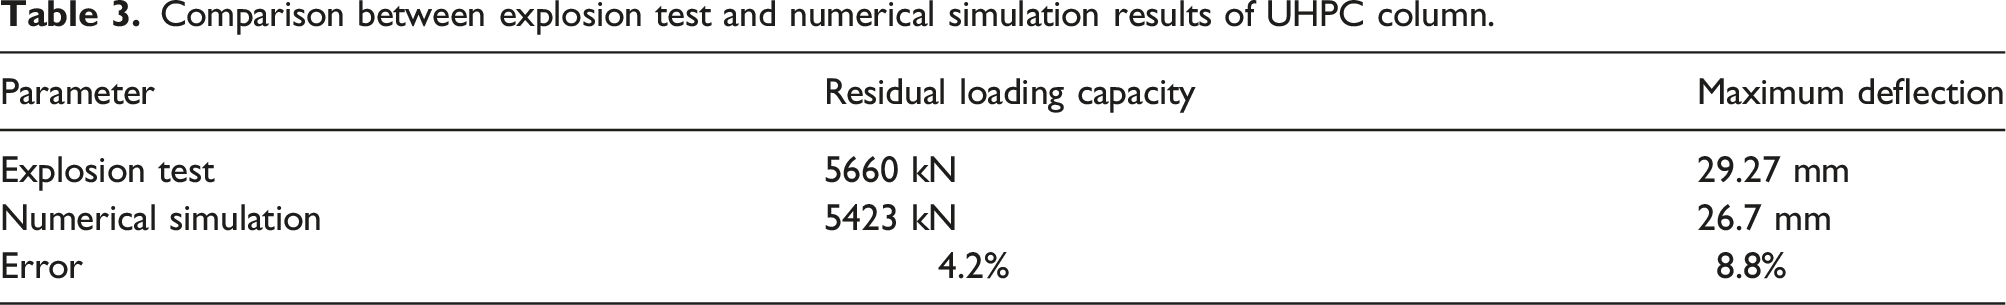
The FEM verification is carried out by comparing the numerical results with the explosion test results of UHPC column with the same UHPC mix proportion (Li et al., 2015).
The effective plastic strain diagram of UHPC column under blast loads is shown in Figure 8. Effective plastic strain diagram of UHPC column.
By comparing the deflection time history curves of UHPC column, it can be found that the maximum deflection and time history curve can be predicted accurately by numerical analysis, as shown in Figure 9. Comparison of deflection time history curve for UHPC column.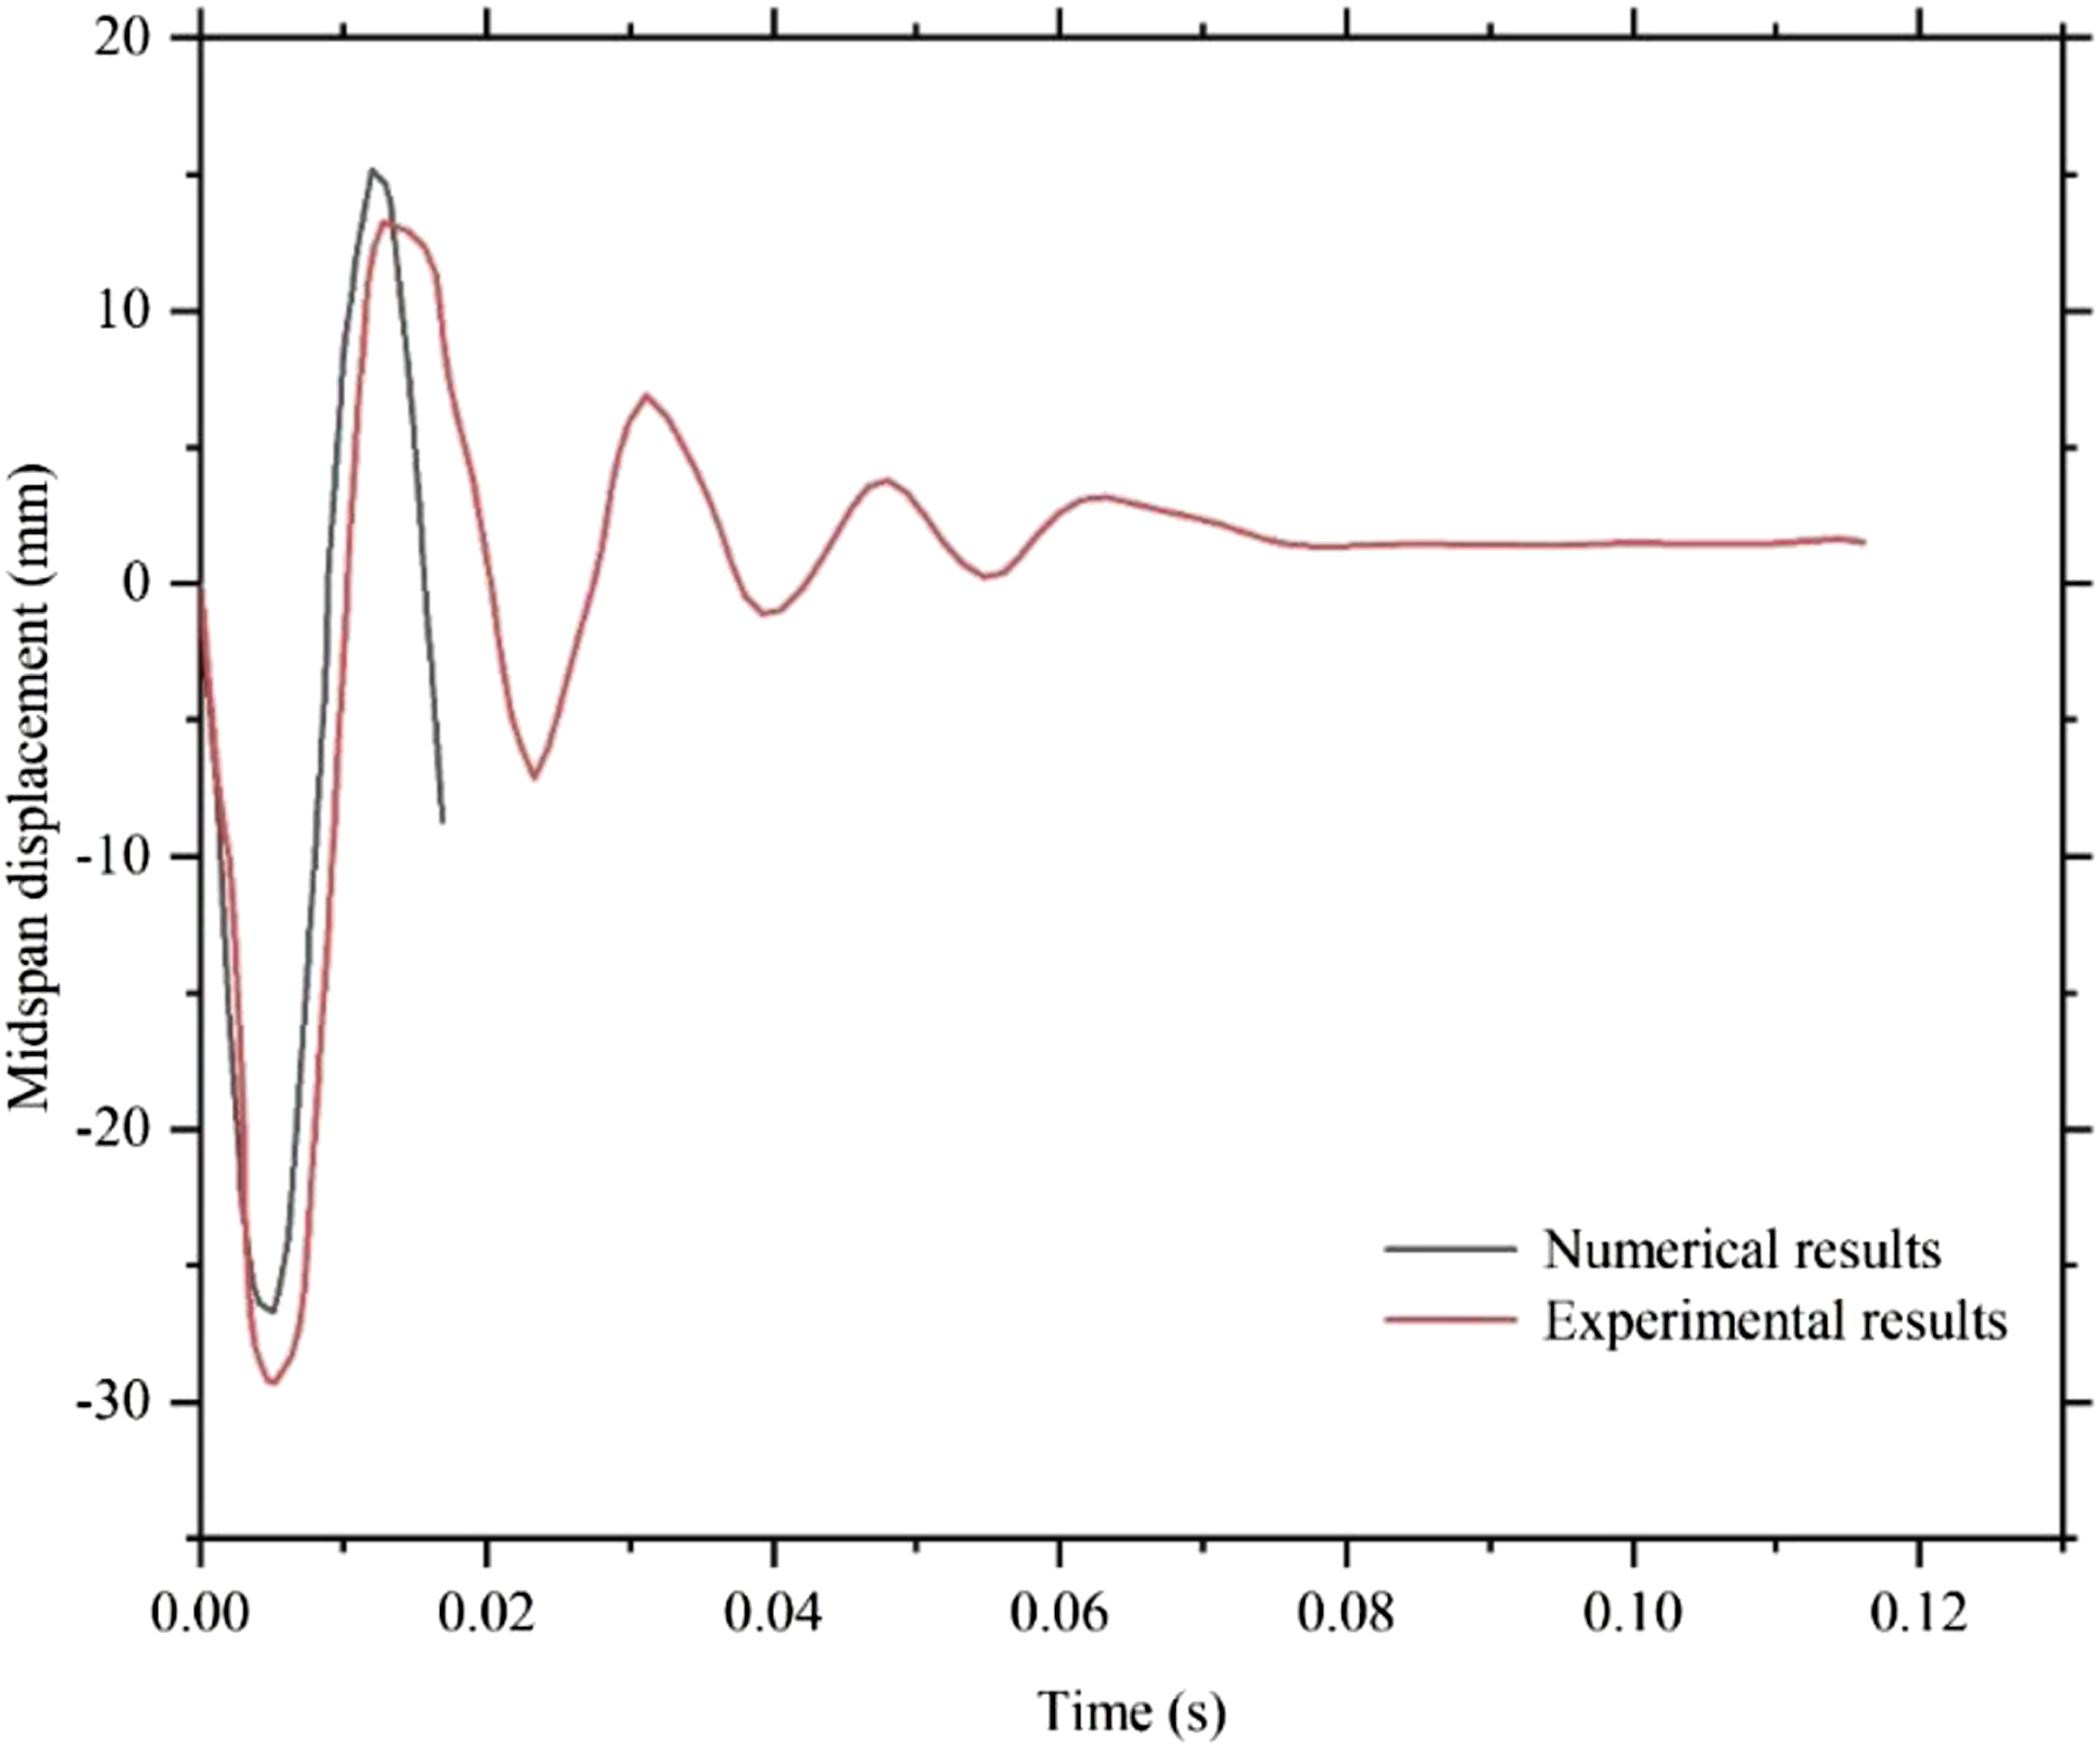
Comparison between explosion test and numerical simulation results of UHPC column.
Stochastic finite element analysis
Random variable
Statistical parameters of stochastic finite element.
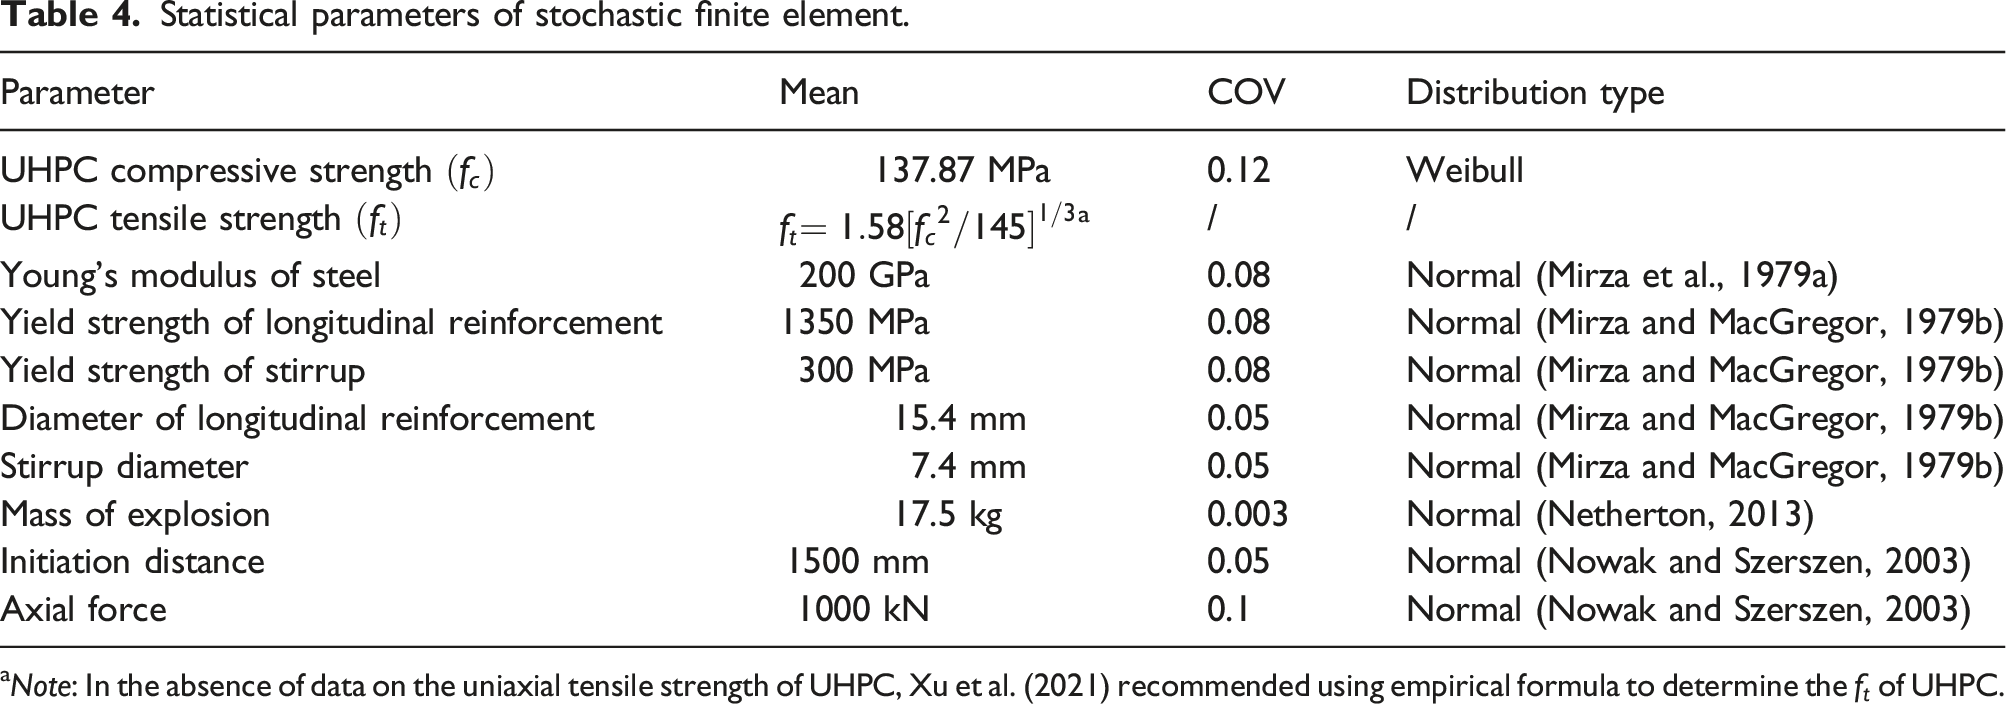
aNote: In the absence of data on the uniaxial tensile strength of UHPC, Xu et al. (2021) recommended using empirical formula to determine the
Mass of the explosive TNT equivalence is 17.5 kg. Considering the scale is accurate to be ±0.05 kg, then the COV for the mass can be taken as 0.003 if the uncertainty represents 95% of all values. It is stated that cylindrical emulsion explosive charge was placed at 1.5 m height above the specimen in the field test (Li et al., 2015), meaning that the range is 1.5 m. It is reasonable to assume that the length influence of the cylindrical explosive on the range ranges between ± 10%, indicating the COV is approximately 0.05 if the uncertainty represents 95% of all values.
Statistical parameters of stochastic finite element model in this study are listed in Table 4.
Spatial variability of ultra-high performance concrete strength
Spatial variability is an important characteristic of the nonhomogeneous of mechanical and physical properties of structural members. For UHPC columns, due to the influence of self-weight, the compressive strength of UHPC in columns usually varies systematically at its height, as shown in Figure 10 (Shi and Stewart, 2015b). Because the relatively small width dimension in a UHPC column, it can be assumed that any spatial variability in this direction will be ignored (Shi and Stewart, 2015b). If the mean and covariance do not change in the random field, it is considered to be “stationary” or homogeneous random field (Haldar and Mahadevan, 2000). Conversely, if the mean fluctuates in space, it is considered to be a non-stationary random field (Haldar and Mahadevan, 2000). Variation in UHPC compressive strength with column height.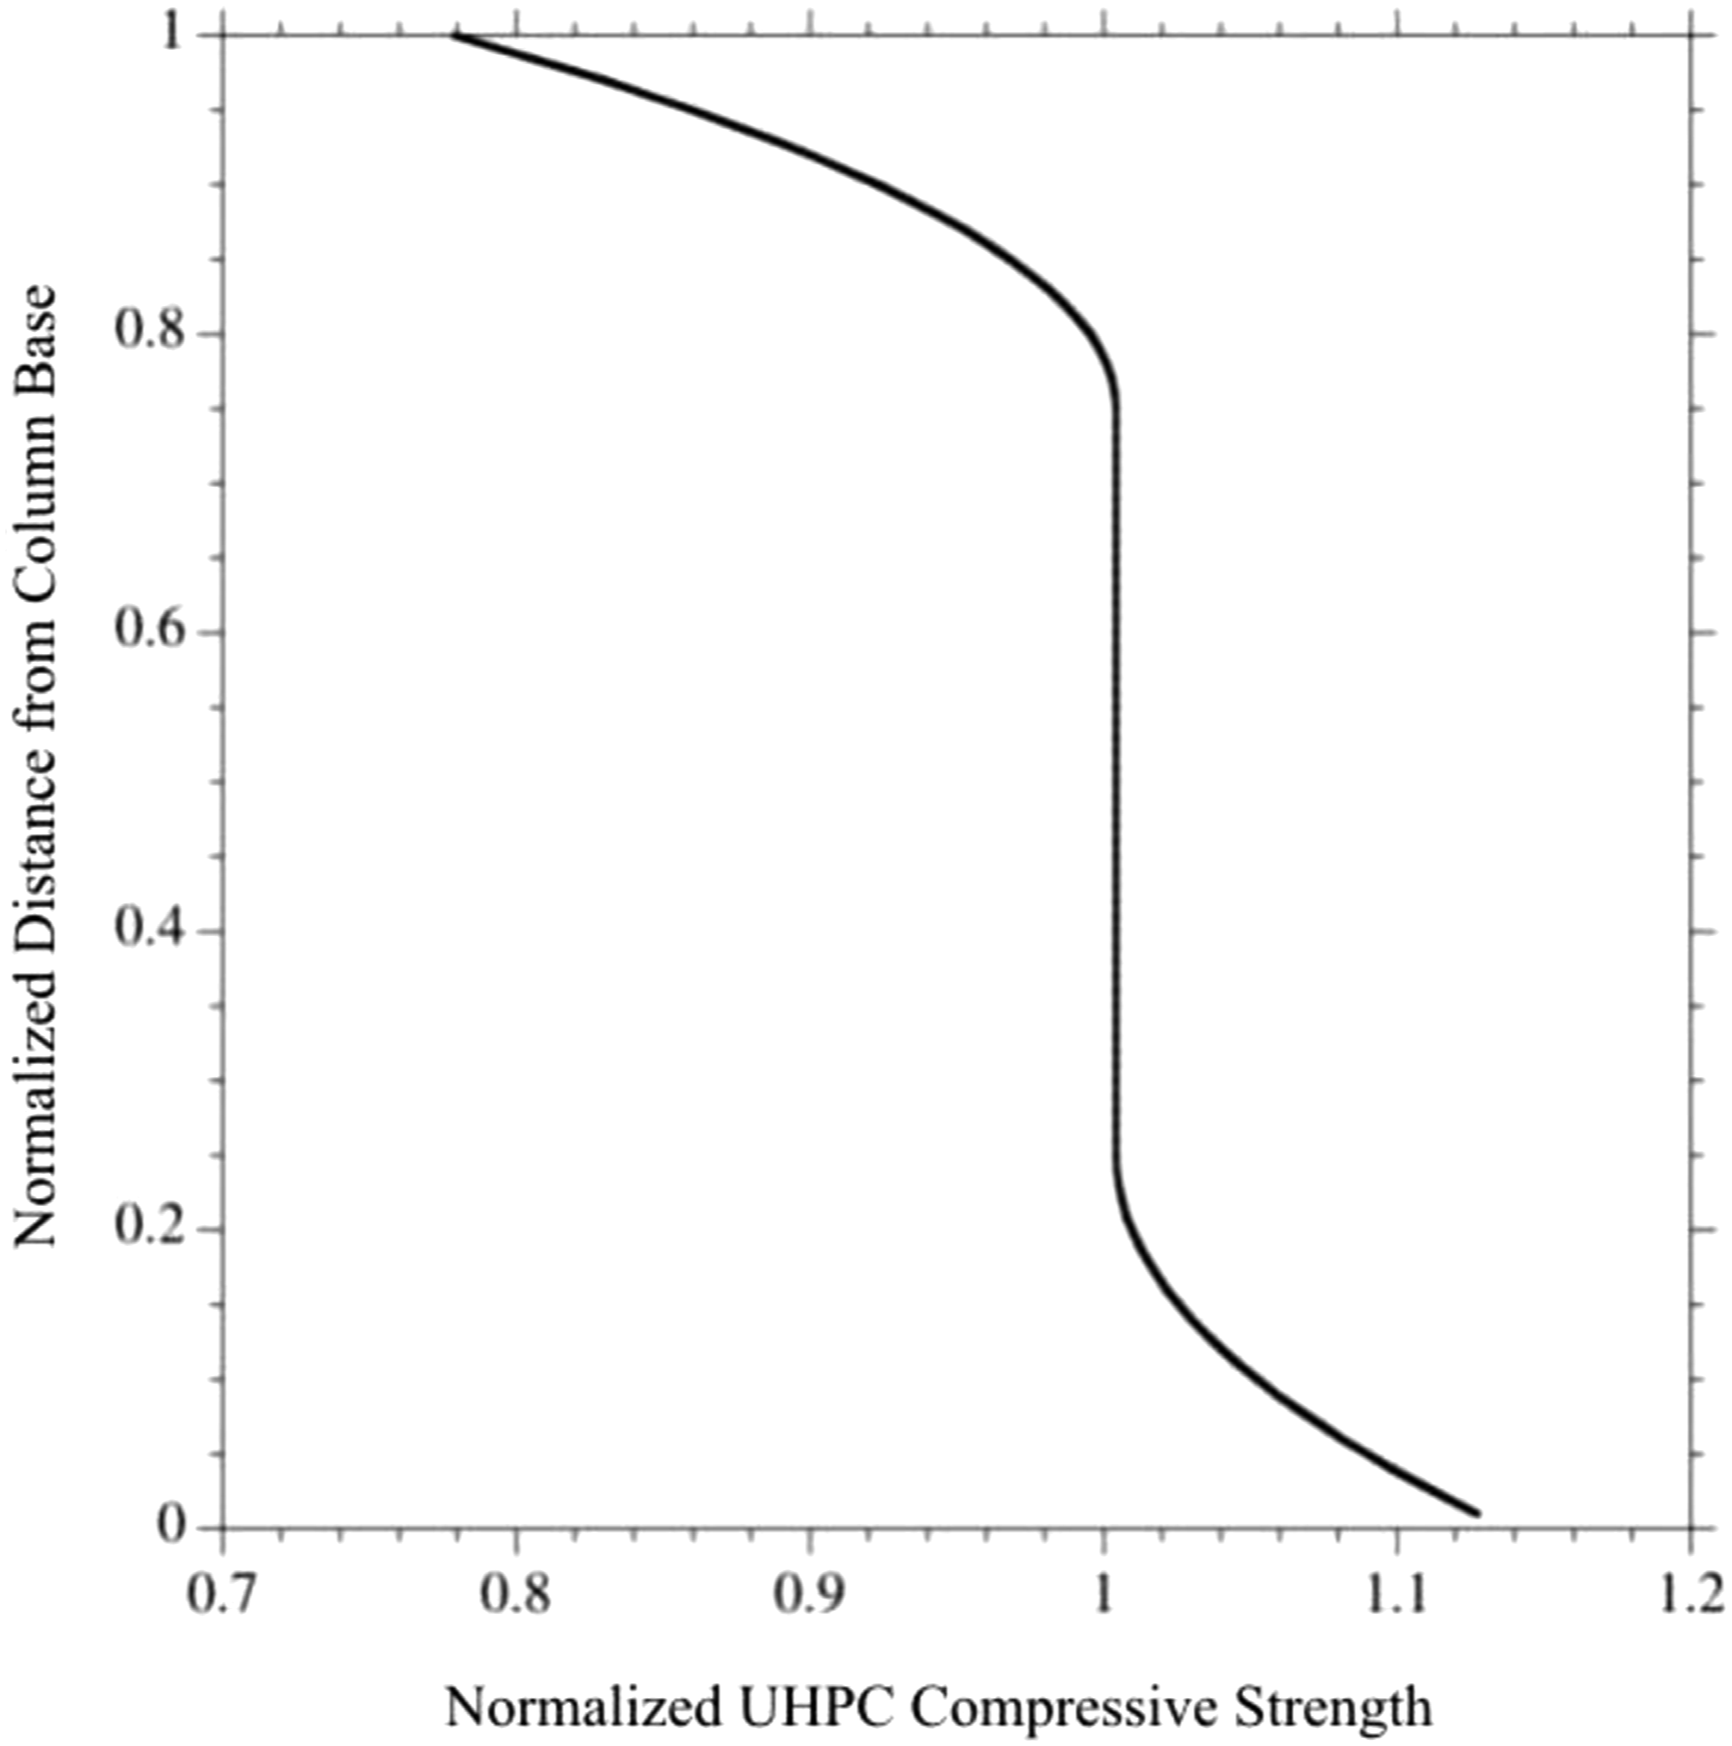
The compressive strength of UHPC columns is regarded as a non-stationary random field, whose compressive strength varies along column height (Z), and the mean spatial strength variation is defined as (Bartlet and MacGregor, 1999):
The dimensions of discrete elements are usually determined based on practical and analytical considerations. If the element is too small, the calculation workload will be increased, and the accuracy of the calculation results will be improved slightly. Conversely, if the element size is too large, the correlation between the elements will be small. Sterritt et al. (2001) suggested that the element size should be in the range of 0.1–0.75 m. Meanwhile, the mesh size of Ls-Dyna should be taken into account, and the element size of random field should be combined with it. In this study, the size of random field element was set as 0.2 m.
Stochastic finite element model establishment
This study combined Python and MCS method to create non-spatial and spatial stochastic finite element models. The steps are as follows: (i) Establish a non-spatial stochastic finite element model. (a) Random generation of mass of explosive and standoff distance according to Normal distribution. (b) Six variables are randomly generated according to the Normal distribution: UHPC Young's modulus, longitudinal reinforcement yield strength, stirrup yield strength, longitudinal reinforcement diameter, stirrup diameter, and axial force. (c) Random generation of non-spatial variable according to Weibull distribution: UHPC compressive strength of stationary random field. (d) Using the above random variables as input parameters, the theoretical axial load capacity and residual loading capacity were estimated from the finite element analysis. (ii) Establish a spatial stochastic finite element model. (a) Random generation of mass of explosive and standoff distance according to Normal distribution. (b) Six variables are randomly generated according to the Normal distribution: UHPC Young's modulus, longitudinal reinforcement yield strength, stirrup yield strength, longitudinal reinforcement diameter, stirrup diameter, and axial force. (c) According to equations (2) ∼ (4), the spatial variable is randomly generated: the UHPC compressive strength of non-stationary random field. (d) Using the above random variables as input parameters, the theoretical axial load capacity and residual loading capacity were estimated from the finite element analysis.
The statistical parameters of non-spatial and spatial stochastic finite element models are shown in Table 4.
Simulation results of non-spatial and spatial models
The number of MCS required was determined by judging whether the COV of residual loading capacity of non-spatial model and spatial model gradually converged. The convergence curves of residual loading capacity COV of non-spatial and spatial models with the number of models are shown in Figures 11 and 12, respectively. Convergence curve of residual loading capacity COV in non-spatial analyses. Convergence curve of residual loading capacity COV in spatial analyses.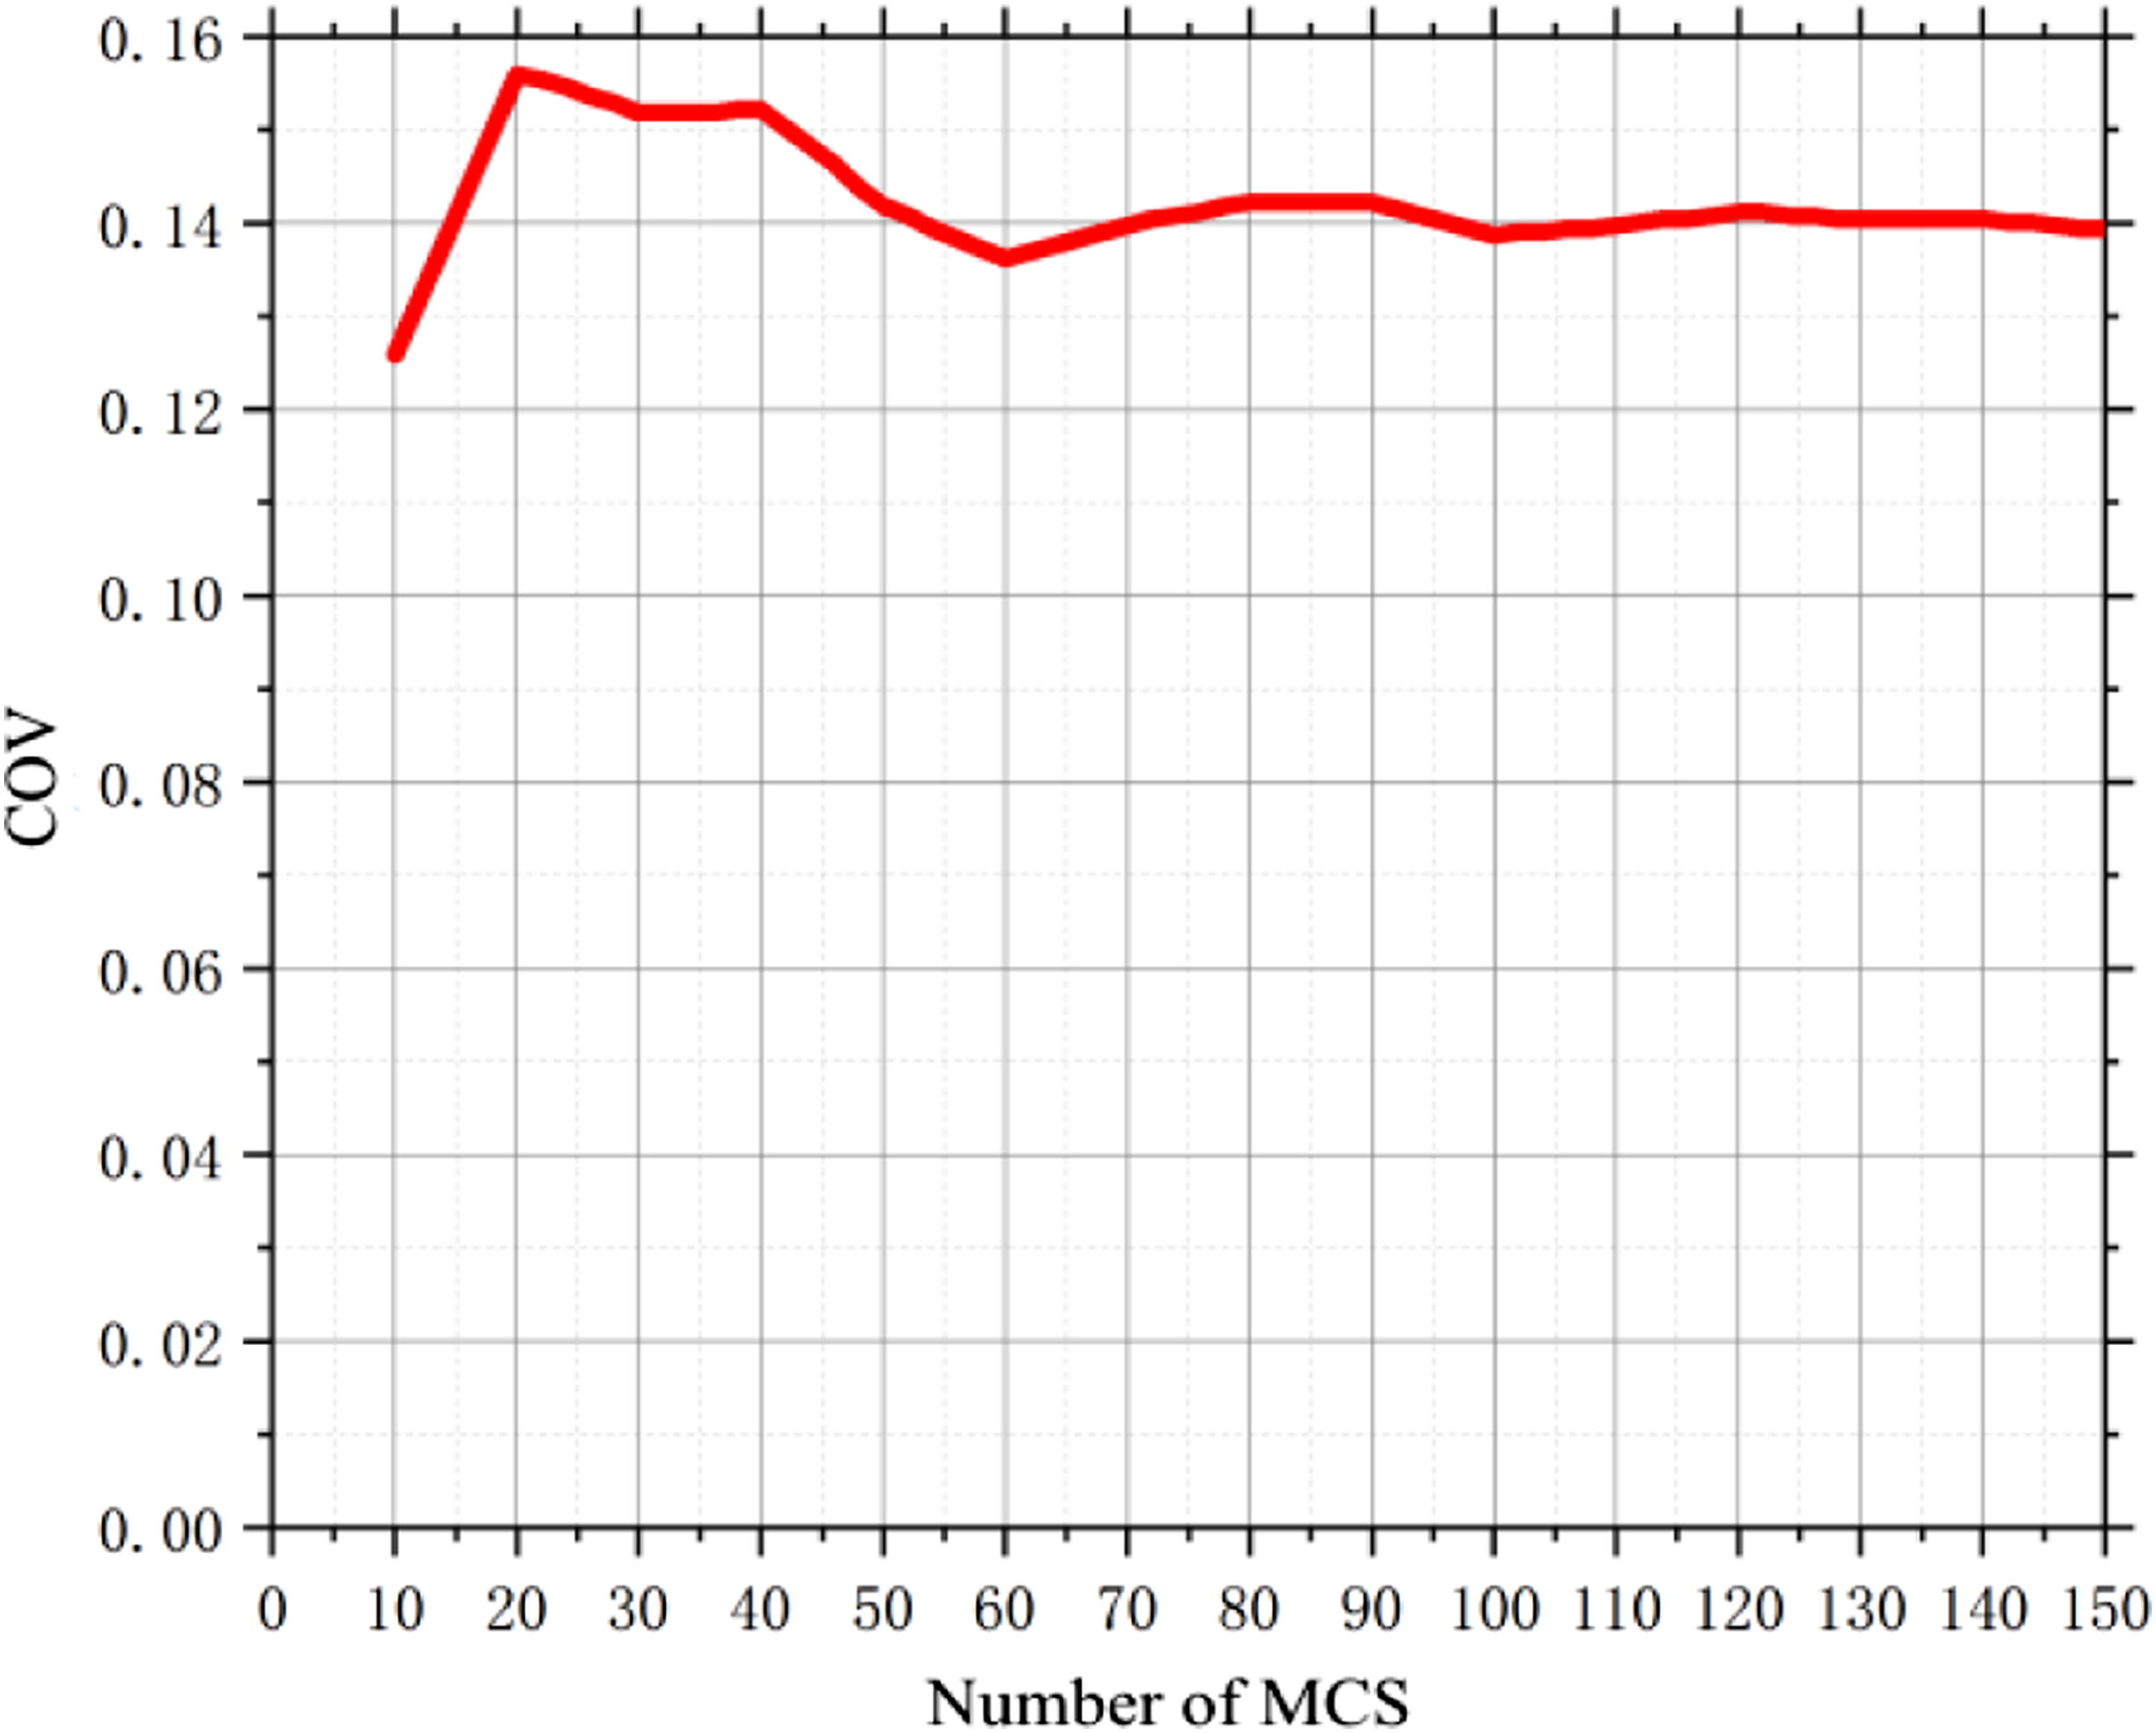
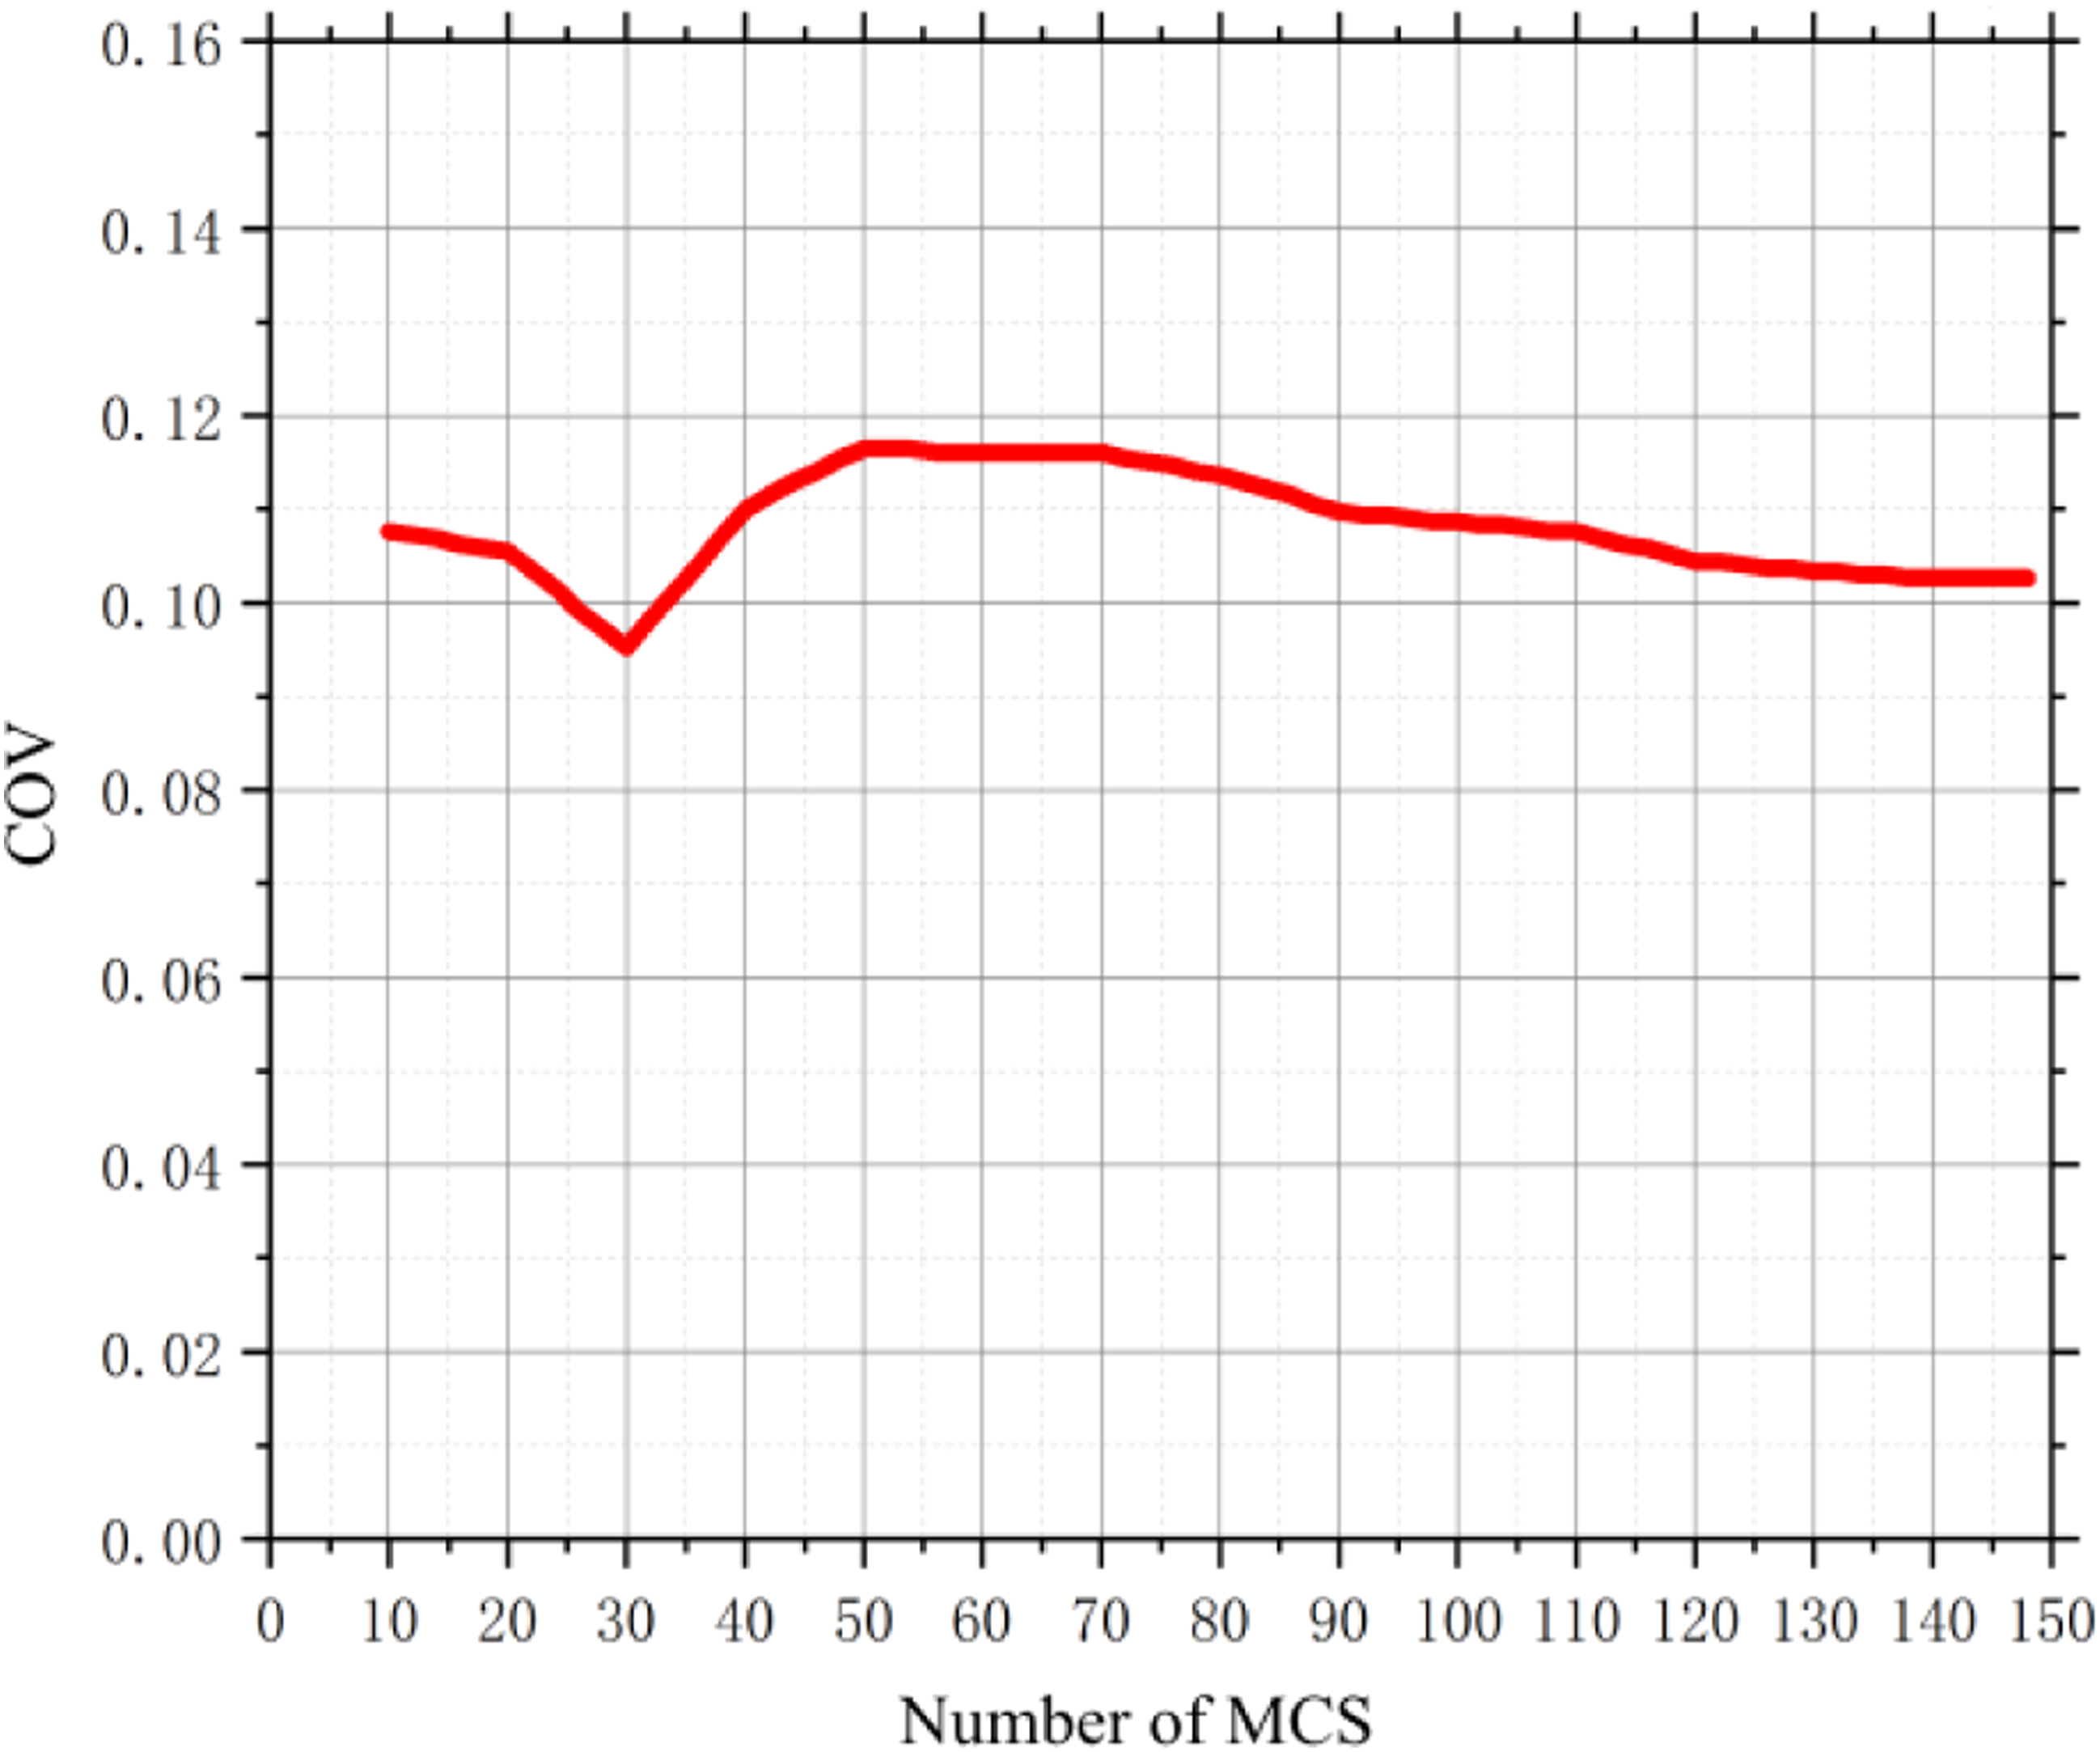
It can be seen from Figures 11 and 12 that the COV of the residual loading capacity of the non-spatial models tends to converge after 100 Monte-Carlo numerical simulations, while the COV of the residual loading capacity of the spatial models tends to converge after 140 Monte-Carlo numerical simulations. Therefore, it is considered reasonable to conduct 150 Monte-Carlo numerical simulations for both non-spatial and spatial models.
The COVs of the residual loading capacity of the non-spatial and spatial models is stable at 0.14 and 0.10, respectively, indicating a 28.6% difference. This phenomenon is caused by the following reasons: For the non-spatial model, the randomly generated UHPC compressive strength may be far greater than the mean compressive strength, resulting in a large residual loading capacity, or it may be far less than the mean, resulting in a small residual loading capacity. Therefore, the residual loading capacity of the non-spatial model fluctuates greatly, resulting in a large COV. However, for the spatial model, the compressive strength of UHPC column has spatial variability. Some of the compressive strength of the random field (i.e., the element of each UHPC column) may be greater than the mean compressive strength, and some may be smaller than the mean compressive strength, resulting in small COV of the residual loading capacity.
Residual loading capacity
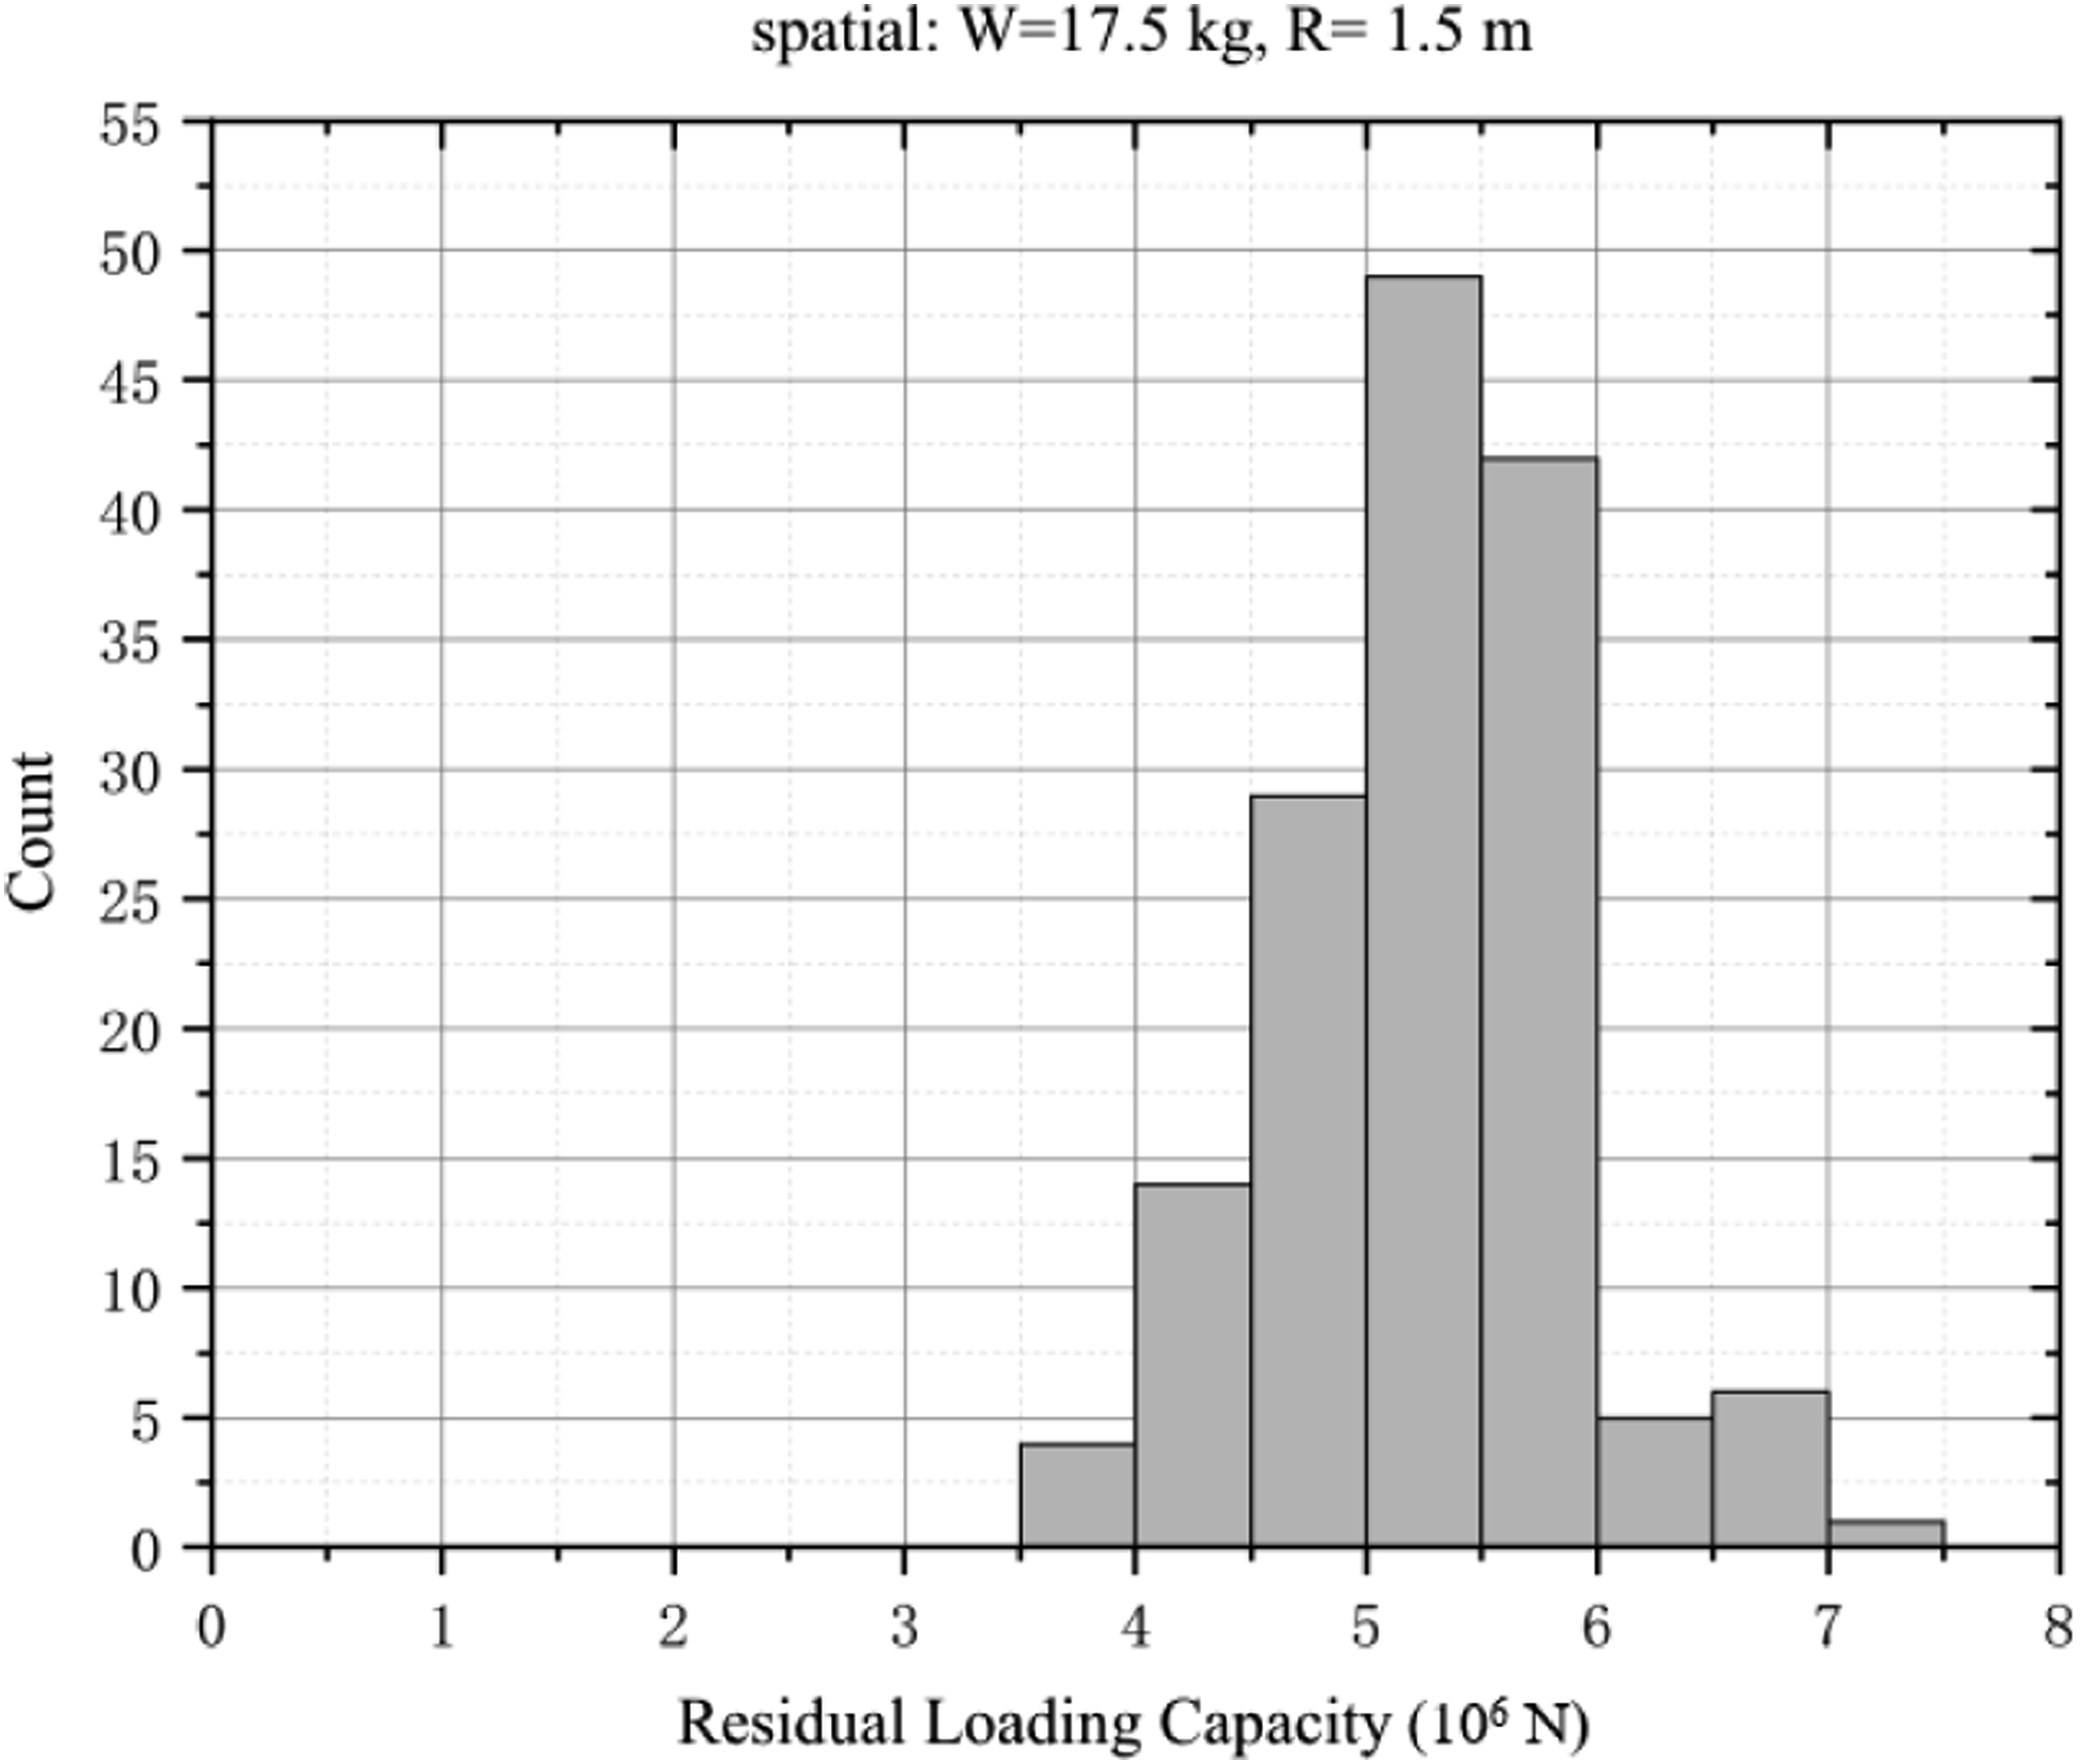
By comparing Figures 13 and 14, it is evident that the statistical distribution of non-spatial models exhibits a relatively scattered pattern, whereas that of spatial models demonstrates a comparatively concentrated trend within the range of 5000–6000 kN. Considering the spatial variability, the mean and COV of the residual loading capacity of UHPC columns are reduced by 13% and 29%, respectively, and the mean and COV of theoretical axial load capacity are reduced by 4% and 39%, respectively, as shown in Table 5. Histogram of residual loading capacity of non-spatial models. Histogram of residual loading capacity of spatial models. Summary of non-spatial and spatial simulation results of UHPC columns.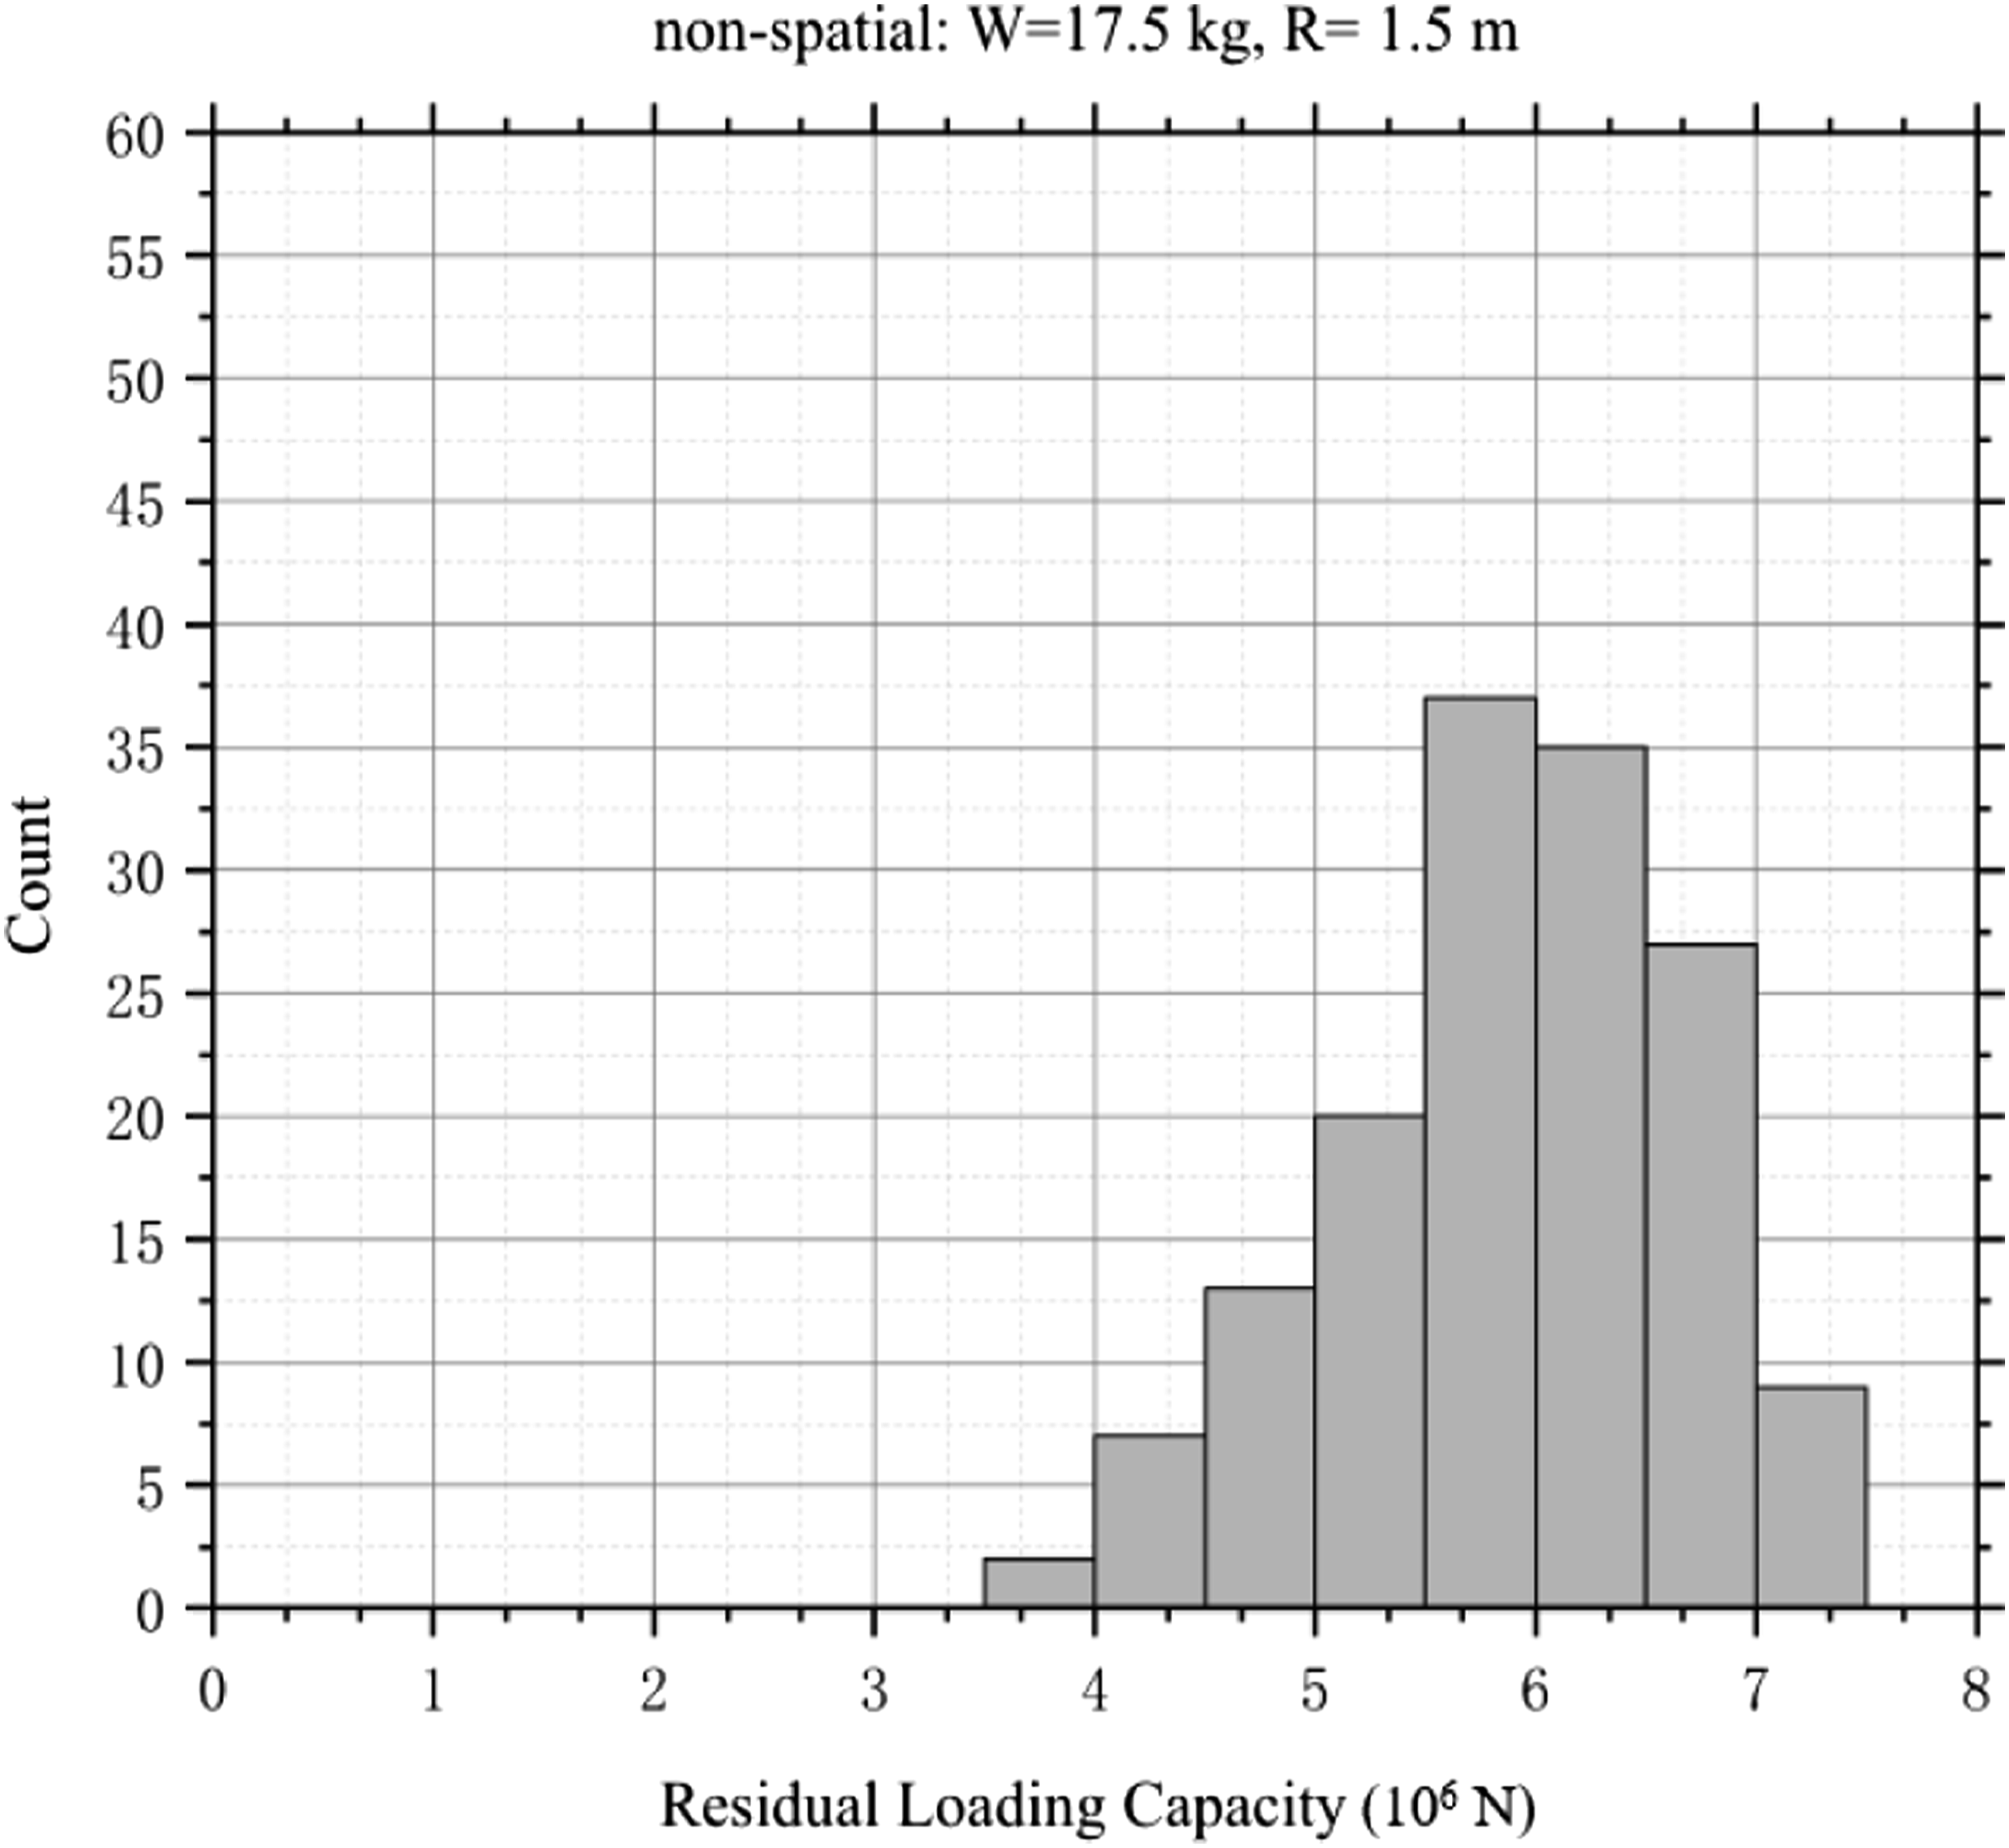

Damage index
Shi et al. (2015b) used the degradation of axial loading capacity of reinforced concrete columns to quantify column damage. The damage index proposed is defined as:
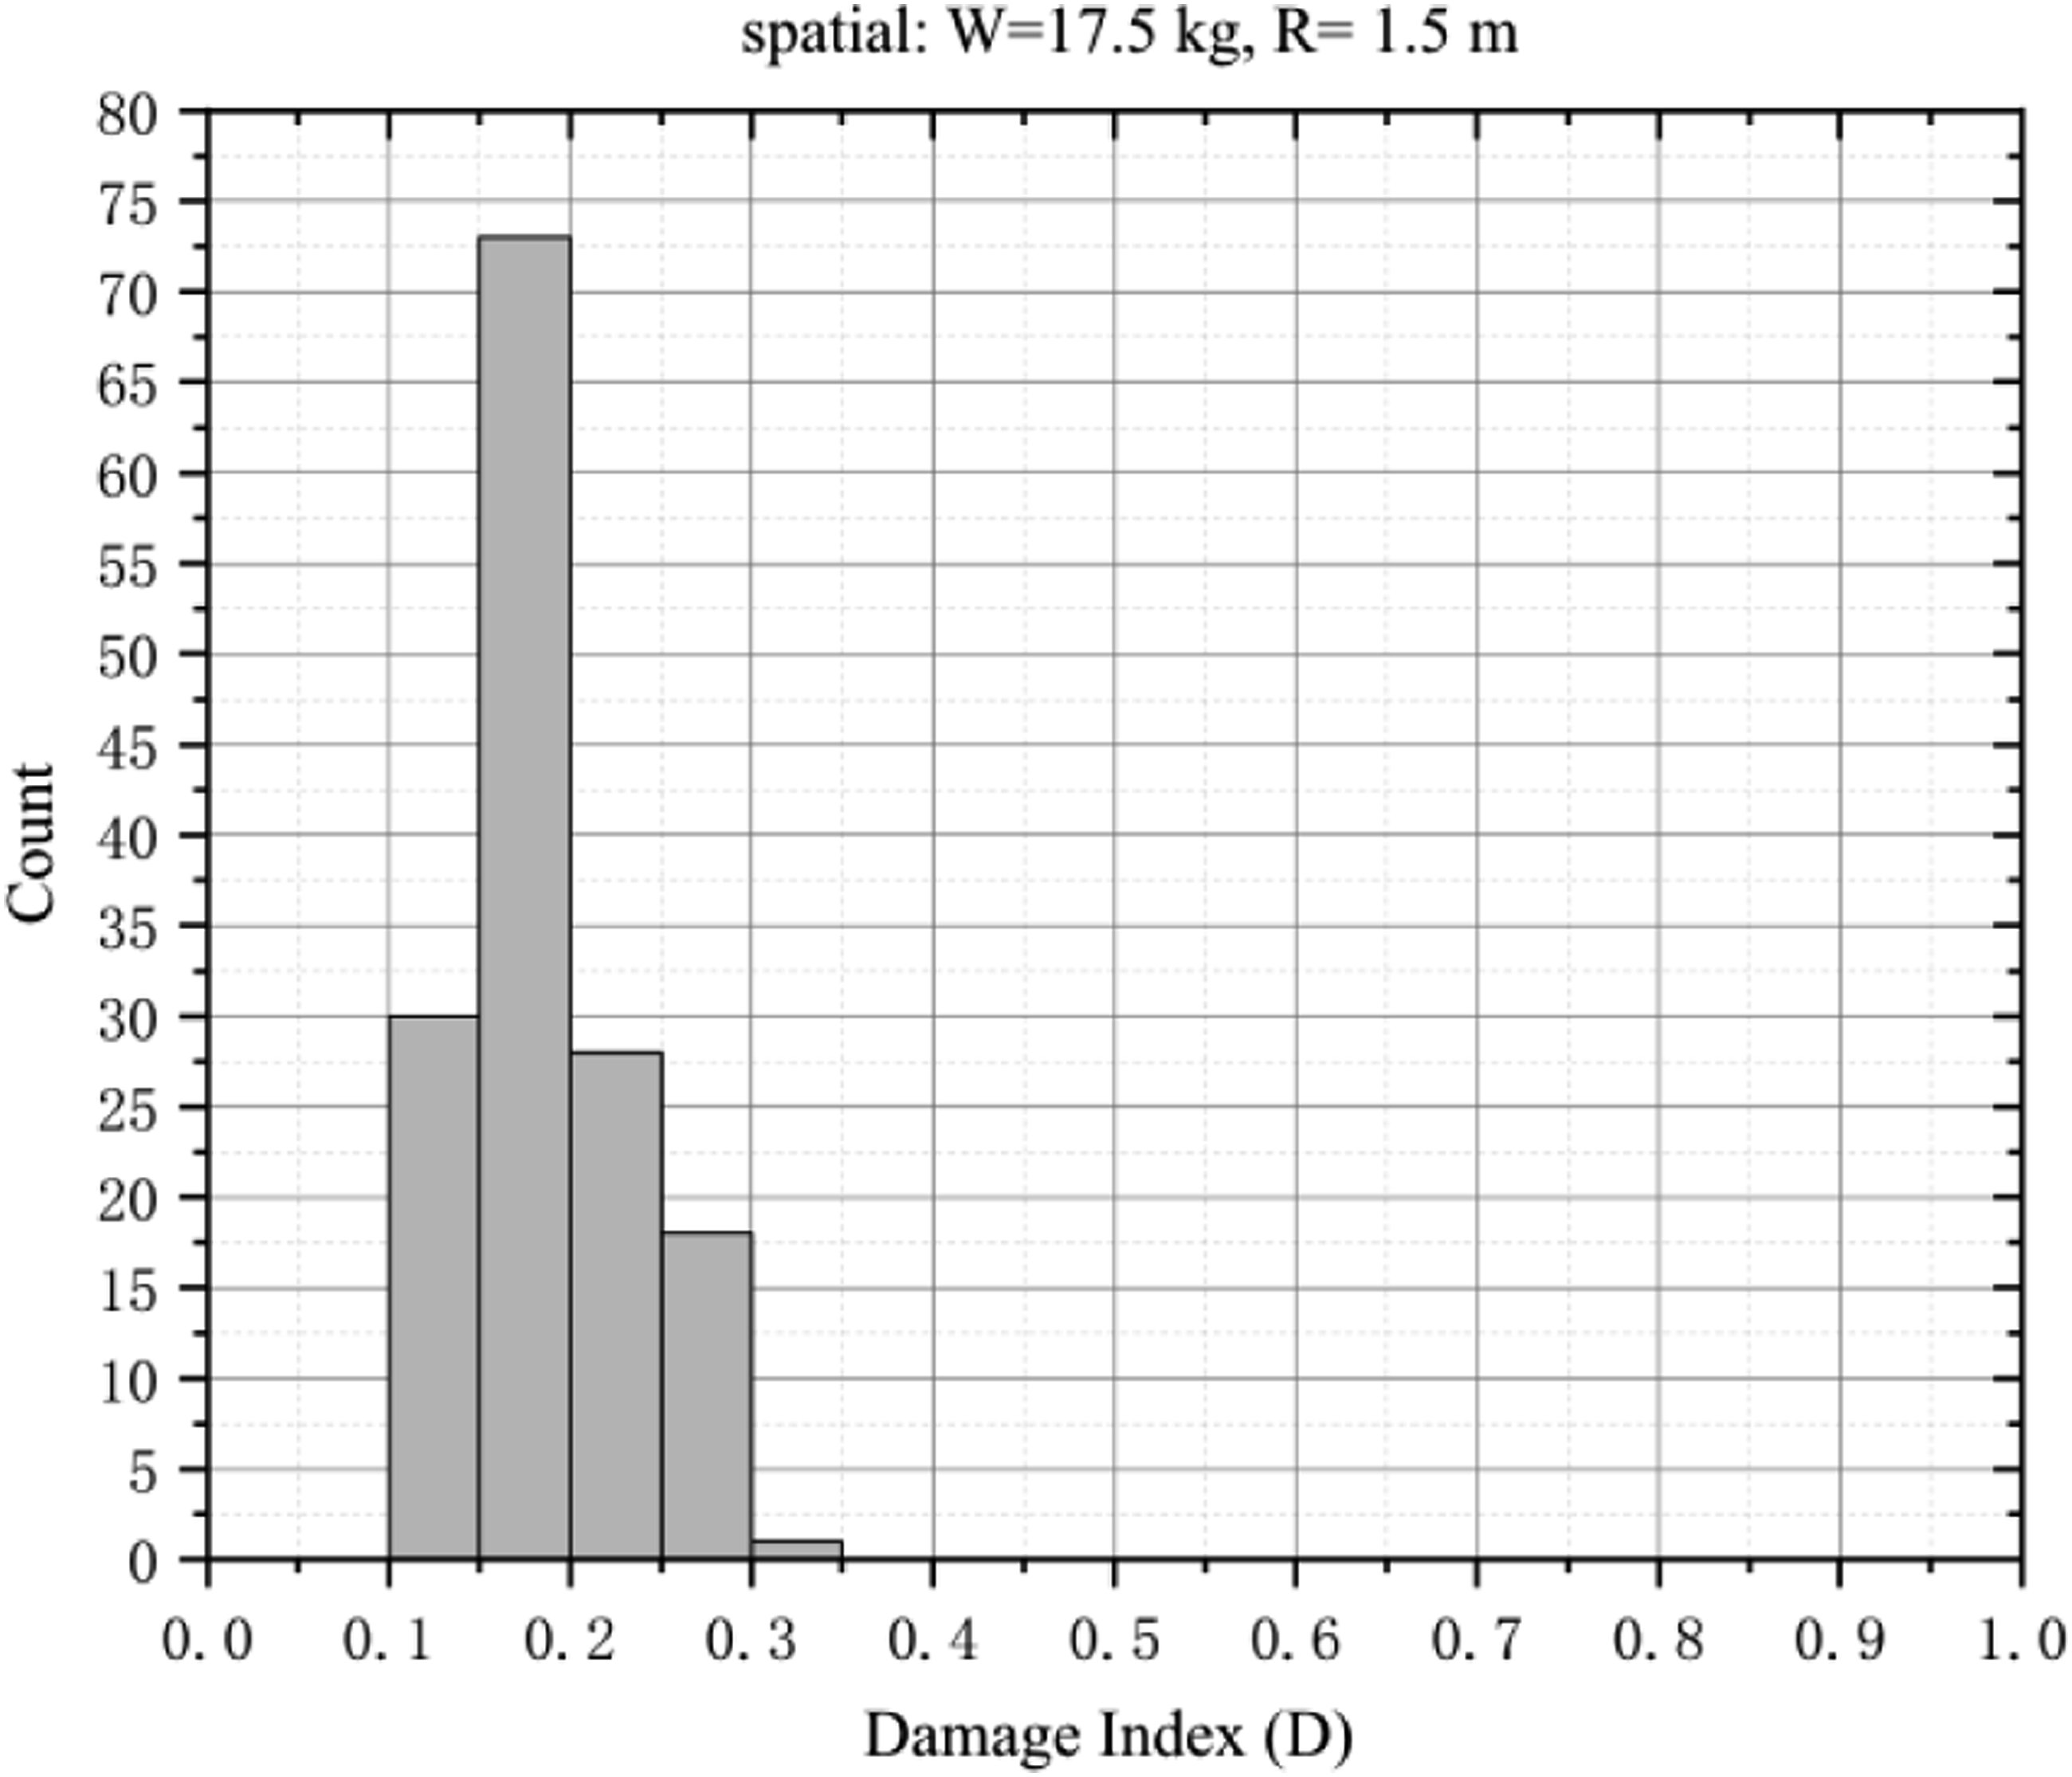
The UHPC column damage index (D) without and with spatial variability is shown in Figures 15 and 16, respectively. In the non-spatial analyses, 43% of the models were medium damage (i.e., D = 0.2–0.5) and 57% were low damage (i.e., D = 0–0.2). In the spatial analyses, 72% were low damage and 18% were medium damage. When spatial variability is considered, the COV of D decreases by 27.5% from 0.342 to 0.248. Histogram of non-spatial models damage index. Histogram of spatial models damage index.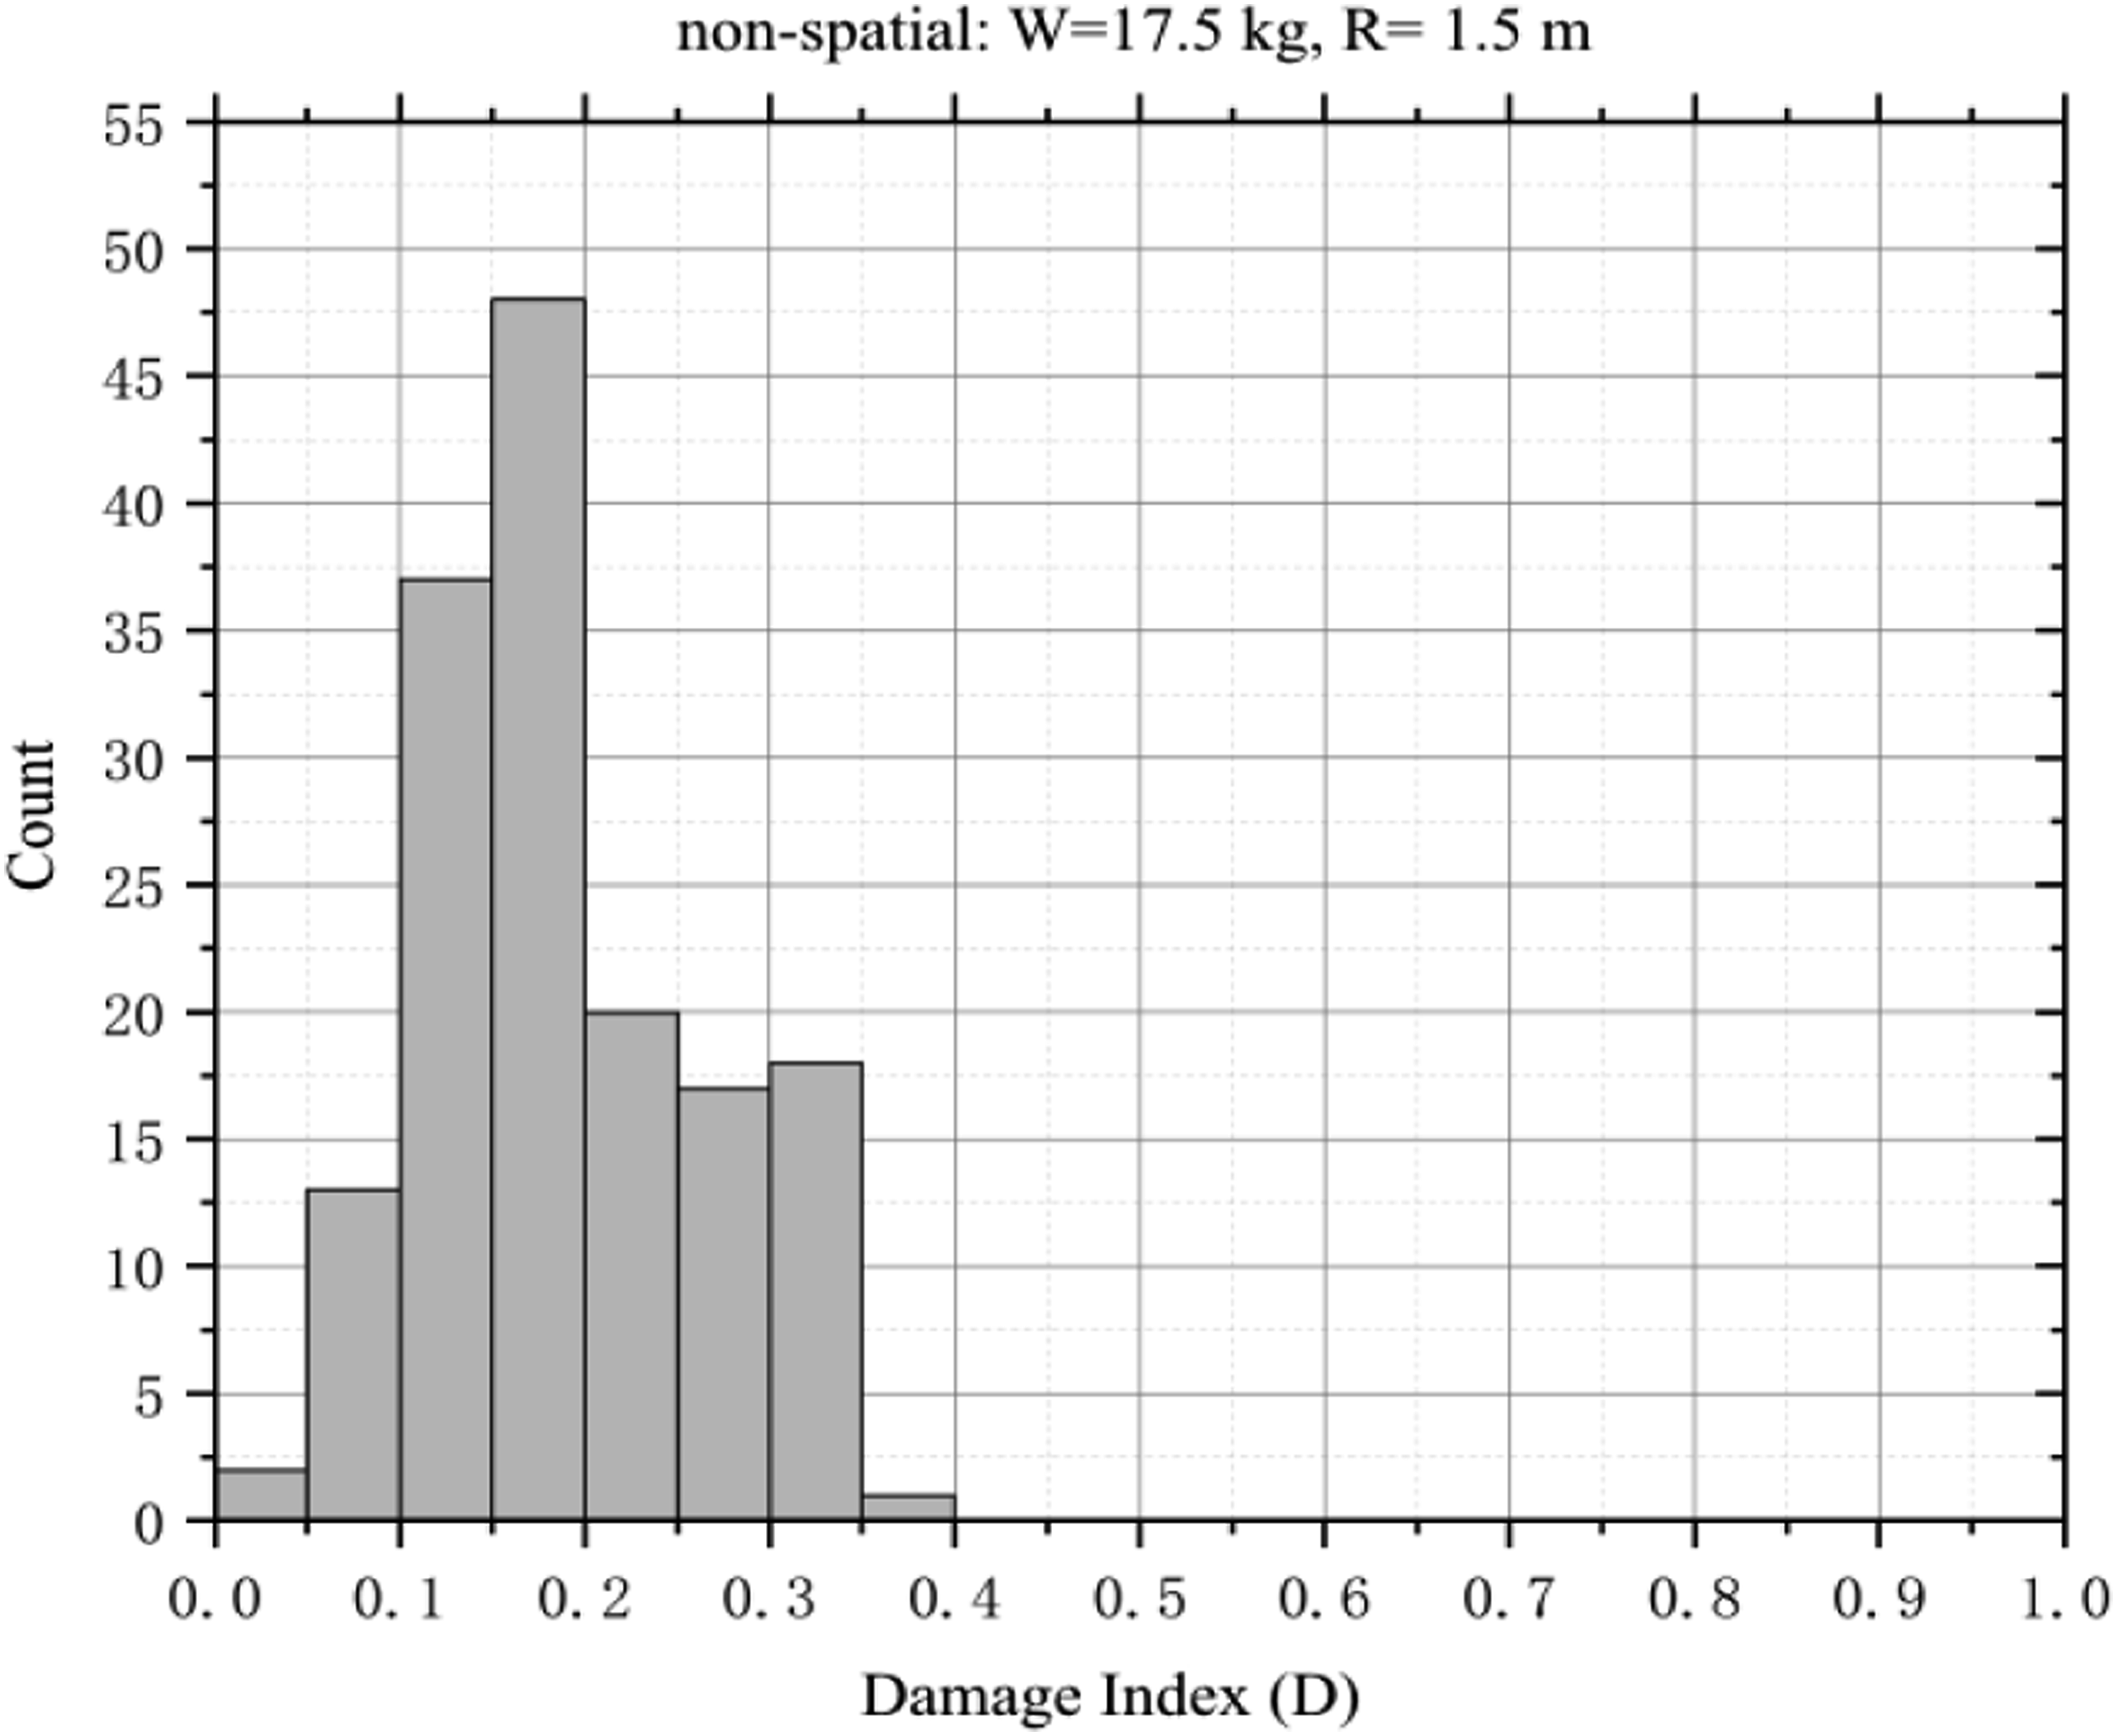
For UHPC columns, simulation results of non-spatial analyses and spatial analyses are presented in Table 5.
Failure mode
Under explosion impact, the failure mode of UHPC column in non-spatial model is only the symmetrical flexural failure. However, the spatial model of UHPC column under explosion impact has a variety of failure modes, which are asymmetric.
(1) Damage modes of non-spatial models
In the non-spatial model results calculated from 150 MCS, all models are finally damaged at the middle part of the UHPC column. Due to the absence of spatial variability, all concrete elements within the column exhibit uniform compressive strength. Consequently, the explosion impact primarily induces damage in the central region, leading to flexural failure as depicted in Figure 17. Failure mode of non-spatial model.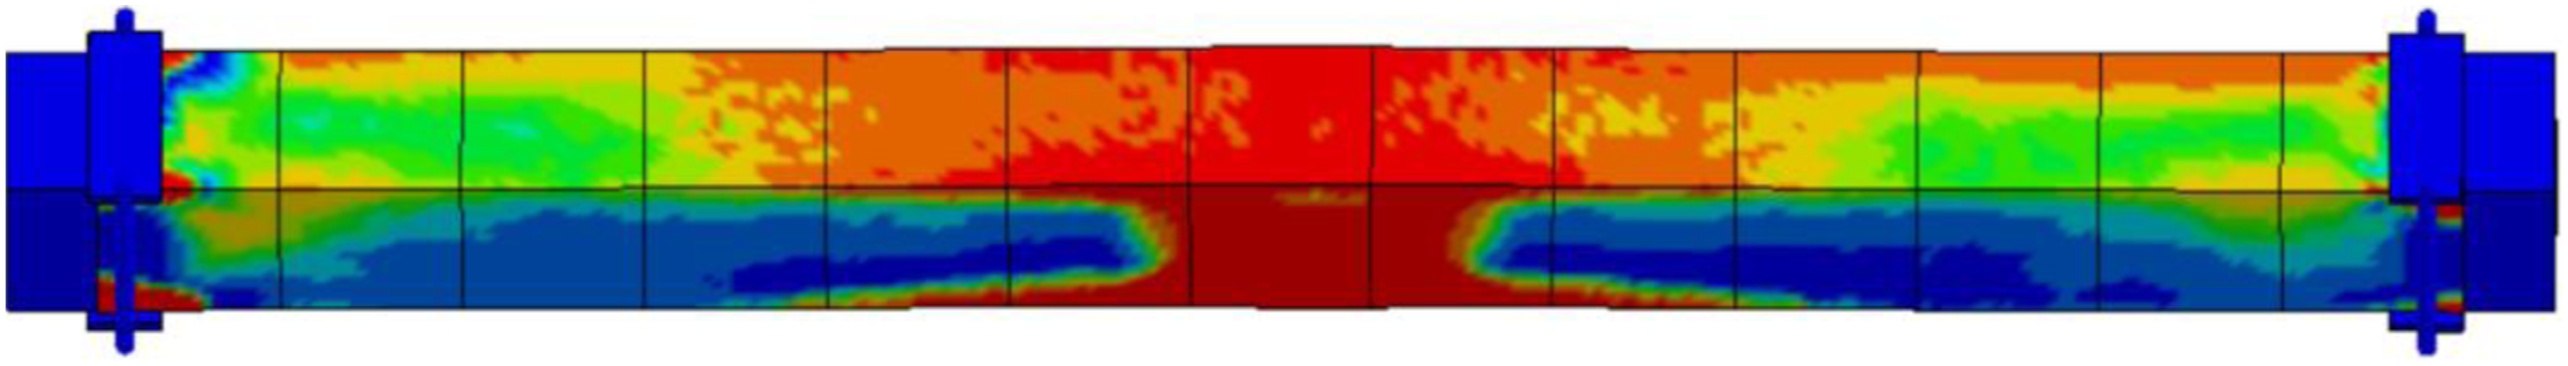
(2) Damage modes of spatial models
In the spatial model results calculated from 150 MCS, 49% of the models are damaged at the top of the column, 37% are damaged in the middle of the column, and 14% are damaged at the bottom of the column. Compared with the flexural failure in the non-spatial models, there are more failure modes in the spatial models, which can be summarized as follows:
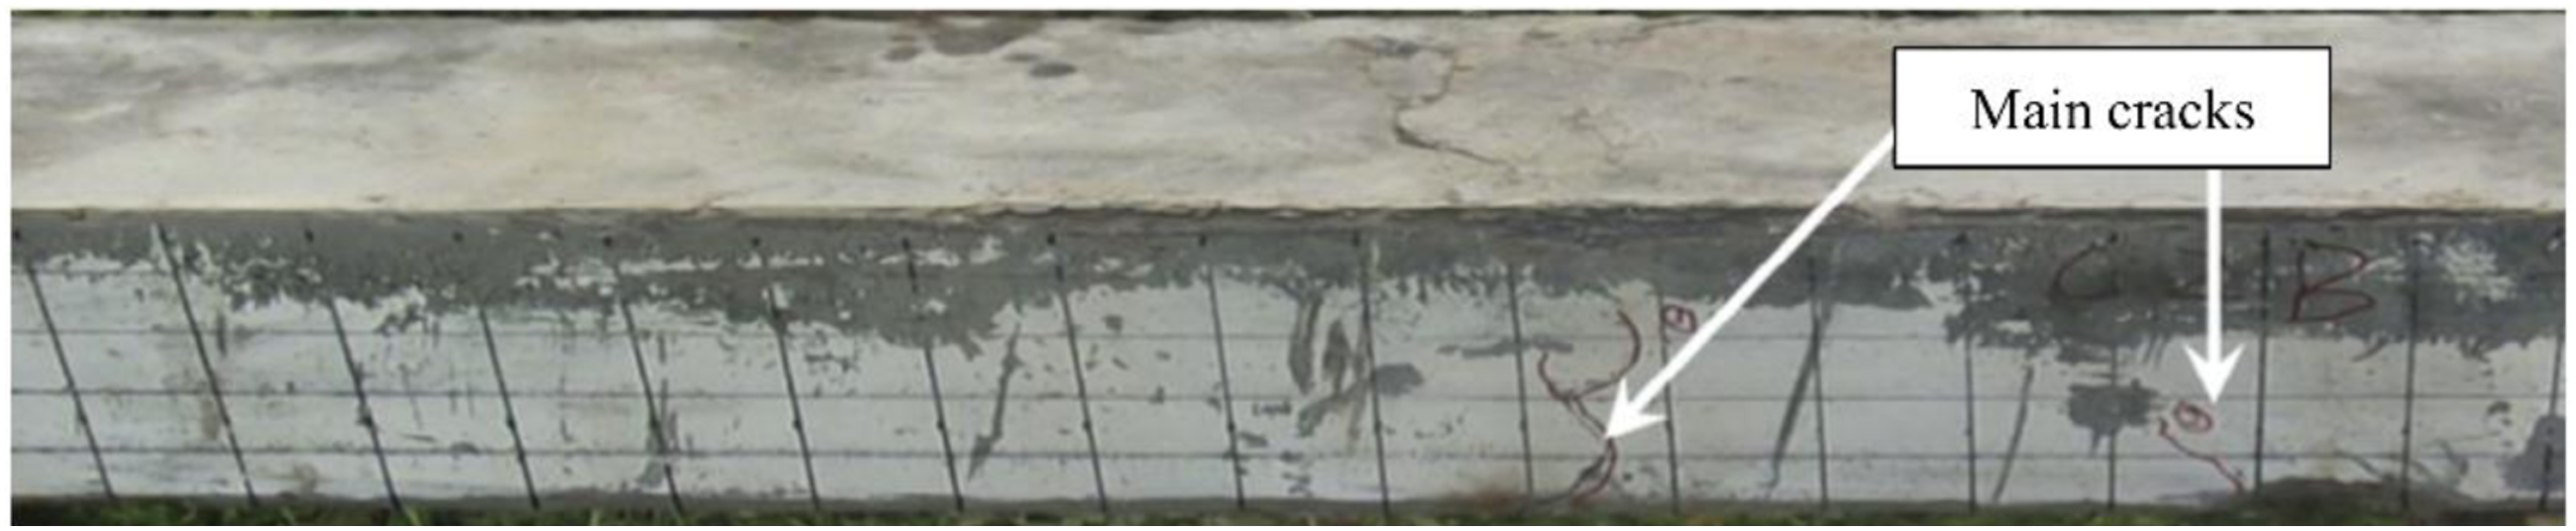
(a) Flexural failure. By analyzing the strength data of this failure mode, it is found that the compressive strength of the UHPC in the middle part of the UHPC column is relatively small, which makes the damage resistance ability small. Compared with the non-spatial model, this failure mode is asymmetrical and closer to the experimental situation (Su et al., 2017), as shown in Figures 18 and 19. Flexural failure. UHPC after 17.5 kg explosion in the field test (Su et al., 2017).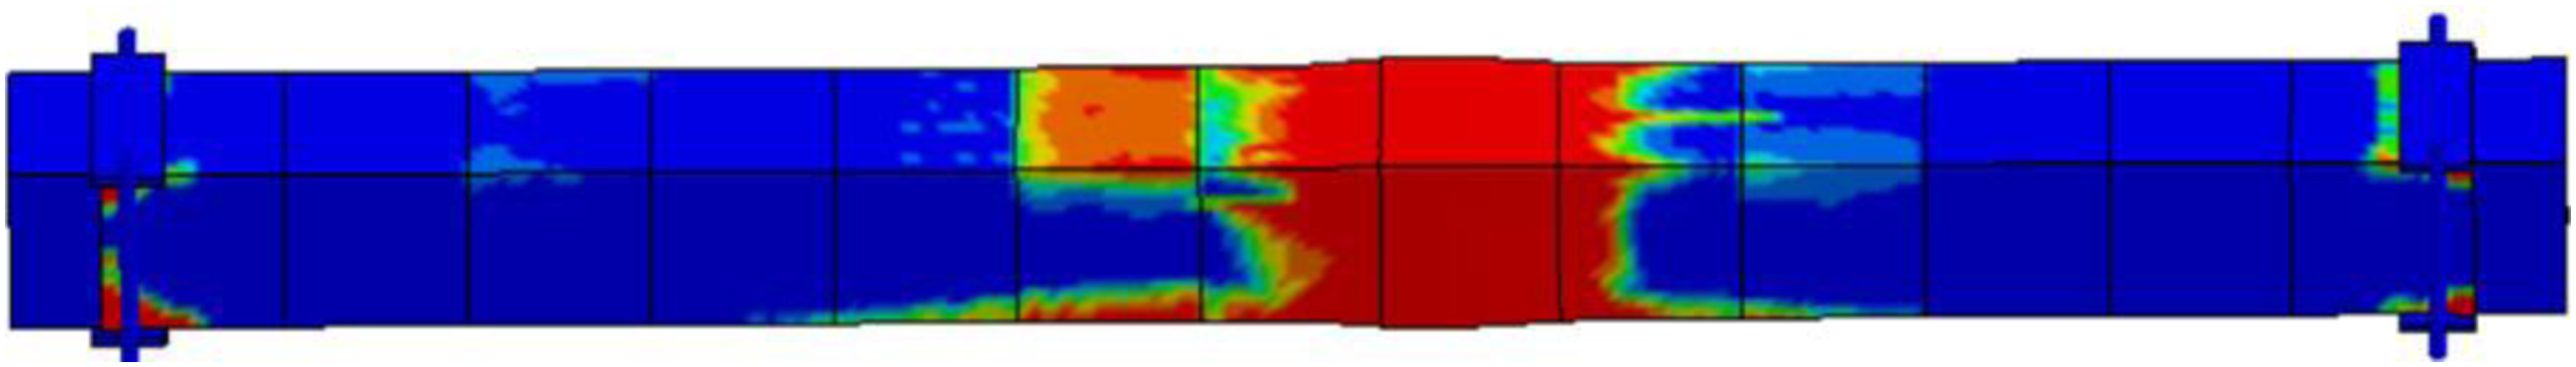
(b) Shear failure. In the spatial model, because the action time of the blast loads is very short and the compressive strength of the column top concrete is 10%–20% lower than the random mean value, the increase of the shear stress of the column head precedes the development of the flexural deformation in the column, so before the flexural deformation occurs, the shear failure limit has been reached near the column head, resulting in shear failure, as shown in Figure 20. Shear failure.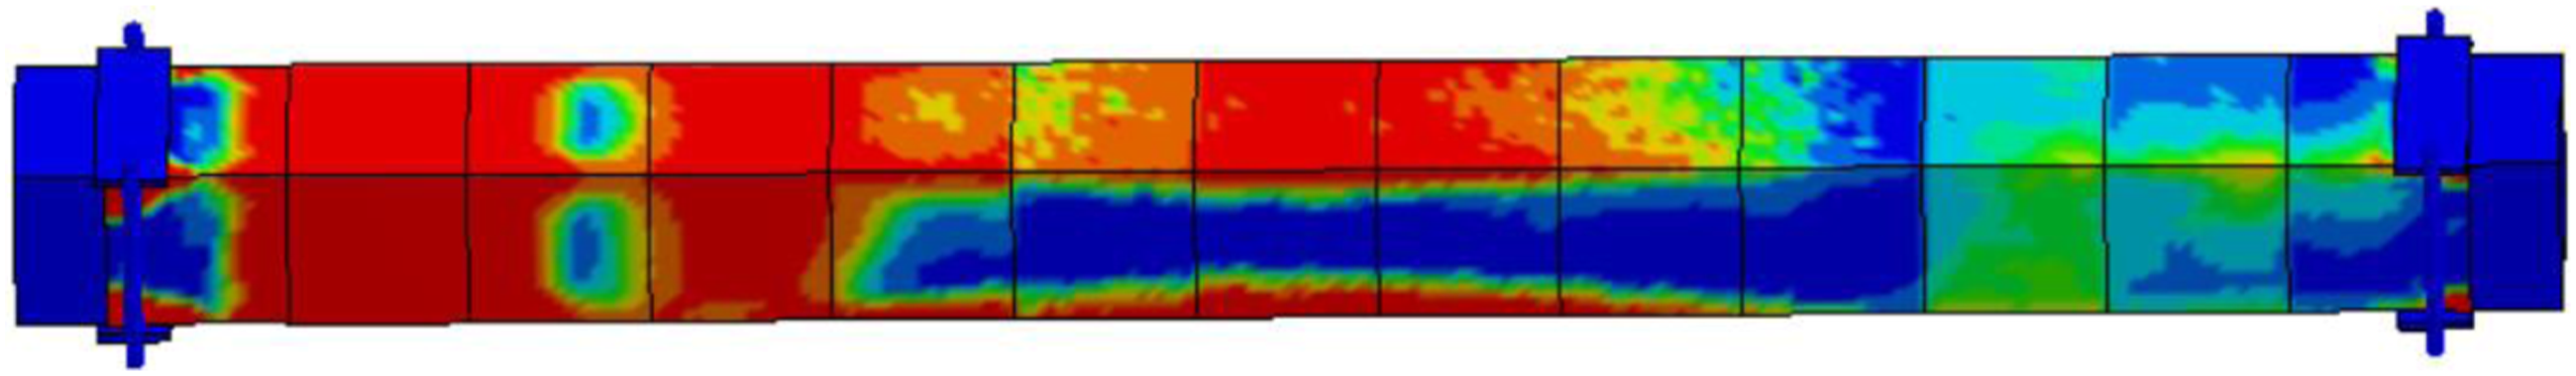
(c) flexural shear failure. This failure occurs in the middle and the ends of UHPC column. The cause of flexural shear failure is the combination of the above (a) and (b) two conditions, as shown in Figure 21.
Damage prediction of ultra-high performance concrete columns with different sizes under different explosion severities
In this section, the non-spatial and spatial models are used to further explore the variability laws of UHPC columns with different damage degrees under different section sizes, so as to provide reference suggestions for the blast-resistant design of UHPC. Flexural shear failure.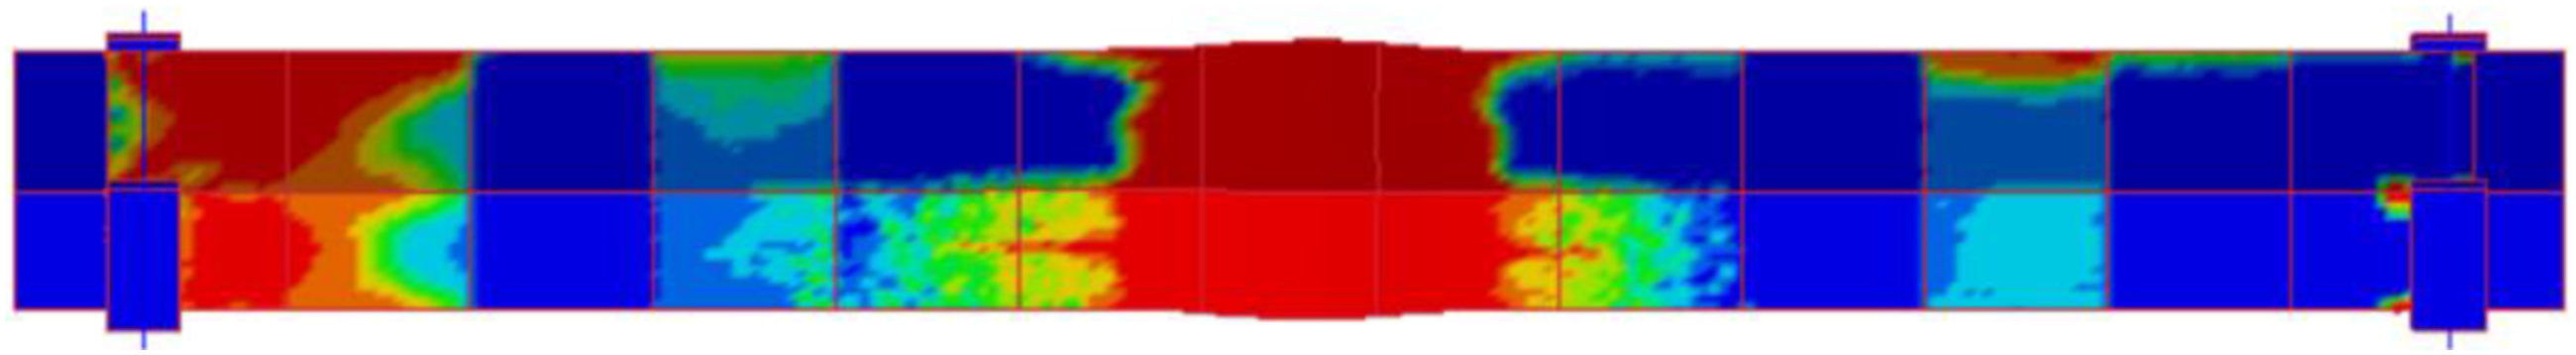
Three UHPC columns with different dimensions are designed in this section. For all columns, the standoff was 1.5 m, the explosive mass was changed to cause different damage degrees to the UHPC column.
Ultra-high performance concrete column design
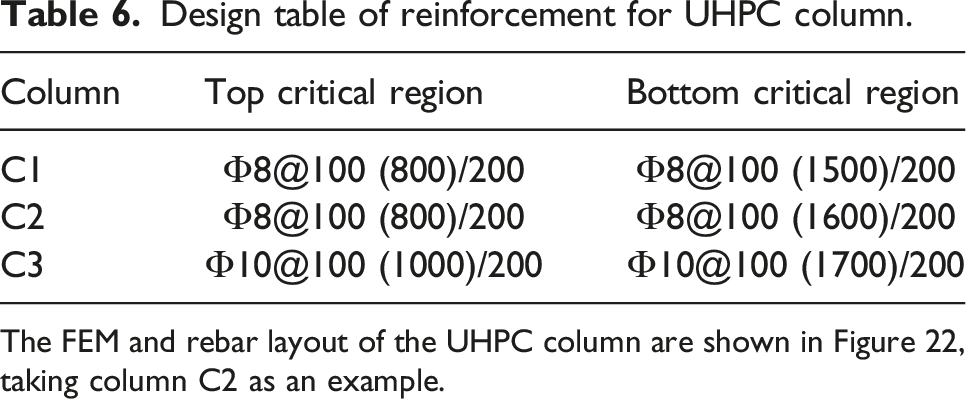
Design table of reinforcement for UHPC column.
The FEM and rebar layout of the UHPC column are shown in Figure 22, taking column C2 as an example.
Model of UHPC column and reinforcement.
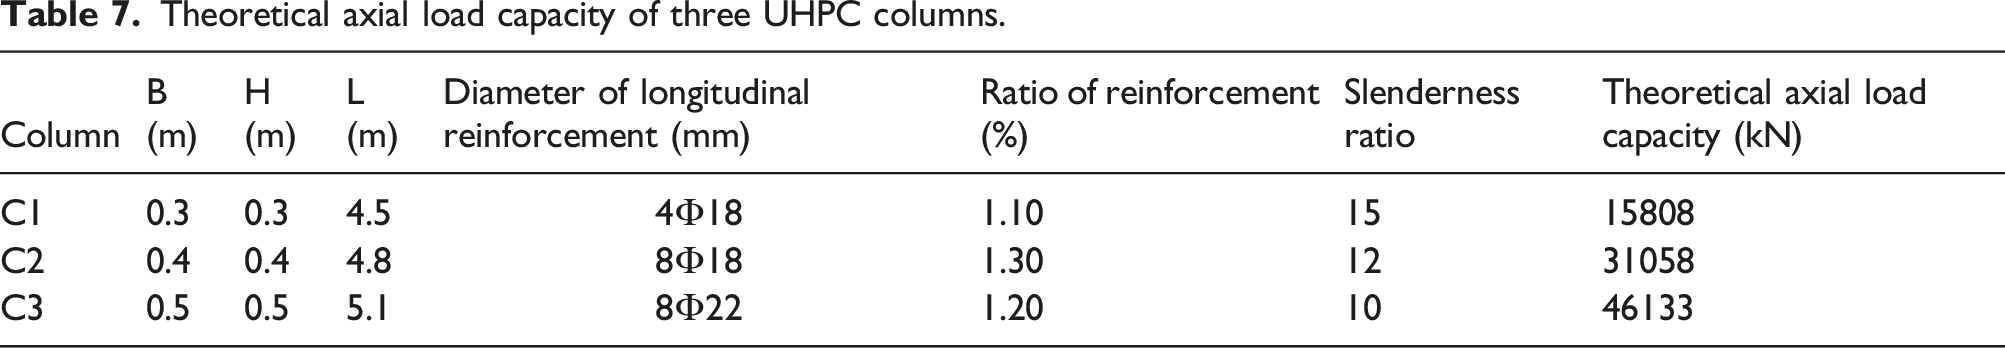
Theoretical axial load capacity of three UHPC columns.
Numerical simulation results
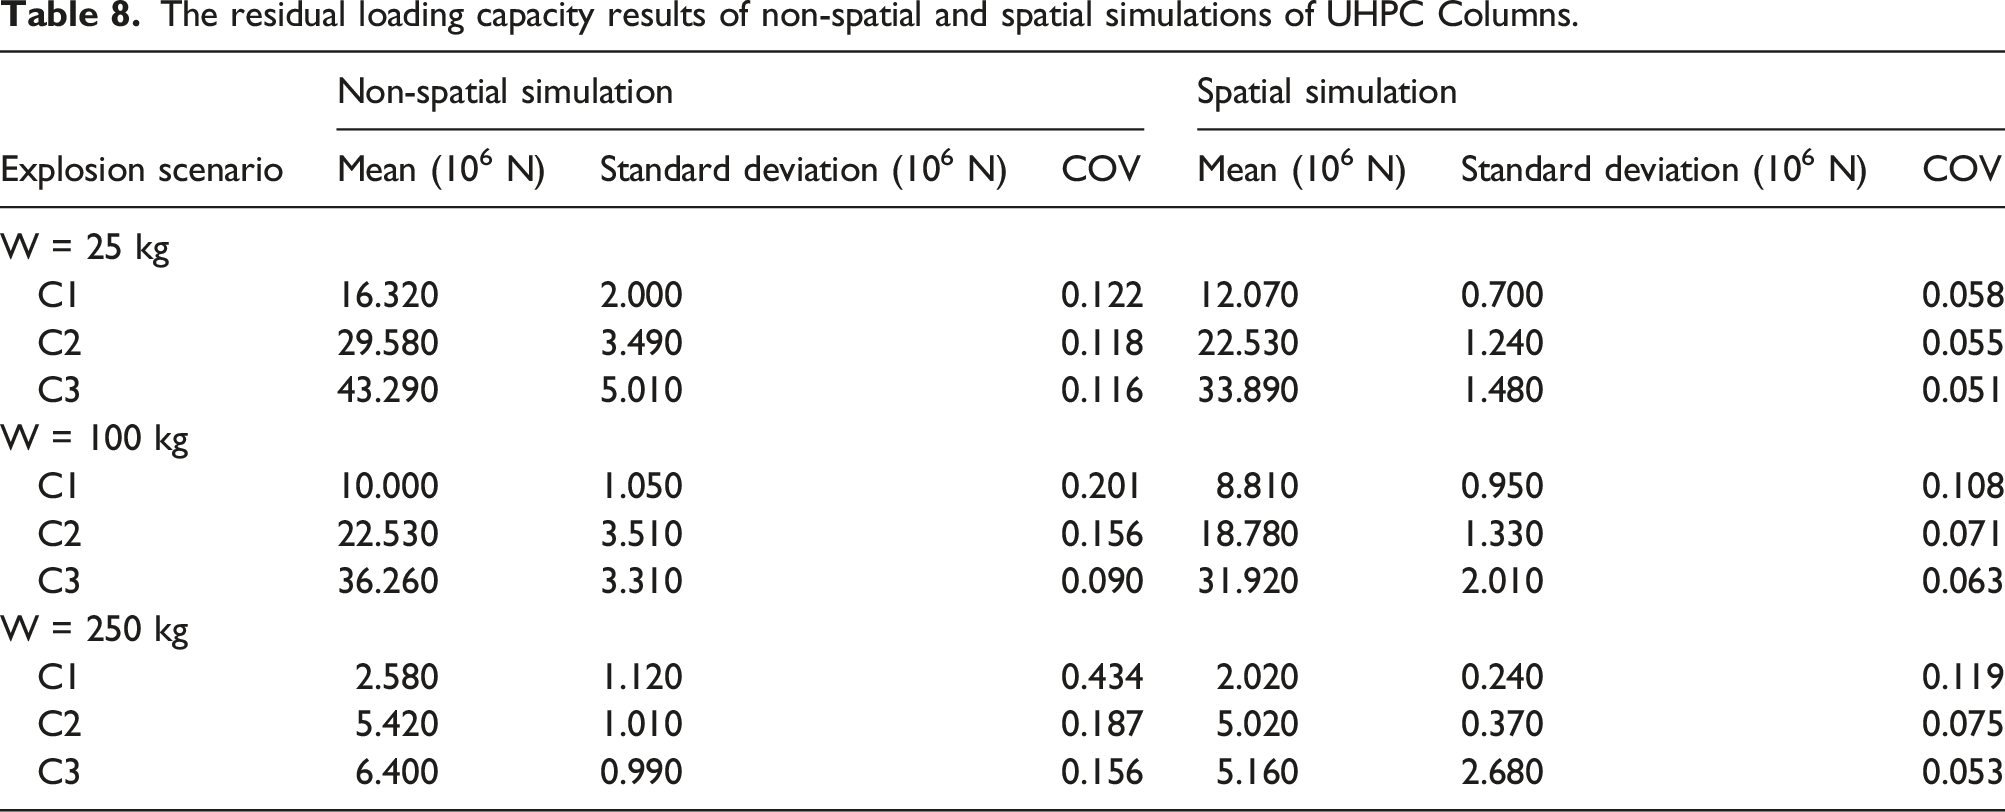
The residual loading capacity results of non-spatial and spatial simulations of UHPC Columns.
Residual loading capacity
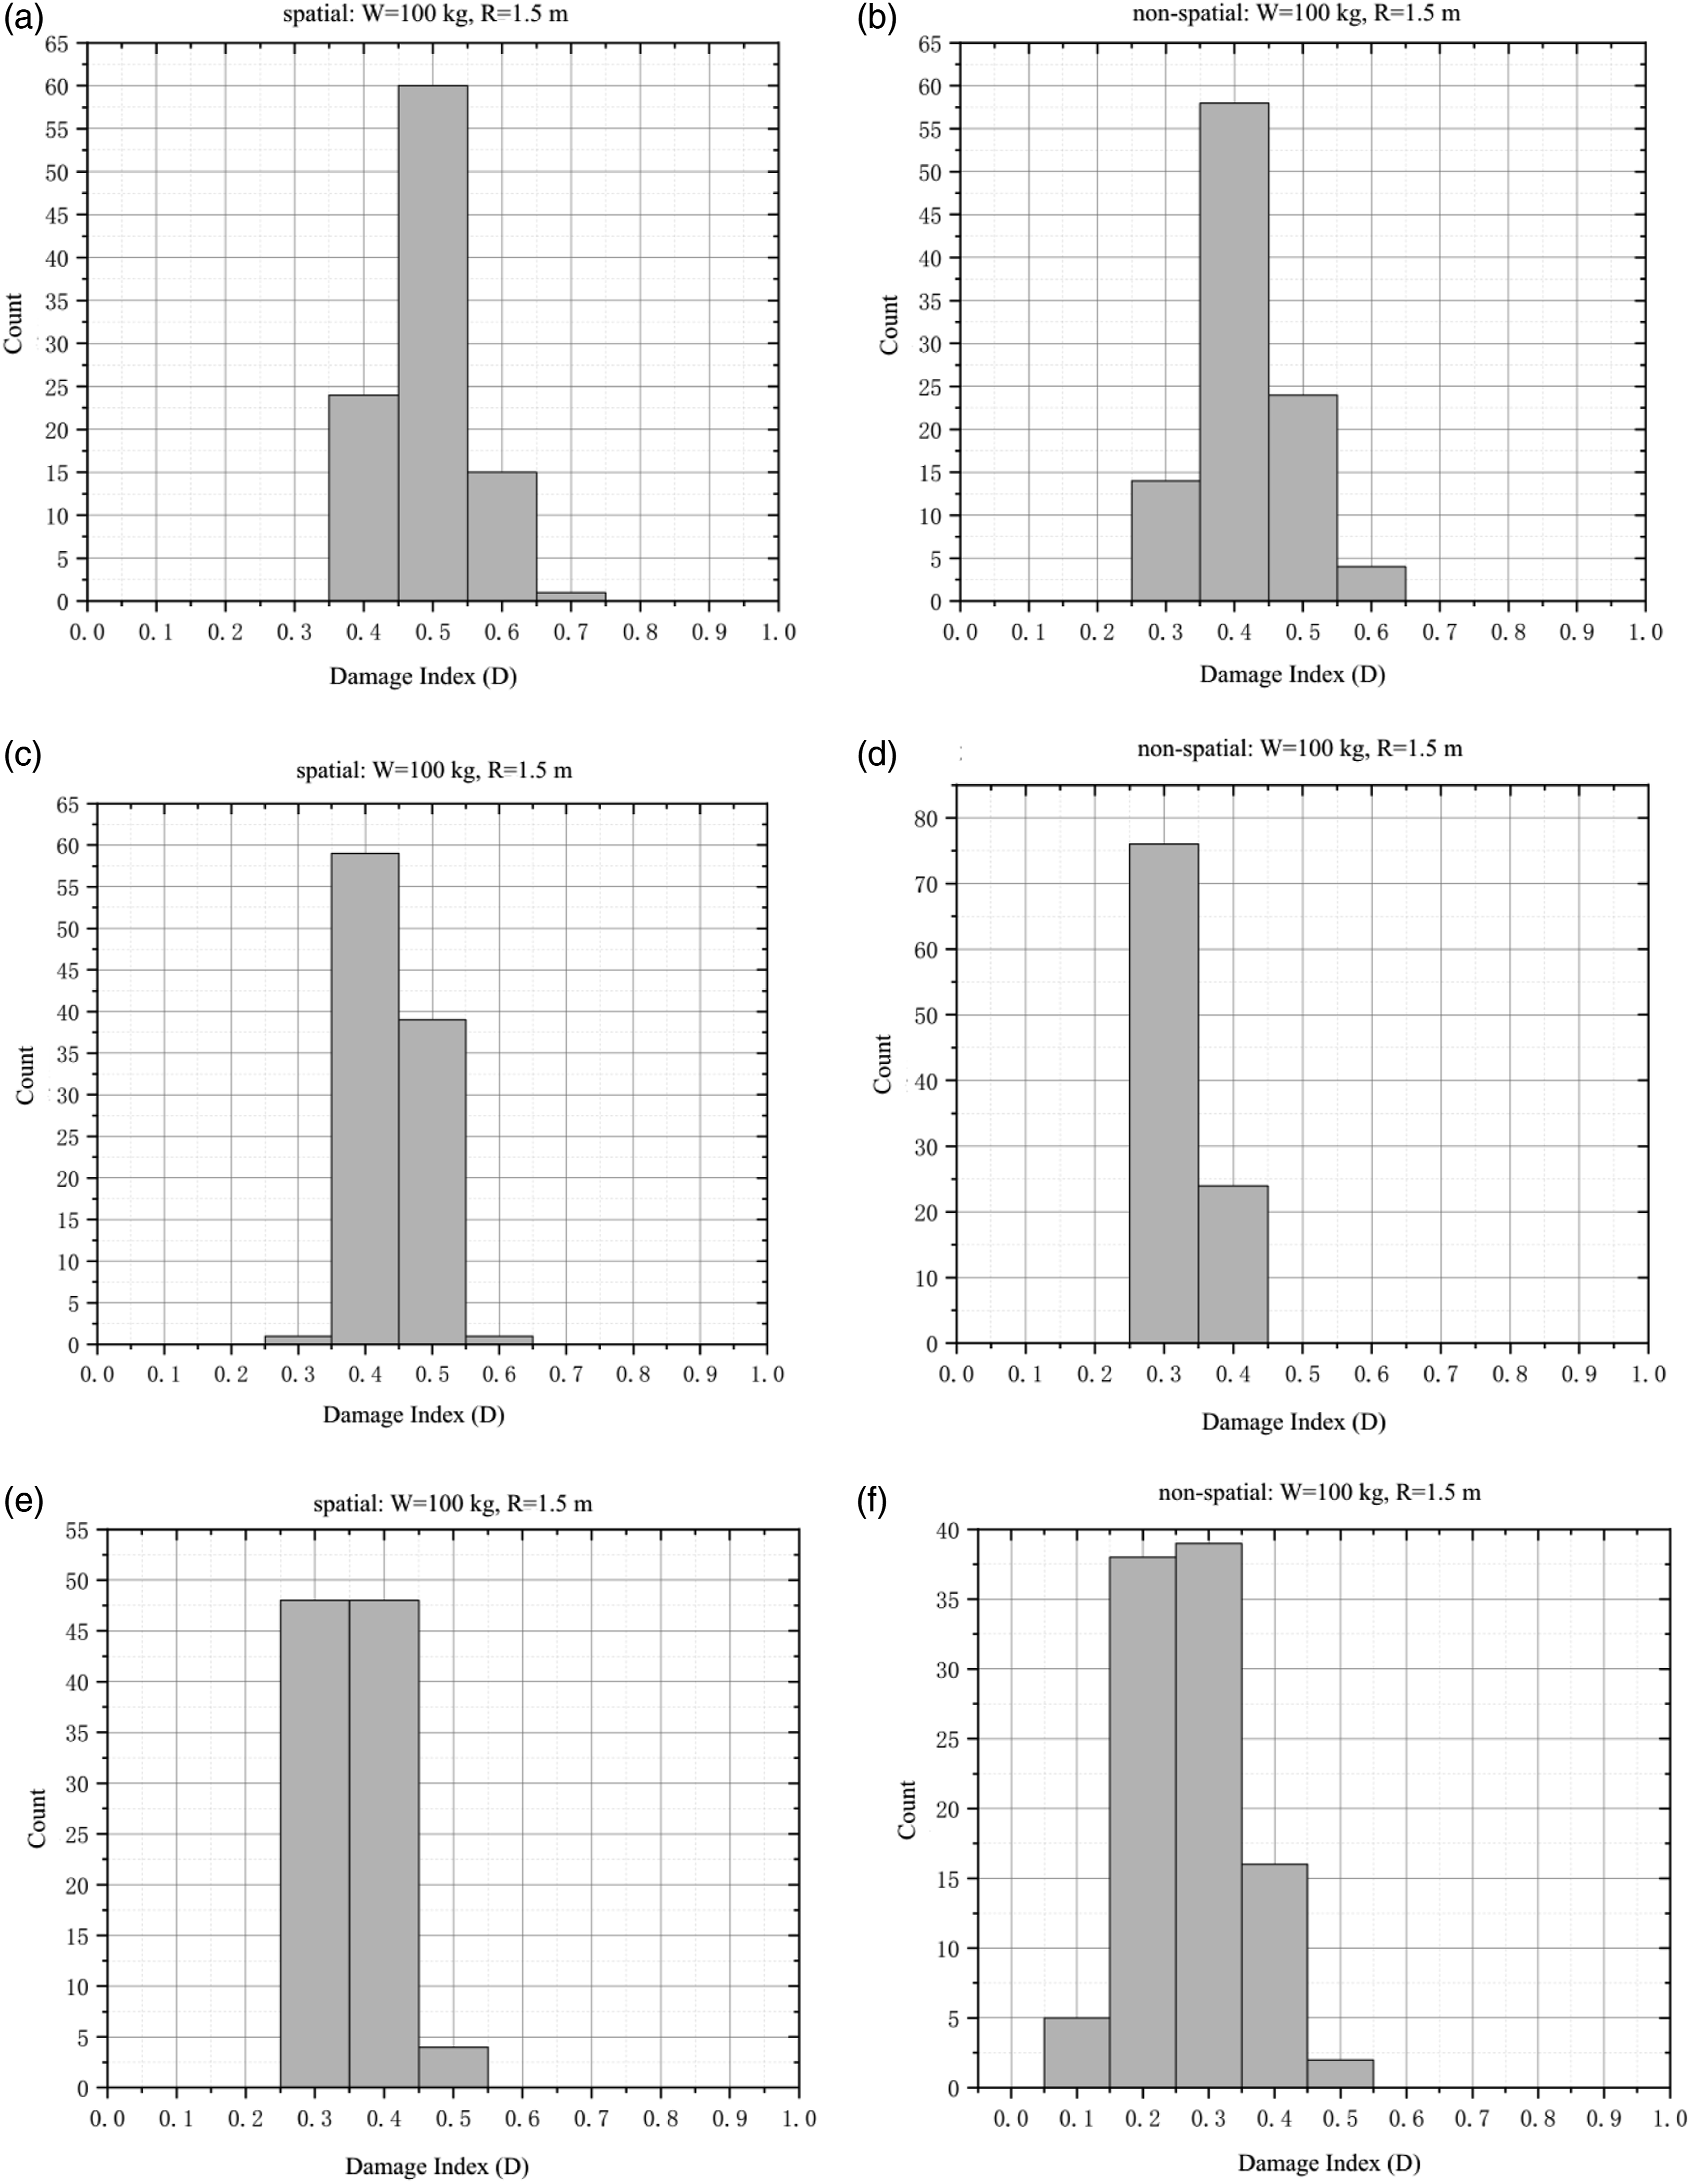
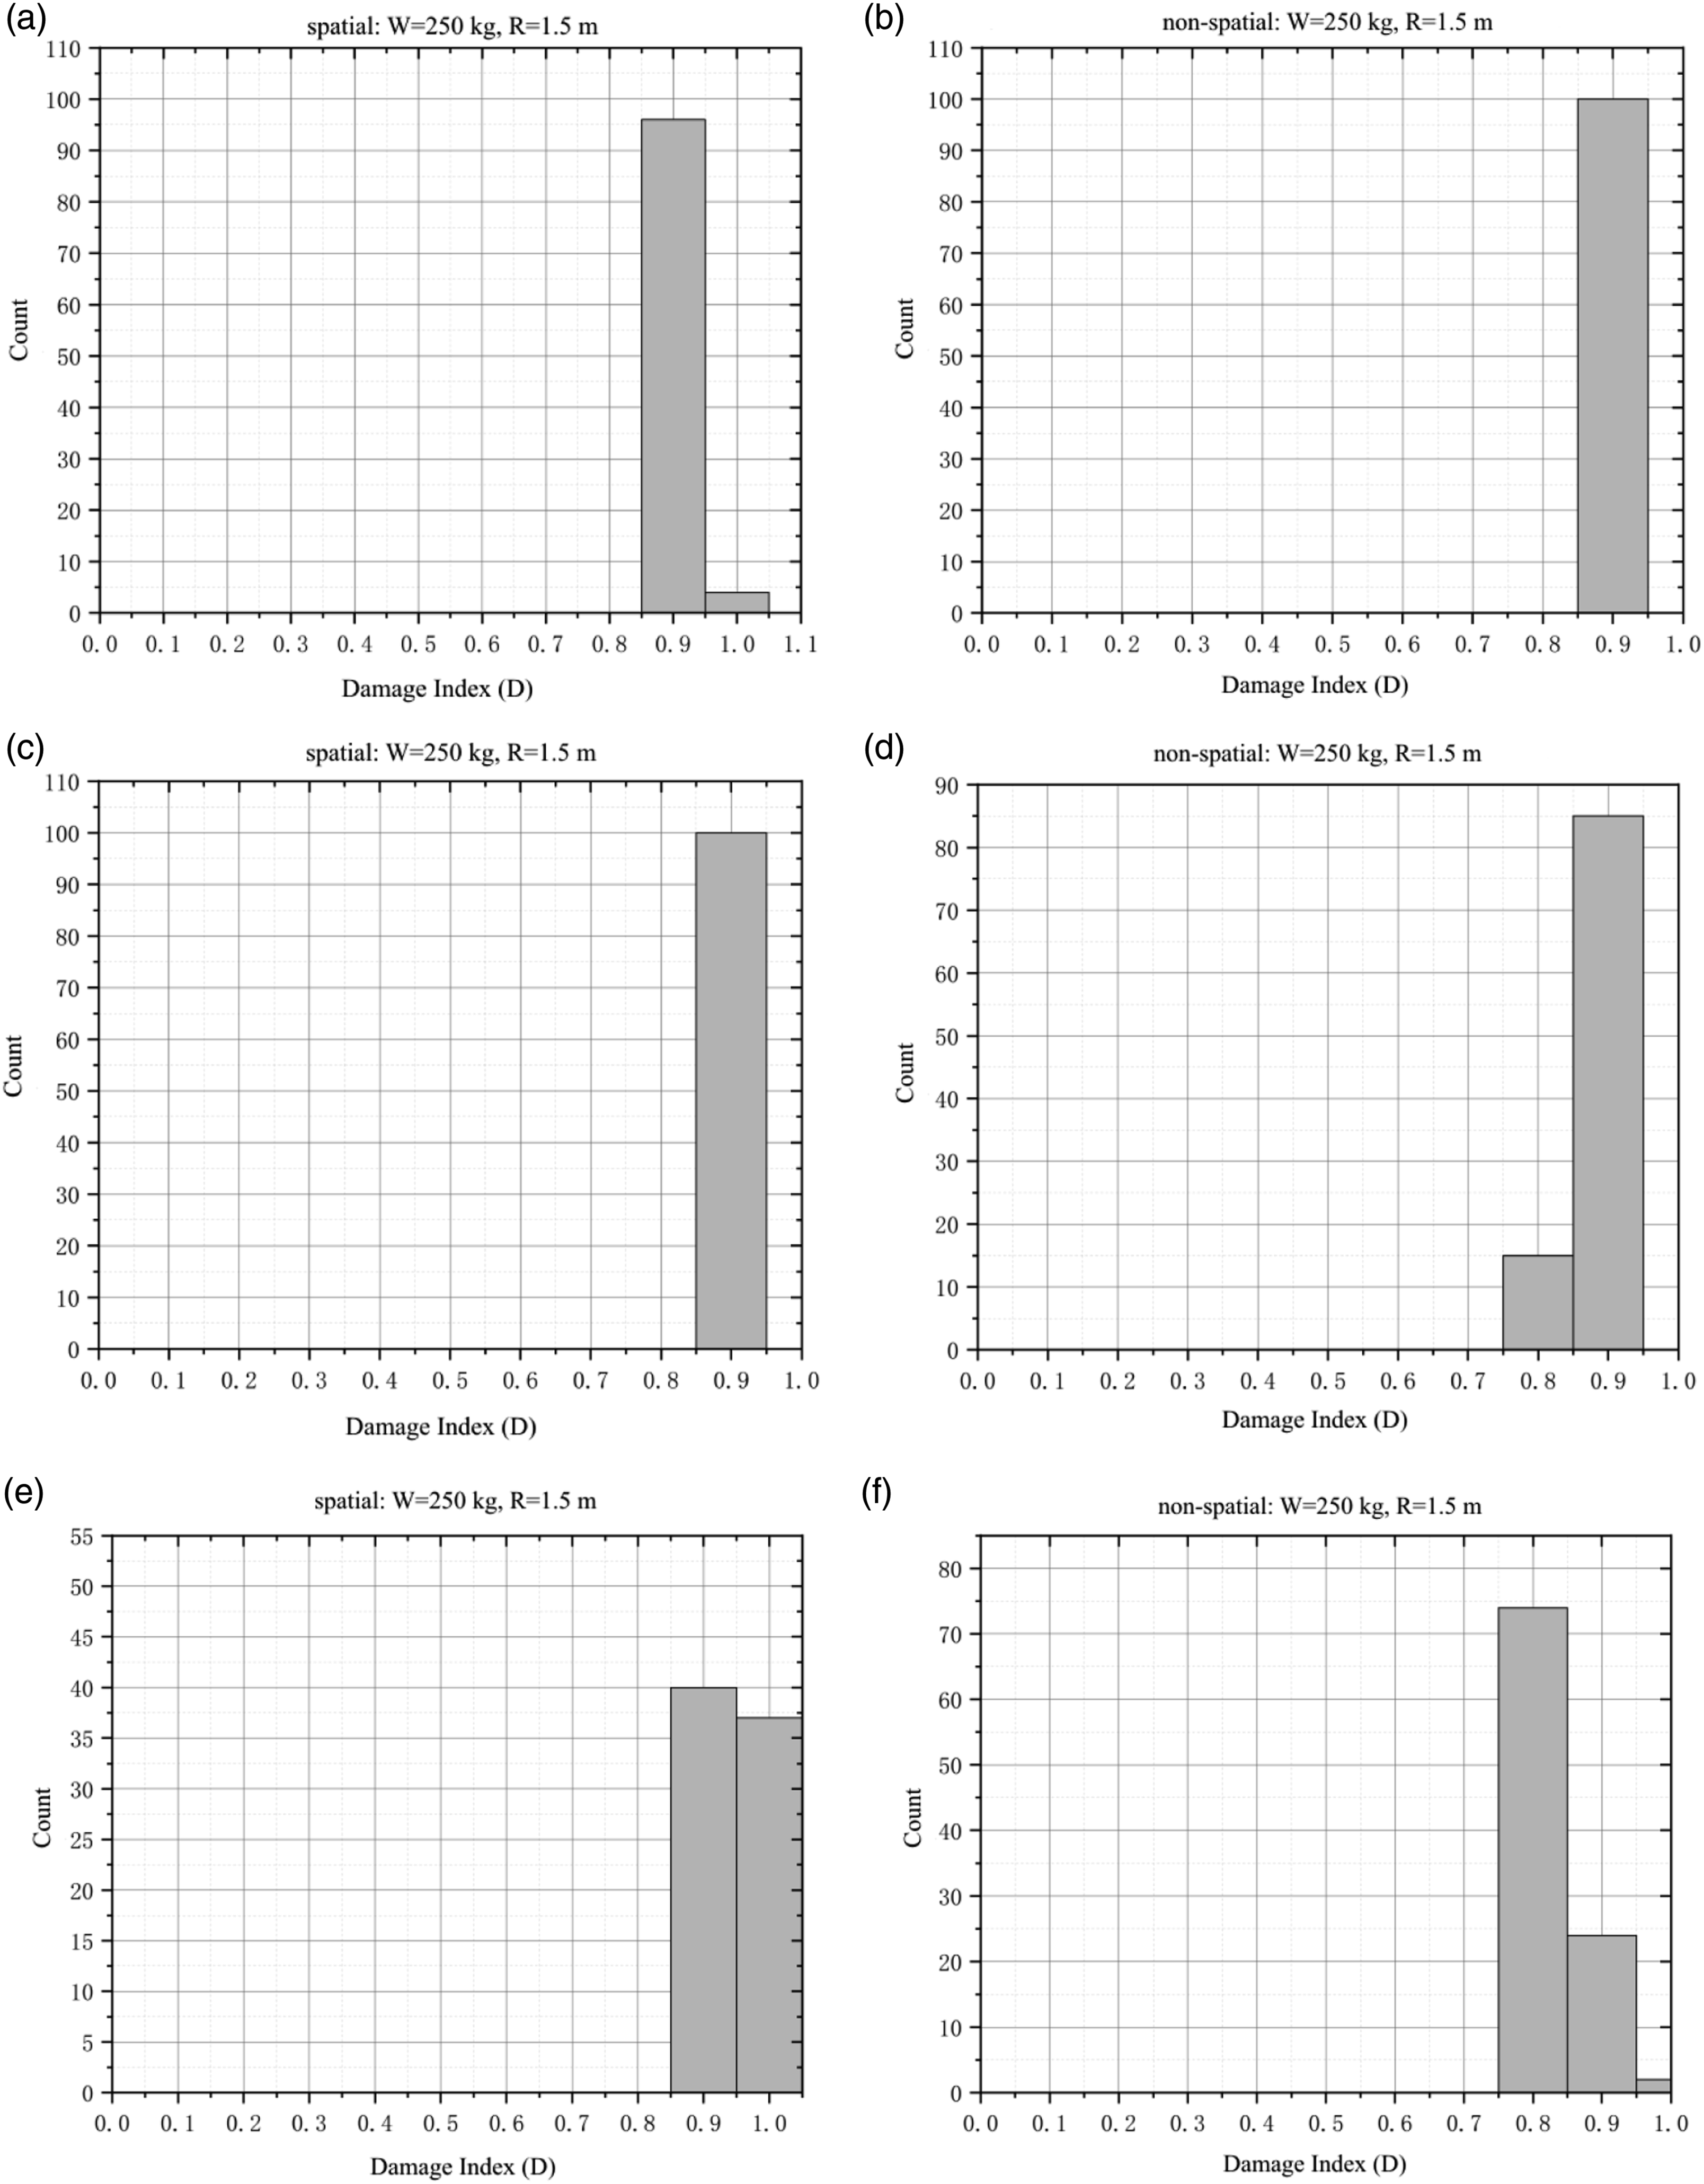
The histograms of the residual loading capacity of the three UHPC columns under different explosion scenarios are illustrated in Figures 23–25. According to the statistical data in Tables 8 and it can be concluded that: First, in all working conditions, the COV of residual loading capacity of the spatial models is always smaller than that of the non-spatial models under explosion impact; Second, in both non-spatial and spatial models, the COV of residual loading capacity of UHPC column decreases with the increase in column section size under the same explosion scenario, and the difference increases with the explosive mass. Thirdly, compared with the non-spatial model, the spatial variability reduces the mean residual loading capacity of UHPC columns under blast loads by 7% to 26%. Histograms of residual loading capacity of the three UHPC columns under 25 kg explosive. (a) Spatial model of column C1. (b) Non-spatial model of column C1. (c) Spatial model of column C2. (d) Non-spatial model of column C2. (e) Spatial model of column C3. (f) Non-spatial model of column C3. Histograms of residual loading capacity of the three UHPC columns under 100 kg explosive. (a) Spatial model of column C1. (b) Non-spatial model of column C1. (c) Spatial model of column C2. (d) Non-spatial model of column C2. (e) Spatial model of column C3. (f) Non-spatial model of column C3. Histograms of residual loading capacity of the three UHPC columns under 250 kg explosives. (a) Spatial model of column C1. (b) Non-spatial model of column C1. (c) Spatial model of column C2. (d) Non-spatial model of column C2. (e) Spatial model of column C3. (f) Non-spatial model of column C3.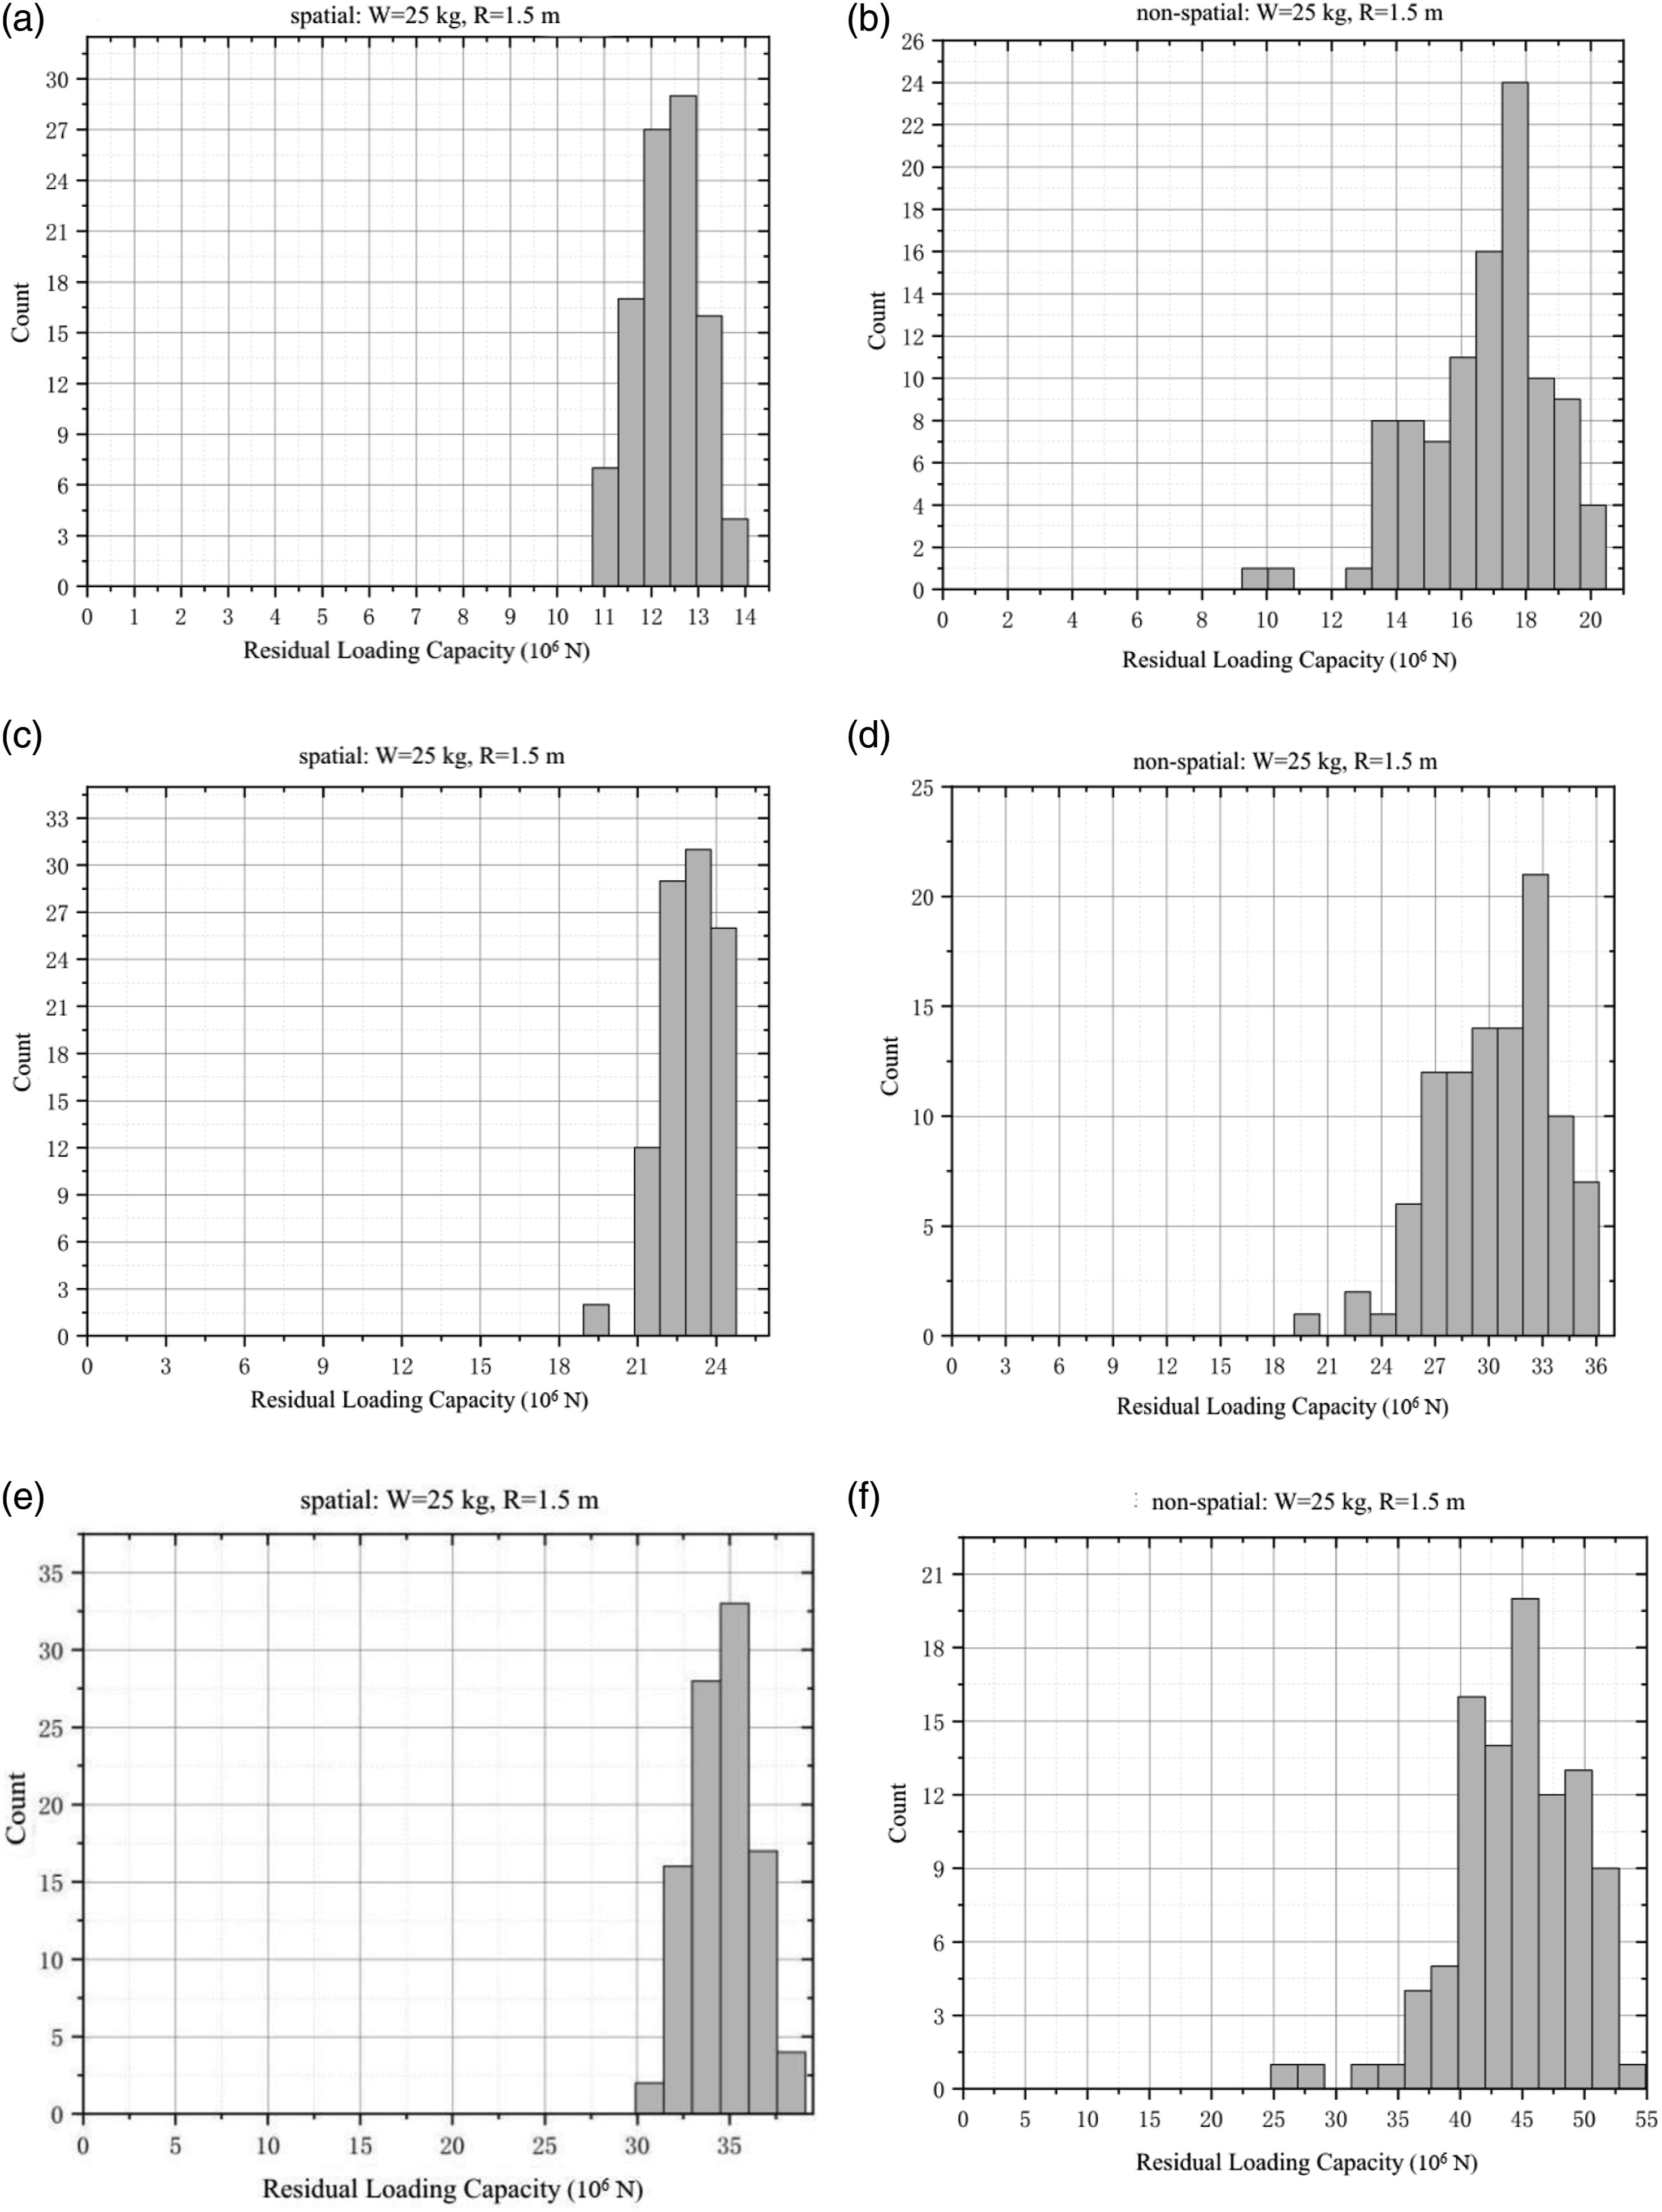
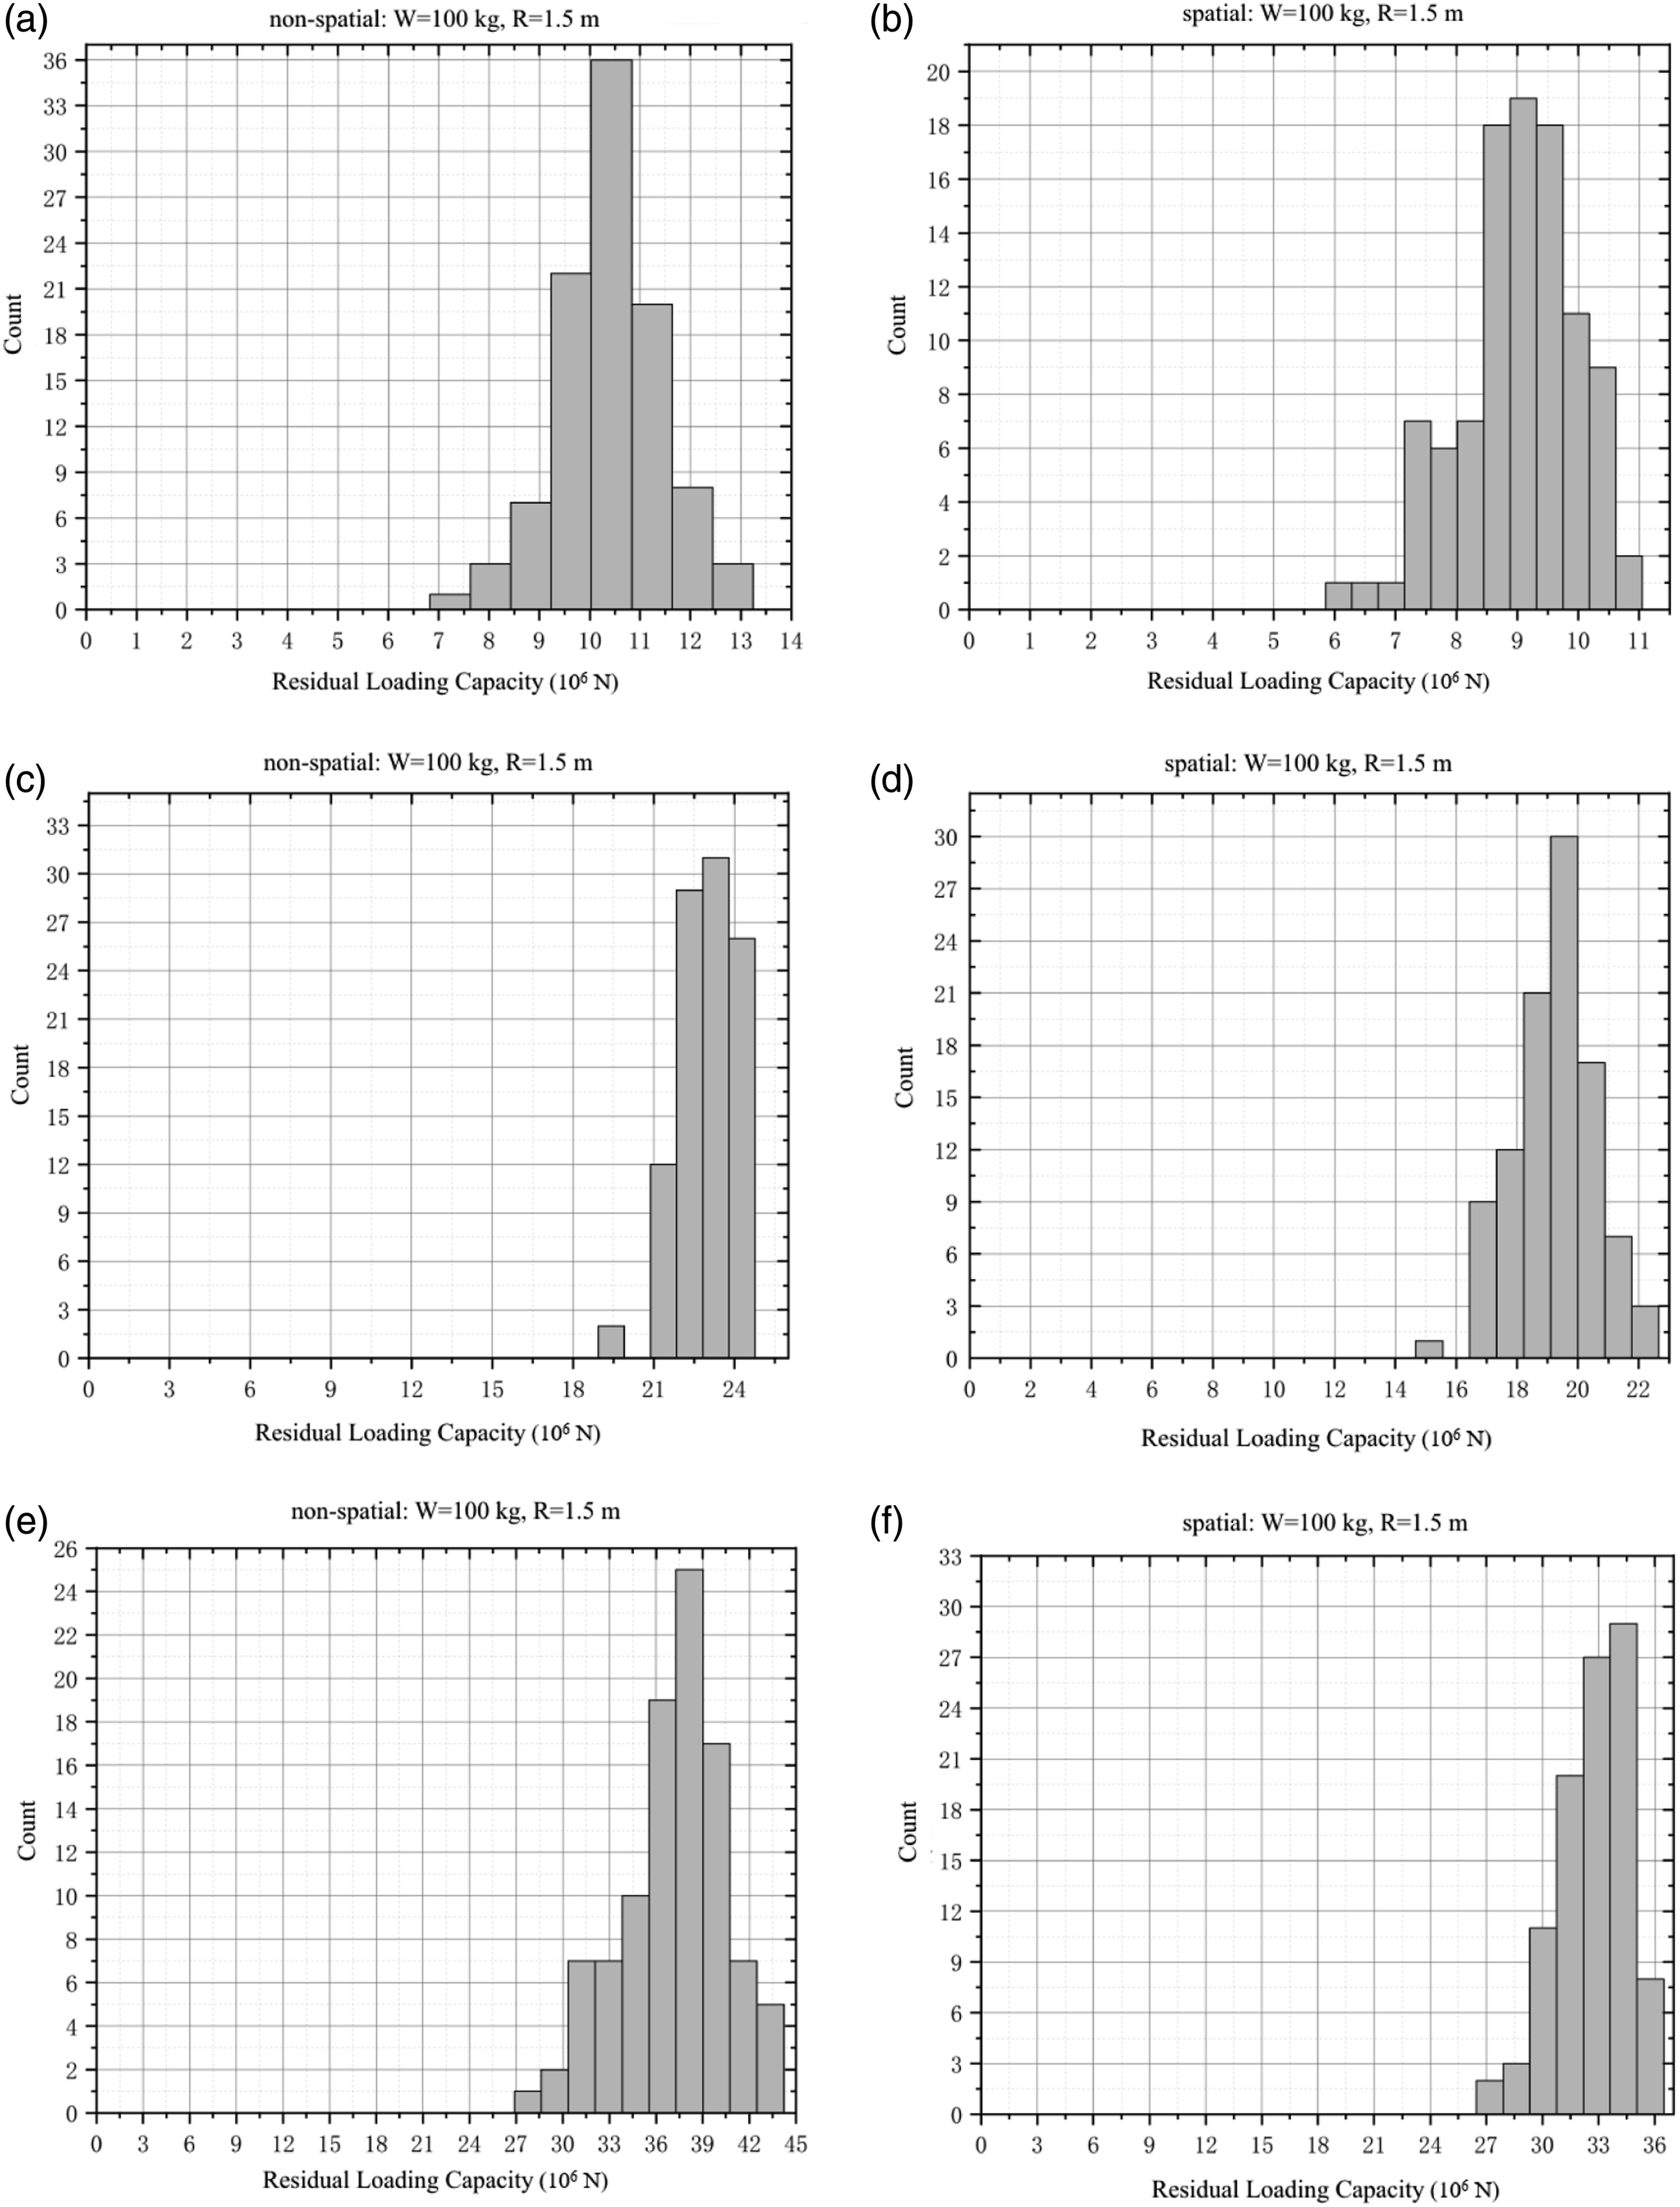
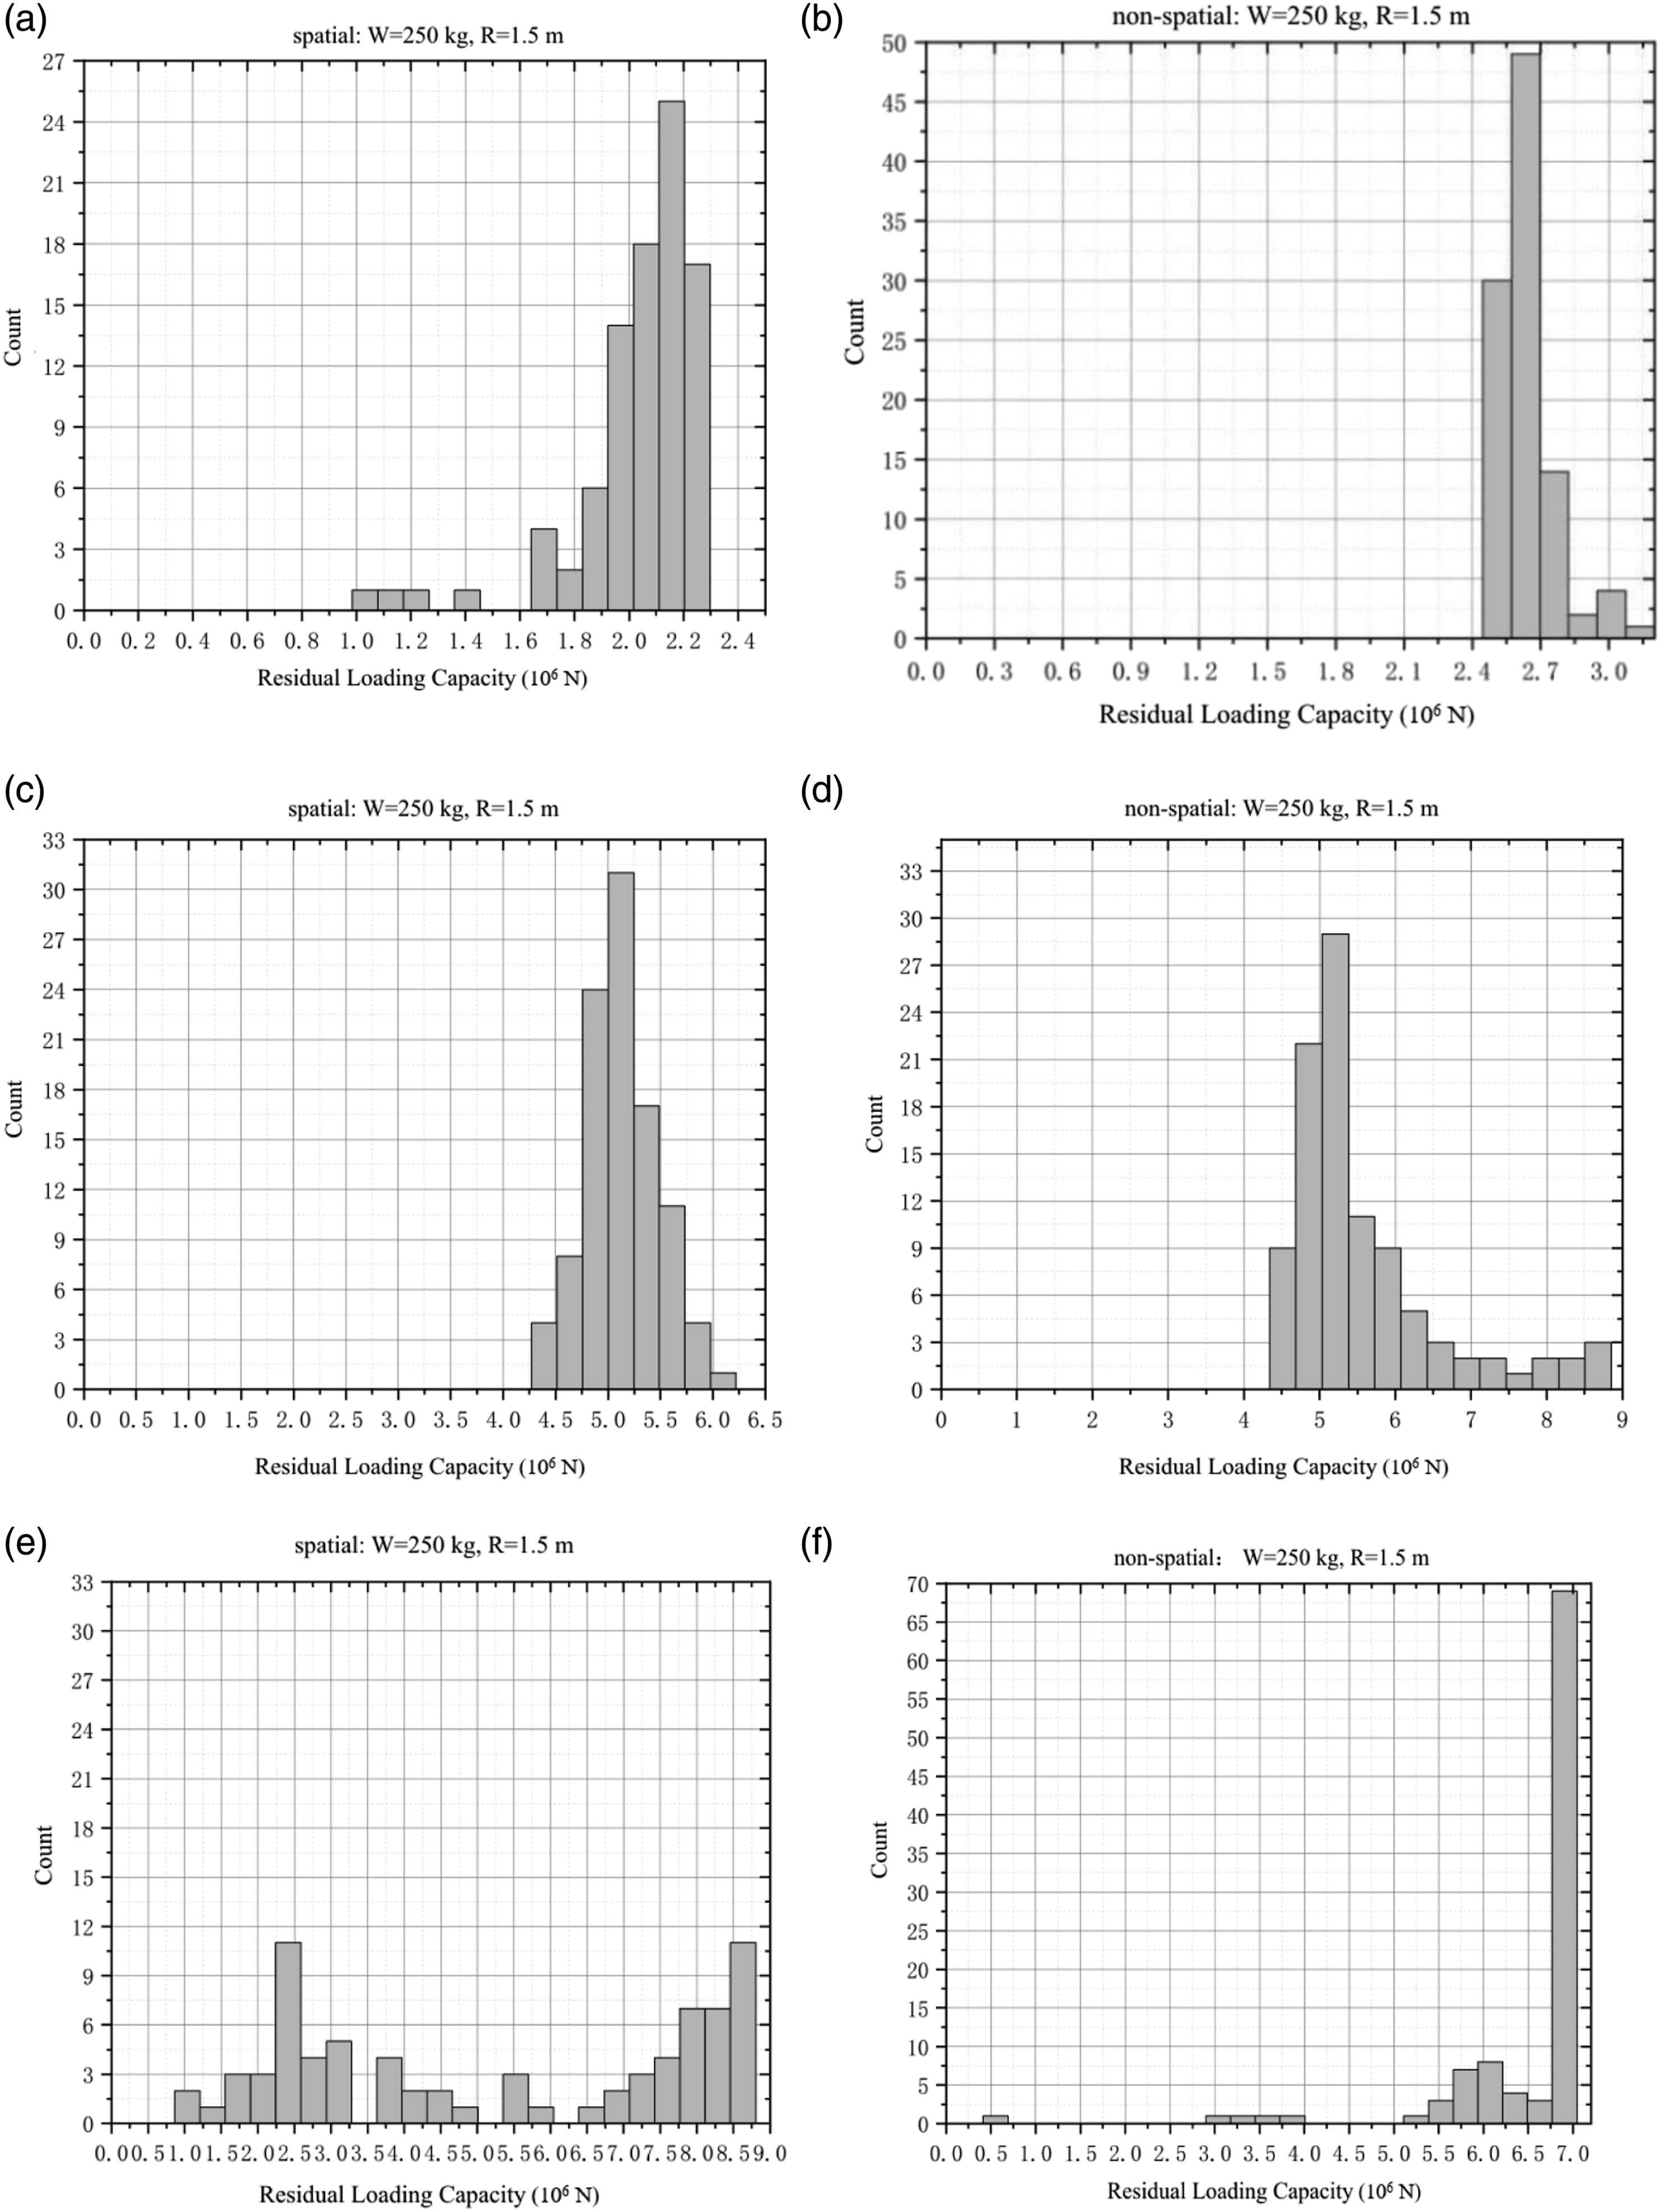
According to the spatial analysis results of the three UHPC columns under 25 kg explosion impact, with the increase in the theoretical axial load capacity of UHPC columns, the COV of the residual loading capacity of the three columns after the blast loads is continuously reduced, indicating that the dimension of the column plays a role in resisting the variability of blast loads. In addition, the effect becomes more and more obvious with the increase in explosive mass under the simulation results of 100 kg and 250 kg in spatial analyses. At 25 kg, the COV difference between column C1 and column C2 is 5%. At 100 kg, the COV difference between column C1 and column C2 is 34%. At 250 kg, the COV difference between column C1 and column C2 is 37%. Moreover, non-spatial analyses also have the same rule.
For the spatial analysis, the COV of the residual loading capacity of column C1 is increasing with the explosive mass. Similarly, the non-spatial analyses also have the same rule.
When the three UHPC columns are under the blast loads of 25 kg, 100 kg and 250 kg explosives, the histograms of residual loading capacity obtained from non-spatial and spatial analyses are shown in Figures 23–25, respectively:
Damage index
Statistical results of D for non-spatial and spatial models.
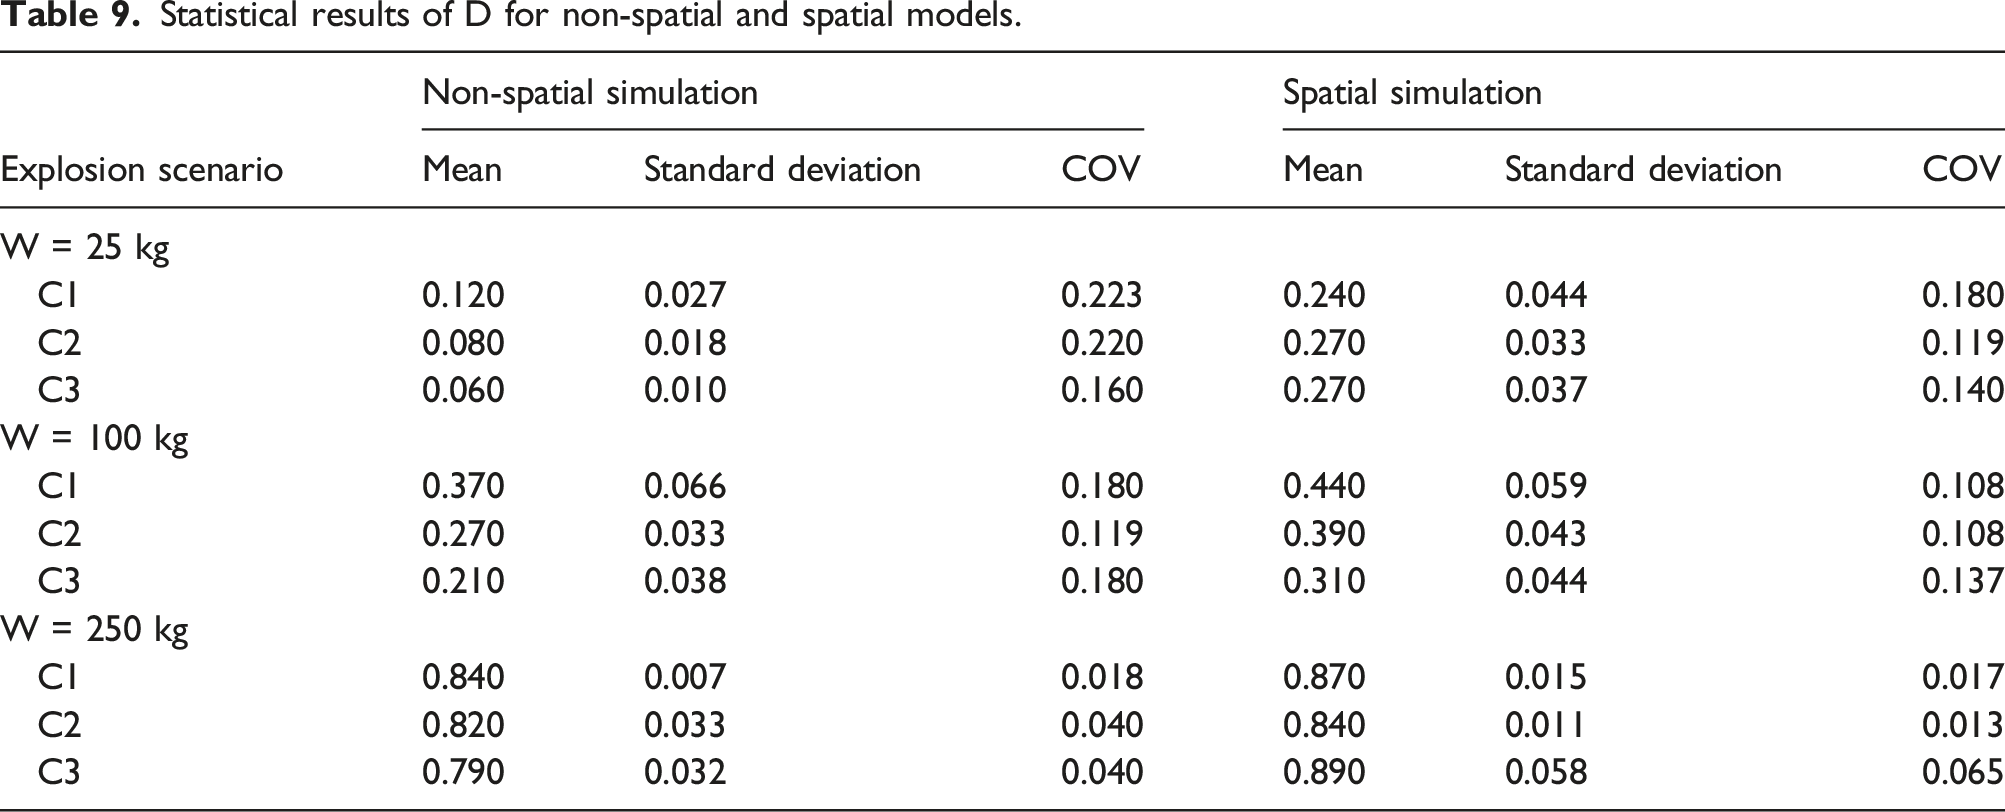
It can be seen from Table 9 that, under the same explosive mass, the mean damage index of the non-spatial model is always smaller than that of the spatial model. For the same UHPC column, the COV of D decreases with the increase in explosive mass.
The damage index histograms obtained from non-spatial and spatial analyses for the three UHPC columns under the explosive masses of 25 kg, 100 kg and 250 kg are shown in Figures 26–28, respectively. Histograms of D for three UHPC columns under 25 kg explosives. (a) Spatial model of column C1. (b) Non-spatial model of column C1. (c) Spatial model of column C2. (d) Non-spatial model of column C2. (e) Spatial model of column C3. (f) Non-spatial model of column C3. Histograms of D for three UHPC columns under 100 kg explosives. (a) Spatial model of column C1. (b) Non-spatial model of column C1. (c) Spatial model of column C2. (d) Non-spatial model of column C2. (e) Spatial model of column C3. (f) Non-spatial model of column C3. Histograms of D for three UHPC columns under 250 kg explosives. (a) Spatial model of column C1. (b) Non-spatial model of column C1. (c) Spatial model of column C2. (d) Non-spatial model of column C2. (e) Spatial model of column C3. (f) Non-spatial model of column C3.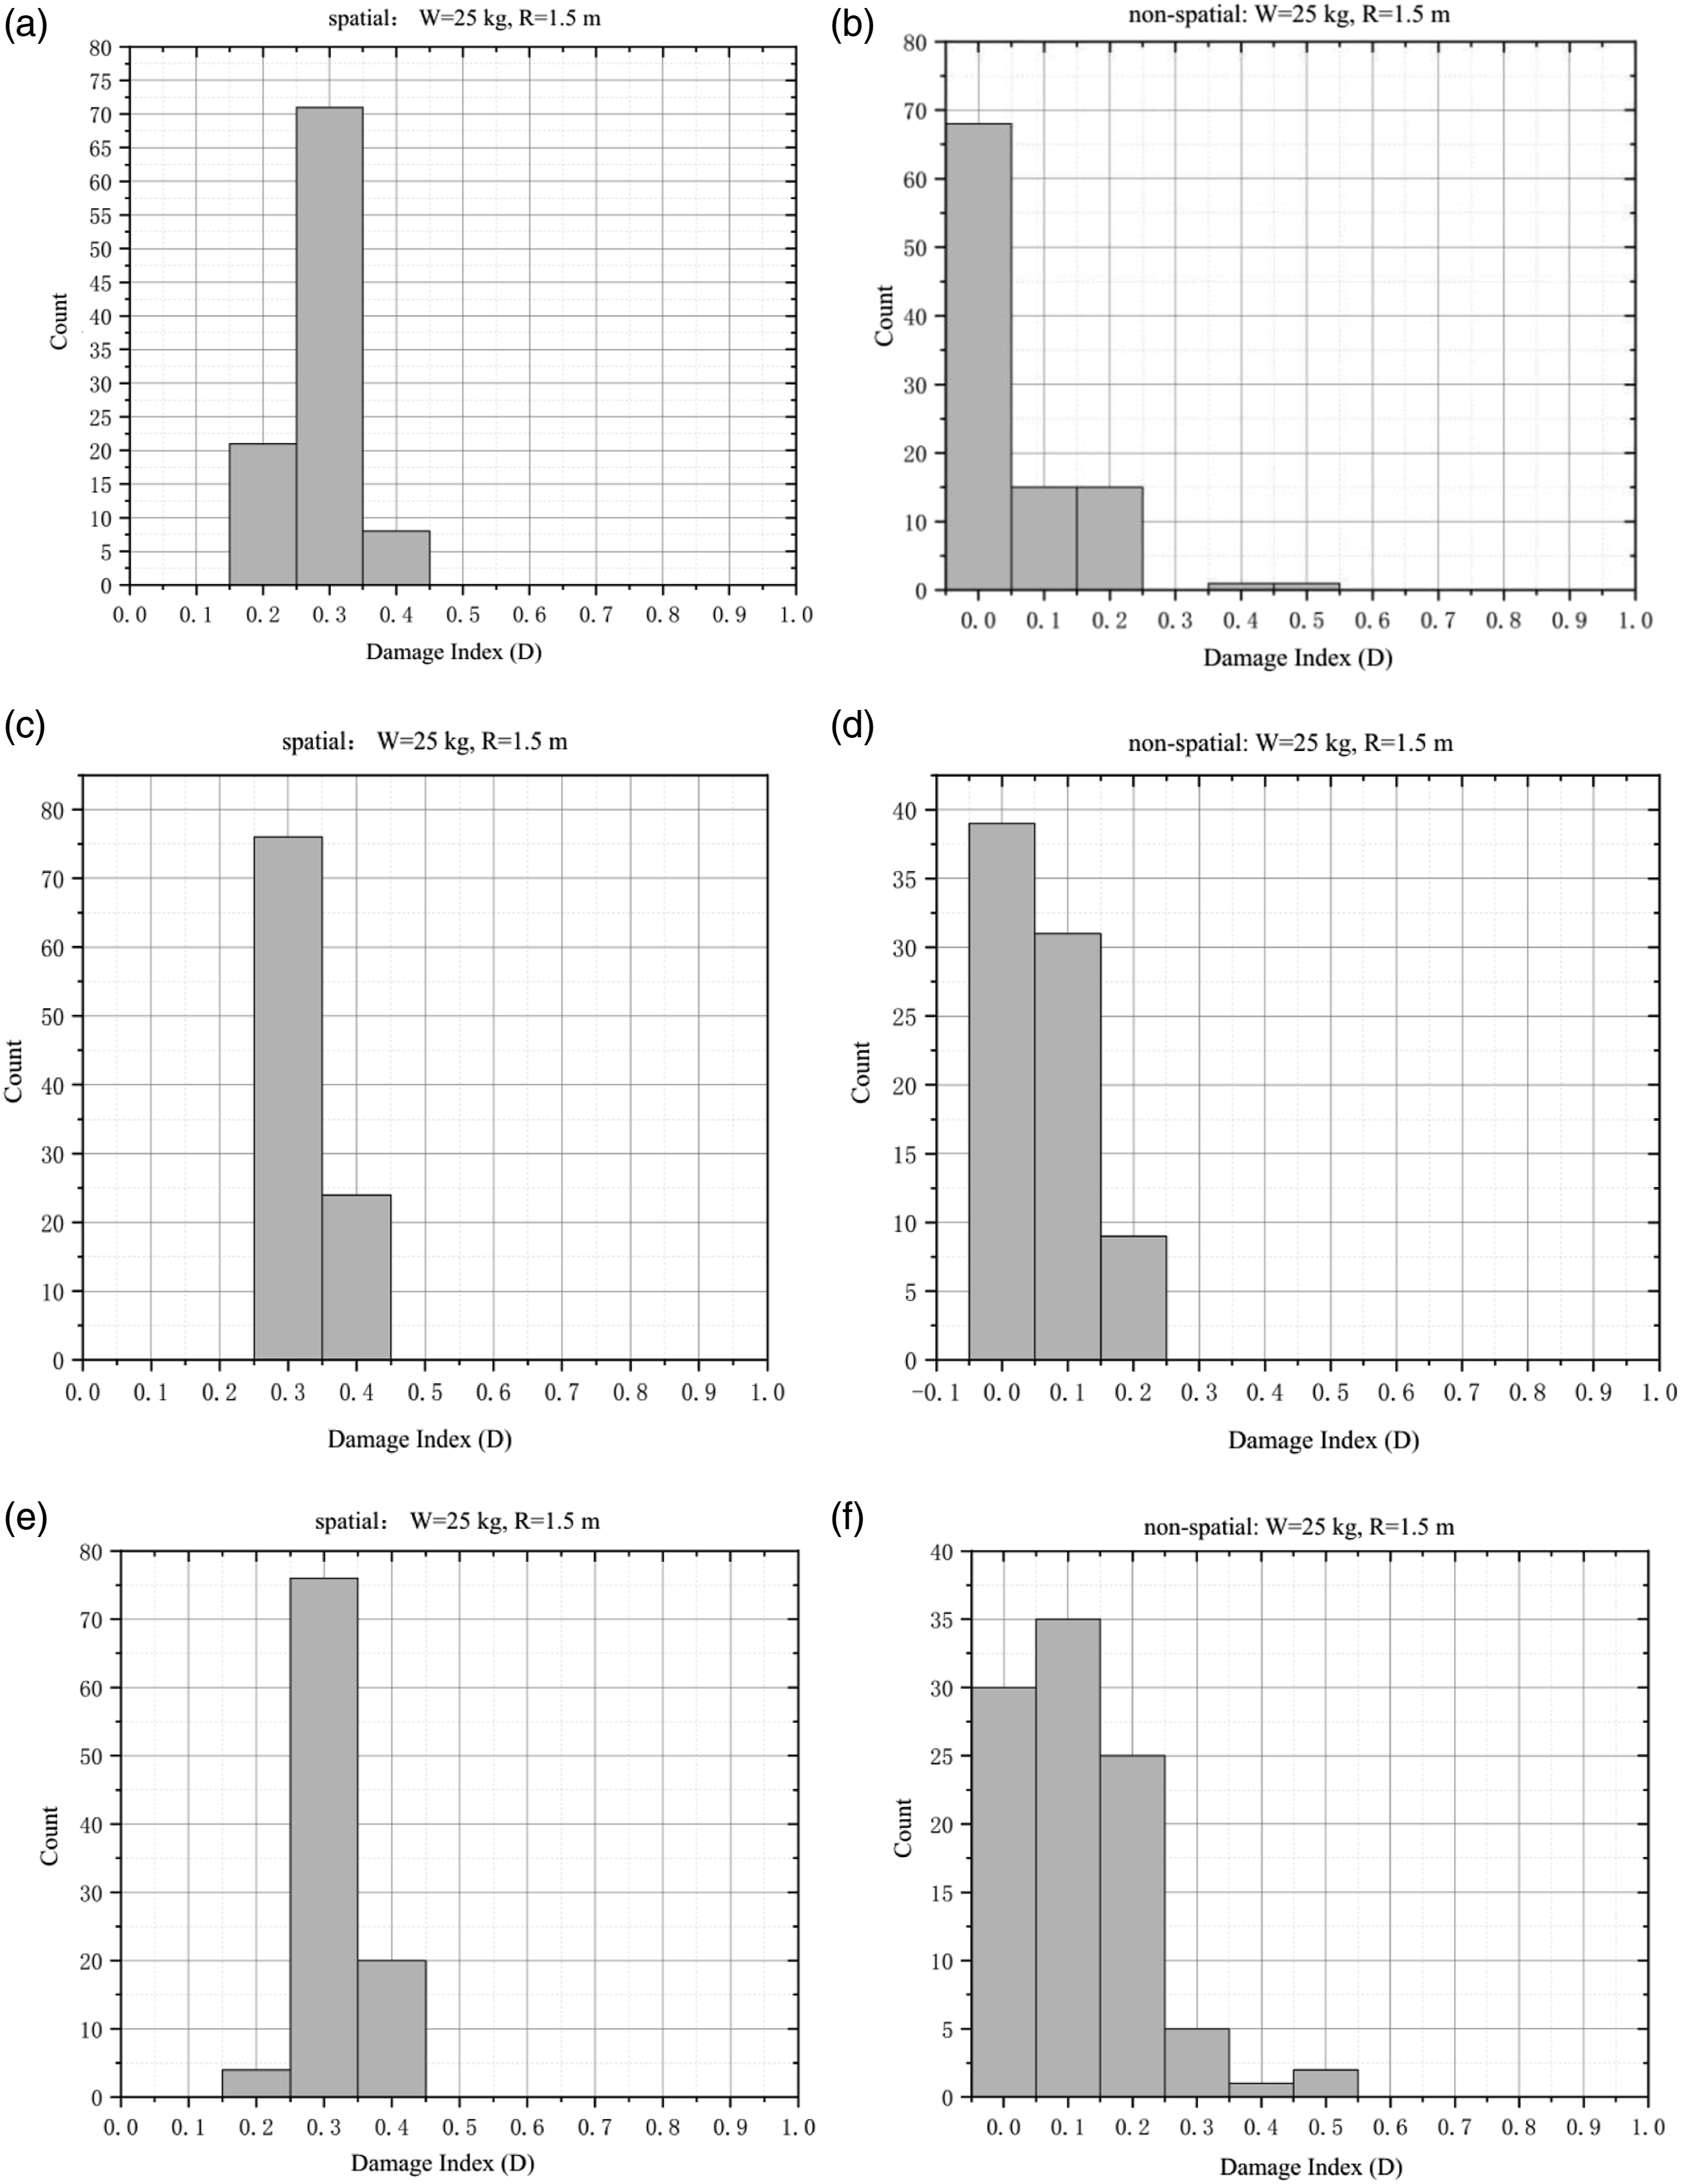
Failure mode
Through the spatial analyses of three UHPC column models under blast loads, the following conclusions can be drawn: In the case of low damage (i.e., D = 0–0.2), 57% of the models are damaged at the top of the column, 29% are damaged at the middle of the column, and 16% are damaged at the bottom of the column. When the three UHPC columns are in medium damage (i.e., D = 0.2–0.5) and high damage (i.e., D = 0.5–0.8), the final damage position is in the middle area. The reason for this phenomenon is that when the blast loads only causes low damage to the UHPC column, according to the spatial variability of UHPC strength, the mean value of UHPC strength in the top part of the column is the lowest, so the failure probability at the column head is the highest. However, when the explosion causes medium damage or high damage to the UHPC column, the explosion impact causes great damage to the UHPC in the middle part of UHPC column, making its impact resistance far less than that of other parts of the UHPC column, and finally the failure occurs under the action of axial force.
In the stochastic finite element analysis of UHPC column under blast loads, three failure modes were observed: shear failure, flexural failure and flexural shear failure.
During the explosion impact stage, the main failure modes are shear failure and flexural shear failure. In the spatial model, the compressive strength of the UHPC at the top of the column is 10%–20% lower than the random mean value. Therefore, in the spatial model, cracks at the top develop faster, since the UHPC strength at the top is lower and is not sufficient to resist the load redistribution due to cracks.
Conclusions
In this study, mechanical compression tests of UHPC were carried out, and the statistical parameters of UHPC compressive strength were obtained, and the Weibull distribution was recommended for UHPC in compression. Considering the variability of UHPC column and blast loads, the damage of UHPC column was quantified by Monte-Carlo simulation. The difference of numerical simulation results between non-spatial and spatial models was analyzed from three aspects of residual loading capacity, damage index and failure mode of UHPC column under blast loads. Finally, the damage prediction was carried out for UHPC columns of different section sizes under different explosion severities.
It can be concluded that the numerical simulation results of the spatial model were closer to the experimental condition. The variability of residual loading capacity of the spatial model was lower than that of the non-spatial model. The failure mode of non-spatial model was single and symmetrical, while the failure mode of spatial model was multiple and asymmetrical. Regardless of the non-spatial model or spatial model, under the same explosion scenario, the COV of residual loading capacity of UHPC column decreased with the increase in column section size, and the difference increased with the explosive mass.
Spatial variability reduced the mean residual loading capacity of UHPC column subjected to blast loads by 7%–26%. Thus, inclusion of spatial variability is recommended for reliability-based blast-resistant design for UHPC column.
Footnotes
Acknowledgments
The authors would acknowledge the support from the National Natural Science Foundation of China (Grant No.52208498, 52178295 and 52308519) and the China Postdoctoral Science Foundation (Grant No.2021M702446 and 2023M732608).
Declaration of conflicting interests
The author(s) declared no potential conflicts of interest with respect to the research, authorship, and/or publication of this article.
Funding
The author(s) disclosed receipt of the following financial support for the research, authorship, and/or publication of this article: This work was supported by the National Natural Science Foundation of China (Grant No. 52208498, 52178295, and 52308519) and the China Postdoctoral Science Foundation (Grant No. 2021M702446 and 2023M732608)