
Abstract
With the addition of electrically conductive steel or carbon fibers, Ultra-High-Performance Concrete (UHPC) possesses an intrinsic self-sensing capability. This opens up the possibility of combining the resilience and sustainability of UHPC with the development of self-sensing solutions for structural applications. In this study, the self-sensing behaviour of a proprietary nano-engineered UHPC material subjected to tension was investigated. To assess the self-sensing performance of the material, bulk resistivity measurements were used on direct tension and pure flexure tests, while a novel wireless approach that operates on was used on out-of-plane bending tests. The wireless approach used alternate current (AC) measurements while the bulk resistivity methods were performed through direct current (DC) and the four-probe method. In both methods, the fractional change in resistance was correlated to the state of deformation. The disposition of the actual strain field was evaluated using Digital Image Correlation (DIC). It was found that in the case of direct tension and pure flexure, the fractional change of resistance was initially decreased up to the onset of strain localization, while it gradually increased in the post-peak range, where the separation of the localized crack gradually increased. In the case of the wireless approach using AC, the onset of cracking was successfully predicted with an abrupt increase in resistivity. The wireless strain-sensing approach also captured the Poisson’s effect due to the loading.
Keywords
Introduction
The state of concrete structures exposed to the aggressive environmental elements is marked by aging, fatigue, corrosion-induced cracking, and delamination. Condition assessment is further hampered by uncertainty regarding the extent and long-term implications of damage. The need for understanding the severity of these influences on the structural performance has fueled research in various types of technologies intended to obtain insights about the state of the structure, collectively known as Structural Health Monitoring (SHM). Existing techniques commonly rely on the use of sensors to detect excessive strain or crack formation; the sensors are either embedded or attached to the structure. These are often compromised by imperfect adhesion or degradation thereof with time, and present challenges in scaling up or due to lack of continuity (Han et al., 2017). An alternative is possible with the incorporation of conductive fillers in the microstructure of the material (e.g., in the mortar). The self-sensing property is based on the capability of semiconductors known as piezoresistivity which describes the change of relative dimensions (strain) and resistance due to applied stress. Electrical resistance is the most commonly measured sensing signal in smart materials. More specifically, the Fractional Change in Resistance or Resistivity (FCR) is used to assess the sensing capability of the material.
With the advent of Ultra-High-Performance Concretes (UHPC), research interest gravitates toward UHPC materials that possess an intrinsic self-sensing capability owing to the network of embedded distributed metal fibers. Although there are numerous studies on the self-sensing capabilities of plain conventional concretes (Azhari and Banthia, 2012; Han et al., 2011, 2012, 2014), the number of studies on the self-sensing UHPCs is limited. One of the first investigations was performed on reactive powder concrete (RPC) reinforced with a short-cut super-fine stainless-steel wire by Dong et al., (2016). The self-sensing performance of the material was assessed by correlating the stress/strain response with FCR under external loads that included cyclic compression, monotonic compression until failure, and monotonic flexure until failure. Although the sensing system was effective, the 20 μm diameter wire significantly compromised the flexural strength by as much as 50% compared to steel fibers that are conventionally used in UHPC.
Only recently, carbon nanomaterials have been used as a substitute for reactive powders in UHPC mixes to enhance the mechanical properties with a great potential to enable the material to effectively sense stress, strain, and cracks (Wille and Loh, 2010). It was found that the addition of very small quantities of Carbon Nanotubes (CNTs) in UHPC substantially improved the electrical conductivity with pre-cracking self-sensing using the FCR method to be more effective in predicting accurately the response under flexure than in compression. This might be explained by the dense microstructure and the lack of pore water in this class of materials. The first is related to hydration products that fill the gaps between CNTs, disrupting the connectivity between the conductive materials (fibers and CNTs) whereas the pore water increases the conductivity (Lee et al., 2018; You et al., 2017). A similar response was observed by other researchers, who verified that the synergistic effect of hybrid reinforcement (steel fibers & CNTs) is important to achieving a smooth self-sensing performance with minimal electrical noise, while the post-peak response in tension could be predicted through FCR in case of UHPC’s containing CNTs in the matrix (Yoo et al., 2018).
As already mentioned, a limited number of studies have been conducted on the self-sensing capabilities of carbon nano-engineered UHPC; the literature was focused on the use of conventional methods with embedded or attached electrodes to measure the electromechanical properties. In this study, a proprietary nano-engineered UHPC mix that contains carbon nanofibers (CNFs) in the matrix was selected to study the effectiveness of a wireless approach for assessing the self-sensing ability of the material. The results of the study were compared to those obtained by the conventional wired bulk resistivity methods. The self-sensing performance was explored under three types of monotonically applied loading: (i) direct tension, (ii) flexure, and (iii) out-of-plane bending until failure. The first two load cases were studied with the four-probe method using DC via embedded electrodes whereas for the last, piezoresistivity was investigated using the Connectionless Electrical Pulse Response Analysis (CEPRA) test method that uses AC in low frequencies. The correlation of stress and strain state with the change in resistance for direct tension and out-of-plane bending was performed via Digital Image Correlation.
Experimental investigation
Materials
Mix proportions for studied nanoengineered UHPC by mass.
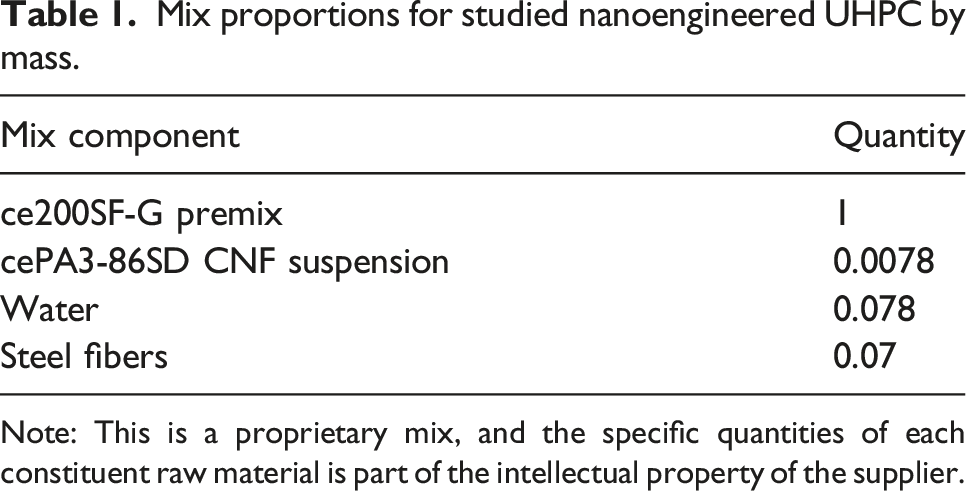
Note: This is a proprietary mix, and the specific quantities of each constituent raw material is part of the intellectual property of the supplier.
Mixing, casting, and specimen preparation
For this investigation, a SP30Qt Gear Driven Planetary Mixer was used. First, the premix was introduced to the mixer and mixed for 5 min. Before use, the CNF/admixture paste was stirred with an electric mixing drill and then diluted with water to form the CNF suspension. Then, the formed suspension was slowly introduced to the mixer and blended for 5 minutes at low speed. A timeline of the mixing process is shown in Figure 1. In the beginning, the mix was dry and as time progressed, the small spherical agglomerations formed pieces with a viscous texture. The fresh UHPC behaved like a non-Newtonian fluid, as it became stiffer when the force from the mixing blades was acting on it, whereas it was flowable when resting. Finally, the steel fibers were incorporated once a uniform mass of thixotropic UHPC was formed and then mixing continued for 3 min. Before casting, the flowability of the mix was assessed per ASTM C1856, (2017) and an average static flow of 213 mm was obtained. Mixing stages of UHPC with CNFs (a): incorporation of CNF suspension; (b) change of consistency; (c) thixotropic paste; (d) incorporation of steel fibers; (e) non_Newtonian fluid behaviour due to forces from the blade; and (f) flowable mix at rest.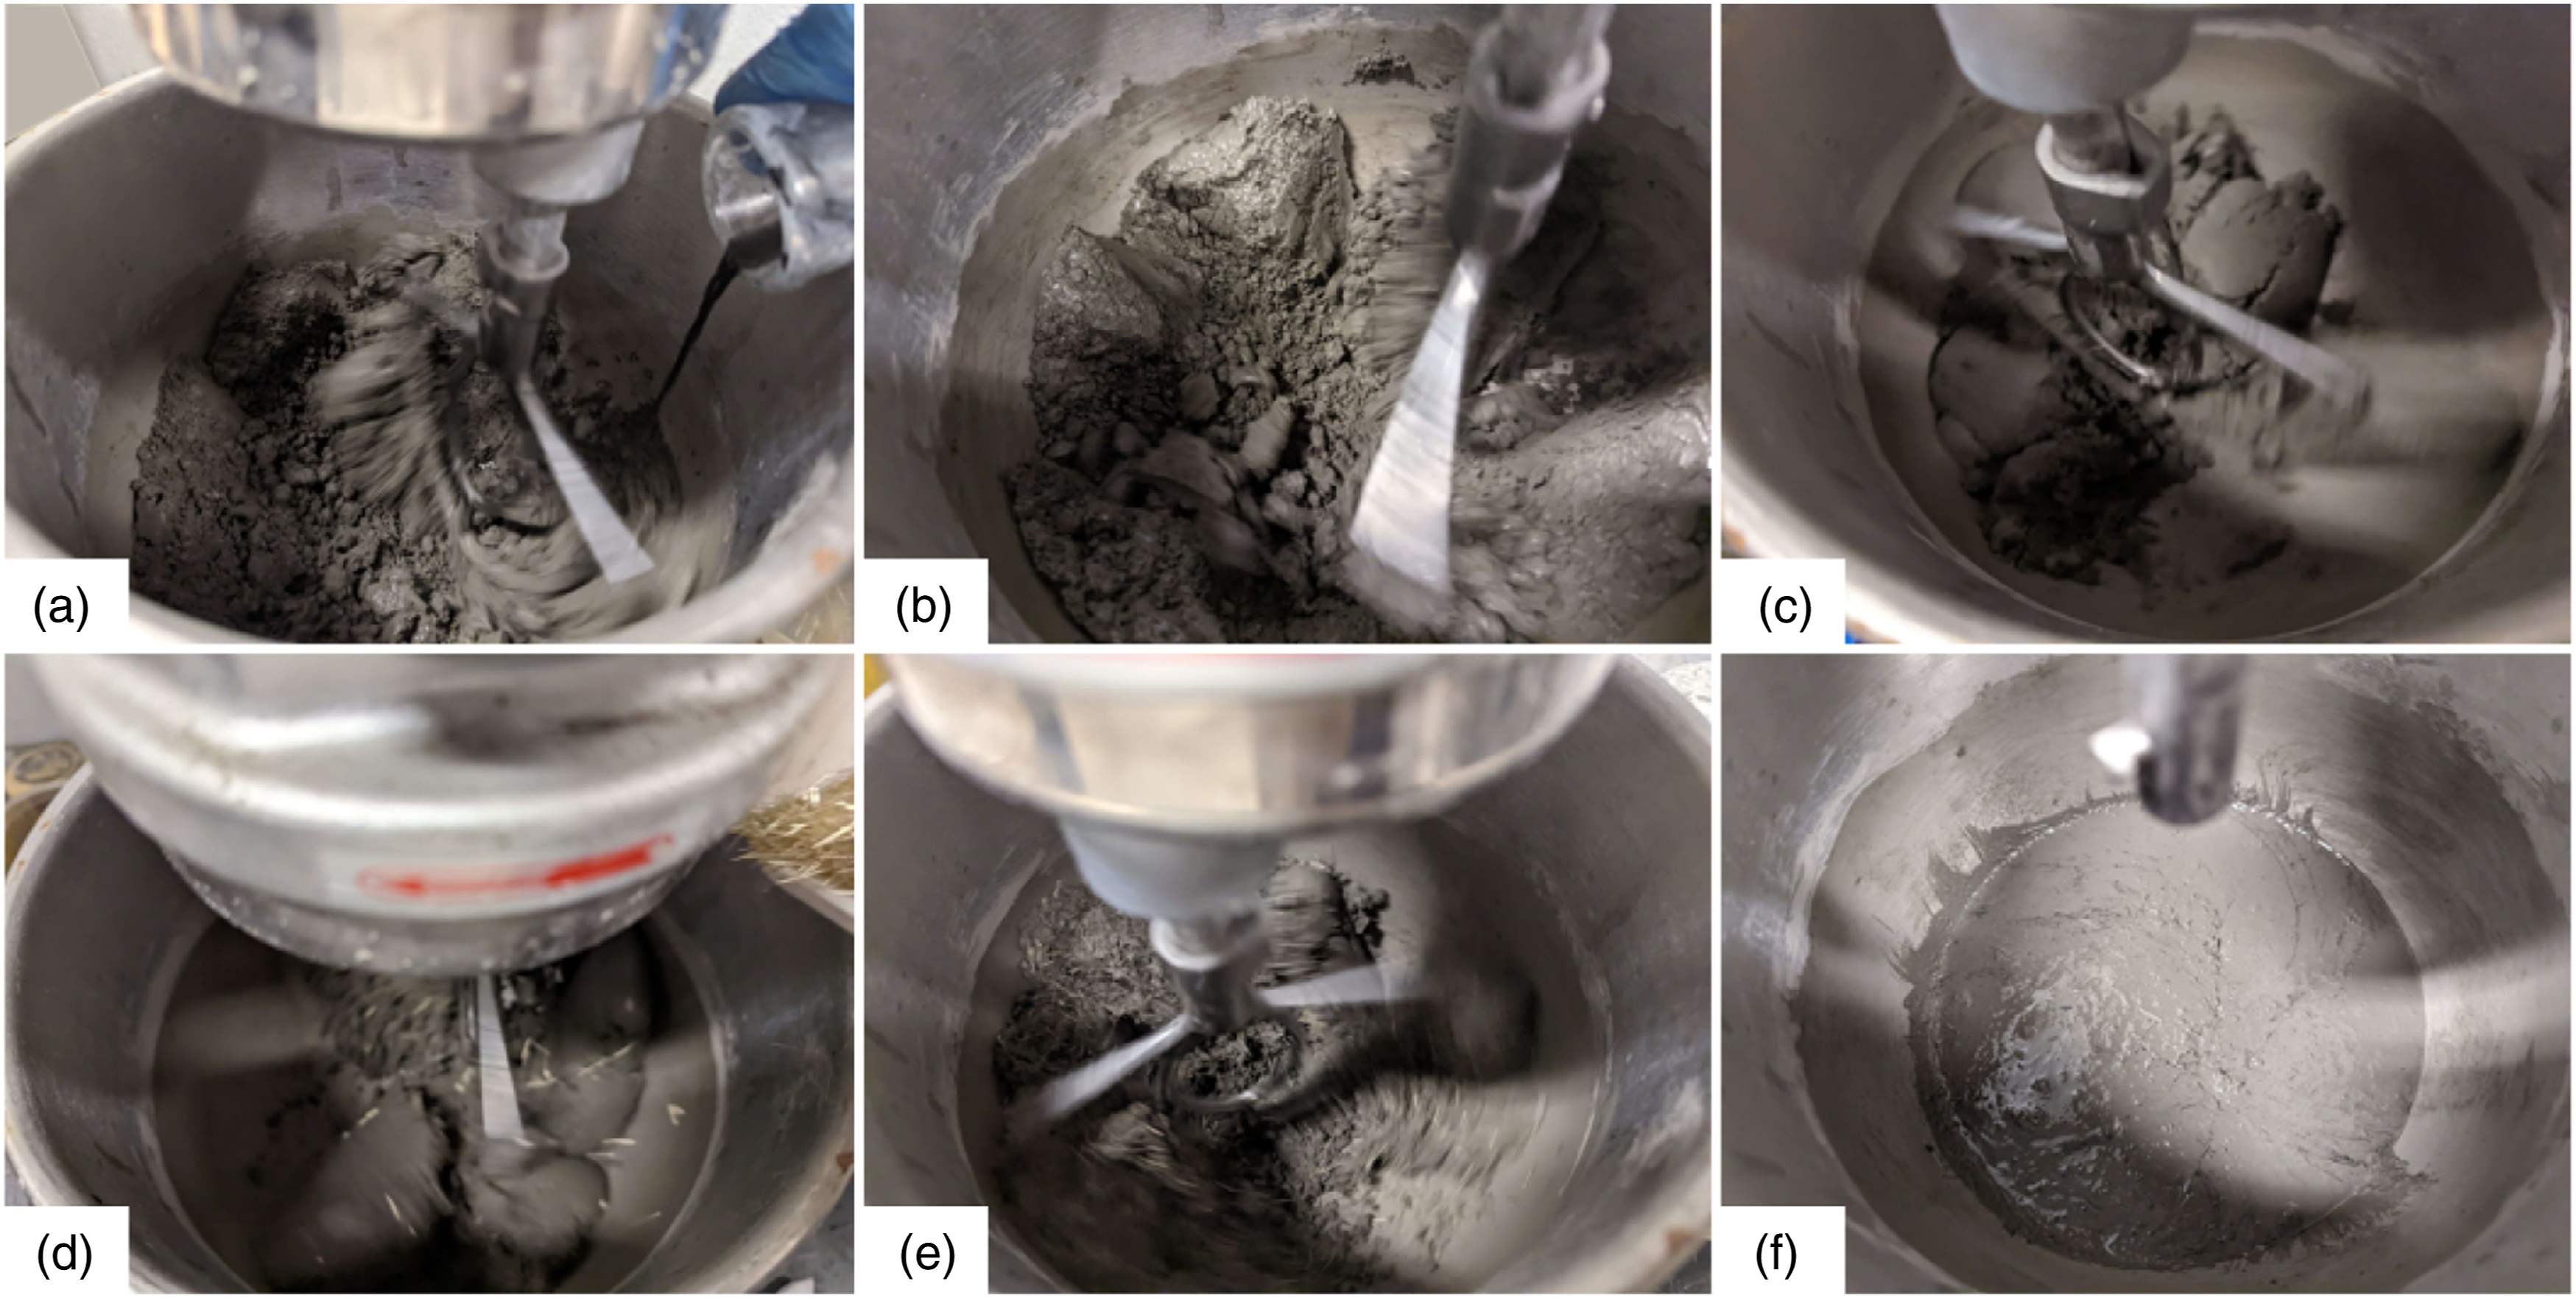
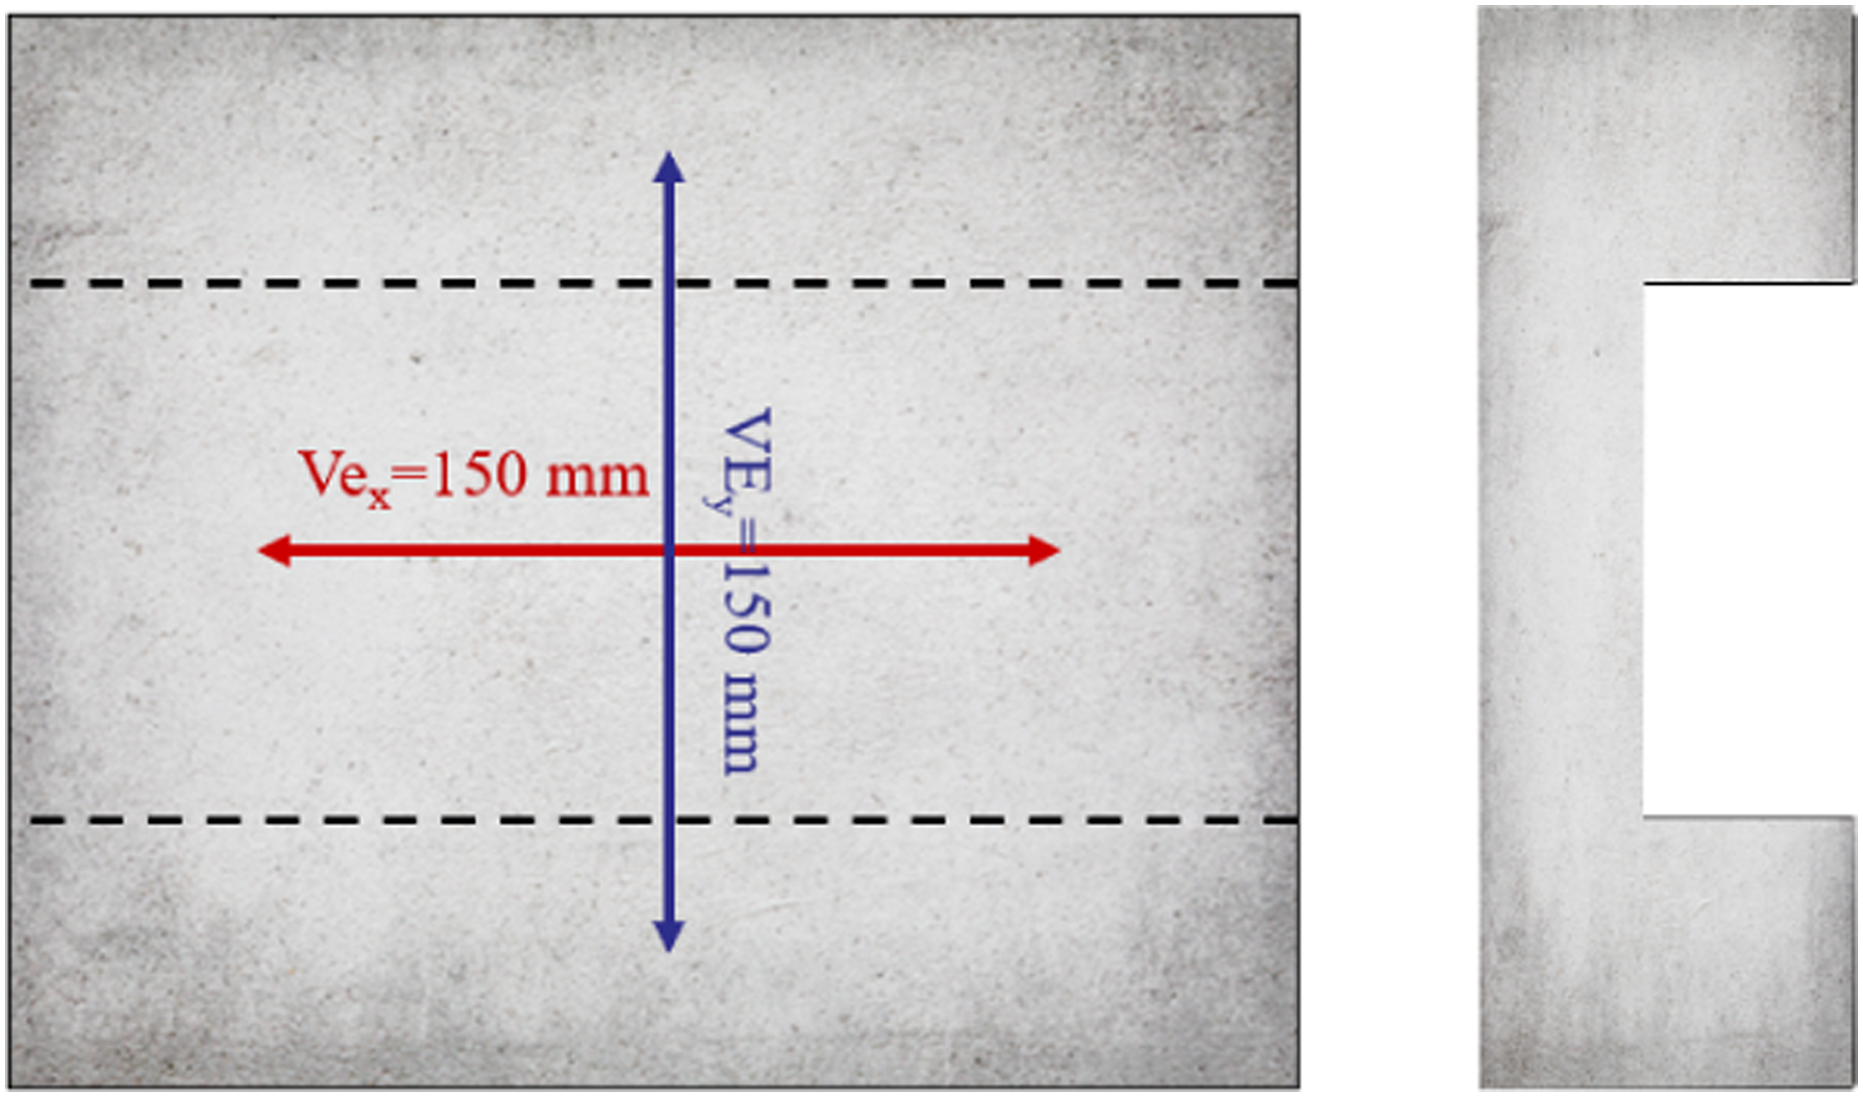
For the determination of mechanical properties, the prepared specimens according to CSA Annex U (CSA, 2019) included: cylinders having dimensions of 75 mm × 150 mm tested in uniaxial compression, 75 mm × 75 mm × 280 mm flexural prisms, and 25 mm × 50 mm × 430 mm direct tension prisms. For the assessment of self-sensing capacity, three different specimens were fabricated: flexural and direct tension prisms with dimensions as described above, and panels with a C-shaped cross-section for out-of-plane bending (OPB) (Figure 2(d)). The thickness of the test region (which was the vertical panel of the C-shape) was a parameter of study in this group of specimens: 30 mm, 35 mm and 40 mm were used for OPB1, OPB2 and OPB3, respectively. The ends of the C-shaped specimens served to bear the applied load (at the top) and to provide support at the base. These ends were 70 mm thick in all cases. The horizontal distance from the point of load application to the centroid of the test cross-section was the load eccentricity e. Due to this eccentricity, a constant moment, M, developed over on the vertical segment, equal to the product P·e. Except for the cylinders which were cast in one layer with a single scoop, all the other specimens were cast with flow from one end to achieve consistent fiber alignment (this, in the C-shaped specimens corresponded to the length direction, X). (a–c) Electrode arrangement and geometry of direct tension and flexural prisms; (d) geometry of OPB specimen.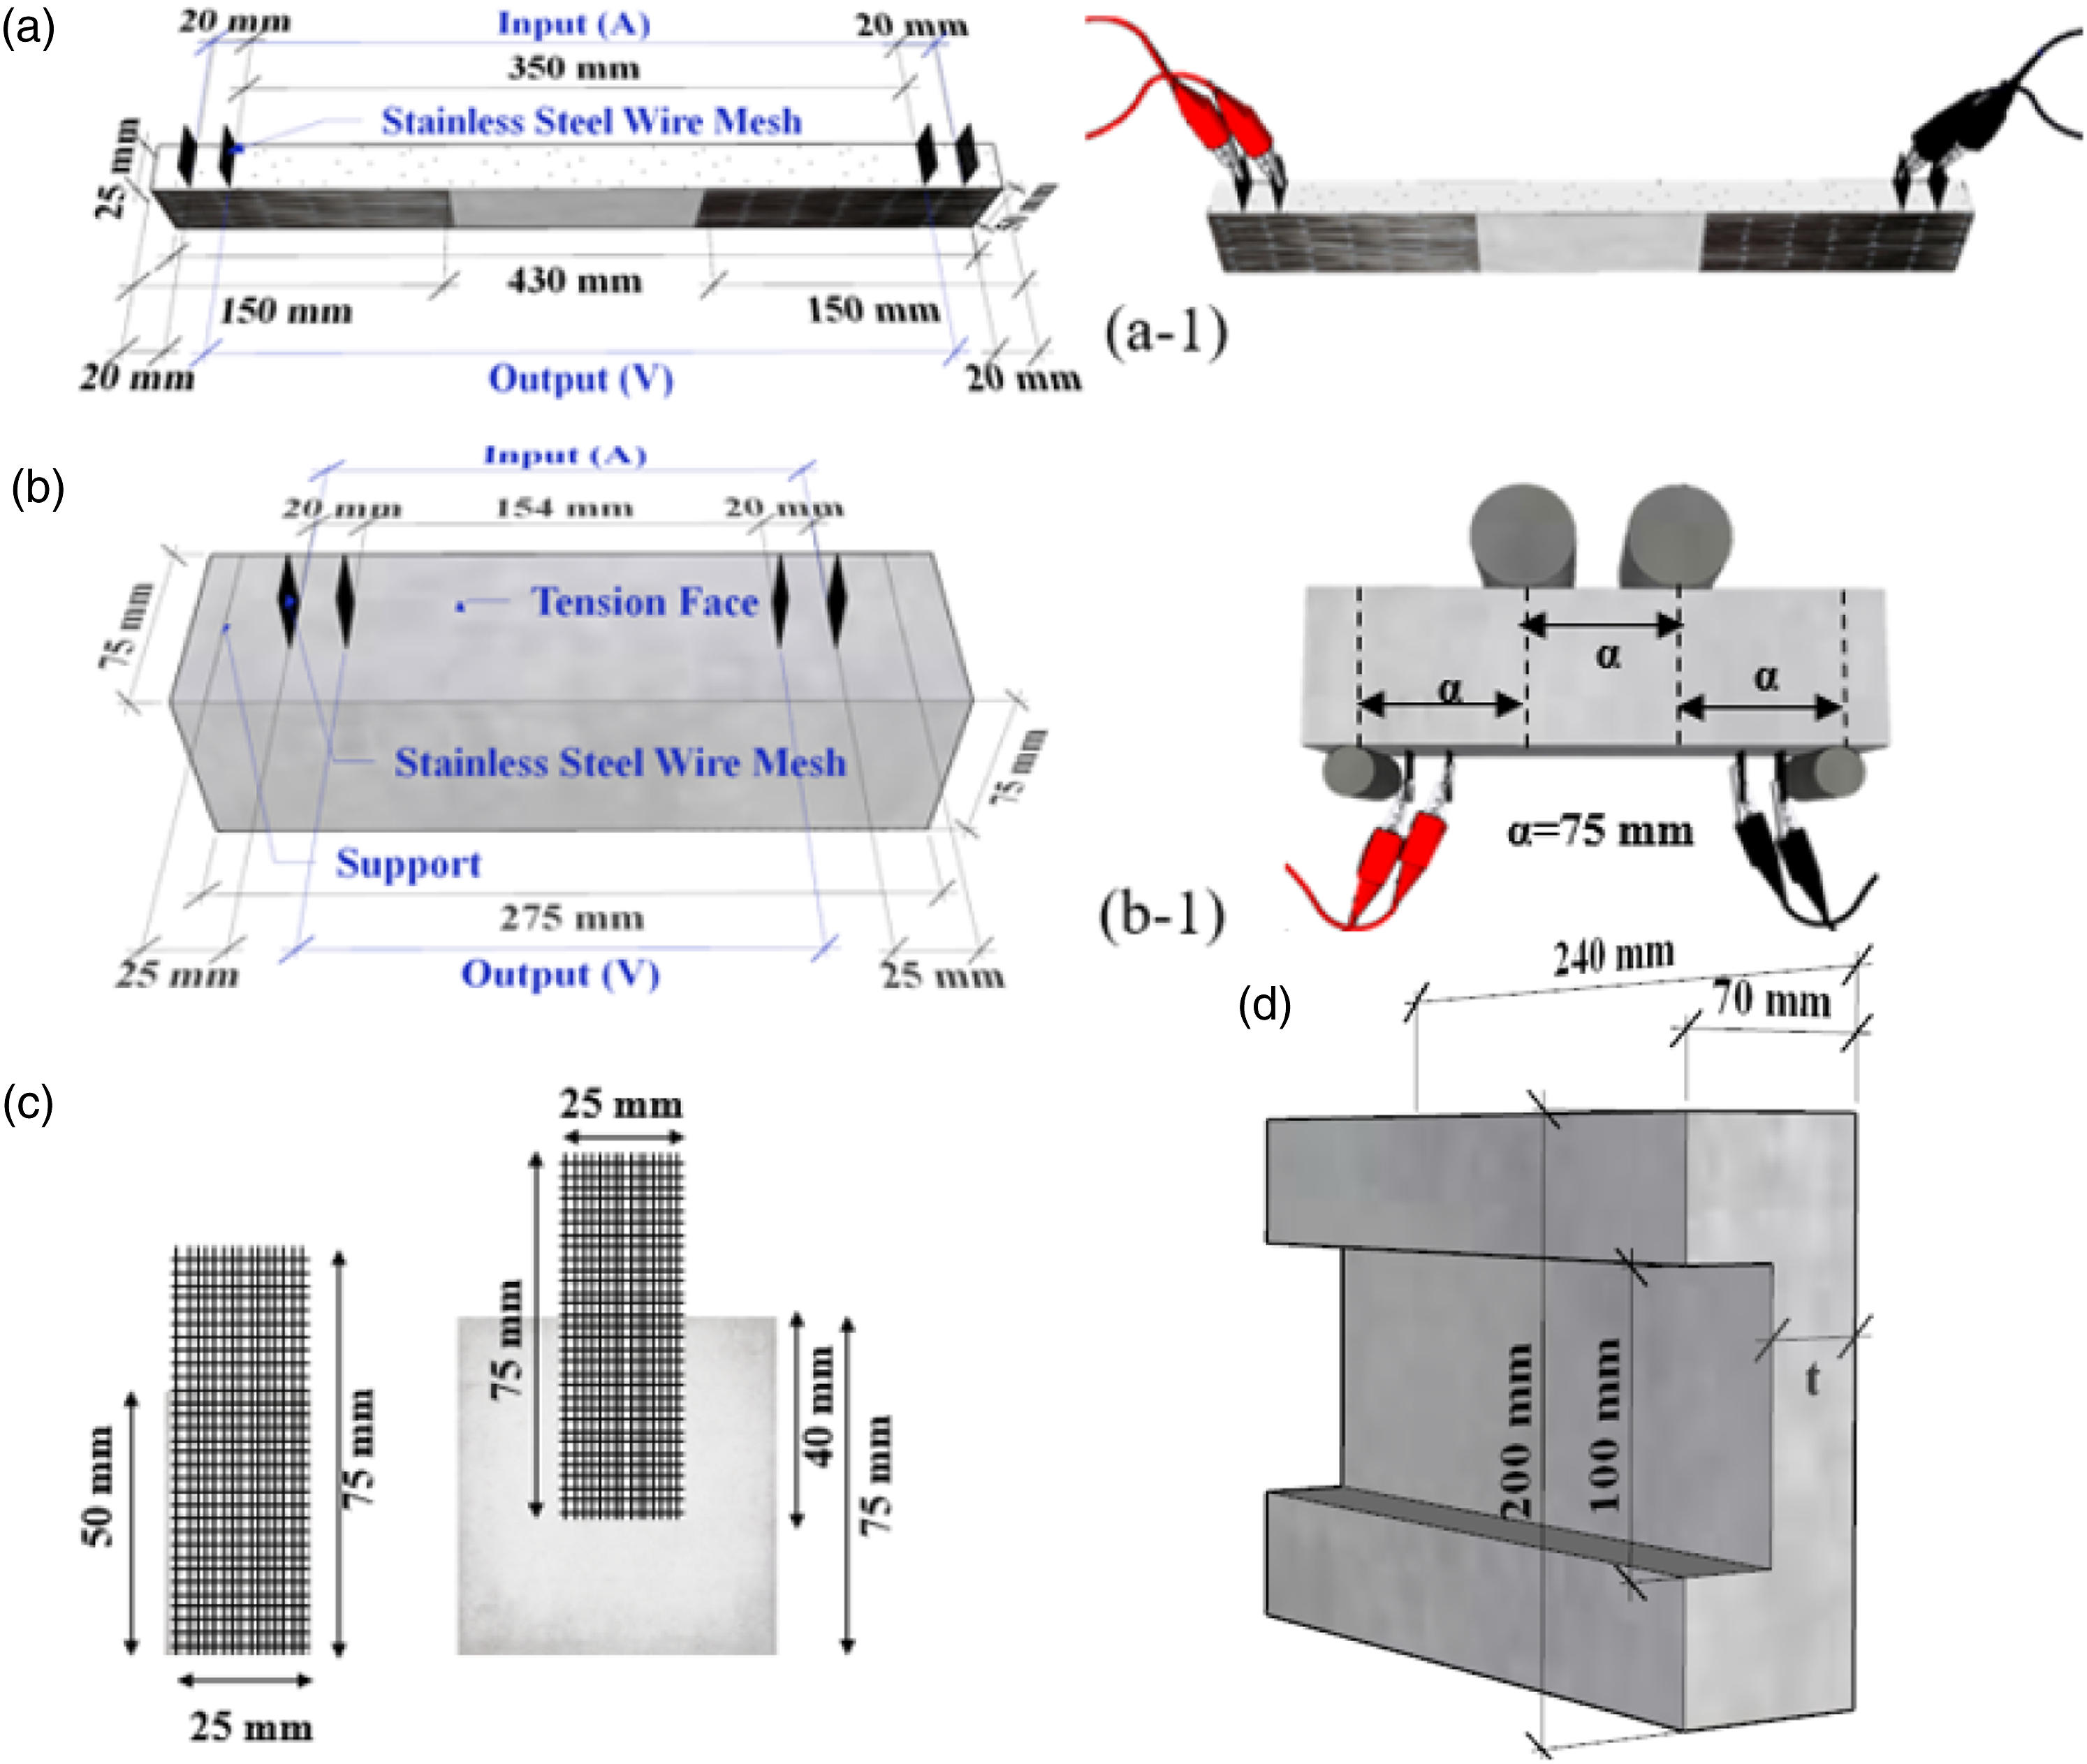
For the prisms used for self-sensing performance testing, stainless steel wire mesh was used as electrodes, embedded in the concrete’s free surface and parallel to the direction of the specimen’s thickness. After casting, all specimens were covered with plastic sheets to prevent evaporation and shrinkage followed by demolding at 24 h and wet curing for 28 days and then left to dry at ambient temperature and relative humidity of 60% till the age of testing. For self-sensing properties, the testing was performed at mature age (several months after casting), while for mechanical properties the testing was conducted at 60 days.
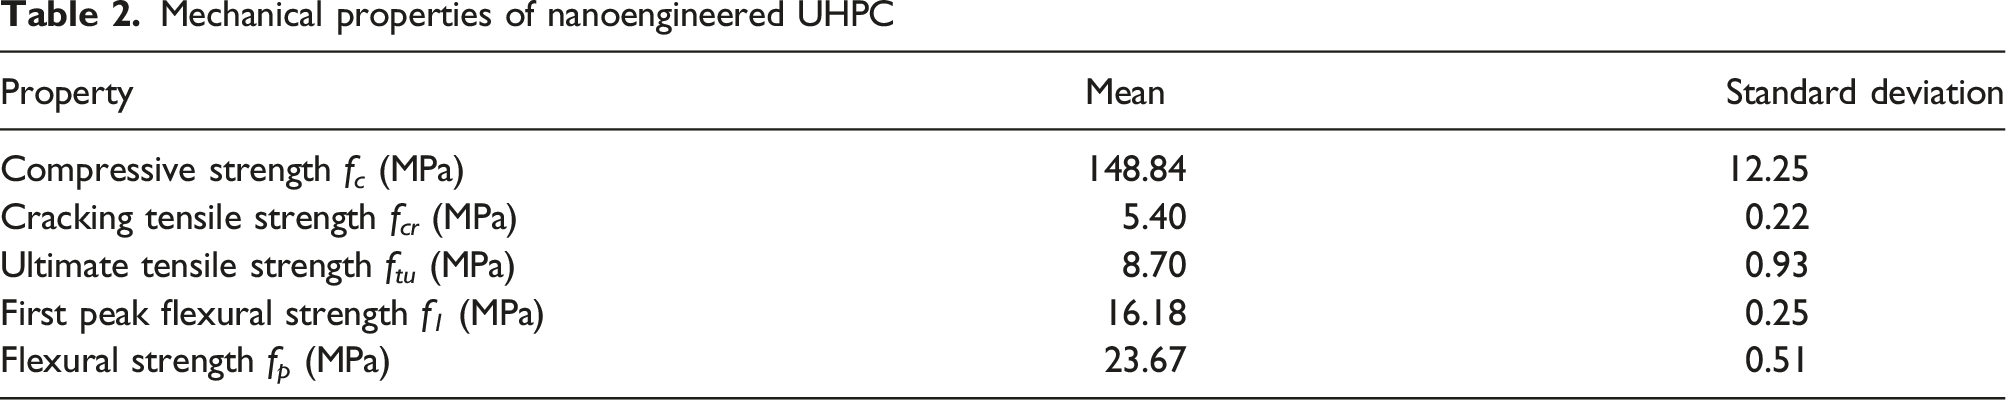
Mechanical properties of nanoengineered UHPC
Test methods: experimental setup and procedure
Prior to the assessment of self-sensing performance, the polarization effect on the electrical resistance was investigated, while resistivity in both directions was recorded via CEPRA. This preliminary work was performed in order to determine the appropriate time drift of polarization and study the sensitivity of CEPRA readings with regards to fiber distribution and boundary conditions.
Electrical properties: polarization of electrical resistance
To determine the self-sensing performance of the material the four-probe method under DC was employed due to its simplicity and easy access (Han et al., 2015). Despite its simplicity, DC is associated with an effect known as electrical polarization. The latter refers to the separation distance between the center of positive charge and the center of negative charge in a dielectric material due to the induced electric field (Chung, 2002). Polarization causes extra charge, reducing the potential and thus the resistance over time. In order to assess properly the self-sensing performance of the produced nano-engineered UHPC, it was important to counteract polarization by applying electric current prior to testing till a plateau was reached. This time drift was determined prior to testing.
As mentioned earlier, the prisms for self-sensing testing contained embedded electrodes in the form of stainless-steel wire mesh. The electrode configuration is shown in Figure 2(a)–(c). Since these specimens were designed for further mechanical testing, the placement was done in order to avoid premature failure and to not disturb the gauge length and the constant moment region for direct tension and flexural specimens, respectively. The four-probe method requires two outer input current electrodes and two inner output current electrodes.
As shown in Figure 3, a commercial digital multimeter (Keithley 2110-120 5.5) was employed to measure the polarization while the data were collected automatically by an instrument control software (Keithley KickStart Software). The magnitude of the input current was maintained at 1 mA for 30 min to monitor the electrical polarization. The tests were conducted in an environment with a constant temperature of 24°C and a relative humidity of 60%. Instrumentation and experimental setup for measurement of polarization via the four-probe method.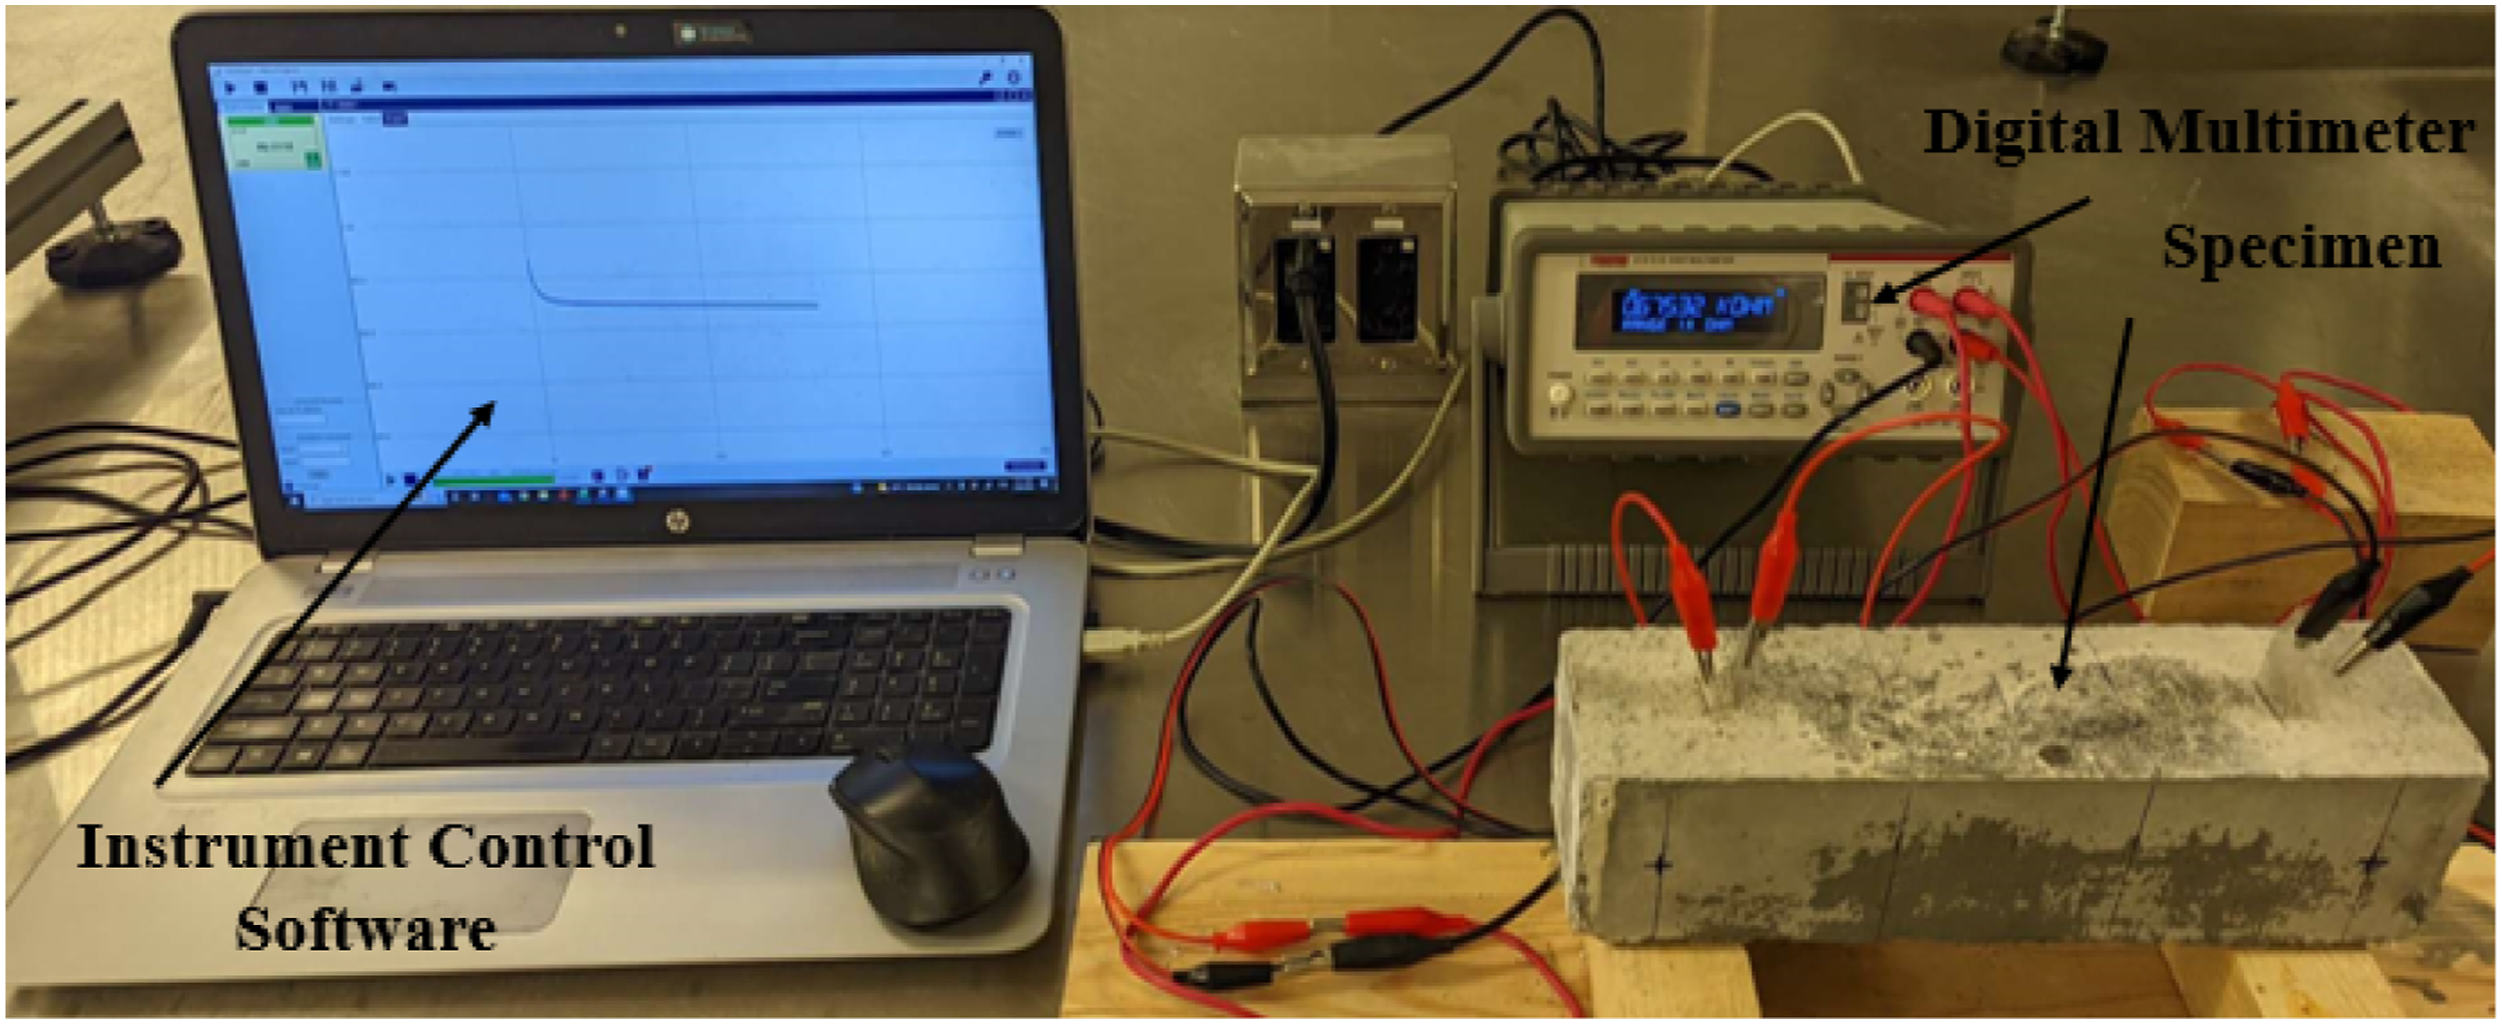
Electrical properties: resistivity via connectionless electrical pulse response analysis technology
Resistivity measurements were also performed using Giatec iCOR®, a contactless corrosion rate measurement device for reinforced concrete structures which can measure concrete resistivity, too. The measurement technique is based on a patented technology developed by Giatec Scientific Inc. and is known as CEPRA (Ghods et al., 2016). More specifically, in order to determine the low-frequency behavior of reinforced concrete systems, a narrow DC/AC pulse or a DC/AC step voltage is applied for a short period of time, while concurrently, the voltage of the system is recorded (© Giatec Scientific Inc., 2019). Since the concrete specimens did not contain reinforcement bars, the measurement of concrete resistivity was made according to the conventional Wenner Array method. The method is of the four-probe type, with equally distanced electrodes. The configuration of iCOR allows the measurement of resistivity in the x and y axis, simultaneously (Figure 4(a)). The intrinsic electrical resistivity ρ can be calculated in terms of distance between electrodes, a, and the electrical resistance R, using equation (1). (a) Giatec iCOR-Bottom view and electrode configuration; (b) experimental setup for concrete resistivity test via CEPRA technology; (c) example of measurement via CEPRA technology with iCOR® and curve fitting of voltage; wireless resistivity measurements without external load (d) in the center and (e) along the casting direction.
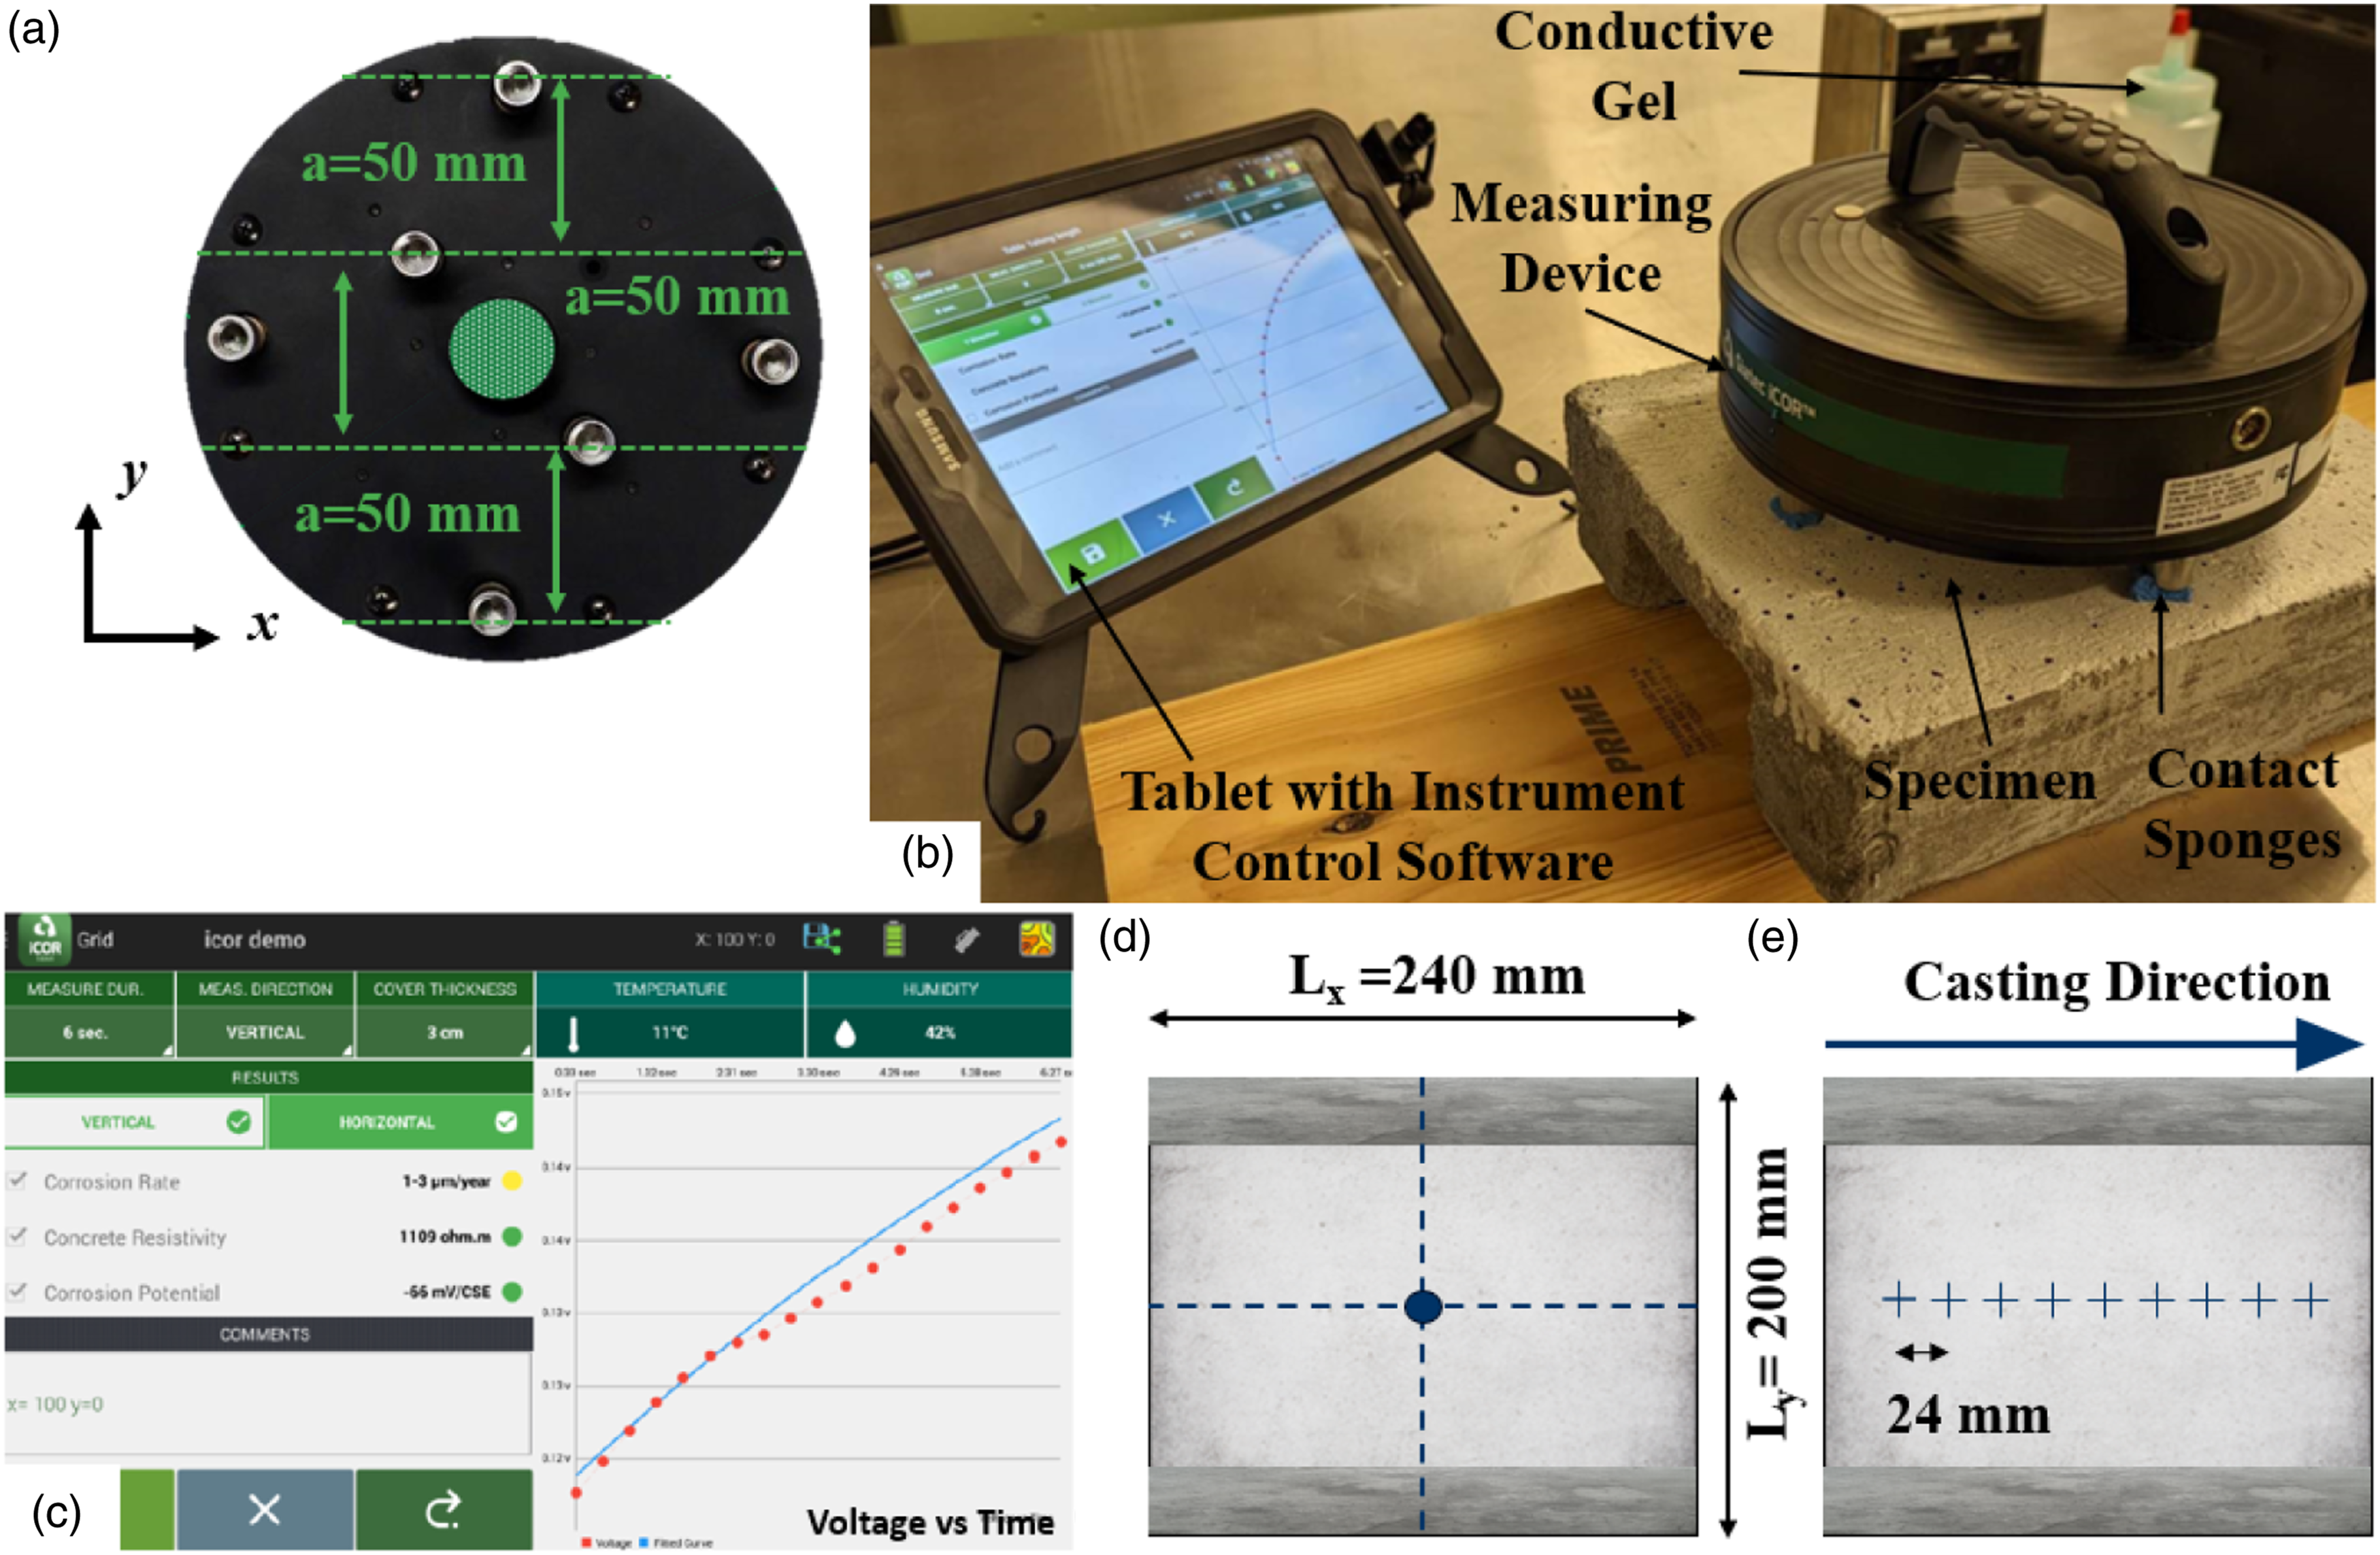
The experimental setup is illustrated in Figure 4(b). Initially, the sponge holders/electrodes were filled with a conductive gel and then the completely moist contact sponges were inserted in the tips. The tablet with the iCOR application, which was connected to the device via Bluetooth technology, received, analyzed, and stored the measured values, while it also post-processed test data and produced graphs and contour plots for concrete resistivity in real time. Before the measurement, input parameters such as duration and direction of the measurement were required. For this study, simultaneous measurement in x and y directions and a total duration of 12 s was chosen. An example of a measurement is shown in Figure 4(c). For each measurement, a fitted curve of the voltage measurement over time is performed and further employed for determination of concrete resistivity.
For every OPB specimen, multiple measurements on the center and along the length of the specimens were taken without external mechanical load as shown in Figure 4(d) and (e). The center was chosen as the reference point for the tests with applied external load, while the measurements along the length and in the direction of casting were performed to examine the effect of fiber distribution and boundary conditions on resistivity. For the center resistivity, nine measurements were taken at the center of each specimen with controlled temperature and humidity at 24°C and 60%, respectively. The distance between each point in the case of measurement along the length was selected to be 10% of the length in the x direction. For this measurement, the temperature was 23°C while the humidity was 55%. Due to geometry limitations in the vertical direction, the measurements were performed in the midspan of the vertical length (L y ). Finally, since resistivity is highly dependable on humidity, five different relative humidity (RH) levels were studied, with intervals of 5% for RH values in the range of 50%–70% in order to measure the center resistivity for one specimen of the three.
Self-sensing performance via wired resistance method
For the assessment of self-sensing performance in tension using the conventional wired four-probe method, two mechanical tests were performed with real-time measurement of electrical resistance. Those tests include monotonic direct tension and monotonic pure bending. The self-sensing performance was assessed through the fractional change in resistance. The measured resistance can be used as FCR according to equation (2). Here, Δρ, ρ
ο
, ΔR, and R
o
are, respectively, the change in resistivity, initial resistivity, change in resistance, and initial resistance.
The direct tension prisms were tested under mechanical loading using the procedure outlined in the Appendix. The test set up for the measurement of electrical resistance of the nano-engineered UHPC during testing in direct tension is shown in Figure 5. A universal testing machine (UTM) was employed with a loading rate of 0.15 mm/min, while the tensile elongation was obtained by virtual extensometers available in Digital Image Correlation (DIC) analysis (this was done using a MATLAB open-source module, ncorr (Blaber et al., 2015)). For DIC analysis, the front face of the specimen was speckled while a digital camera was taking pictures every 6 s, (Figure 5(a)). The electrical resistance of the specimen under tension was measured using a digital multimeter via the four-probe method. The data from the multimeter were collected through an instrument control software (Figure 5(b)) which collected the data at the same frequency as the camera. Prior to testing, the electrical resistance was measured for 1 h to ensure the elimination of polarization. (a) General view of the set-up for the electromechanical testing in direct tension; (b) instrumentation used for self-sensing performance under direct tension.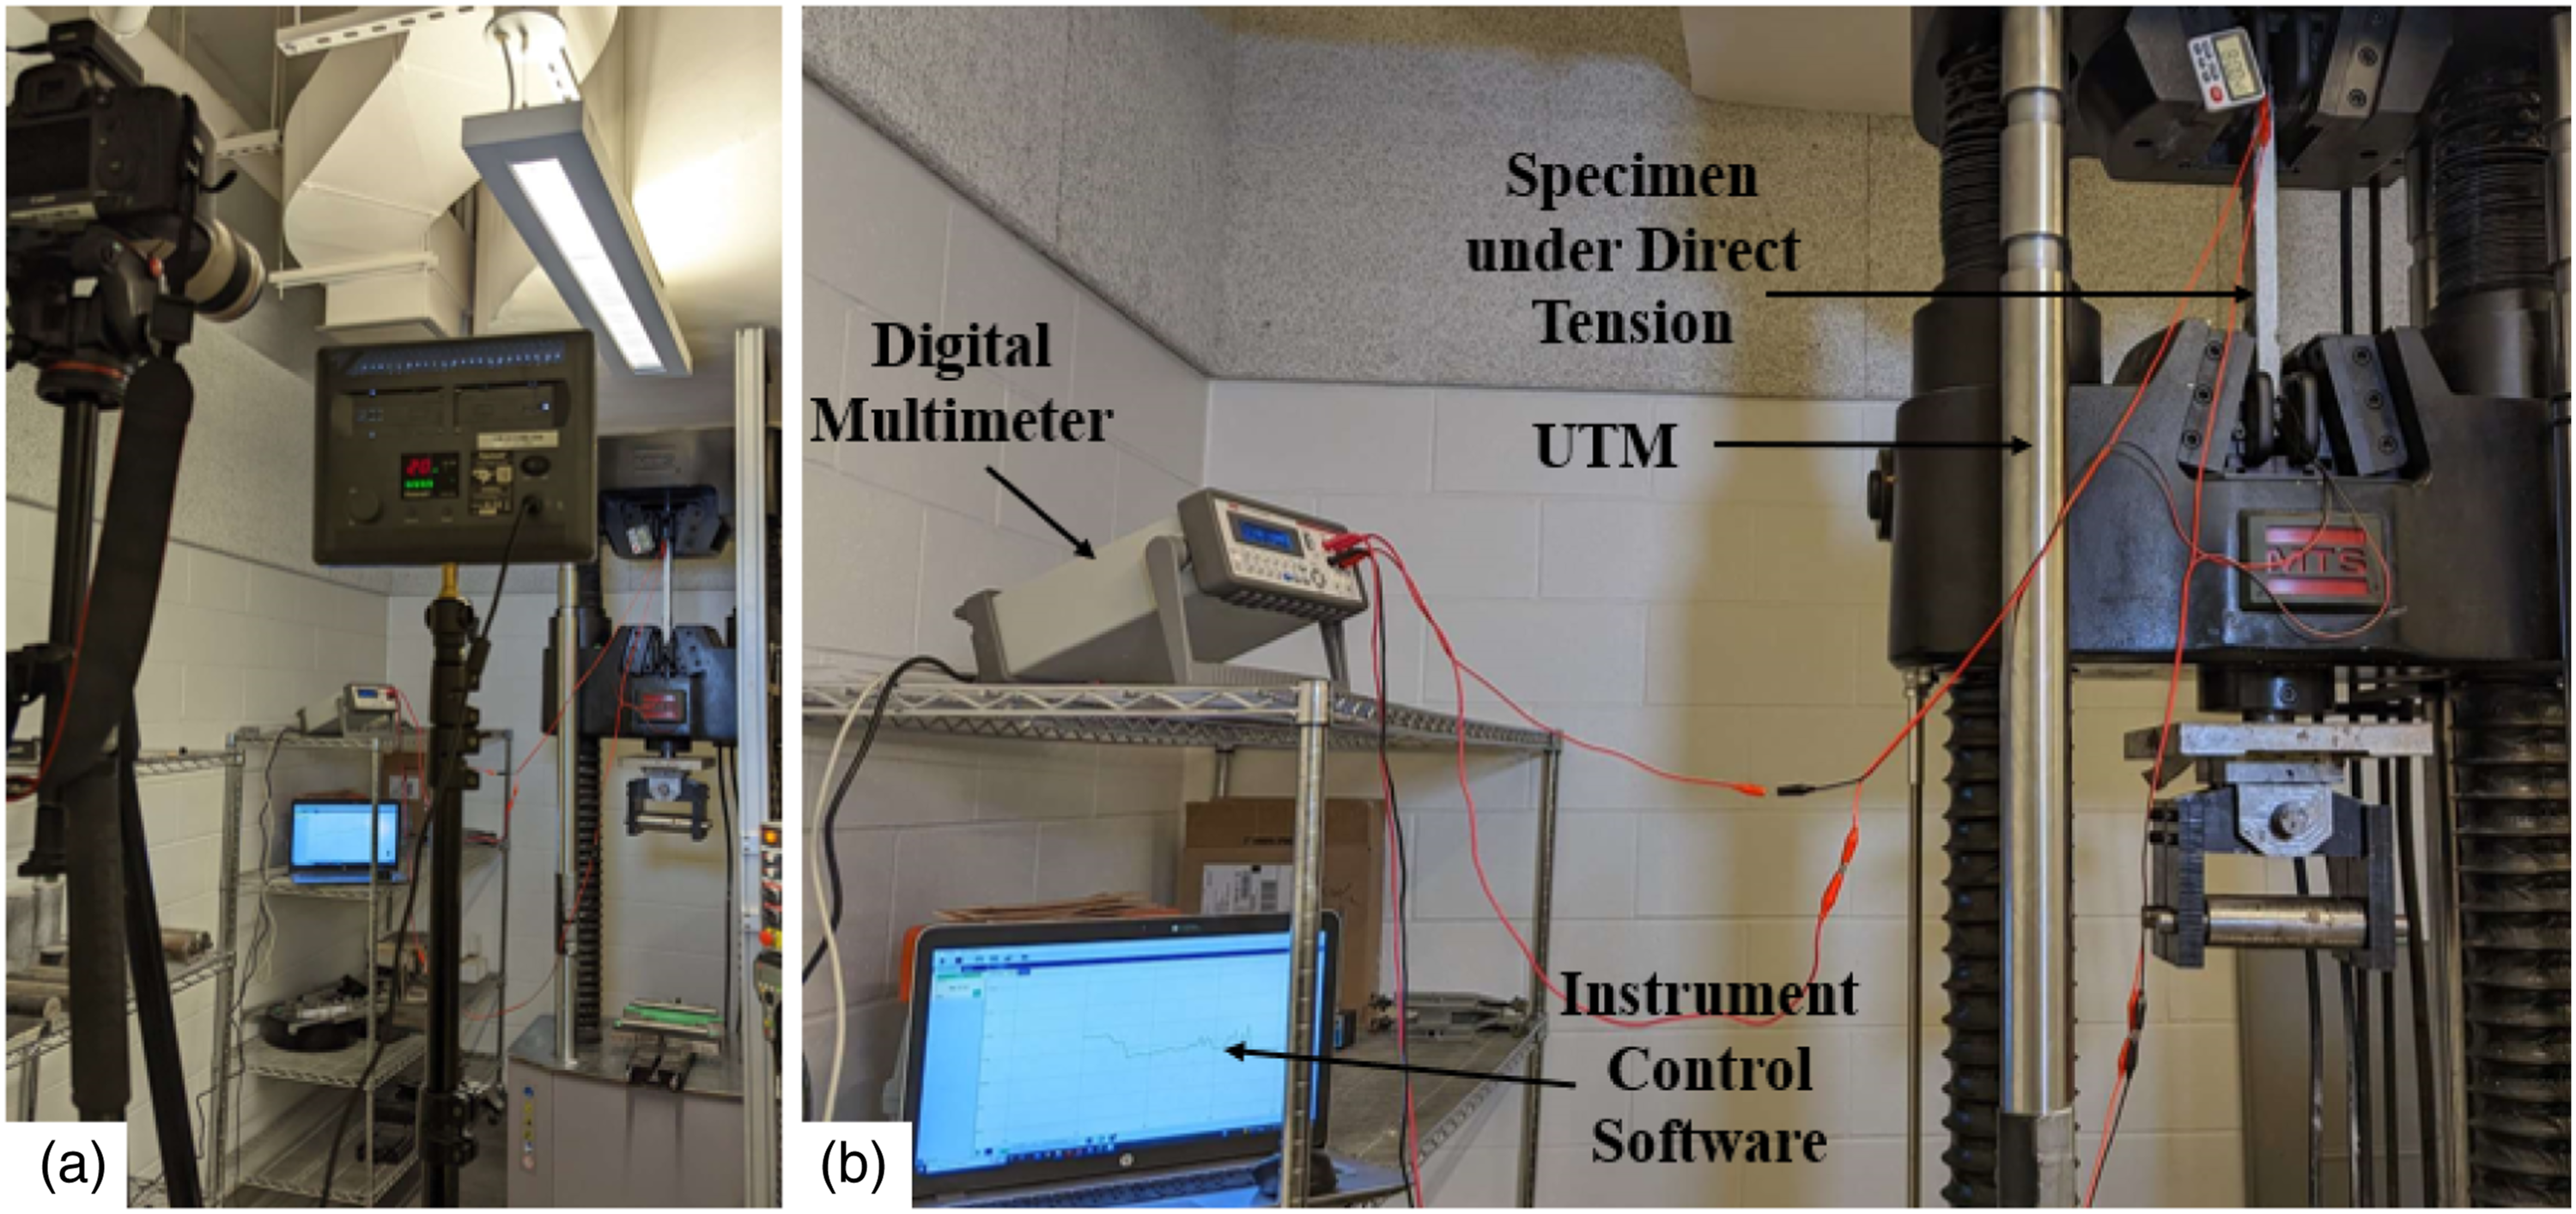
For the evaluation of self-sensing performance of the tension cracking in specimens under pure bending, three specimens were tested according to the four-point bending test of ASTM C1609, (2019) following the same procedure for the determination of flexural strength. More details about the testing method are given in the Appendix. The experimental setup for the measurement of self-sensing capacities of the nanoengineered UHPC subjected to pure flexure is shown in Figure 6(a). Since the tension face is selected for monitoring, the specimen is rotated 180° from the casting side which had the embedded electrodes. The displacement of the midspan is measured via two Linear Variable Differential Transformers (LVDTs) on both sides of the specimen mounted on an aluminum frame. To avoid interference with the conductive loading system or with the instrumentation jig that holds the LVDTs, insulating tapes were placed at the connection lines (Figure 6(b)), while the electrical resistance was also measured for 1 h prior to testing to counteract the polarization. Experimental set-up for four-point bending test: (a) instrumentation; and (b) flexural specimen with insulating tape at the points of contact with the loading system and frame.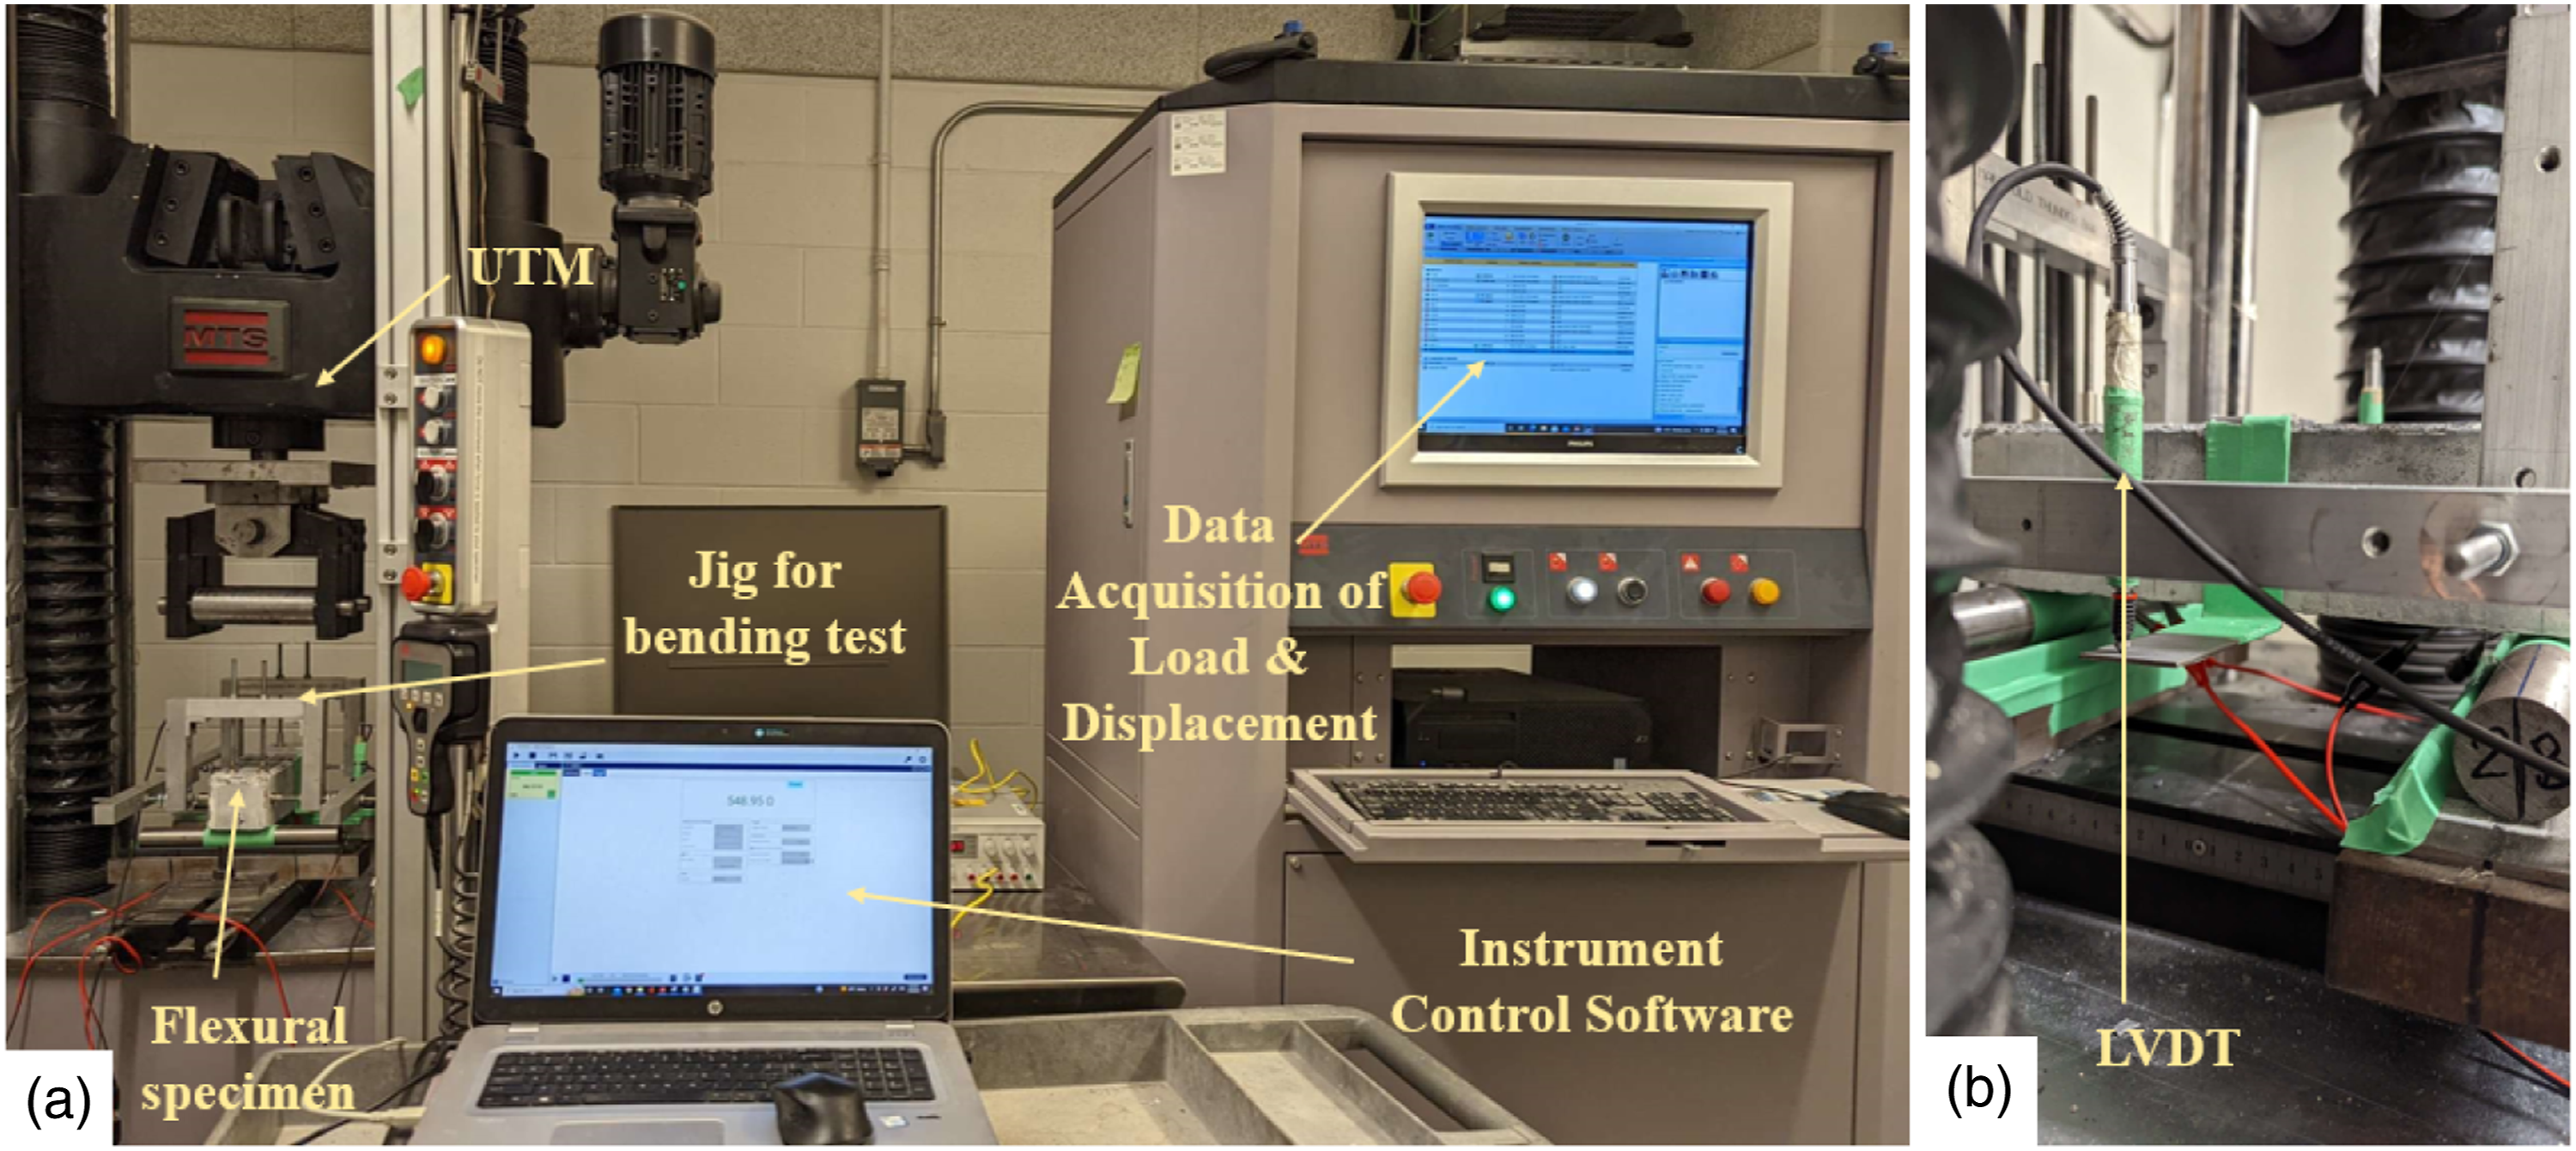
Wireless self-sensing performance via connectionless electrical pulse response analysis technology
In order to assess the self-sensing performance of the wireless resistivity measuring device, out-of-plane bending test of panels with a C-Shaped form was used. The design of the cross-section and type of test was performed based on limitations imposed by the electrode configuration of the measuring device and user safety considerations. The latter is crucial for real-time manual measurement of electrical properties of the externally placed device, under the presence of vertical load.
The experimental setup for the wireless sensing under out-of-plane bending is illustrated in Figure 7. The measurement was performed intermittently every 1 min till the peak load. The device was set to measure both directional (i.e., in x and in y) resistivities simultaneously, while the duration of the measurement was 12 s. Since resistivity is sensitive to temperature and humidity, the same ambient conditions were ensured for all specimens, namely, temperature at 23°C and 50% relative humidity. DIC analysis was also employed to obtain the surface strain and deformation in both directions. (a) Schematic illustration of the wireless electromechanical testing and support conditions; (b) eccentricity and moment diagram of the cross section due to out of plane bending; (c) instrumentation of the experimental setup; and (d) instant resistivity measurement via wireless iCOR® device.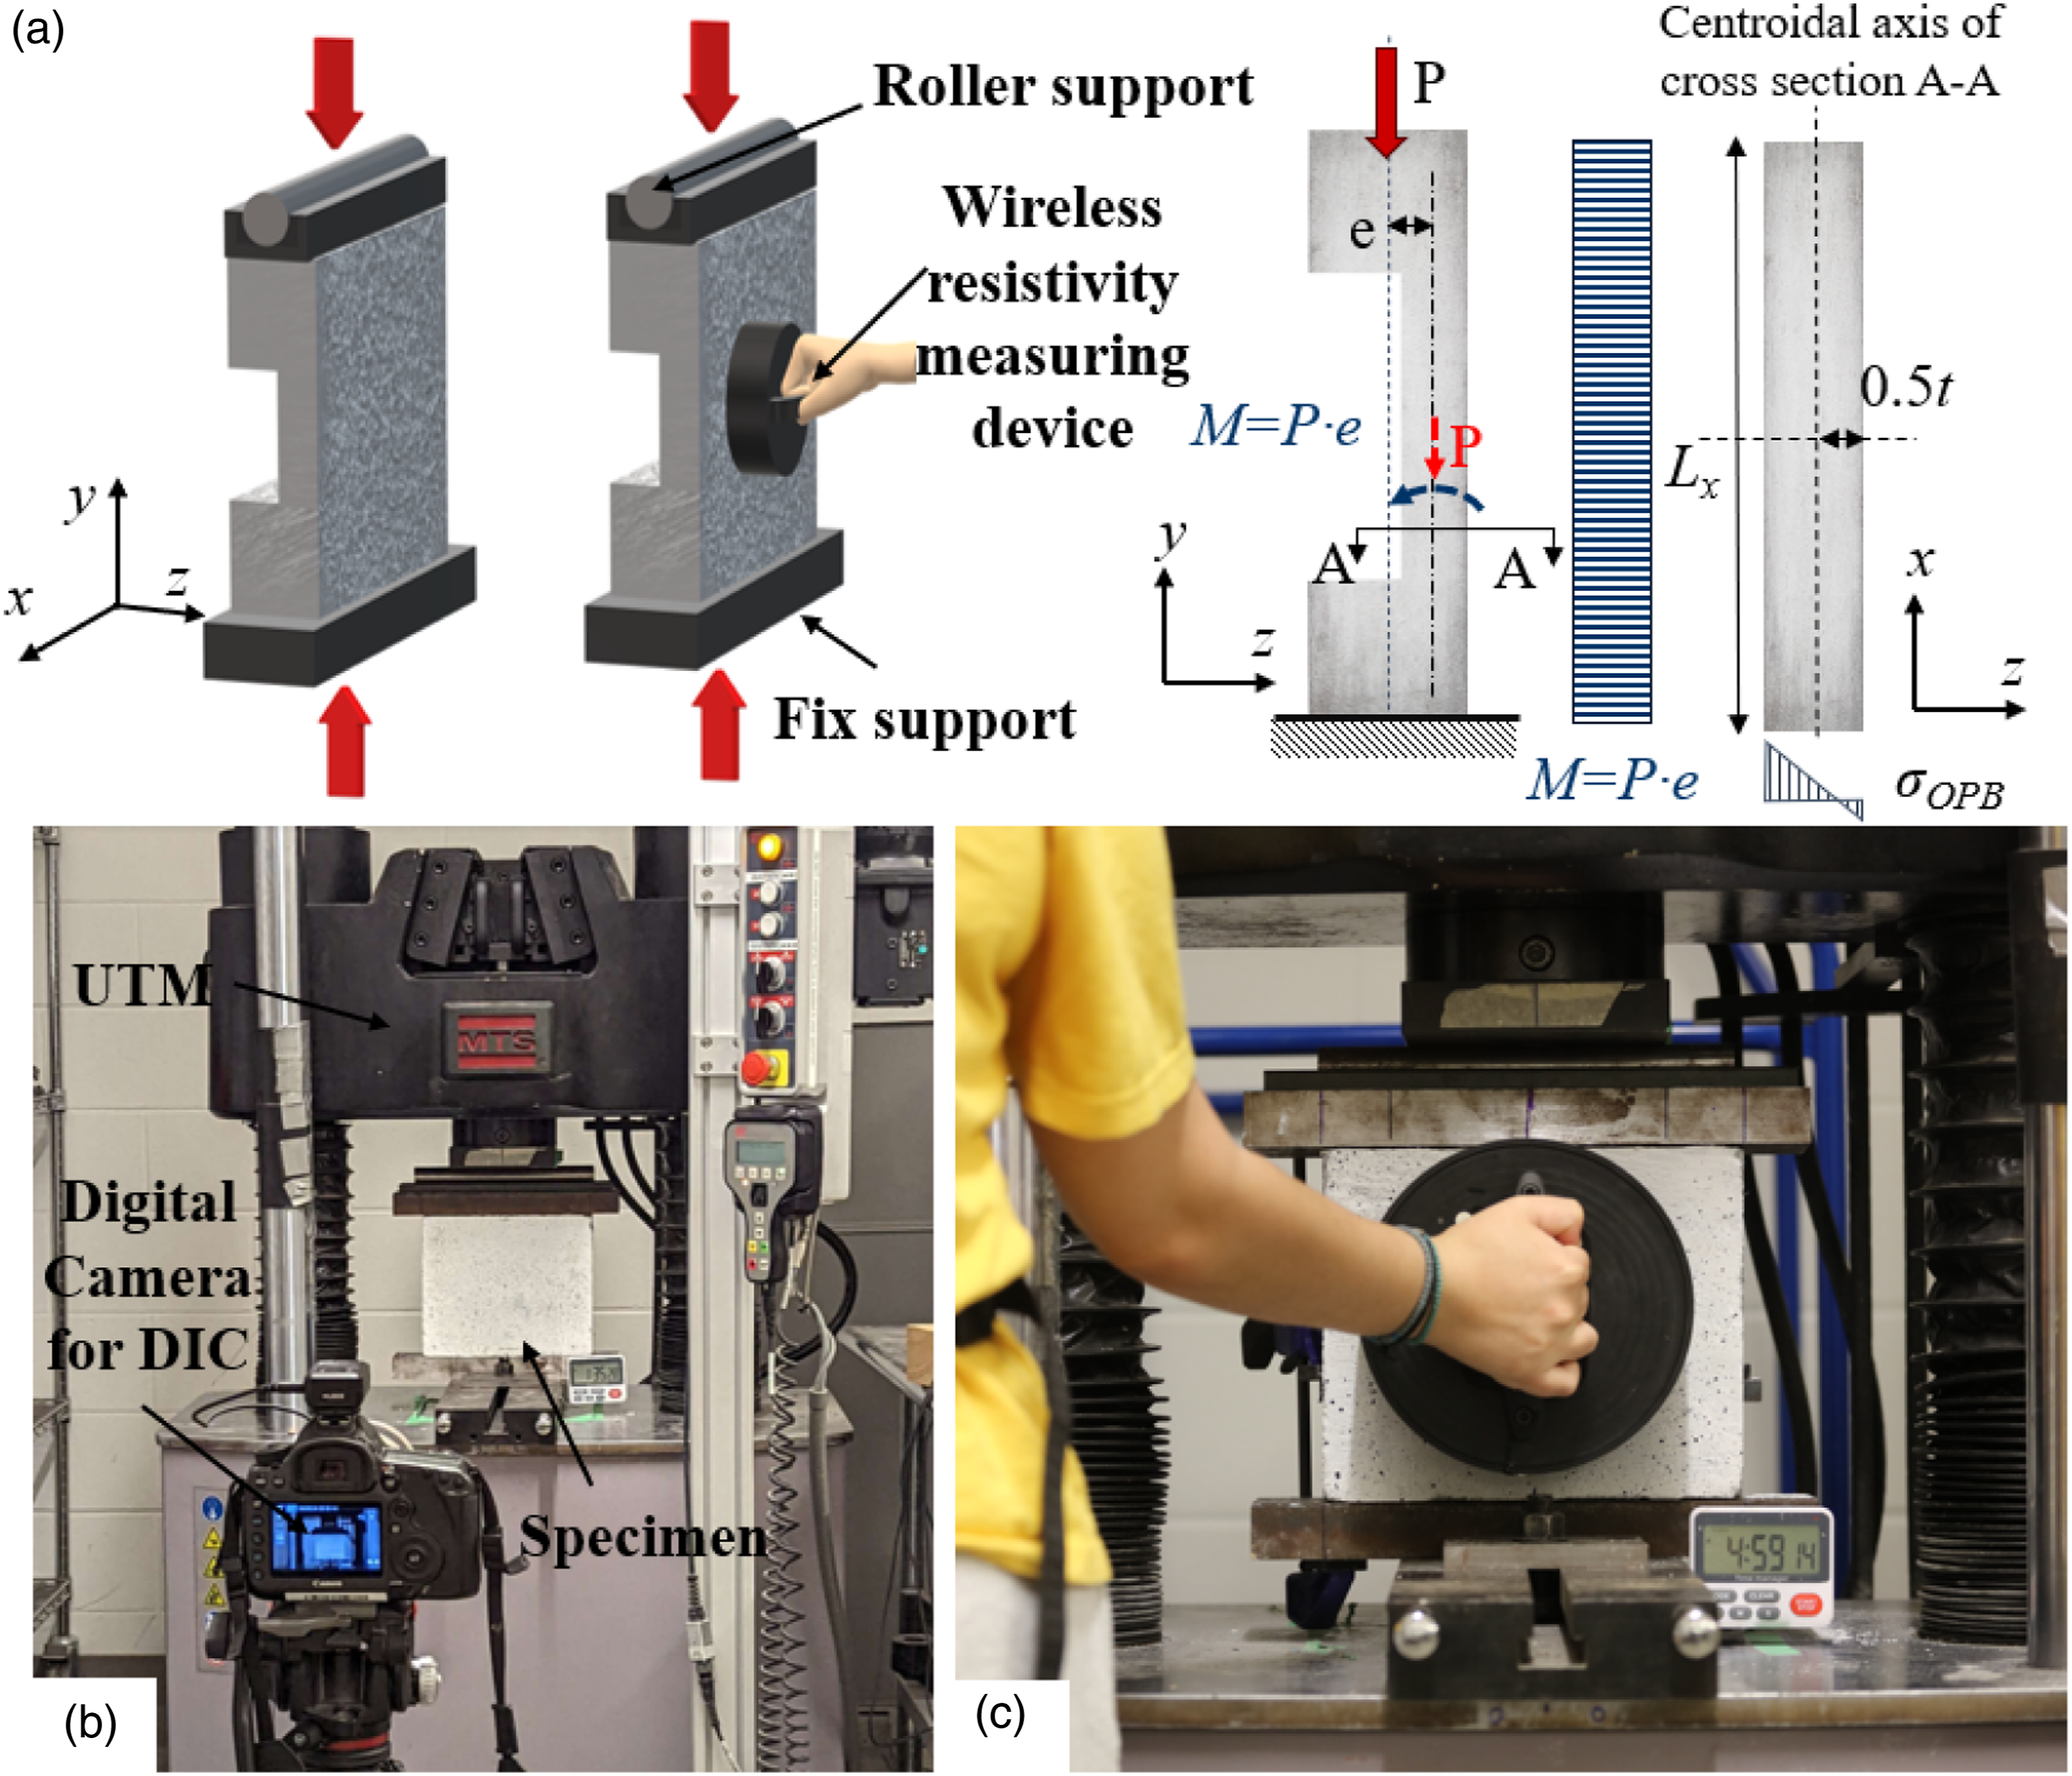
The developed stress, σ
OPB
, on the tensile face due to the moment M and the applied load P is given by equation (3a), where e is the load eccentricity, I is the moment of inertia of the cross-section, t, and L
x
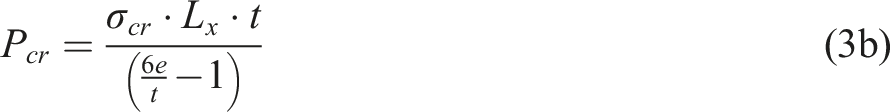
the thickness and length of the cross-section A-A in Figure 7(b), respectively. Note that e was equal to 15 mm, 17.5 mm, and 15 mm, respectively, for OPB1, OPB2 and OPB3, specimens. The expected cracking load P
cr
for the out of plane bending test may be calculated using equation (3b), where σcr is the tensile cracking stress as determined by the direct tension test. It is noted that this normal stress occurs in the y-axis of the specimen. Compressive strains occur in both x and z directions due to Poisson’s effect acting on the tension strain in the y-direction. Configuration of VE for DIC.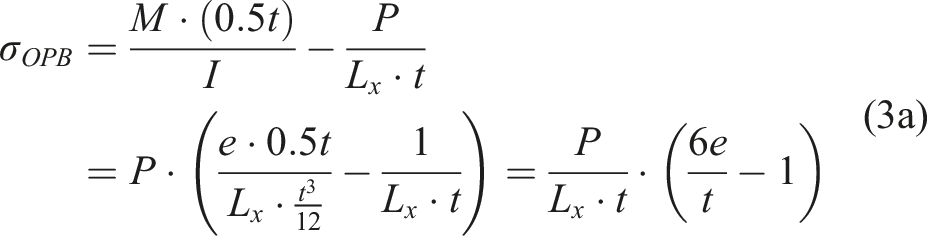
Experimental results and discussion
Electrical properties
Figure 9(a) and (b) illustrates the change in electrical resistance of the nanoengineered UHPC due to electrical polarization before applying external load, for the flexural and direct tension specimens, respectively. In the case of flexural specimens, it was observed that the electrical resistance dropped instantly at the beginning and then continued to decrease at a slower pace until reaching the polarization time for stable measurement. However, for direct tension specimens, the reduction was steeper followed by an abrupt increase and then a plateau in a shorter time compared to flexural prisms. The latter may be explained by better fiber alignment in the case of direct tension specimens which was linked to wall effects and the smaller thickness of these specimens over the flexural prism specimens. It was known that more conductive pathways reduce the time drift of polarization (Chung, 2021). The difference in the range of resistance between the two different types of specimens was owing to different electrode configurations and specimen size. Change of electrical resistance due to polarization for (a) flexural specimens and (b) direct tension specimens (repetition of three specimens).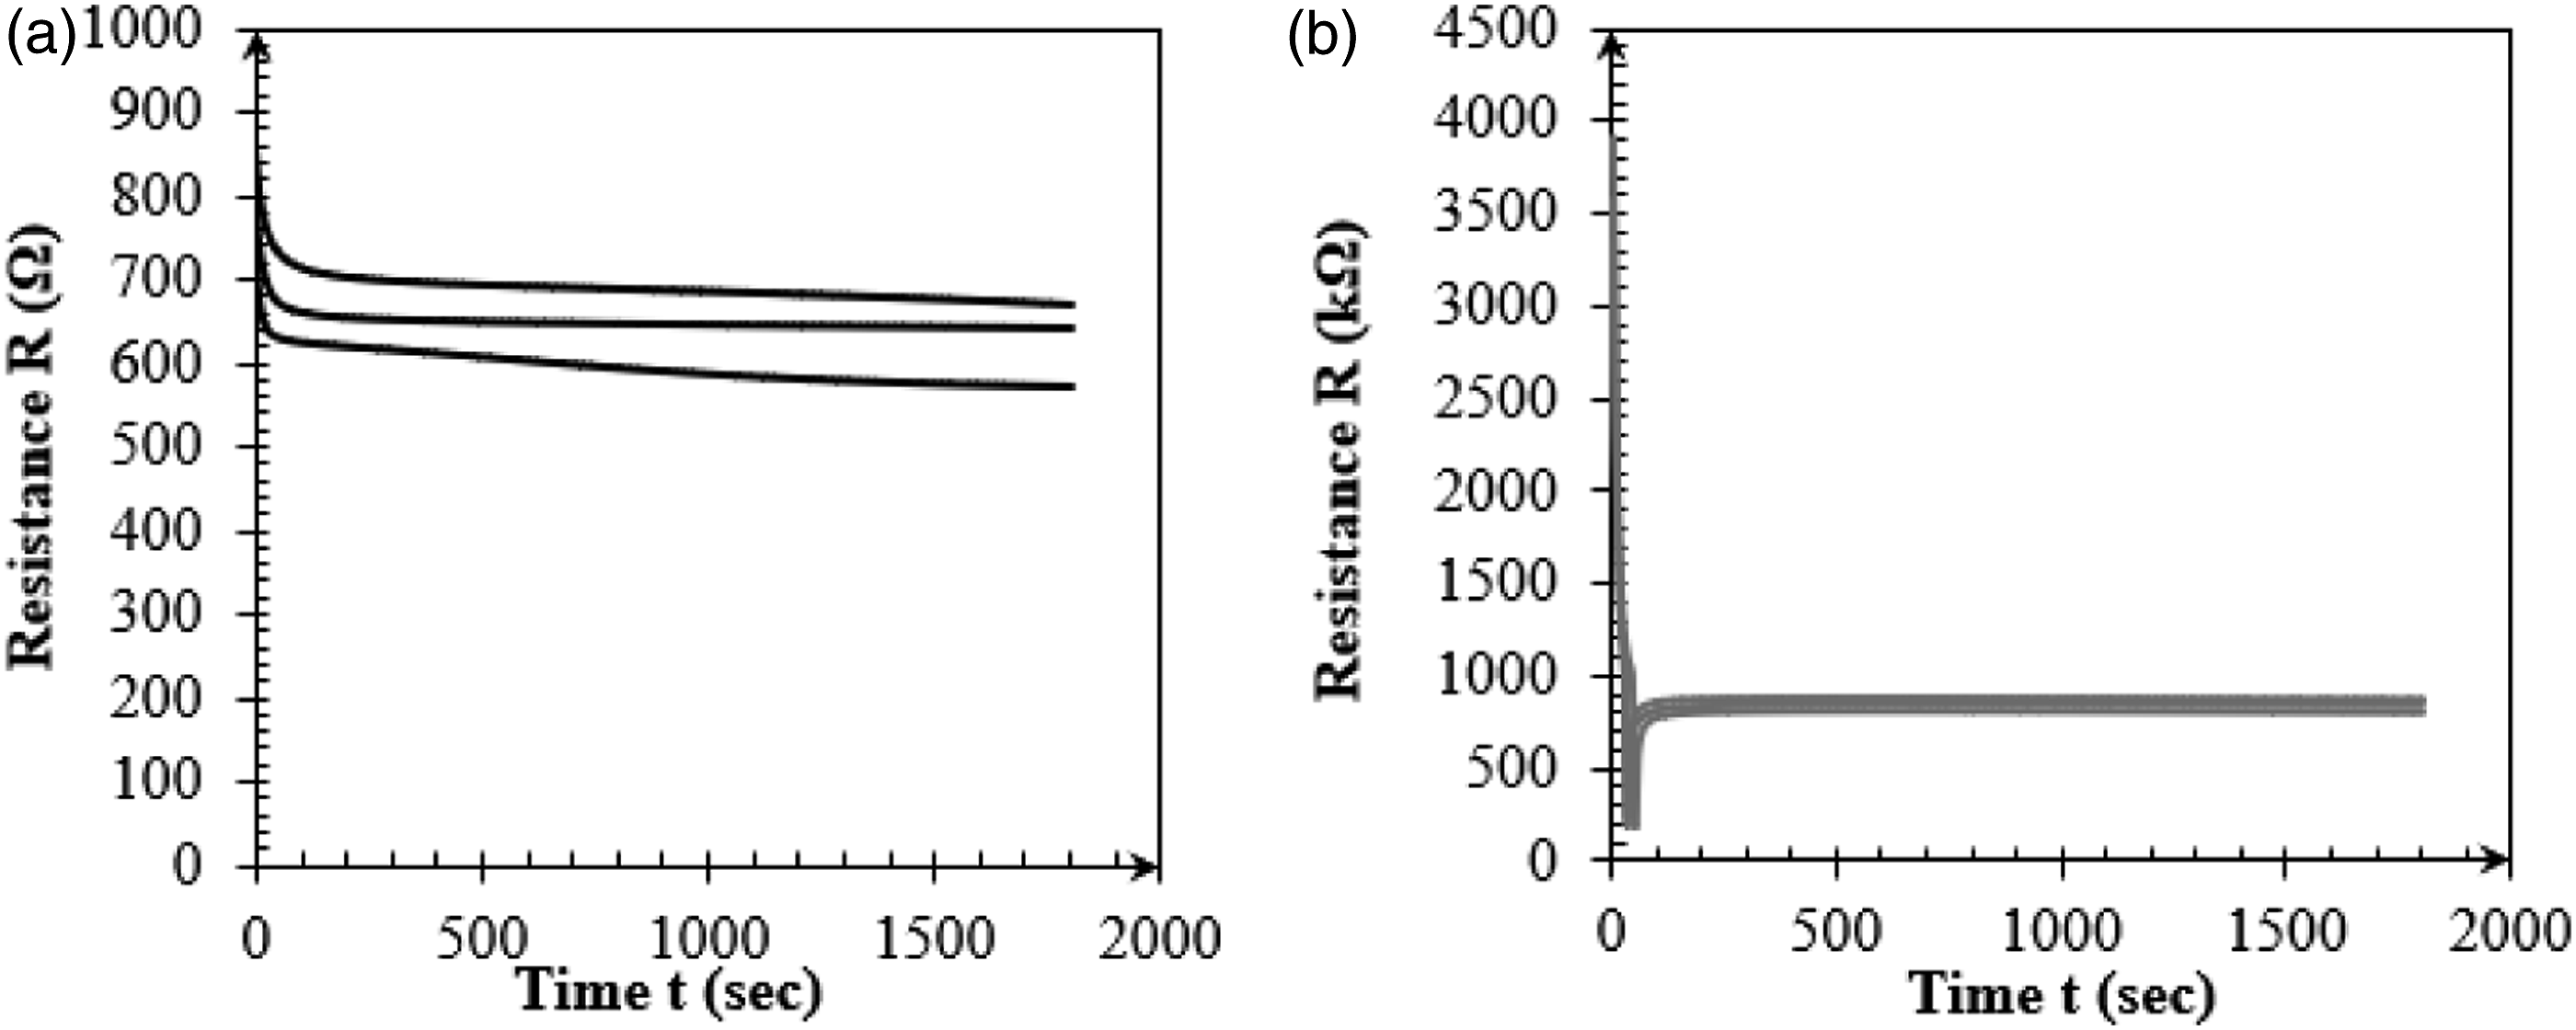
Initial resistivity, the effect of fiber distribution, and humidity
Resistivity measurements in the center of OPB specimens.
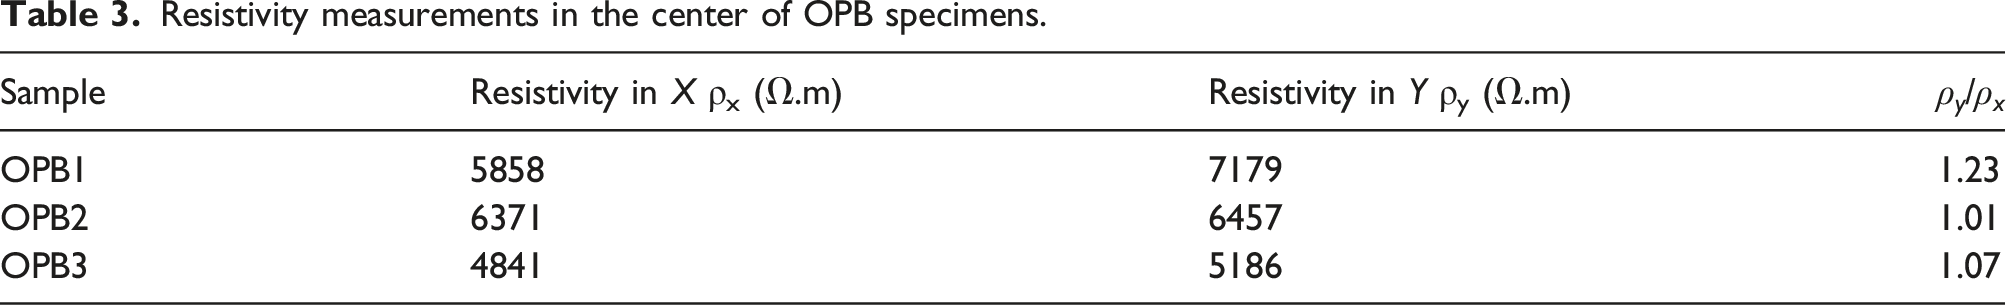
Figure 10 illustrates the resistivity measurements in both directions along the horizontal dimension. For all specimens, moving farther from the casting point is associated with a decrease in resistivity in the horizontal direction. At locations close to the end boundary, both directional resistivities were increased, with the value in the horizontal direction surpassing the corresponding value in the orthogonal direction. The latter can be explained by the wall effect on the flow, which drives fibers to rotate by about 90° at the downstream boundary (Pantazopoulou et al., 2019). Finally, the effect of relative humidity on resistivity is illustrated in Figure 10(d). As expected, the increase in humidity causes resistivity reduction with a more prominent effect for relative humidity values higher than 65%. (a-c) Effect of fiber distribution on resistivity of OPB specimens; (d) effect of humidity on resistivity of OPB specimens.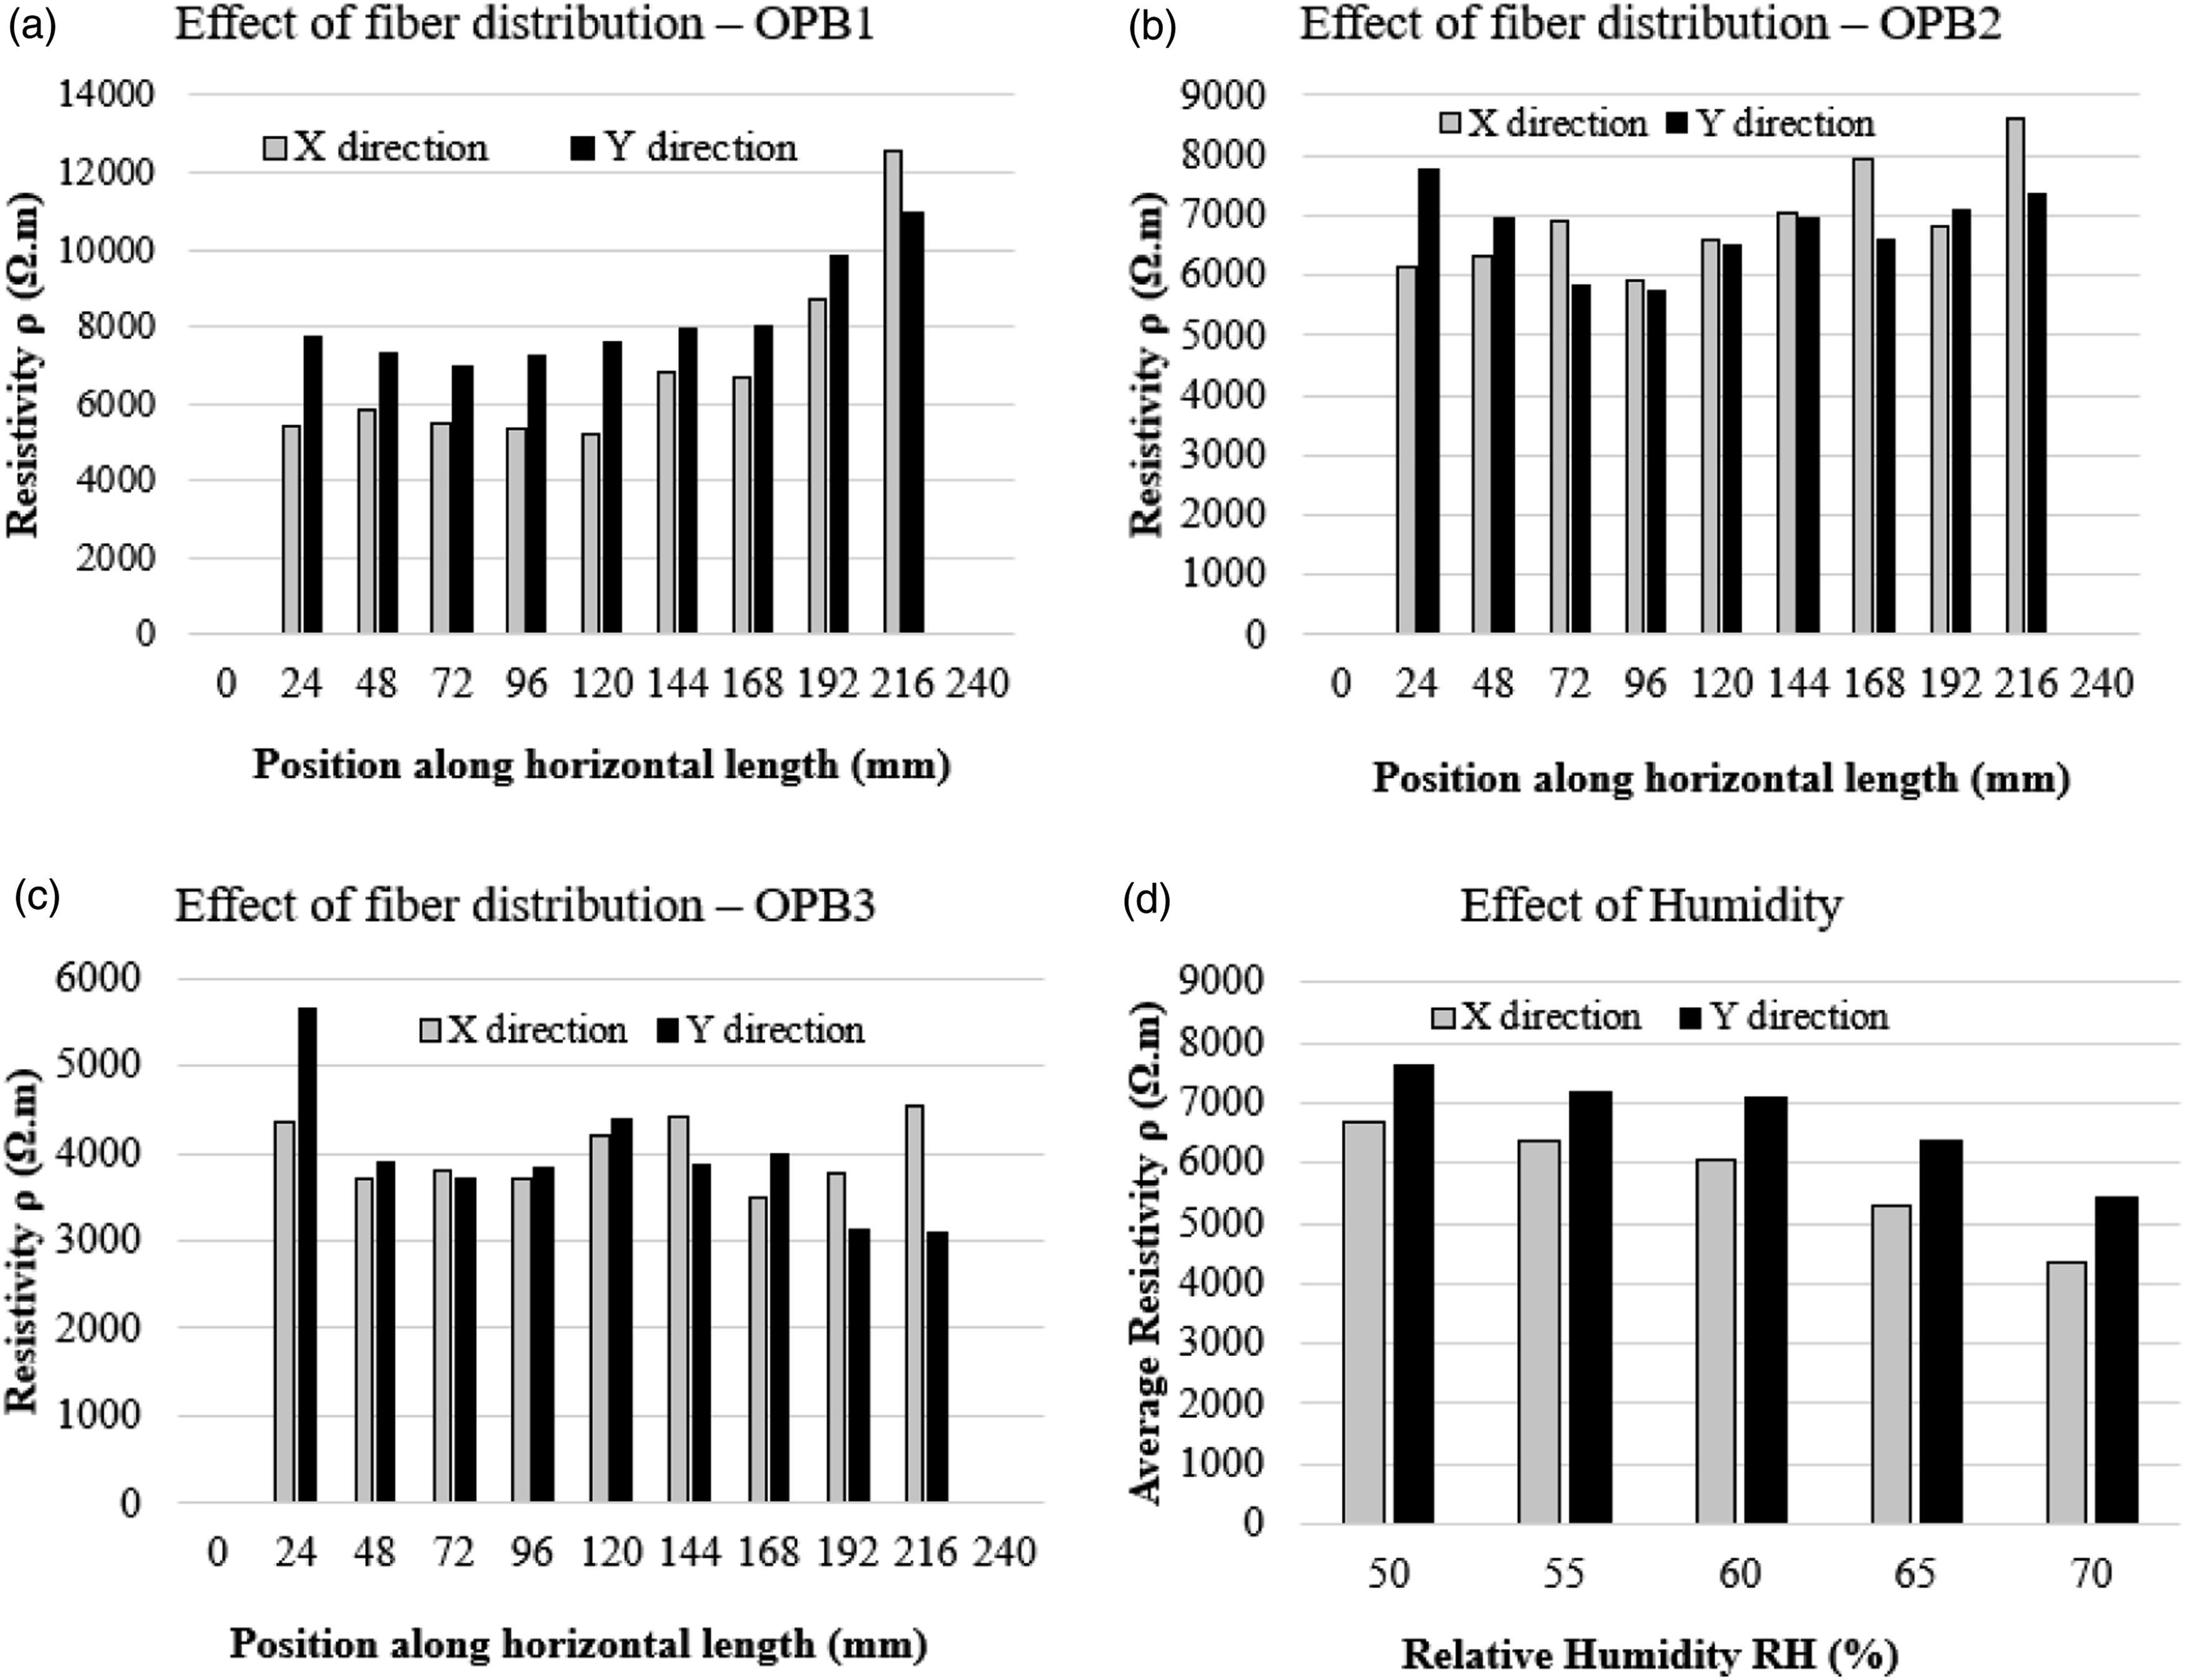
Self-sensing performance using wired resistance method
Figure 11 illustrates the tensile stress- and FCR-time of each specimen in direct tension. For increasing strain and stress while the specimen is still in the elastic (pre-cracked) region the resistance is decreasing gradually. This trend is reversed after crack initiation: This behavior is consistent with the self-sensing performance of tension hardening UHPCs in direct tension, measured with DC and reported in the literature (Kim et al., 2018; Noh et al., 2019; Song et al., 2015). The opposite trend, namely an increase of the resistance in the strain-hardening region is observed in AC measurements (Hou et al., 2022). According to Kim et al., (2018, 2020) and Song et al., (2015) at this stage due to multiple microcracking, there are two phases in a strain hardening UHPC under direct tension: the non-cracked and the cracked segments. A non-cracked segment is associated with much higher resistivity due to the intact matrix. However, as micro-cracking progresses, the high electrical conductivity of the steel fibers in the cracked UHPC contributes towards a decrease in the specimen’s electrical resistance. The maximum absolute change in resistance in the ascending branch was found to be consistent with the first cracking obtained by DIC and found to occur at a stress of around 5 MPa. Another observation is related to the sharp changes in FCR before the maximum decrease of resistance at this stage, which are not related to sharp changes in stress. The latter might be linked to the fact that conductivity increases in thickness due to Poisson’s induced contraction, provided that the element has not yet developed cracks in the x direction due to possible out-of-plane bending. The rapid increase of the resistance at the onset of macro-cracking is due to the creation of larger discontinuities in the matrix and the disturbance of the conductive pathways created in the nanoengineered UHPC between the micro and nanofibers. Due to multiple cracking and the bridging of the cracks after the first cracking strength and till 60% post-peak, the FCR slope does not change considerably. Specimen #3 demonstrated a different response compared to the other two specimens. This may be linked to out-of-plane bending which may have occurred during testing (see evidence of this in the circled region of Figure 11(c)). Comparative stress-, and FCR-time curve of nanoengineered UHPC in direct tension along with surface axial strains at cracking from DIC analysis: (a) specimen DT1, (b) specimen DT2, and (c) specimen DT3.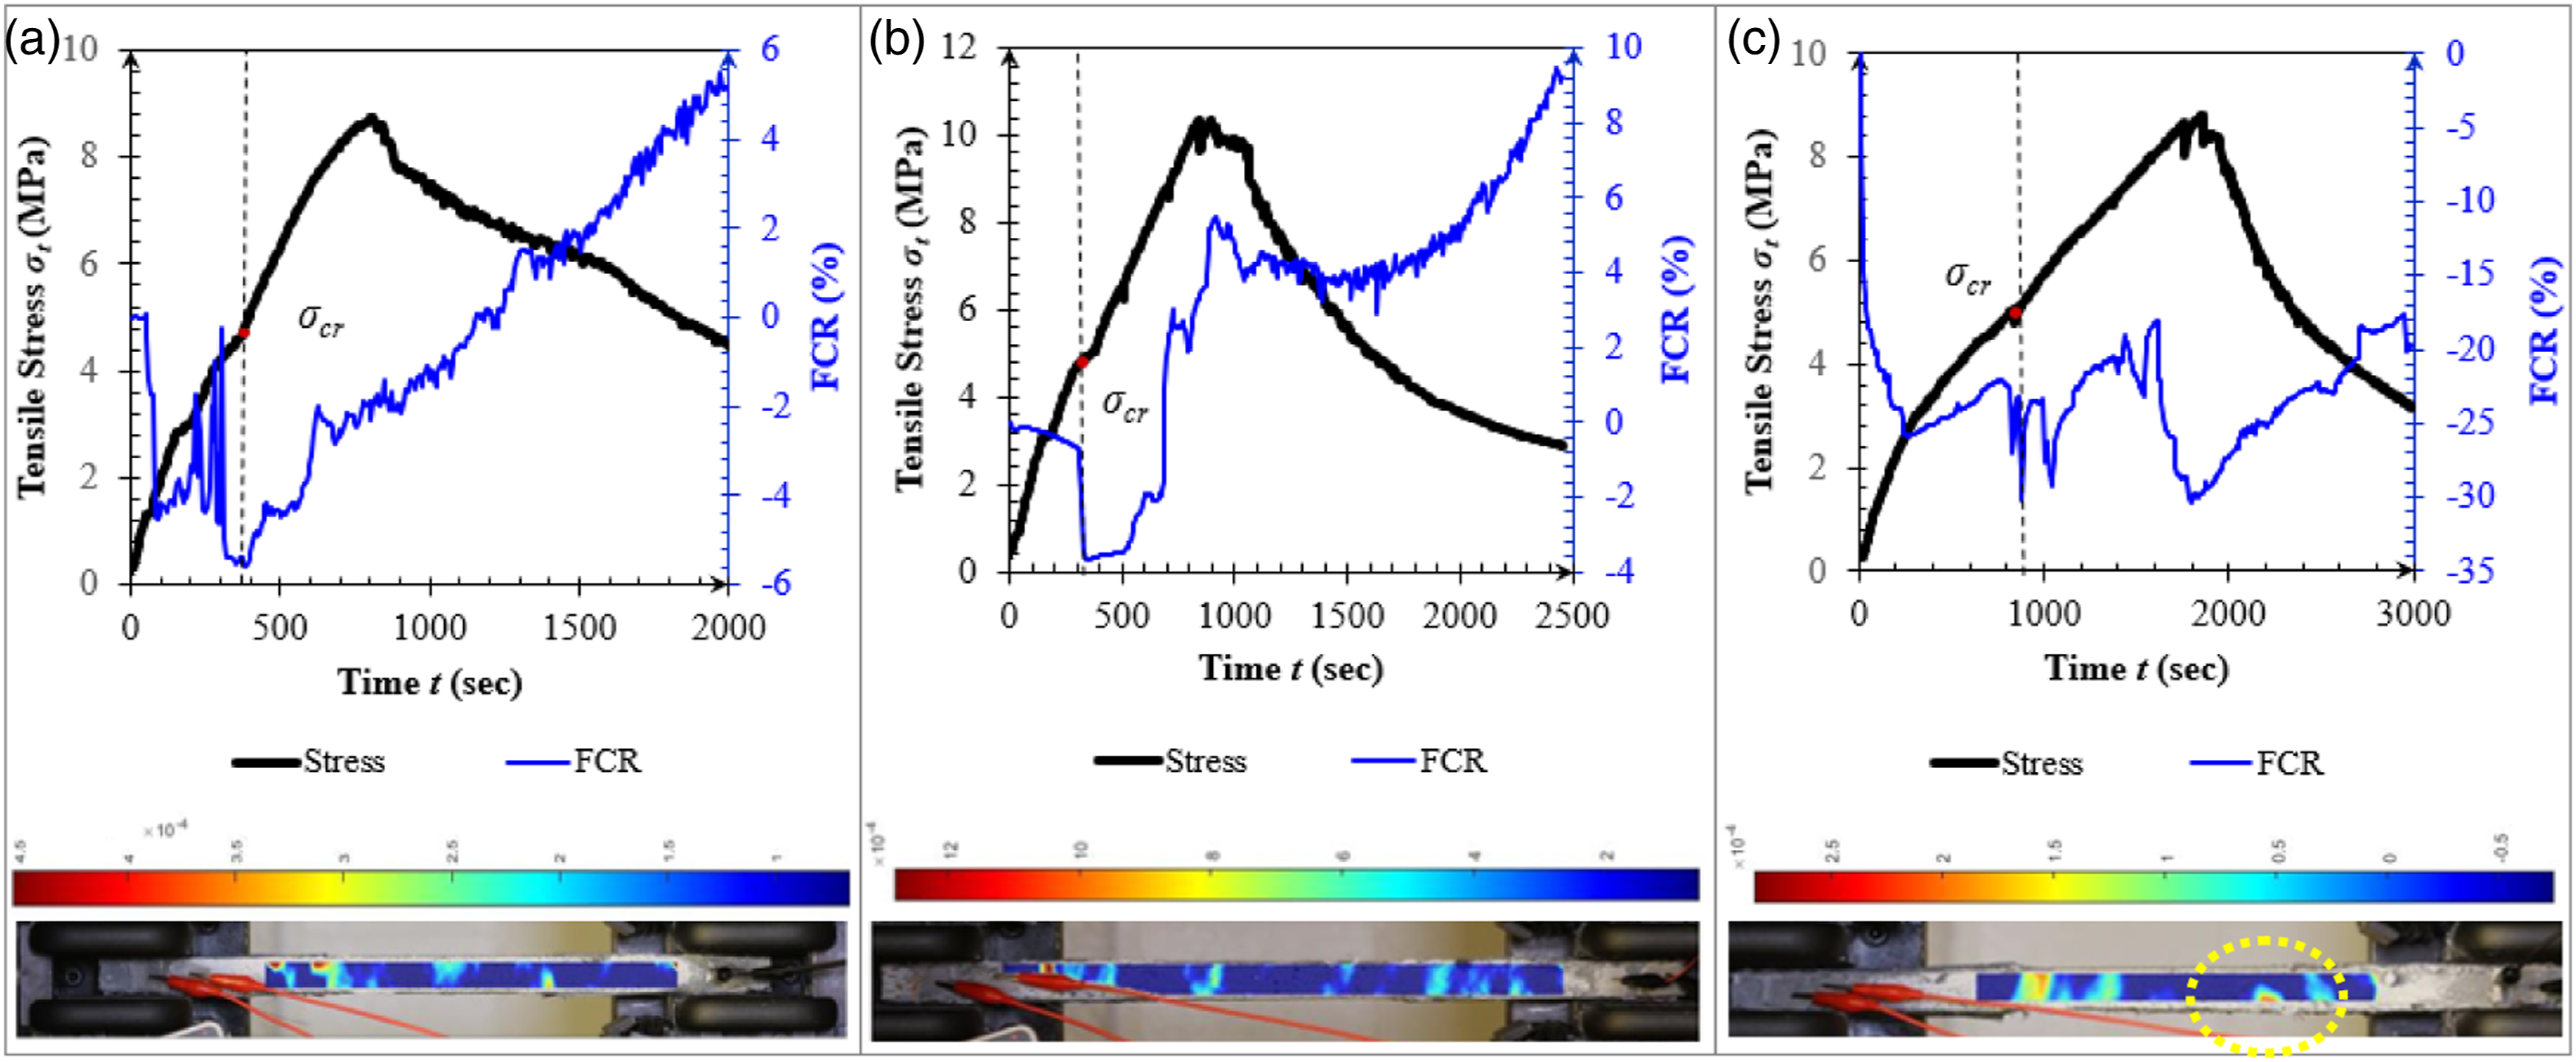
The comparative flexural load-deflection and FCR-deflection behavior of the flexural prisms are presented in Figure 12. A similar trend with direct tension tests in terms of FCR is observed. In the elastic range up until cracking, the FCR decreases. The reduction could be again explained by the multiple micro-cracking as observed in direct tension. Also, at this stage, the strains in the tensile face are not significant yet and thus the influence of compression dominates. At the end of the linear elastic region, which can be associated with the onset of cracking, the first drop of FCR coincides with the first peak while the maximum absolute FCR is correlated with the ultimate load. After that point, the FCR changes slope as the resistivity starts to increase drastically. The increase in FCR is more prominent at the descending branch of the mechanical resistance curve for specimens FL1 and FL3 (Figure 12(a) and (b)), while the jagged pattern in the flexural load curves which is associated with the pullout of fibers is also evident in the FCR curve. However, in case of FL2 specimen (Figure 12(c)) at post-peak the FCR is decreasing which does not agree with the expected response. The latter is explained by the location of the crack, as it occurred between one input and output electrode close to the support (Figure 12(d)). Comparative flexural load-deflection and FCR-deflection behaviour of (a) specimen FL1; (b) FL3; (c) specimen FL2, and (d) shear failure between an input and output electrode for specimen FL2.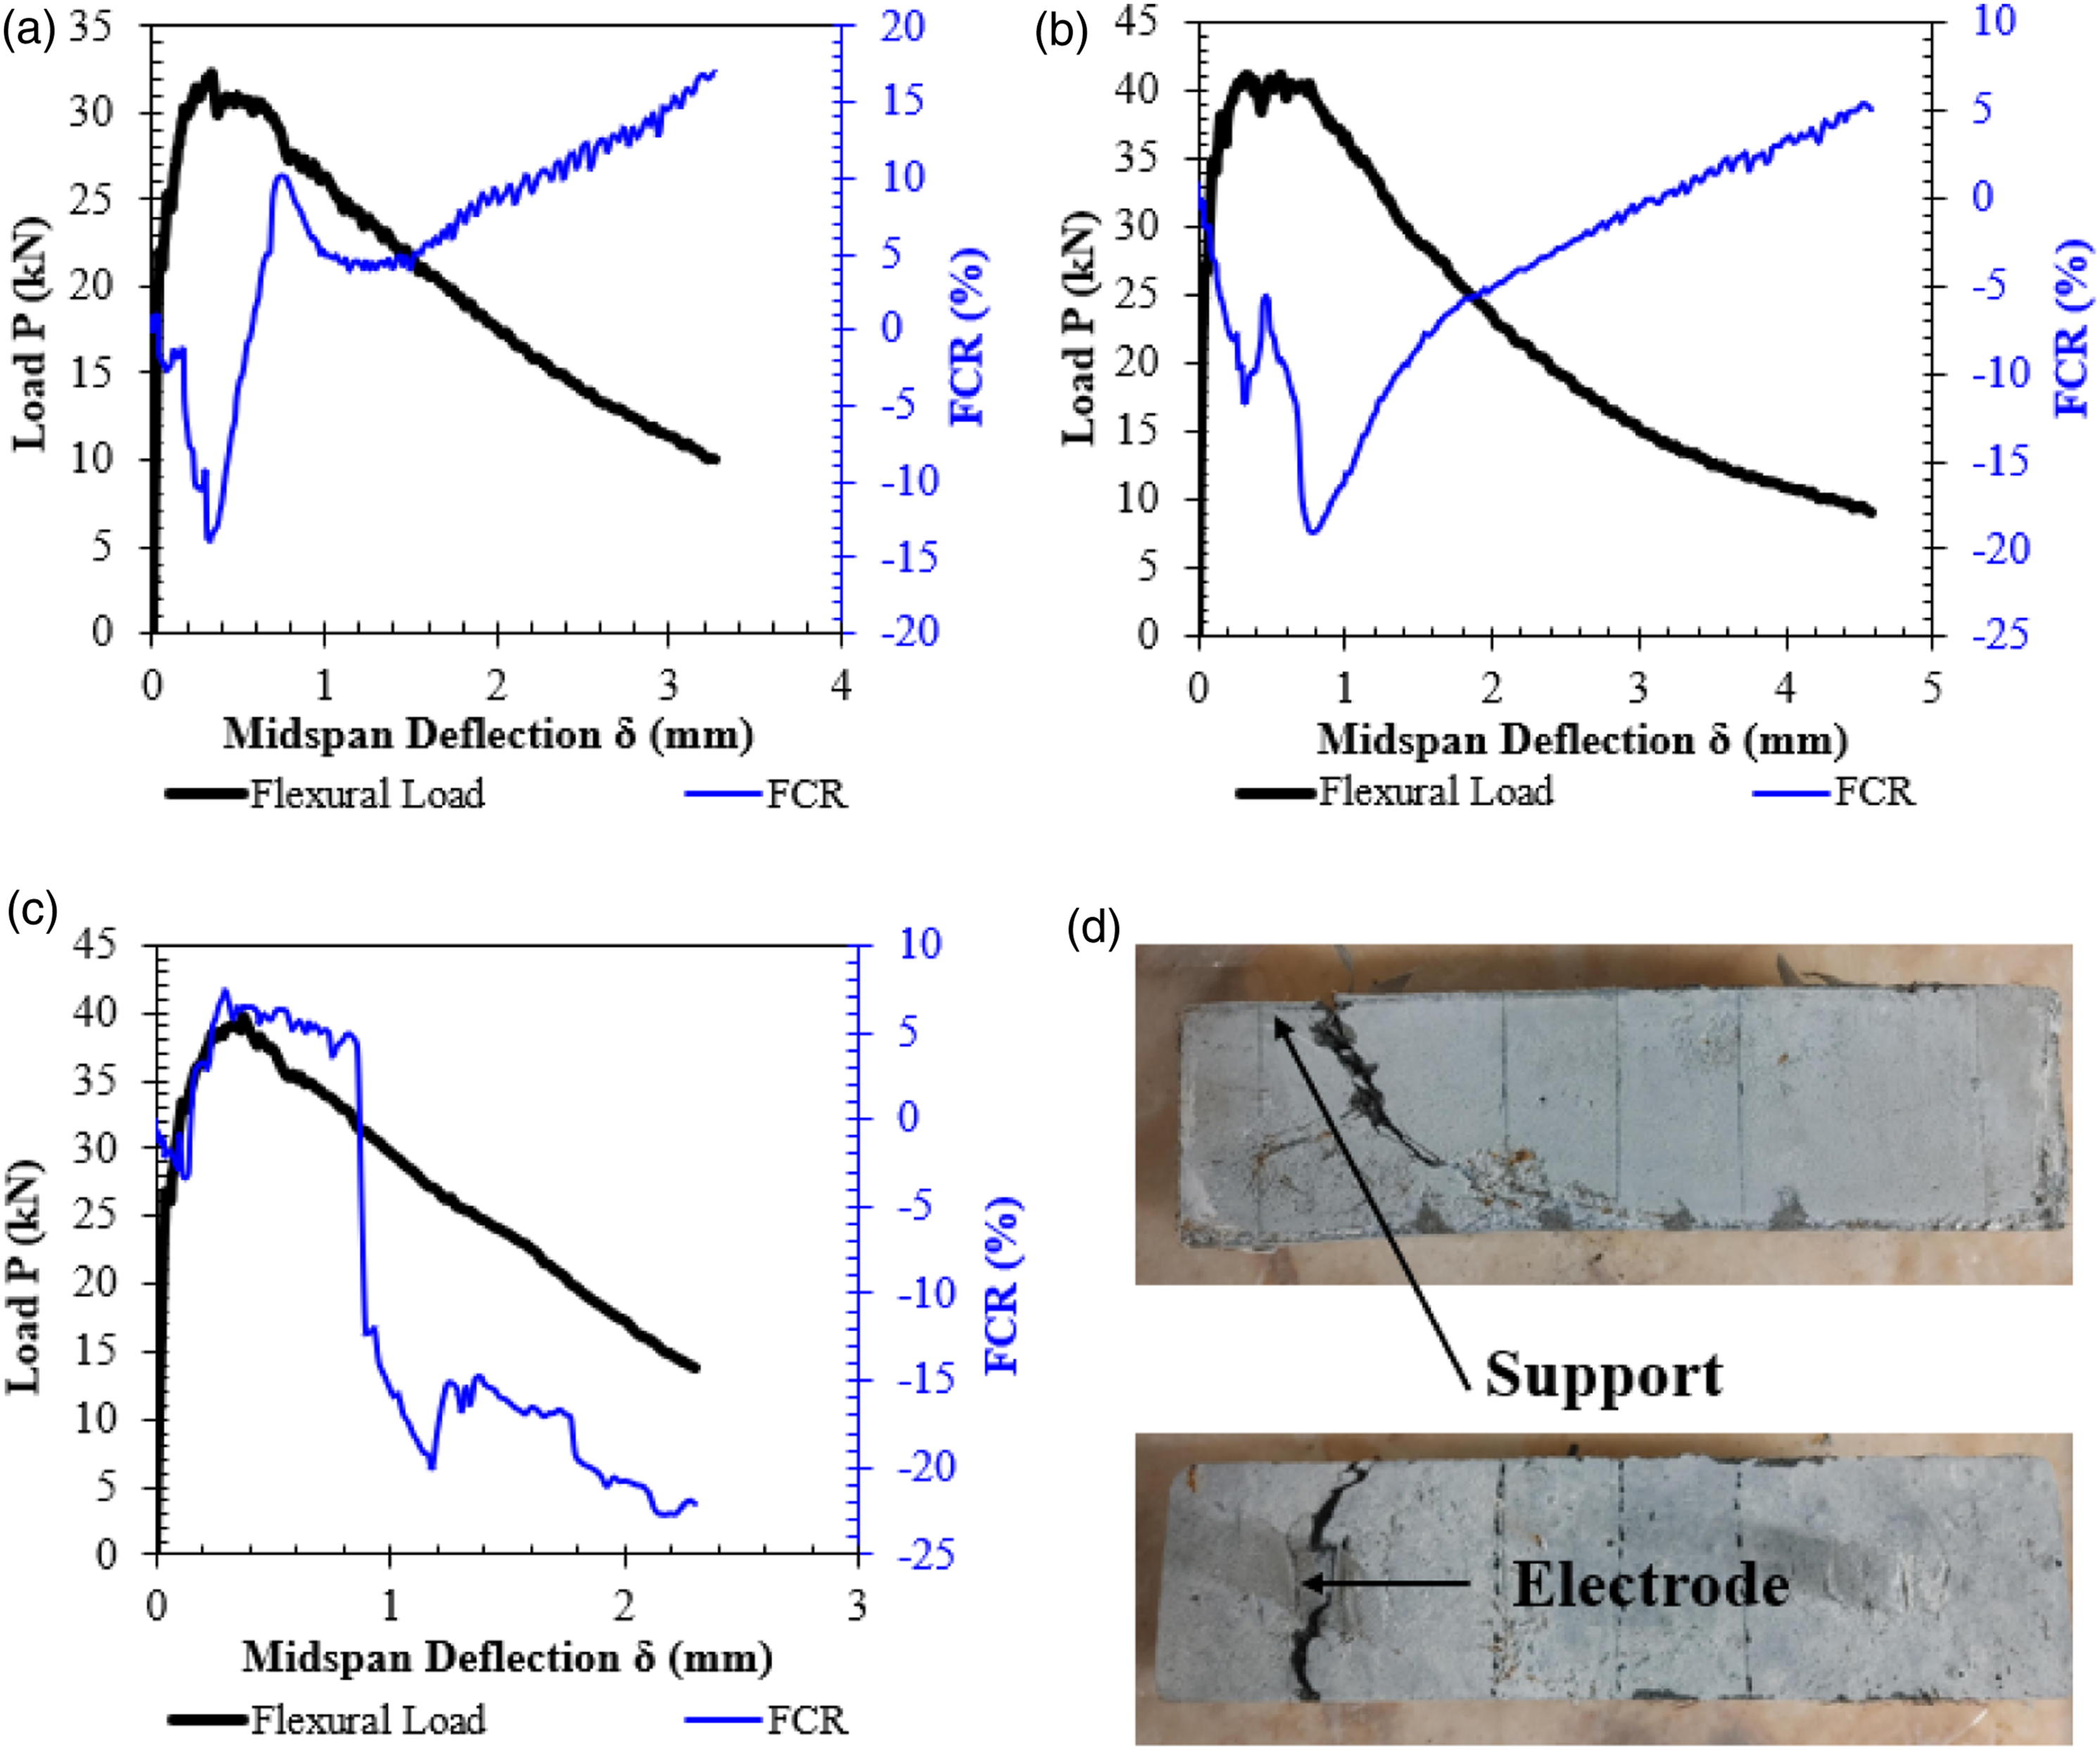
Self-sensing performance using wired wireless connectionless electrical pulse response analysis technology
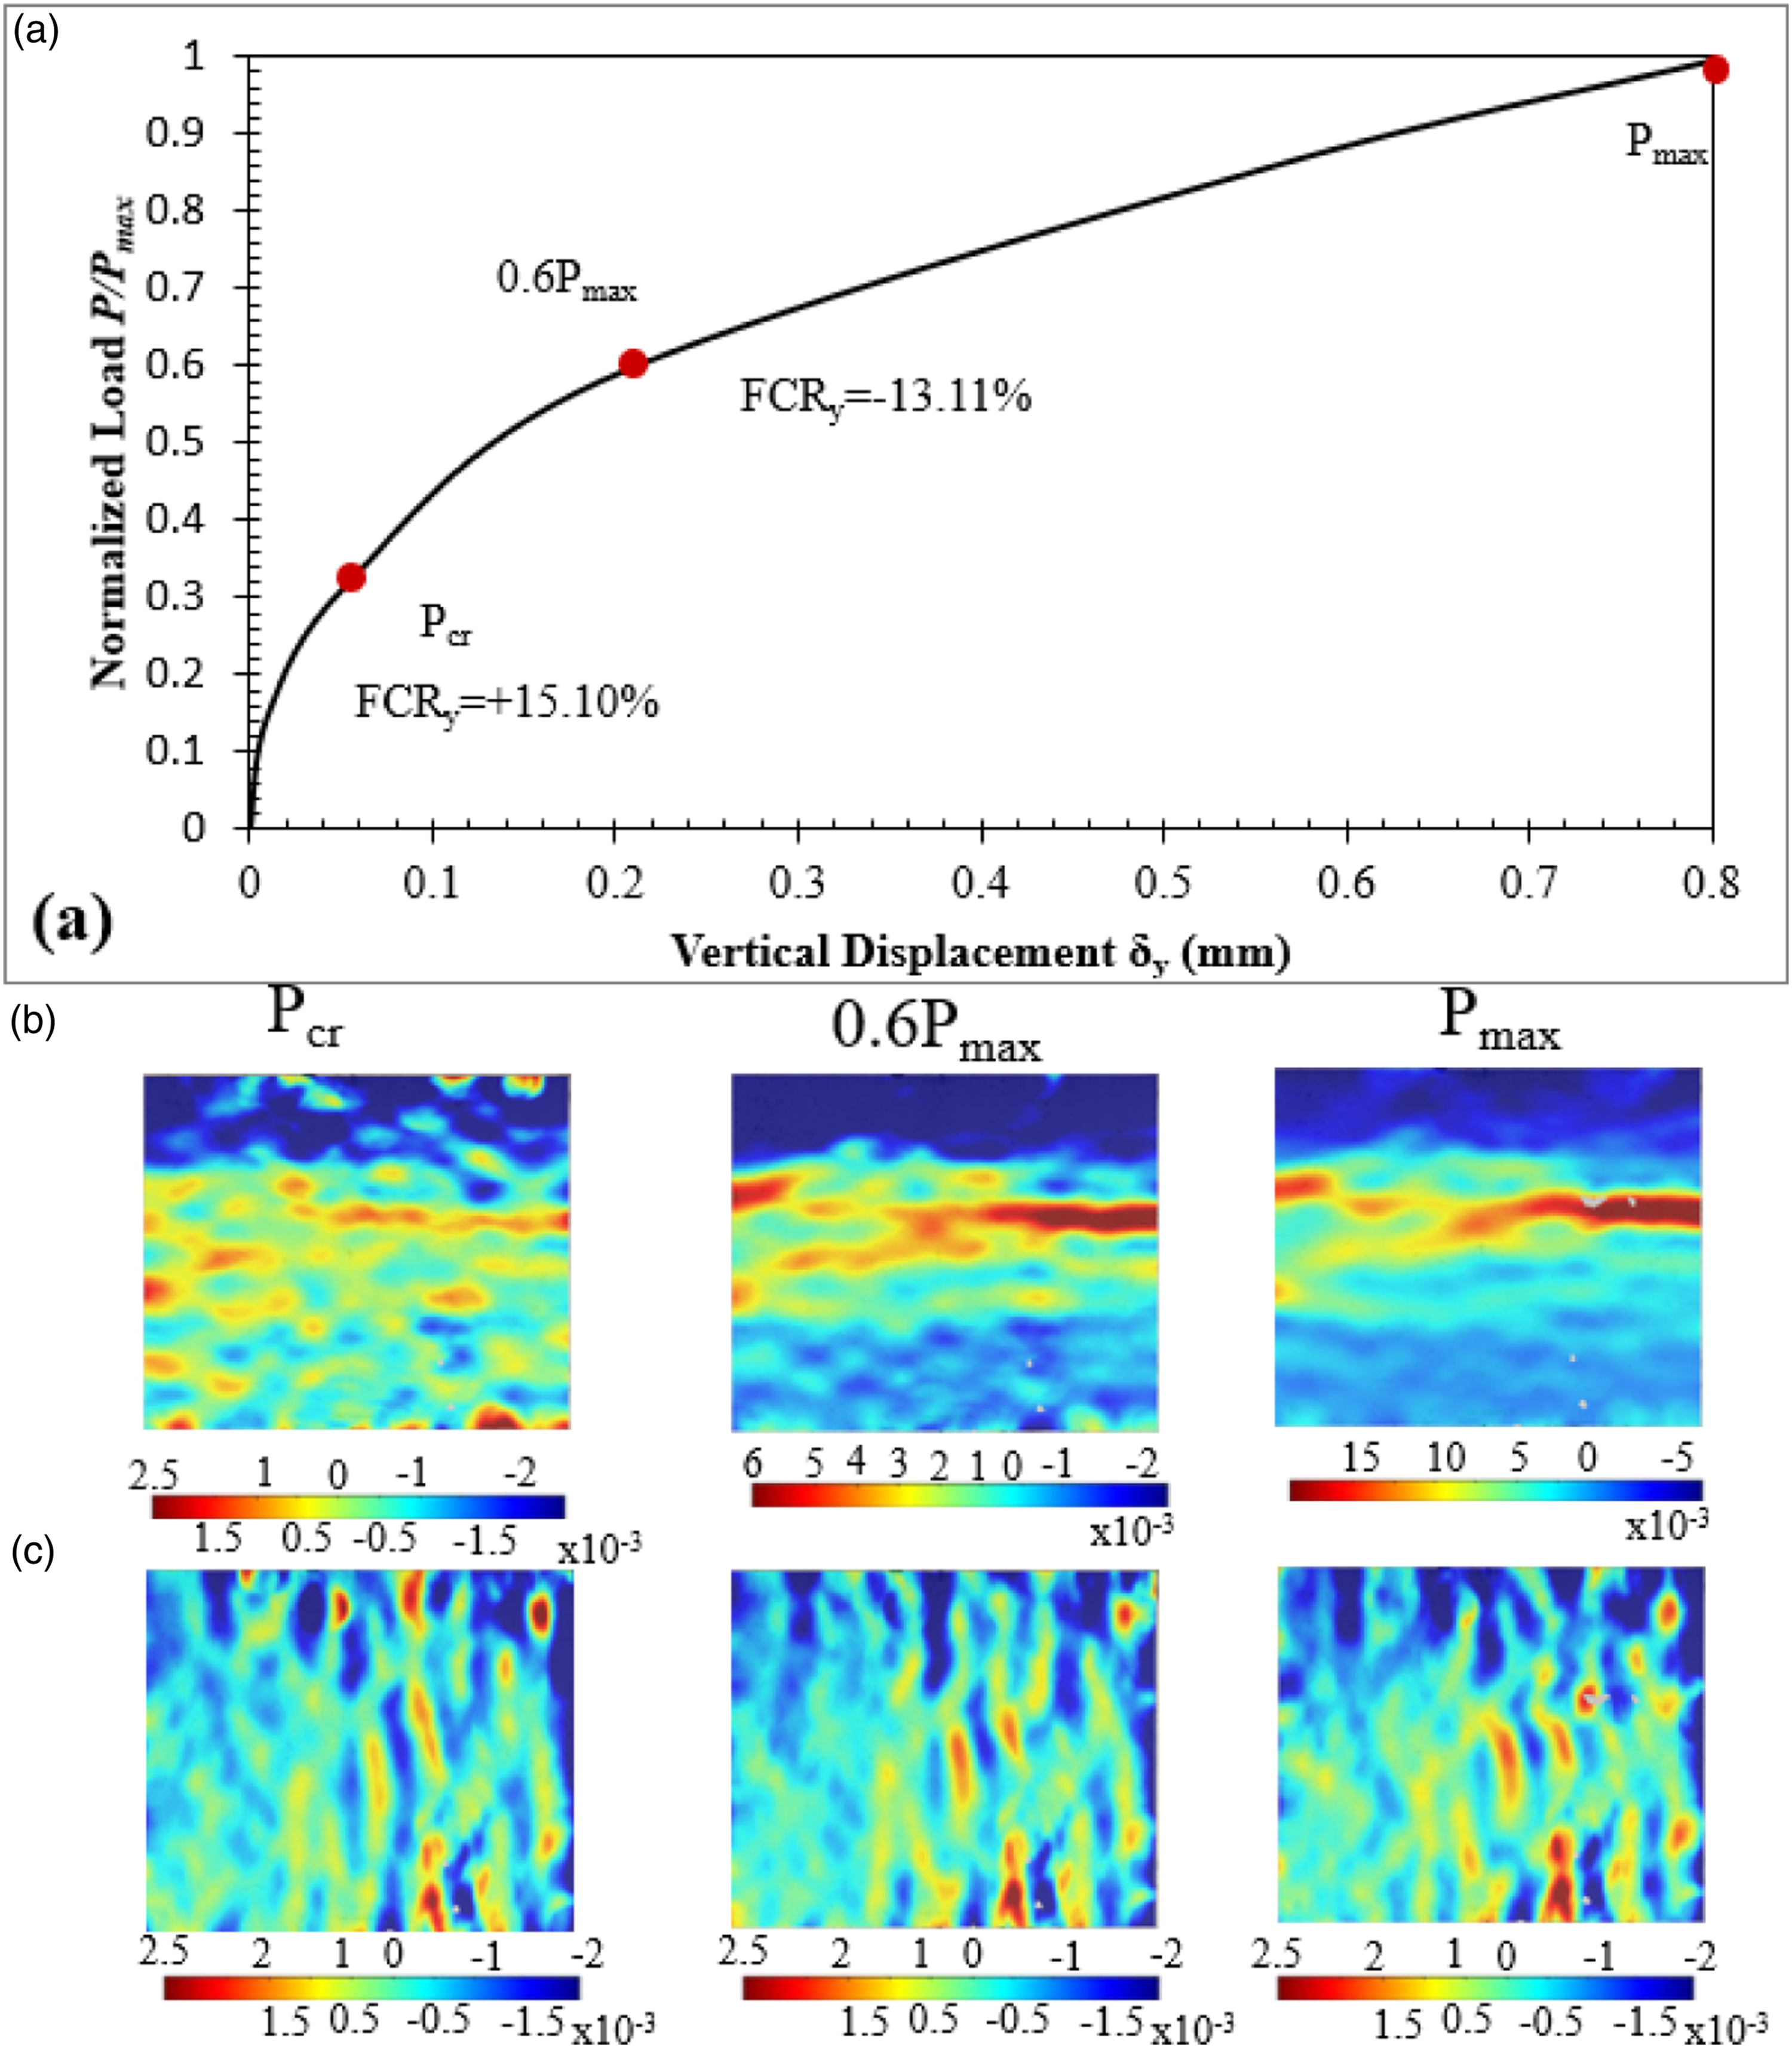
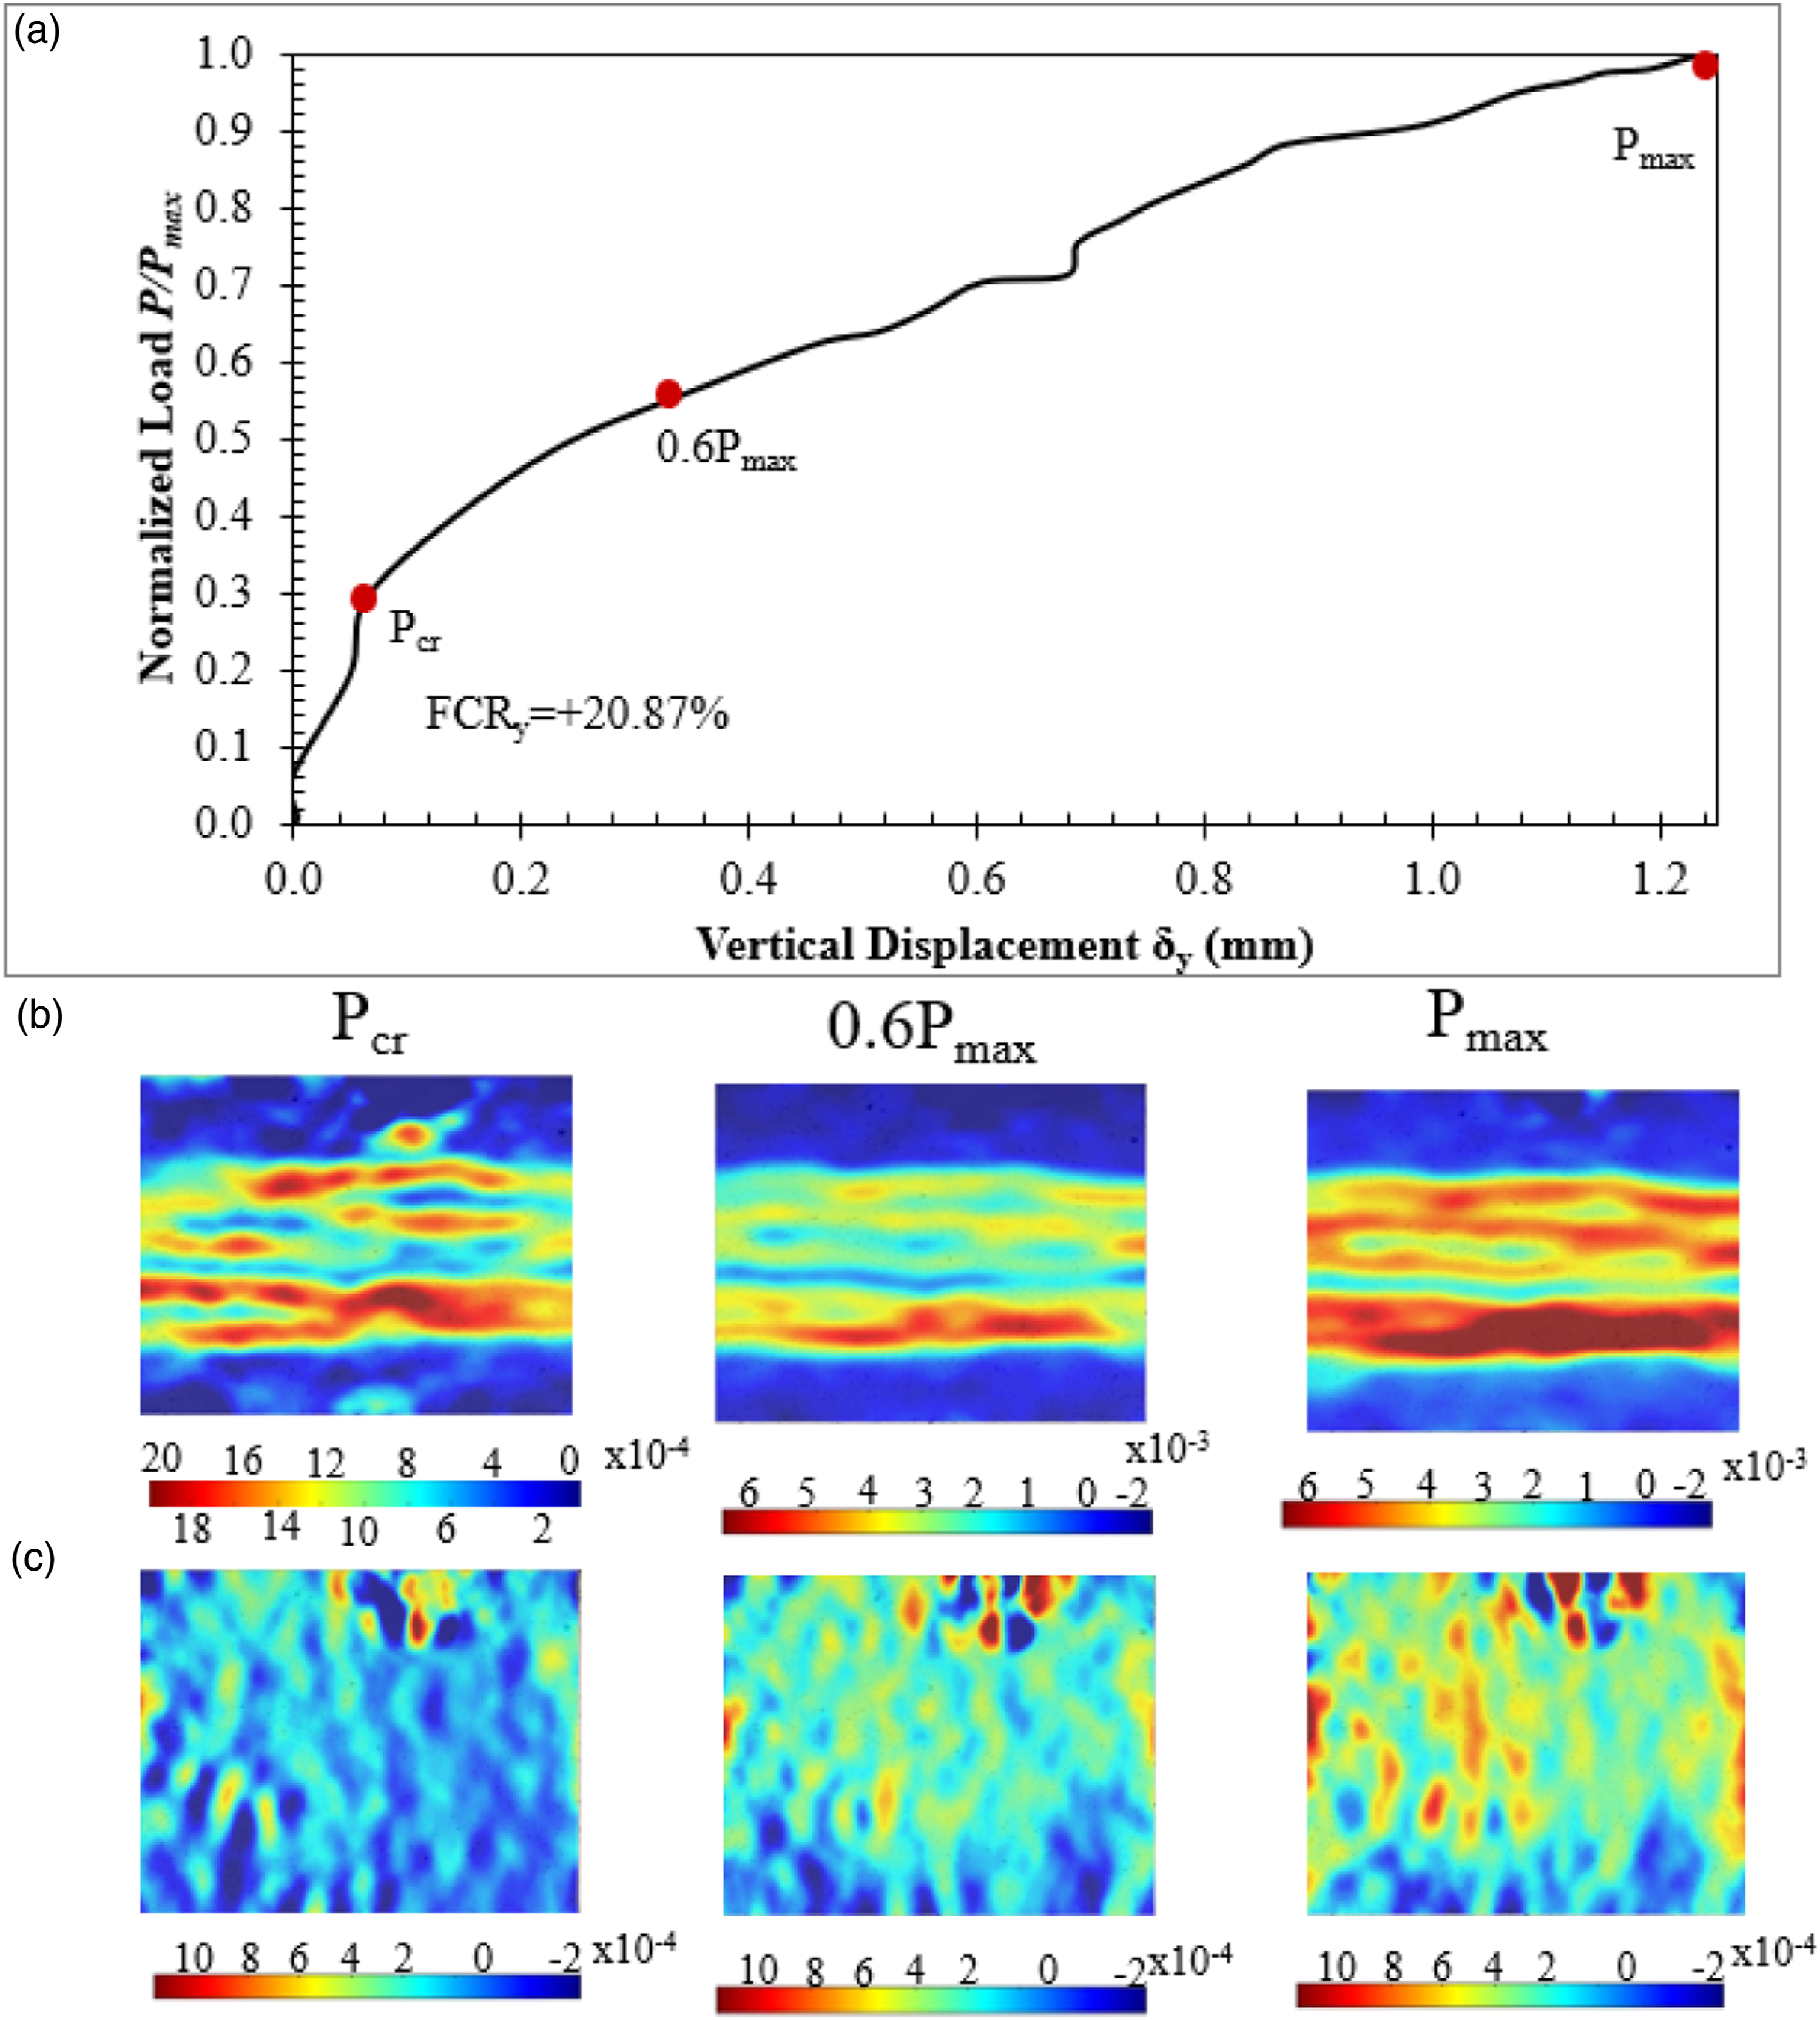
The normalized load-deflection curves from the OPB specimens are presented in Figures 13–15. In all three specimens, the expected cracking load calculated from equation (3b) which was found between 30%–32% of the ultimate load (Table 4), is associated with an increase in resistivity in the y direction between 15%–20%. After the cracking load was reached, the FCR in the vertical direction was reduced significantly. In the case of self-sensing in the horizontal direction, the resistivity was found to be reduced by 5%–17% at cracking. Reduction in the resistivity in the x direction is associated with the compression due to Poisson’s effect. In compression, the distance between the functional nanofillers (CNFs) in the matrix is reduced leading to improvement of the conductive network, and thus, a reduction of the resistivity (Han et al., 2014). It is also observed that in the hardening range, between the cracking load and the maximum, there is instantaneous decrease in resistivity FCRy for specimens OPB1 and OPB2 at that point by -14% and -13%, respectively. This can be correlated to the maximum difference between the compression and the tension zone found from a layered analysis of the cross-section subjected to OPB (Appendix). Finally, Table 4 also summarizes the measurements performed at the ultimate load (FCRmax). (a) Normalized load-deflection for specimen OPB1; surface strain fields from DIC analysis for characteristic P points in (b) y direction; and (c) x direction. (a) Normalized load-deflection for specimen OPB2; surface strain fields from DIC analysis for characteristic P points in (b) y direction; and (c) x direction. (a) Normalized load-deflection for specimen OPB3; surface strain fields from DIC analysis for characteristic P points in (b) y direction; and (c) x direction. Piezoresistive properties of OPB specimens.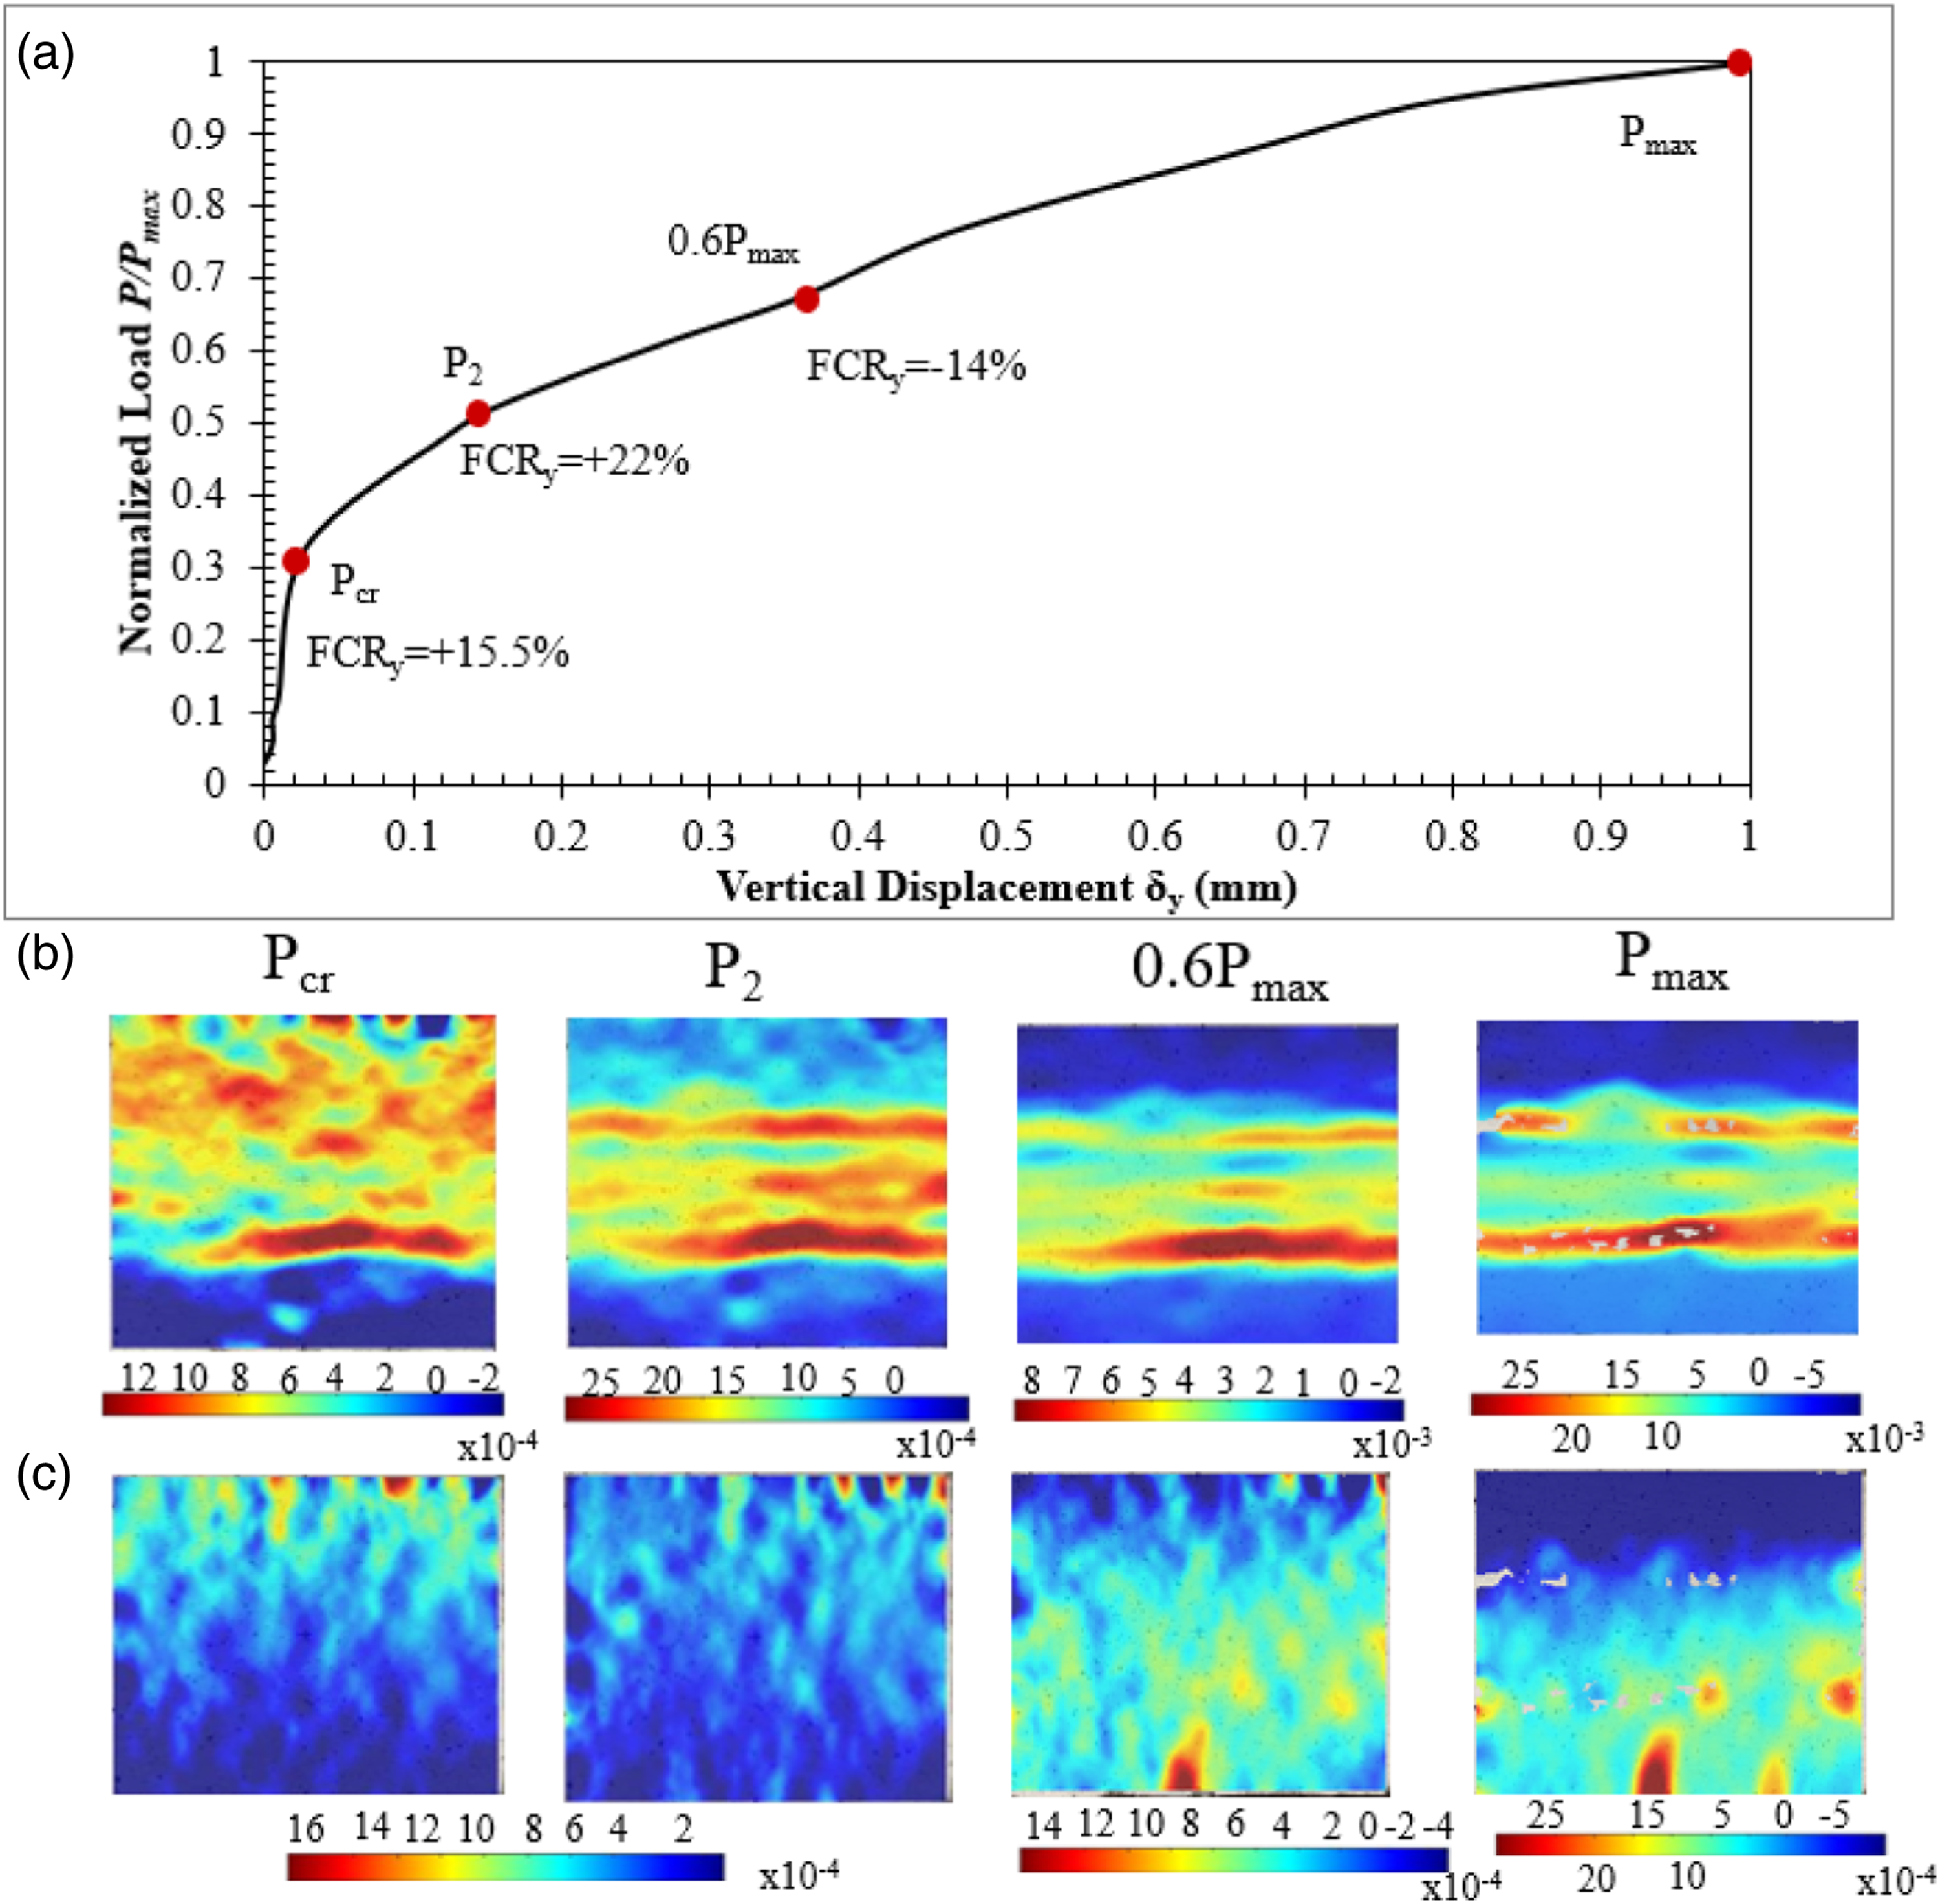

Comparison with current literature
As already mentioned above there are limited studies on the self-sensing behaviour of nanoengineered UHPC under tension (direct tension and pure flexure) (You et al., 2017; Yoo et al., 2018; Lee et al., 2018). These studies mainly investigated the self-sensing performance of non-proprietary UHPC that contained steel fibers and CNTs at different contents with the latter to range between 0.1%–0.5% by volume. The self-sensing testing was performed using conventional wired sensing methods, more specifically the four-probe embedded electrode method under AC. In these studies, it had been found that intermediate and higher contents (0.3 and 0.5%) demonstrated better sensing ability compared to 0.1% volume fraction.
The study presented in this paper is the first study that reports successful self-sensing capabilities for nanoengineered UHPC with CNFs at a mass content of 0.03% which is the equivalent of a volume fraction less than 0.1% - this is important from a practical perspective, because higher CNF contents reduce the workability and flowability of the mix. Most importantly, it has been shown that sensing can be done remotely, using a new wireless approach. It was shown that this approach was not only able to capture the onset of cracking and the hardening zone, up to the maximum load, but also through resistivity measurement it could be used as a means for non-destructive assessment of fiber orientation.
Conclusions
A nanoengineered UHPC containing 5 × 10¹⁹ of CNFs per m3 of UHPC (at 0.1% volume ratio) and 2% by volume steel fibers was used in this study to explore the potential use of the material’s electrical permittivity as a means for self-sensing in the detection of concrete cracking. Different specimen types were fabricated and subjected to direct tension, four-point flexure, and out-of-plane bending, each creating different patterns of tension strain fields and cracking. The mechanical tests were conducted while at the same time monitoring the change in the materials’ resistivity in directions parallel to and crossing the cracks. The material had tension-hardening properties, with an average uniaxial compressive strength of 148 MPa, ultimate tensile strength of 8.7 MPa, whereas the tension-hardening ratio (f
t
/f
cr
) was 1.6. The addition of the CNF dilution increased the first peak strength in flexural tests, compared to other UHPCs of the same compressive and tensile strength. Regarding the self-sensing performance of this investigation, the following could be concluded: • The micro-fiber distribution, which is highly dependent on casting method and specimen geometry had a significant effect on the electrical properties of the material. Specimens with enhanced fiber alignment had less polarization time drift. Moreover, the effect was also evident in the case of directional resistivity measurements, as the resistivity in the direction of casting was systematically lower than in the other direction. • A wireless resistivity device is an effective means for measuring resistivity; this opens up the opportunity for using this as a non-destructive method for the assessment of fiber distribution. • The FCR curve was strongly correlated with the evolution of cracking and could be used to identify the onset of cracking. In all specimens, after a decrease in resistance due to microcracking, a sharp increase in the resistance was observed as the mechanical load-displacement curve developed a post-peak descent. This is an important feature as it indicated that the nanoengineered UHPC exhibits self-sensing capacity even after localization of cracking under tension. • The proposed wireless sensing approach was able to capture the first cracking, but also the Poisson’s effect due to loading. However, the nature of the test and the limitations of the specimen geometry perplexed the interpretation of the results. Further research is needed in order to develop a wireless non-destructive method for cracking detection.
Footnotes
Acknowledgments
The authors wish to acknowledge the support from Giancarlo Ayala-Charca and the Electrical Engineering and Computer Science Department at York University who provided the electrical equipment for the wired resistance method. Materials were generously donated by ceEntek Canada.
Declaration of conflicting interests
The authors declared no potential conflicts of interest with respect to the research, authorship, and/or publication of this article.
Funding
The author(s) disclosed receipt of the following financial support for the research, authorship, and/or publication of this article: Funding for the work was provided by NSERC-Canada, DG grant of the third author.