
Abstract
In order to further demonstrate the effectiveness of engineered cementitious composites (ECC) in repairing and strengthening the post-earthquake damaged structure, at the overall structural level, experimental and numerical comparative analysis of structural seismic performance before and after “retrofitted with ECC” is conducted in this paper. A 1:2-scale reinforced concrete frame is tested under cyclic reversed loading and a new ECC material’s constitutive model is proposed in this paper for improving the accuracy and feasibility of numerical modelling. The modelling method and newly proposed constitutive model of ECC has been demonstrated to be workable and accurate. Based on numerical and experimental data, the increase of the average yielding displacement after the installation of ECC is relatively significant (80.4% to 156.4%), and the repairing method using ECC in post-earthquake damaged RC frame can restore and even exceed the original frame’s load bearing capacity. Comparing the ultimate inter-story drift ratio, the ratio with ECC is about 31.0% higher, indicating that ECC has good deformation capacity and the usage of ECC is indeed an effective method to improve deformation capacity in repairing and strengthening post-earthquake damaged structures. The results confirm the effectiveness and superiority of retrofitting ECC in post-earthquake damaged structures for the reason that the repaired structure can reach the same level of seismic performance as the original structure. The “repairable” characteristic can be used in the design of earthquake resilient structures.
Keywords
Introduction
Reinforced concrete (RC) frame structures have the advantages of good integrity, high strength and good seismic performance which are widely used in various construction projects (Sosso and Berke, 2023; Xu et al., 2018). However, due to the relatively small lateral stiffness, damage often occurs after strong earthquake actions (Civil et al., 2008; Gong et al., 2013; Kamogawa et al., 2005). For those post-earthquake damaged structures, it would be too costly to totally rebuild, while the option of strengthening and repairing can improve the seismic performance of the structure with a smaller increase in investment (Khan et al., 2022; Prota et al., 2004; Yuan and Hu, 2021). Therefore, the importance of post-earthquake strengthening research has been attracted much attention (Fischer and Li, 2003; Mosallam et al., 2019).
Engineered cementitious composites (ECC) is a kind of ultra-ductile fiber reinforced cementitious composites and it is developed for applications in the large material volume usage, cost sensitive construction industry (Ding et al., 2022; Li, 2003; Li et al., 2002; Yuan et al., 2022). ECC exhibits a remarkable pseudo-strain-hardening tensile behavior with a strain capacity reaching up to 5% (Civil et al., 2008; Gong et al., 2013; Li et al., 2019; Li, 2003; Li et al., 2001), which not only provides extraordinary damage tolerance, high tensile ductility, and energy dissipation capacity under extreme loads, but also ensures desired durability under service accidents (Cai et al., 2020; Sahmaran et al., 2008). Further, nowadays, the philosophy of earthquake resilience has drawn more and more attention of scholars. Hence, ECC can be a good choice to implement the earthquake resilience function, and there have been many investigations on mechanism and seismic performance of ECC material. Further, the usage of ECC in repair and restoration has also been deeply analyzed and investigated both numerically and experimentally (Dadmand et al., 2022).
In recent years, ECC has been widely used for engineering repairment projects. Kanda T et al. (Canbolat et al., 2005; Kanda et al., 2011) tested beams installed with ECC and found that ECC can successfully enhance the structural performance of seismic resistant elements. Billington et al. (Billington et al., 2009; Kyriakides and Billington, 2014) found that the usage of ECC can change the traditional frame’s brittle failure with the improvement of load bearing and deformation capacities. Esmaeeli et al. (Esmaeeli et al., 2013) applied a single layer of ECC into masonry beams to assess the strengthening ability and confirmed the effectiveness of ECC (a thin layer). Afefy et al. (Afefy and Mahmoud, 2014) put the emphasis on slab element and their experimental results showed that ECC-strengthened slabs can remarkably enhance their both serviceability and load carrying capacity.
There are also numerous investigations on numerical simulations. Li et al. (Li et al., 2022) analyzed the influence of axial compression ratio of different ECC frame joints with the modelling of ECC material. Thanh et al. (Thanh et al., 2020) developed a 3D numerical model for ECC’s flow behavior. Gencturk et al. (Gencturk, 2011; Gencturk and Elnashai, 2013) proposed a cyclic constitutive model for ECC and tested compared with RC column under cyclic loading. Zhang et al. (Huang and Zhang, 2016; Li et al., 2019; Zheng et al., 2018) also aimed for proposing a suitable constitutive model of ECC and verified its accuracy. With the adoption of newly proposed ECC’s constitutive model, Cai et al. (Cai et al., 2020) conducted parameter analysis of ECC-encased columns and investigated its failure mechanism and processes under reversed cyclic loading conditions.
It can be seen that there have been many achievements realized in the analysis of ECC. However, there are still some limitations. Firstly, most studies that demonstrate the effectiveness of ECC are the comparation between RC elements with/without ECC. Considering post-earthquake repairment, the comparation may be more suitable to be conducted between “before” and “after” repairing. Secondly, it can be found that most of experimental tests focus on elements (such as beam, column, slab or wall); although the study of elements can provide an important reference for the overall structure, if wanting to further evaluate the post-earthquake strengthening performance of a whole structure, the overall structural experiment and numerical simulation are still needed.
In summary, this paper conducts an experimental study of post-earthquake reinforced concrete frame structures retrofitted with ECC. Based on the understanding of ECC’s mechanism, a new ECC constitutive model is proposed, and the Python is used to secondary develop the principal structure model of the material for the finite element software Abaqus. Combined with the experimental data, the frequency, load bearing capacity, energy dissipation performance, structural damage and other parameters are fully analyzed to demonstrate the effectiveness of ECC in post-earthquake structural repairing. It is expected to provide reference for similar engineering applications.
Constitutive model for ECC material
Figure 1 schematically shows the proposed constitutive model for ECC and the commonly used concrete constitutive model. The progressing of the curve is indicated according to the numbers from smallest to largest. The main difference between these two models is in the tensile stage. Constitutive models adopted in ABAQUS: (a) ECC; (b) common concrete. Nomenclature: 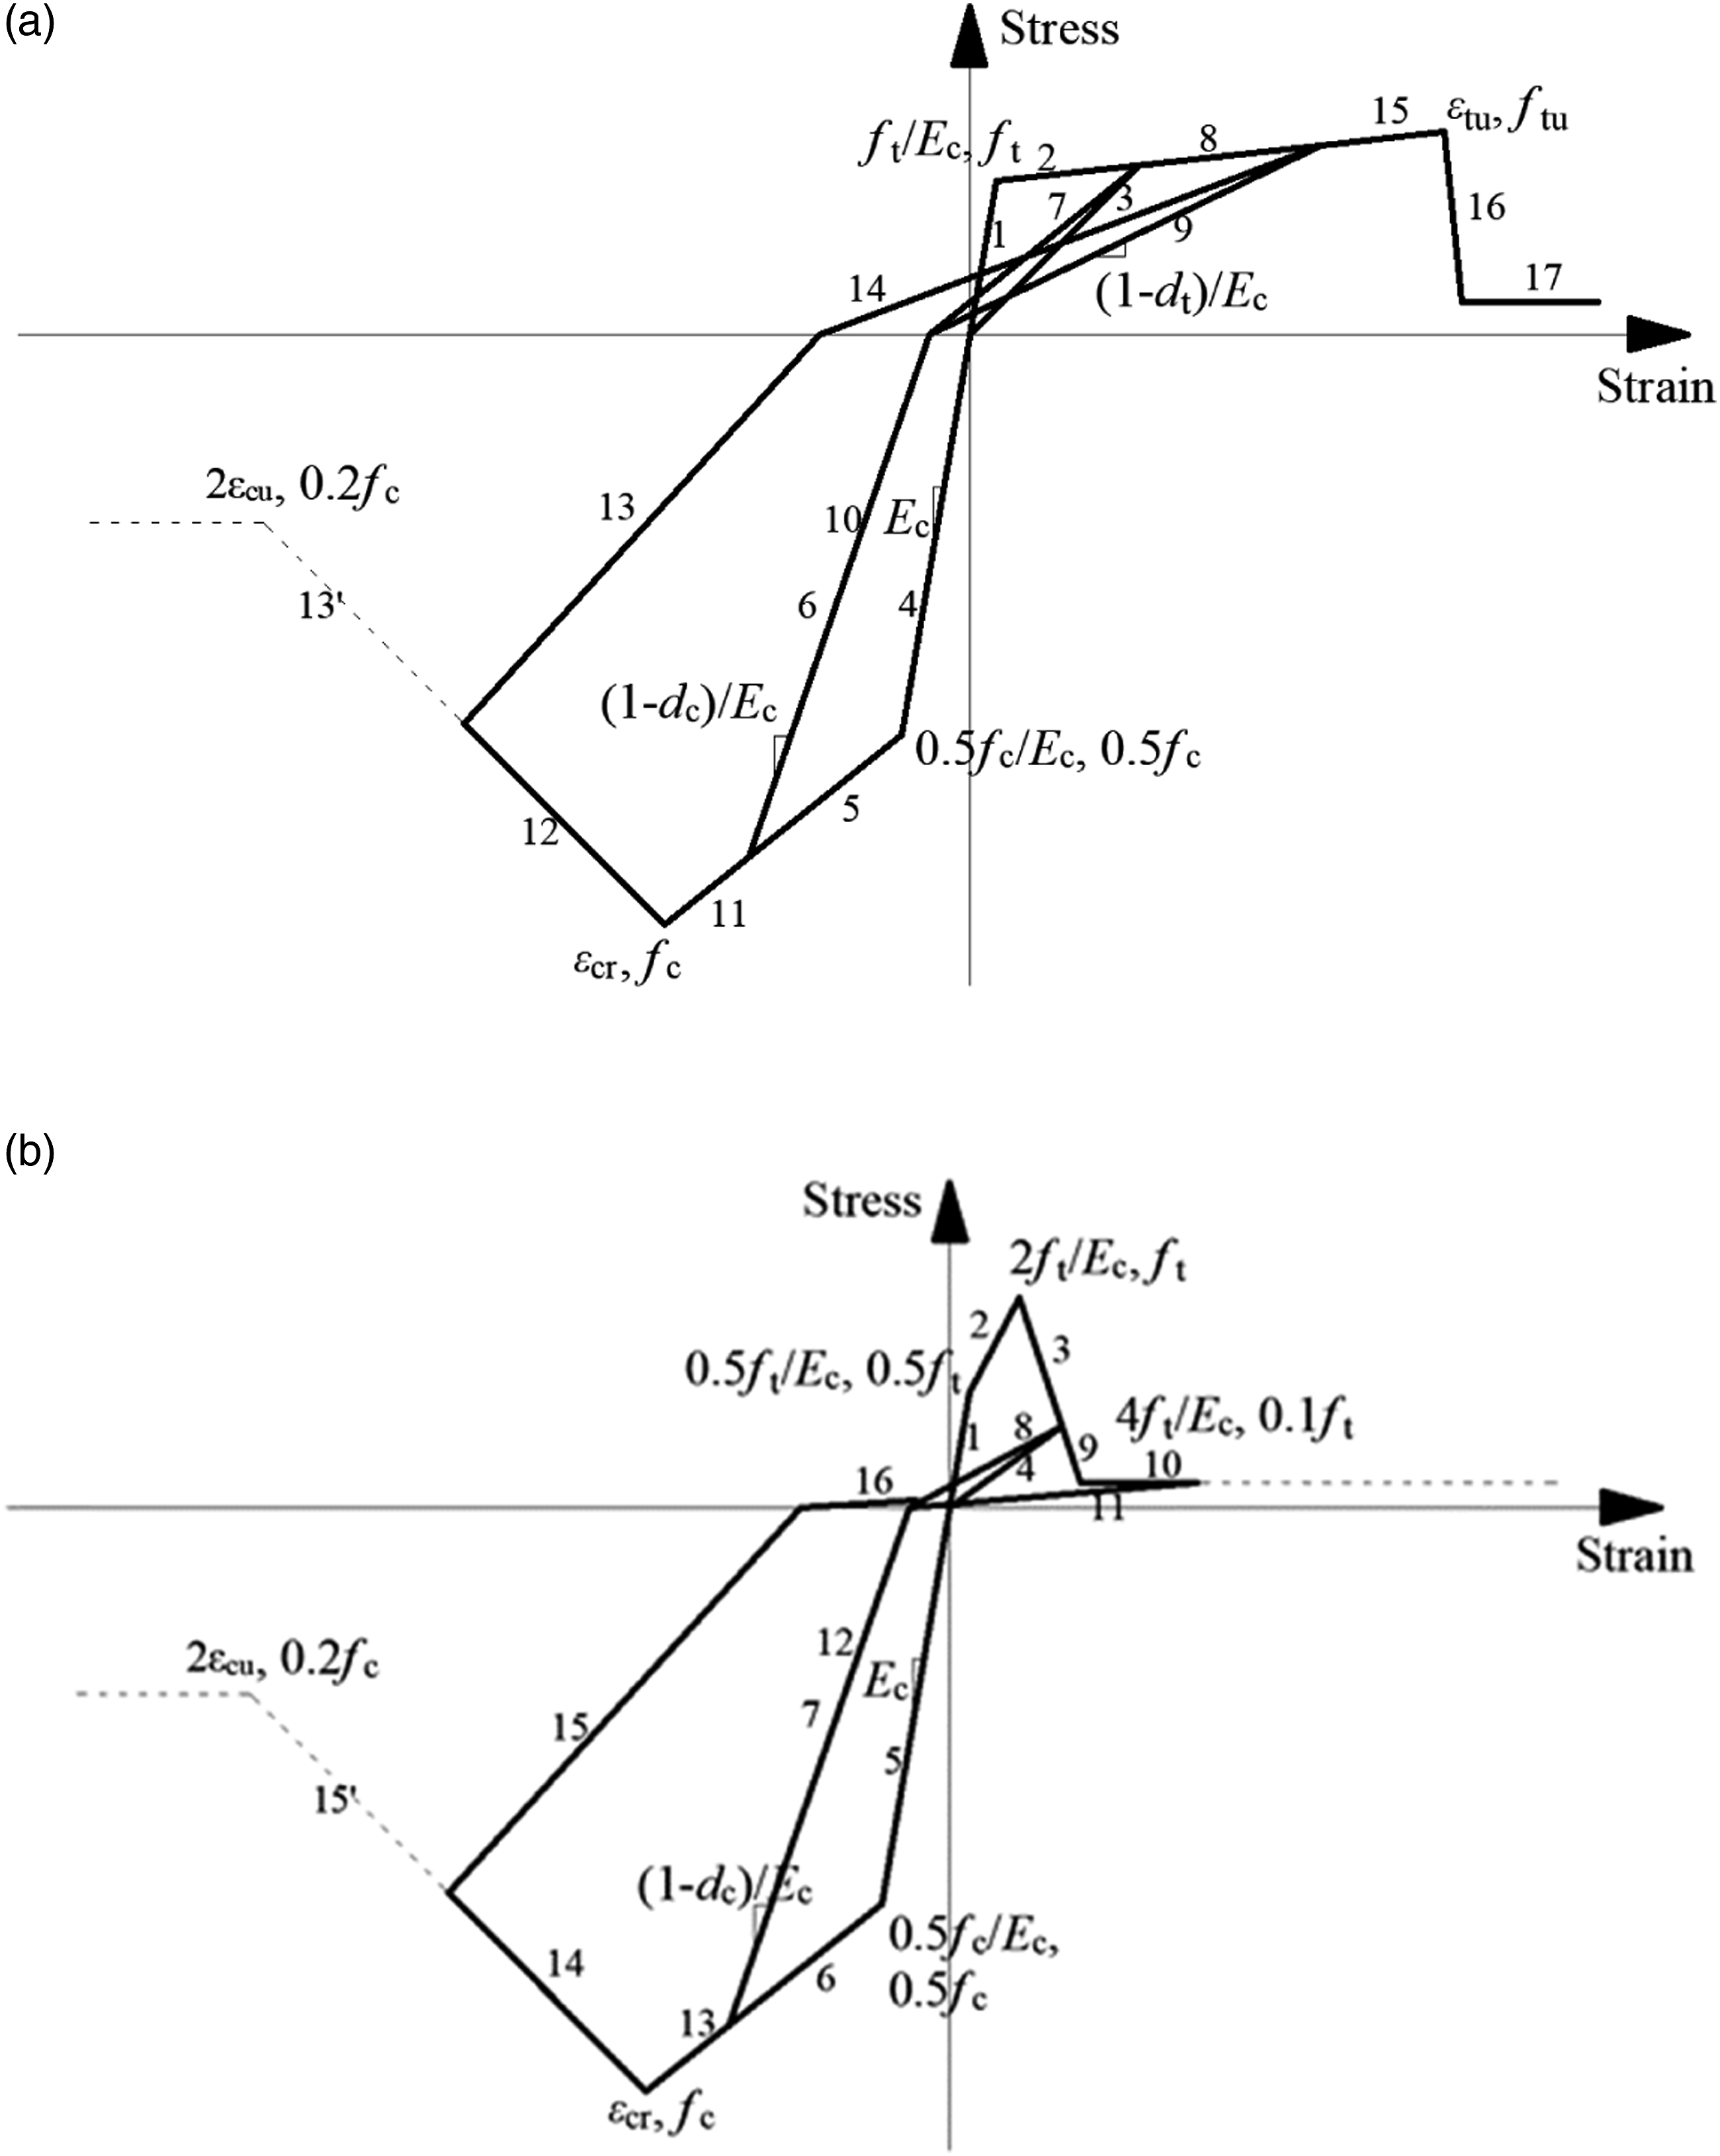
As for commonly used model, before the stress reaches up to 0.5f t , the curve keeps in elastic stage (Line NO.1 in Figure 1(b)); when the stress reaches the level of tensile strength (f t ), there will be tensile damage occuring while the skeleton curve continues to rise to the tensile strength (f t ) with the strain level of 2f t /E c (Line NO.2 in Figure 1(b)); after reaching the level of f t , the concrete tensile stress level will decrease rapidly (Line NO.3 in Figure 1(b)) until it remains stable at the level of 0.1f t (Line NO.10 in Figure 1(b)).
As for ECC, considering good ductility of ECC material, the curve keeps linear before the stress level reaches up to f t (Line NO.1 in Figure 1(a)); after that, the tensile stress continues to rise up until reaching the ultimate tensile strain and ultimate strength with brittle damage (Line NO.2 in Figure 1(a)); finally, the stress decreases rapidly to the level of 0.1f t (Line NO.16 and NO.17 in Figure 1(a)).
The laws of unloading of these two materials are also the same. When there is no plastic compressive deformation, regardless of the stage of tensile stress, the unloading curves all point to the initial origin, which are shown in Line NO.3 in Figure 1(a) and Line NO.4 in Figure 1(b). When there appears the plastic compressive deformation, the unloading curves all point to the point with unloading stiffness, which are just like Line NO.6 in Figure 1(a) and Line NO.7 in Figure 1(b). The unloading stiffness is calculated according to the theory proposed by Najar energy method (Krajcinovic and Lemaitre, 1987) ((1- d c )/E c and (1-d t )/E c ). Python is used to secondary develop the principal structure model of the material for the finite element software Abaqus.
Experimental and numerical validation of constitutive model for ECC
Experimental test
The original testing frame, named as CF (shown in Figures 2 and 3), is a 3-layer reinforced concrete frame (on scale of 1:2) with the total height of 4.5m and total span of 5.4m. The section size of beam is 120mm*120mm and the column section size is 200mm*200mm. Reinforcement details of CF (mm). Specimen.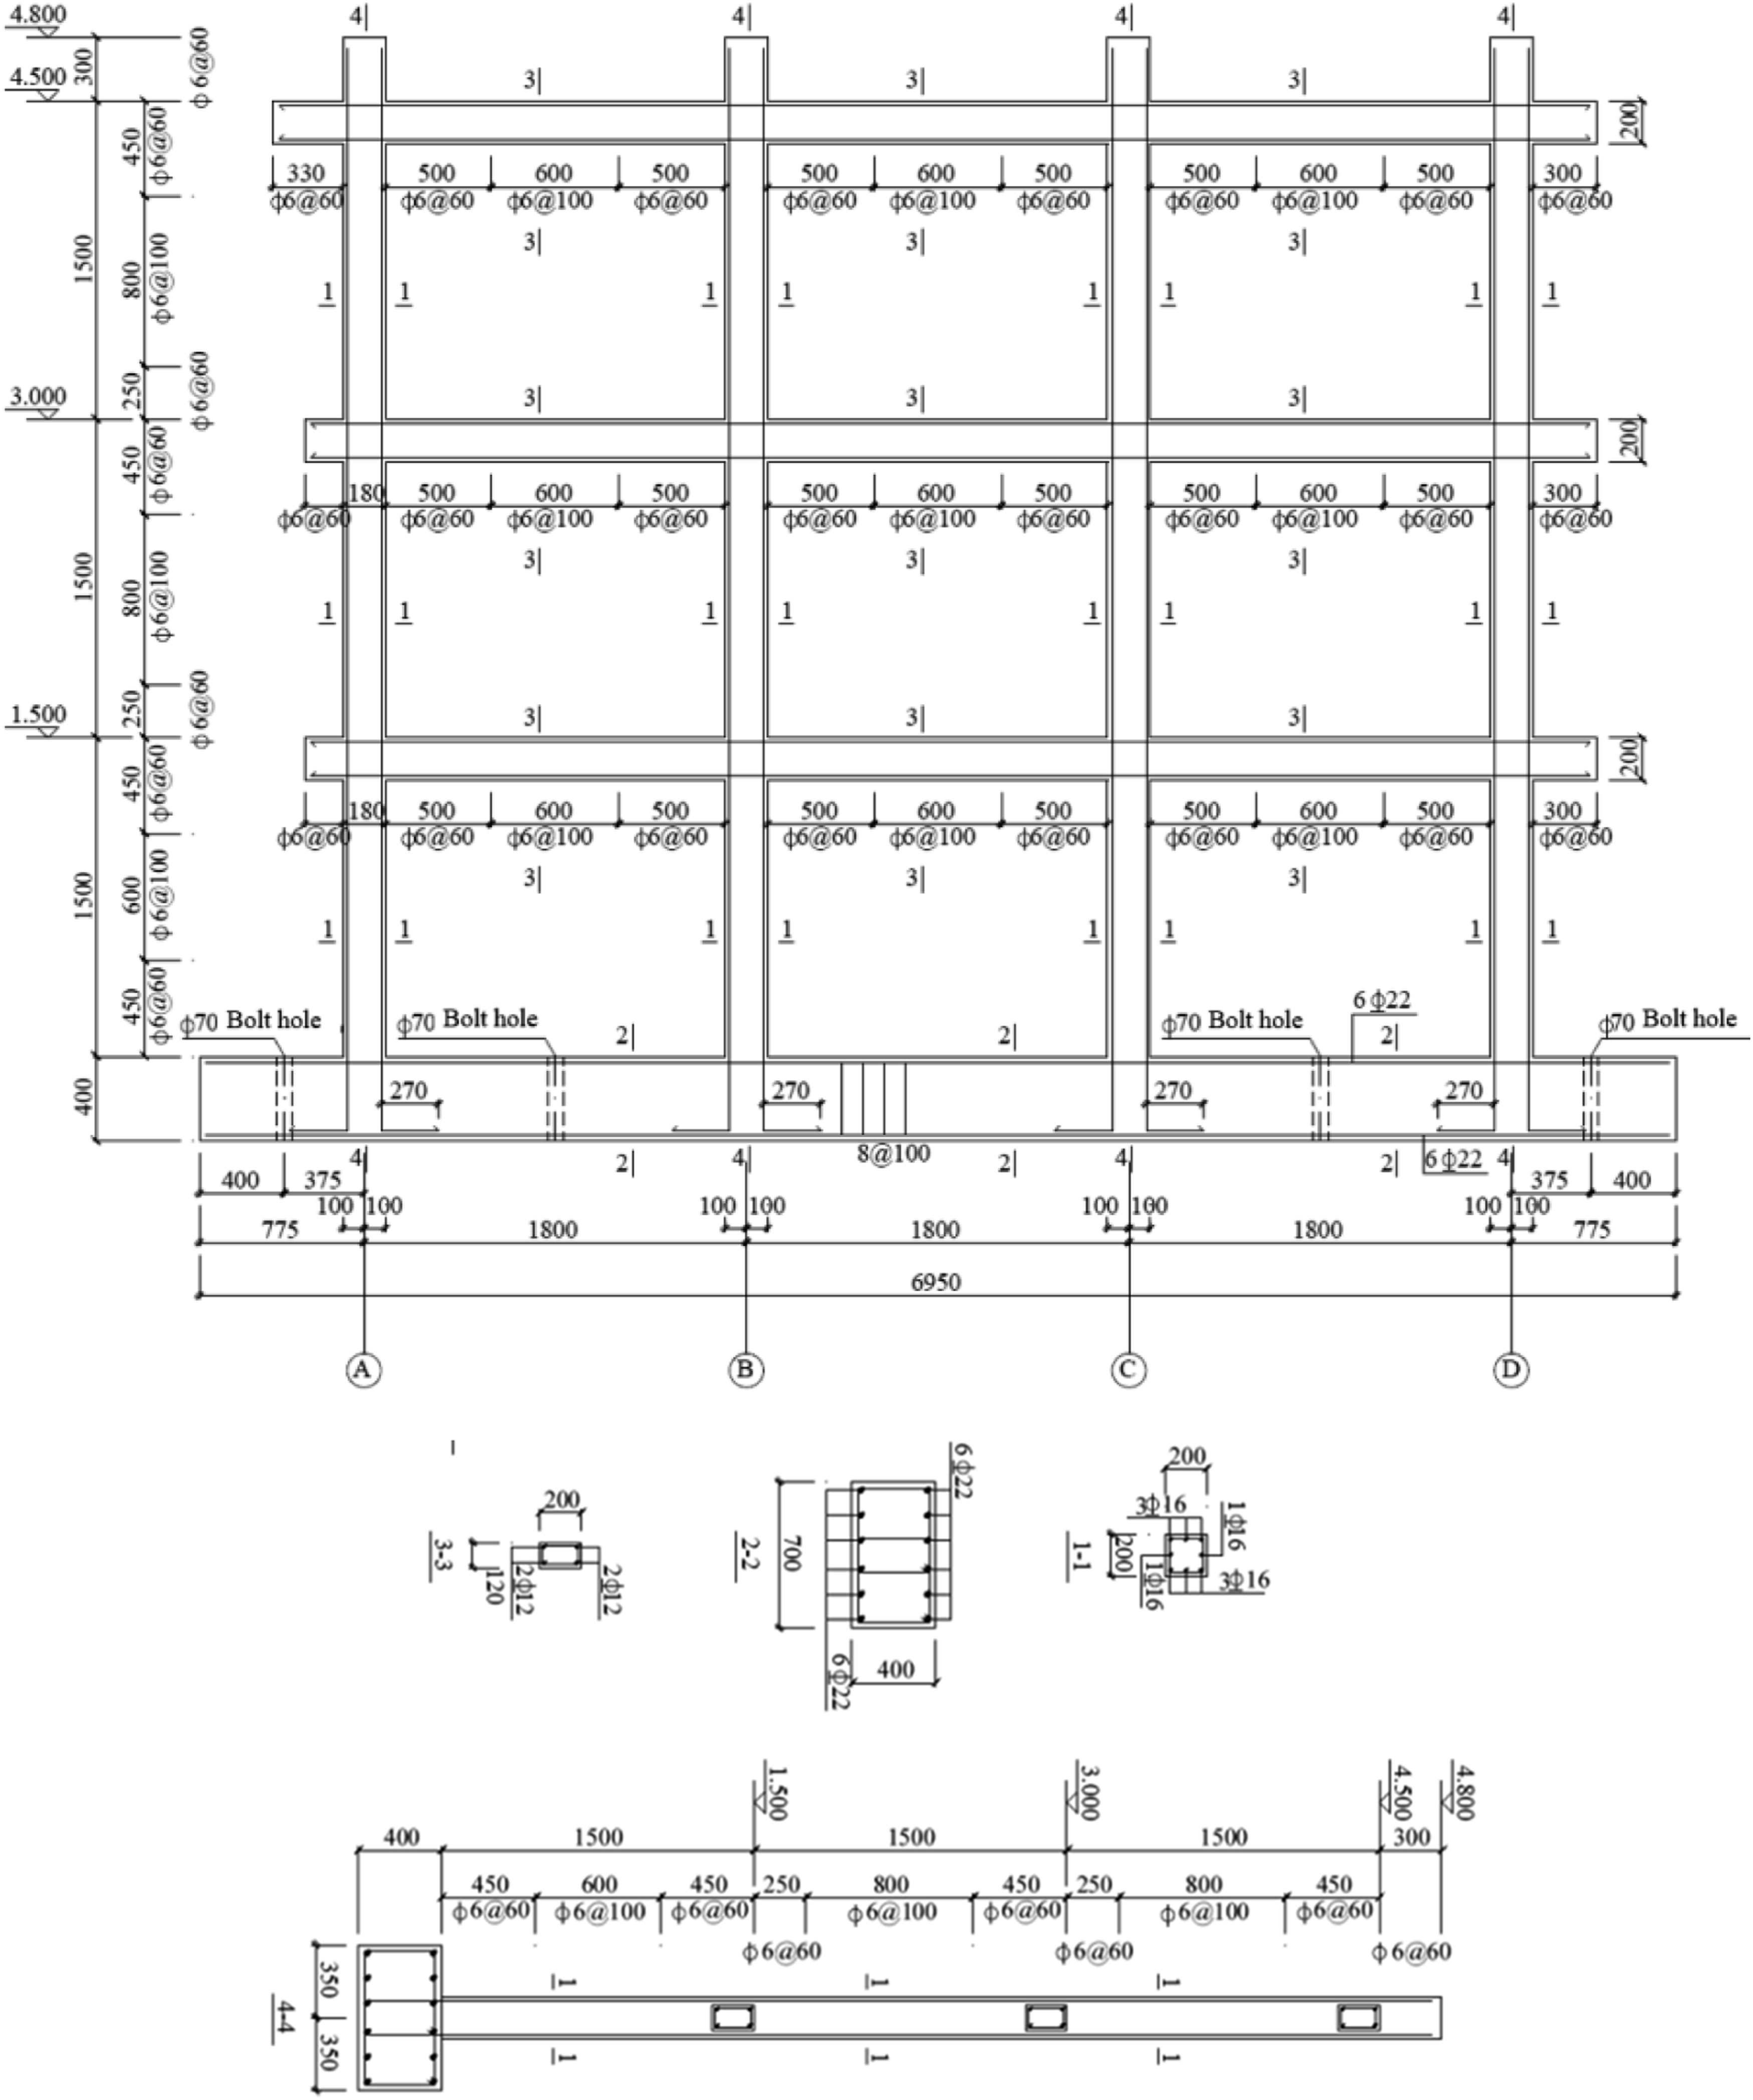
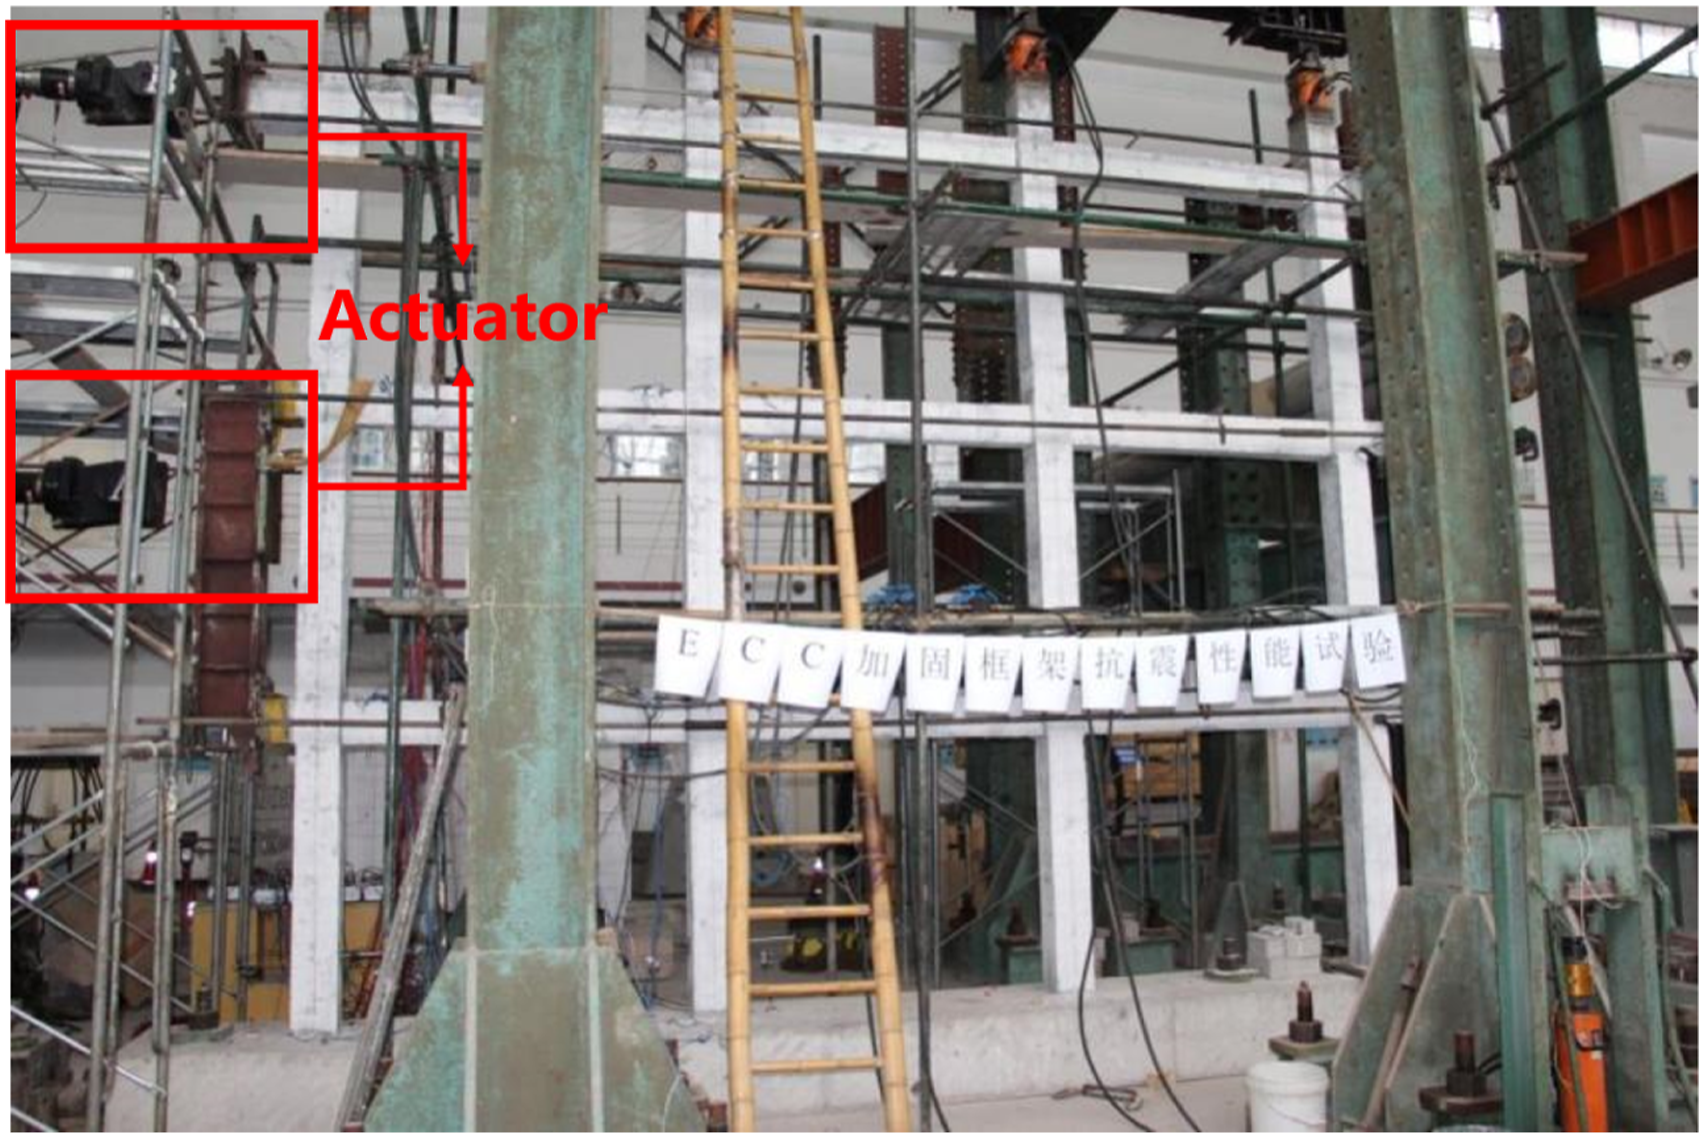
The cyclic loading is chosen for damage testing until the CF is regarded as “failure” (the load is reduced to 85% of the peak load). The loading process of CF is controlled both by force and displacement. Firstly, the increment of force is 10kN and is set to be recycled once at each grade; when the load is up to ±30kN, there are numerous cracks in the RC frame and at this time, the loading process is transformed to be controlled by displacement and the increment is 15mm and it is set to be recycled three times at each grade. When the displacement reached up to ±195mm, the load is reduced to 85% of peak load and the specimen is regarded as “failure”, hence the loading is stopped. The main damage mode of CF is as follows (Figure 4): some of the concrete at the end of the beam is crushed off and some reinforcements are pulled off; large parts of concrete fall off. Damage of CF: (a) the end of the beam; (b) falling off of concrete.
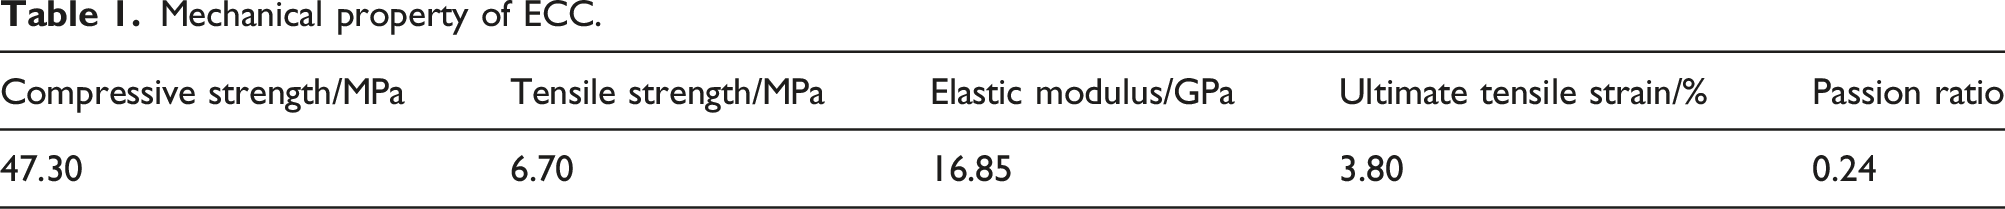
According to the damage of CF, the following scheme is adopted for repairing and strengthening (Figure 5): all parts of the concrete in the plastic hinge zone at the end of beams are totally removed away, and all damaged reinforcements are welded with new short reinforcements and then those positions are filled with ECC; as for the positions where concrete falls off, the “loose” concrete is removed and then those positions are retrofitted with ECC. The repaired reinforced concrete frame (retrofitted with ECC) is named as CFS. The mechanical property of ECC is listed in Table 1. The mixing ratio of ECC adopted in this paper is: “cement: fly ash: sand: water = 1: 2.33: 0.72: 0.96”. The volume ratio of polyvinyl alcohol (PVA) fibers added is 2.5%. Repairing with ECC: (a) removal of concrete and welding reinforcements; (b) retrofitted with ECC. Mechanical property of ECC.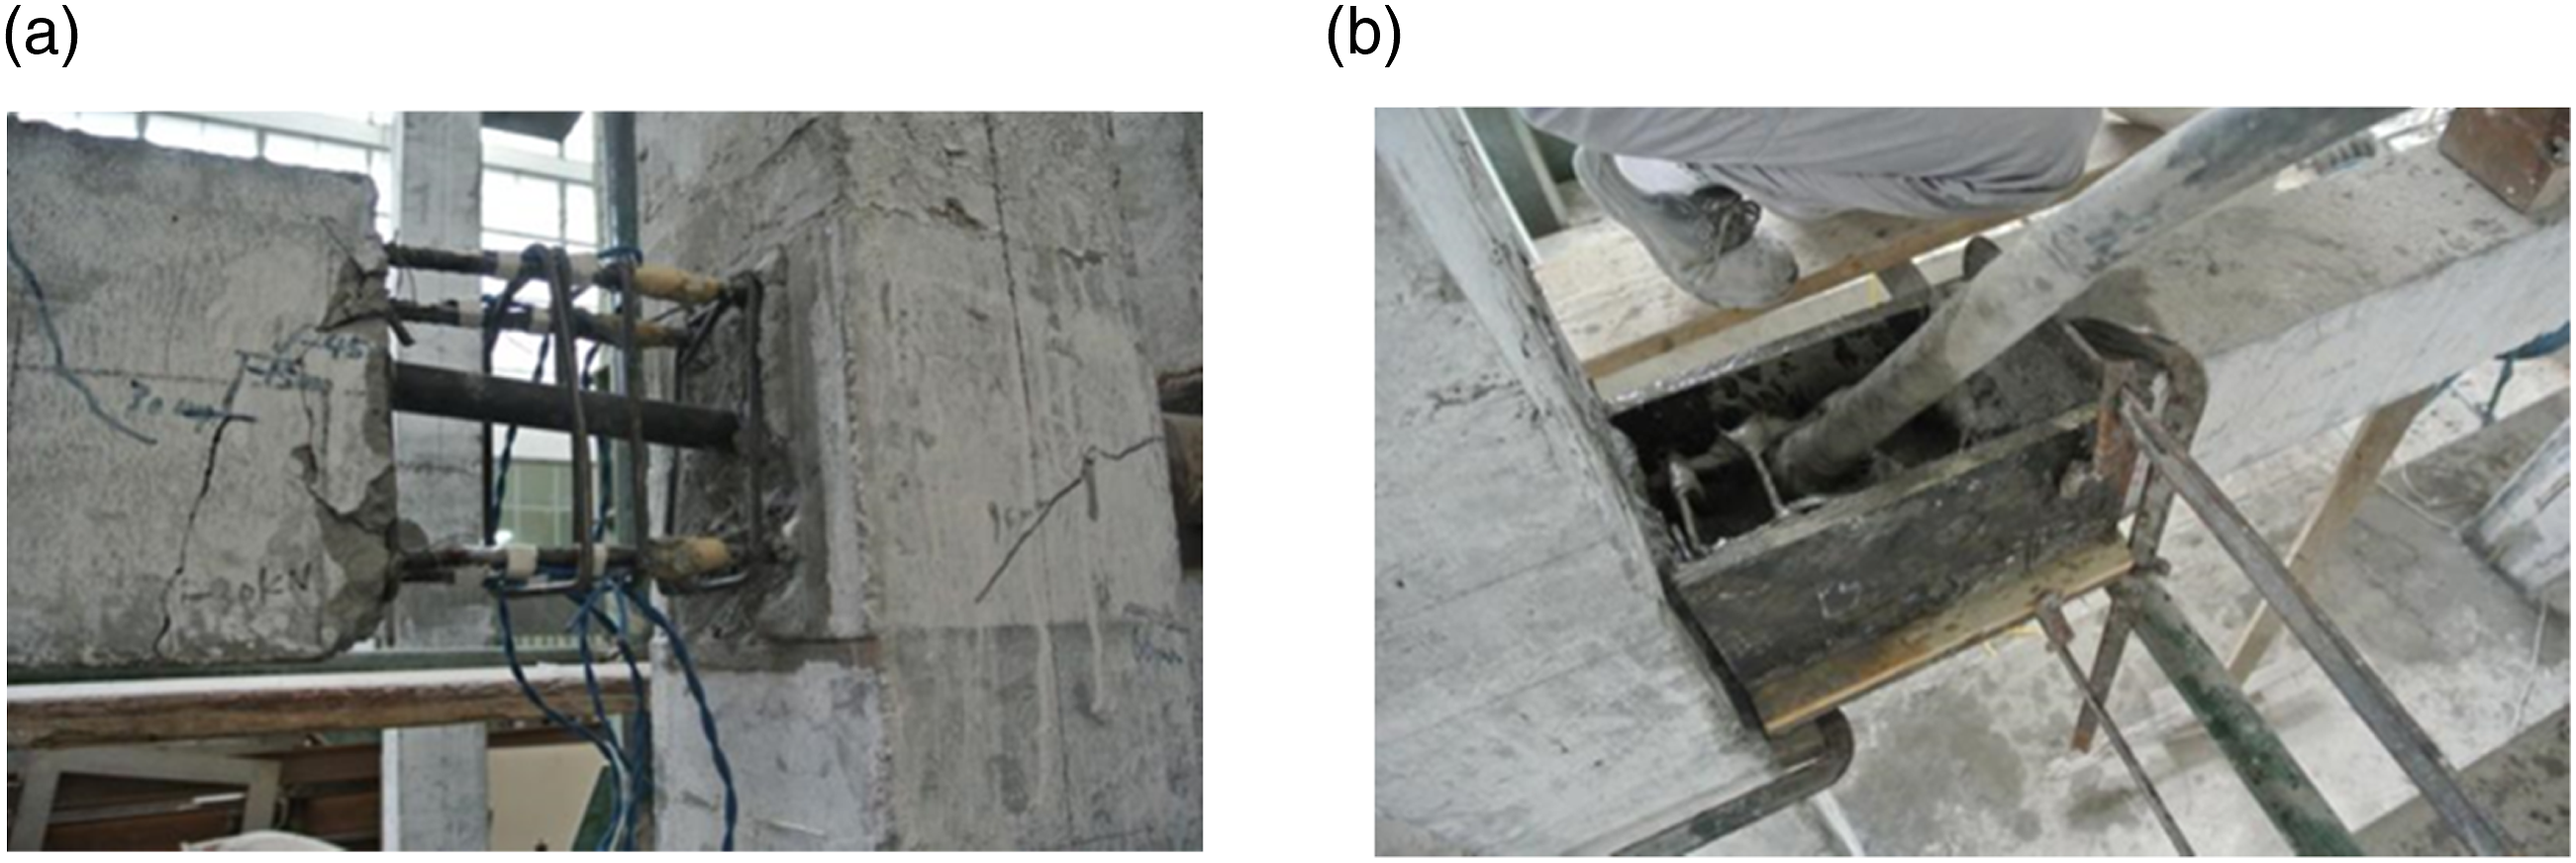
The whole construction process is conducted according to local codes (such as”Technical Specification for Reinforcement of Masonry Structures with High Ductility Fiber Reinforced Cementitious Composites” (DB42/T1937-2022) of Hubei Province, China and Code for design of strengthening concrete structure (GB50367-2013)) and related references (Cai et al., 2021; Nie et al., 2022).
The loading process of CFS is basically the same as that of CF. The horizontal cyclic loading is also controlled both by force and displacement. Firstly, the loading process is controlled by force with the incremental quantity of 20kN and it is set to be recycled once at each grade. When the horizontal displacement of CFS reaches up to 30mm, the loading process starts to be controlled by displacement with the incremental quantity of 30mm and recycled three times at each grade; when the load is reduced to 85% of the peak load, the specimen is regarded as “failure”.
FEA model
The materials’ constitutive models (except for ECC) are established according to related specification (Code for Design of Concrete Structures” (GB50010) in China). The 2-node beam element is used to simulate the frame. The reinforcement is modelled by beam element (B21). The bonding between concrete and reinforcement is realized by means of co-nodes. The choice of element type is according to explanatory document of ABAQUS. Further, the establishment of FEA (finite element analysis) model has taken related reference (Sabnis et al., 1983) into consideration. The FEA (finite element analysis) model is shown in Figure 6. FEA model in ABAQUS.
In order to fully “re-produce” the experimental loading process of CF and CFS, the model of CF with common concrete is firstly modelled; after the cyclic reversed loading process is totally applied into CF until the stage of “failure”, the positions without ECC is imported into new model and the position retrofitted with ECC is re-defined by using ECC constitutive model; then the new model is applied with the same loading process as that of CF until reaching the stage of “failure”.
Validation of FEA model and constitutive model for ECC
The hysteretic curves of CF and CFS are shown in Figure 7. It can be seen that the simulation results match well with the experimental data in terms of key load values and the whole curve developing process. The differences between numerical and experimental data may be caused by the neglecting of bond slip between concrete and reinforcement in FEA model and the simplification of constitutive model of ECC. The simplification of constitutive model is for lowering down the difficulty of programming and rising up the speed of calculation. According to the comparation shown in Figure 7, it can be validated that the simulation results of CF and CFS both have achieved the expected level. The constitutive model of ECC proposed in this paper is effective with accuracy. Hysteretic curves: (a) CF; (b) CFS.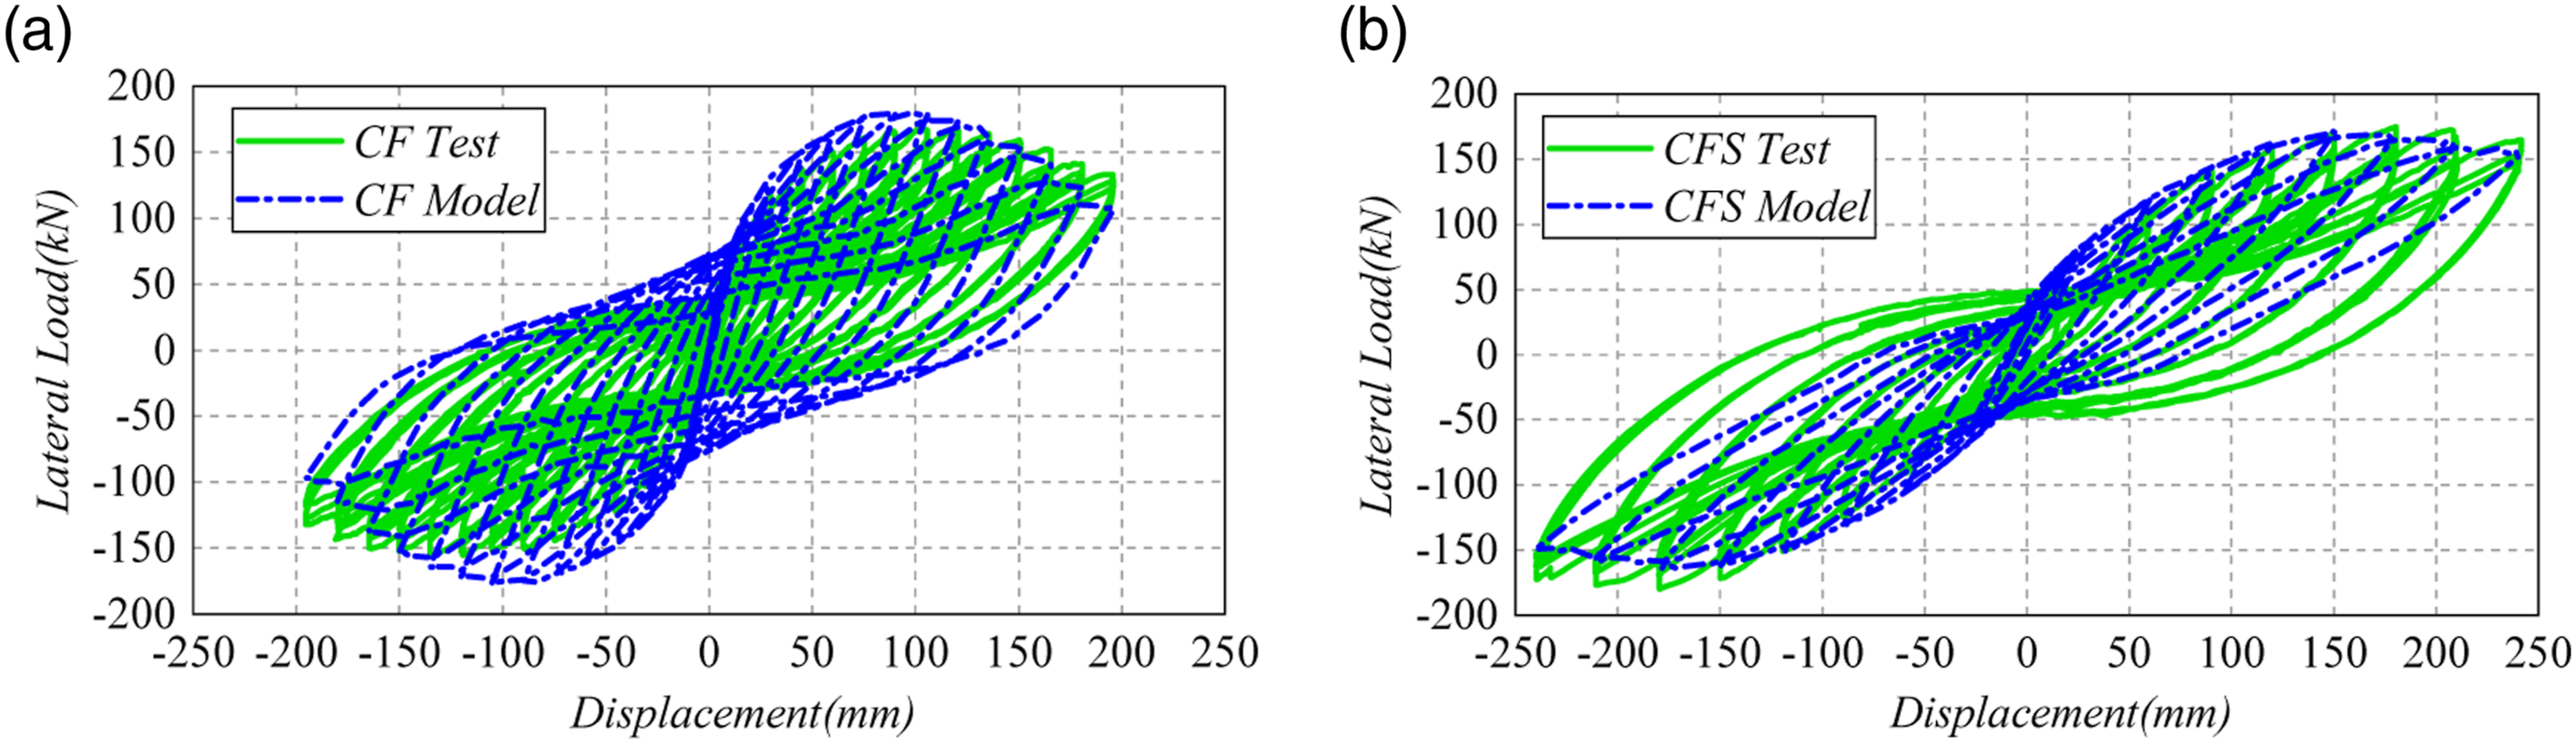
Performance analysis of ECC in seismic strengthening
Experimental observations of CF and CFS
As for CF (Figure 8), when the load reaches up to 20 kN, the vertical cracks appear at the left side of the second layer’s beams and at the middle side of the third layer’s beams. When the load is up to 30 kN, the horizontal crack firstly appears on columns and the vertical cracks on beams continue to develop. Then the controlling method is transformed into “displacement”. Experimental observations of CF: (a) vertical crack of beam (20kN); (b) horizontal cracks of column (30kN); (c) diagonal cracks at the joint of frame (30mm); (d) falling off of concrete (90mm); (e) exposure of reinforcements (120mm).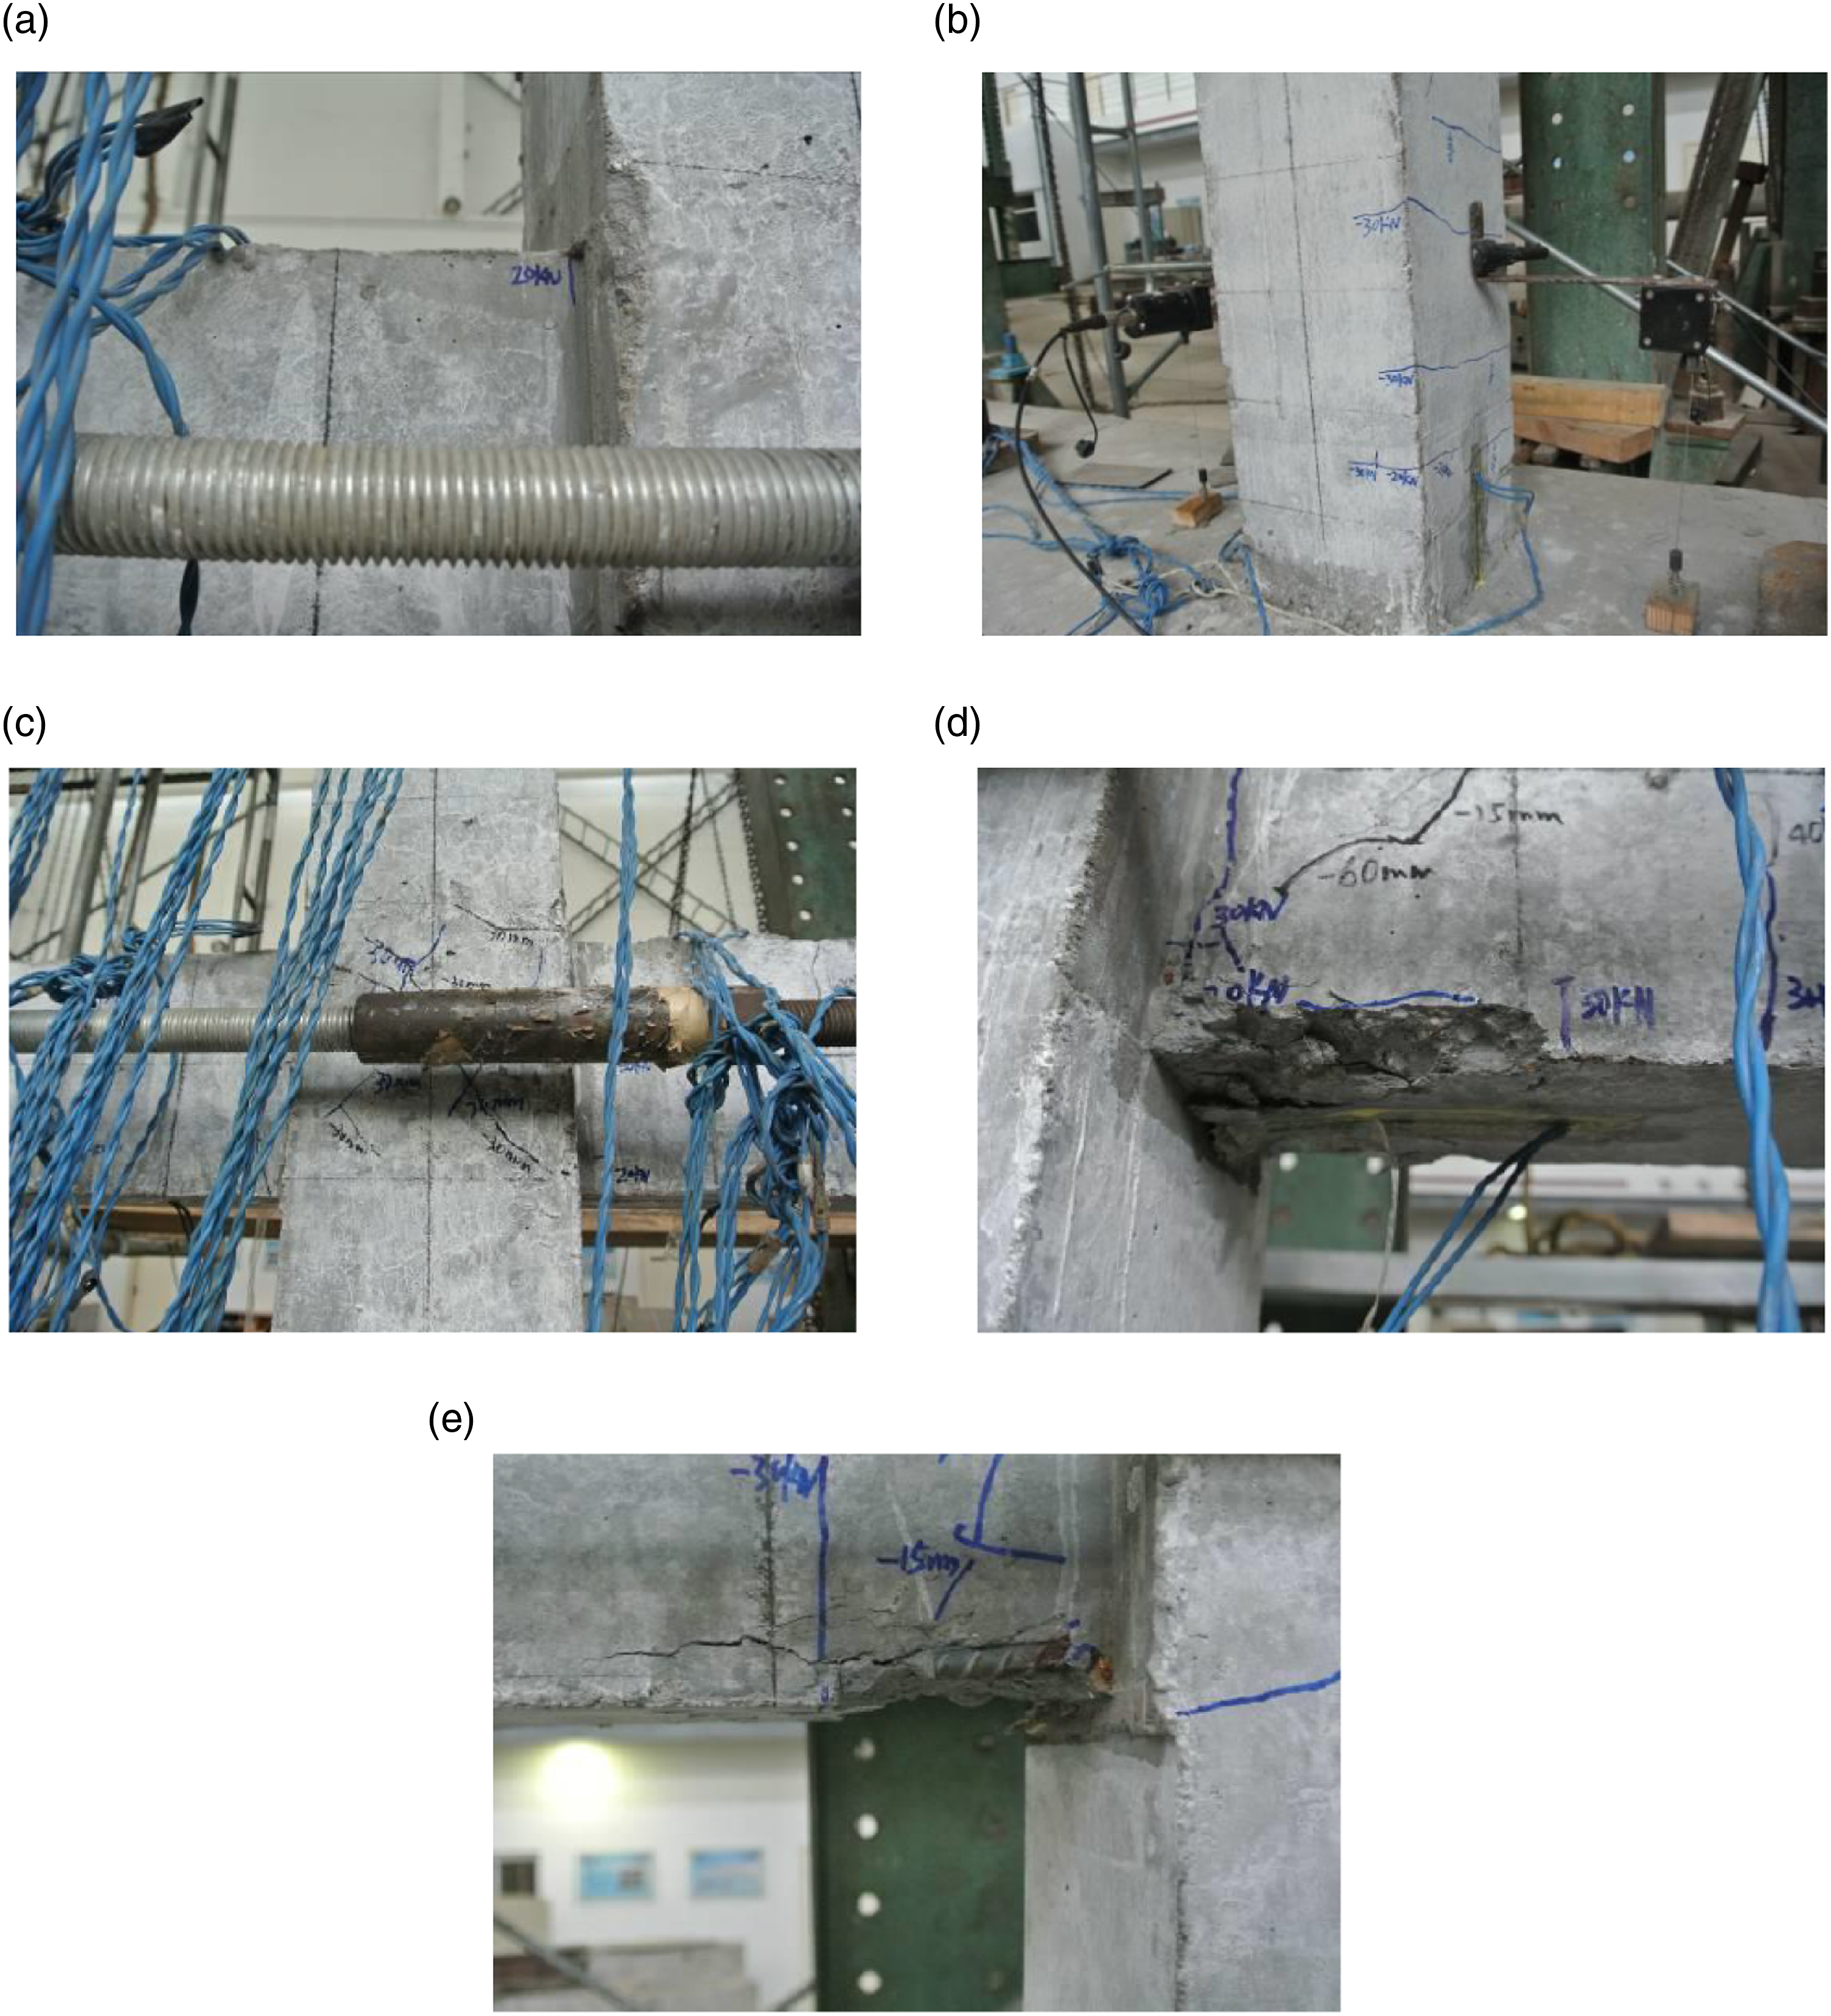
When the displacement is at the level of 15 mm, there are many horizontal cracks at each column and the crack’s positions gradually move up; the beams’ vertical cracks also continue to develop and the positions move into the middle of the span. The diagonal crack firstly appears at the joint when the displacement reaches the level of 30 mm and the maximum width of beam’s vertical crack is about 0.25 mm. Subsequently, concrete starts to fall off and thus the reinforcements start to be exposed. When the displacement is about 195 mm, the load is reduced to 85% of the peak load and the specimen CF is regarded as “failure”. At this time, it can be seen that two ends of beams have the most severe damage; the concrete falls off and totally crushes; the reinforcements are compressed into yielding.
As for CFS which is retrofitted with ECC, when the load is 20 kN, the first vertical crack appears above the intersection of ECC and original concrete at the right side of the middle beam in the first layer. When the load continues to reach the level of 40 kN, all interfaces between ECC and original concrete have vertical cracks and after that, the loading process is transformed into being controlled by “displacement”.
As the displacement is about 60 mm, the joint repaired with ECC has obvious diagonal cracks. When the displacement is 180 mm, column starts crushing and falling off and the width of diagonal crack at the joint reaches up to 4mm when the displacement is 210 mm. The whole loading process is stopped when the displacement is 240mm (Figure 9(a)). At this time, although the load has not been reduced to 85% of the peak load, the actuator has reached the limit of the loading and it cannot continue to apply force, hence the loading process is stopped. Final damage of CFS: (a)whole frame (240mm); (b) separation of beams and columns; (c) crushing of concrete; (d) separation of ECC and original concrete.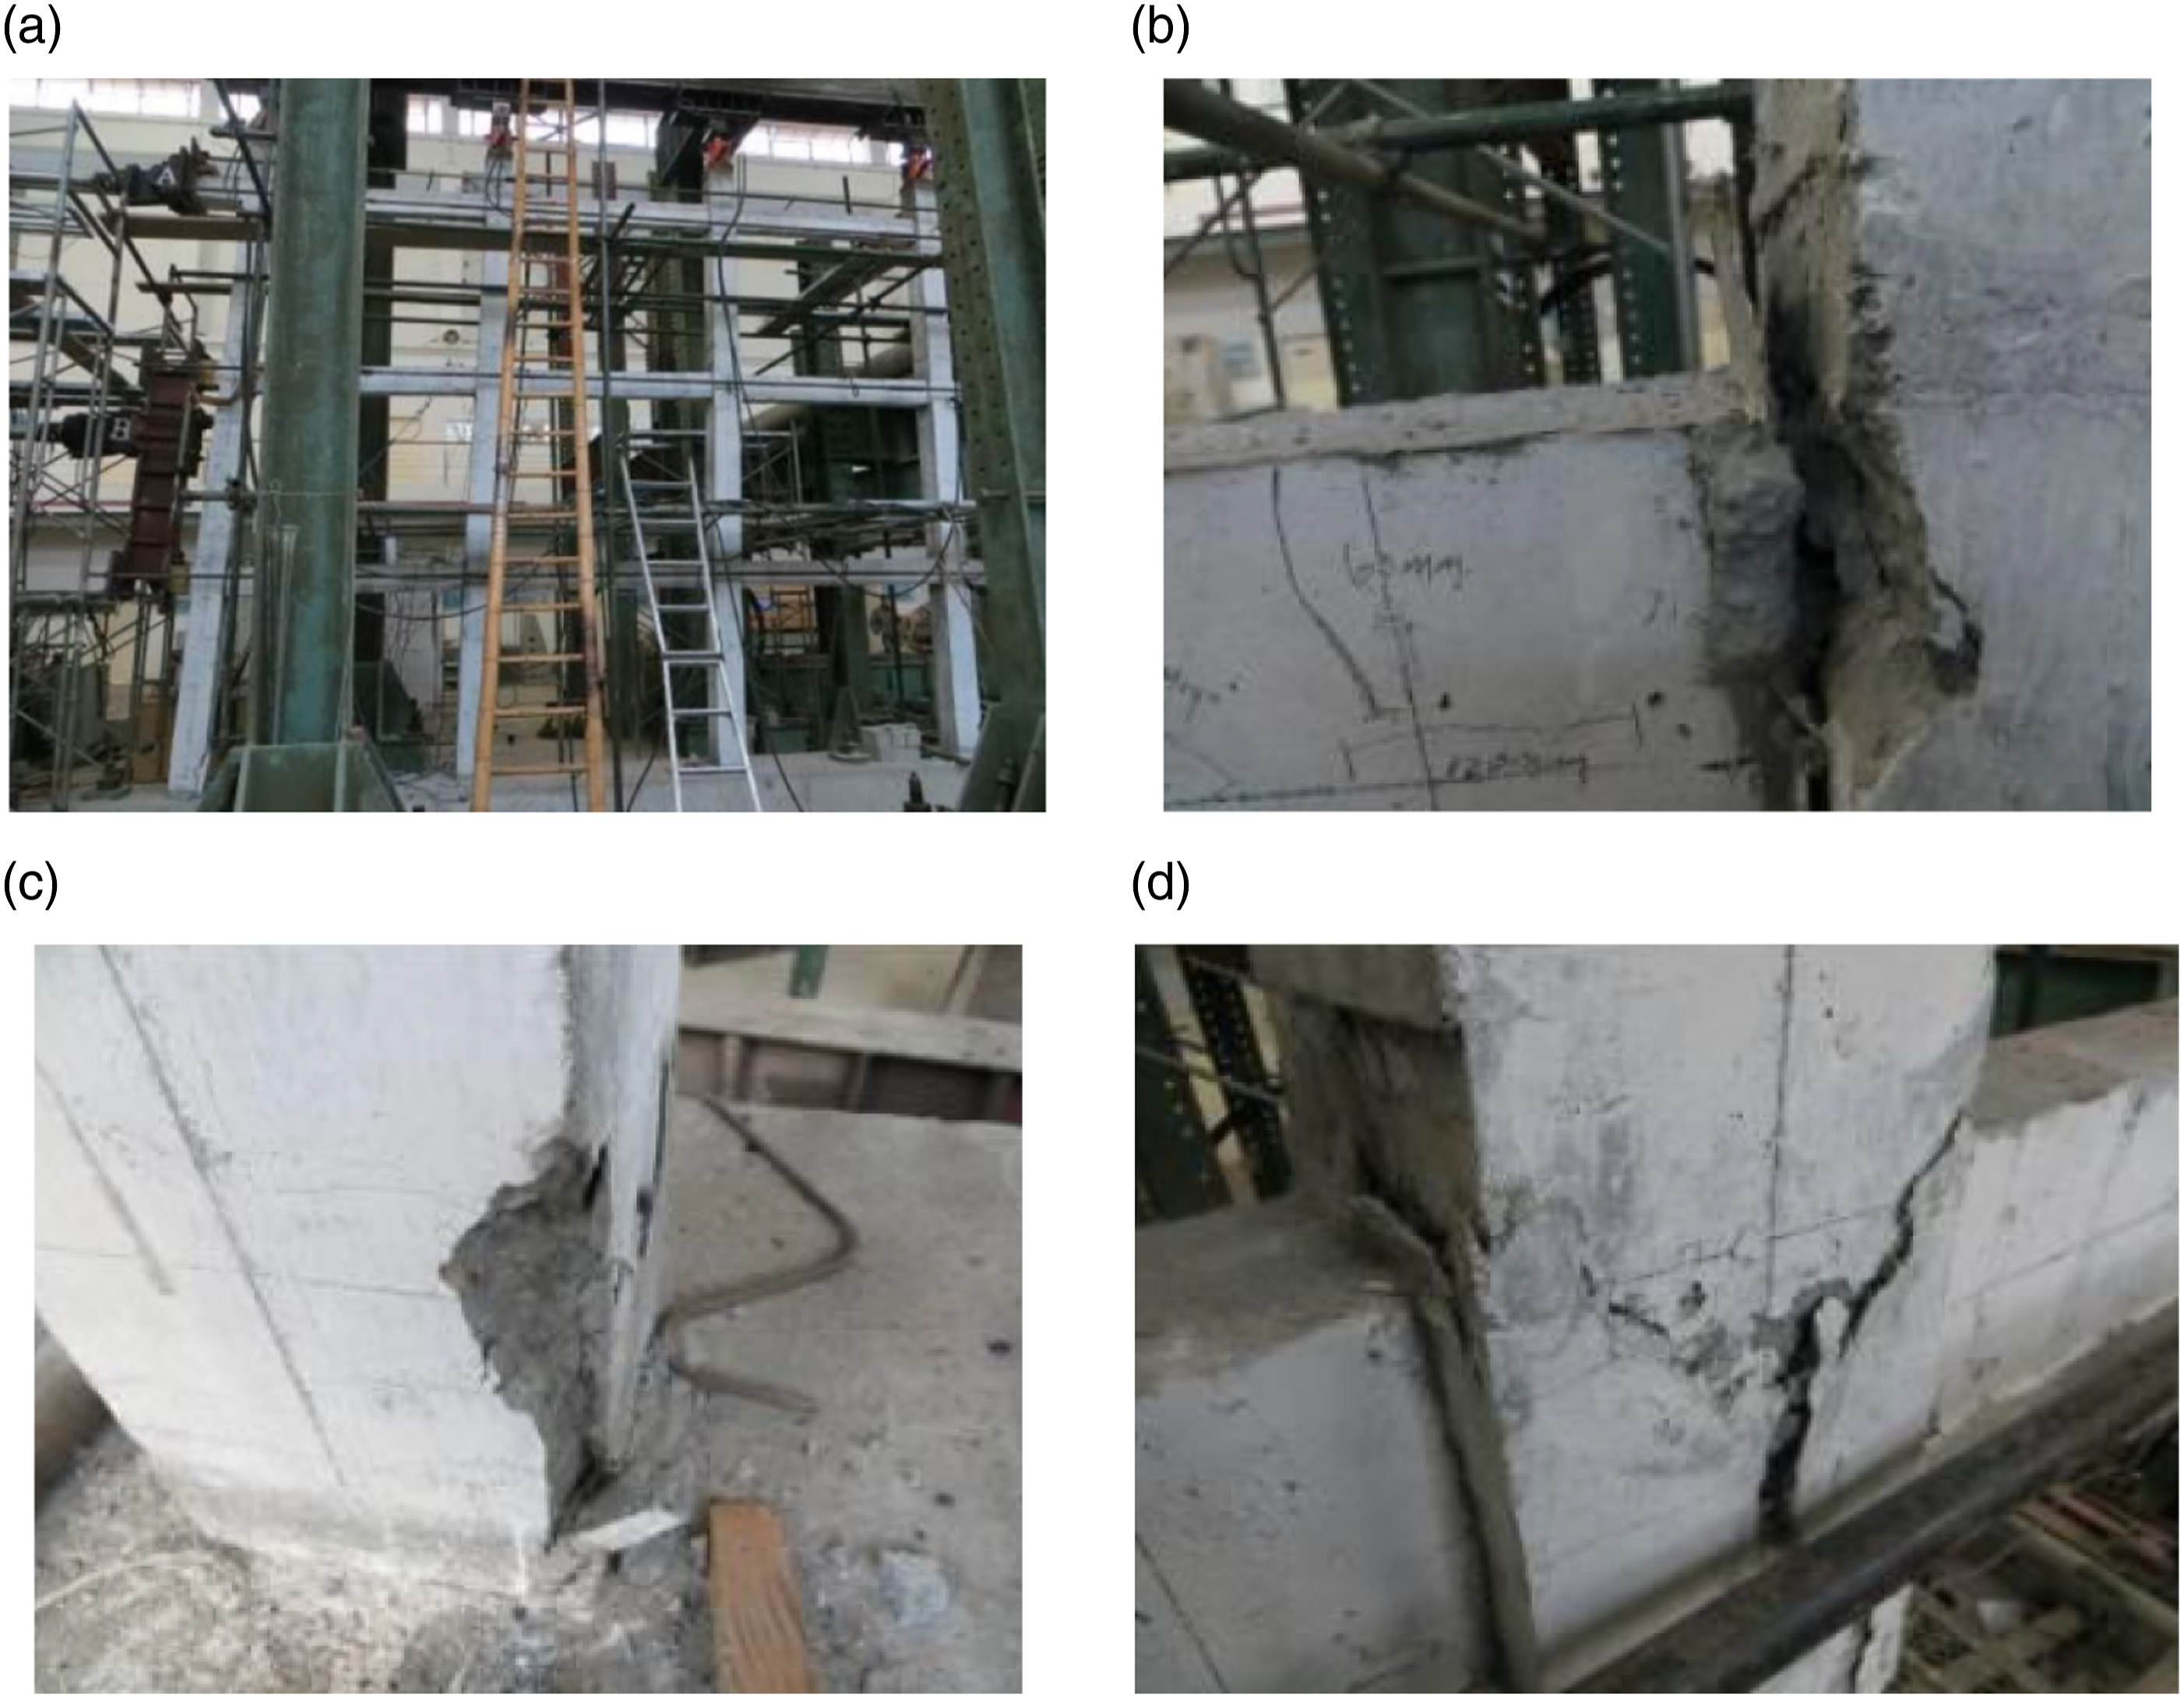
The main damage characteristics consist of ((Figure 9(b) and (c)) following parts: significant disconnection (or “separation”) at the intersection of beams and columns; obvious separation of ECC and original concrete at the joint of the frame; crushing of concrete at the columns.
The crack patterns of CF and CFS are shown in Figure 10. Since the original cracks of CF are not repaired, only the distribution of new cracks in the plastic hinge zone (the positions retrofitted with ECC) is shown in Figure 10(b). As for whole crack patterns in CFS which is retrofitted with ECC, the number of cracks is most in first layer, more in second layer and the least in third layer, which is consistent with the development pattern of cracks of CF. The overall cracks at the end of beams are less and thinner than those of CF and there is no falling off of ECC in the plastic hinge zone which is totally different of the original concrete frame, indicating that the usage of ECC can effectively improve the load bearing capacity of the plastic hinge zone of the frame and facilitate the post-earthquake repairment. Crack of frame: (a) CF; (b) CFS.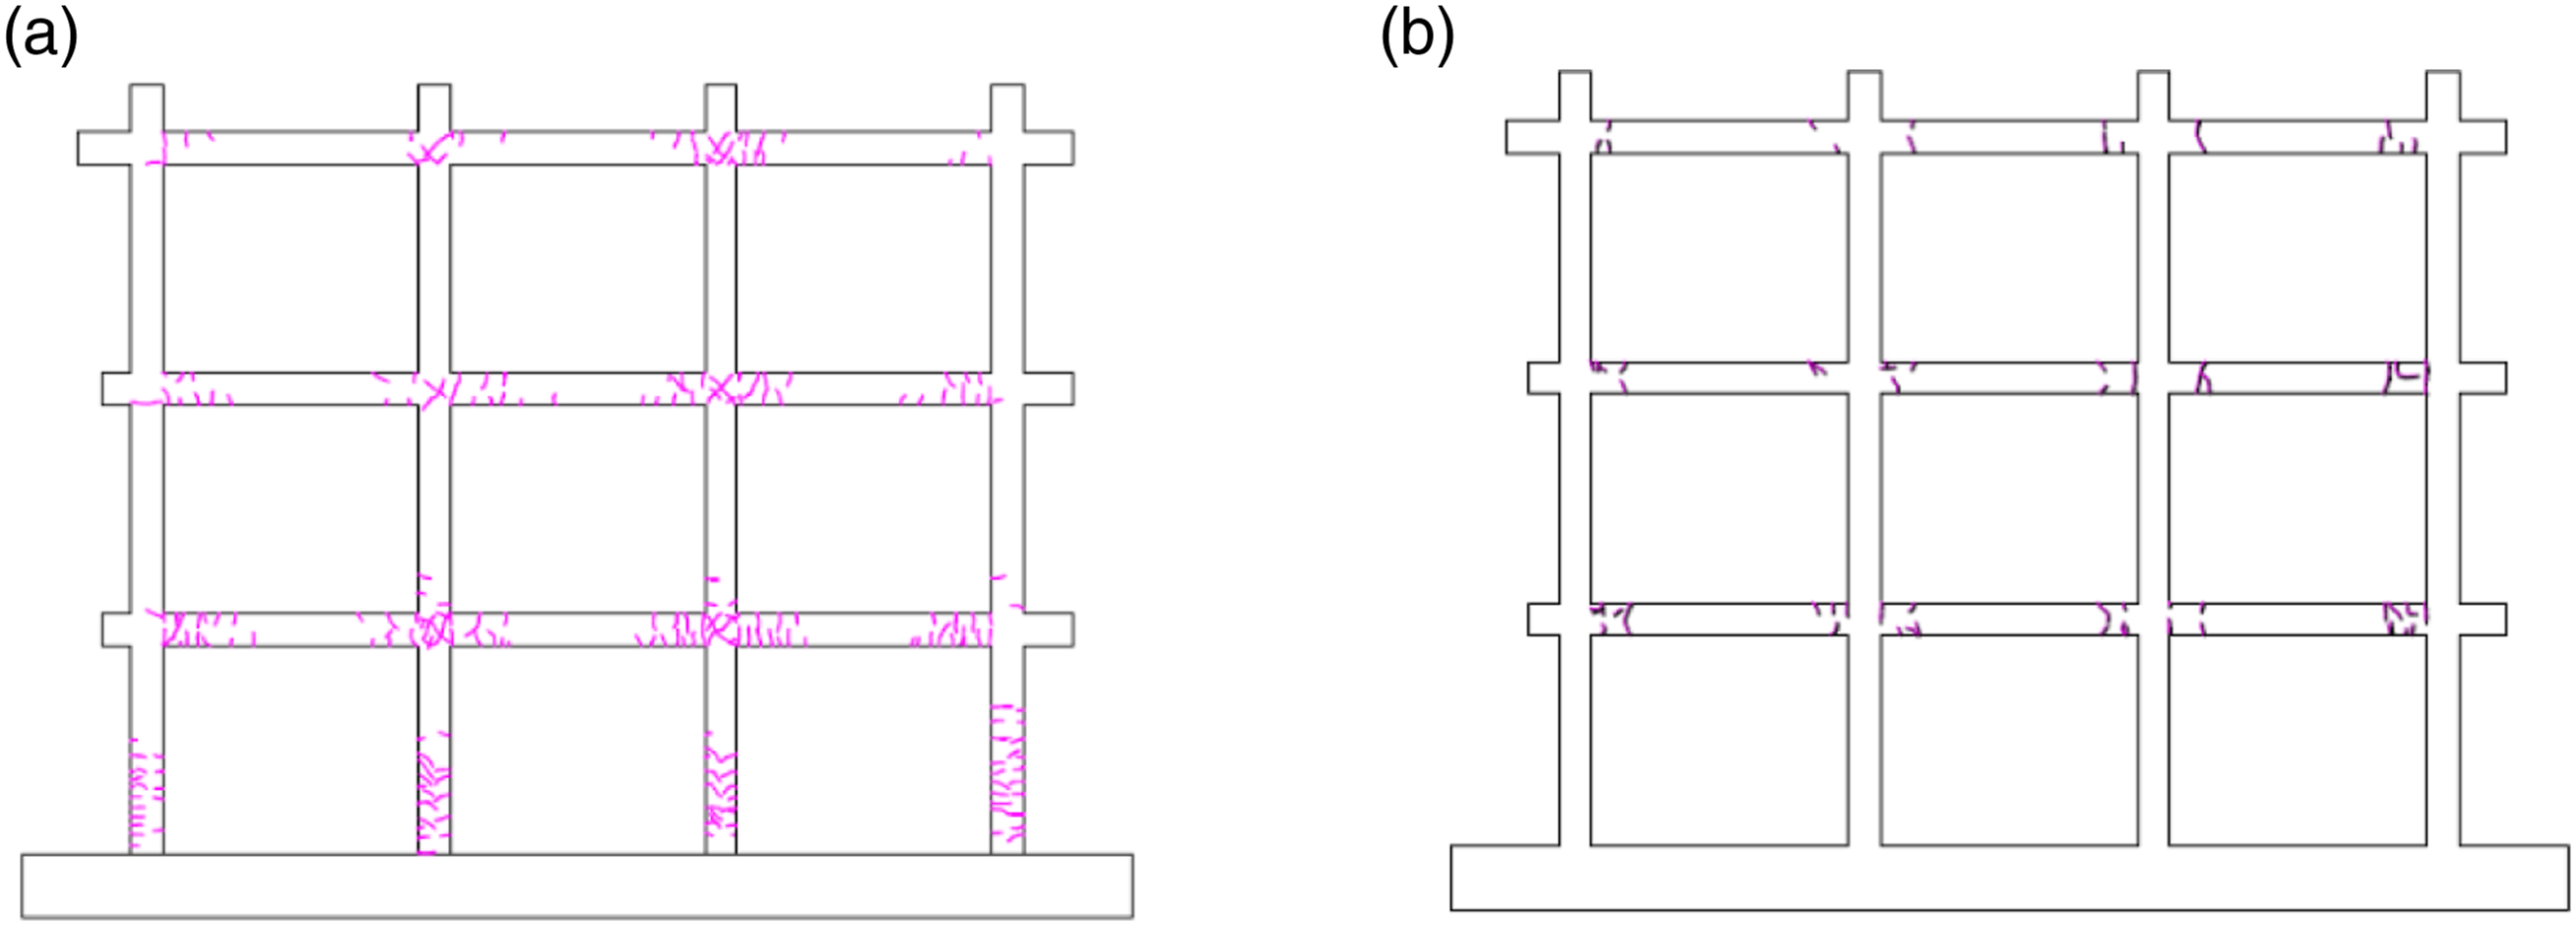
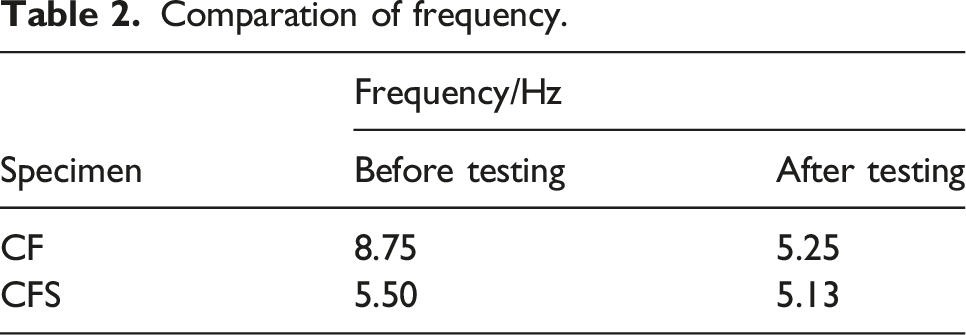
Comparation of frequency.
Hysteretic curve and skeleton curve
The hysteretic curves of CF and CFS have been shown in previous section, Section Validation of FEA model and constitutive model for ECC (Figure 7), and the reliability of numerical model has been demonstrated. Hence, in this section, hysteretic curves of each layer drawn from numerical models are shown in Figure 11. Hysteretic curves of each layer (numerical data): (a) first layer; (b) second layer; (c) third layer.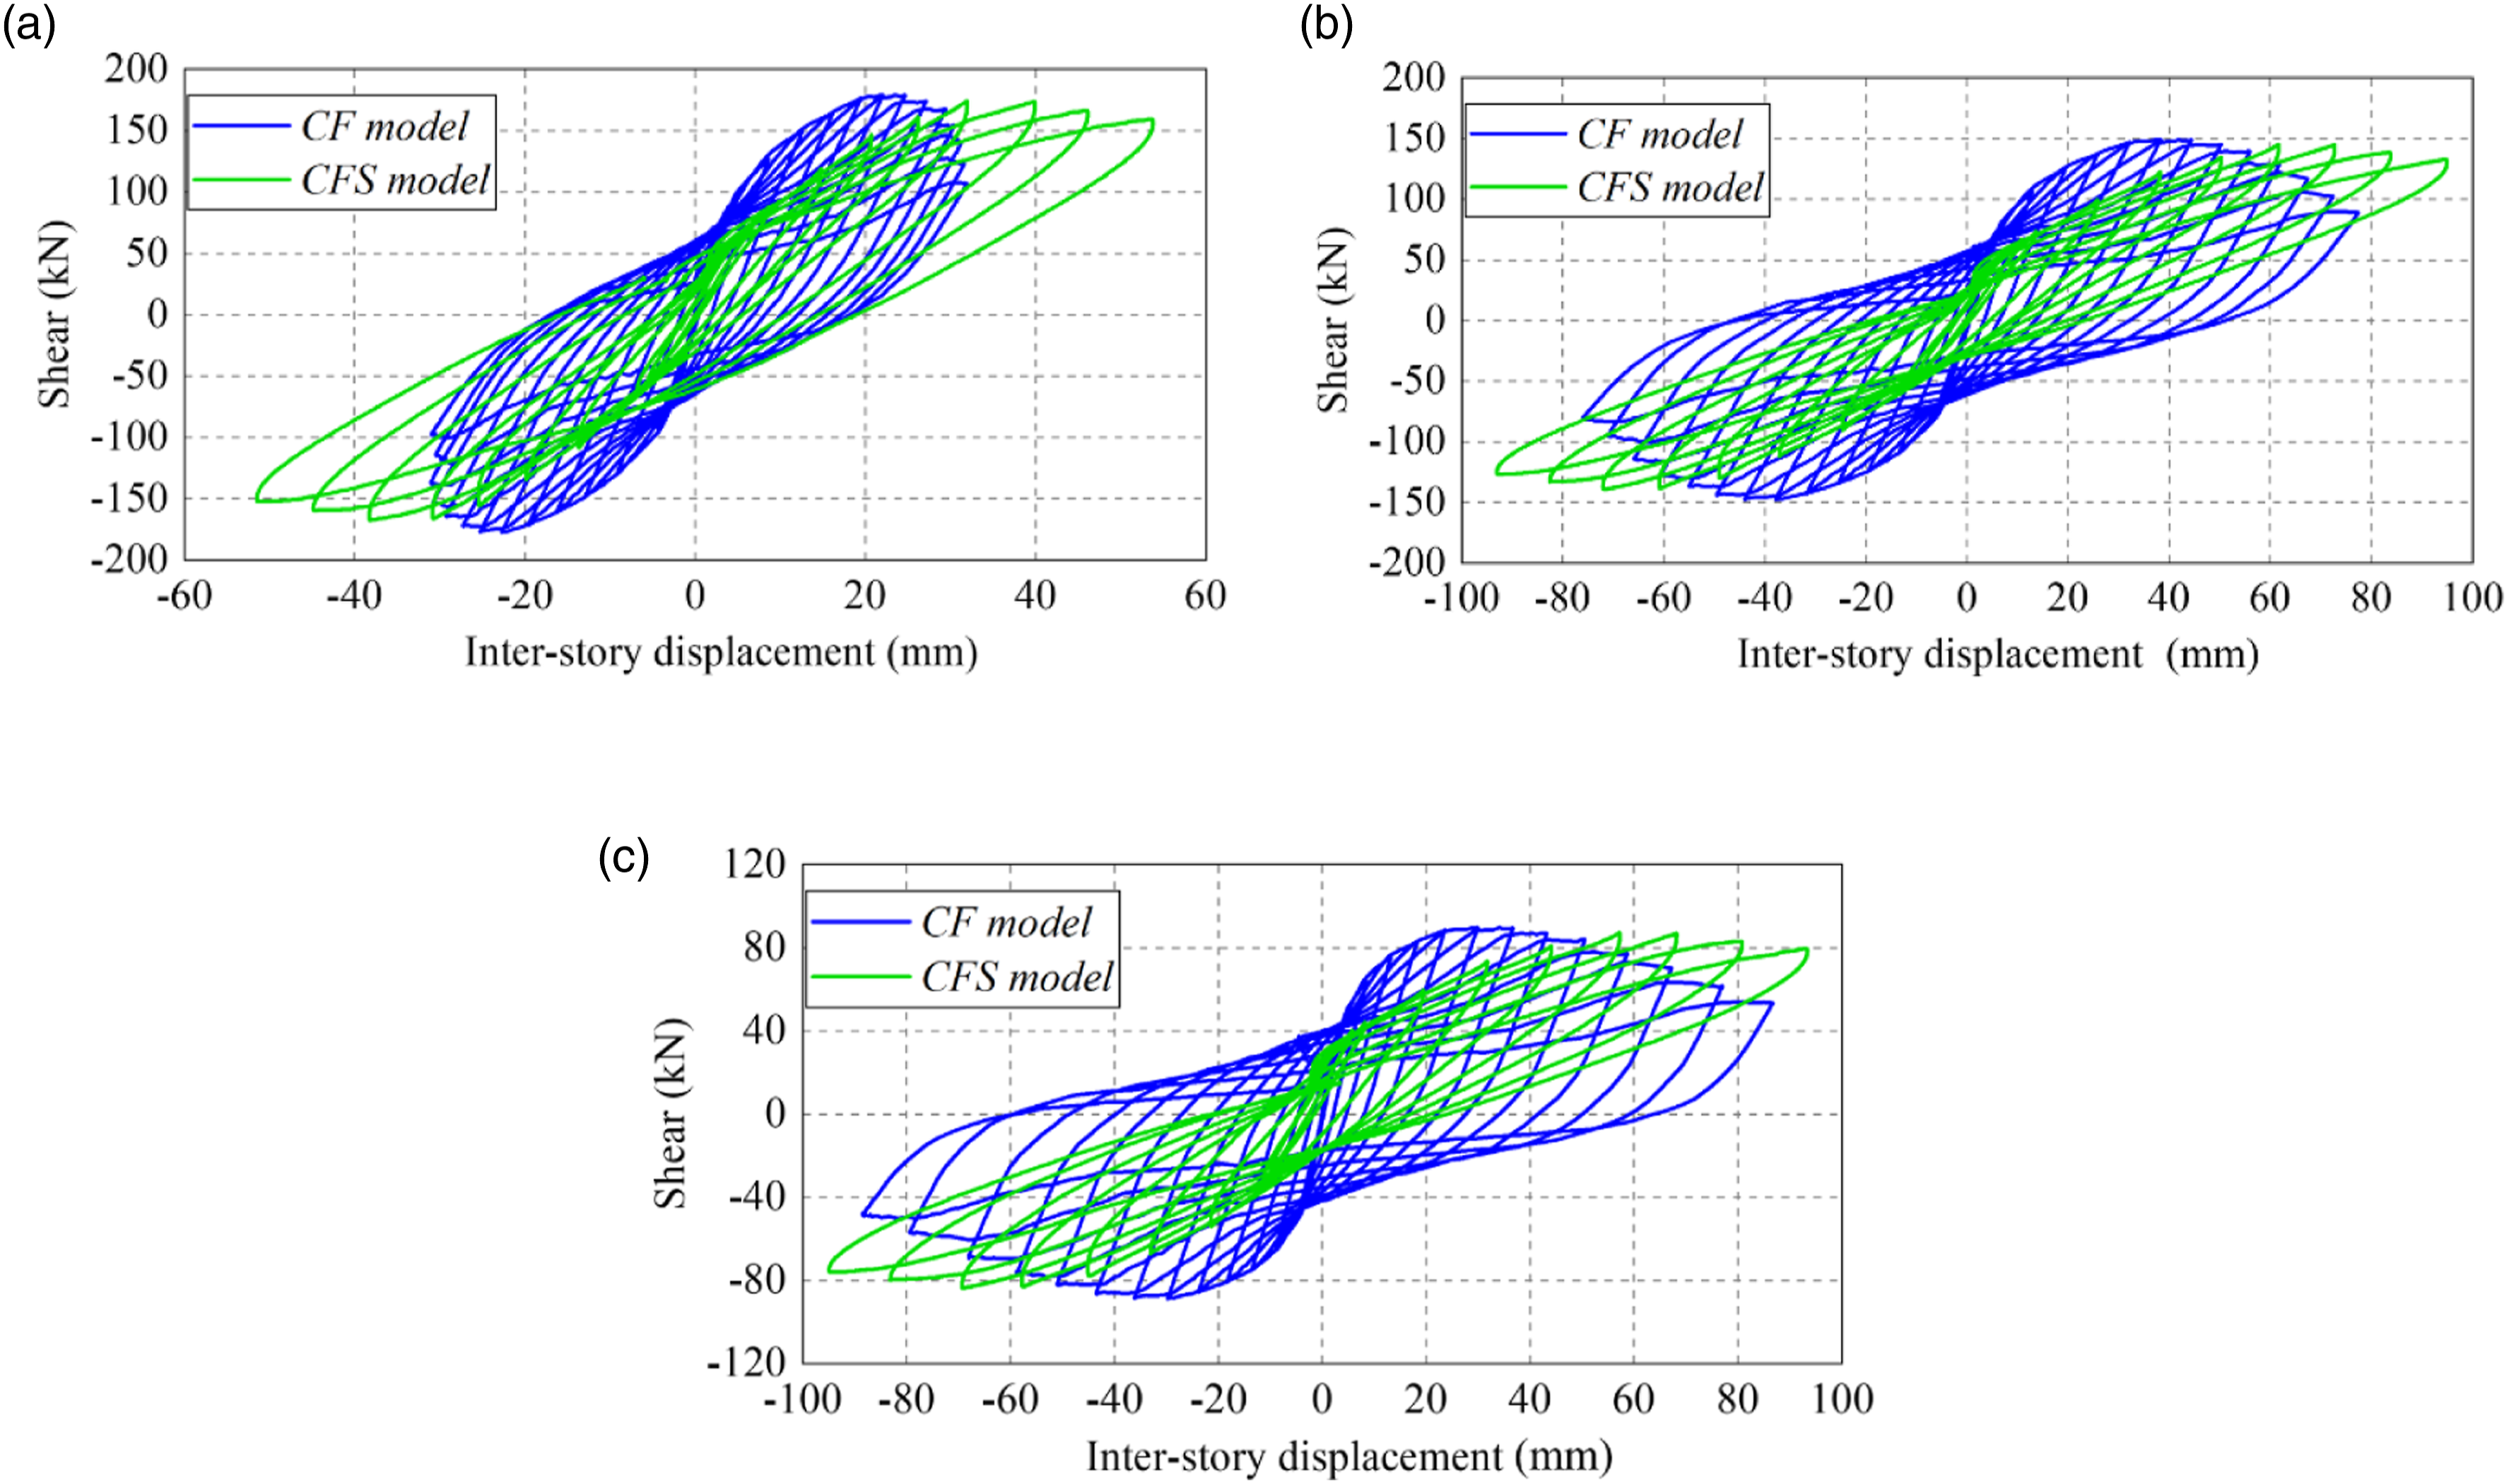
From the perspective of whole frame’ hysteretic curve, the difference in shape type between CF and CFS is not obvious as loops are both in S-shape after yielding. However, the pinch effect after the retrofitting of ECC is much more obvious compared with CF, meaning that although ECC material can effectively ensure the loading bearing capacity, the energy dissipation ability and ductility still are influenced by seismic action. Moreover, comparing each layer’s hysteretic curve, two specimens both exhibit the fullness of loops in first layer, which is better than that of second layer and third layer. It is due to the much heavier damage in the lower layer of frame, thus causing larger plastic deformation in lower layers.
Further, according to the data of hysteretic curves, the energy dissipation capacity related parameter can be calculated based on reference (Zhang et al., 2020) and Figure 12 shows the equivalent damping ratios of CF and CFS. The overall developing process of CFS is similar to that of CF and at some stages the value of CFS is even larger than CF, demonstrating that the post-earthquake RC frame retrofitted with ECC can maintain the advantages of good energy dissipation ability of frame structure and the energy dissipation capacity can reach the level of the original frame. Equivalent damping ratio: comparation between CF and CFS.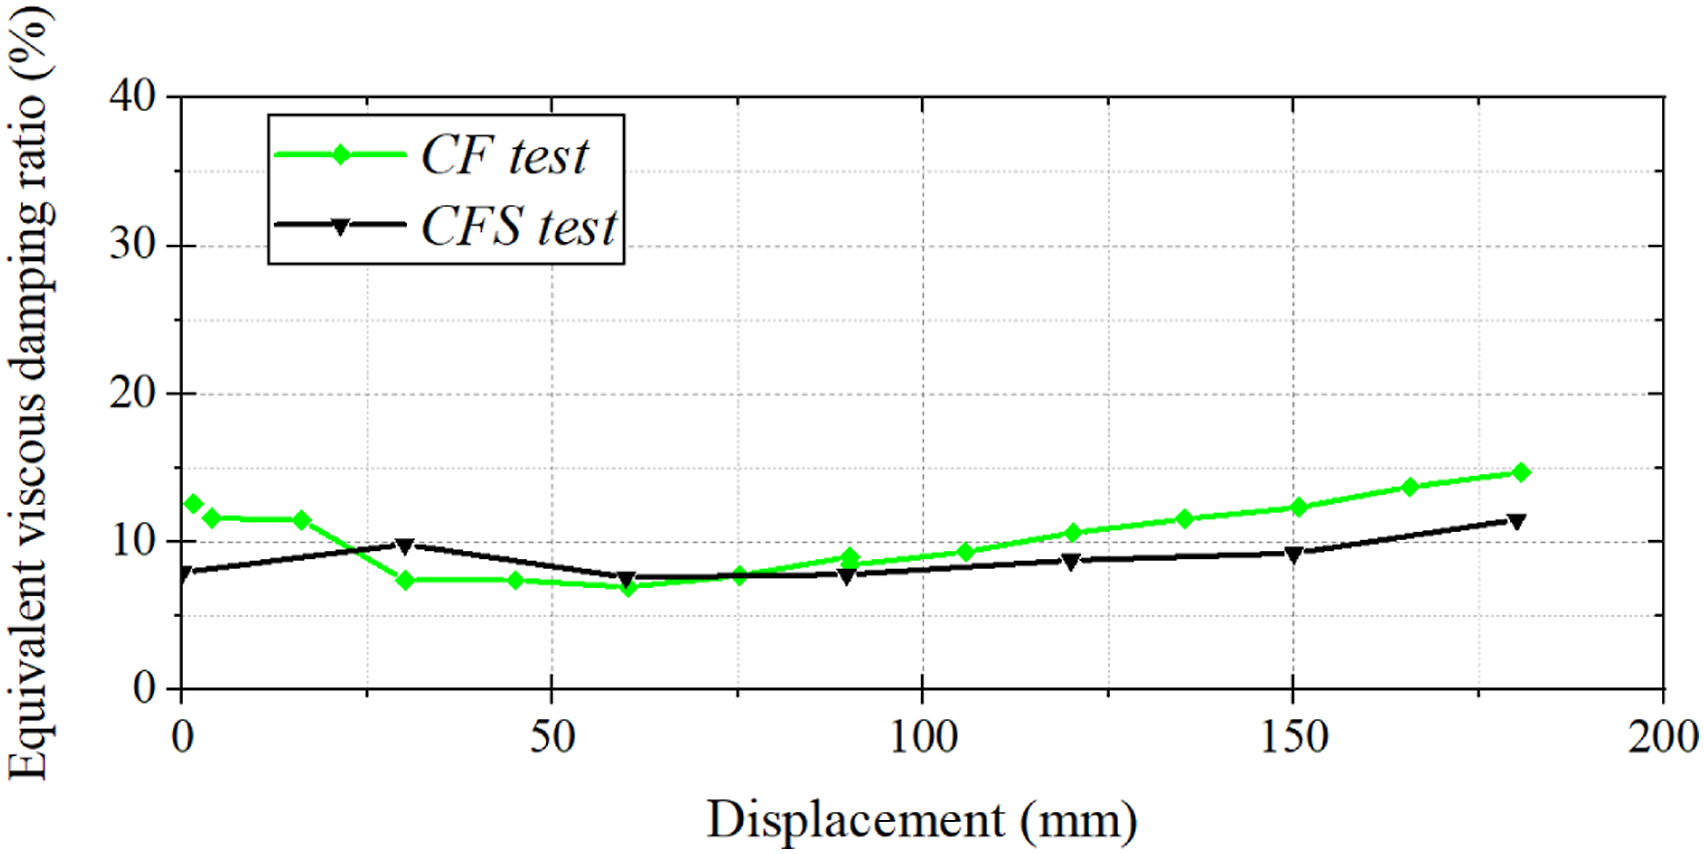
As the accuracy of numerical modelling compared with experimental data has been clarified in previous content, the results of simulation models are not repeated here.
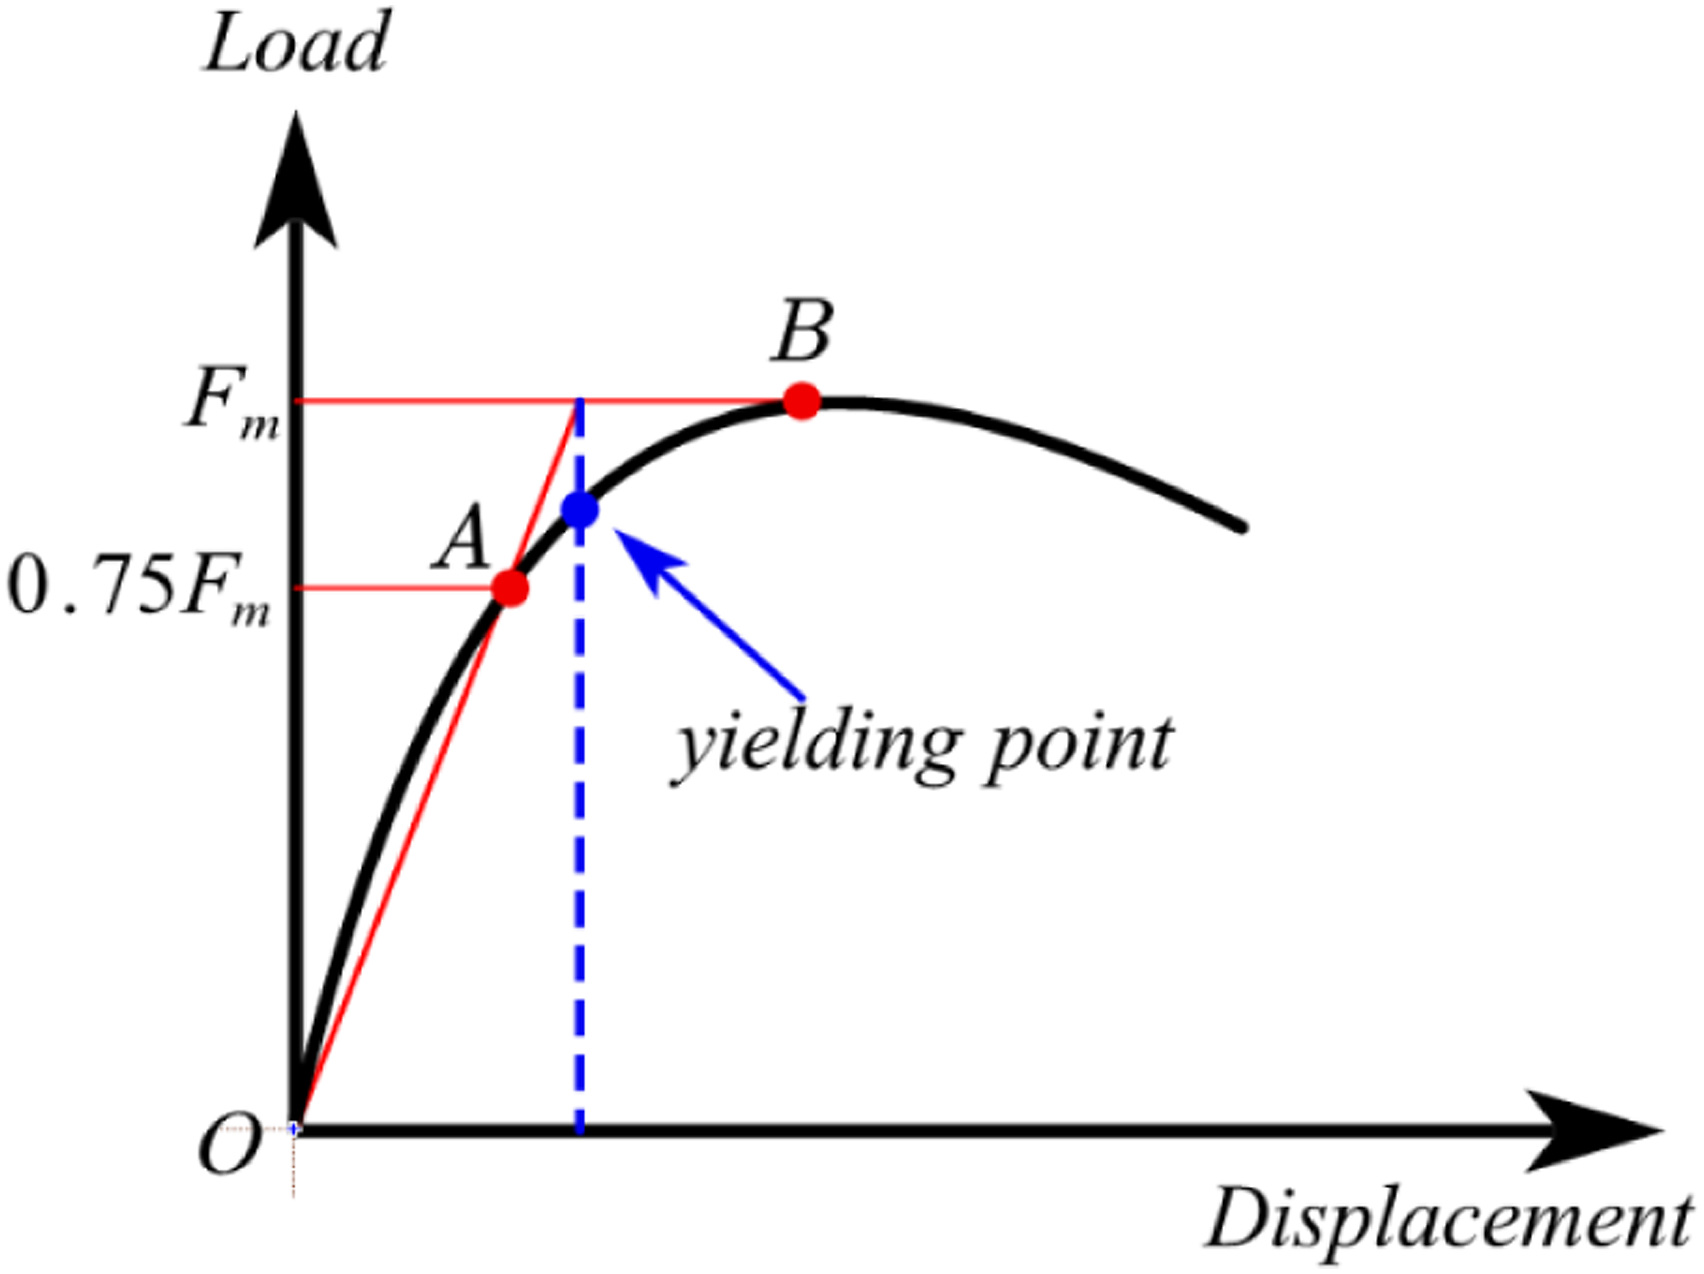
The skeleton curves of CF and CFS (both experimental and numerical) are shown in Figure 13. Based on skeleton curve, ductility can be calculated according to the method proposed by Park R (Park, 1998) (Figure 14), and the detailed results are listed in Table 3. The experimental data and numerical results basically match well with each other, further demonstrating that the FEA model and newly proposed numerical constitutive model of ECC material have enough accuracy for engineering analysis. Skeleton curves of CF and CFS (experimental and numerical). Yielding point determination (F
m
: peak load/maximum load). Calculation of key points and ductility (μ). Note: the ultimate stage is determined when the load is reduced to 85% of the peak load; as for CFS, when the load reaches the level of 240kN, the actuator cannot continue to apply loading and directly stops working, hence the specimen is directly regarded as “failure”.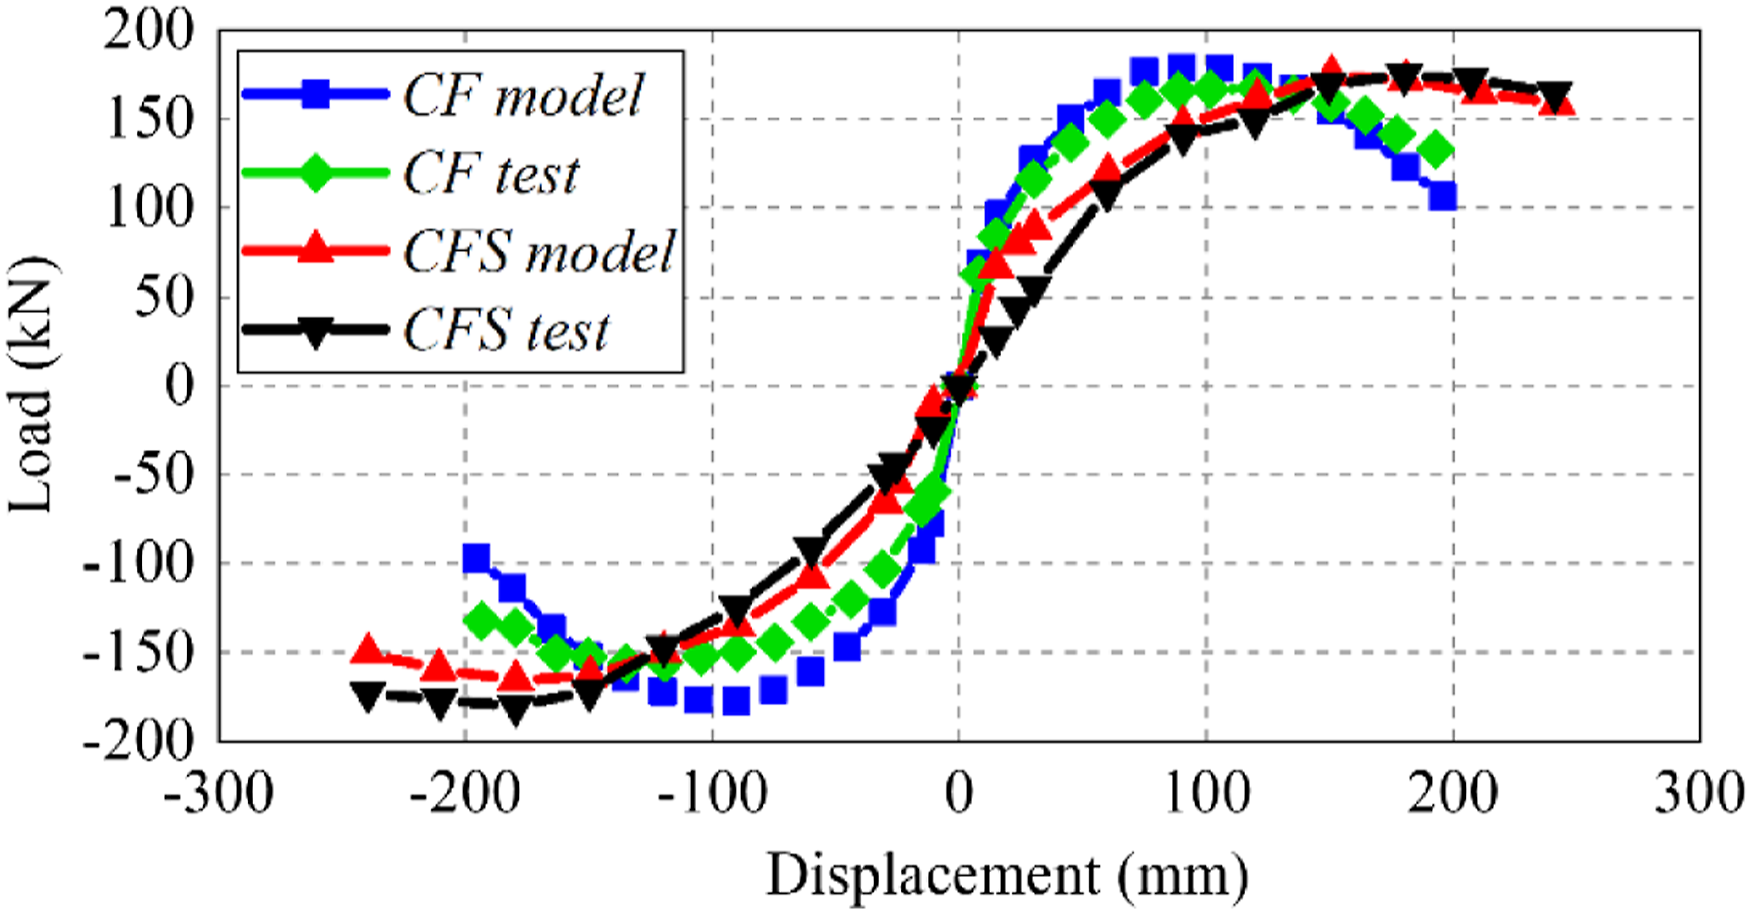
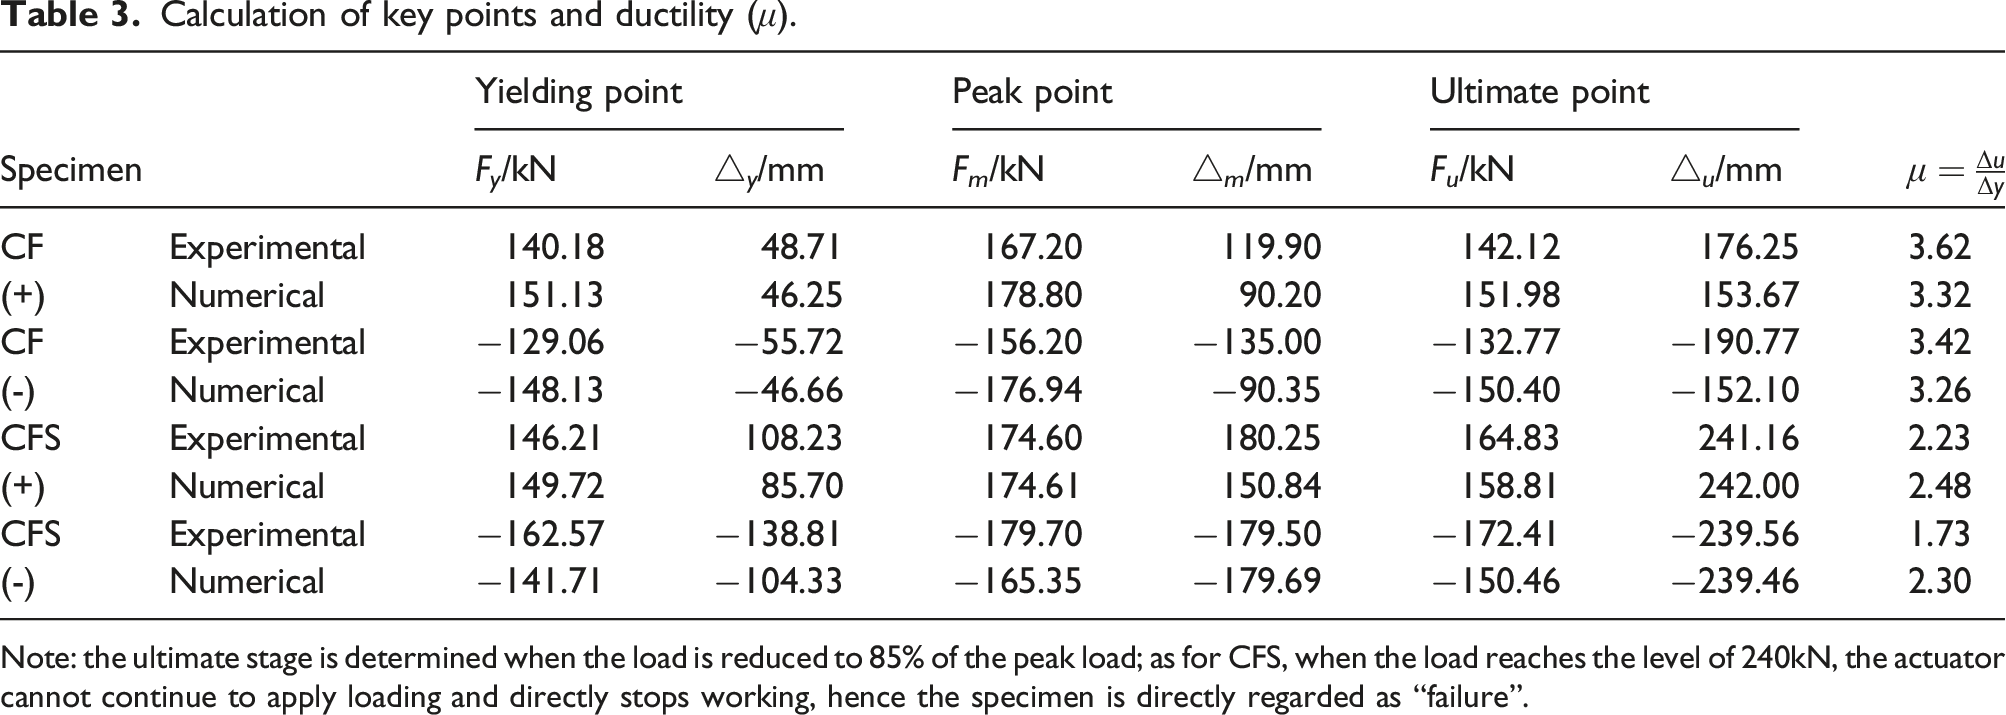
According to curve developing pattern shown in Figure 13, there are three obvious stages of two specimens under cyclic loadings, which are elastic, yielding and ultimate, and the positive and negative curves are basically the same with similar key points and ductility values. However, the initial stiffness of CFS is relatively smaller than that of CF, indicating that the previous loading has indeed resulted in damage. The average yielding displacements of CFS in both positive and negative directions are significantly higher than those of CF, with an increase of 80.4% to 156.4%; the increase of the average yielding load is relatively insignificant, but it can basically ensure that the frame retrofitted with ECC can reach the same level of peak load as the original frame, showing that the repairing method using ECC in post-earthquake damaged RC frame can restore and even exceed the original frame’s load bearing capacity.
Ductility is an important index for evaluating seismic performance and the calculation results are listed in Table 3.
The ductility of CFS in both directions is 2.23/2.48 and 1.73/2.30 and it is obviously much smaller than that of CF, due to the limitation of actuator used in the experimental test. The actuator cannot further load to the ultimate displacement while testing CFS and stops loading too much early (when the loading process is stopped, the load value is only about 95% of the peak load). If based on the developing process of skeleton curves, the deformation capacity and ductility ability of CFS shall not be much worse than those of the original frame (CF). Further, comparing the ultimate story drift ratio, the ratio of CFS is about 31.0% higher than that of CF, indicating that ECC has good deformation capacity and the usage of ECC is indeed an effective method to improve deformation capacity in repairing and strengthening post-earthquake damaged structures.
Stiffness degradation
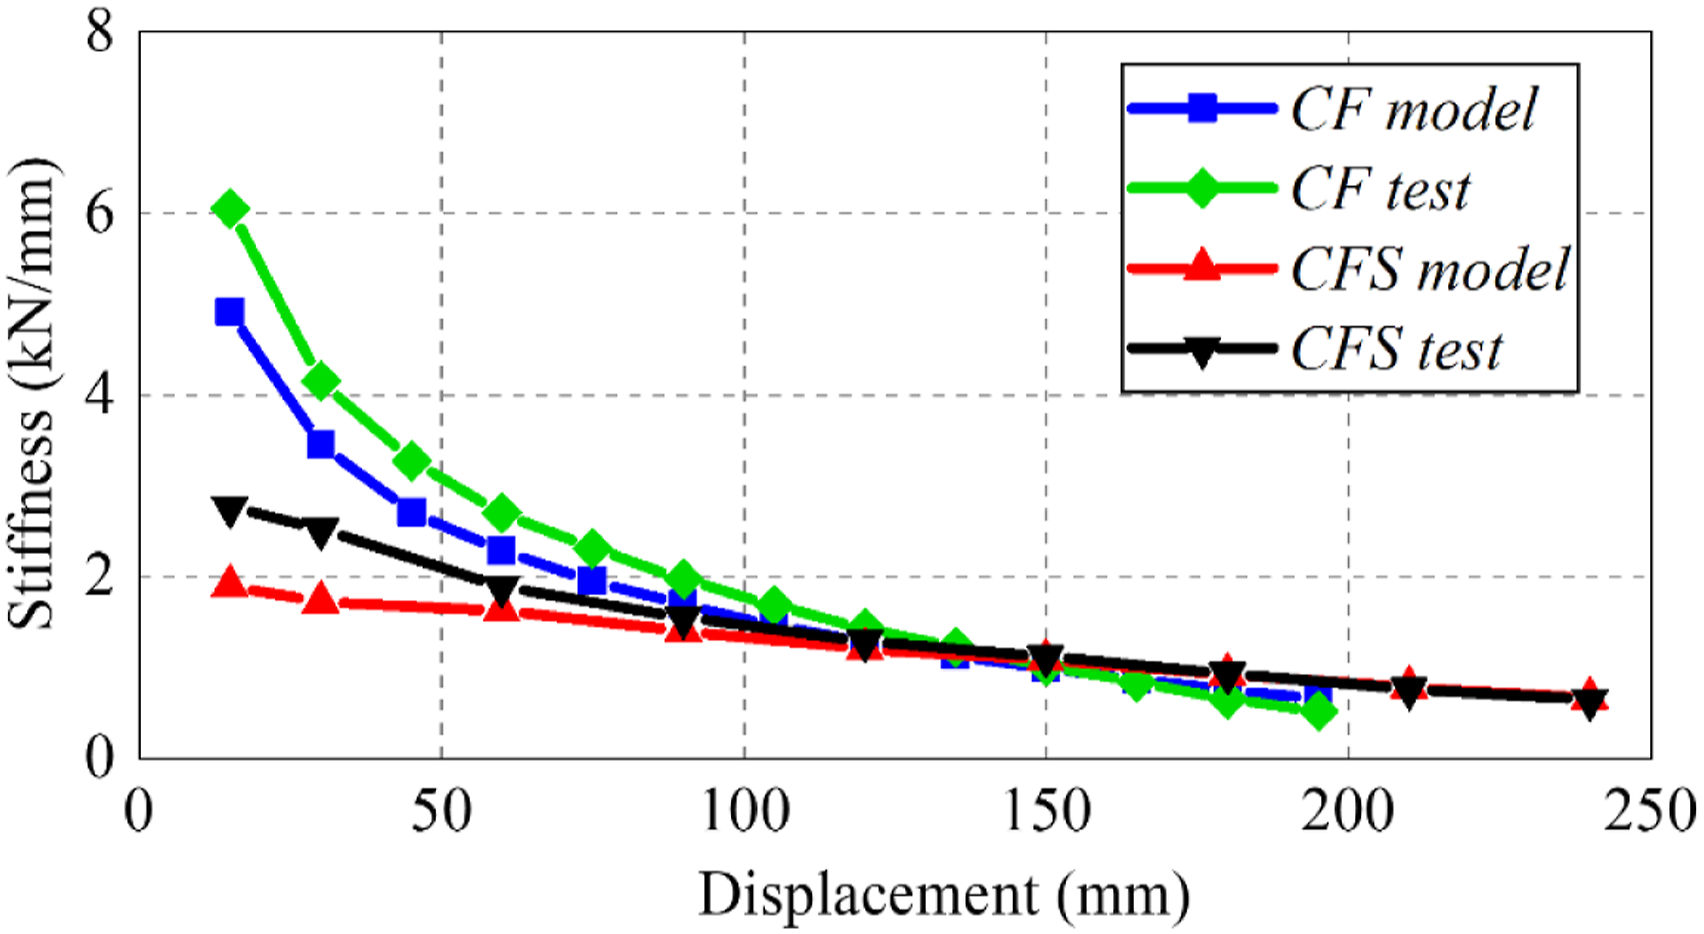
According to related reference (China, 2012), the stiffness can be calculated in equation (1). Figure 15 shows the stiffness degradation of all specimens. Stiffness degradation.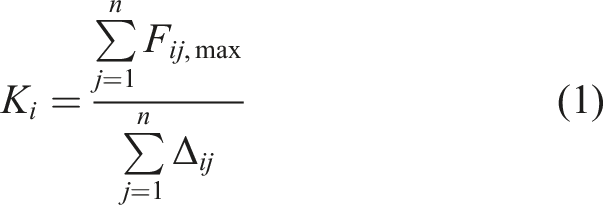
Note:
The developing processes of stiffness degradation of CF and CFS are different. At the outset, the stiffness degradation of CF is strikingly evident; after the yielding and along with the development of damage caused by cyclic loading, the stiffness degradation curves (both experimental and numerical) gradually flatten. The result of CFS is different from the beginning as the stiffness of CFS is significantly much smaller than that of CF (nearly half). Hence the decline of curves (model and test) is not obvious and the curves of CFS are much smoother. This is partly due to the previous damage, and the other reason may be caused by the fact that the crack developing speed in the positions retrofitted with ECC at the end of beam in CFS is lower than that of original concrete in CF.
In addition to the whole developing process of curves, the final statuses of two frames also vary. At the later loading stage, the stiffness of CFS is larger than that of CF, showing good stiffness degradation performance.
After comparing the parameters (including hysteretic curve, skeleton curve, ductility and stiffness degradation, etc.), it can be confirmed that the seismic performance of structures retrofitted with ECC can maintain basically the same level as the original structure. Considering the simplicity in the whole repairing construction process (mentioned in Section 3), it can be demonstrated that the structure with ECC can achieve the requirement on replaceable (or repairable) members or components, and to make the primary structures quickly repaired.
Damage analysis
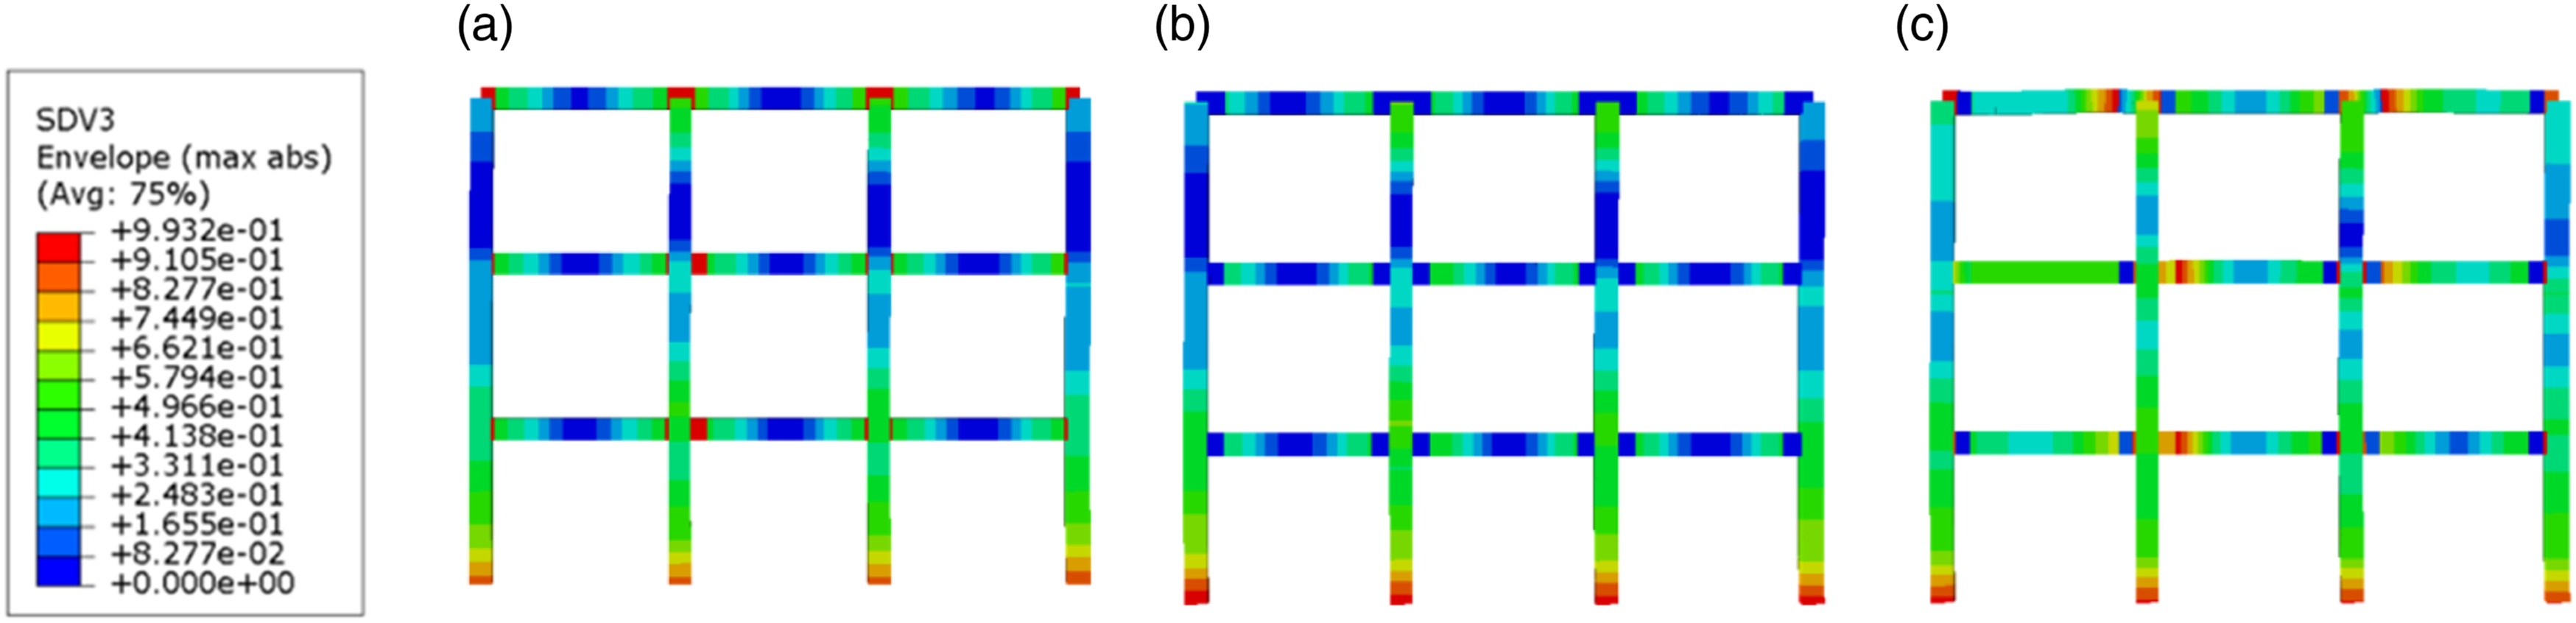
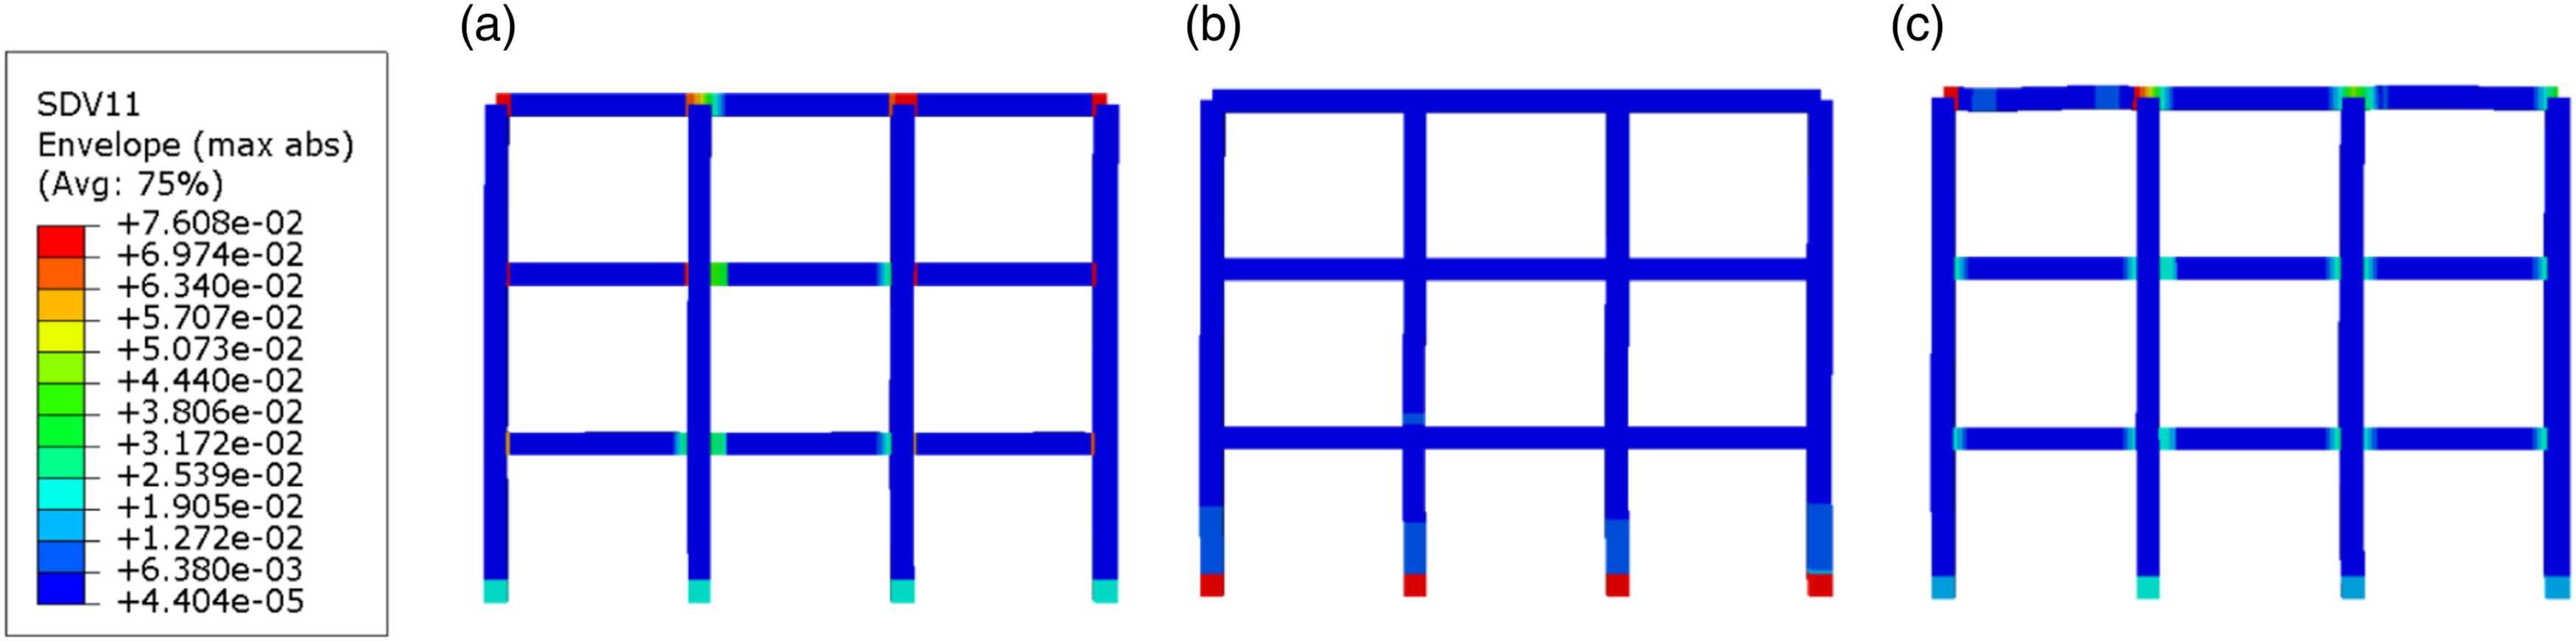
The damage analysis of CF is shown in Figure 16(a) and Figure 17(a). It can be seen that except the span of the beam and the lower part of column, the tensile damage of frame is widely distributed in the whole structure, and the cracking of concrete occurs in almost all positions. The strain pattern of CF is shown in Figure 18(a), showing that larger strains appear in the beam end and column footing, while the strain values in other areas are smaller. This indicates that although the cracking of the concrete has occurred in a large area of the whole frame, the crack width is small and difficult to be directly observed with the naked eye during the test. Tensile damage of concrete: (a) after loading (CF); (b) before loading (CFS); (c) after loading (CFS). Compressive damage of concrete: (a) after loading (CF); (b) before loading (CFS); (c) after loading (CFS). Maximum tensile train of concrete: (a) after loading (CF); (b) before loading (CFS); (c) after loading (CFS).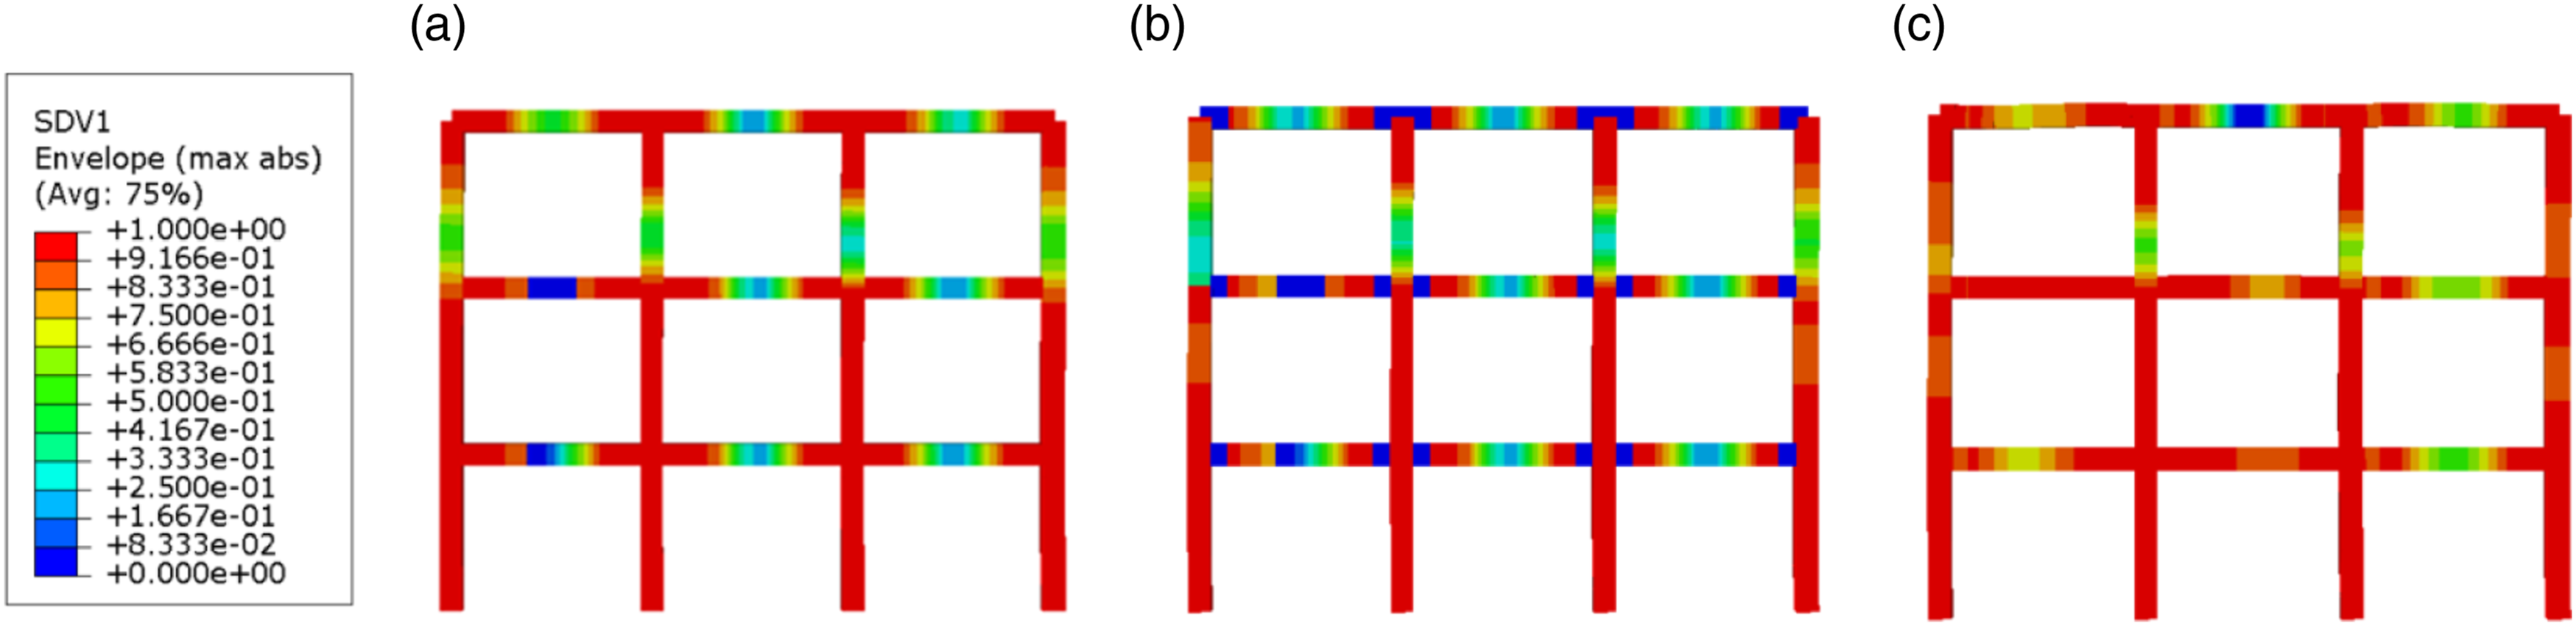
The maximum compressive damage of the model occurs at the beam ends of each layer, and the stiffness degradation shows that the concrete stiffness in those zones at the beam ends has degraded to less than 1%, indicating that the concrete has been completely crushed, which is consistent with what is observed in the experimental test. The concrete at the foot of the column at the bottom layer has slightly less compression damage than the beam ends, and its remaining stiffness is also less than 10%, which is consistent with the slight spalling observed in the test.
Combining the hysteretic curve, damage distribution and frequency reduction and other parameters listed above, the simulation results can reflect the damage and destruction process of the specimens accurately.
The repairing results are shown in Figure 16(b), Figure 17(b), and Figure 18(b). It can be seen that the damage in other positions remains unchanged, but the compressive and tensile damage in the positions retrofitted with ECC are both 0. Although the overall damage reduction of the structure is not changed, the most severely damaged regions caused by the compressive damage have been repaired.
After finishing all loading steps, the tensile and compressive damages of CFS are shown in Figure 16(c) and Figure 17(c). It can be found that the tensile damage is further developed and the damage spreads to the middle section of the beam-column elements, indicating that the microcracks are widely distributed at each member of the frame. Similar to the analysis results of CF, although the tensile damage of CFS spreads widely, the tensile strain of CFS (Figure 18(c)) shows that the strain in most areas still remains at a low level, indicating that the tensile cracking is maintained at a small scale.
Conclusion
In order to further investigate seismic performance of post-earthquake structures retrofitted with ECC, a new ECC constitutive model is proposed in this paper, and the Python is used to secondary develop the principal structure model of the material for the finite element software Abaqus. Combined with the experimental data, the frequency, bearing capacity, energy dissipation performance, structural damage and other parameters are analyzed to demonstrate the effectiveness of ECC in post-earthquake structural repairing. The comparation between original structure and post-earthquake structure retrofitted with ECC is carried out. The following conclusions can be concluded: (1) Newly proposed constitutive model of ECC and related modelling method conducted in Abaqus have been proved to be feasible and effective through the comparation of hysteretic curve, skeleton curve, damage pattern, etc. The model can be good reference for actual engineering projects. (2) The feasibility and effectiveness of ECC are fully demonstrated by comparing the seismic performance of post-earthquake with and without retrofitting ECC structures. The “repairable” characteristic can be used in the design of earthquake resilient structures. (3) The structure retrofitted with ECC can reach basically the same level of load bearing capacity as the original structure. Although the initial stiffness of retrofitted structure is relatively smaller than that of original structure, it has much better deformation capacity with the similar energy dissipation capacity as the original structure.
Footnotes
Declaration of conflicting interests
The author(s) declared no potential conflicts of interest with respect to the research, authorship, and/or publication of this article.
Funding
The author(s) disclosed receipt of the following financial support for the research, authorship, and/or publication of this article: This research was funded by Scientific Research Fund of Institute of Engineering Mechanics, China Earthquake Administration (Grant No. 2021D22). This research was also sponsored by Natural Science Foundation of Shanghai (20ZR1424500).