
Abstract
The true realization of the benefits of vibration based structural health monitoring (VBSHM) in real-world applications is acquired through long-term continuous monitoring so that one can attain a detailed grasp of the behavior of the monitored structure. The challenges in long-term continuous VBSHM include: the large volume of accumulated monitoring data; the effective extraction of engineering information amid the influences of noise and uncertainties embedded in the monitoring data; maintaining continuity and consistency in the long-term monitoring data considering that the system and instrumentation may change due to sensor failure or renewal due to advances in sensing technologies. To meet these challenges, this paper presents recent research that has resulted in the development of a framework and specialized signal processing and data analytic tools for long-term continuous VBSHM suitable for real-world monitoring applications of structures in the field. These include efficient tools for large scale intelligent data processing and analysis, management of monitoring database and extracted information relevant to the structural health of the monitored structure. The novel Automated In-Line Full Space Identification (AI-FSI) method is presented to address the needs and challenges associated with long-term continuous VBSHM, such as the automation of all data processing and analysis operations including modal parameter estimations and mode tracking, and the need of minimizing the measurement and computational uncertainties and variability in the operational modal analysis results. A smart self-diagnostic system for the monitoring of the health of the data collection sensors and monitoring system has also been developed that will allow the consistent use of the monitoring data of different sensor configurations and era in the monitoring project. Examples on the efficiency of analyzing the monitoring data collected over 20 years from the Confederation Bridge monitoring project in Atlantic Canada by using the developed novel framework and data analytic tools are presented.
Keywords
Introduction
Vibration-based structural health monitoring (VBSHM) is a sub field of structural health monitoring (SHM) where field-measured vibration responses are used for condition assessment of civil engineering structures for safety and/or maintenance purposes. The goal of VBSHM applications is reliable and consistent non-destructive condition assessments of structures (such as bridges, buildings, dam, towers, etc.). The main objective of this paper is to expand on the current knowledge of VBSHM, with a focus on the practical aspects of long-term continuous vibration monitoring such as data collection, data management and large scale data processing and analysis, which leads to proper condition assessment and damage detection. The Confederation Bridge’s long-term remote vibration monitoring project in eastern Canada provides an important backdrop for the work described in this paper.
Long-term vibration-based structural health monitoring
The goal in the development of the SHM methodology is that it can be an alternative means to the traditional practice of relying on visual inspection to ensure the high performance and long-term durability of critical civil structures that also reduce operating and maintenance cost by early detection of problems and allowing effective mitigation measures. With recent advances in system identification techniques, VBSHM has been attracting increasing interest as a promising method for non-destructive evaluation of civil engineering structures. From the vibration data, modal properties, such as vibration frequencies, mode shapes and damping ratios, of the structure can be extracted. By treating the estimated modal parameters of the structure as features and by monitoring these extracted features over time, any observed changes in the modal frequencies, mode-shapes or damping ratios are considered as manifestations of possible damage or deterioration of the structure. It is well understood in structural dynamics that changes in modal parameters reflect changes in physical properties (such as stiffness and mass) and therefore in the physical conditions of the structure. However, difficulties arise in real-world applications of VBSHM in the field, where monitoring data are affected by noise and other uncertainties of the environment. The solution to alleviate this problem and facilitate correct interpretation of the engineering information embedded in the data is to establish and understand the trend and detailed behaviour and characteristics of the monitoring data by long-term collection of the information, even over the entire service life of the facility.
It is only through long-term continuous monitoring that one can attain a sufficiently detailed grasp on the characteristics of the monitoring data and behavior of the monitored structure that would allow the true realization of the benefits of VBSHM in real-world applications. Establishing a detailed baseline of “healthy” vibration signatures of a civil structure early in its service life will aid in the development of robust condition assessment techniques. While these advantages are well understood, the realities of establishing and maintaining a long-term monitoring program are not without difficulties. Not the least of which is the fact that the life cycle of a civil infrastructure is typically much longer than the life cycle of the monitoring instrumentation. In a long-term monitoring program, the instrumentation may undergo several cycles of renewal. While designing the renewed instrumentation systems, careful attention must be accorded to assure data quality and integrity. In fact, data quality, integrity and continuity must be considered as criteria of the highest importance in the design and implementation of a long-term continuous VBSHM project.
Understanding the baseline characteristics and long-term trends and evolution of the monitoring data not only increases the confidence in the use of the extracted information, but also reduces the detection threshold of any change in the structural health condition of the monitored structure. The use of large volume of continuous monitoring data in VBSHM processing has the effect of reducing the influences of noise and uncertainties in the monitoring data through cancellation.
For long-term monitoring, specialized instrumentation systems are permanently installed on the structure to capture routine operational response data as well as responses from extreme events such as earthquakes, hurricanes or impacts. The captured monitoring data during and after extreme events can be used to rapidly evaluate the structure’s safety, its performance and condition. Vibration-based monitoring systems are generally non-intrusive and they do not interfere with the normal function and operation of the monitored structure. To extract the needed information from the large volume of data acquired from these monitoring systems, efficient signal processing, numerical operations and data analytic tools are essential for reliable fault tolerant automatic system identification of the monitoring data. The recent advances in operational modal analysis (OMA) have provided researchers with effective system identification techniques that can be used to gain valuable insights on the statistical properties of the OMA-derived parameters (frequencies, mode shapes and damping ratios) and uncertainties in the environmental effects of the monitoring data through statistical filtering algorithms (Desjardins 2019). This has led to significant advances in practical damage detection and deteriorating condition assessment in real-world VBSHM applications in the field (Londono 2006; Desjardins 2019). It is recognized that the most reliable approach for early detection of structural health problem is by long-term continuous monitoring as compared to periodic short-term collection of monitoring information. In comparison, long-term continuous monitoring not only can achieve the best possible combination in performance and sensitivity in detecting changes in structural health conditions at the earliest possible stage of deterioration, once problem has been identified it can also keep track on the rate of deterioration in the monitored structure so that data informed decision can be made at appropriate time that would save cost and enhance safety at the same time. However, it is also recognized that there are special needs and challenges in long-term continuous VBSHM of real-world structure in the field. The specific challenges in long-term continuous VBSHM include: (i) efficient and timely processing and analysis of the continuous flow of large volume of monitoring data; (ii) effective detection of trends and abnormality in the data and extracted engineering information amid the influences of noise and uncertainties embedded in the monitoring data; (iii) maintaining continuity and consistency in the monitoring data collected over long period of time during which the monitoring system and instrumentation may change due to sensor failure or renewal of sensors and other equipment due to advances in sensing technologies.
To meet these challenges, this paper presents recent research that has resulted in the development of a framework and specialized signal processing and data analytic tools for long-term continuous VBSHM suitable for real-world monitoring applications of structures in the field. These include efficient tools for large scale intelligent data processing and analysis, management of monitoring database and extracted information relevant to the structural health of the monitored structure. A smart self-diagnostic system for the monitoring of the health of the data collection sensors and monitoring system has also been developed that will allow the consistent use of the monitoring data of different sensor configurations and era in the monitoring project for long-term evaluation of the structural health of the monitored structure.
Advanced operational modal analysis
Operational modal analysis (OMA) refers to the system identification of modal properties of a monitored structure from its response monitoring data. It is generally the approach of VBSHM applications adopted for large scale civil engineering structures in the field due to the lack of control or information on the input excitations that caused the vibration response of the structures, and is the basis of many damage detection and condition assessment algorithms.
Structural responses caused by normal operating loads, such as ambient wind or traffic induced load actions as commonly in the case of bridges, are referred to as ambient responses, which are the basis for continuous long-term vibration-based structural evaluations. The estimation of modal parameters from these ambient responses has been shown to present significant challenges due to the large volume of data, the high computational load, the high level of uncertainties and the non-linearity in the input excitations, the relatively low amplitude of the responses, the high noise contaminations of the data, the non-stationarity of the signals, the non-linearity of the structural behavior resulting in high uncertainty of the signals. Special system identification algorithms that can effectively reduce the effects of noise contaminations by means of signal correlations have been proven to be the most robust output-only identification techniques. Meeting the challenges requires the development of robust, consistent and automatic identification tools for operational modal properties of monitored structures, which would then be able to realize the goal of reliable condition assessment of real-world VBSHM problems with actual uncertainties and variabilities in the field.
Despite being a relatively new field, OMA has attracted significant attention in the research community and has become more viable especially where traditional experimental modal analysis (EMA) techniques cannot be used (Ren et al., 2005; Yan and Ren 2015; Yan et al., 2019). For large-scale civil structures like bridges, it is impractical to carry out forced vibration measurements which have been the common practices for EMA and considered as the most reliable means for vibration-based evaluation of mechanical systems. Consequently, operational loadings are relied upon as the input excitations in the dynamic response measurements of bridges. Since it is typically impractical nor feasible to measure the operational forces, output-only system identification (or operational modal analysis) techniques are required in the analysis of such vibration response data. Recent advances in OMA include automation and mode tracking (Reynders et al., 2012; Ubertini et al., 2013; Marwitz and Zabel 2018).
Critical review and comparison studies of different state-of-the-art system identification techniques have been presented by a number of researchers (Peeters 2000; Rahman 2012; Londono 2006; Peeters and Ventura 2003). Among the different system identification techniques proposed for civil engineering monitoring applications, the stochastic subspace identification (SSI) method has been found to be a reliable OMA technique which compares favourably to other available methodologies.
Stochastic subspace identification
The SSI method, also known as Covariance Block Hankel Matrix method (CBHM) (Jakobsen 1995), is a robust output-only identification technique that is similar to the Eigensystem Realization Algorithm with Data Correlations (ERA-DC) (Juang 1994) except that the ERA-DC method uses data correlations of the system impulse responses, which are estimated from both input and output measurements, instead of using data correlations of the output-only responses as in the SSI method.
The dynamic behaviour of physical systems, such as civil engineering structures, is traditionally modeled through a discrete-time approximation, which is represented by the following matrix equation of motion

Although theoretically the order of the system n can be determined, when analyzing the data from real structures, the model order is typically masked by the noise in the data. The noise may arise from a combination of sources such as: modeling approximations, measurement inaccuracies, the use of finite datasets to compute estimates of the correlations, non-stationarity and non-linearity behavior in the data, etc.
To overcome the problem of the unknown and hidden system order, the solutions from the models of different order are presented in a stabilization diagram where the distinction between “true” or stable system solutions and “spurious” solutions caused by the noise becomes apparent to the analyst. A typical stabilization diagram is shown in Figure 1. For a more in-depth look at the SSI method the reader may refer to the following references: Peeters (2000); Peeters and De Roeck (1999); Londono (2006). Typical stabilization plot showing stability of poles.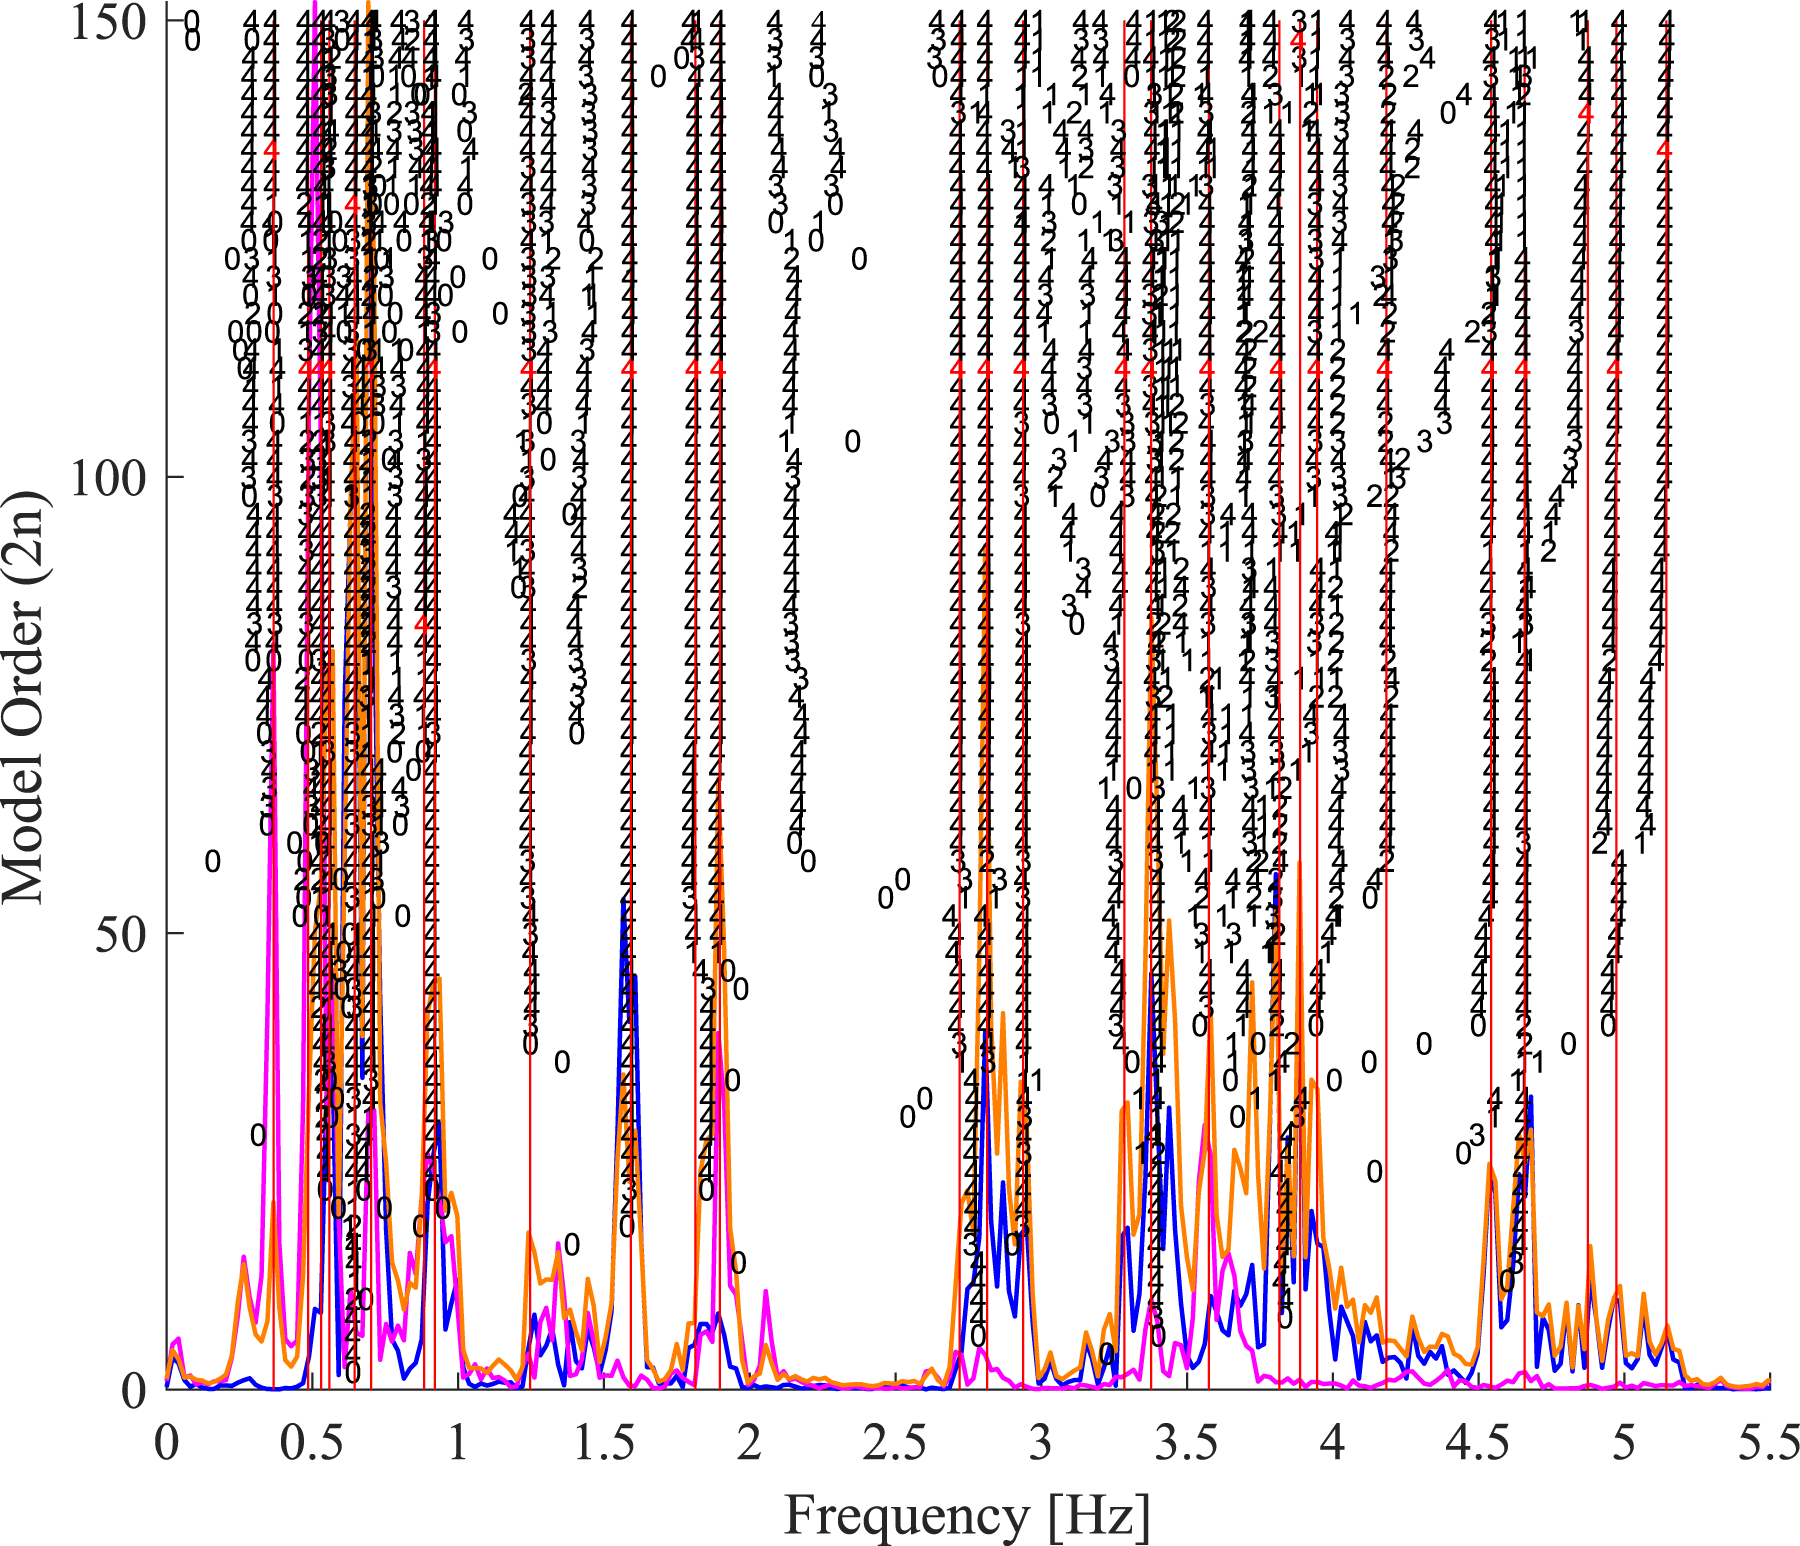
As the preferred method of OMA for the past 15 years on the Confederation Bridge monitoring project, the SSI technique was instrumental in obtaining the dynamic characteristics of the bridge for design verification (Londono and Lau 2003b; Rahman 2012) and for identifying variability in the operational modal estimates (Londono et al. 2004, 2013; Londono and Lau 2003a; Desjardins 2005). A baseline variability of 0.6% standard deviation of identified frequencies from ten data sets of similar loading scenarios and environmental conditions shows that it is possible to retrieve highly consistent modal frequencies using the SSI technique (Londono et al., 2004). Londono et al. (2013) established a general variability of 1.1–2.2% standard deviation of identified frequencies using 42 datasets of varying loading and environmental conditions. The limited number of datasets considered for these early studies shows the evident need for more advanced tools to permit large-scale reliable data processing and analysis. The development of these new tools and techniques focused on automation, accuracy and efficiency.
Automated in-line full space identification
A new Automated In-line Full Space Identification (AI-FSI) method is described here to address the needs associated with long-term continuous vibration-based structural health monitoring, such as the automation of all data processing and analysis operations (including modal parameter estimations and mode tracking), and the need for high quality OMA results with minimal measurement and computational uncertainties and variability.
The original SSI algorithm, developed more than 25 years ago, had to deal with a major constraint, that of computer processing limits. Many operations were in fact limited by the computer processing capabilities. Some data operations were originally implemented with the only objective of reducing computational requirements all the while introducing possible sources of uncertainties and variabilities in the results. With advanced computing exploiting parallel processing capabilities and with the proposed improvements to the SSI technique described below, the operational modal parameters thus extracted will be of high quality with minimal computational noise.
A new method for the automation of the modal parameter estimations from the stabilization diagrams is presented here and is an integral component of the proposed AI-FSI technique along with the novel mode tracking algorithm also described in this section.
Full space identification
The original SSI technique uses only a small subset of reference sensors, instead of all available sensors, for the computation of data correlations to reduce computing time. This can have significant impact on the quality and completeness of the identification results. In the proposed method, the complete block Toeplitz matrix is calculated with the output correlation matrices using all available sensors. This is a significant improvement made possible by modern computing practices.
Equation (2) shows the full output correlation matrices.

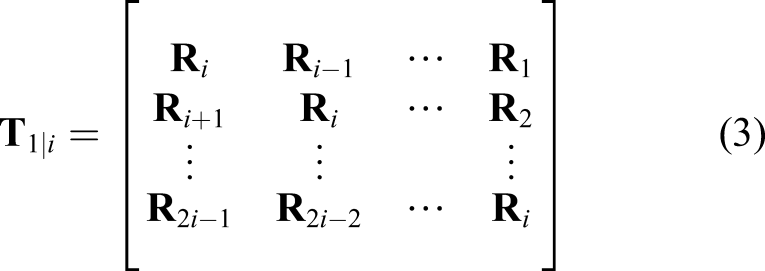
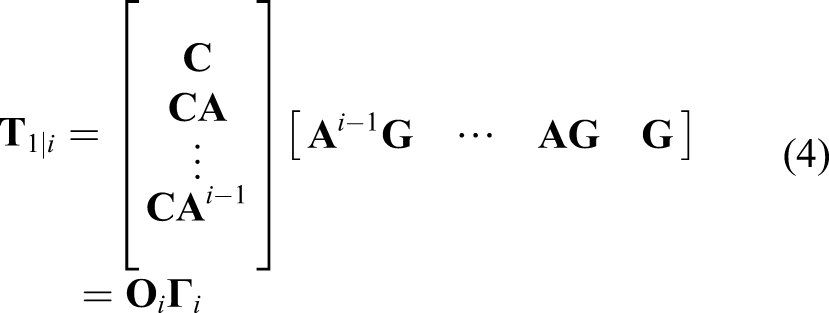
The full output correlation matrices computed at different time lags are then gathered into the full block Toeplitz matrix as in equation (3).
In operational modal analysis applications, typically many sensors are used to measure the response of the structural system in order to obtain the mode shapes with a reasonable spatial resolution. By using all available information, the quality of modal identifications (especially in regards to mode shapes) is maximized, and the computational noise is minimized. As a result, computation loads are substantially increased since many more correlation computations are performed. However, with proper code implementation of the AI-FSI algorithm to fully exploit the parallel computing capabilities of modern computers, the computing time can be kept at a level that permits in-line analysis of the monitoring data for real-time applications.
Automated modal parameter estimations
The manual pole-picking from the stabilization diagram as required in the original SSI technique is not well-suited for the automatic data processing necessary for handling the large continuous flow of data captured in long-term continuous vibration monitoring applications. A custom clustering algorithm is developed and integrated in the AI-FSI algorithm for the automation of the modal parameter estimations carried out in this study. Reynders et al. (2012) identify five target criteria that should be respected when considering a fully-automated approach for the interpretation of stabilization diagrams: • The method should not rely on more than one dataset, or on prior estimates; • The method should be as physically intuitive as possible and be similar to the manual analysis; • The method should produce similar results as in a manual analysis; • The method should work in an OMA framework and with any parametric system identification algorithm that produces a stabilization diagram. • The method should not contain parameters that need to be specified or tuned by the user.
Recently, several OMA techniques that employ clustering algorithms have been developed that mostly satisfy the aforementioned criteria (Neu et al., 2017; Ubertini et al., 2013; Marwitz and Zabel 2018). A new clustering algorithm meeting all these criteria that is efficient together with the AI-FSI algorithm has been developed in the present research. It should be made clear that the algorithm described below is used for modal parameter estimations (MPE) on a single dataset of measured signals. A distinction needs to be made between MPE and mode tracking, which is the tracking of a single mode through time by repeated MPE. A separate novel algorithm for mode tracking has been developed and implemented in this study and is described in the following section.
The clustering algorithm for MPE works recursively on the solutions of the FSI algorithm (Figure 2). Starting at the highest model order nmax all solutions modes are used to initially seed the clusters. If nmax was set to 400, then there are 400 different solution poles available for initial seeding. For each subsequent model order in descending order the solution poles are added into the seeded cluster bins according to modal parameter match (mode shape, frequency and damping ratios). Mode shape comparisons are calculated using the modal assurance criterion shown in equation (5) (Allemang 2003) Clustering algorithm for modal parameter estimations.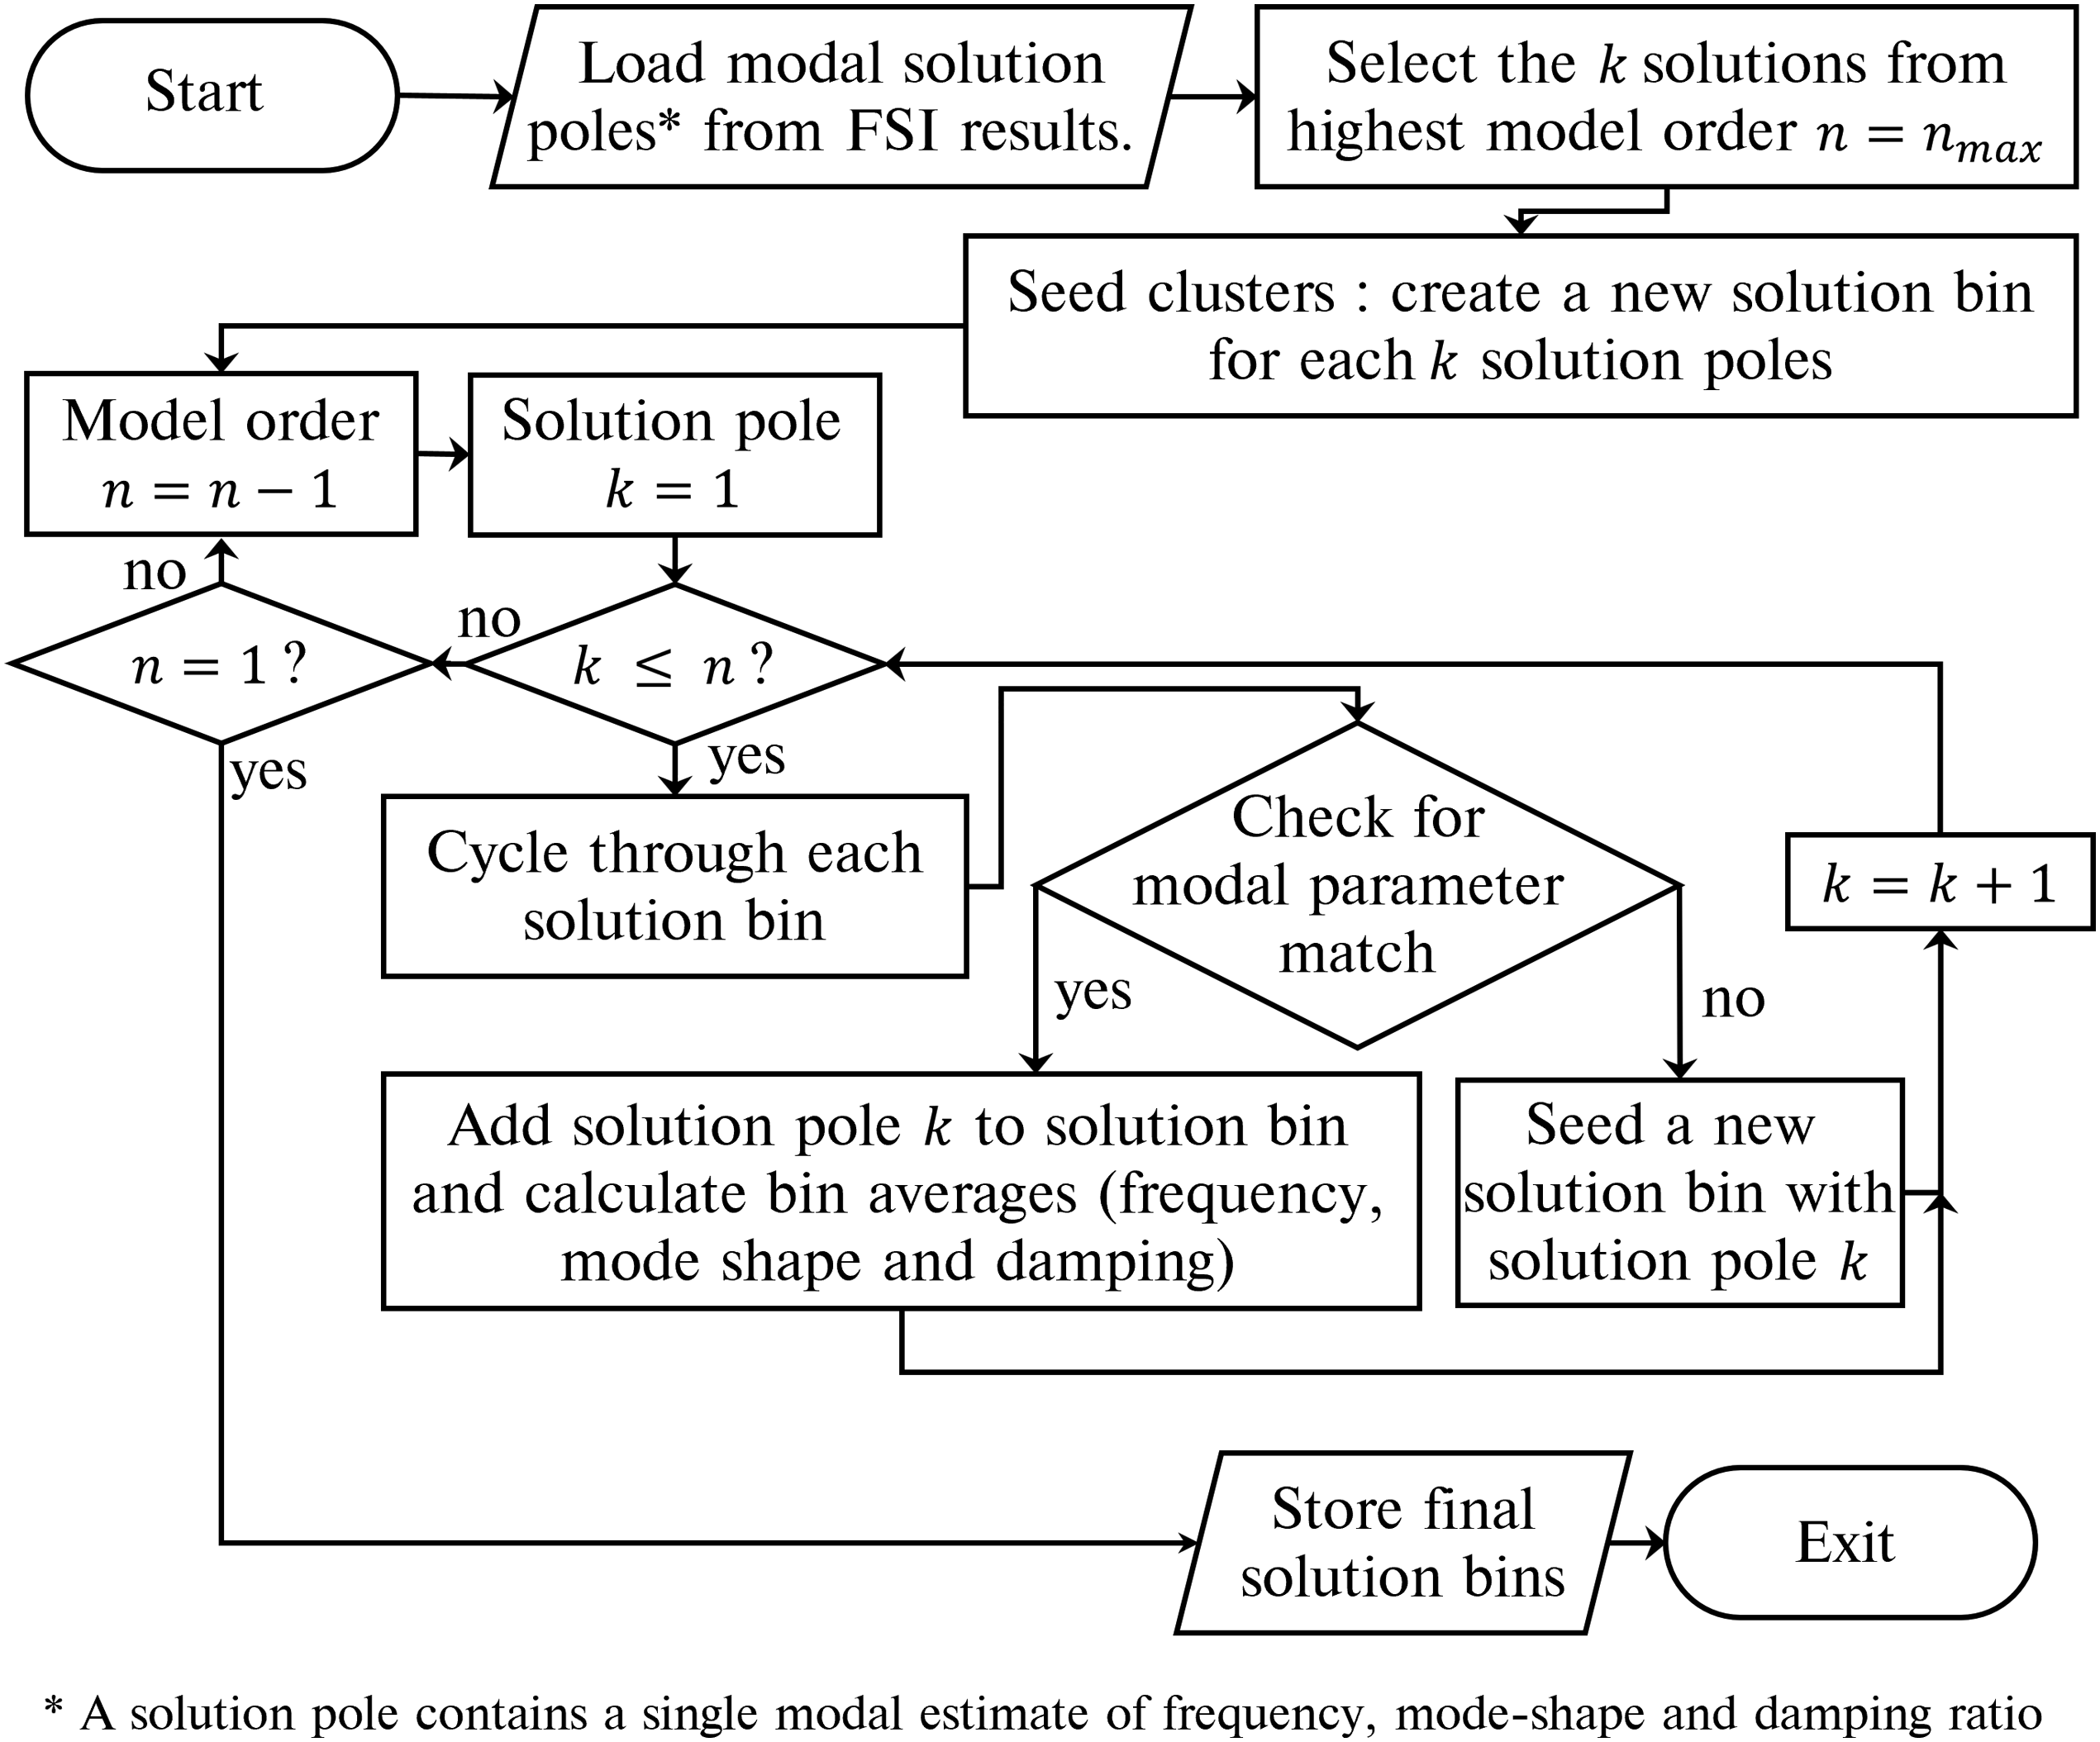

By setting the maximum order of the model nmax relatively high, many spurious, non-physical solutions are generated by the identification algorithm. With clustering, the spurious numerical solutions (which occur randomly, are not properly sorted and are distributed uniformly over the frequency spectrum) are effectively filtered out by the algorithm. At set intervals, the algorithm flushes out the spurious solutions which are represented by small cluster sizes. Only clusters that contain consistently-identified solution poles through the model orders are kept as true mode solutions. A large cluster size indicates good mode consistency through the model orders. The threshold on cluster size to identify true modes from spurious modes must not be set too low to avoid including non-physical solutions. A threshold of nmax/8 is used here to validate consistently-identified modes. The size of each cluster provides a measure of the strength of identification and is stored as an operational parameter by the algorithm. This parameter serves as an indication of mode quality.
Mode tracking by recursive reduction of the MAC matrix.
The tracking of the evolution of a single mode through time from multiple MPE is much more complex than the modal parameter estimations of a single dataset. Difficulties lie in the fact that all modal parameters vary due to various environmental and operational influences. Literature suggests to use hard-validation criteria to sort out complex modes, which is not always applicable in the cases of closely-spaced modes (Brincker and Ventura 2015; Marwitz and Zabel 2018), as the mode-shape may lie in a subspace that is spanned by two corresponding modes shapes of closely-spaced modes. Reynders et al. (2012) suggests using baseline modal parameters to start an automated modal tracking algorithm.
Described here is a novel two-stage approach to the grouping of modes proposed for long-term modal tracking. In the first stage, the dominant modal frequencies are identified based on their frequency of identification as determined from histogram calculations of multiple MPE. These dominant modes are used to start the modal tracking algorithm. In order to confirm proper mode pairing of modal frequency and mode shape, a clustering algorithm is employed to group modes around the identified dominant modal frequencies. A relatively high frequency range (±20%) is considered in this first step so as not to hide potential frequency variations due to damage or deterioration. It is possible and not uncommon that the identified clusters may overlap during this first clustering step. Also, by grouping modes according to frequency only, there is also a high likelihood that several closely-spaced modes are grouped together in a single cluster. These are typical scenarios that are properly handled by the algorithm.
In the second stage of the mode tracking algorithm, inside each cluster, the modal assurance criteria of equation (5) is calculated to ensure that compared modes are indeed the same mode and not separate closely-spaced modes (Pastor et al., 2012). Each mode shape is compared to all the other mode shapes within each cluster by calculating the MAC matrix. By averaging across a single dimension of the MAC matrix we obtain average MAC values for each of the identified modes. The algorithm then recursively reduces the MAC matrix by excluding the modes with average MAC values below a minimum threshold. For each subsequent iterations, the threshold is incrementally increased until the minimum MAC value for a single mode inside the sub-cluster is greater than 0.75. A true mode sub-cluster is therefore confirmed when the smallest average MAC value of a mode shape with all other mode shapes inside the sub-cluster is greater than 0.75. This threshold is chosen so as not to exclude modes with variations of mode shapes due to environmental or operation influences or due to damage or deterioration. The excluded modes are gathered and passed through the recursive MAC matrix reduction algorithm again in order to find other true mode groups (in the case of closely-spaced modes). This step is repeated until there are no more modes to group. The result of this second stage are sub-clusters of true modes inside each dominant frequency clusters. Theses sub-clusters are assumed to be true grouped modes.
It should be noted that a relatively high computational load is required for the repeated calculation of the MAC matrix. Optimization of computation steps is possible, however with proper code implementation, parallel processing keeps computing times reasonable. OMA results using the AI-FSI algorithm are presented in a subsequent section.
Intelligent data processing and analysis for VBSHM
To properly capture motions of a physical system such as a bridge, the sampling of information needs to be performed at relatively-high frequencies; in the order of 100 Hz–250 Hz. This range of sampling frequency is typically required to prevent aliasing and to permit proper capture of all significant vibration modes of civil structures. These relatively-high sampling rates combined with long-term monitoring operations produces large amounts of structural response data that needs to be efficiently managed, processed, analyzed and evaluated. The great amount of collected vibration data shows there is evident need for an intelligent computer application for rapid and efficient data management, signal processing, and system identification operations.
The initial development of the Signal Processing PLatform for Analysis of Structural Health (SPPLASH) was completed in 2004 and is presented by Desjardins (2005); Desjardins et al. (2006). SPPLASH is a centralized intelligent computer application for all VBSHM operations. What distinguishes this computer application are the sophisticated easy-to-use custom graphical user interfaces (GUI) created for all vibration-based data operations and interactions as shown in Figure 3. The visualization modules integrated in the platform are practical and provide useful engineering information. The ability to visualize animations of structural responses (deformations and mode shapes; both extracted and numerical) is an asset for any structure’s engineer and/or operator. Detailed descriptions of the data processing, data visualization, data animation and operational modal analysis modules are included in Desjardins (2005). Screen-capture of the SPPLASH application modules for all VBSHM data operations.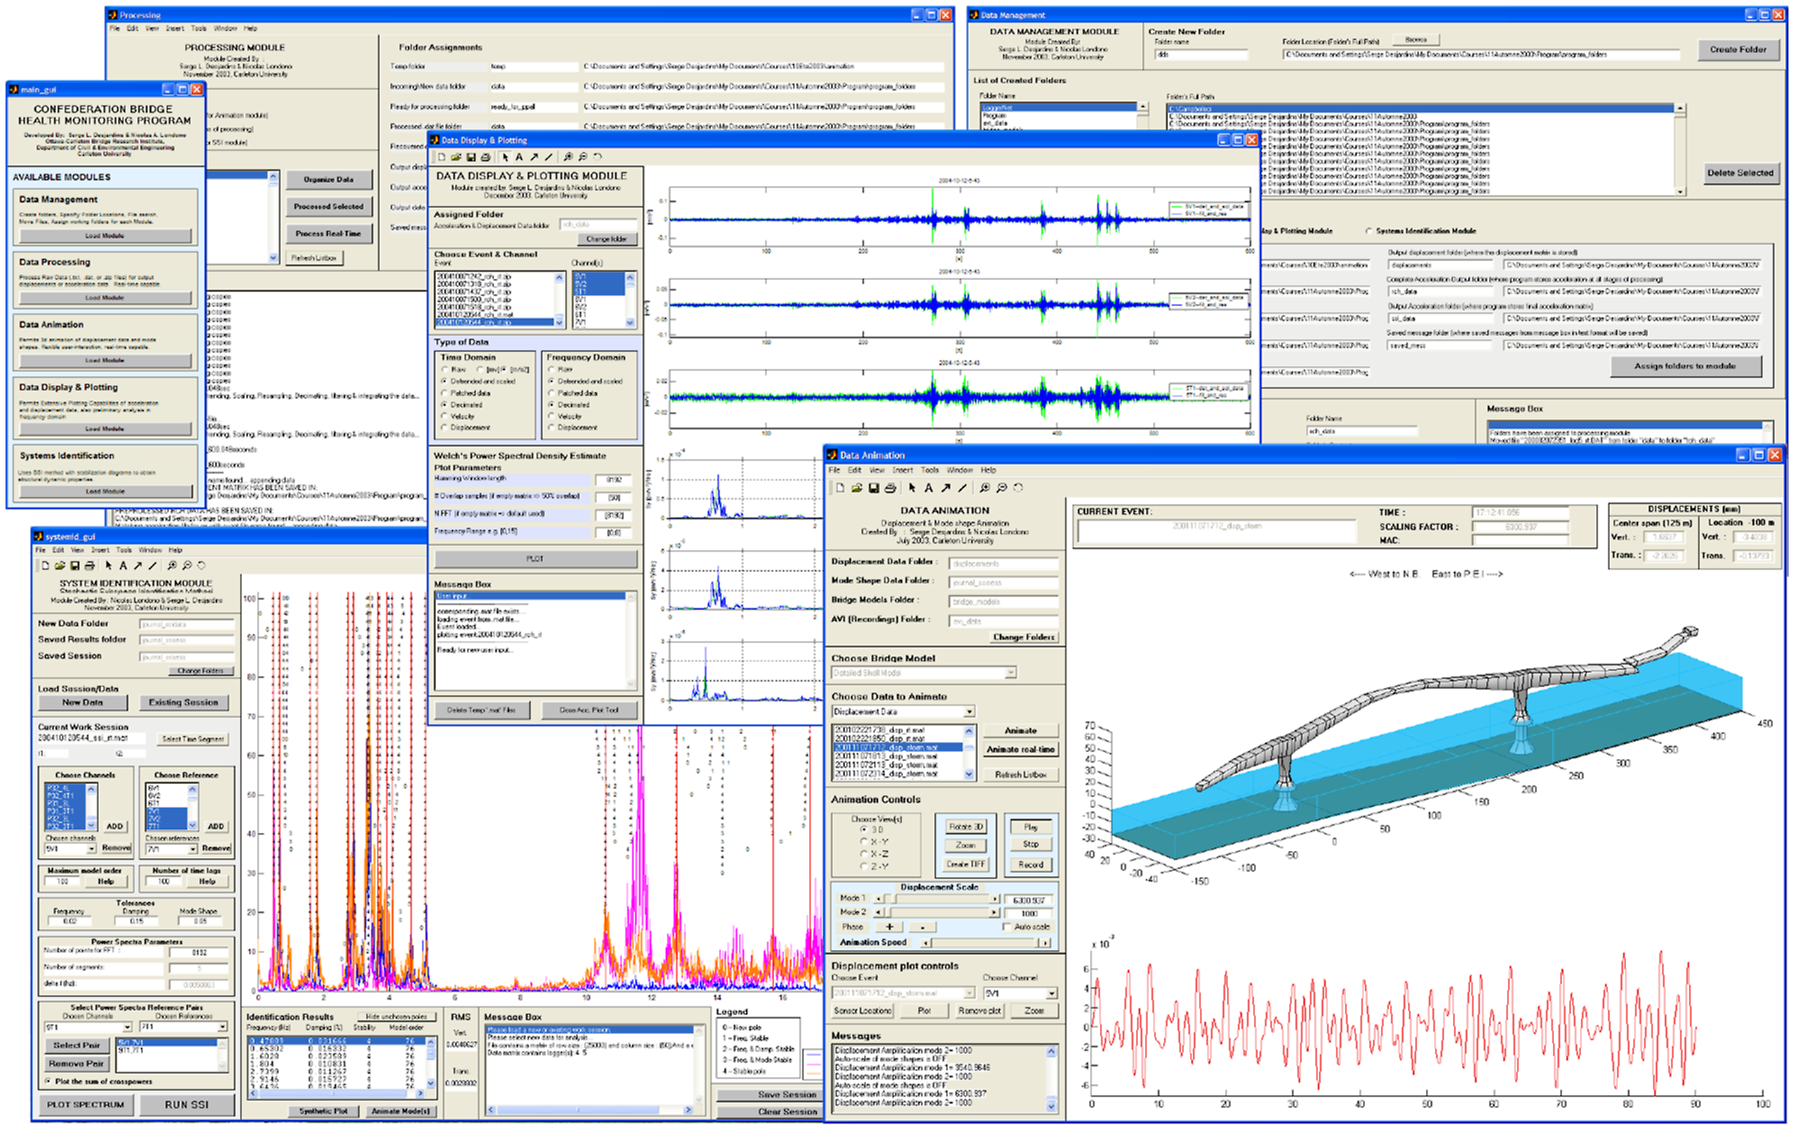
The essential components and the new recent additions to the SPPLASH application are described here.
Database creation and management
Firstly, a database management system that automatically collects, archives and organizes raw and processed vibration response data is an essential component of any intelligent VBSHM application. The main function of the newly updated database module is the creation of databases. The steps for creating a new database are described by Desjardins and Lau (2019). The database module can function in real-time or in automatic batch mode when the user points to a directory containing raw data. Once the raw data is acquired, all the pre-processing and processing operations are automatically carried out in the background.
Data analysis can also be performed automatically by the database management engine or manually by accessing the system identification module.
The database module includes a database viewer window (Figure 4). The database viewer permits visualization of the data files captured by the monitoring system. Shown in Figure 4(a) are all the logger data files captured over 11 days in November 2014. The module also has zoom and pan capabilities to permit quick searches for data in the chosen time frame. Screen capture of new Database Management module of SPPLASH.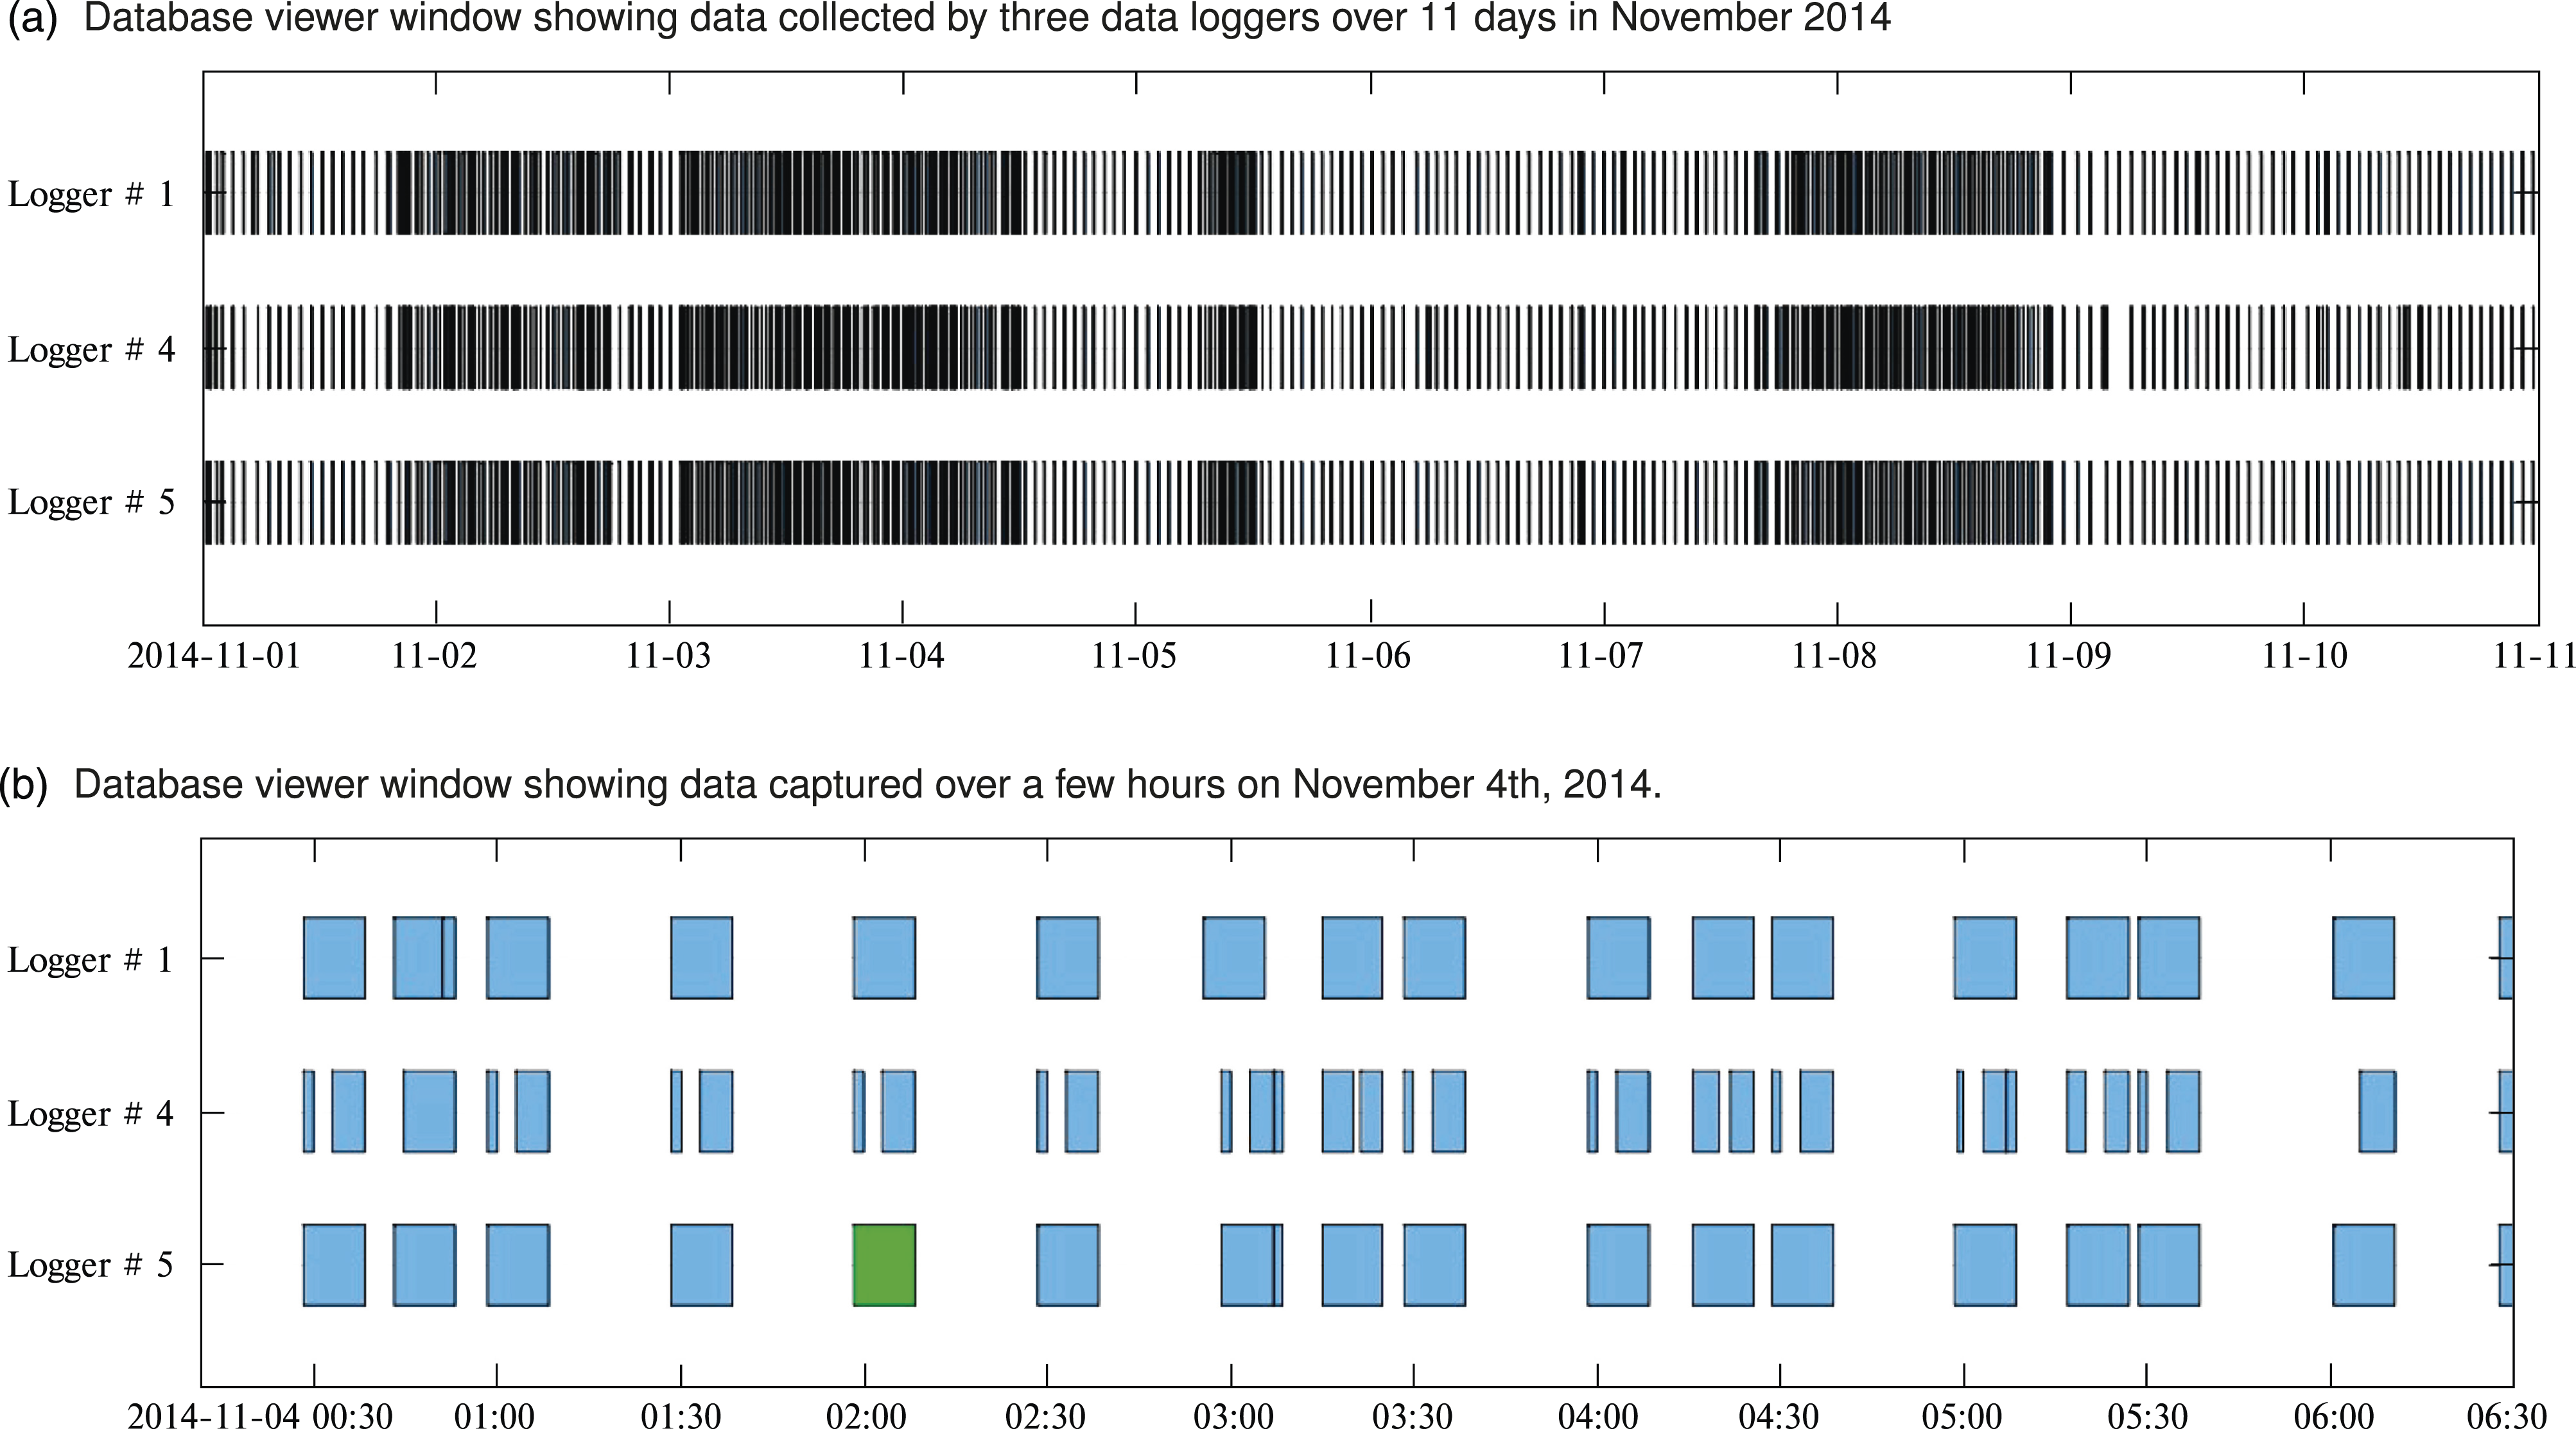
Figure 4(b) includes a zoomed view of the timeline plot showing data captured over 7 h on 4 November 2014. Further capabilities of the module include clicking on an element in the timeline plot to gather metadata information on the selected data file.
As an added feature, the database viewing capabilities allows for qualitative determinations of data acquisition issues. As can be observed in Figure 4(b), there are data collection issues with logger no. 4 that create fragmented data files which should be investigated and corrected. This is an example of how the timeline plots included in the database viewer permit quick assessment of the condition and validity of data collection operations. This feature also serves to visualize the synchronization issues between the collected logger files. The collection times of the logger files are plotted in this figure according to the time stamps related to the internal logger clocks. Collection lags can be quickly identified.
Other functions of the database management module include: opening and searching existing databases, adding data to an existing database, checking for database integrity, fixing or refreshing databases. The last two capabilities are automated and required if manual modifications are made to the databases.
Data synchronization
It is evident, that for the system identification techniques to work and give meaningful results, data from multiple sensors and data loggers must be synchronized precisely.
Figure 4(b) shows the imprecise alignment of logger files based on internal logger clocks.
An algorithm is developed that searches through the trigger channels (as identified by the file header) of the logger data files to find trigger instances. A trigger instance occurs when a low voltage signal is sent from one data logger to the other data loggers when a specific response threshold is surpassed (a strong vertical acceleration measured at a specified sensor location due to the passage of heavy truck, for example). The algorithm can identify and align the synchronized data files according to this trigger signal and send them to the processing engine which then combines them to form a complete synchronized processed event. Additionally, a data synchronicity signal is sent from one logger to the others via the triggering channels at every 5 min to confirm data synchronicity under a multitude of data collection scenarios (such as continuous monitoring or under manual data collection).
As an added verification, a correlation function is used to temporally align the logger files based on the triggered collection patterns of each data logger. Any anomalies are detected and flagged for correction.
Streamlined data processing
All the processing operations performed by the application have been streamlined in order to minimize the effects on the data and to avoid introducing additional computational noise. The objective in data processing is to minimize the variability of the analysis results that will then improve the use of the operational modal estimates in damage detection algorithms. Some processing operations are done on data sets, while others are performed on individual channels. The following data processing operations and procedures are carried out by the processing engine as required: Channel identification and mapping; Purging of duplicate records; Patching small data gaps; De-trending of data (baseline correction); Scaling of data using calibration factors; Re-sampling of data to a common sampling rate; Decimation of data; Un-filtering of channels; Double integration (The signal is doubly integrated to obtain the displacement response of the structure using the cumulative trapezoidal numerical integration (CTNI) method); Signal statistics; Sensor and system diagnostics; Processing outputs. For more details the reader is directed to Desjardins (2019).
Metadata extraction
An important improvement to the SPPLASH application has been the gathering of metadata at all stages of operations. This metadata is useful in querying the database for targeted research. During the initial reading and translation of the raw data files, the metadata is gathered, saved and tagged to the translated logger data files. Metadata is also generated and stored during the processing of events. Some of the metadata tagged to the logger data files, to the processed event files and to the individual processed sensor signals include file name, file path, starting time stamp, end time stamp, duration of recordings, time step, trigger data, number of channels, sensor configuration, processing parameters, signal statistics such as signal strengths and maximums, etc. The metadata of monitoring data is important for establishing consistent assimilated datasets for accurate feature extraction in system identification and their use in structural health condition assessment and damage detection when long-term monitoring data were collected under different sensor and monitoring system configurations.
Sensor and systems self-diagnostics
Another significant improvement to the application is the development of a sensor diagnostic algorithm used to automatically identify the faulty or empty signal channels corresponding to problematic or missing sensors. Once properly identified these faulty signals are removed from the processed output displacement and output acceleration matrices preventing incorrect or erroneous data from being used in subsequent automatic signal processing and system identification steps in the monitoring program.
The algorithm functions in two stages. The first stage considers each signals occupied bandwidth in the frequency domain. If the lower bound of the occupied bandwidth is below a threshold value (taken as 0.01 Hz) the signal is considered faulty and is removed from the processing results. The second stage is carried out as follows: the normalized cross correlations are calculated between each signal and every other signal. The normalization is done with respect to the maximum value of the-auto correlations with a value of one. The maximum absolute value of each correlation is stored in a symmetric matrix of size equivalent to the number of channels.
To confirm that a signal is faulty or empty, an average of the maximum cross correlations values for each sensor is calculated across a single dimension of the correlation matrix and plotted as illustrated in Figure 5. The algorithm identifies faulty or empty sensors when the calculated average falls below one standard deviation. Averaged maximum normalized cross-correlations for each sensor signal from a single dataset.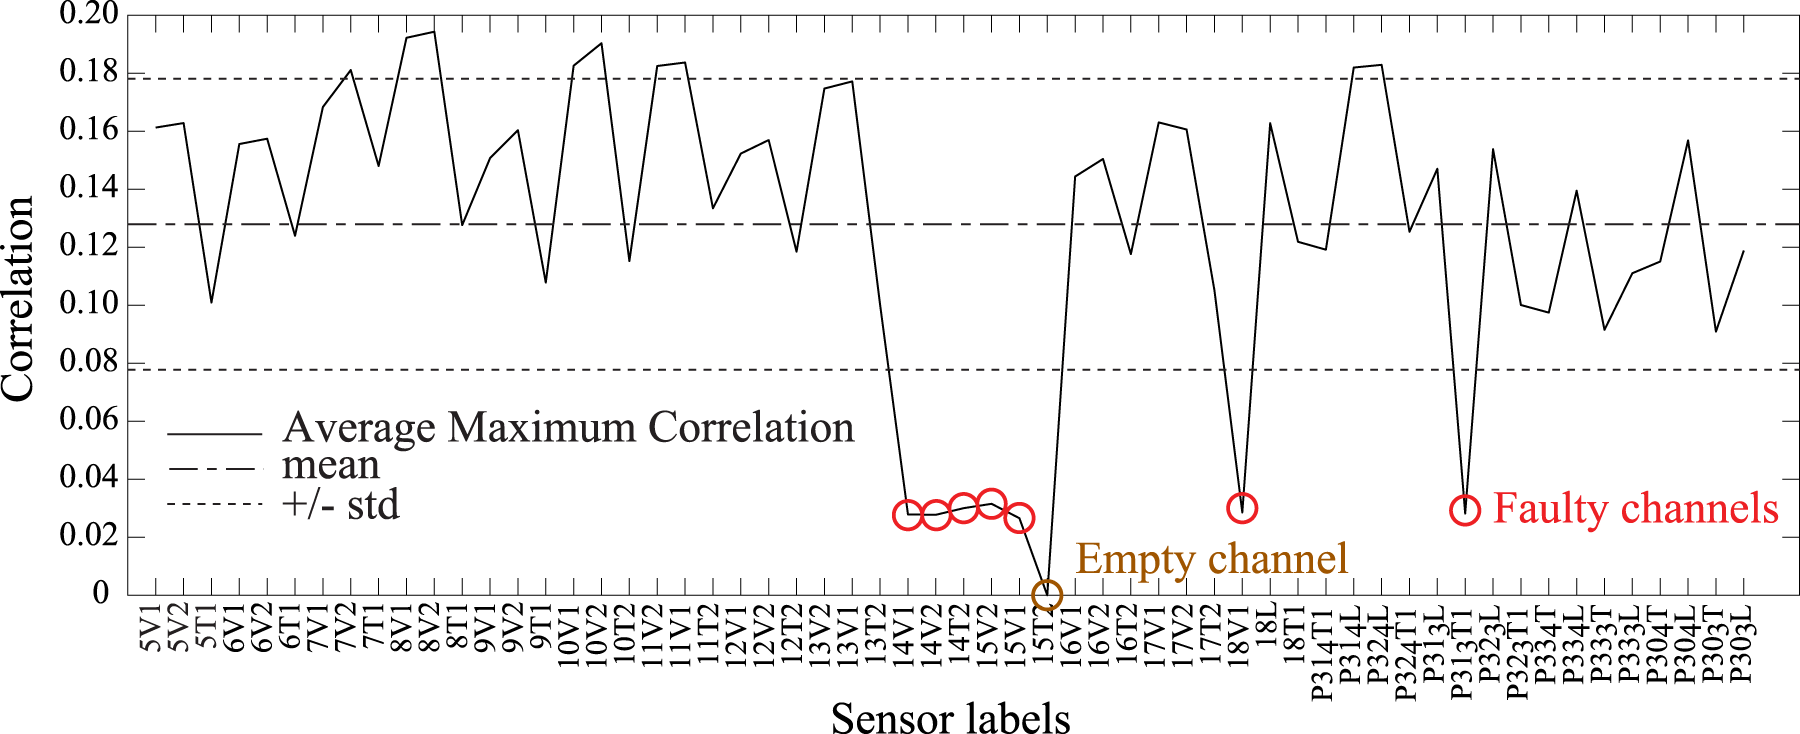
Automated operational modal analysis
The AI-FSI algorithm is fully implemented in the SPPLASH application. After the processing operations, a subroutine identifies all the full processed events (i.e. datasets containing the synchronized data from all data loggers) with a minimum 10 min recording length. The identified full events are then analyzed automatically using the Automated Inline Full-Space Identification (AI-FSI) method presented in the previous section. The AI-FSI algorithm includes a new automatic pole picking algorithm for MPE created to select the physical poles from the stabilization diagram of the modified stochastic subspace identification (SSI) technique. The estimated modal parameter structures and the associated metadata are then stored in the database for future visualization and evaluation and are used as inputs to the mode tracking algorithm.
Confederation bridge VBSHM
Upon completion in the summer of 1997, the Confederation Bridge provides a fixed link between the provinces of New-Brunswick and Prince-Edward Island in eastern Canada. The Confederation Bridge monitoring project is one of only a few documented long-term vibration-based monitoring projects in the world. The project provides a unique opportunity to study real bridge responses from data with presence of real-world uncertainties and noise. With 25 years of captured vibration data, representing one quarter of the bridge’s design service life, the Confederation Bridge monitoring project is a tremendous resource for testing and implementing various state-of-the art system identification and condition assessment techniques.
Bridge Description
With 43 main spans of 250 meters each and a 100-year design life, the 12.9 km long Confederation Bridge is the world’s longest prestressed concrete box girder bridge built over salt water (Cheung et al., 1997). The crossing consists of 21 approach spans, 2 transition spans and 43 main spans at a typical height of 40 meters above the mean sea level (60 meters at the navigation spans) as shown in Figure 6(a). Confederation Bridge elevations.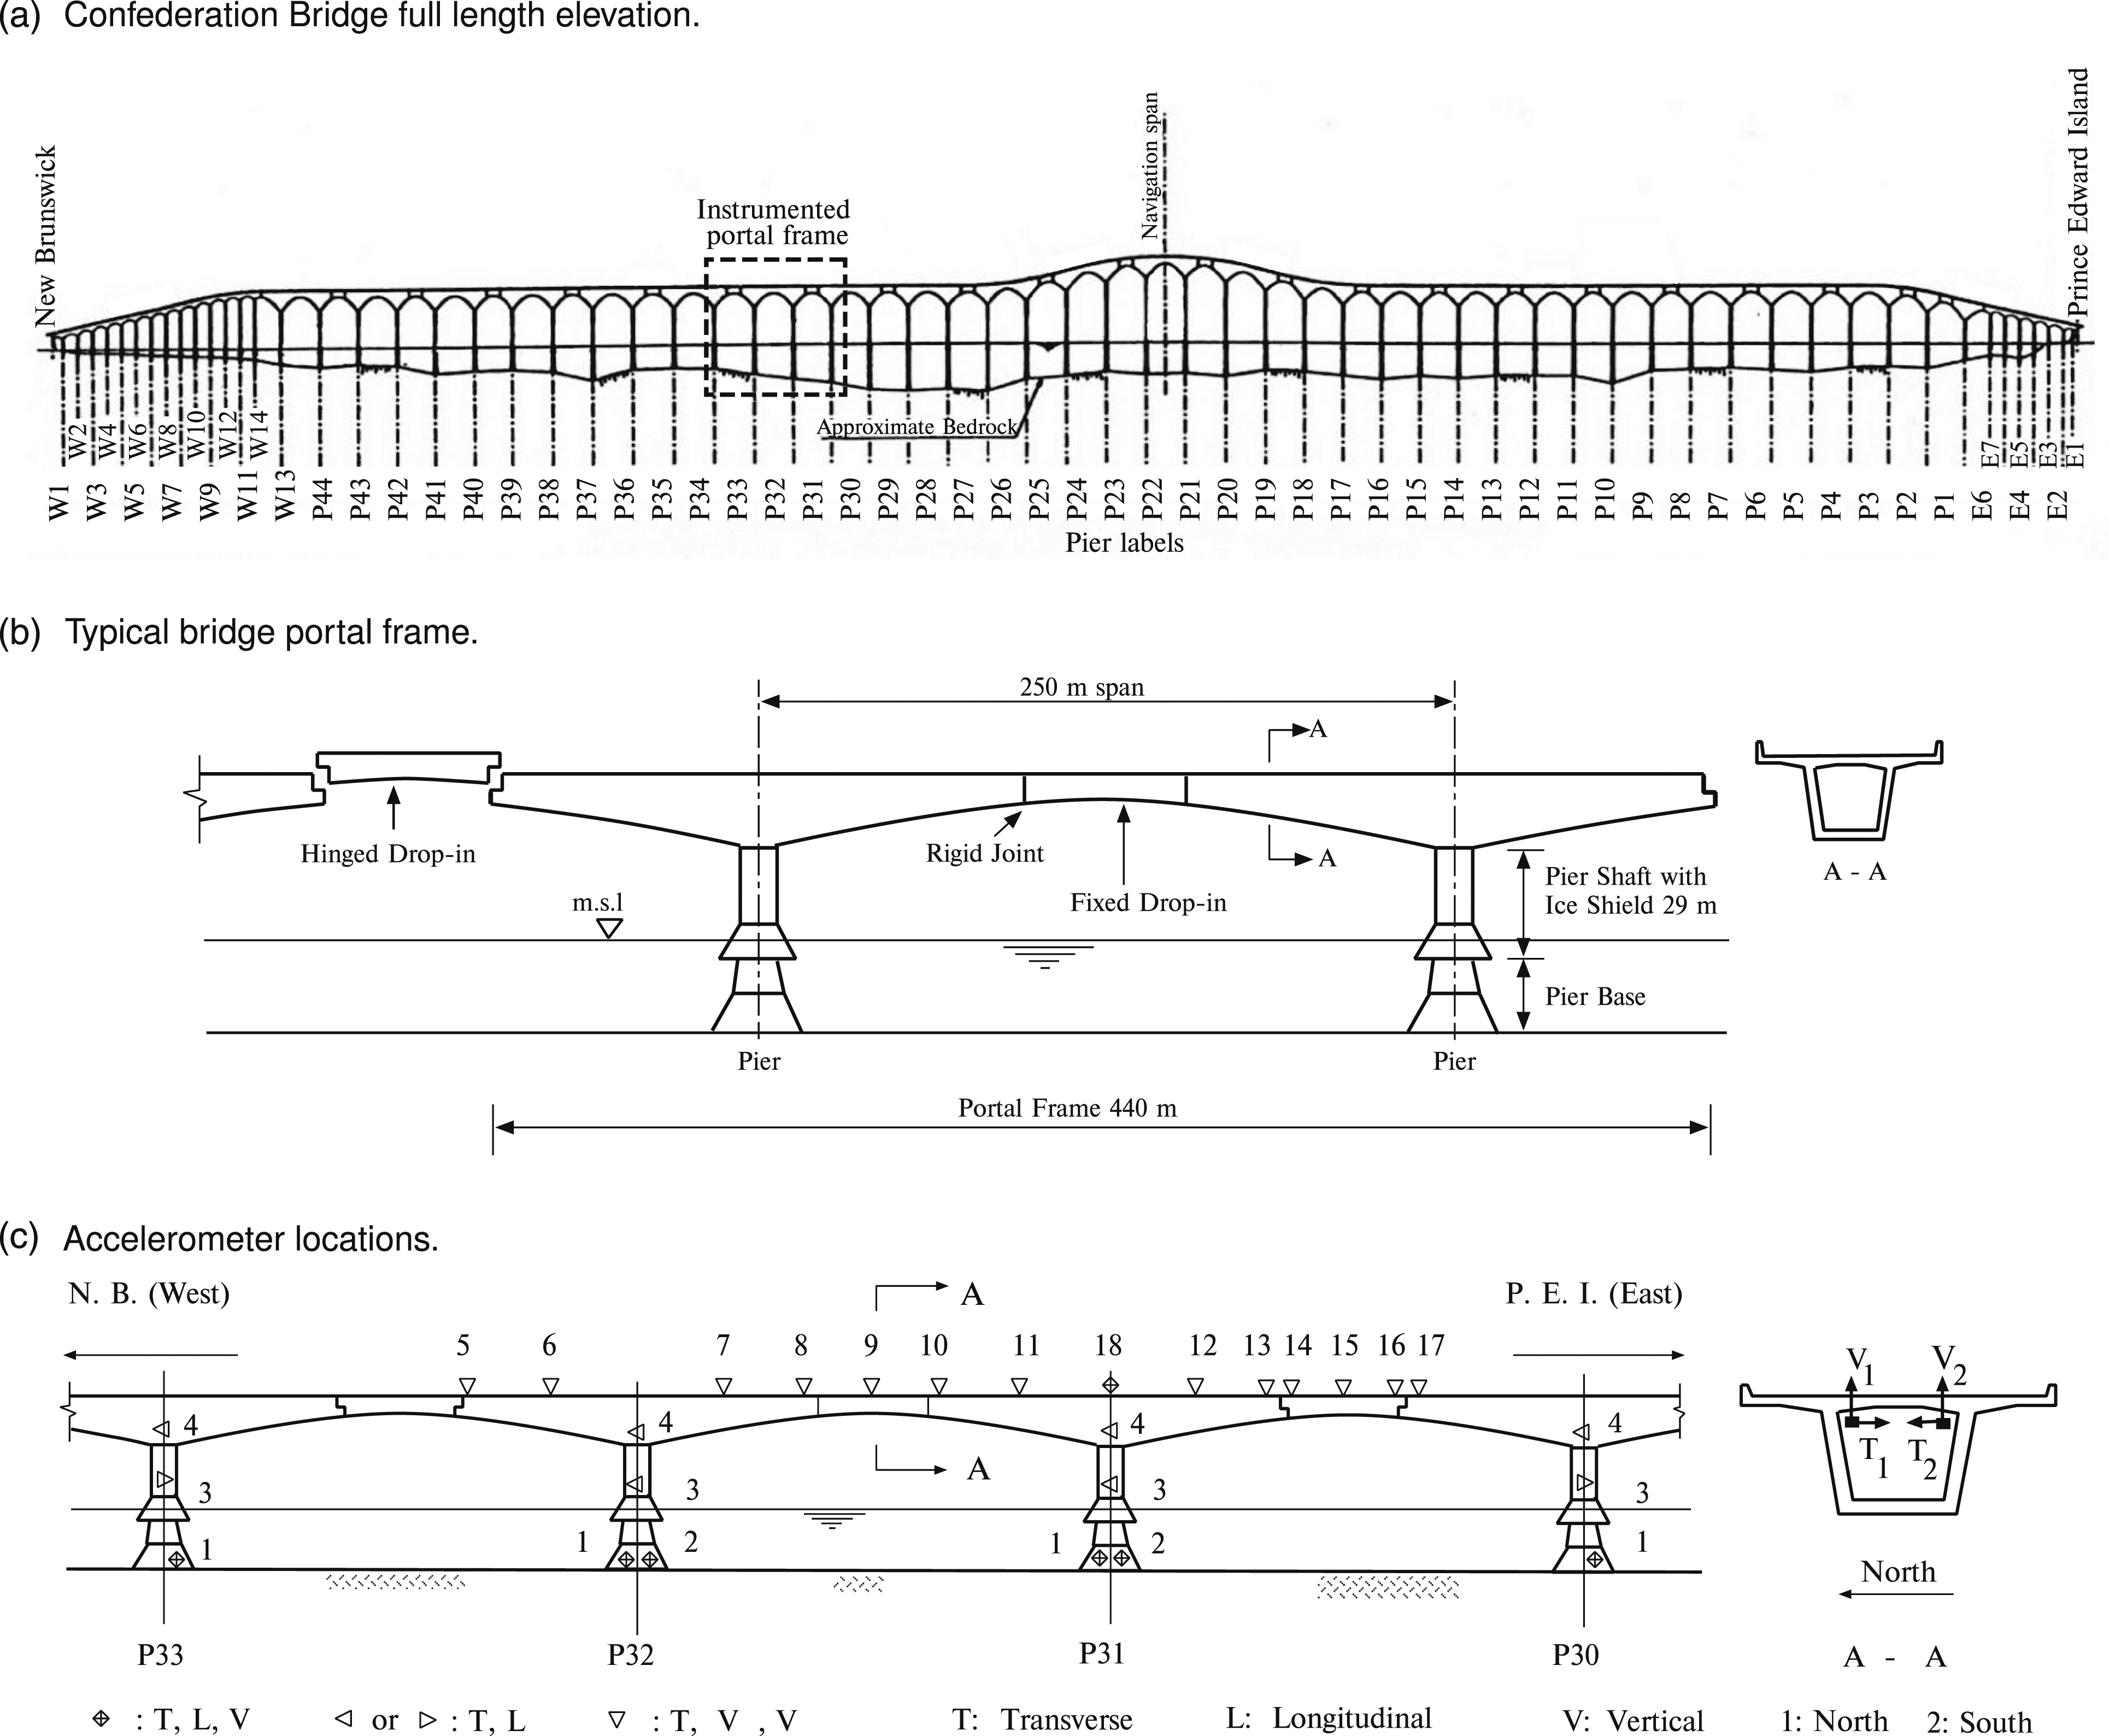
The main-spans portion of the bridge is comprised of 22 repetitive structural frame modules of 500 m length each. Each frame module is a 440 m portal frame made up of a 250 m center span and two 95 m overhangs, one on each side of the center span, plus a 60 m simply supported drop-in expansion span, as shown in Figure 6(b). The portal frame is constructed of four types of prefabricated component units, pier base, pier shaft, main girder and fixed drop-in span girder. The connections between the different units of the portal frame are made continuous by post tensioning, prestressing and grouting. The bridge girders are single trapezoidal cell box girders with section depth varying from 14 m above the piers to 4.5 m at mid-span of the drop-in girder, and a cross-section width varying from 5.0 m at the bottom to 7.0 m at the top, with 2.5 m deck overhangs.
Monitoring system
A comprehensive long-term remote monitoring system on the Confederation Bridge has been in operation since the bridge opening to collect data and information about its behaviour and performance. The monitoring system which was commissioned in December 1997 measures and records both environmental and bridge response data related to wind, ice forces, short and long-term deflections, thermal effects, traffic loading, corrosion and vibration responses (Cheung et al., 1997). All instruments incorporated in the bridge structure are located in two adjacent spans, a rigid frame and a drop-in simply supported span covering a one kilometer stretch of the bridge in the deep-sea part of the Northumberland Strait with some additional wind measurements being also taken at the highest elevation of the navigation span.
The dynamic monitoring system is dedicated to the measurement of the ambient vibration responses of the bridge caused by sources of dynamic excitations, including wind, traffic, ice loads and earthquakes. The vibration instrumentation comprises 76 accelerometers distributed around a typical structural frame module, as shown in Figure 6(c). The response behavior observed in the instrumented segment of the bridge is considered representative of the behavior of the main span portion of the structure. Vibration responses of the bridge girders are measured in the vertical and transverse directions as shown in Figure 6(c). This setup facilitates the recovery of vertical bending, transverse bending and torsional vibration modes of the bridge superstructure. Data loggers are located inside the piers (P30 to P33). Detailed descriptions of the original installed system can be found in Cheung et al. (1997); Montreuil et al. (1998).
Having been in operation for approximately 15 years, the first generation of the monitoring system was showing signs of reaching the end of its service life. Sensors started to fail at greater rate and data acquisition and transmission issues were encountered more frequently. Recent advances in sensor and data acquisition technologies allow a more streamlined approach to the data acquisition process as compared to the original system. Also, the technological advancements with regards to processing, storage and data transmission permit increases to the collection and sampling rates to accommodate current and future analysis techniques.
From December 2012 to March 2014, the vibration monitoring system of the Confederation Bridge underwent a renewal program of the monitoring instrumentation with all accelerometers replaced and upgraded, and new data loggers.
SPPLASH v3.0
Since the monitoring system underwent an instrumentation renewal, an accurate account in the sensor configuration of the monitoring system is critical when both pre-renewal and post-renewal monitoring data are used in data assimilation for examining data trends, system identification processes and condition assessment and damage detection of the bridge in the future. New advances in computing, in storage capacities, and in communications render some tools inefficient or obsolete. Moreover, having been utilized by a multitude of researchers, much feedback has been received over the past 15 years in order to improve or to build upon this application. The third version of the SPPLASH application is complete and is partially described in the previous section with a focus on data management, data synchronization, data processing, metadata, sensor diagnostics and finally on the integration of system identifications techniques including the novel automated operational modal analysis algorithm (AI-FSI). For a full description, the information can be obtained from Desjardins and Lau (2019).
Historical database of processed vibration responses
The Confederation Bridge vibration monitoring project has been in operation since the bridge opening in 1997 with a continuously expanding database of over 20 years of vibration and other monitoring data from the monitoring program. This database includes data from two different data acquisition configurations due to the replacement of all vibration sensing equipment in 2013-2014. The tools required to manage, query and process the data need to be robust, reliable, adaptive and simple of use. New data processing and mining techniques are continuously being developed, which require back processing of historical data. Some damage detection techniques may also require the baseline reference information from the healthy or initial state of the structure. In this investigation, all the historical data from pre-renewal sensor configuration as well as data collected under the new updated sensor configuration are processed and analyzed to build a comprehensive database of extracted modal parameters of the bridge. To accomplish this task, all of the processing and analysis operations are automated by using the SPPLASH application platform in batch processing mode.
Data collection statistics
Most of the instruments incorporated in the bridge structure are located in two adjacent spans, a rigid frame and a drop-in simply supported span covering a one kilometer stretch of the bridge in the deep-sea part of the Northumberland Strait (Figure 6(c)).
For the past 20 years since the bridge opening, researchers from the Ottawa-Carleton Bridge Research Institute (OCBRI) at Carleton University in Ottawa, Canada have been responsible for the high speed data collection operation of the long-term monitoring program. Vibration data are mainly collected by three data loggers numbered 1, 4 and 5 located in the bridge piers as shown in Figure 6(c). Raw data are stored in logger files containing data tables of continuously recorded vibration data from a subset of accelerometers. Data collection parameters have varied throughout the years; while a sampling rate of 125 Hz is most common, sampling rates of 100 Hz, 166 Hz and 200 Hz have been used in the past. Dataset duration has also varied greatly, from 30 s to 10 min. Shorter duration datasets were mainly collected in the first 10 years of the vibration monitoring program. While data collection can be triggered manually (and has been in the past), most of the data collection has been under automated trigger scenarios. The specified thresholds for triggering data collection have varied greatly throughout the past 20 years, according to the needs of on-going research. Consequently, the quantity of data collected has also varied greatly. It should be noted that since October 2015, the collection mode has been set to “continuous”. Meaning that data is collected continuously, independent of trigger thresholds. This results in substantial amounts of collected raw vibration data and a unique opportunity to study bridge behaviour under actual ambient conditions.
Environmental data in the form of wind speed, wind direction and ambient air temperature have also been collected since bridge opening. The wind and ambient air temperature measurements are obtained from existing weather stations installed near pier 20 above the deck of the Confederation Bridge (see Figure 6(a)). The sustained wind measurements are 10-min mean, while gusts are based on peak measurement (one-second mean). Historical wind and temperature data have been collected almost continually since November 1997. On average, a measurement is taken every 6–7 min as shown in Figure 8(a) and (b). Using the available 1.7 million data samples, correlations between environmental conditions and processing and analysis results are made possible.
It should also be noted that the bridge operators limit vehicular traffic on the bridge during strong wind events. Travel restrictions may be enforced when steady winds recorded at the bridge exceed 70 km/h with gusts consistently exceeding 85 km/h. Restrictions during these strong wind events usually only apply to high-sided vehicles, motorcycles, and vehicles with objects in tow. On occasions, when extreme wind conditions occur with sustained winds greater than 100 km/h, the bridge is closed to all traffic.
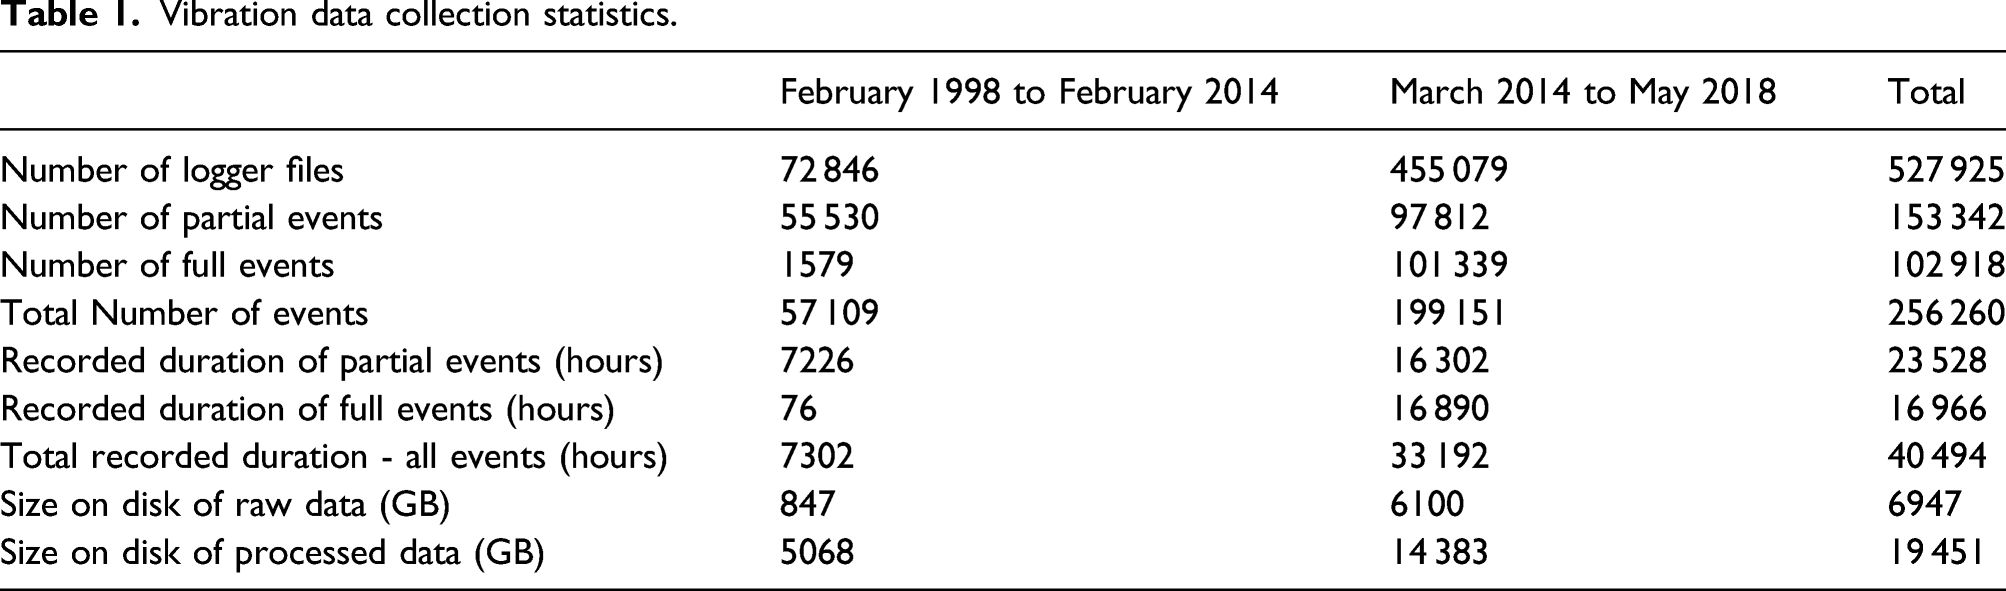
Vibration data collection statistics.
Data collection per data logger.
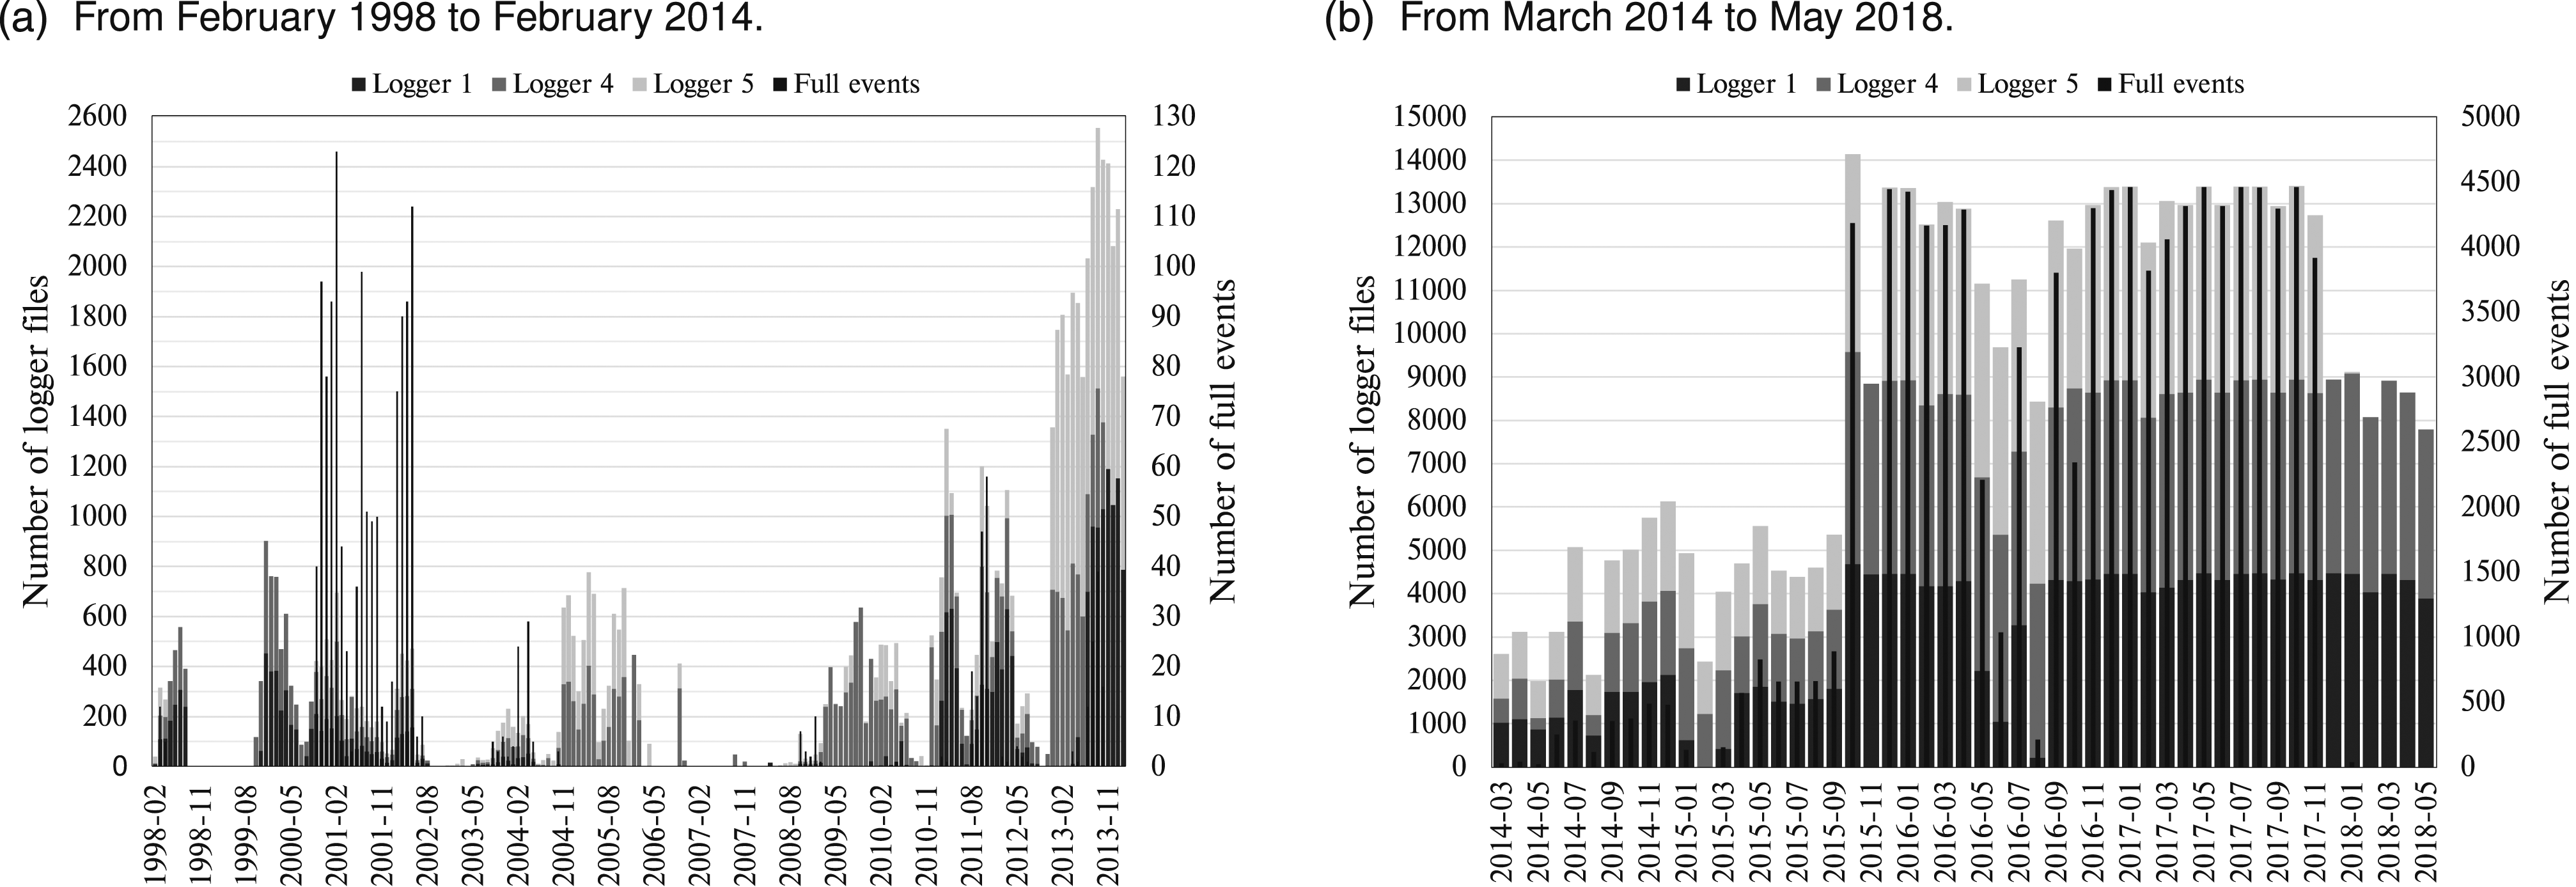
A full event is described as a combination of synchronized datasets from the logger files of logger 1, 4 and 5. Partial events are composed of synchronized data from a subset of loggers. As explained, the length of recording for individual triggered events (either partial or full) is a preset parameter that can be modified by the user and as such is not constant in the data collection scheme. The total duration of events shown in Table 1 was calculated from a cumulative sum of all events for the periods specified. The file size information presented in Table 1 serves as an indication of the amount of data required to be managed under a long-term vibration monitoring program. Figure 7(a) shows the quantity of data (number of logger files) collected between February 1998 and February 2014. This represents the first 17 years of Confederation Bridge vibration monitoring data collected by the first generation of the vibration monitoring system.
The period from December 2012 to February 2014 corresponds to the transition period from the first to the second generation of the monitoring system. During this period a combination of old and new sensors and loggers were in place and the collection schemes were in flux.
Figure 7(b) shows the quantity of datasets (number of logger files) collected between March 2014 and May 2018. This represents the last 4 years of Confederation Bridge vibration monitoring data collected by the second generation of the vibration monitoring system.
The last 4 years of data collection can be split into two periods, the first of which, from March 2014 to September 2015, corresponds to a relative increase in data collection under a new monitoring system. The number of datasets collected in this period varied from 2000 to 5000 a month. A marked increase in the number of full events is also noted, due to better triggering routines and the addition of a synchronized signal communicated to all loggers. The period from October 2015 to May 2018 corresponds to a period of continuous data collection. The maximum number of datasets were collected in this period, which sums to, on average, close to 13 000 datasets per month.
Operational modal estimates
The analysis of historical data includes the extraction of modal properties from full processed events. The estimated modal properties obtained (modal frequencies, mode shapes and to a lesser extent damping ratios) are primordial for the damage detection approach proposed in Desjardins (2019). Full events are data collection events comprised of data collected by the three main data loggers. Potentially, data from all sensors are included in full events; however, due to faulty instrumentation, some sensors are removed from the processed results. This removal is carried out automatically by the sensor diagnostic algorithm incorporated inside the processing engine of the SPPLASH application. The accurate determination of OMA results are dependent on the sensor signals included.
The extracted modal frequencies of the Confederation Bridge are presented for both generations of the monitoring system. For the first generation of data collection (from February 1998 to February 2014), a total of 1569 full events were collected, processed and analyzed. The extracted modal frequencies from these events are plotted in histogram form in Figure 8(c) with bin widths specified at 0.0034 Hz.
Operational modal analysis results are obtained by the MPE algorithm developed for automated selection of solution poles from the modified SSI method. The peak frequencies are labeled directly on the histogram plot of Figure 8(c) with units in Hz. The peaks correspond to the most frequently extracted modal frequencies, and provide a good indication of the dominant modes of the bridge superstructure. Figure 8(a) shows the top modes from each full event plotted temporally with corresponding environmental (wind and temperature) measurements. From this figure we can observe interesting temporal trends in the extracted modal properties. In this long-term perspective, even with sporadic collection schemes, certain trends in OMA results emerge. Clearly, some modes vary according to temperature. The quantification of the correlation of the extracted frequencies with environmental conditions is presented in Desjardins (2019). While the scatter of plotted results for certain frequencies is relatively high for this period, the main modes of vibration of the structure are identifiable. Operational modal frequency estimates.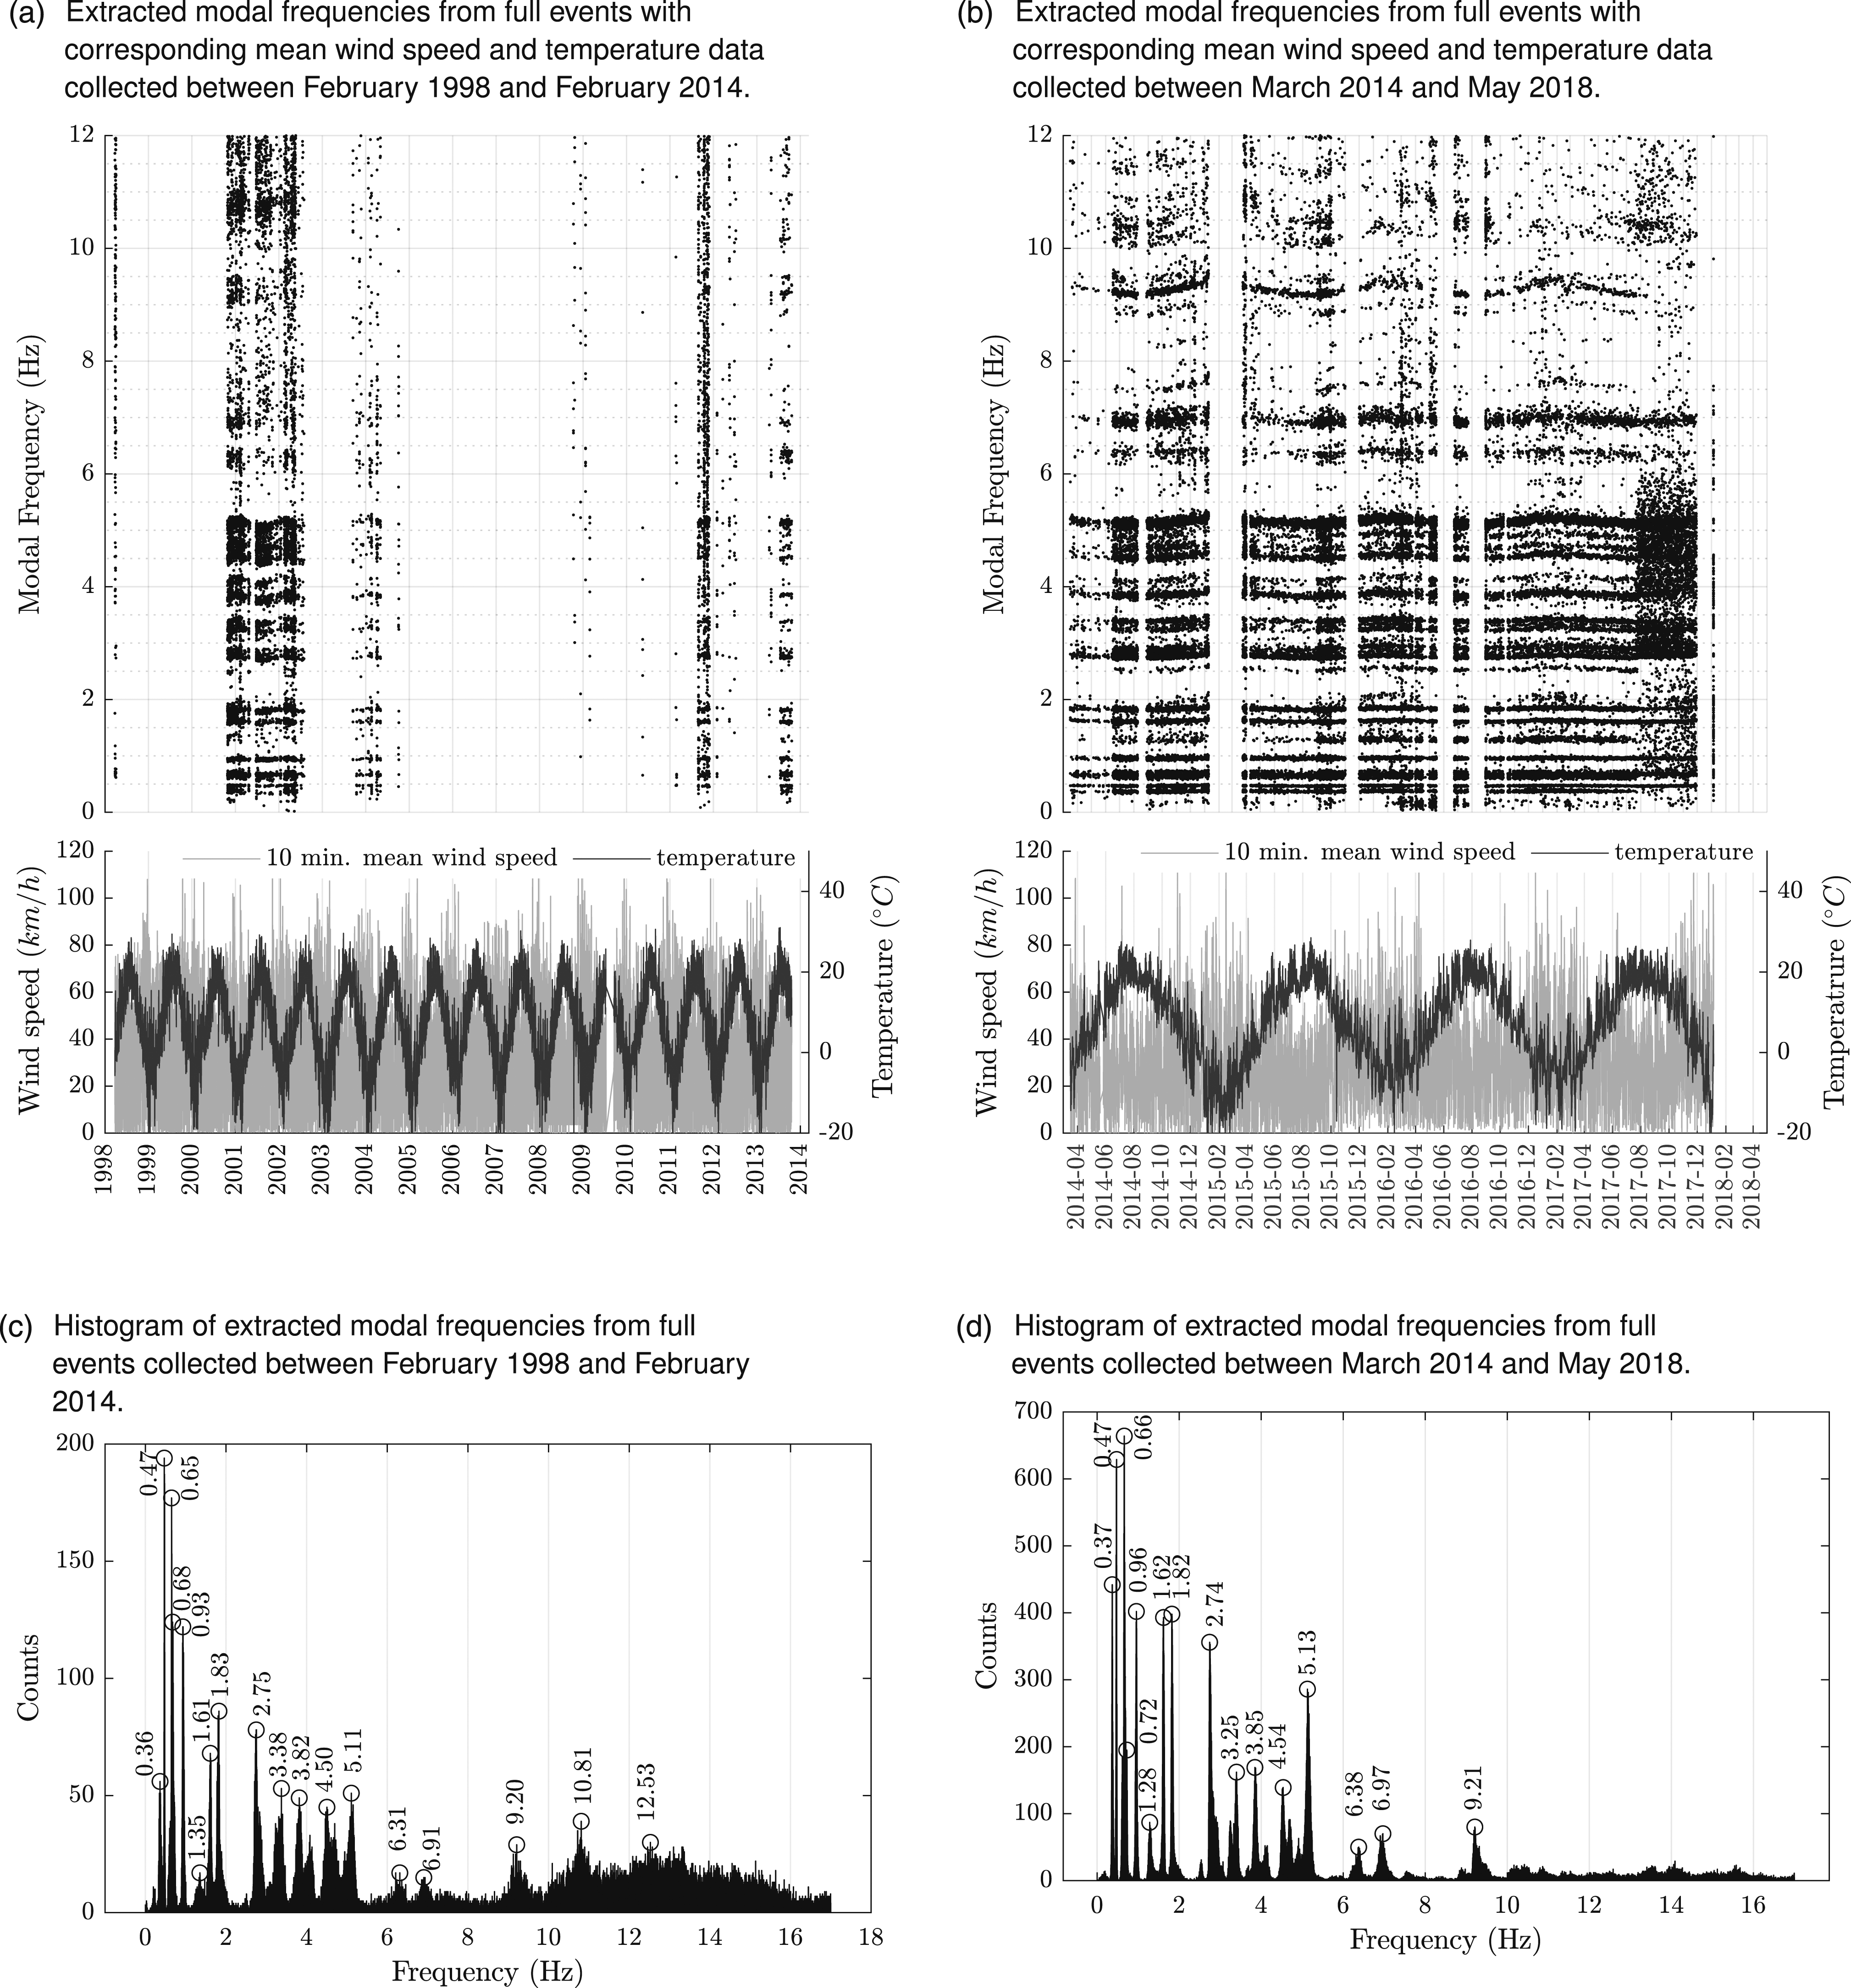
From March 2014 to May 2018, data collection was relatively more uniform, especially after September 2015 when data collection was set to “continuous”. A total of 1 01 339 full events were collected and processed; a subset of which was analyzed with the AI-FSI method integrated in the SPPLASH application. The extracted modal properties from these 12 750 events are plotted in histogram form in Figure 8(d).
The bin widths specified for the histogram of Figure 8(d) are 0.0034 Hz; the same as those specified in Figure 9(c). While the count numbers are comparatively higher, the peaks identified in Figure 8(d) are similar to those identified in Figure 8(c) albeit with very minor variations in frequency values. The histogram for this period is cleaner, meaning the the peaks are more pronounced with less distribution, which indicates less variability in the extracted modal properties. Also of note is the relatively low identification rate of modes in the 10–16 Hz range. Box plots of normalized operational modal frequencies from full events.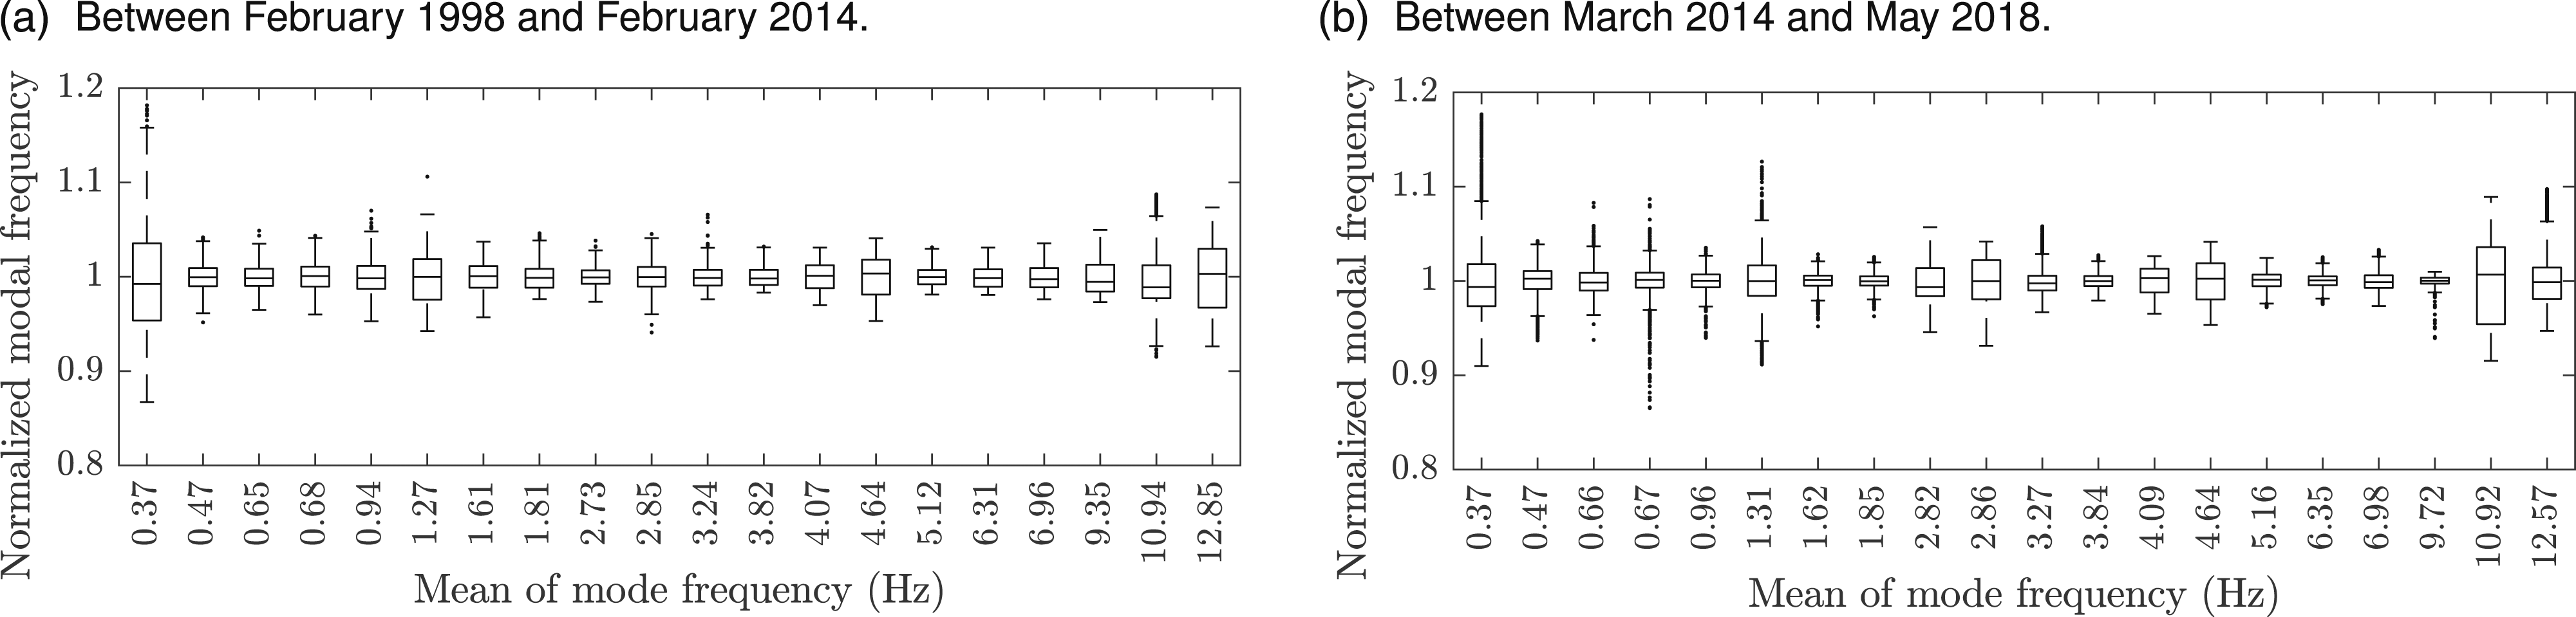
Figure 8(b) shows the ten top modes from each of the 12 750 analyzed full events plotted temporally with corresponding environmental (wind and temperature) measurements. From Figure 8(b) the dominant modes and their temporal variations can be observed. The vertical gaps in the scatter plot correspond to periods where full events were not collected. Qualitatively, the correlation between the modal frequencies and temperature can be observed. This correlation is more evident for higher modes such as the 9.21 Hz and the 6.97 Hz modes. Also of note is the sudden increase in scatter observed in the OMA results of the data collection events occurring after late July 2017. This corresponds to the sudden malfunction of several sensors of data logger # 1 on or near 23 July 2017. It is now evident that although fault tolerant, the AI-FSI algorithm is sensitive to sensor configurations where many sensors are omitted due to faulty behavior. Further statistical analysis using OMA results must consider the sensor configuration as an operational parameter for proper comparisons. OMA results obtained with the maximum number of sensors seem to be more consistent with lower parameter estimation variability.
Variability of OMA results
Identification and variability of operational modal estimates.
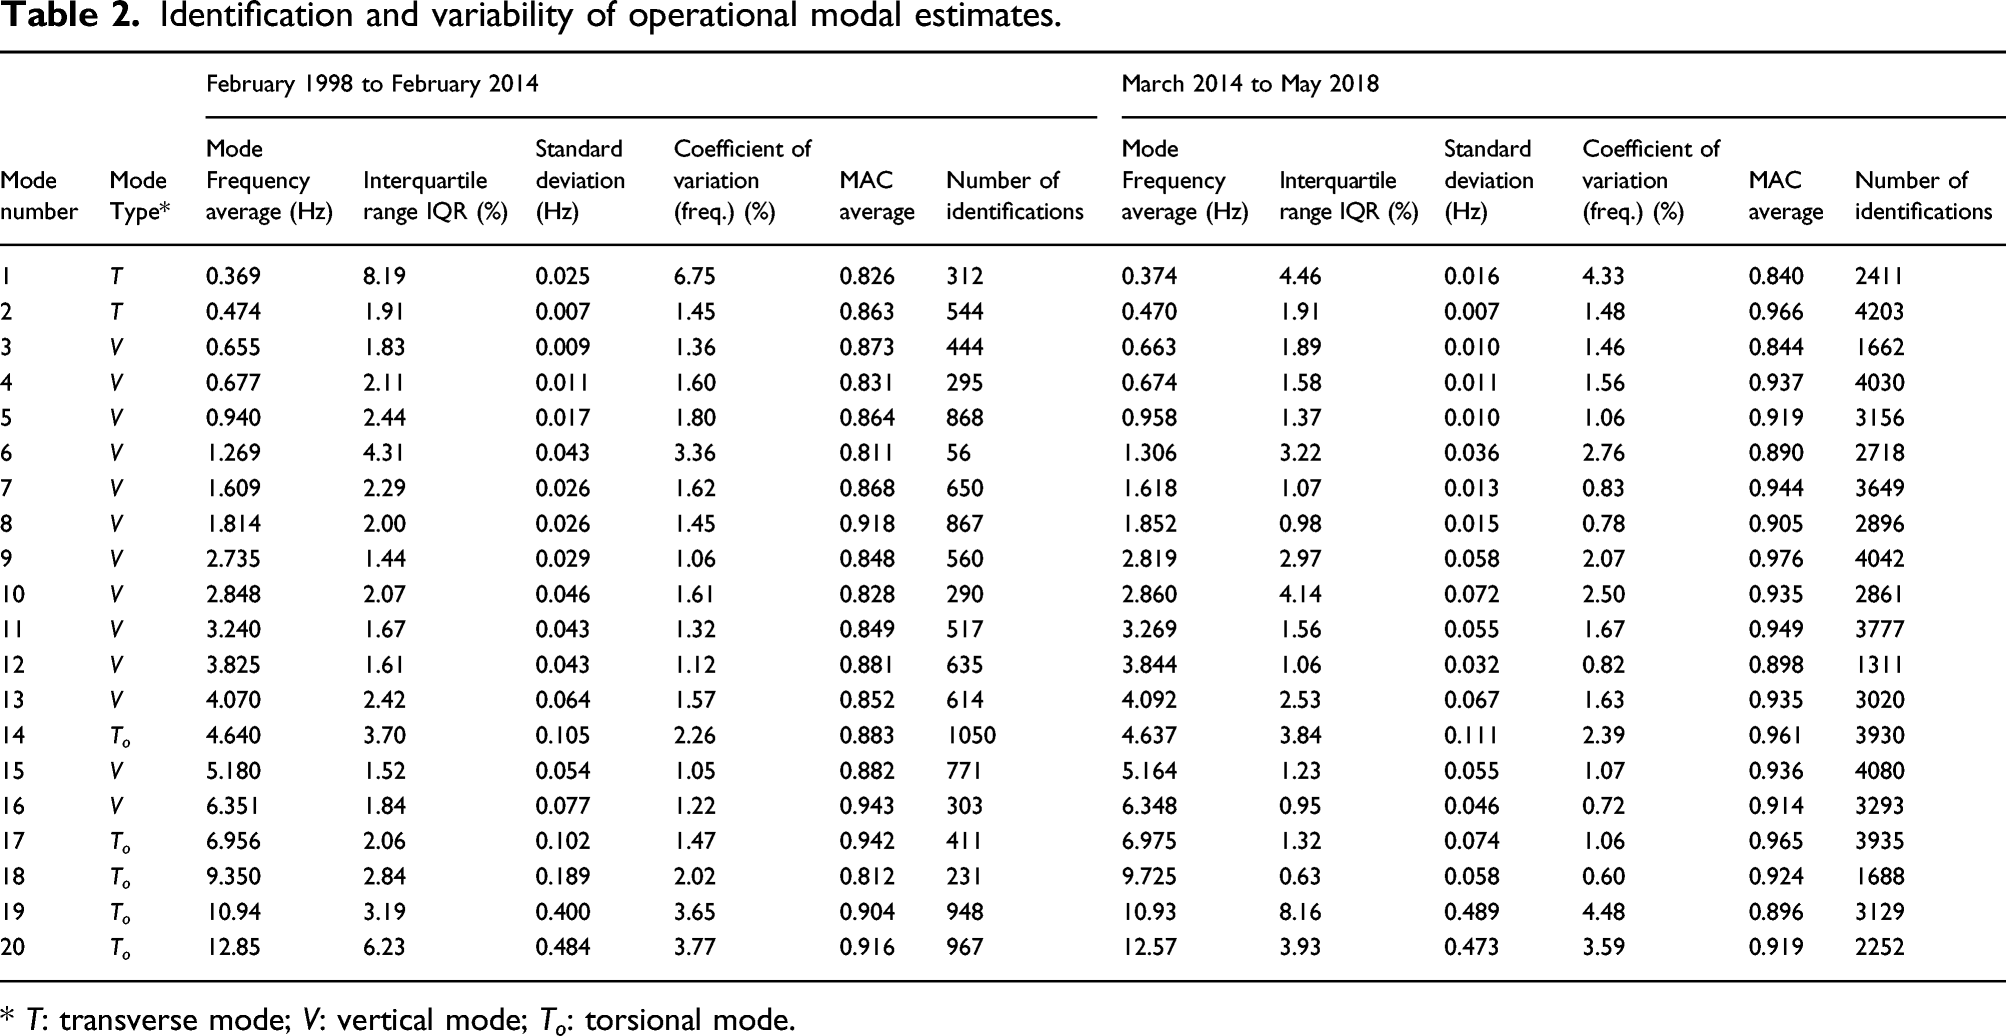
* T: transverse mode; V: vertical mode; T o : torsional mode.
The results shown in Table 2 correspond those obtained by the AI-FSI algorithm for each generation of the vibration monitoring system. The interquartile range shown in Table 2 is equal to the difference between the 75th and 25th percentiles of the distribution of modal frequencies and provides a good indication of variability along with the calculated standard deviation. The MAC average shown in this table is the calculated average in both dimensions of the MAC matrix obtained for a true mode group identified by the mode tracking algorithm. In the last column of Table 2, the number of identifications represents the number of times the mode was identified in the time period specified. Figure 9(a) and (b) show box plots of the dominant modes extracted in each of the identified collection period. Results from Table 2 and from Figure 9(a) and (b) indicate that operational modal estimates can be reliably, consistently and automatically-extracted from highly uncertain and noisy data on a much larger scale than was previously undertaken. A general improvement in the quality of OMA results can also be observed from the first to the second generation of the monitoring system, especially regarding mode shape identification. Improvements are attributable to better data acquisition system (sensors, loggers, etc.), more streamlined processing and improved parameter estimations in the OMA.
Conclusion
Critical advances in long-term continuous vibration-based structural health monitoring are presented in this paper. These advances address the needs associated with the large-scale data collection, such as the automation of all data processing and analysis operations (including automated modal parameter estimations and mode tracking), and the need for high quality OMA results with minimal measurement and computational uncertainties and variability. The existing stochastic subspace identification algorithm was improved and automated to reduce the uncertainty associated with computation and human error. A new automated inline full space identification (AI-FSI) technique is presented and integrated in an intelligent VBSHM computer application called SPPLASH. This new technique integrates all aspects of automated modal parameter estimations and modal tracking. The renewal of the computer tools used for the monitoring of the Confederation Bridge vibration responses coincided with the renewal of the installed instrumentation. Most of the improvements and additions to the SPPLASH application were a result of the needs arising from the multi-state and multi-scale data created by the two generations of vibration monitoring system and from the practical considerations gathered from over 15 years of continued use. The data processing engine has been completely overhauled in order to automate and streamline all data operations. This work was carried out with the underlying goal of removing all unneeded data operations that contributed to computational noise. The automation was required in order to batch process the large amounts of collected raw vibration responses. With the new automated processing and analysis tools, an unprecedented feat was realized with the processing and analysis of all the historical data collected by the Confederation Bridge monitoring project since 1998. This represents over 250 000 logger files, 40 000 h of recording and 26 TB of raw and processed data collected over 20 years. This historical database confirms that operational modal estimates can be reliably, consistently and automatically-extracted from highly uncertain and noisy data on a much larger scale than was previously undertaken. This will improve our understanding of OMA variability and allow for more sensitive damage detection techniques.
Footnotes
Declaration of conflicting interests
The author(s) declared no potential conflicts of interest with respect to the research, authorship, and/or publication of this article.
Funding
The author(s) disclosed receipt of the following financial support for the research, authorship, and/or publication of this article: This work is part of the collaborative research project on monitoring of the Confederation Bridge funded by Natural Sciences and Engineering Research Council Canada, Public Services and Procurement Canada, and Strait Crossing Bridge Ltd.