
Abstract
This paper is concerned with the behaviour of concrete-filled tubular flange girders (CFTFGs) under the combination of bending and tensile axial force. CFTFG is a relatively new structural solution comprising a steel beam in which the compression flange plate is replaced with a concrete-filled hollow section to create an efficient and effective load-carrying solution. These members have very high torsional stiffness and lateral torsional buckling strength in comparison with conventional steel I-girders of similar depth, width and steel weight and are there-fore capable of carrying very heavy loads over long spans. Current design codes do not explicitly include guidance for the design of these members, which are asymmetric in nature under the combined effects of tension and bending. The current paper presents a numerical study into the behaviour of CFTFGs under the combined effects of positive bending and axial tension. The study includes different loading combinations and the associated failure modes are identified and discussed. To facilitate this study, a finite element (FE) model is developed using the ABAQUS software which is capable of capturing both the geometric and material nonlinearities of the behaviour. Based on the results of finite element analysis, the moment–axial force interaction relationship is presented and a simplified equation is proposed for the design of CFTFGs under combined bending and tensile axial force.
Keywords
Introduction
Steel-concrete composite construction can provide an efficient structural solution by utilising the two component materials to create a single efficient composite section. The high tensile strength and ductility of steel combined with the excellent compressive strength and robustness of concrete results in an effective composite cross-section, which can be used in a wide variety of applications. Owing to these credentials, composite construction has experienced a significant growth in its market share in recent decades (Kirkland, 2014; Vasdravellis et al., 2012, 2015). Composite members come in a variety of different arrangements, including concrete filled steel tubes (CFST). CFST utilise the beneficial qualities of the constituent materials as the concrete core prevents local buckling of the steel section and increases the stability and strength of the member as a system whilst the steel hollow section provides confining pressure to the concrete and forces the concrete to behave under a triaxial stress state.
Modern-day composite construction regularly comprises heavily-loaded structural components such as bridge approaches, primary beams in multi-storey car parks and various elements of other large structures. A relatively new solution for these scenarios is a concrete-filled tubular flange girder (CFTFG) which are formed by replacing the top flange plate of a typical I-shaped steel beam with a tubular section which can then be filled with concrete. Compared with other solutions, CFTFGs offer several advantages, including: (1) the concrete-filled tubular flange increases the stiffness and strength of the cross-section in bending compared with a flat-plate flange with the same amount of steel; (2) the web depth is reduced compared with a conventional I-girder of similar total depth, which reduces the web slenderness effects; and (3) the concrete-filled tubular flange increases the torsional stiffness, and therefore increases the lateral torsional buckling (LTB) resistance of the girder (Kim and Sause, 2008).
Before the development of CFTFGs, a number of different types of beam with hollow tubular flanges were proposed. The structural efficiency of hollow flange girders is greatly enhanced by the torsionally rigid closed compression flange and this is coupled with economic fabrication processes (Kim and Sause, 2008). Hollow flange girders were mainly developed for high-loading scenarios which could not be supported by universal hot-rolled sections or built-up steel girders. Owing to the efficiency of composite construction, and the interesting and promising development of hollow tubular flange plate girders, it was a natural progression to fill the top hollow tube with concrete to create a concrete-filled tubular flange girder (CFTFG). Researchers at Lehigh University in the United States conducted an experimental, numerical and analytical study into these members and assessed the influence of boundary conditions and stiffener arrangement on the structural response (Kim and Sause, 2008). The resulting analytical model was based on a transformed section approach and a good agreement was shown with the experimental and numerical results.
Beams in structural frames can often be exposed to combined actions, for example, continuous or semi-continuous structures, where members are under either positive (sagging) or negative (hogging) bending moments in combination with axial forces. Uy and Tuem (2006) conducted an investigation into the behaviour of traditional composite beams under the combined effect of axial tension and bending, and presented a full moment–axial load interaction diagram. The effect that combined axial load and bending moment has on the ultimate capacity of CFTFGs has not yet been covered in a comprehensive way either in the research literature or in codes of practice. Eurocode 4 (EN 1994-1-1, 2004), Australian code AS2327 (2004) and the American AISC standard (2005) provide detailed guidance for the design of composite columns under combined actions, but do not address the effects of combined loading for CFTFGs.
Previous studies have investigated the bending resistance of CFTFGs and a series of analytical expressions for predicting the location of the plastic neutral axis and the ultimate bending capacity were proposed (Al-Dujele and Cashell, 2018, 2019; Al-Dujele et al., 2018a, 2018b). However, the behaviour of CFTFGs under combined loading has not been previously studied. This is a scenario which occurs frequently in practice such as in continuous or semi-continuous members or, in extreme cases, if a support is removed and the beams are required to withstand high tensile loads to avoid progressive collapse.
In this context, the current paper presents a numerical study into the behaviour of CFTFGs under the combined effects of positive bending and axial tension. A finite element (FE) model is developed which is capable of capturing both the geometric and material nonlinearities of the behaviour. The analysis is employed to derive and propose a simplified design equation is for CFTFGs subjected to positive bending and axial tension.
Development of the numerical model
A finite element (FE) model was developed using the commercial software package ABAQUS (2011), which is capable of achieving numerical convergence for complex structural systems such as CFTFGs despite the geometric and material nonlinearities of the behaviour. This model is a further advancement of the previous version which was employed to assess CFTFGs under bending (Al-Dujele and Cashell, 2018) and validated against available test data (Wang et al., 2008; Al-Dujele et al., 2018a).
FE modelling of CFTFGs
General
The model is developed based on the testing carried out by Wang et al. (2008). Accordingly, the simulated girder is 0.5 m in height and 4.3 m in length, as shown in Figure 1, and is subjected to two concentrated loads (P) in the vertical direction. It is made using Q235 steel and the concrete infill has a compressive strength of 38.6 MPa. The load is applied incrementally and the nonlinear geometry parameter (*NLGEOM, in the ABAQUS library) is included to allow for changes in the geometry under load. There are four stiffeners across the span, including one at each of the supports and also at the two loading points, to prevent local instability of the web at these locations. The steel beam and stiffeners are both modelled using the four-noded, three-dimensional shell elements with reduced integration (S4R in the ABAQUS library) whereas the concrete infill is represented using the C3D8R solid elements in the ABAQUS library. A tie contact is defined between the surface of the steel section and the edges of the stiffeners. Following a mesh sensitivity study, an element size of 30 mm × 30 mm is employed as this provides the optimum combination of accuracy and computational efficiency.
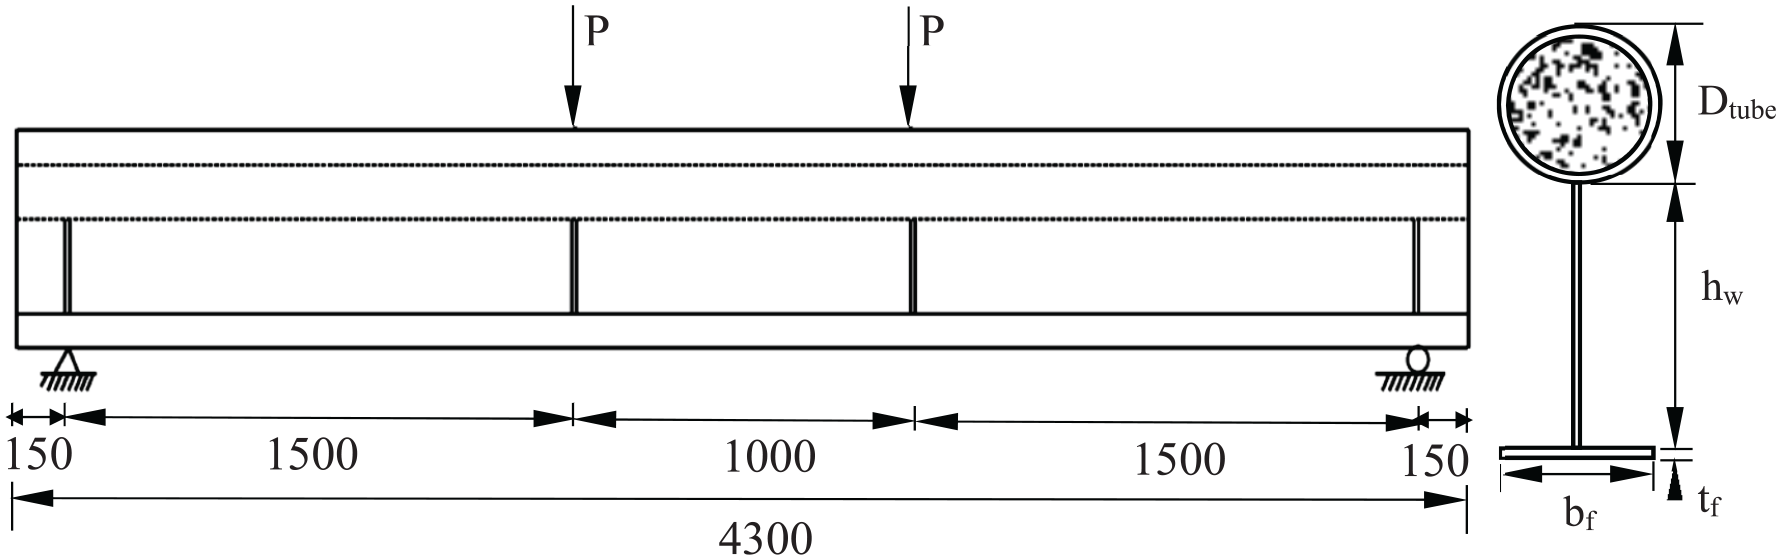
Schematic of the simply supported beam (all units in mm).
The amplitude of the global imperfection is taken as L/1000 where L is the member length, in accordance with the permitted out-of-straightness tolerance in EN 1090-2 (2008). It is noteworthy that the residual stresses are neglected in the FE simulation, in accordance with the approach of other researchers (Dong and Sause, 2009), as the beam is relatively short and residual stresses are not expected to be very influential to the overall behaviour.
Material modelling
In terms of the concrete material response, typical uniaxial stress–strain curves for confined and unconfined concrete are shown in Figure 2, where fc and εc are the compressive strength and the corresponding strain of unconfined concrete, respectively, and fcc and εcc are the equivalent values for confined concrete. The nonlinear stress–strain response for confined concrete proposed by Hu et al. (2003) is adopted in the numerical simulations. The expressions proposed by Mander et al. (1988) are employed for relating the stress and strain properties of confined and unconfined concrete, and are given in equations (1) and (2), respectively:

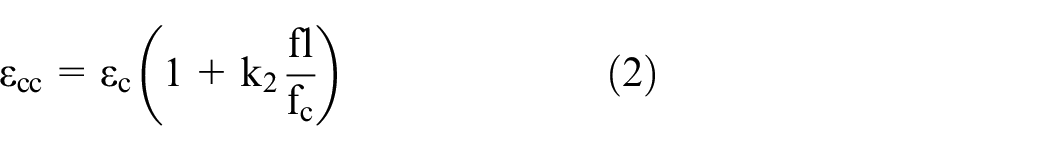
Typical stress–strain curve of confined and unconfined concrete (reproduced from Hu et al., 2003).
In these expressions, values of 4.1 and 20.5 are used for
The stress–strain curve of confined concrete, as presented in Figure 2, consists of three parts. Initially, it is assumed that the confined concrete responds linearly, obeying Hooke’s law and this continues up to around 40% of compressive strength in the ascending branch (EN 1992-1-1, 2004; Goode and Lam, 2011). During this phase of the response, the behaviour of confined and unconfined concrete is identical, as shown in Figure 2. The initial Young’s modulus Ecc (in GPa) can be estimated with reasonable accuracy from the empirical formulation provided in Eurocode 2 (2004) given in equation (5):

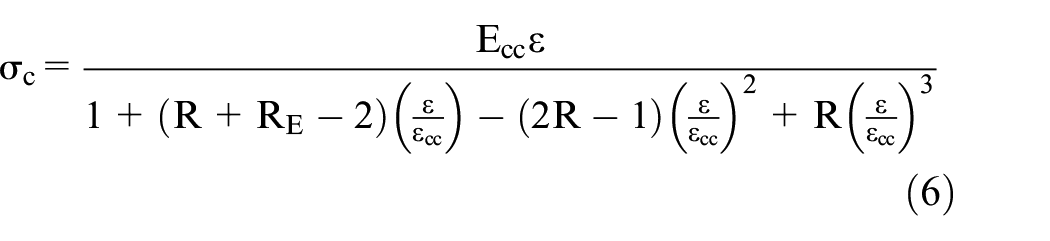
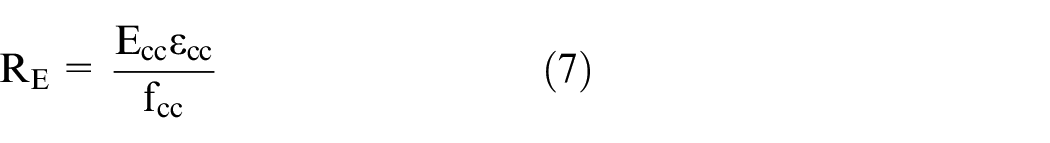
The second part of the stress–strain curve defines the nonlinear behaviour before the concrete reaches its maximum strength, starting from the proportional limit (0.4fc) to the maximum confined concrete strength fcc. The relationship between concrete stress and strain in this part of the response was proposed by Saenz (1965), and is as described in equations (6) to (8):
where:
and
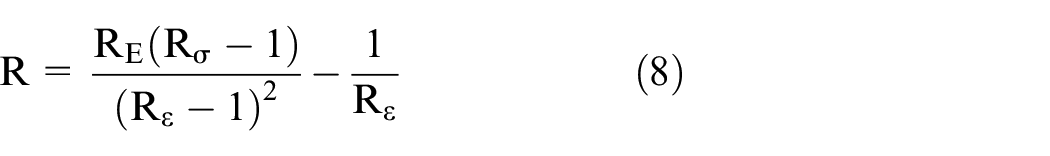
In these expressions, Rε and Rσ are both assumed to be 4.0, in accordance with the recommendations given elsewhere by Hu and Schnobrich (1989).
The third and final part of the curve is the descending branch which begins at the maximum confined concrete strength fcc and decreases linearly until a stress of fcu is reached at a corresponding strain of εcu, which are determined using equations (9) and (10), respectively:


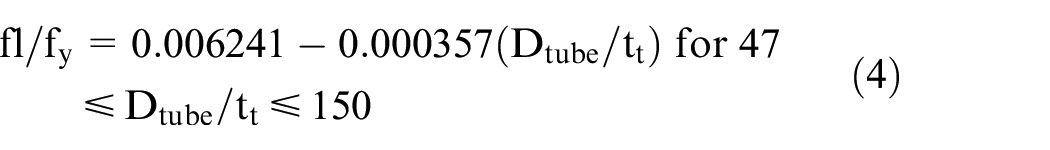
In these expressions, the parameter k3 for concrete-filled circular steel tubes is calculated using equation (11), based on the recommendations presented by Hu et al. (2003):
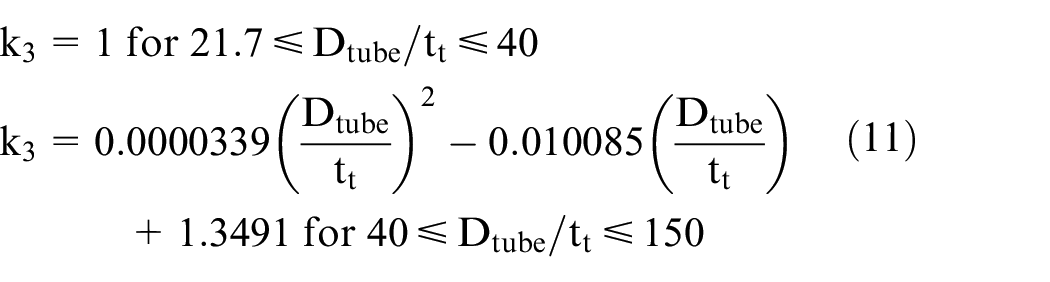
where Dtube and tt, represent the tube outside diameter and tube thickness, respectively. As a result of the experimental studies carried out by Giakoumelis and Lam (2004), it was suggested that the value of the parameter r in equation (9) may be taken as 1.0 for concrete with cube strength of 30 MPa and 0.5 for concrete with a cube strength of 100 MPa and linear interpolation can be used for intermediate values (Ellobody and Young, 2006; Ellobody et al., 2006). Table 1 presents the compressive strength fc and Poisson’s ratio of the concrete, as determined during the testing programme.
Details of the material properties.
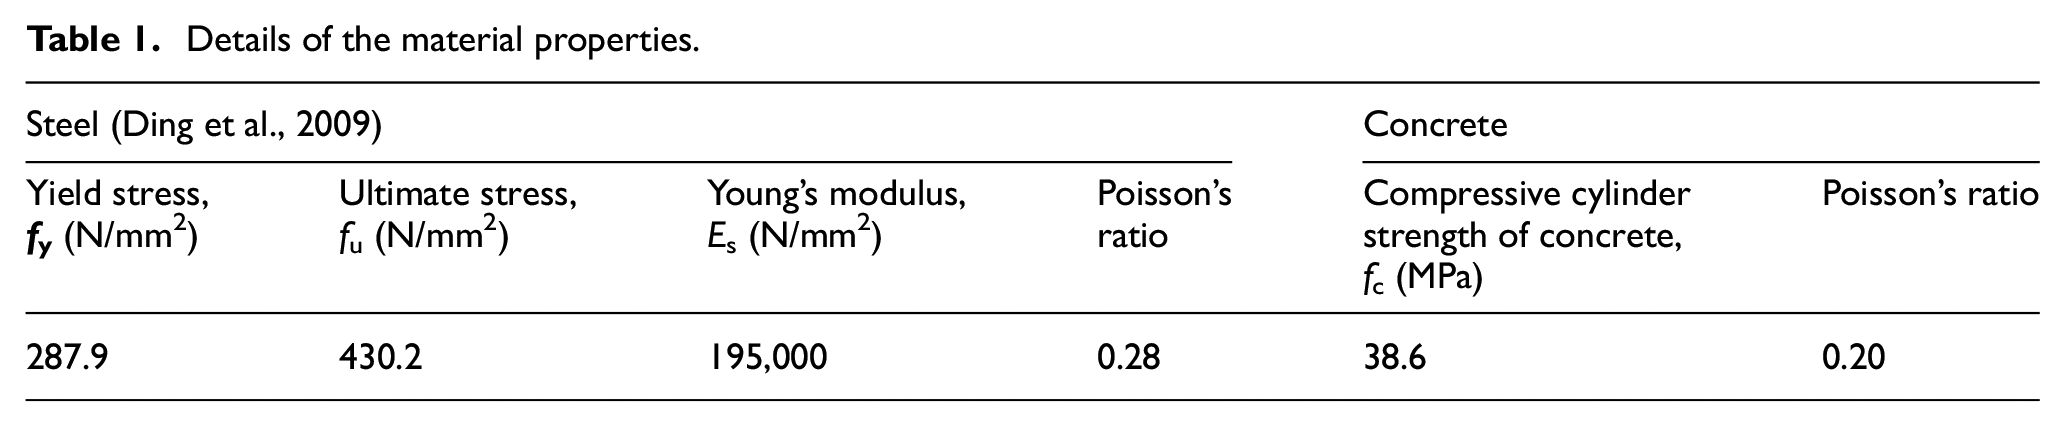
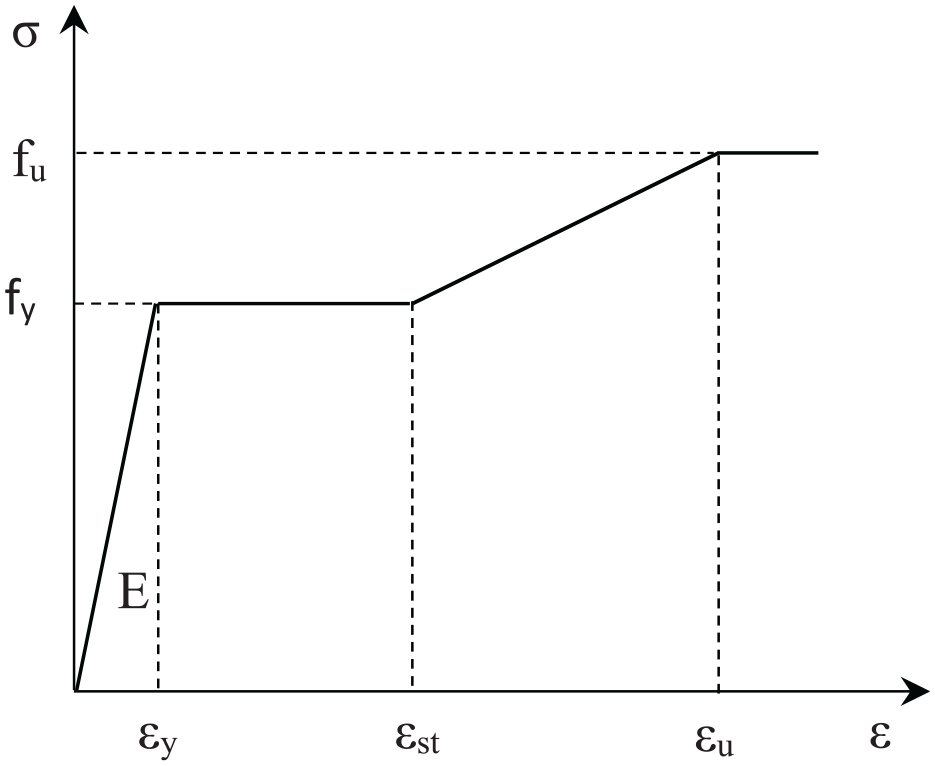
The steel properties incorporated in the model are presented in Table 1 including the yield strength (fy), ultimate strength (fu), Young’s modulus of steel (Es) and Poisson’s ratio given by Ding et al. (2009). An idealised tri-linear stress–strain relationship is assumed to model the steel material in the FE model, as shown in Figure 3. The strain at the onset of strain hardening εst and the strain at the ultimate tensile stress εu are taken as 0.025 and 0.2, respectively (Ban and Bradford, 2013). In order to consider the effects of the decreased section during the tensile test, the stress–train curves included in the FE model are converted into true stress–strain relationships. The engineering stress–strain (σeng − εeng) curve is converted to true stress–strain (σtrue − εtrue) curve for the ABAQUS model using equations (12) and (13), respectively.


Stress–strain curve of steel beam (reproduced from Ban and Bradford, 2013).
Support and loading conditions
The geometry and loading conditions are symmetrical about the mid-span and therefore only half the girder length is explicitly modelled, and appropriate boundary conditions are applied at the plane of symmetry. The ends of the beam are simply supported, as was the case in the experiments that are being used for validation (Wang et al., 2008). Accordingly, simply supported boundary conditions are applied to one the end of the modelled girder whilst the other end has symmetrical boundary conditions, as shown in Figure 4, in which ux, uy, uz, φx, φy and φz are the displacements and the rotations about the global x, y and z axes, respectively. The y–z plane is considered to be in-plane whilst the x–z and x–y planes are out-of-plane. The end of the beam is modelled as a rigid body and the whole depth of the cross-section is subjected to identical tensile stresses. The tensile load is applied at a reference point which is selected in the current work to coincide with the centre of gravity of the steel section.
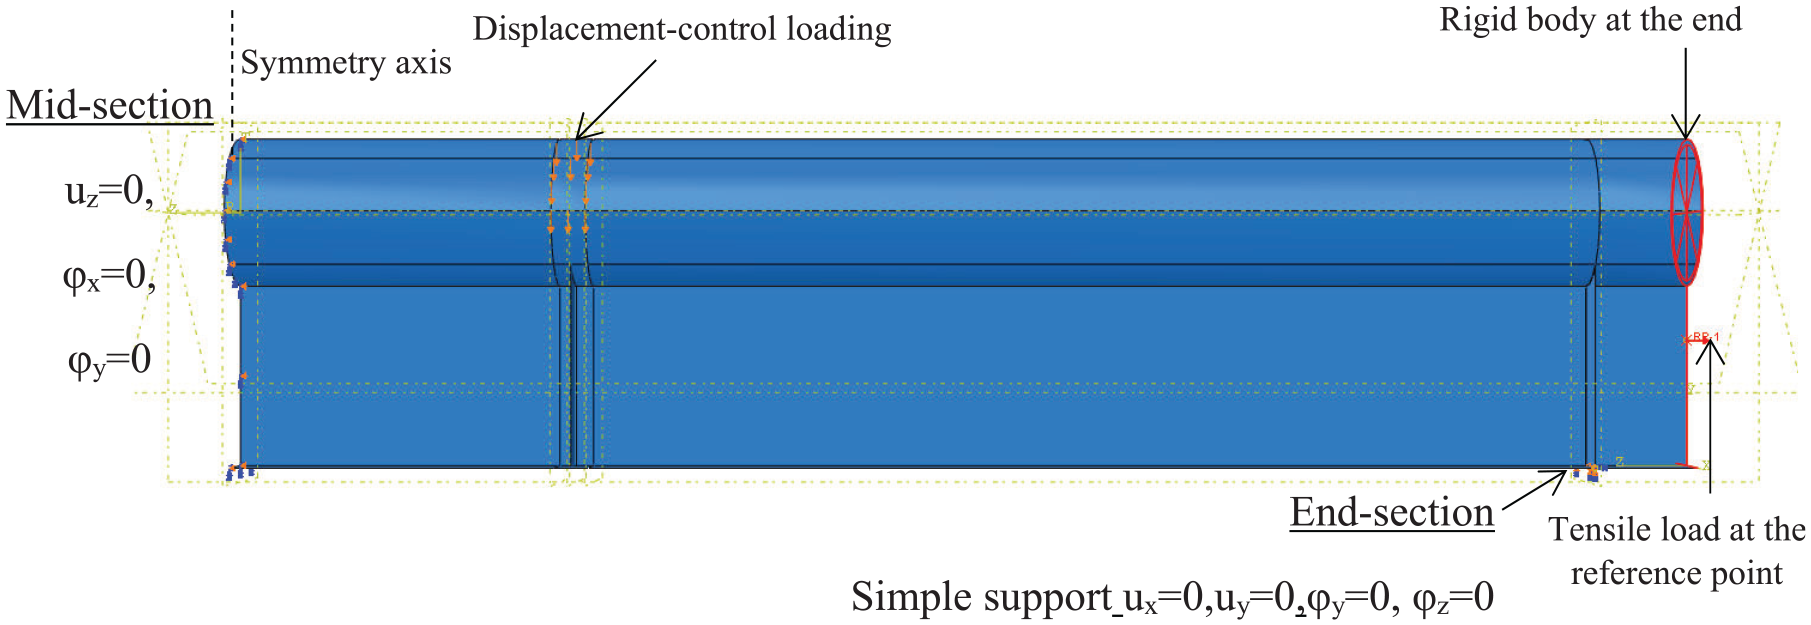
Support and loading conditions of FE model for the CFTFG.
Failure criteria
In order to determine when the CFTFG has failed, a number of failure criteria are defined and these are closely monitored during simulation. The possible failure modes of a CFTFG subjected to positive bending and axial tension are as follows:
Local buckling: a tubular flange should not buckle locally before yielding in compression. Therefore, the local buckling requirement provided by the AASHTO (1998) Design Specifications for circular tube compression members has been checked for all specimens examined in this study, in accordance to:
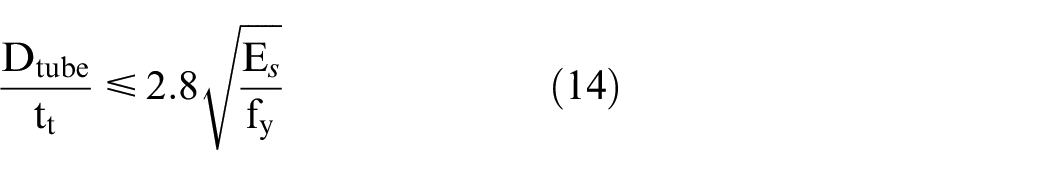
Equation (14) was originally developed based on an unfilled tube although the AASHTO specification recommends using the expression for concrete-filled tubes also.
Excessive yielding of the steel beam: the spread of yielding from the bottom surface of the girder, at the mid-span. A tensile yielding strain εs of 0.2 is employed in the current study as the limiting acceptable value. This failure mode is clearly dependent on the level of vertical and axial loading that is applied.
Deflection limit: the maximum level of mid-span deflection that can be tolerated in the girder, depending on the application. Here, it is suggested that the maximum acceptable limit of allowable deflection is L/120, where L is the member length, in accordance with AISC standard (2005).
Concrete damage: concrete usually fails either by tensile cracking or compressive crushing, and both of these are considered in the concrete material model, as discussed before.
Solution method
The implicit dynamic analysis method in ABAQUS (2011) with adaptive stabilisation is employed to simulate the nonlinear response of the CFTFG. Finite element analysis with concrete elements in tension may result in convergence problems. In order to avoid these, the discontinuous analysis option is also employed in the general solution control options of the programme. The applied moment acting on the girder comprises two components, (1) the direct moment due to the applied vertical load and (2) the second-order moment created by the eccentricity of the applied axial load relative to the plastic centroid of the section. Thus, the moment equilibrium equation is given as:

where P is the vertical force applied on the beam, a is the distance between the simple support and the vertical force, N is the horizontal axial force applied placed through a reference point in the steel web and e is the eccentricity between the location of the axial load and the plastic neutral axis (PNA) of the CFTFG.
Validation of the FE model
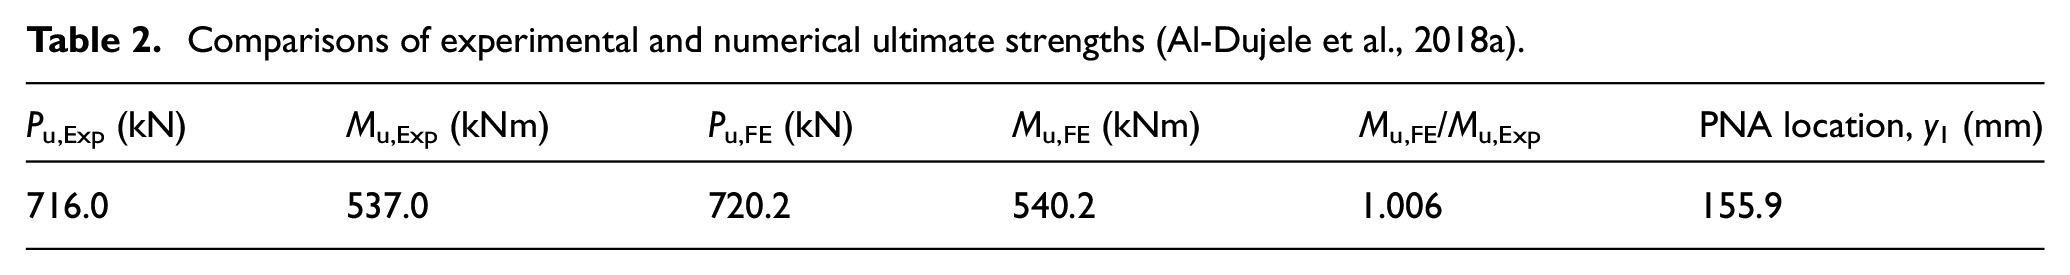
To assess the accuracy of the load-displacement response generated by the FE model, the test conducted by Wang et al. (2008) was simulated as described in previous sections. This is the only test which has been done on concrete filled tubular flange girders with a circular top flange, to date, in the public domain. The load-displacement response of the CFTFG from both the FE model and the experimental programme is presented in Figure 5. The ultimate load and ultimate moment obtained from the FE analyses (Pu,FE and Mu,FE, respectively) are compared with the test ultimate load and ultimate moment (Pu,Exp and Mu,Exp, respectively) in Table 2. Pu,Exp is determined as the maximum value in the test, whilst Pu,FE is determined as the value at which the slope of the load versus axial displacement response reaches 1% of its initial stiffness, as proposed by dos Santos et al. (2018).
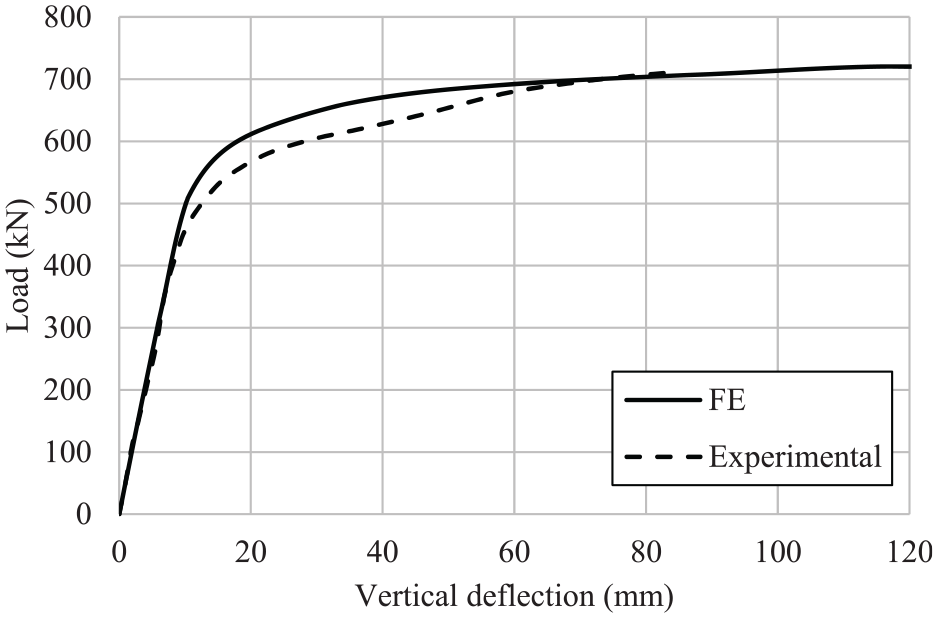
Load versus deflection relationship from the FE analysis and experimental results.
Comparisons of experimental and numerical ultimate strengths (Al-Dujele et al., 2018a).
In terms of the general behaviour, and with reference to Figure 5, it is observed that the response predicted by the FE model is divided into four phases. Firstly, below a load of around 400 kN, there is a linear relationship between load and displacement in the elastic phase, and the response is very well predicted by the model in this range. Secondly, when the load reaches 500–600 kN, the behaviour becomes nonlinear. With the expansion of the yielded region from the bottom flange to the middle of the steel section, the flexural rigidity decreases and the stress redistributes. In this elastic-plastic stage, there are some disparities between the experimental and numerical curves and the model somewhat over-predicts the capacity of the beam. This difference is likely to be due to a combination of factors which affect deformations, such as the idealisation of the material nonlinearity in the FE model as well as the likelihood of initial imperfections in the real structure. In the third phase, when loading exceeds 600 kN, the displacement increases rapidly as plasticity spreads in the middle region of the beam. Finally, when the load reaches around 720 kN, the response plateaus as the displacement continues to increase with very little change in the load. The failure mode of FE model as well as experimental is combined between steel yielding and torsional buckling.
It is clear that the FE model is capable of providing a good representation of the general response and also offers an excellent prediction of the ultimate load of the CFTFG. Overall, the simulated load-deformation curves reflect the experimental behaviour very well and it is concluded that the FE model is capable of predicting the behaviour and strength of that member well and is suitable for conducting further parametric studies on CFTFGs under positive bending and axial tension.
Behaviour of CFTFGs under combined loading
General
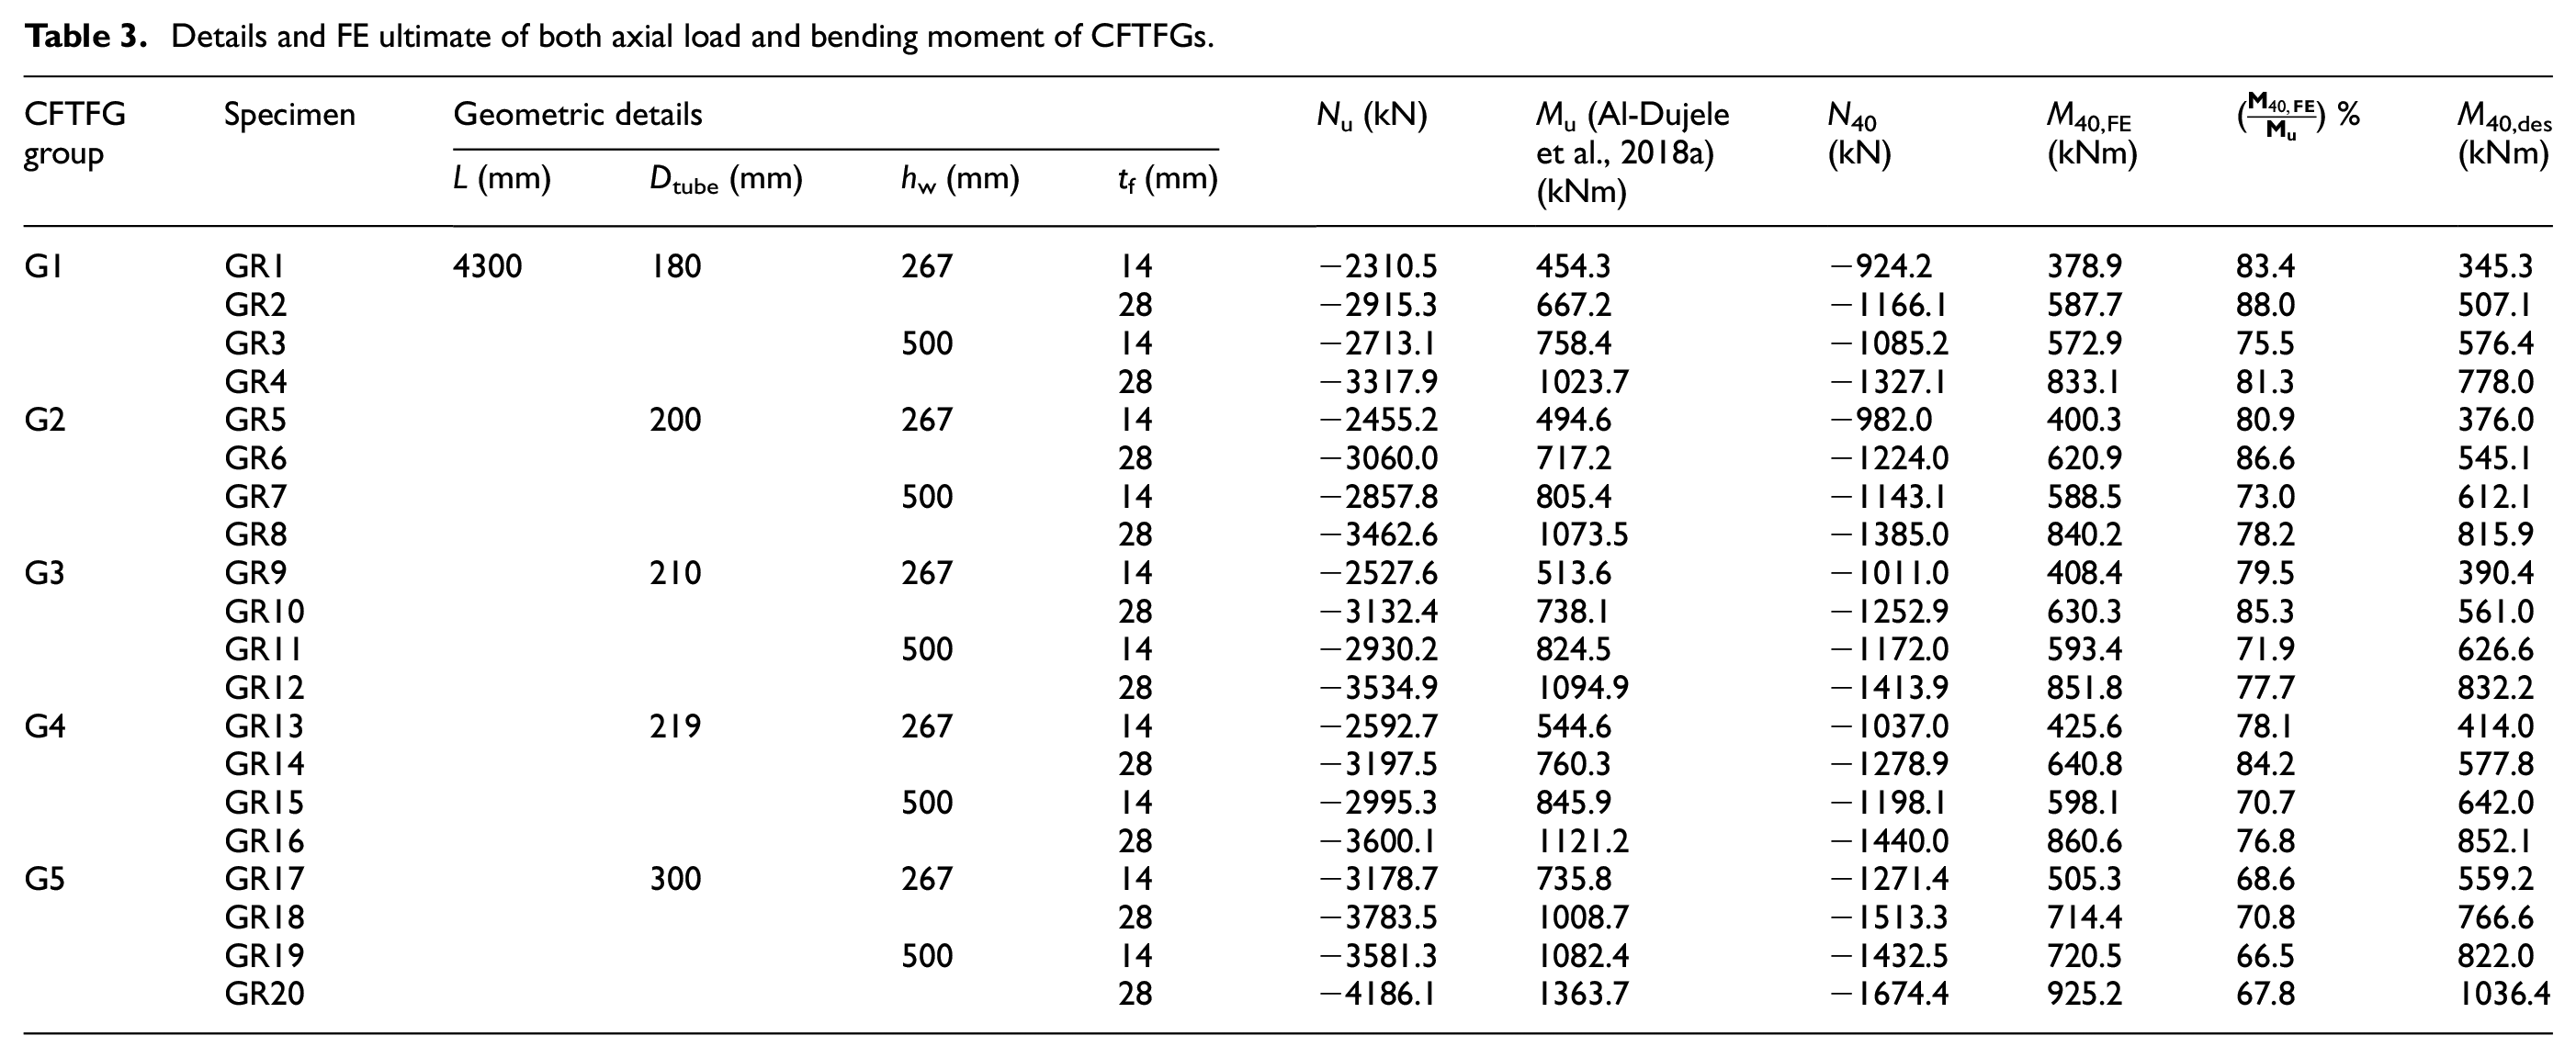
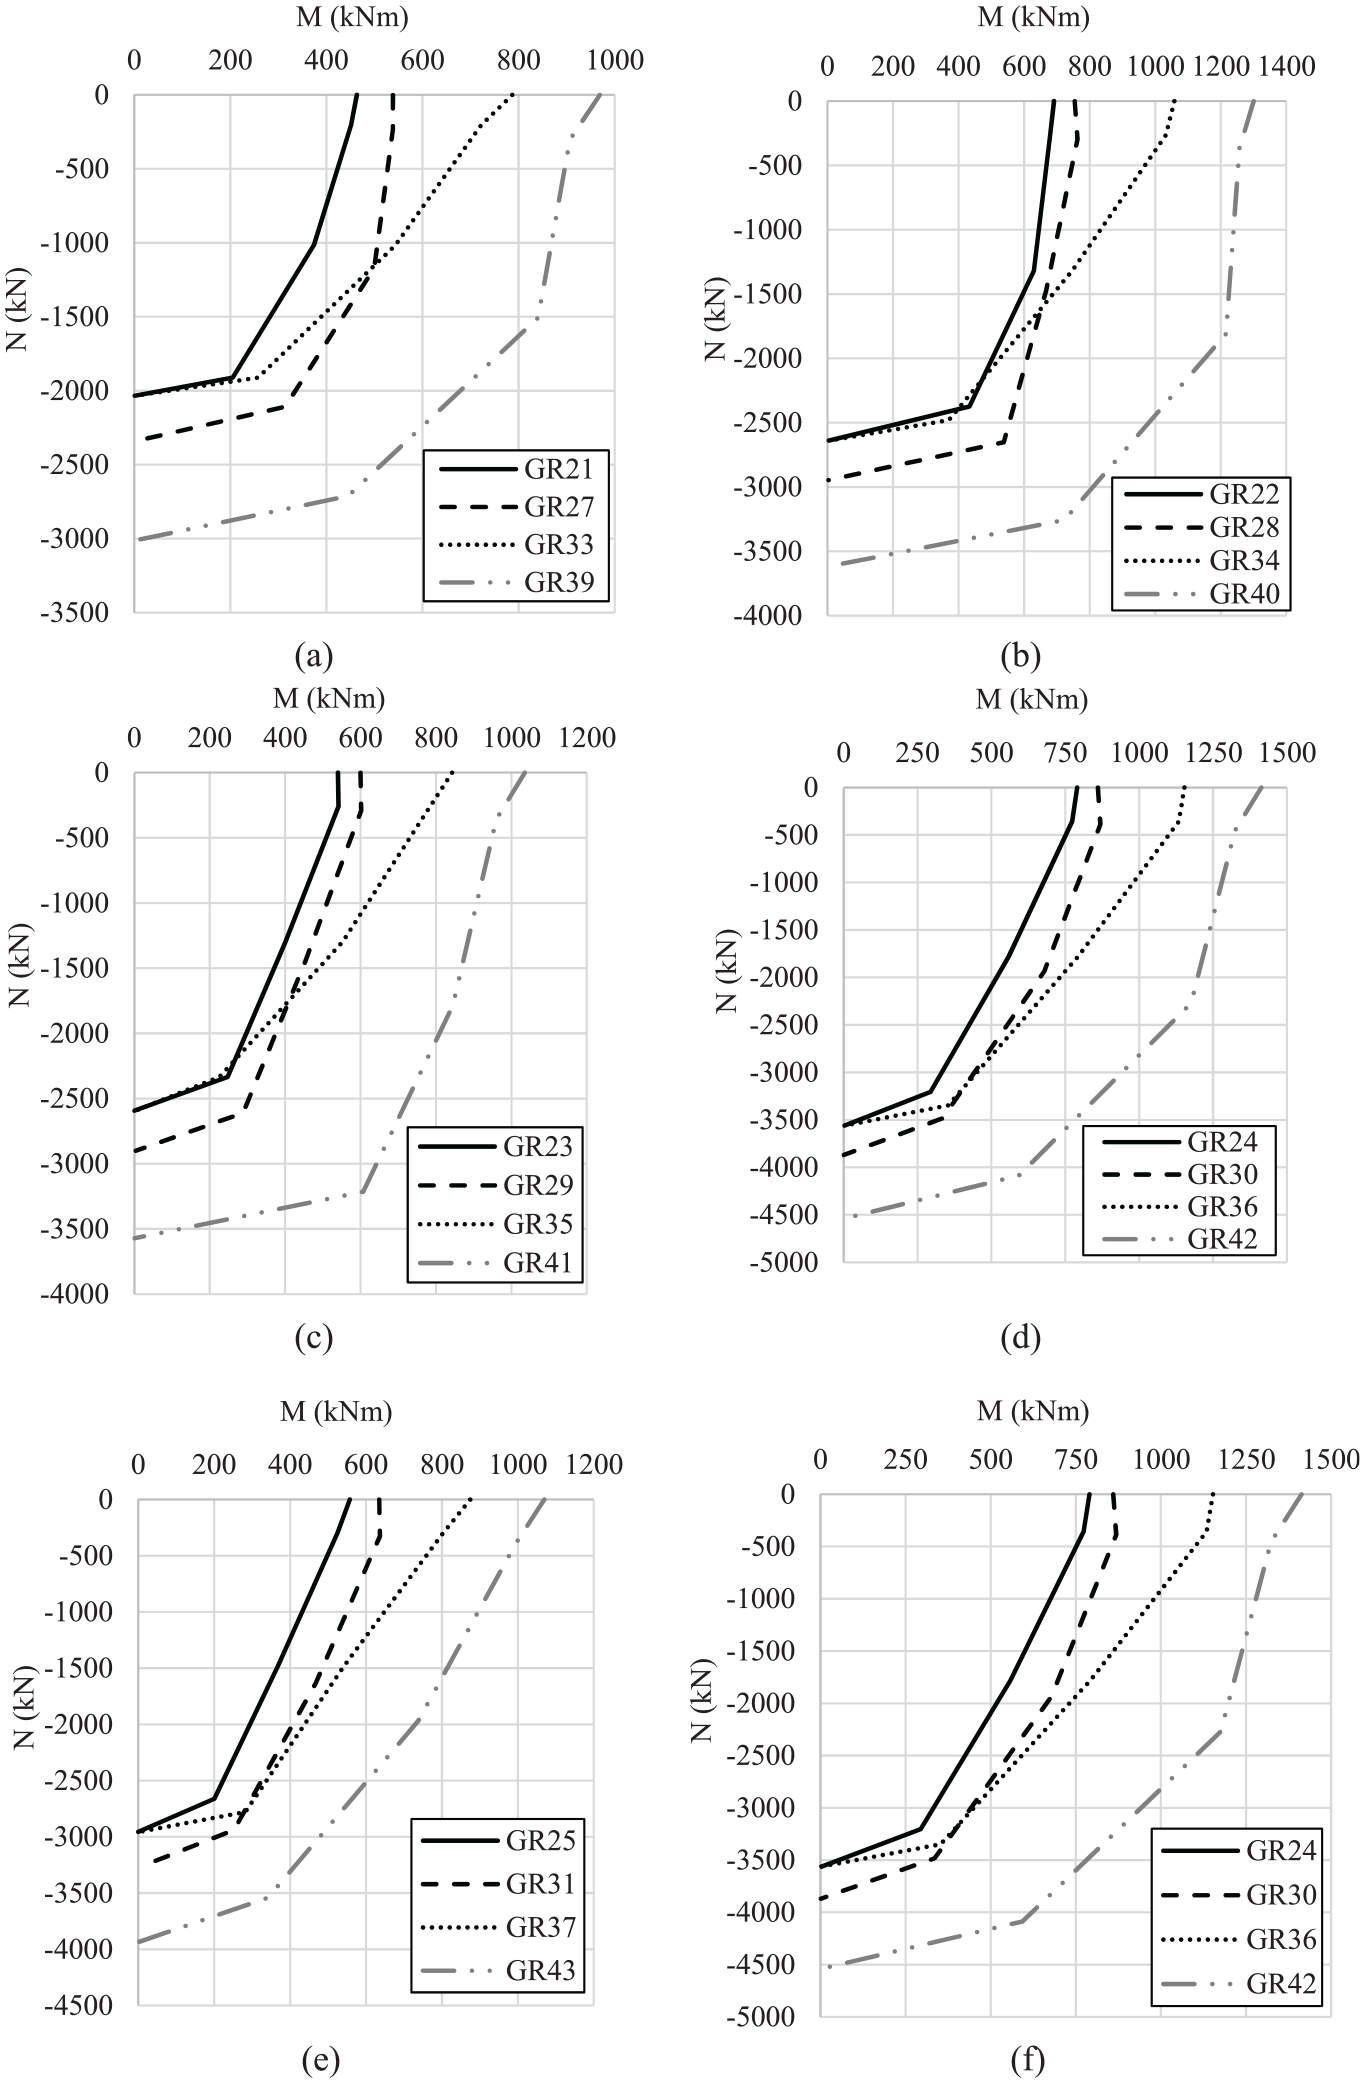
In this section, the FE model is used to study the interaction of bending moment and axial tension for CFTFGs with different properties. In order to specify a reliable moment–axial force (M–N) interaction diagram, a parametric study is conducted using a series of beams with different material and geometric design parameters. The beams studied are all 4300 mm in length (L) and are transversally stiffened with double-sided flat plate stiffeners which are 12 mm in thickness (tstiffener) and located at the support and loading locations. A total of 44 different arrangements are considered in this study, as presented in Tables 3 and 4. For clarity, in the current section, the results are presented in two general categories: (i) members with different tube diameters (Dtube) (Table 3) and (ii) beams with various tube (tt) and web thicknesses (tw) (Table 4). It should be noted that CFTFG groups G1–G9 contain concrete infill with a compressive strength of 38.6 MPa. Also included in the tables are the ultimate moment of the girders Mu which is defined later, as well as the value corresponding to 40% of the ultimate axial strength N40)for each girder with the corresponding moment which acted on the member in that condition M40. These are included to provide a reasonable analysis of the behaviour at this level of combined loading, which is important later in the development and proposal of design expressions.
Details and FE ultimate of both axial load and bending moment of CFTFGs.
Details and FE ultimate of both axial load and bending moment of CFTFGs.
In the specimens listed in Table 3, models with five different tube diameters (Dtube = 180, 200, 210, 219 and 300 mm) are considered. For each model, two web heights (hw = 267 and 500 mm) and two flange thicknesses (tf = 14 and 28 mm) are investigated. The tube and web thicknesses are fixed at 8 mm and 6 mm, respectively. For the specimens listed in Table 4, models with three different tube thicknesses (tt = 5, 8 and 10 mm) are considered and for each model, two different web heights (hw = 267 and 500 mm), two different web thicknesses (tw = 6 and 10 mm) and two flange thicknesses (tf = 14 and 28 mm) are studied. The tube diameter is fixed at 219 mm for all of the cases in Table 4.
All of the beams included in the parametric study are subjected to positive (sagging) bending through the application of vertical loads in combination with axial tension. The vertical loads P are kept constant whilst various levels of axial tension are applied, ranging from 10% to 80% of the ultimate axial strength Nu of the steel section. This is a similar approach to that taken by other researchers (e.g. Vasdravellis et al., 2012, 2015).
The analysis continues until one of the failure criteria described in Section 2.3 is satisfied or the ultimate load level is reached. The data in this figure clearly demonstrates that increasing levels of axial load have the effect of reducing the capacity of the girder to carry vertical loads. The axial capacities of the CFTFGs examined herein are presented in Tables 3 and 4 and these values are defined with reasonable accuracy as the axial capacity of the steel section (Nu), which is the sum of the tensile strengths of the loaded steel areas:

where As and fy are the cross-sectional area and yield strength of the steel, respectively.
Interaction curves
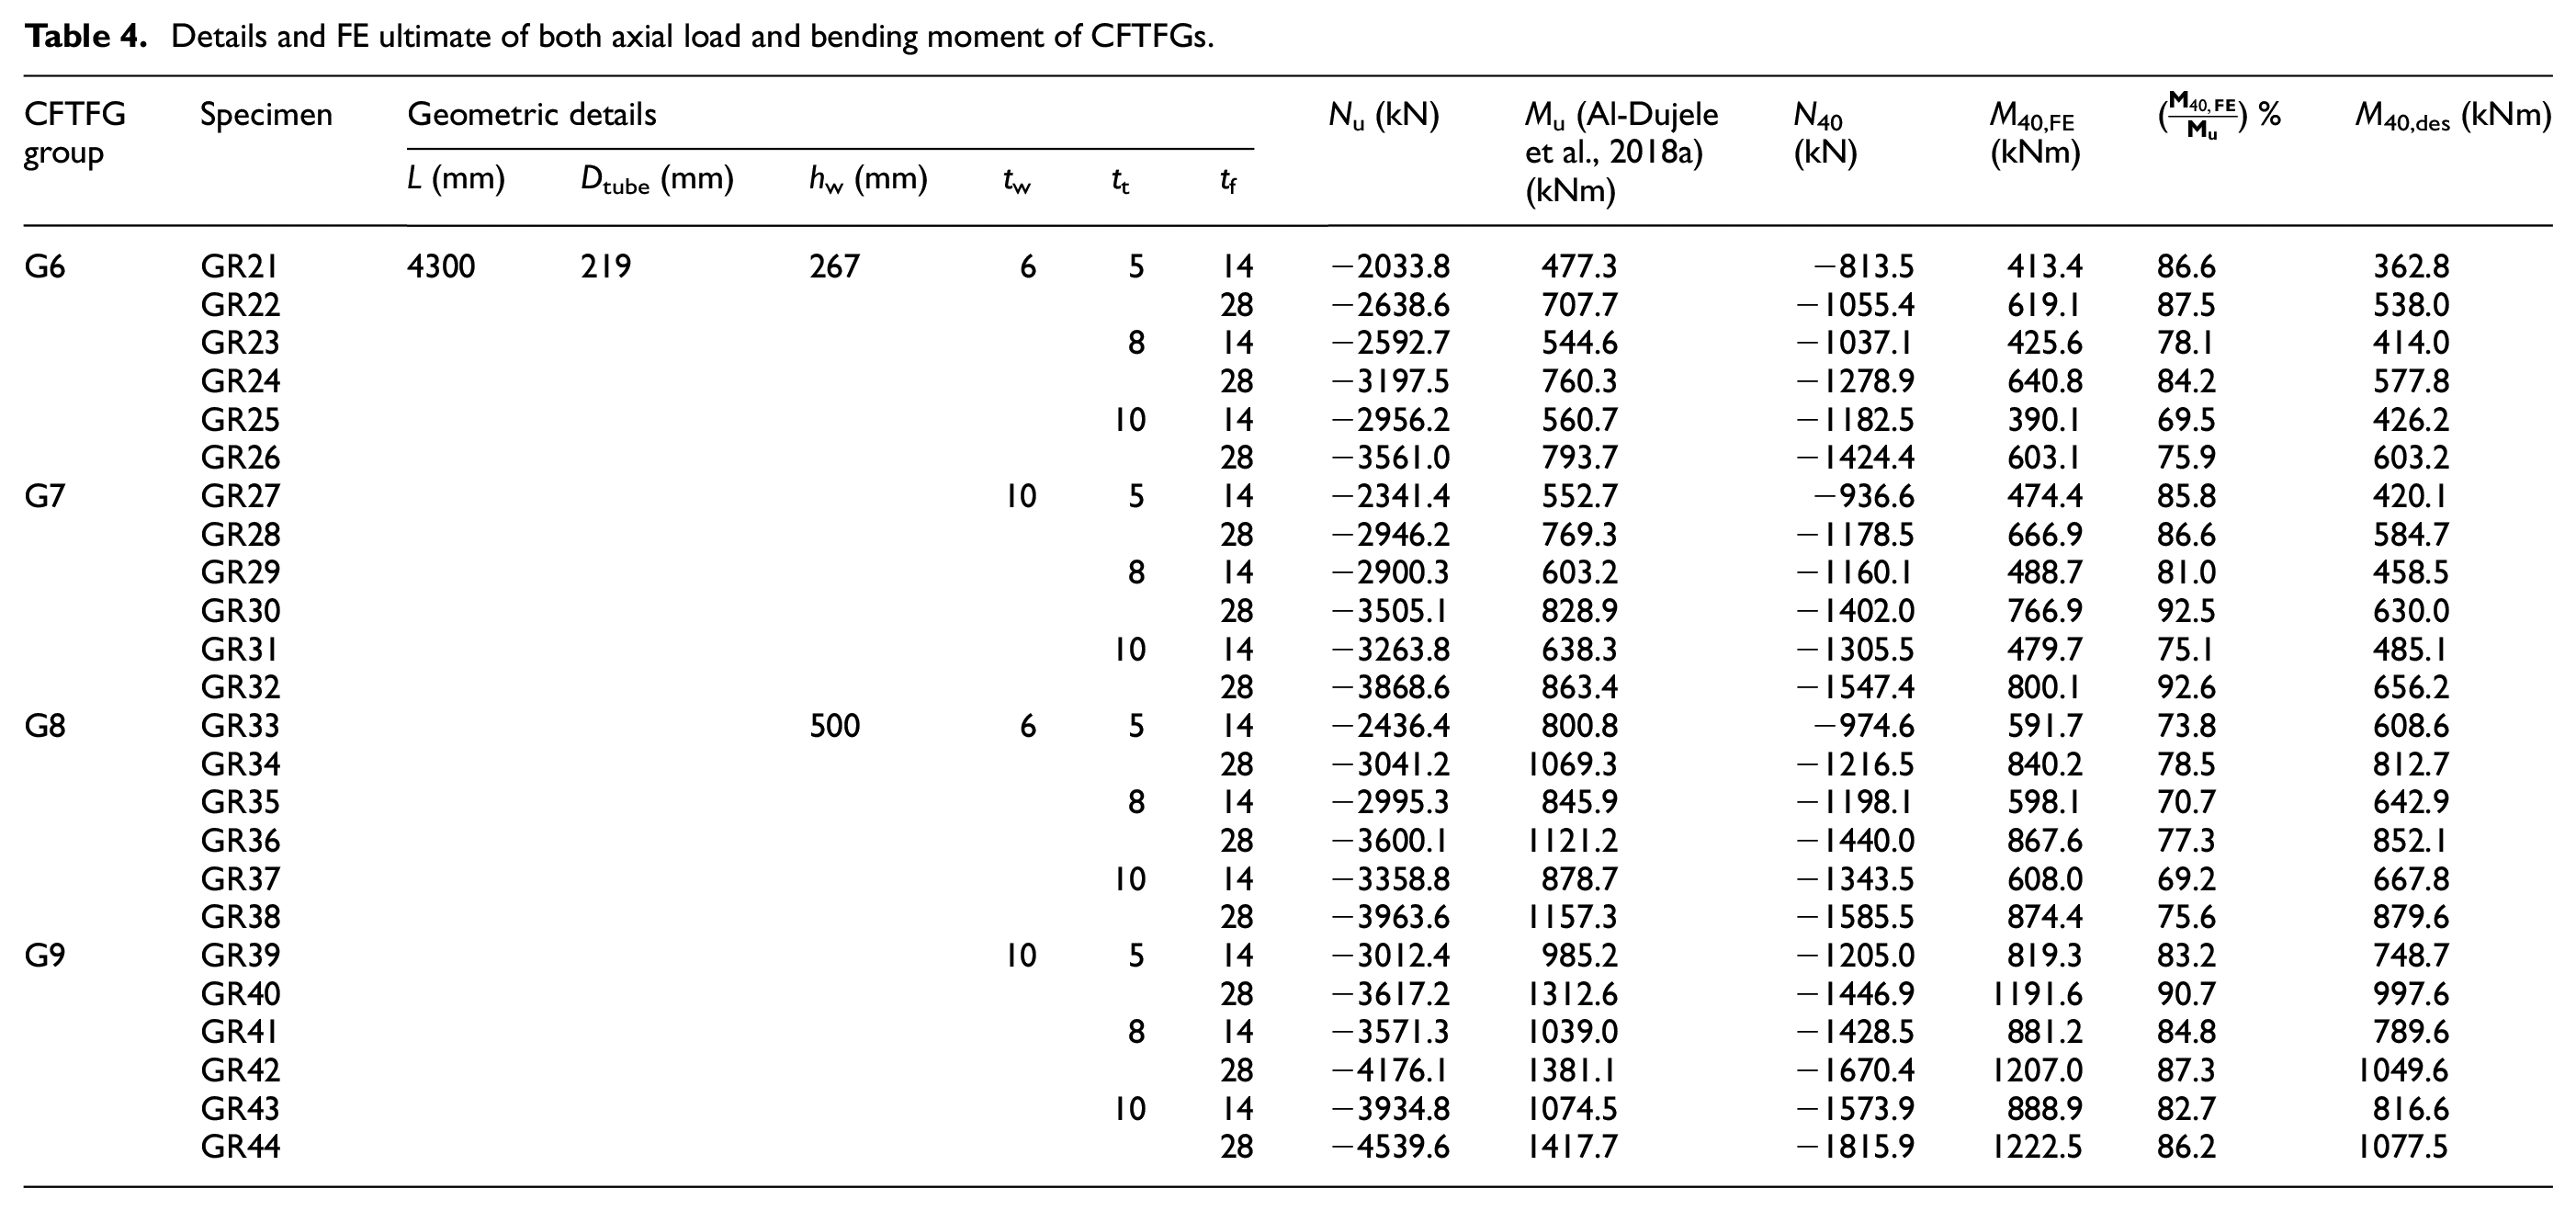
The moment–axial load interaction curves generated from the parametric study are presented in Figure 6. In general, all of the CFTFGs behaved well and there was no sudden collapse of any structural component during the simulations. A general conclusion is that the interaction diagram for all beams follows a similar pattern and the moment capacity of each is reduced with an increase in axial tensile force acting in the steel beam section. Figure 6(a) to (d) presents the moment versus axial load interaction diagrams obtained from the ABAQUS model for girders with different tube diameters Dtube (as in Table 3). For ease of visualisation and analysis, the results are grouped into four different images. Girders with a web height hw of 267 mm and different tube sizes Dtube are plotted in Figure 6(a) and (b) for flange thicknesses of 14 and 28 mm, respectively, whilst the equivalent images for members with a web height of 500 mm are presented in Figure 6(c) and (d). With reference to these figures, the following observations are made:
Figure 6(a) shows that for a given level of applied axial load (e.g. 40% of the ultimate axial strength N40), the reduction in bending moment carried by each girder is 83.4%, 80.9%, 79.5%, 78.1% and 68.6% for GR1, GR5, GR9, GR13 and GR17, respectively, compared with their ultimate moment capacity Mu (the value that can be achieved when no axial load is applied). Similar trends are shown in Figure 6(b) to (d).
It is clear that the CFTFGs with a relatively small tubular flange Dtube experience a greater reduction in their moment-carrying capability as a result of increasing the applied axial compared with member with a larger diameter top tube. This is attributed to the concrete contribution being less significant for the sections with a relatively small diameter tubular flange.
CFTFGs with relatively thin bottom flanges tf experience a more significant reduction in moment-carrying capability, relative to their ultimate moment capacity, when axial tension is also applied to the section. The reduction in bending moment carried by each girder is 83.4% and 88.0% for GR1 and GR2, respectively, compared with their ultimate moment capacity Mu. As the amount of axial load introduced in the steel beam increases, the moment resistance decreases considerably, as shown in the percentage ratio values presented in Table 3.
The influence of web height is examined by comparing GR1 in Figure 6(a) and GR3 in Figure 6(c) which have identical properties apart from hw which is 267 and 500 mm, respectively. The reduction in moment for GR1, relative to its moment capacity without any axial load, is just 83.4% whereas the equivalent value for GR3 is about 75.5%.
With reference to Table 3, a relative increase in tube thickness tt leads to a reduction of the of the moment carrying capacity. For instance, as can be seen in the M40,FE/Mu ratios given in Table 4, the moment capacity is reduced by 86.0%, 84.2% and 75.9% for GR22, GR24 and GR26, respectively at 40% of ultimate axial load. On the other hand, the M40,FE/Mu ratios increase when the web thickness increases. The moment is reduced by 73.8% and 83.2% for GR33 and GR39, respectively.
Moment -axial force interaction diagram for CFTFGs with values of Dtube between 180 mm and 300 mm and (a) hw = 267 mm and tf = 14 mm, (b) hw = 267 mm and tf = 28 mm, (c) hw=500 mm and tf = 14 mm, and (d) hw = 500 mm and tf = 28 mm.
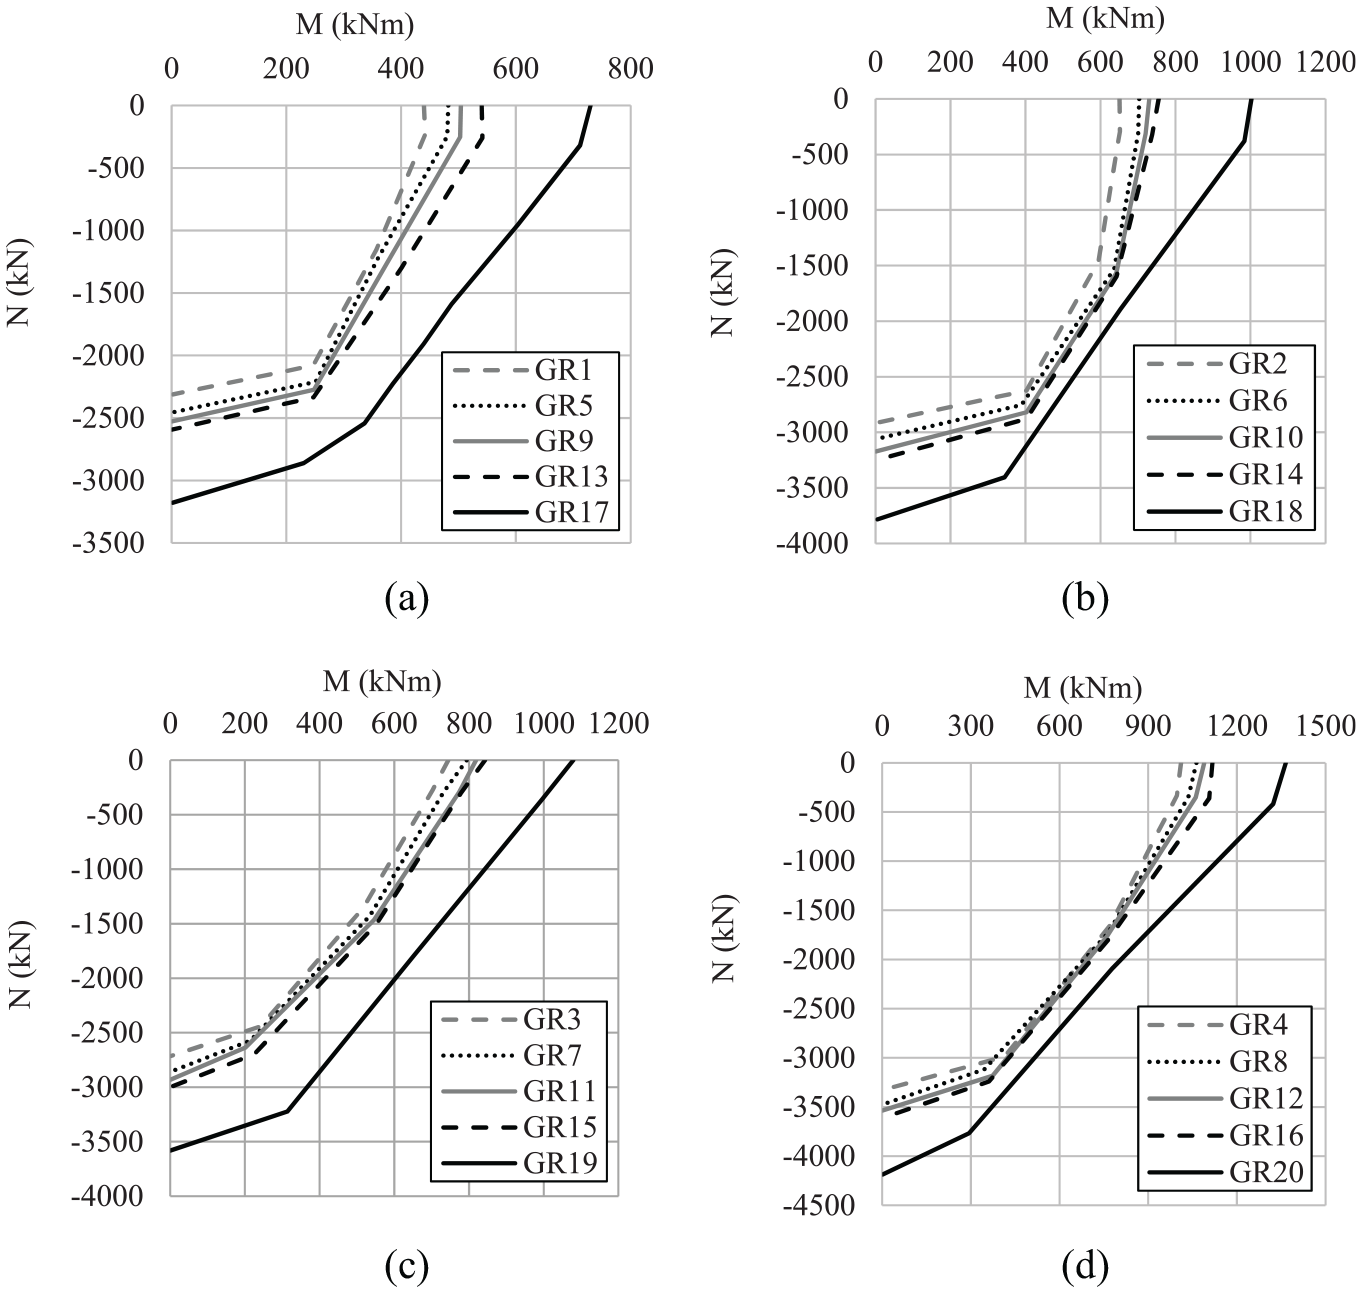
Figure 7 presents the moment–axial load interaction curves for the specimens given in Table 4. All of the curves within each graph present results from specimens with the same compression flange diameter (219 mm) and varying other dimensions. The key observations from these curves include:
The beams with smaller web heights demonstrate lower moment and axial force capacity, as expected.
An increase in tt leads to a reduction in the moment. For instance, as can be seen in Table 4, the moment is 425.6 kN·m when tt = 8 mm for GR23 and the moment reduces to about 390.1 kN·m when tt = 10 mm for GR25 at 40% of ultimate axial load. On the other hand, the moment increase when the tw increases.
An increase in tf leads to an increase of the moment-carrying capability.
The interaction diagrams follow the same trend for girders with identical values of hw.
Moment -axial force interaction diagrams for CFTFGs with Dtube= 219 mm and (a) tf=14 mm and tt=5 mm, (b) tf=28 mm and tt=5 mm, (c) tf=14 mm and tt=8 mm, (d) tf=28 mm and tt=8 mm, (e) tf=14 mm and tt=10 mm, and (d) tf=28 mm and tt=10 mm.
From the interaction diagrams and the data presented in Tables 3 and 4 it can be concluded that the flexural capacity of CFTFGs under combined tension and bending moments is not affected when the level of the axial force is relatively low (i.e. around 20% of Nu). Nevertheless, a general conclusion is that the moment capacity is reduced with the presence of applied axial tensile force acting on the steel section.
Influence of yield strength of steel on the behaviour
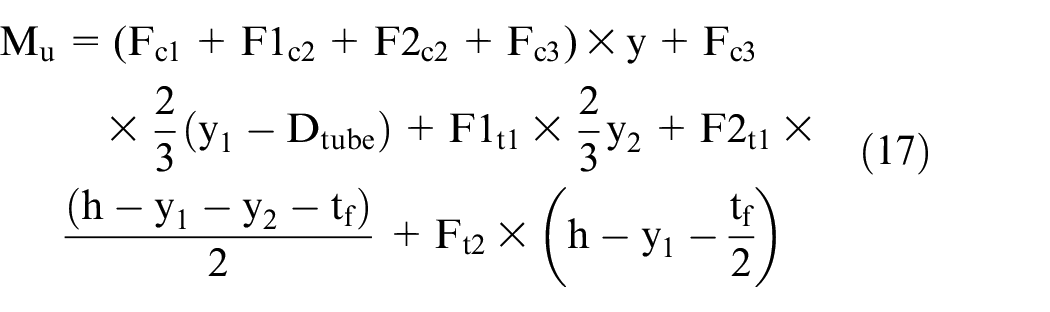
In this section, the CFTFG GR13 (as described in Table 3) is modelled using different grades of structural steel, ranging from S235 to S690, to assess the influence of this parameter on the behaviour. The details and results from this parametric study are presented in Table 5. Figure 8 presents (a) the moment–axial force interaction diagrams for these beams and (b) the proposed design equation for these CFTFGs under combined bending moment and axial tension. In Figure 8(a), it is notable that all the predicted responses are of a similar shape. When the applied axial load is 40% of the ultimate axial capacity, an increase in the yield strength of the steel section leads to a reduction in the combined moment compared with ultimate moment. For example, when the steel section is made from S235 steel, M40,FE = 290.51 kN·m while Mu = 442.7 kN·m, giving a ratio of M40,FE to Mu of 65.6%. On the other hand, if the same CFTFG is made using S355 steel, these values change to M40,FE = 462.50 kN·m and Mu = 637.9 kN·m, with the corresponding ratio being 72.5%. So, the moment which can be carried by the section when the applied axial load is 40% of Nu increases when a higher grade of steel is used. In addition as can see by the M40,FE/Mu ratio in Table 5, the reduction ratio of moment relative to Mu increase with increase the steel yielding 65.62%, 72.50%, 77.62% and 80.39% for S235, S355, S460 and S690, respectively. As expected, the axial load and bending moment capacity increases in accordance with the yield strength.
Details and FE strengths of GR13 used to investigate the effect of fy.
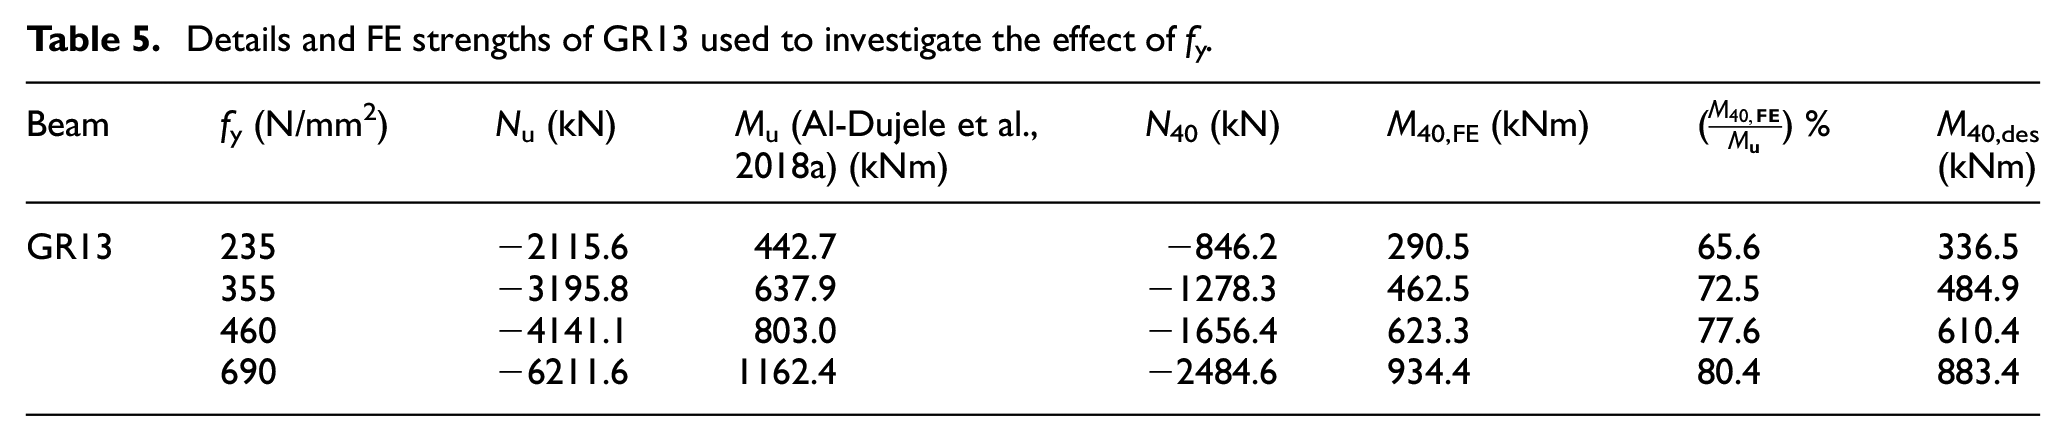
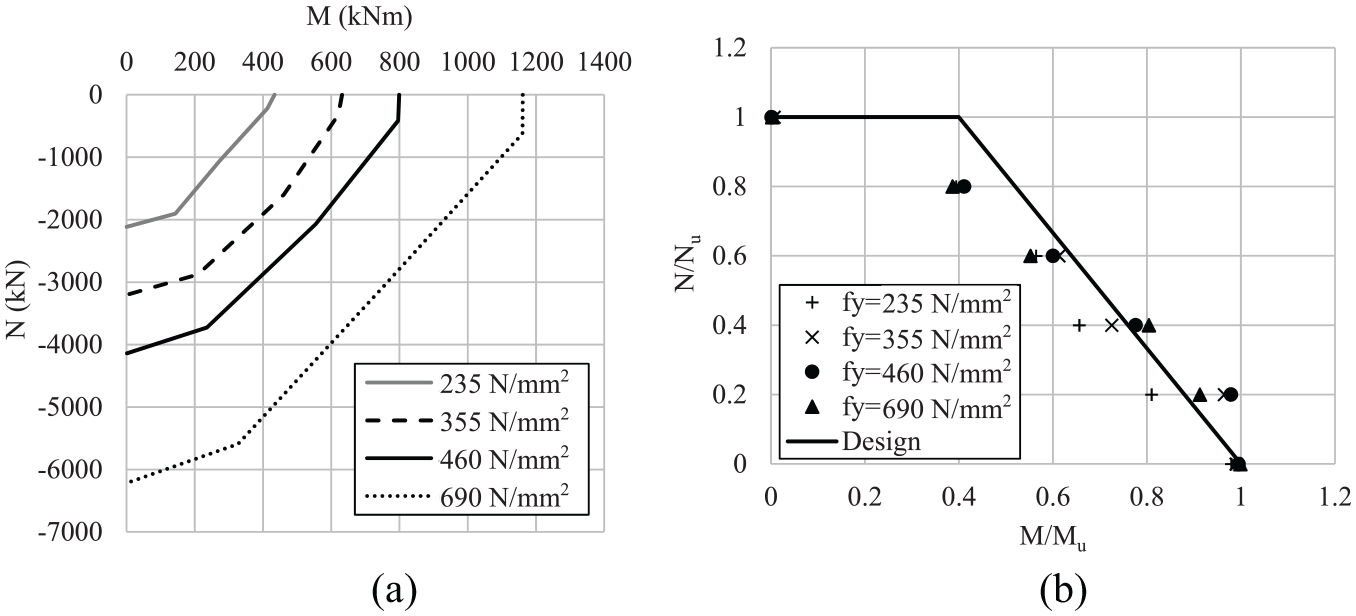
Model GR13: (a) moment–axial force interaction diagram with different yielding strength of steel and (b) proposed design equation for CFTFGs under combined action with different yielding strength of steel.
Design of CFTFGs under combined loading
In this section, a simplified analytical approach for assessing the capacity of CFTFGs under combined loading is presented, based on the observations from the FE simulations as well as a fundamental review of the behaviour. Firstly, it is necessary to assess the cross-sectional behaviour for a section under pure bending, before extending the study to allow for axial load also.
Moment capacity of a CFTFG Mu
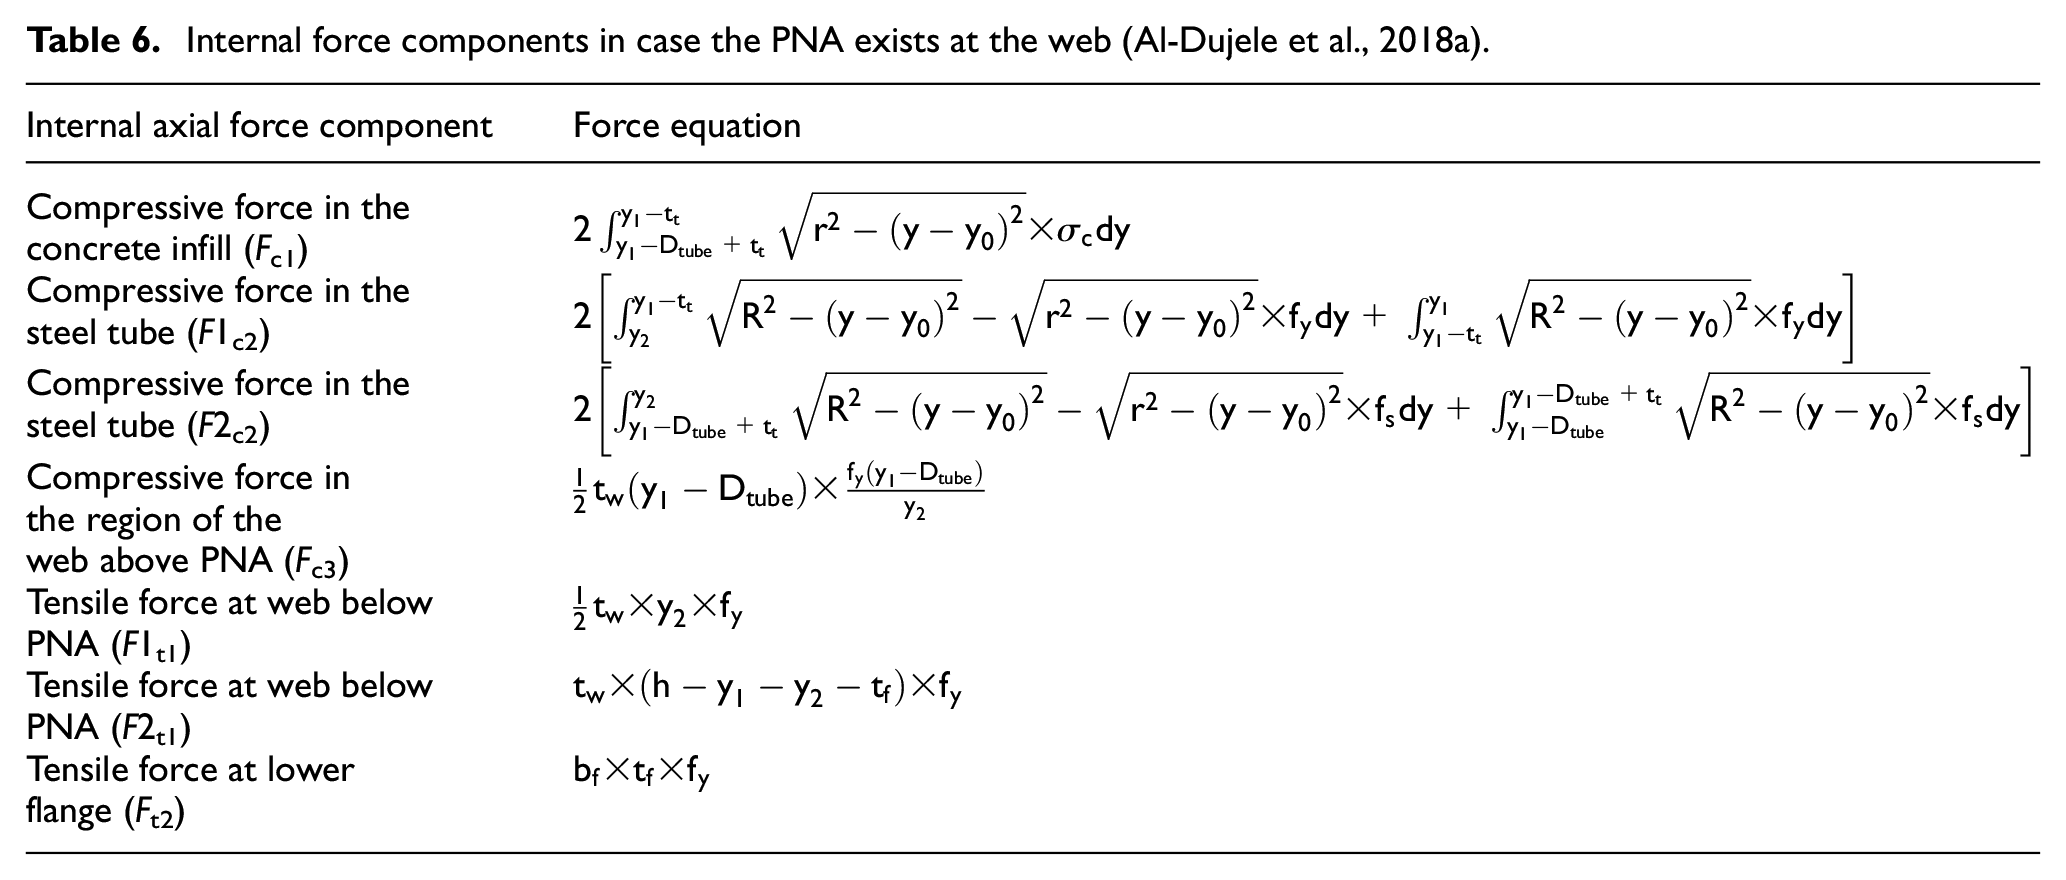
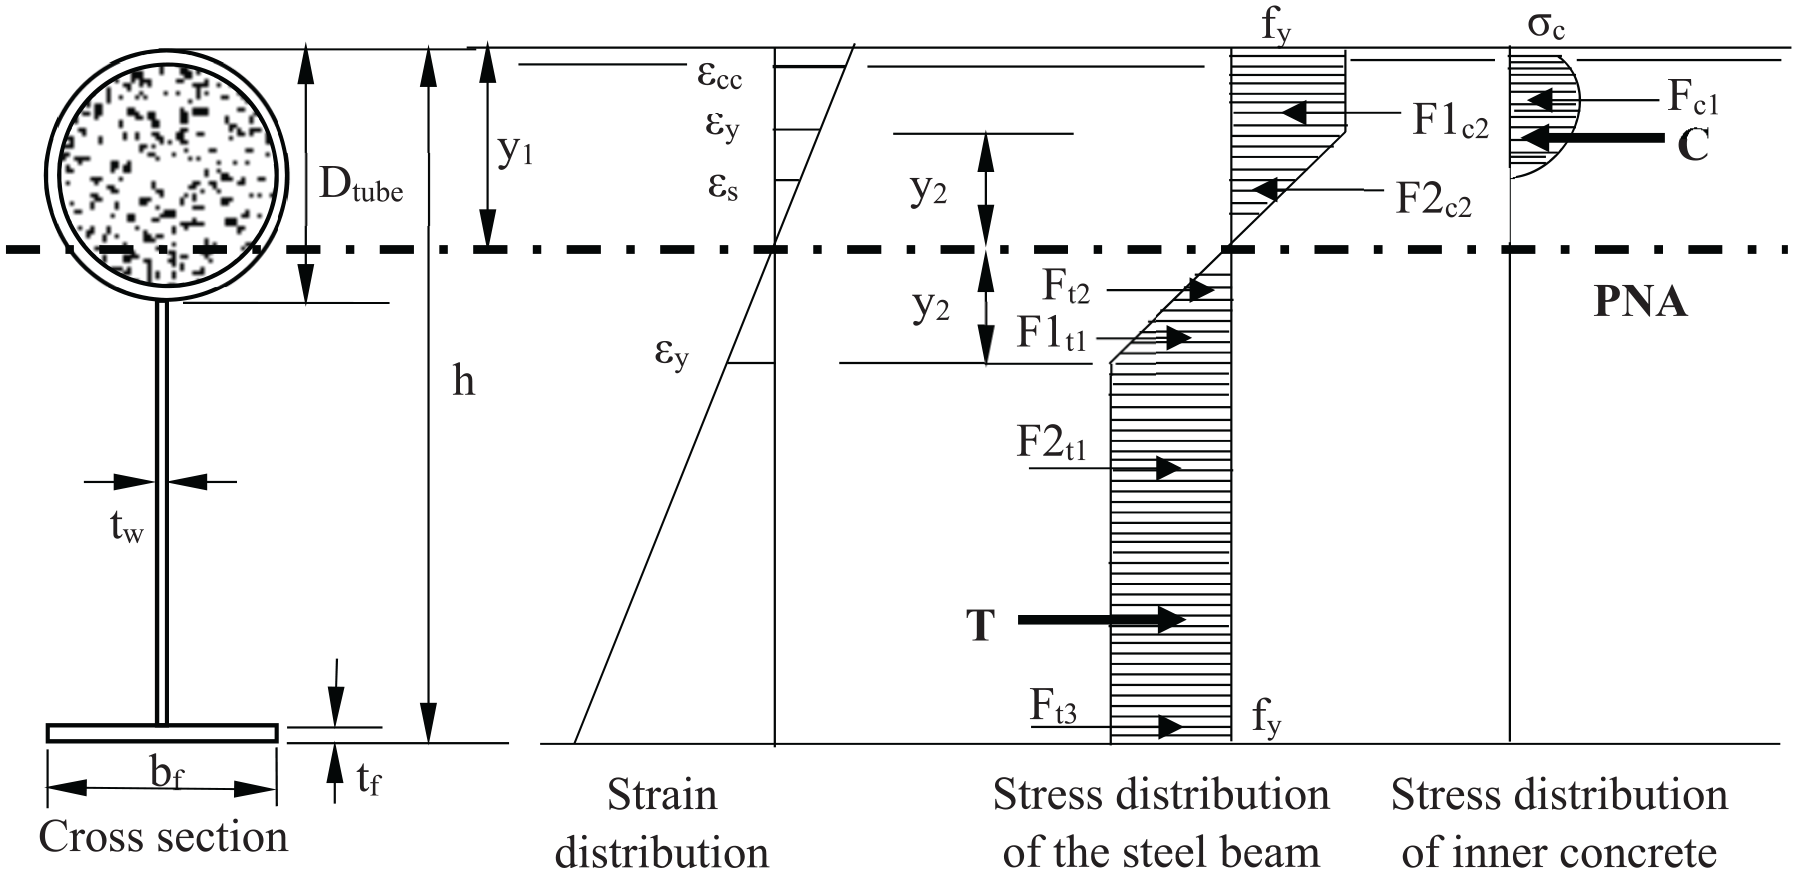
The ultimate bending capacity Mu of a CFTFG in pure flexure can be derived based on the equilibrium of internal forces in the cross-section. Previously, a series of analytical expressions for predicting the location of the PNA (y1 from the top of the girder) and Mu was presented by Al-Dujele et al. (2018a). In this scenario, when y1 > Dtube and therefore the PNA passes through the steel web, as shown in Figure 9, the moment capacity is determined as:
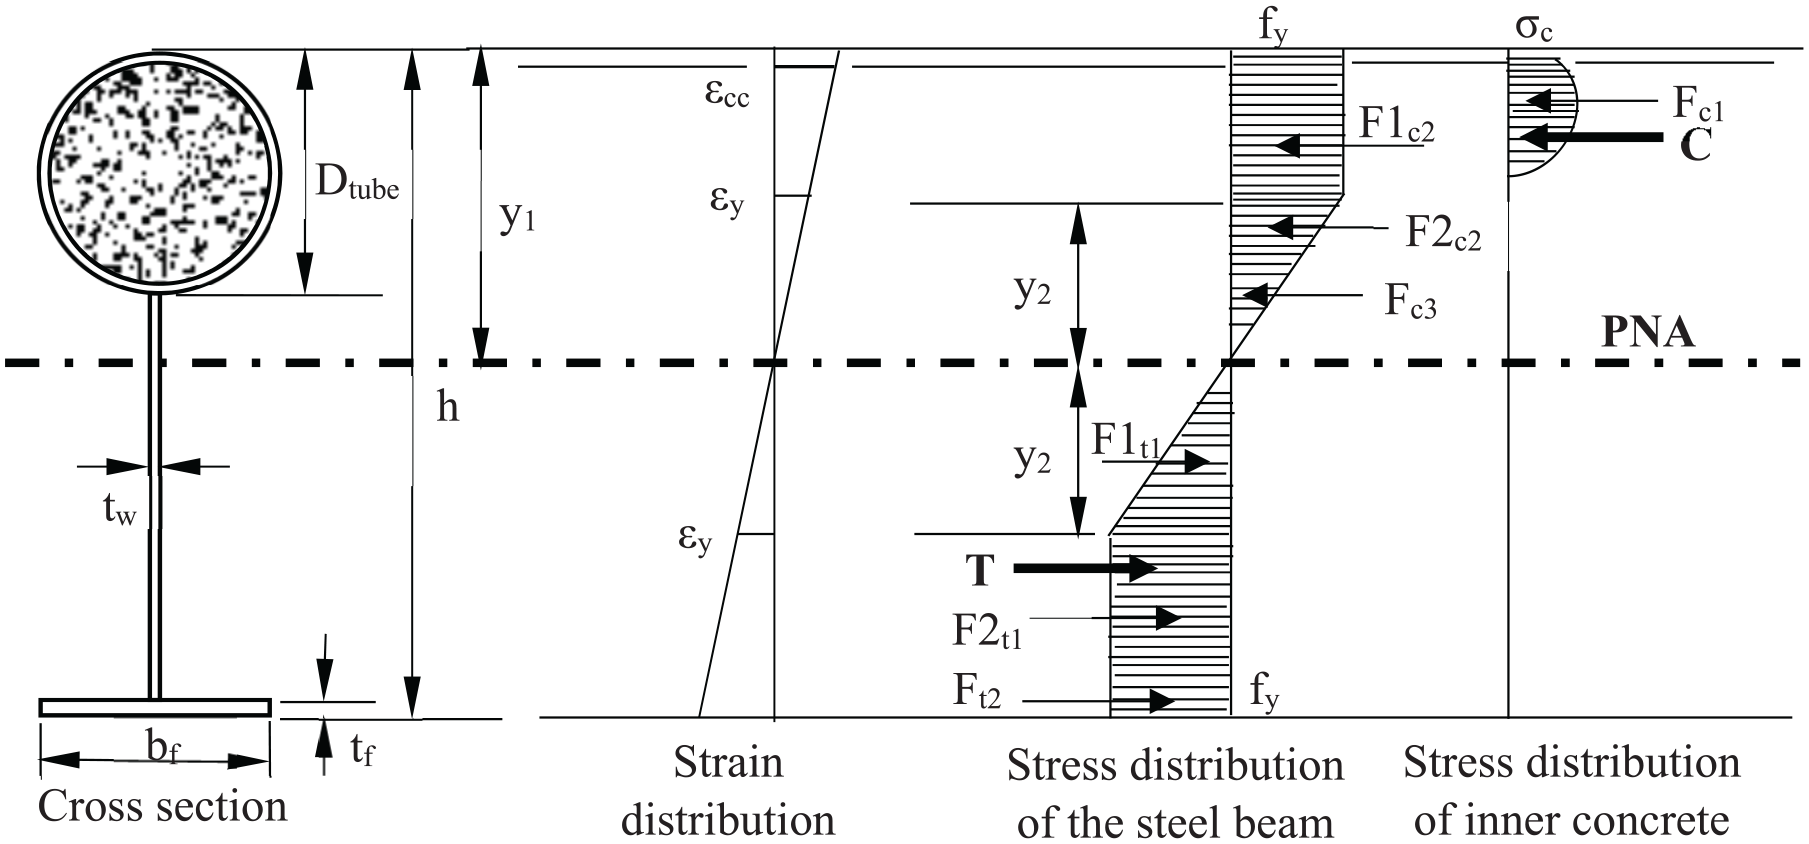
Distributions of strain and stress for Case 1, where the PNA is in the web of the steel section (y1 > Dtube).
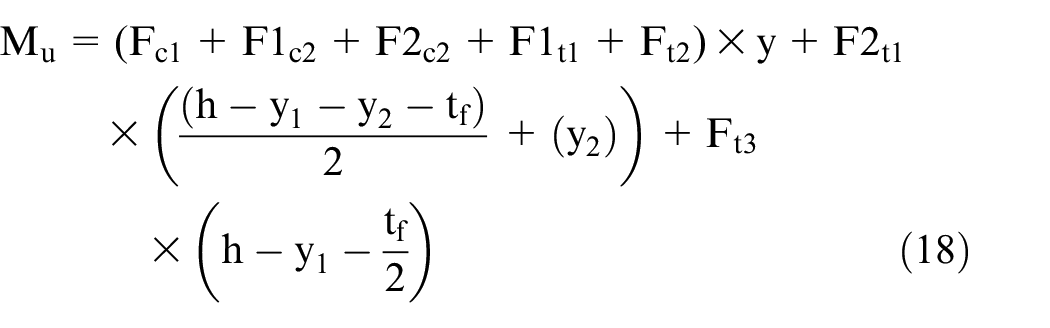
The internal axial force for each component of the section can be computed as shown in Table 6. On the other hand, when y1 < Dtube, and the PNA passes the concrete filled tube as shown in Figure 10, Mu can found as follows:
Internal force components in case the PNA exists at the web (Al-Dujele et al., 2018a).
Distributions of strain and stress for Case 2, where the PNA is in the tubular flange section (y1 < Dtube).
The internal axial force for each component of the section can be calculated from the equations presented in Table 7.
Internal force components in case the PNA passes the concrete filled tube (Al-Dujele et al., 2018a).
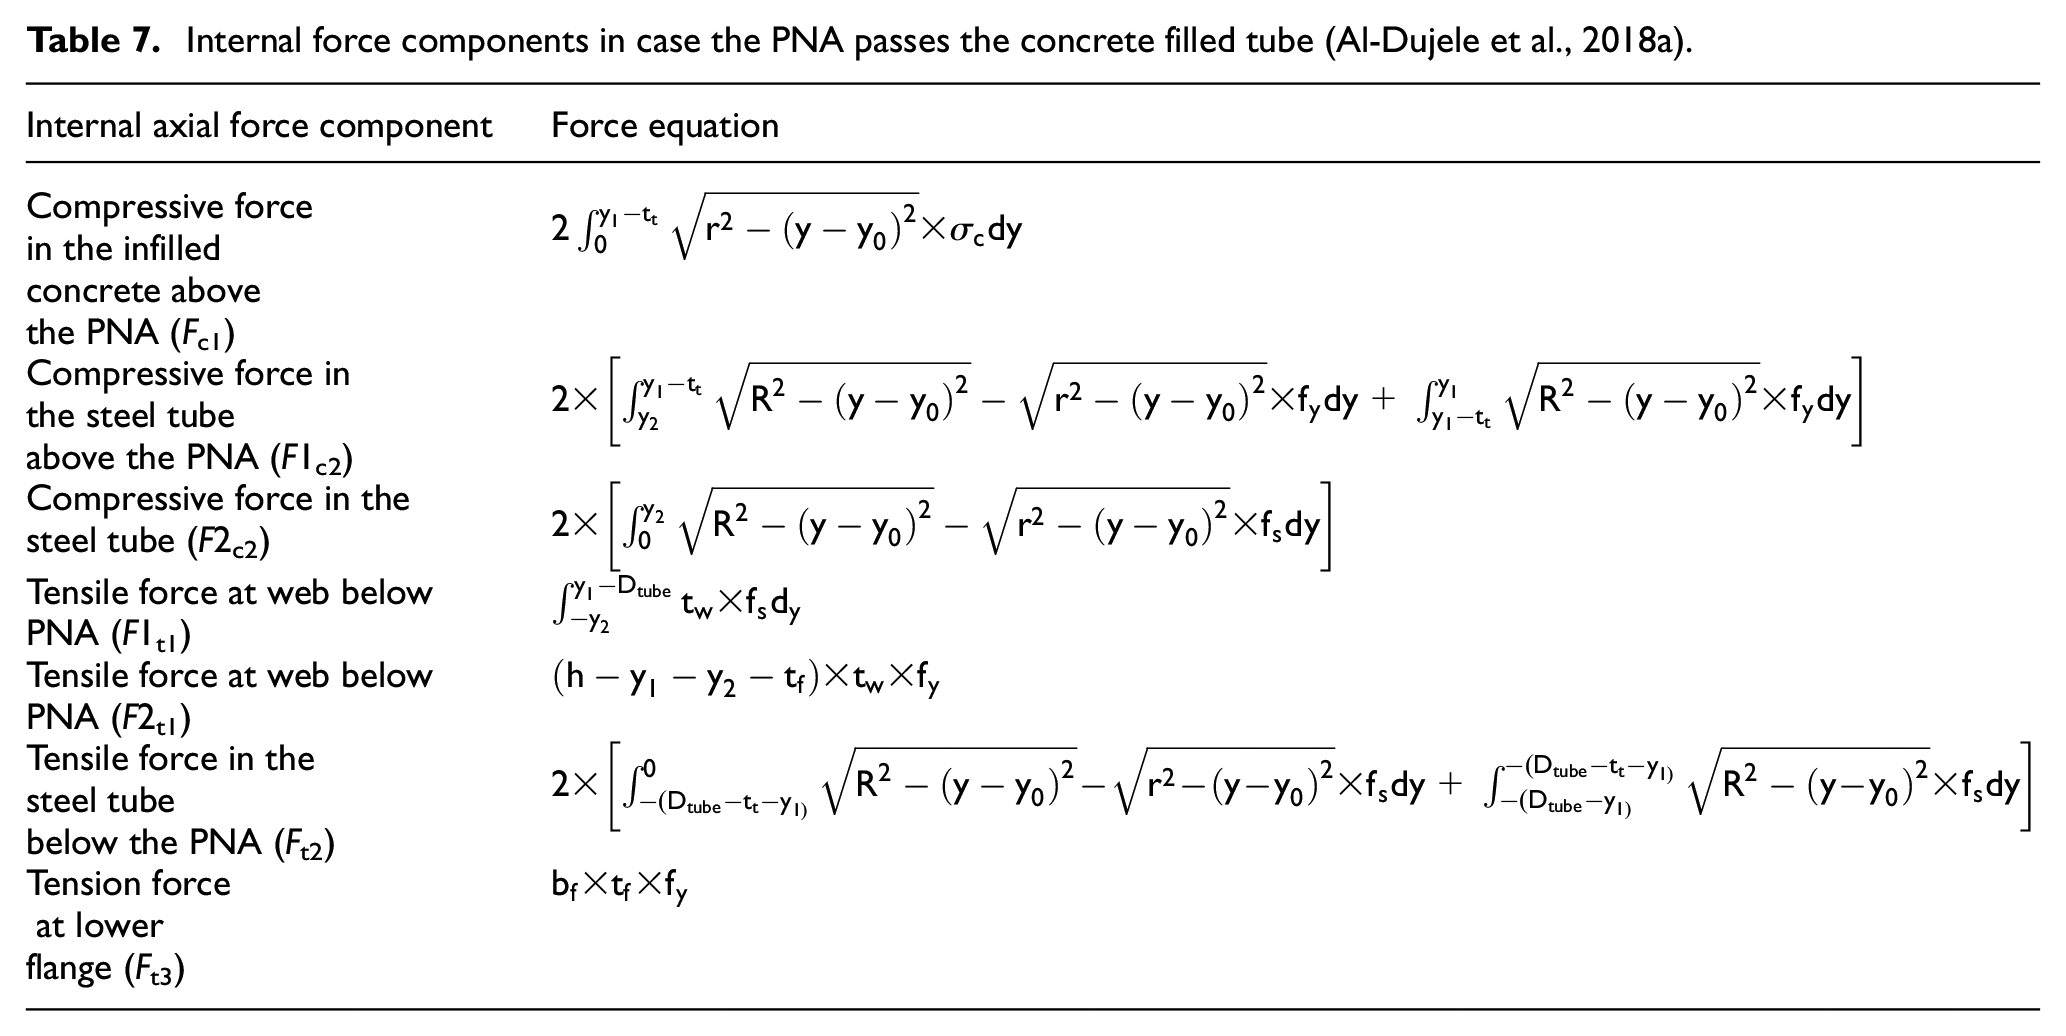
In these expressions, fs and εs are the stress and strain in the steel section, respectively. The coordinate (x0, y0) is the centre of the circular tube where x0 = 0 and y0 = y1 − R, and R and r are the outer and inner radius of the steel tube, respectively. The term y2, which is the vertical height of the triangular stress block, is determined by
CFTFGs under combined loading
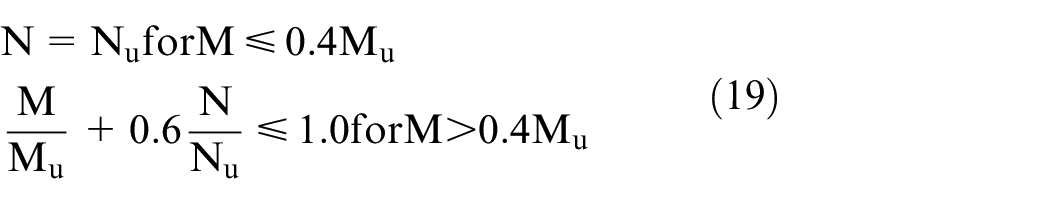
Based on the FE results and the parametric study, a simple design model for CFTFGs under combined sagging moments and axial tension is proposed in this section. For this purpose, the interaction data points presented before are given in non-dimensional form in Figure 11 for each of the CFTFGs included in the parametric study. In these figures, the axial force and bending moment acting on the beams simultaneously are normalised by the axial capacity (Nu) and moment capacity (Mu), respectively. Using the data from the parametric study, it is proposed that for the design of CFTFGs subjected to combined axial load and bending moment, the following interaction expression should be satisfied:
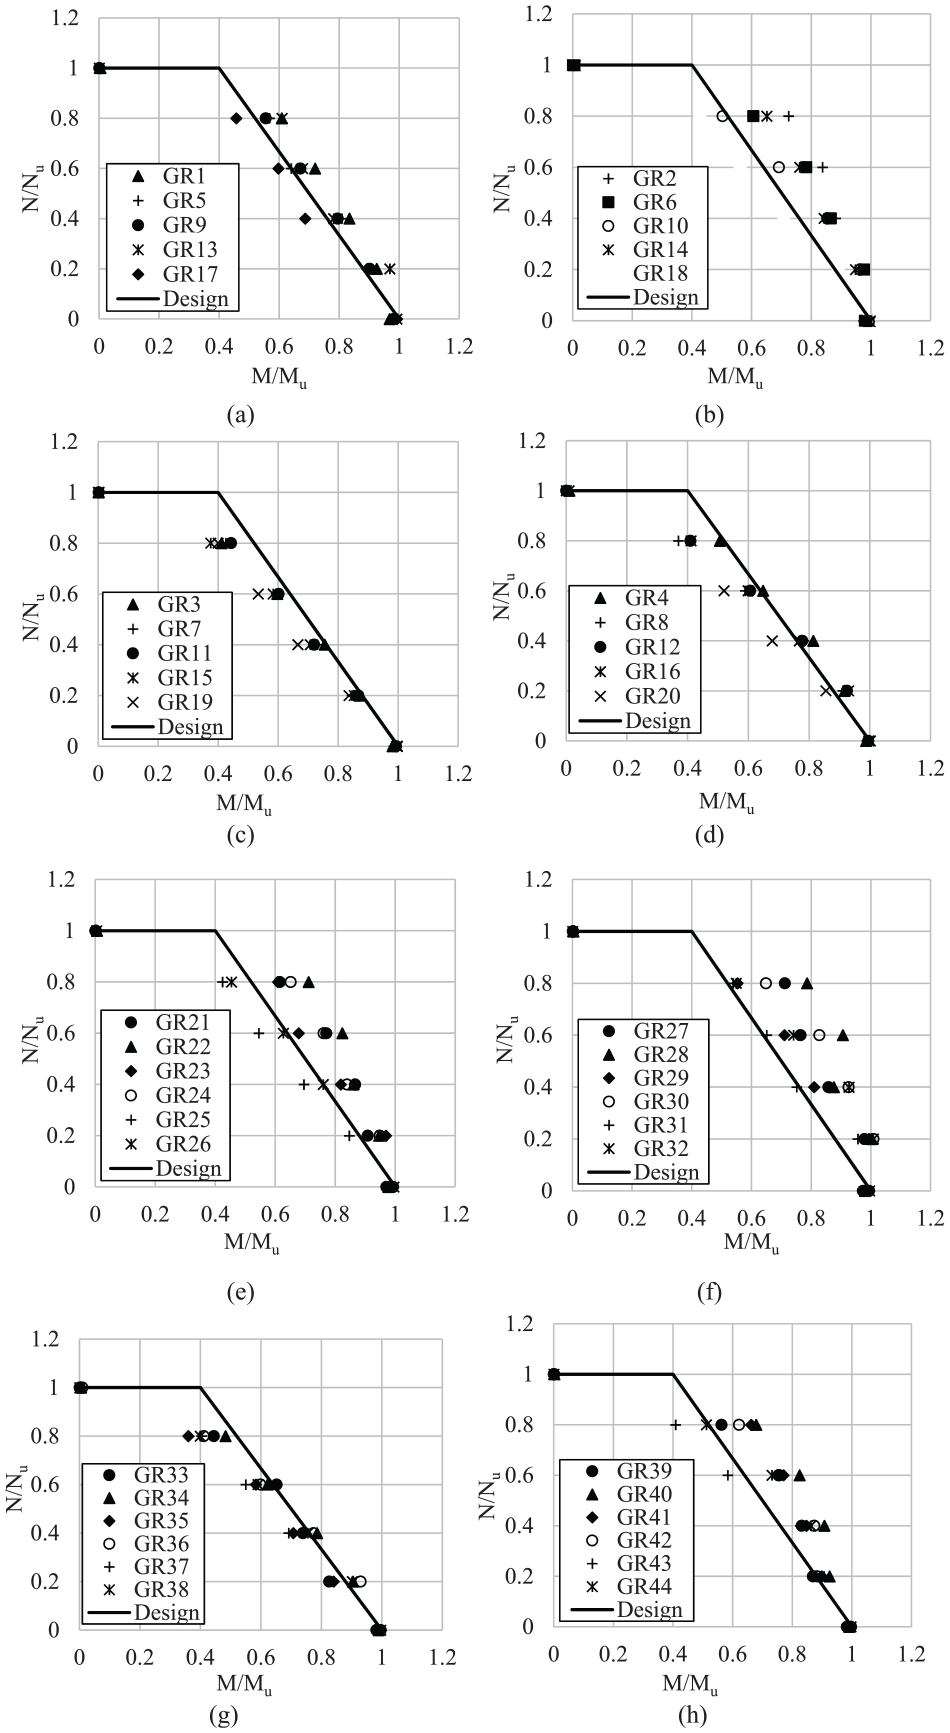
Results from the parametric study and proposed design equation.
This proposed design expression is the same for all beams included in the current study and is presented in Figure 11, denoted as ‘Design’. According to equation (19), the moment capacity of a CFTFG reduces linearly from 100% of the ultimate value when there is no axial load present to around 40% of Mu when the axial load applied equals Nu. It is noteworthy however, that in practice it is very rare for a beam to be subjected to tensile axial forces greater than the 30%–40% of its axial capacity (Kirkland, 2014; Vasdravellis et al., 2012, 2015). Nevertheless, this study has considered the full range of axial force possibilities in order to complete the interaction diagram and gain a complete understanding of the behaviour of CFTFGs under combined loading.
Tables 3 and 4 present a comparison between the bending strength predicted by the FEM (M40,FEM) and the design moment capacity (M40,des) calculated by equation (19) for a selection of girders, as well as the associated error. A positive value for the error indicates an unconservative prediction. The results are not presented for all girders in the study for brevity but similar analaysis has been completed for all of the CFTFGs presented in Tables 3 and 4. Based on the images presented in Figure 11 and the data in Tables 3 and 4, it is clear that the proposed equation provides a conservative estimation of the interaction behaviour of the majority of CFTFGs. The error is small when the level of axial load is relatively low (i.e. up to and including 60% of the axial capacity, which is the most realistic scenario for CFTFGs under combined loading) and becomes slightly greater as the axial load increases to 80% of Nu.
Conclusions and further research
This paper presents the results of an extensive numerical investigation that is carried out to study the effects of axial tension applied in combination with sagging moment’s for CFTFGs. A parametric study is conducted, examining several key parameters including the tube diameter size (Dtube), the thickness (tt) of the compression flanges, the bottom tubular flange depth (tf), the web plate slenderness and the yield strength of steel. It is shown that the moment capacity of a CFTFG is reduced under the presence of an axial tensile force acting in the steel beam section but this is not a major issue within the realistic range of applied axial loads (up to 40% of Nu). In addition, the analysis demonstrates that the axial tensile force that the CFTFG section can sustain is limited and the design axial tensile resistance should be taken equal to the plastic axial capacity of the steel beam alone. It is shown that the bending moment capacity of a CFTFG deteriorates under the simultaneous action of a relatively high axial tensile force with bending moments. However, the reduction is less or even negligible under a low to moderate axial force in most practical cases. Based on the absence of specific design formulae for CFTFGs under combined loading, a design model is proposed and shown to provide accurate capacity predictions. The work presented in this paper is part of a larger programme of research, in which different shapes of CFTFGs are studied under various other load scenarios, including extreme conditions.
Footnotes
Acknowledgements
The authors would like to gratefully acknowledge the financial support by the Office of the Prime Minister of Iraq through the Higher Committee for Education Development in Iraq.
Declaration of conflicting interests
The author(s) declared no potential conflicts of interest with respect to the research, authorship and/or publication of this article.
Funding
The author(s) received no financial support for the research, authorship and/or publication of this article.