
Abstract
Thunderstorms winds are localized and transient phenomena characterized by three-dimensional non-stationary velocity fields. While numerous studies investigated the wind loading on cantilevered structures under thunderstorm downburst winds, there is a lack of fundamental research on the behavior of simple circular cylinders subjected to downburst-like outflows. This paper investigates the pressure distribution and aerodynamic coefficients of two cylinders with different diameters immersed in three different types of wind: (1) isolated downburst (DB); (2) downburst embedded in an atmospheric boundary layer (ABL) wind (DBABL); and (3) steady ABL wind. The focus of this study is to provide a comparative analysis between aerodynamic coefficients (drag and lift) and surface pressures that result from these three different wind systems. The ABL winds caused a higher drag on the thinner cylinder than the two DB-like outflows. The lift coefficients during the primary vortex passage in the DB-like outflows were negative at the base of the cylinders and approached zero or to slightly positive values close to the cylinders’ top. The location of the cylinders in DB-like outflows is the dominant factor for their aerodynamics.
Keywords
Introduction
On-going research over the last several decades has demonstrated that the wind loading caused by the atmospheric boundary layer (ABL) winds profoundly differs from the wind loading due to highly three-dimensional and transient winds, such as thunderstorm downbursts (Hangan et al., 2019; Solari, 2016). The main differences in the structural behavior to different wind systems are not only due to potentially higher wind speeds in downburst outflows but predominantly are due to different vertical profiles of the mean wind speed and turbulent characteristics between the two flows, as well as different velocity distributions (De Gaetano et al., 2014; Hangan et al., 2019). By definition, thunderstorm downbursts are cold downdrafts that originate from a cumulonimbus cloud and spread radially upon hitting the surface. The main contributors to the negative buoyancy of descending downdrafts are evaporation and, to a smaller extent, melting of hydrometeors inside and below the cloud, as well as the drag due to the falling hydrometeors (e.g. falling raindrops, ice, and graupel). Other contributing factors for descending currents in supercell cumulonimbus clouds have also been identified and discussed in the literature (Markowski, 2002).
In wind engineering applications, circular cylinders are found in construction designs of lighting and luminary poles, chimneys and antenna masts, power transmission lines, silos, wind turbine towers, and bridge supports and cranes, to name few applications. Therefore, the proper understanding of aerodynamic wind coefficients and surface pressures on circular cylinders is needed for the appropriate design of cylindrical structures. While these parameters are well researched and properly reported in many international wind building codes for the case of ABL winds, there is a lack of fundamental research on the behavior of circular cylinders under the transient and non-Gaussian wind actions of downburst-like outflows.
When it comes to cantilevered structures, a lot of wind engineering research has recently been focused on the structural behavior of transmission lines and towers under downburst winds. Savory et al. (2001) performed dynamic structural analysis of a lattice transmission tower to investigate wind loading and failure criteria due to downbursts and tornadoes. Their study concluded that the calculated tornado failures have better agreement with the field damage surveys. However, the study neglected vertical downburst wind components, as well as downburst forces on conductors. Later, Shehata et al. (2005) and Shehata and Damatty (2007) investigated the responses of transmission lines under downburst wind using a computational fluid dynamics (CFD) tool. More recently, Wang et al. (2009), Darwish et al. (2010), Darwish and Damatty (2011), Qu et al. (2013), and Elawady et al. (2017, 2018) studied transmission line responses under different downburst-like outflows by considering different structural properties of transmission lines. Ibrahim et al. (2017) showed that downbursts could be more hazardous for pre-stressed concrete poles than tornadoes.
In a study on thunderstorm response spectrum technique, Solari (2016) discussed the need for more research on comparative analyses between ABL and thunderstorm winds. One such study was carried out earlier by Kim et al. (2007), in which the authors examined the differences between ABL and downburst wind loads on tall buildings. They showed that the large downdrafts can produce higher shear forces and base moments than the ABL winds. Chen and Letchford (2004) simulated downburst wind actions on a cantilevered structure by assuming deterministic mean wind speed and stochastic fluctuations. They demonstrated that the structure was highly sensitive to wind fluctuations and the properties of coherence function. Later, Chay et al. (2006) concluded that lower turbulence intensities and higher mean wind speeds produced in a downburst outflow than in an ABL wind results in a higher and more correlated loading on a long span structure. In two consecutive papers, Nguyen et al. (2015a, 2015b) investigated aeroelastic responses of complex lighting poles and antenna masts subjected to ABL winds. The obtained aerodynamic coefficients were analyzed in the context of quasi-steady theory. Their analyses based on sectional model tests demonstrated the existence of certain configurations prone to wind instabilities and strong dynamic responses. Recently, Hangan et al. (2019) discussed the applicability of quasi-steady theory for non-synoptic winds such as downbursts and tornados. However, no study experimentally investigated the influence of downburst-like outflows on slender circular cylinders, which are among the most significant structural shapes in the field of wind engineering.
The main goal of this paper is to investigate experimentally the pressure distribution and associated aerodynamic force coefficients for two circular cylinders of different diameters with a free end that are immersed in downburst-like outflows. While the model geometry is rather simple, the investigated flows are complex and not investigated thus far in terms of the proposed application. The two circular cylinders were subjected to: (1) An isolated downburst outflow produced without ABL winds; (2) a downburst outflow embedded in ABL winds; and (3) the control case of ABL winds without any downburst outflow.
Experiments setup and methodology
The WindEEE Dome and experiments setup
All physical experiments in this study were performed in the WindEEE Dome (Hangan et al., 2017), which is a large-scale wind simulator capable of producing downburst-like outflows at different geometric scales varying from approximately 1:100 to over 1:1000 (Junayed et al., 2019; Romanic et al., 2020). The velocity scales are typically between 1:1 and 1:4. This unique wind simulator is capable of simultaneously producing different ABL winds and downburst outflows (Romanic et al., 2019) (Figure 1).
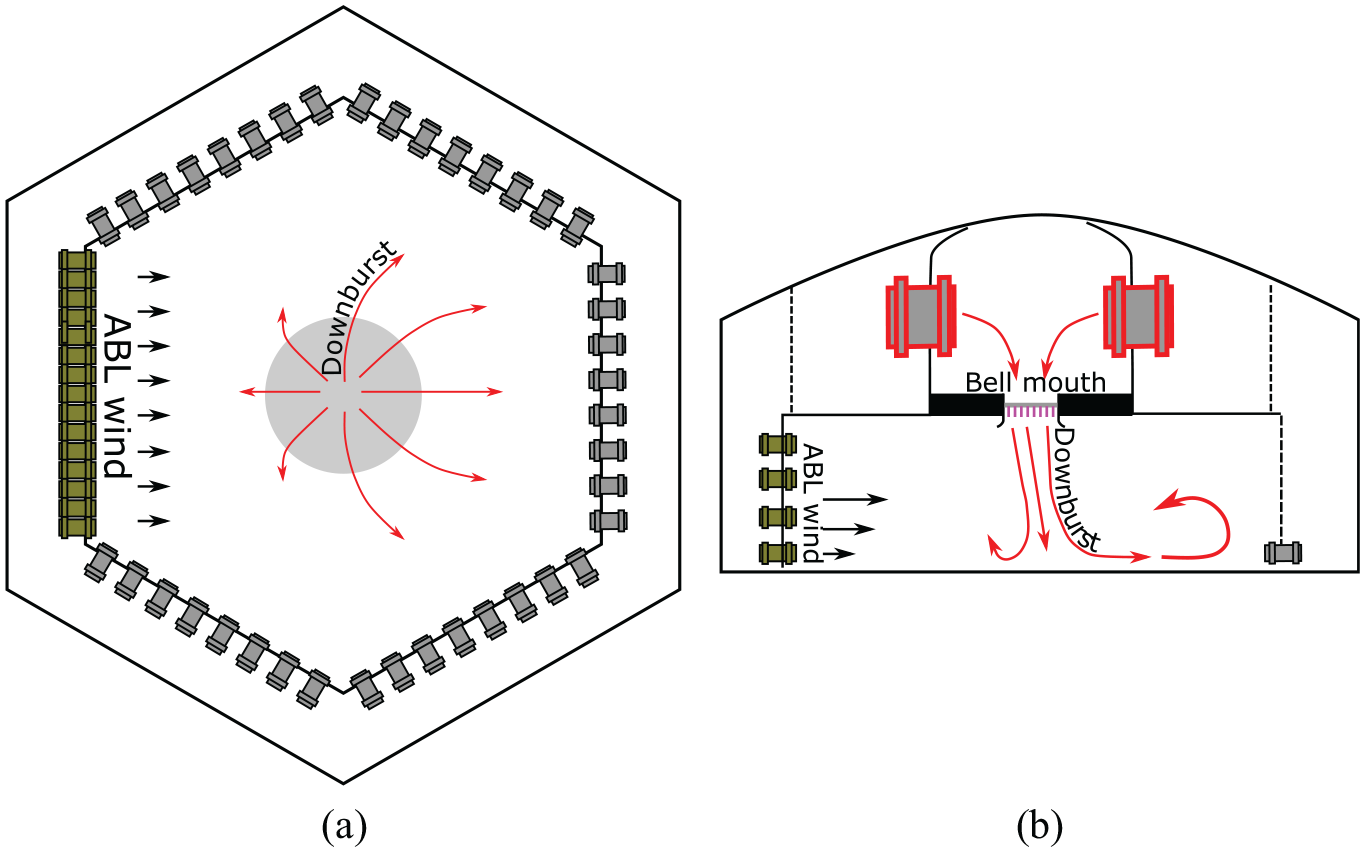
Downburst released in the background ABL winds inside the WindEEE Dome from (a) top-view and (b) side-view perspectives.
Downburst-like outflows in the WindEEE Dome are created by closing the louvers on the bell mouth and pressurizing the upper plenum (Figure 1(b)). The pressurization is achieved by using six large fans situated in the upper plenum, each fan with a diameter of 2 m. When the upper chamber is pressurized, the sudden opening of louvers creates an impinging jet that spreads out horizontally upon hitting the surface of the test chamber. The use of impinging jets to replicate downburst-like outflows was proposed by Hjelmfelt (1988) after demonstrating that these two flows have similar radial velocity profiles. The simultaneous downburst and ABL wind mode of the WindEEE Dome are similar to the isolated downburst mode, with the exception that the impinging jet is released into an already developed ABL wind (Figure 1). Nine different momentum ratios of ABL winds and downburst impinging jets were recently investigated in Romanic et al. (2019). The ABL winds were generated by using 60 fans installed on one of six peripheral walls in the test chamber (Figure 1(a)). The 60-fan wall contains four rows of 15 fans per row. A detailed description of the WindEEE Dome capabilities and a comparison of generated ABL winds against the Engineering Sciences Data Unit (ESDU) wind and turbulence intensity profiles (ESDU, 2002) are presented in Hangan et al. (2017) and Jubayer et al. (2019).
Hereafter, the isolated downburst-like outflow and the downburst simultaneously combined with ABL winds are referred to as DB and DBABL, respectively. The jet centerline velocity at the bell mouth level in the DB and DBABL downdrafts were 12.3 and 11.8 m s−1, respectively, whereas the ABL wind velocity at the height of the cylinder was 3.3 m s−1. The selected configuration of two flows was chosen due to the minimal loss of jet momentum between DB and DBABL cases in this closed-circuit mode of the WindEEE Dome (Romanic et al., 2019). All investigated downbursts had a diameter of
The diameters of two rigid Plexiglas circular cylinders considered in this study were
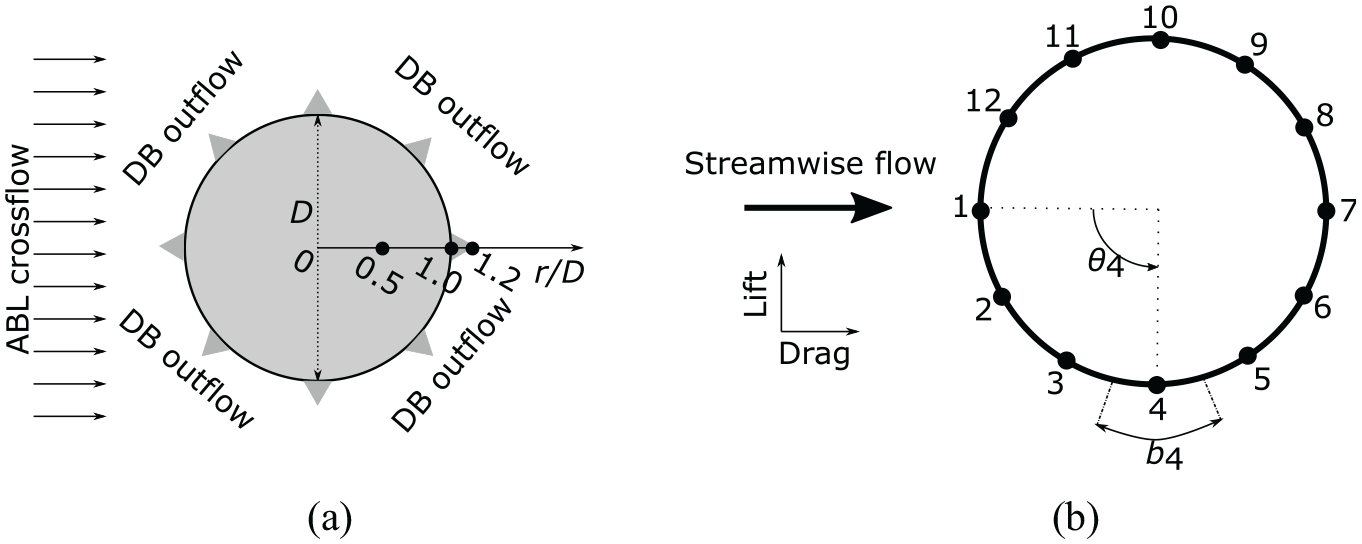
Summary of experiments: setup and governing parameters.
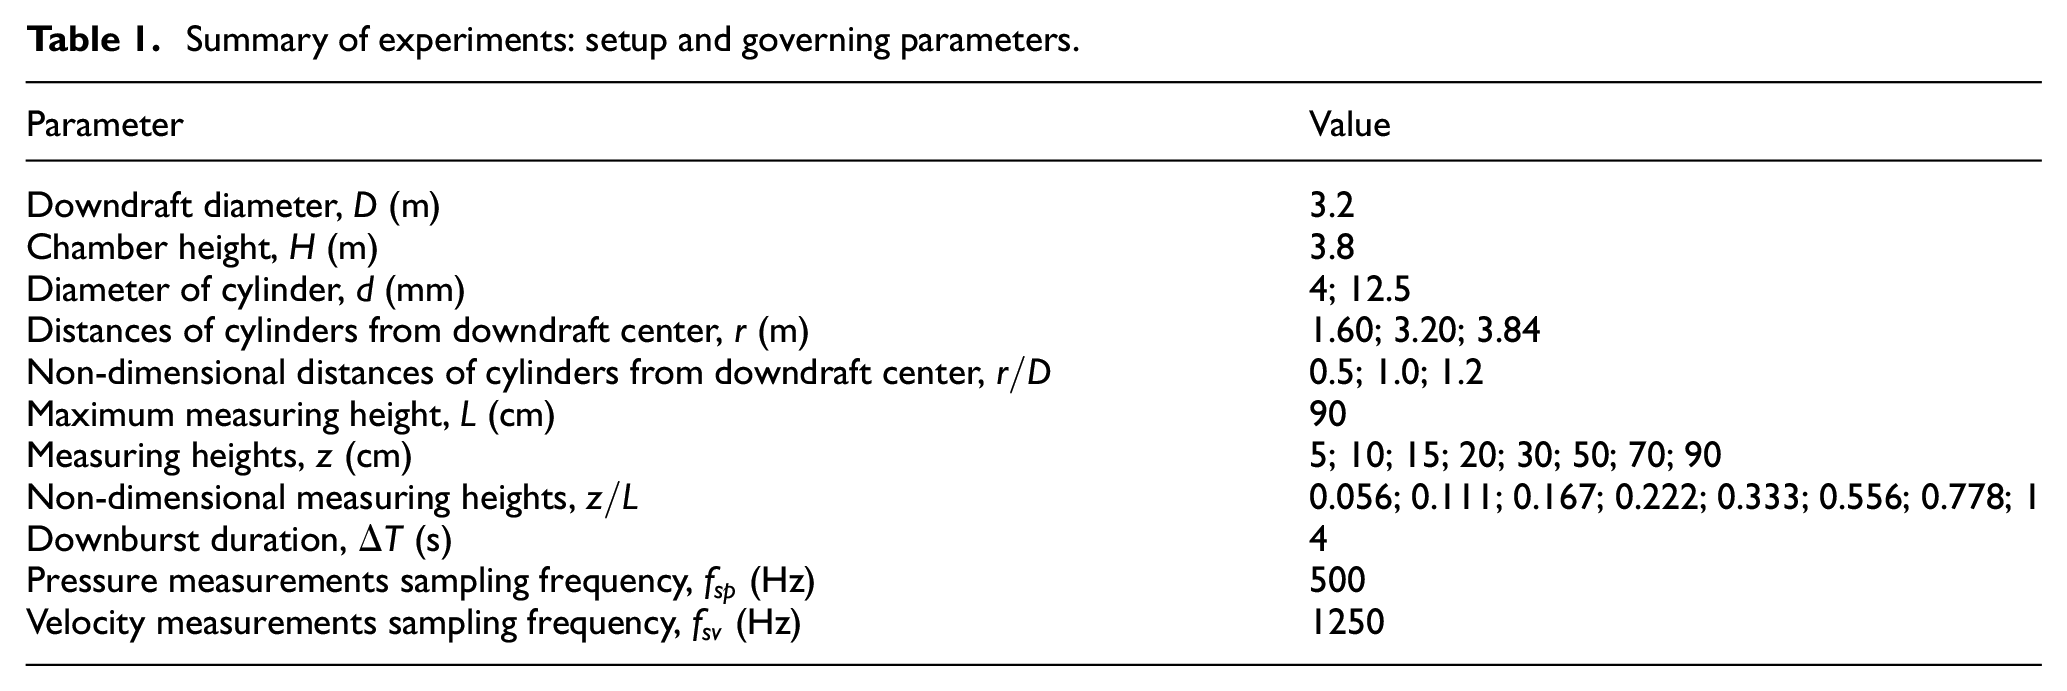
Two cylinders subjected to DB and DBABL outflows in the WindEEE Dome. (a) is a closer look at the pressure taps on the thinner cylinder, (b) shows the distance between the pressure taps and the free end of mounted cylinder, (c) Shows the cylinder
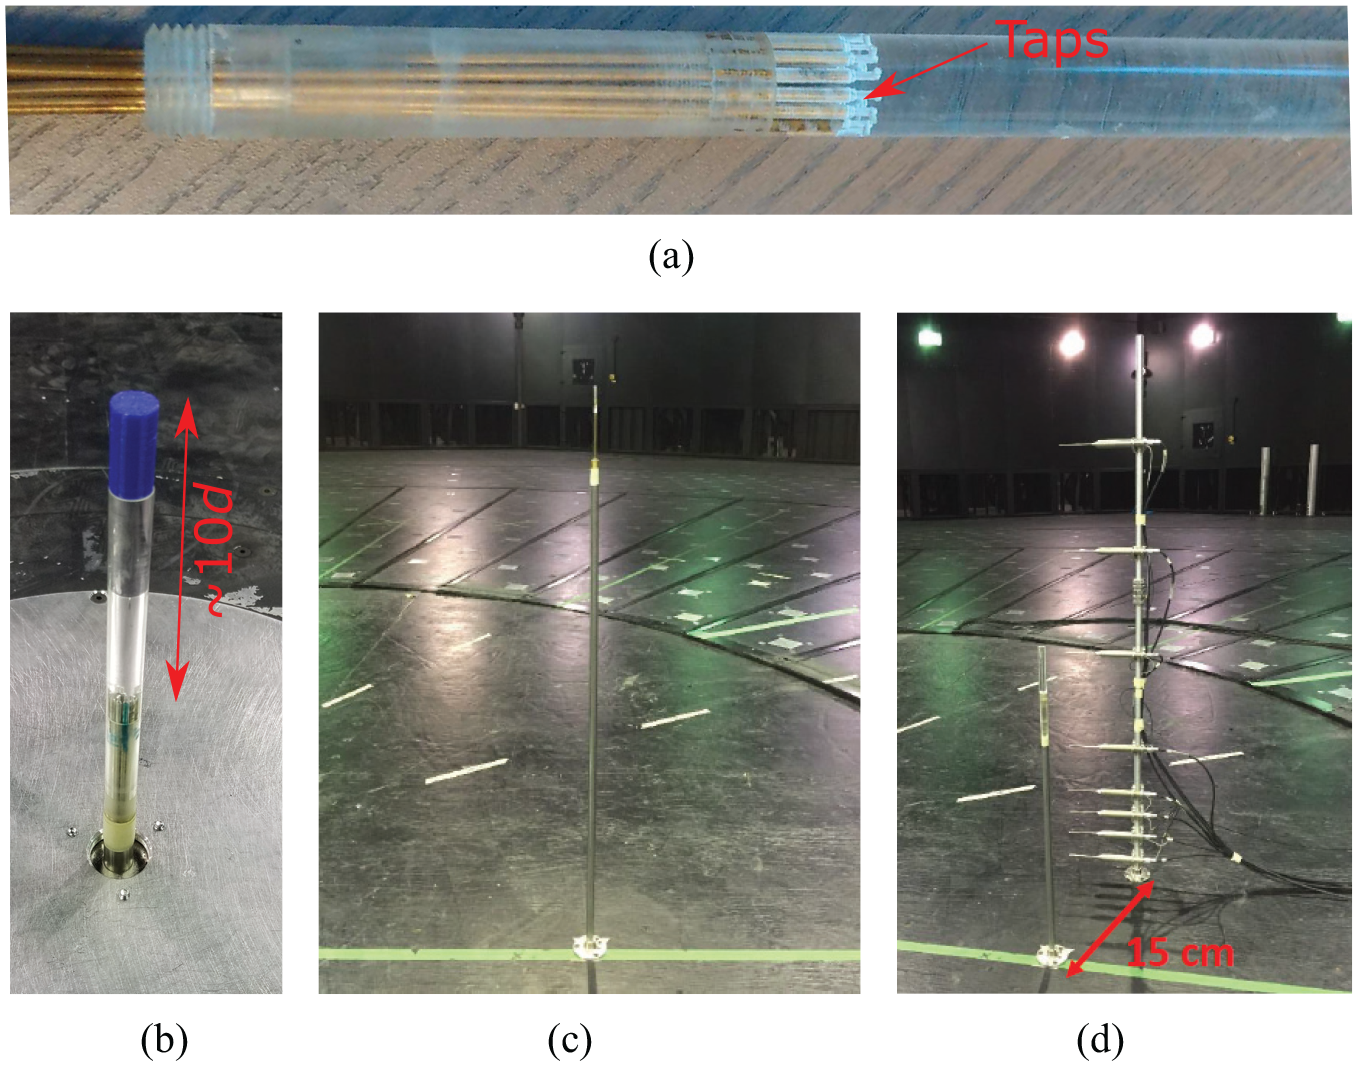
(a) The locations of cylinders in the outflow (black dots). The directions of ABL winds and DB outflow indicated with black arrows and gray triangles, respectively. (b) Spatial distribution of pressure taps and the direction of positive lift and drag forces to the incoming flow. The tributary length (
The pressure measurement system used the Electronically Scanned Pressure (ESP) scanners and Digital Temperature Compensation (DTC) Initium to record differential pressure at each of 12 pressure taps. The pressure scanners are electronic pressure units that measure differential pressures with an array of silicon piezoresistive pressure sensors. All 12 pressure taps were connected to a single 32-port scanner that can accommodate tubes with an outer diameter of 1 mm. The pressure range for the scanners was ±4 inches of water (equivalent to ±1 kPa). Proper and periodic on-line calibration of the system maintained static errors within ±0.03%. The DTC Initium is a pressure data acquisition system that was connected to the scanner via an Ethernet-based connection. The accuracy of the DTC Initium is ±0.05% over the entire operating temperature range (0°C–70°C). The mean air temperature during the tests was 21.2°C.
The velocity measurements were performed using four-hole Cobra probes. The position of eight Cobra probes on the vertical rack is shown in Figure 2(d), and their
Methodology
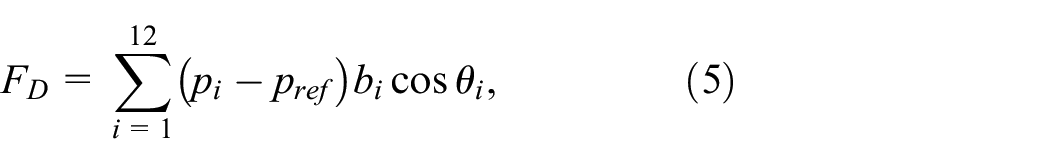
The drag (
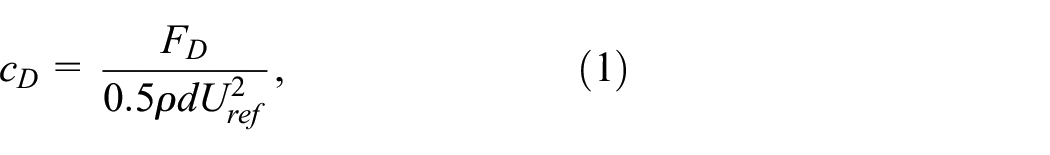
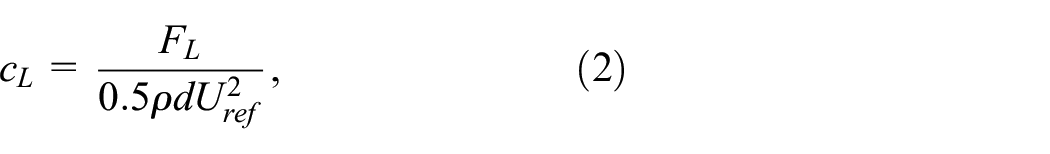
where
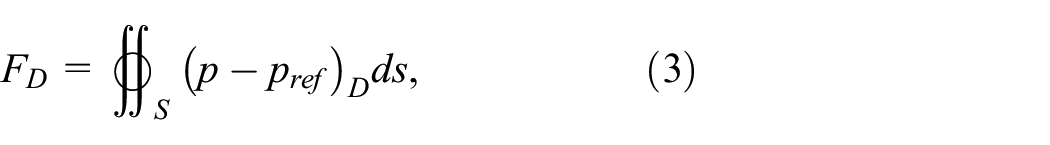
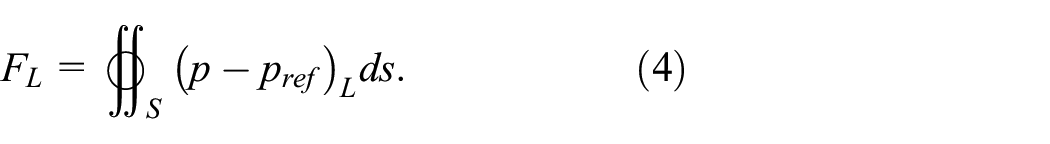
Here,

where
The reference pressure,
The reference velocities (
where
Results
Flow field
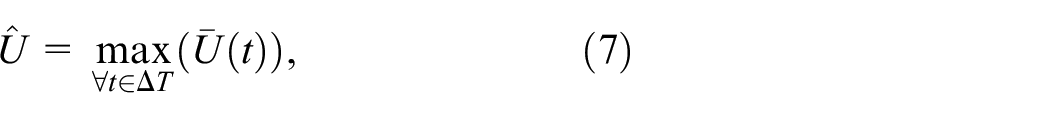
The transient nature of the DB and DBABL outflows at the radial distance
(a–c) Time histories of the ensemble mean velocities from multiple experiment repetitions at the height of
The differences between the enveloped peak velocities in DB and DBABL outflows increase with the height (Figure 4(d)–(f)). The nose-shape curvature in the DBABL outflow is less pronounced than in the DB outflow. This result is in accordance with the numerical simulations in Mason et al. (2010) that demonstrate that the ABL wind tends to amplify the upper regions of the DBABL winds in this part of the outflow. Romanic and Hangan (2020) recently confirmed these findings experimentally. As stated earlier, the flow interaction is highly dependent on the investigated position in the flow field. Both DB-like cases profoundly differ from the logarithmic-like ABL wind profile.
The vertical profiles of radial wind speed extracted at the moment when the velocity peak is observed at the height
Drag and lift coefficients
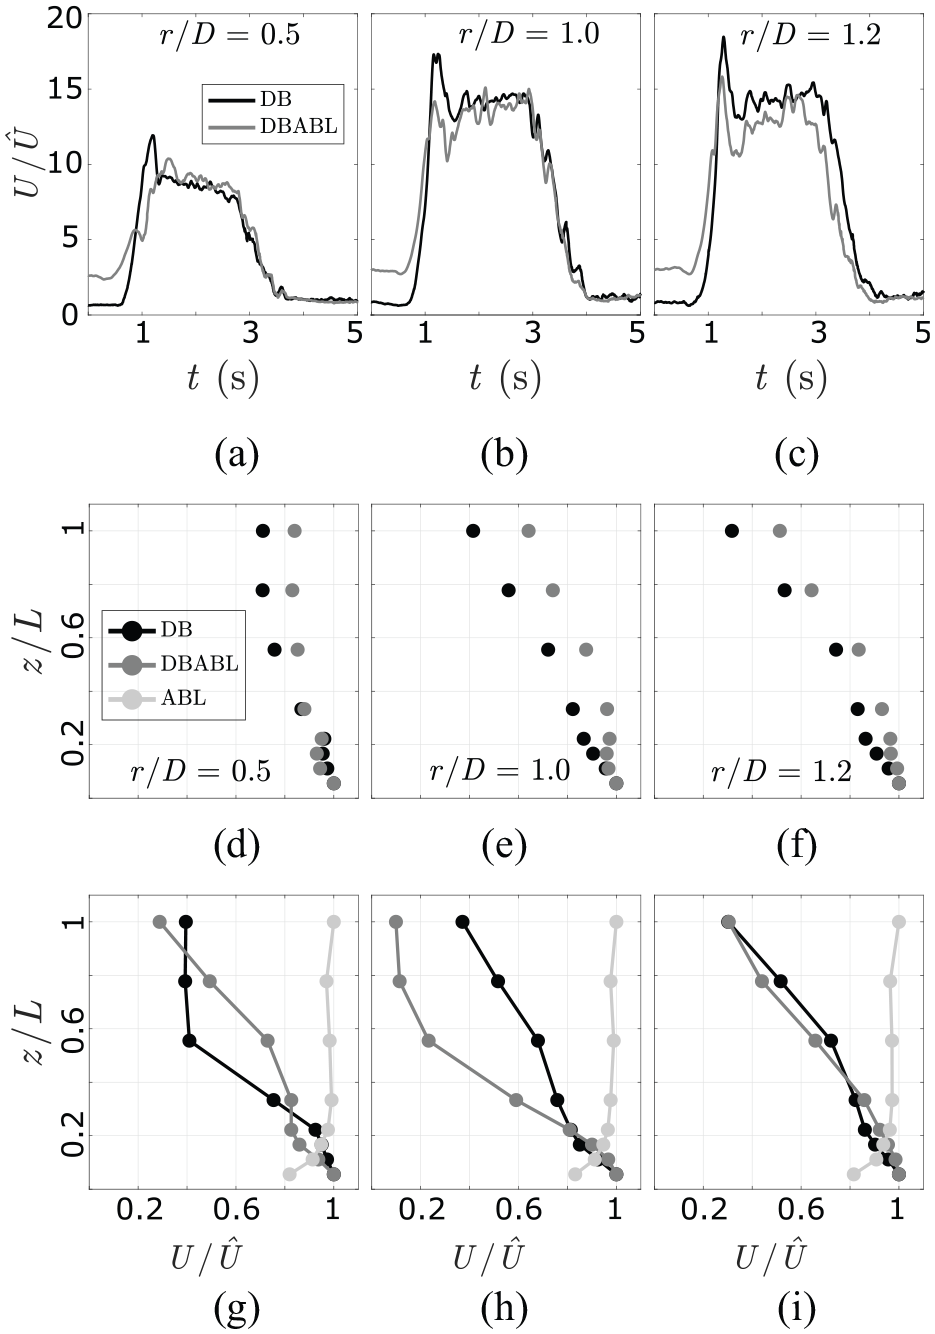
Overall, the ABL winds cause higher drag coefficients (
Drag coefficient (
The
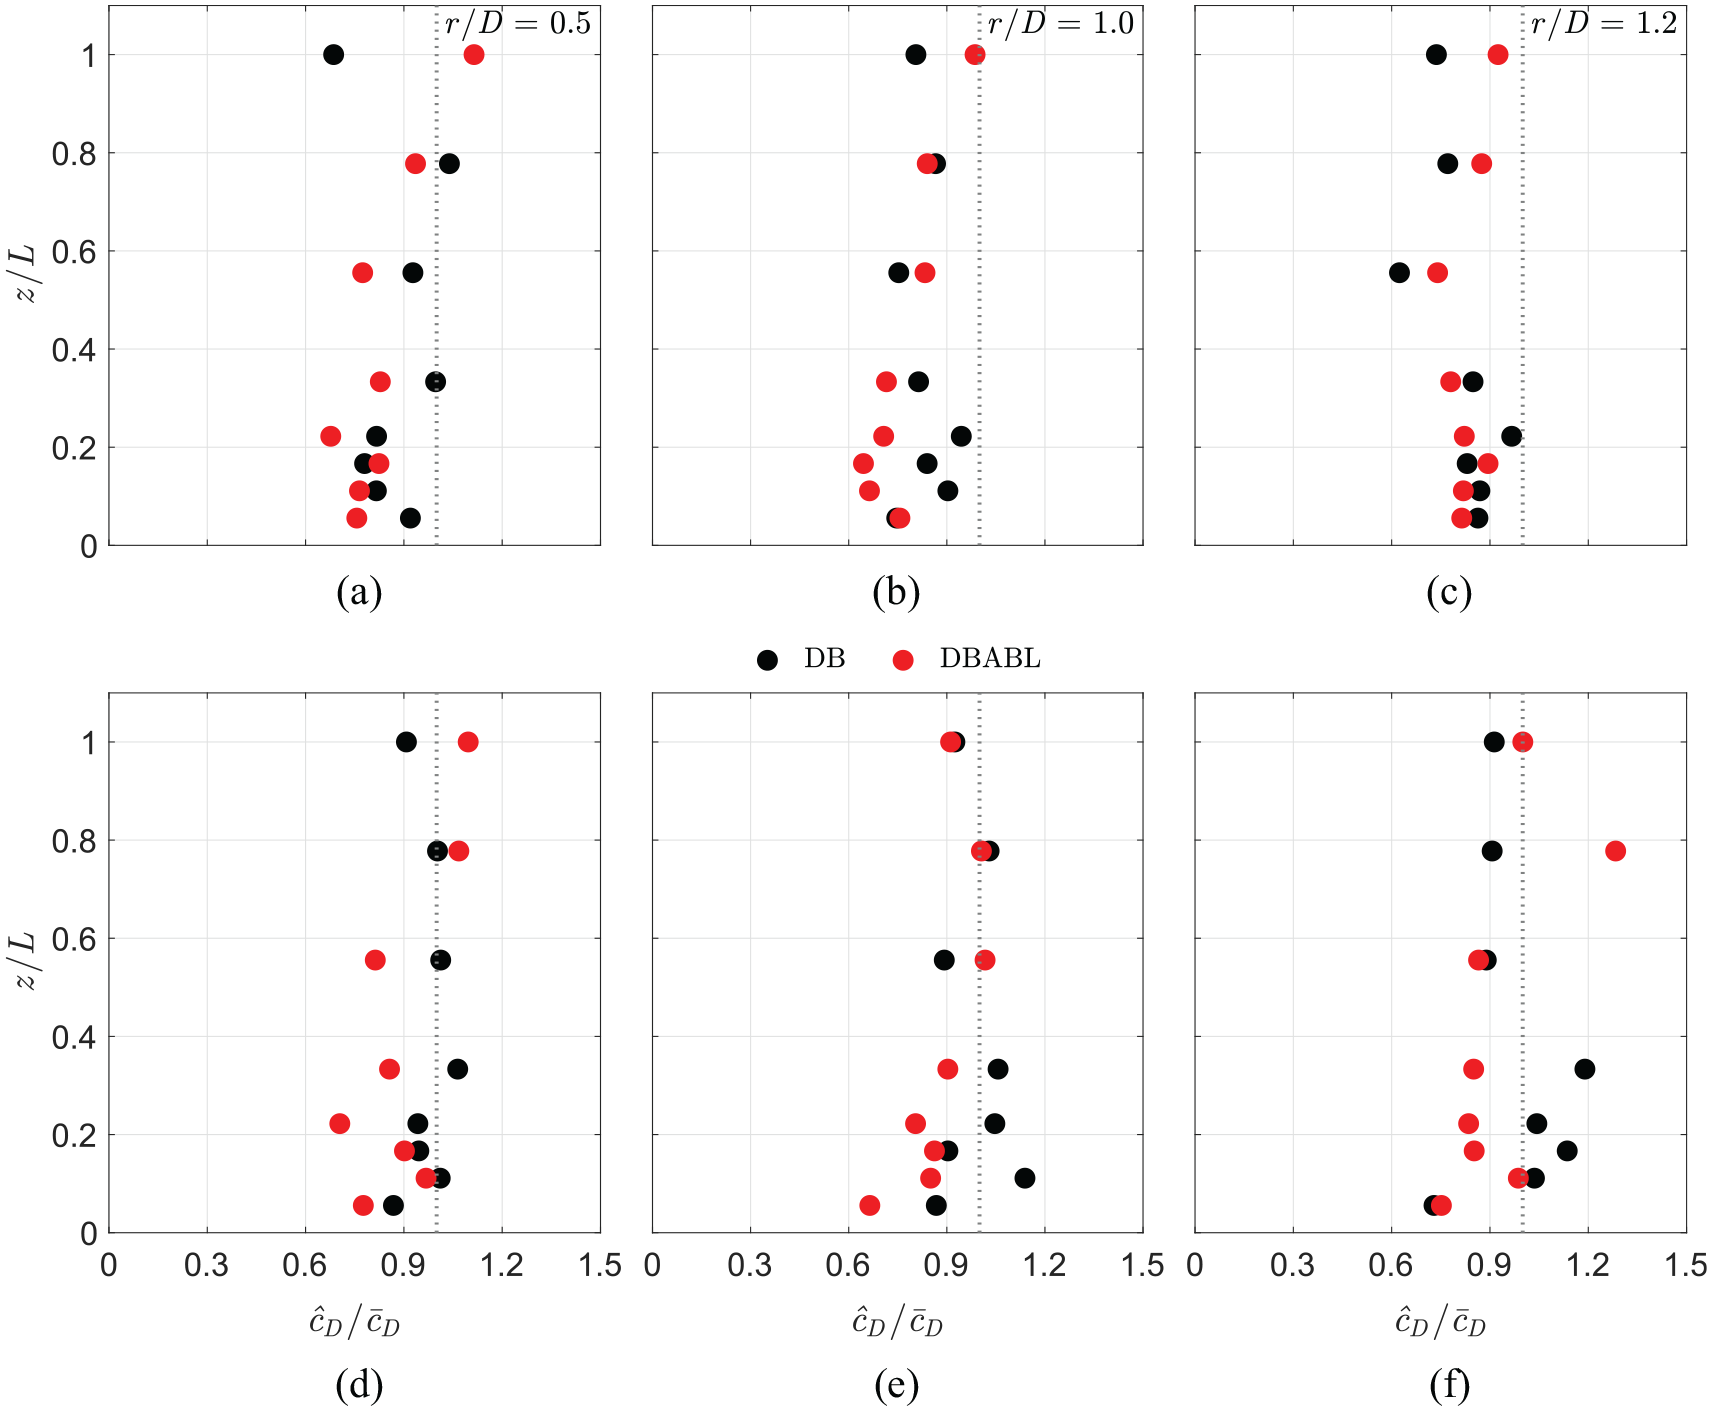
Drag coefficient (
The mean lift coefficient (
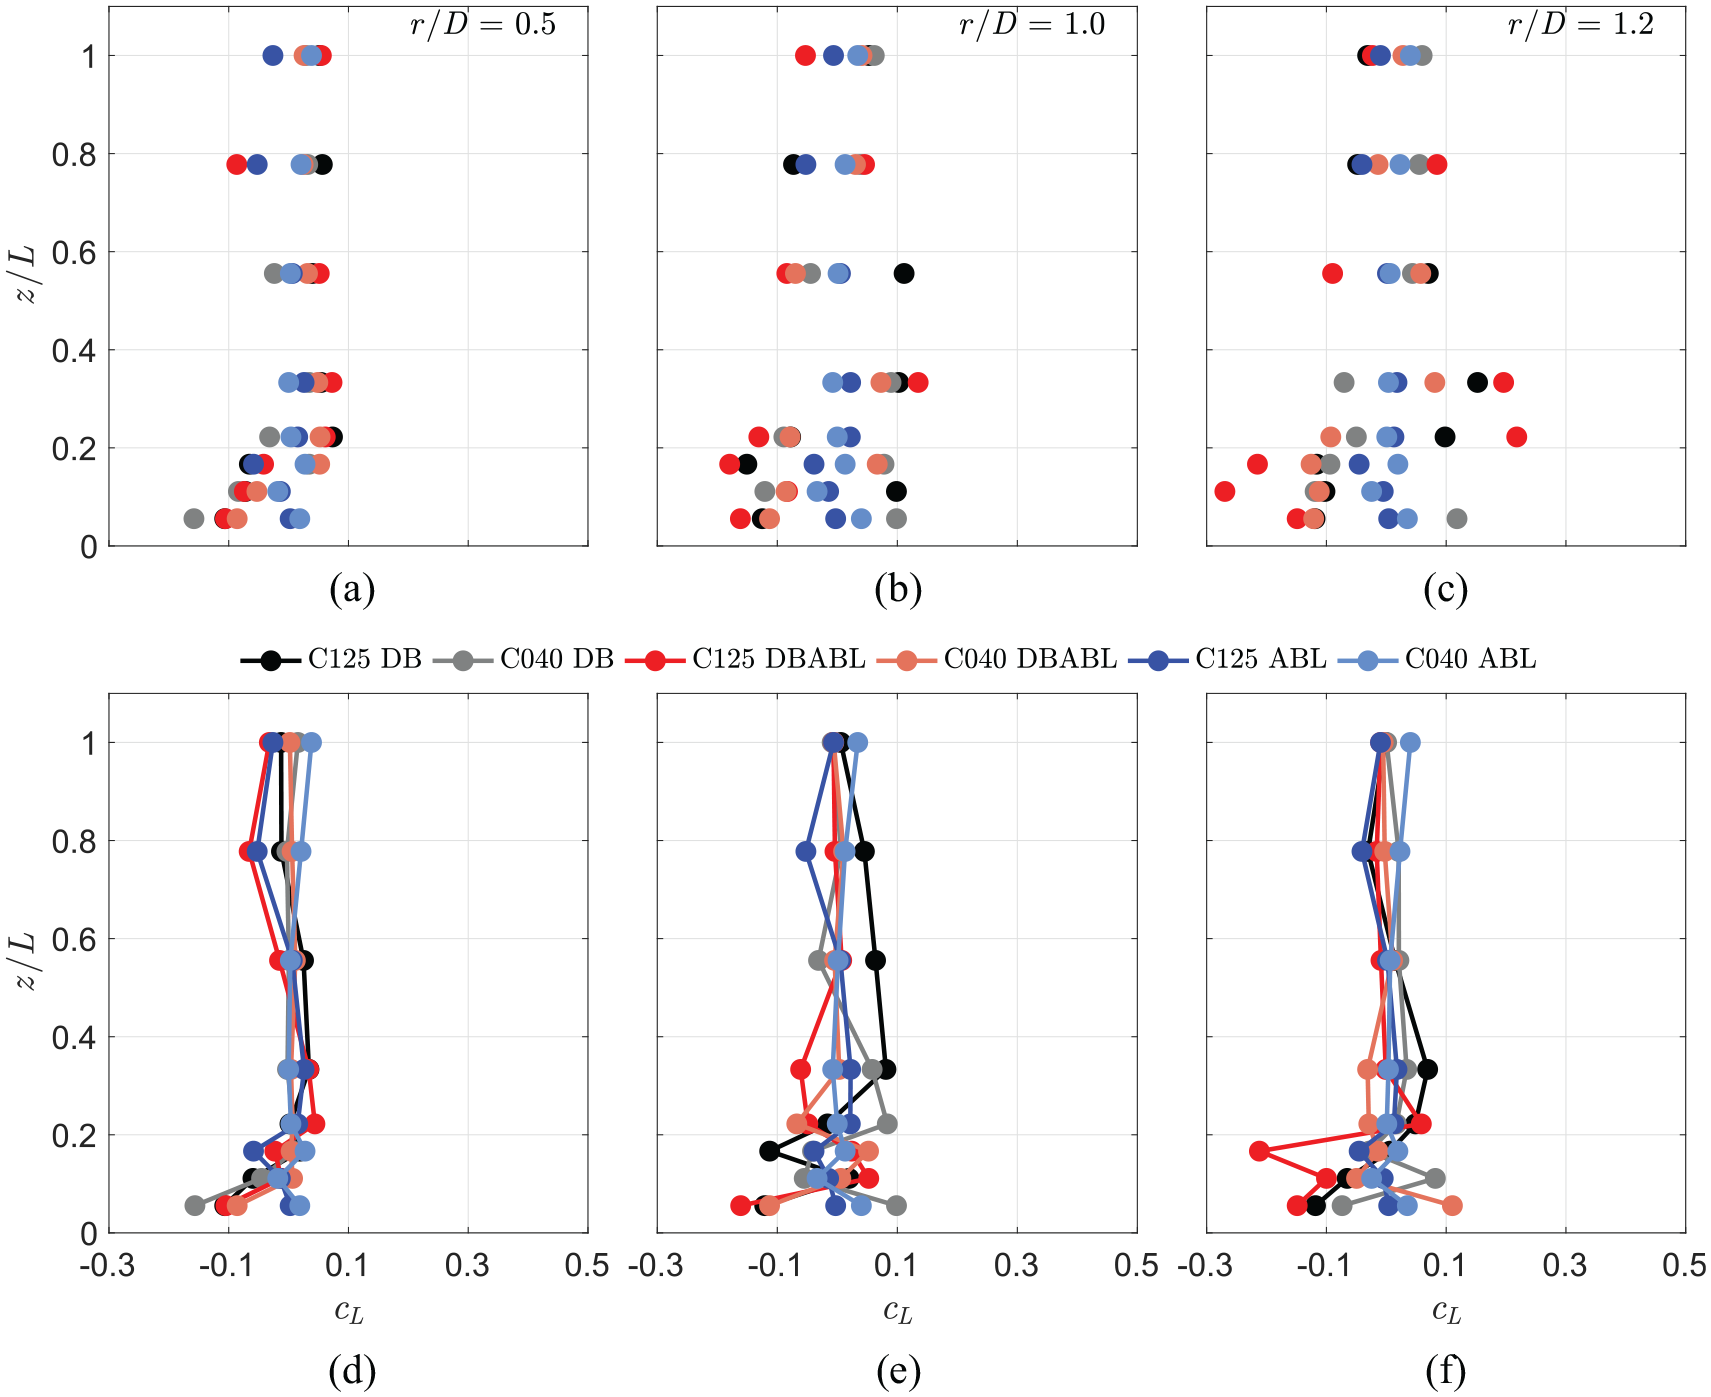
The top row (a-c) shows the peak lift coefficint (cL) at each height (i.e. the enveloped peak of cL), while the bottom row (d-f) shows the vertical profile of cL at the instant of peak cL occurring at z/L = 0.056. The vertical profile of mean cL in the stationary ABL wind is also shown. Cylinders location: (a,d) r/D = 0.5; (b,e) r/D = 1.0; and (c,f) r/D = 1.2.
The
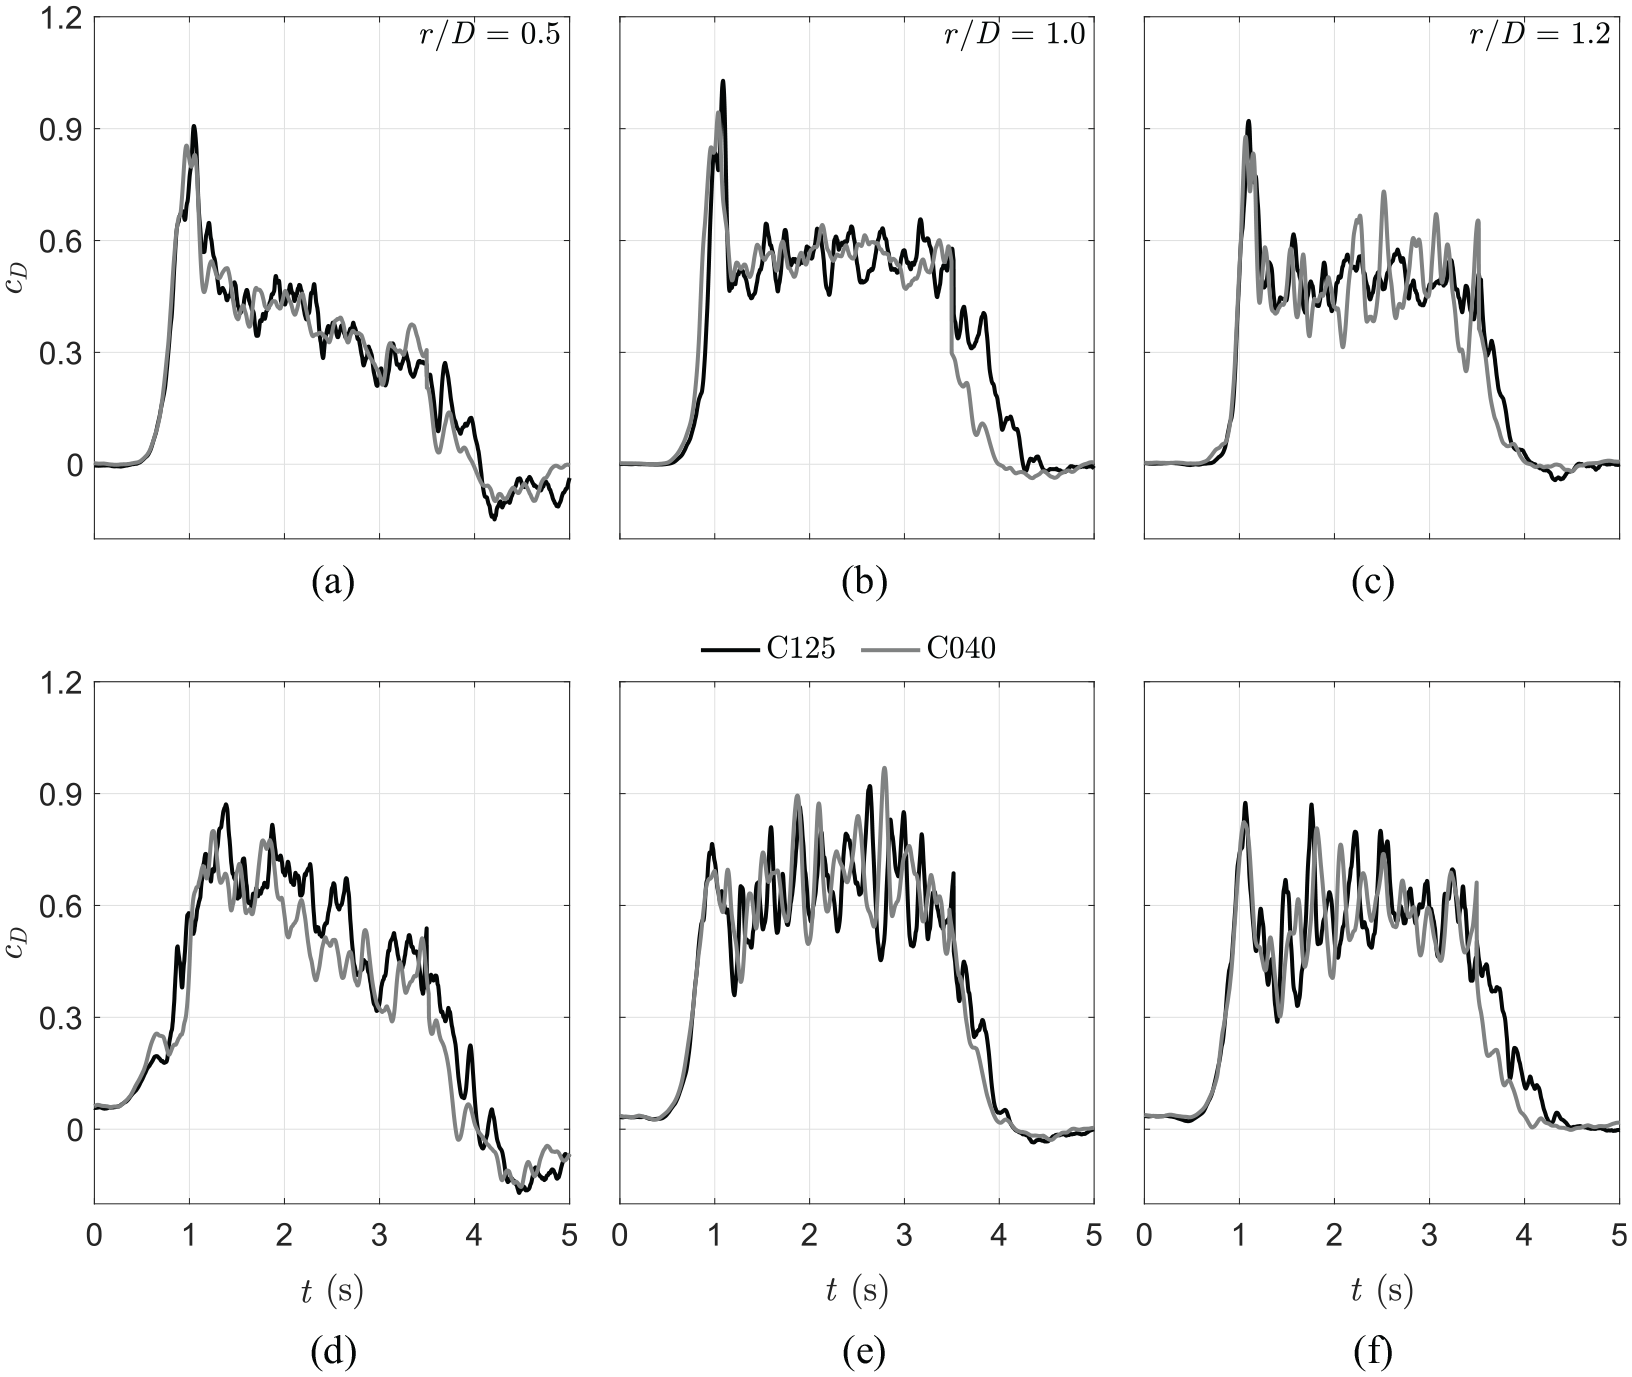
Time histories of drag coefficient (
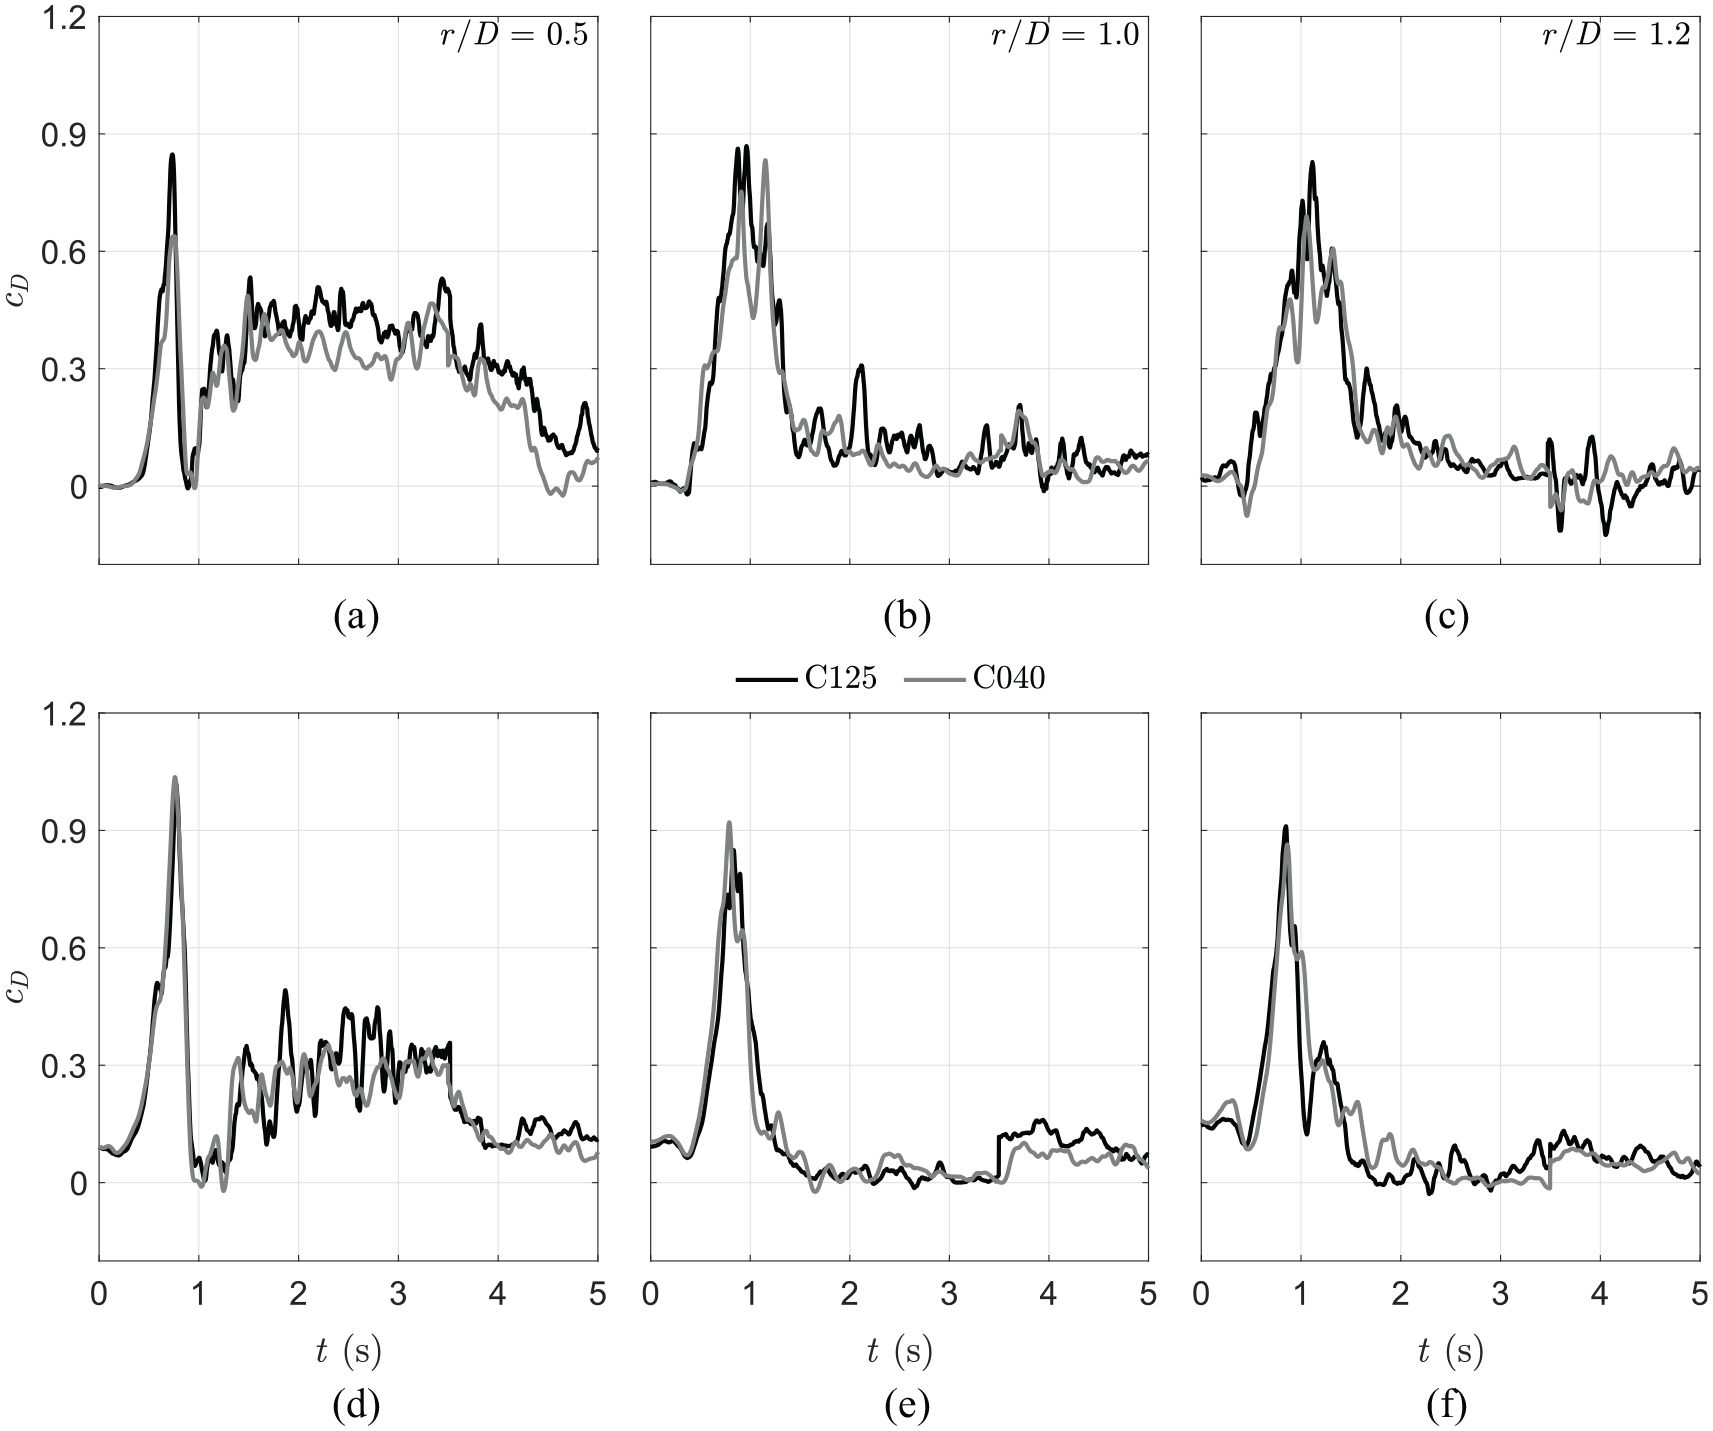
Time histories of drag coefficient (cD) at the height z/L=1 in the DB (a-c) and DBABL (d-f). The black and gray lines correspond to the C125 and C040 cylinders, respectively. Cylinders location: (a,d) r/D = 0.5; (b,e) r/D = 1.0; and (c,f) r/D = 1.2.
Overall, the
Surface pressures
The strong suction in the leeward side (tap #7) of both cylinders (Figures 10 and 11) is aerodynamically caused by the wake region behind the cylinders. While the surface pressures for the windward and leeward taps at
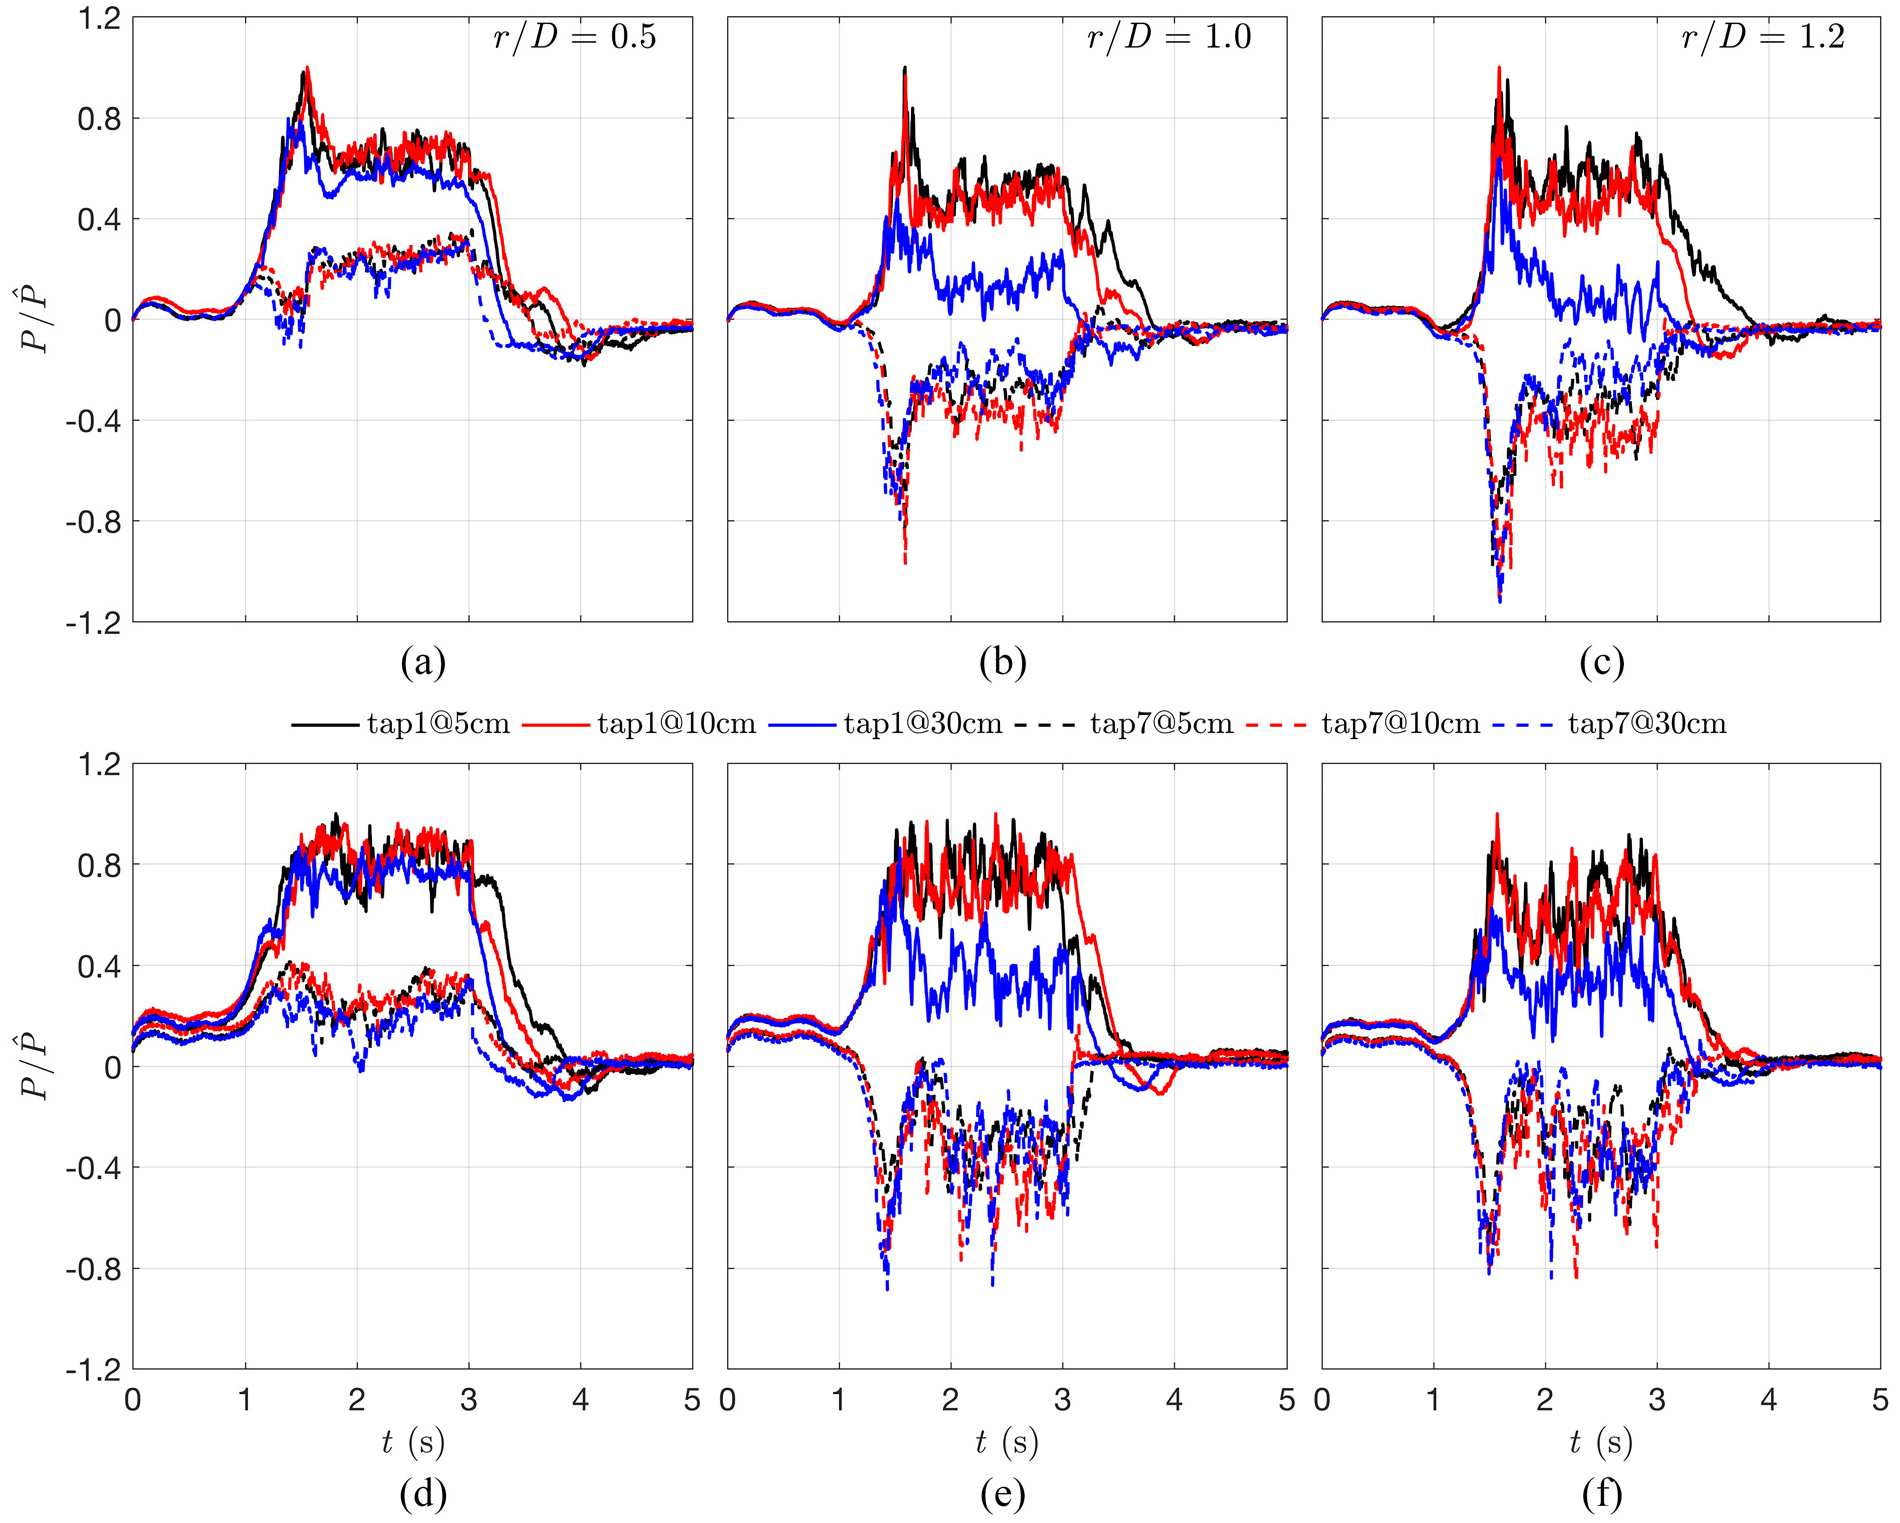
Time histories of normalized surface pressures at tap #1 (windward tap on the cylinders) and tap #7 (leeward tap on the cylinders) on the C125 cylinder. The top row (a-c) is for the DB outflow and the bottom row (d-f) for DBABL outflow. Cylinders location: (a, d) r/D = 0.5; (b, e) r/D = 1.0; and (c, f) r/D = 1.2.
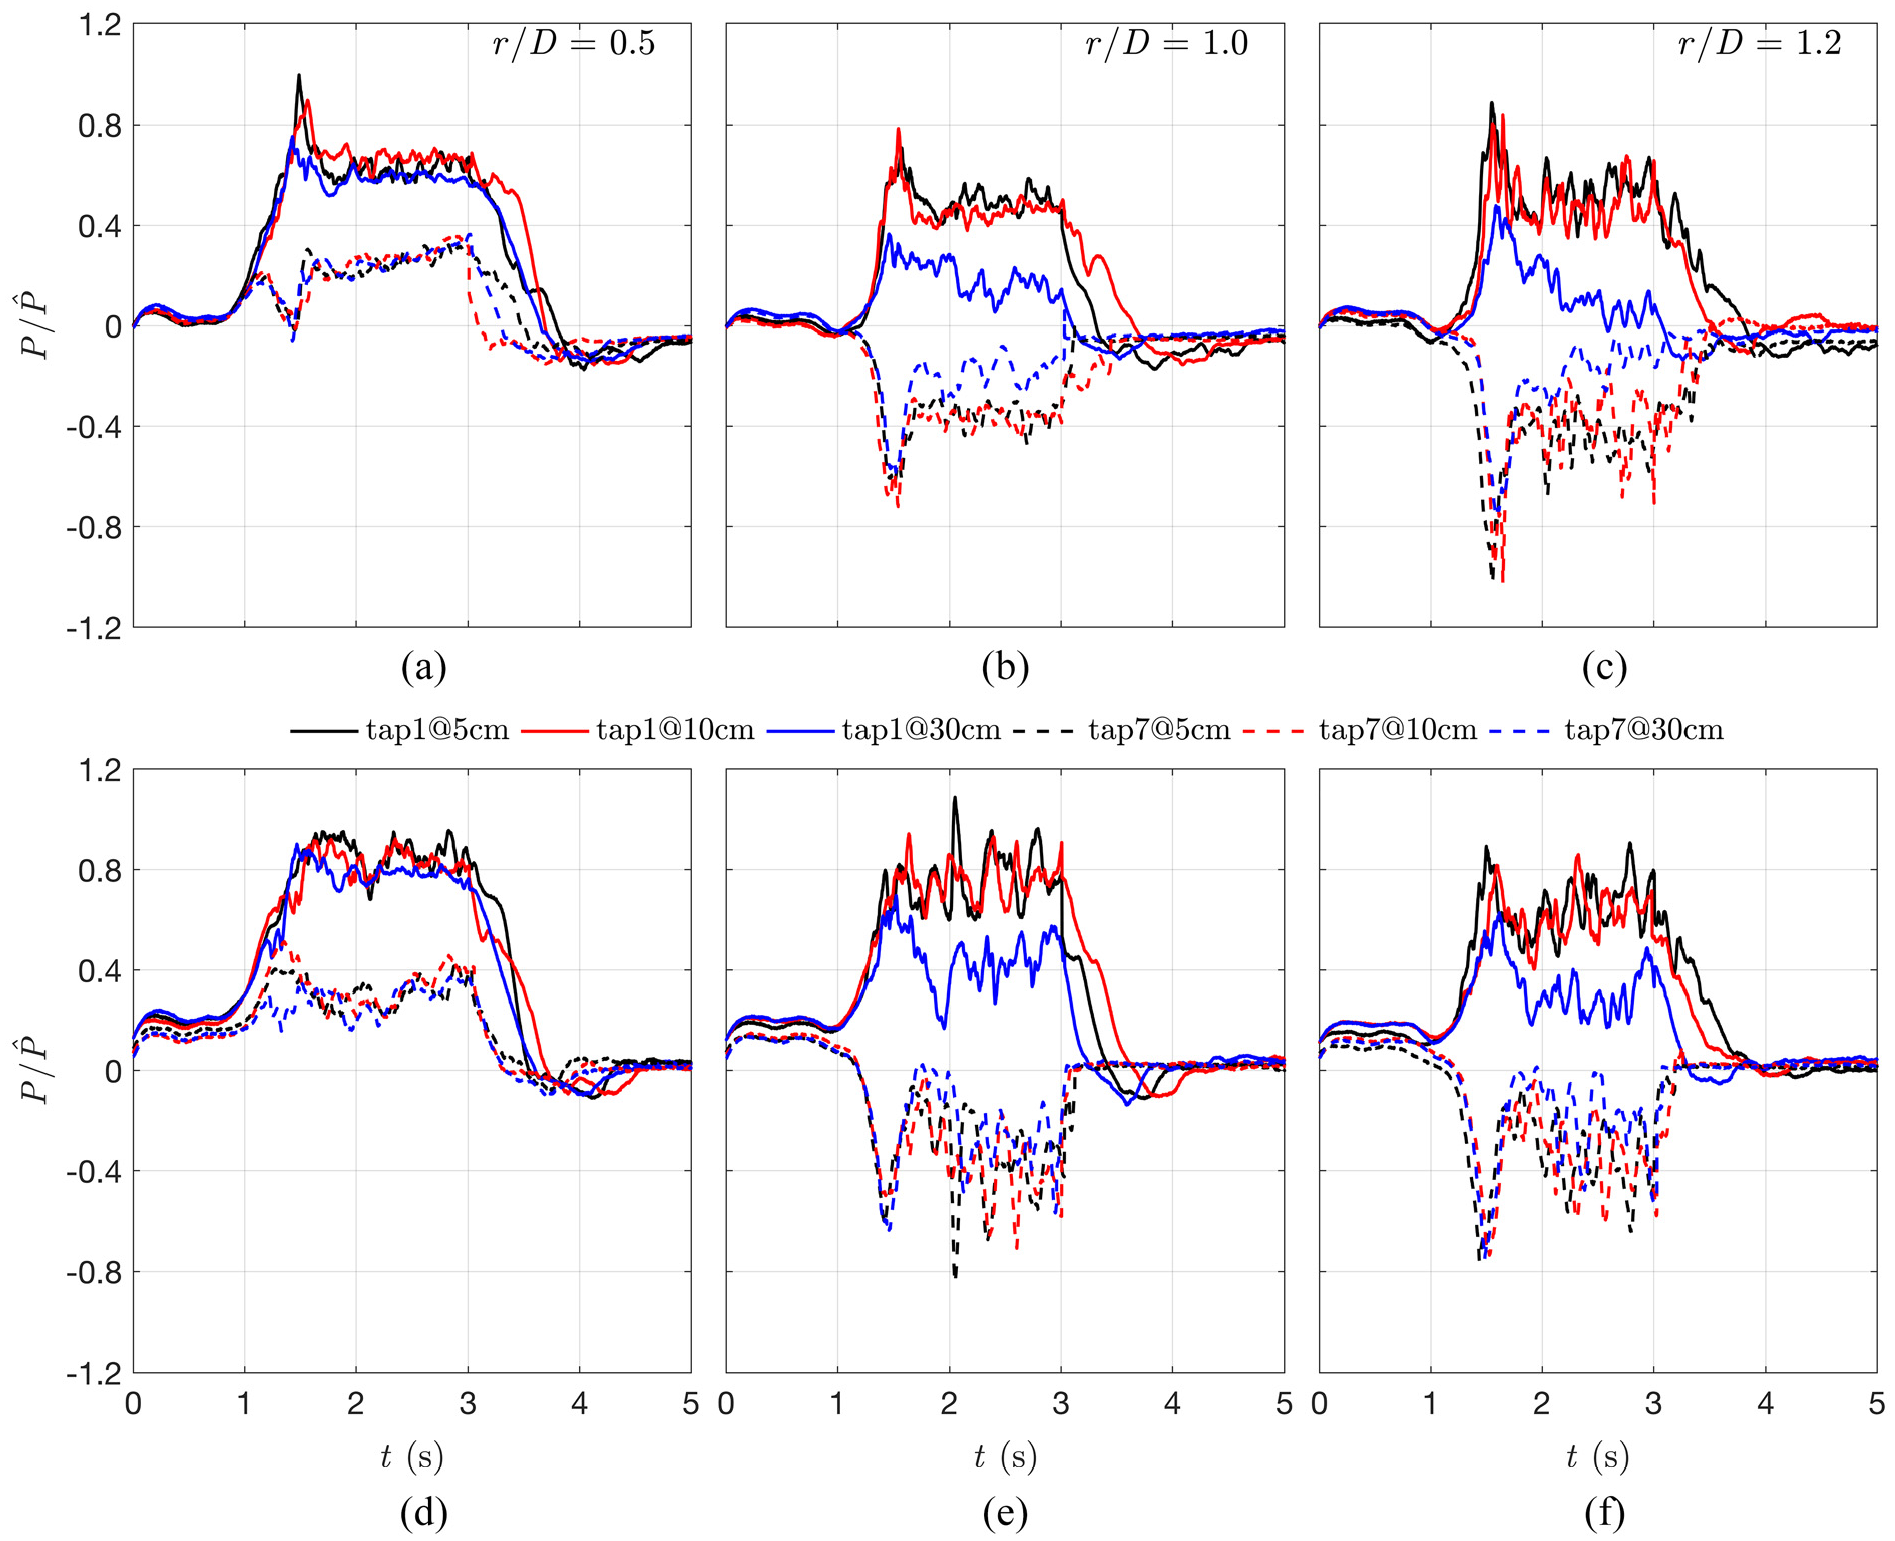
Time histories of normalized surface pressures at tap #1 (windward tap on the cylinders) and tap #7 (leeward tap on the cylinders) on the C040 cylinder. The top row (a-c) is for the DB outflow and the bottom row (d-f) for DBABL outflow. Cylinders location: (a,d) r/D = 0.5; (b,e) r/D = 1.0; and (c,f) r/D = 1.2.
We further notice that the surface pressures in the leeward side of the cylinders are slightly positive even during the ABL wind segment of the velocity record. This observation is caused by the “atypical” choice of reference pressure in the downburst outflows (section “Experiments setup and methodology”). This issue of proposing the proper location of the reference pressure measurements in DB-like outflows is still under investigation, and more discussion on this topic is included in section “Discussion of results and prospects for future research” (also see Jubayer et al., 2019). However, the primary significance of the pressure results presented herein is in their relative differences between different cases (DB versus DBABL) and not in the absolute values of the surface pressures obtained in any given experiment. For instance, the surface pressures at tap #7 are always lower than at tap #1 in the ABL portion of the DBABL velocity records (Figures 10 and 11).
The pressure distribution at
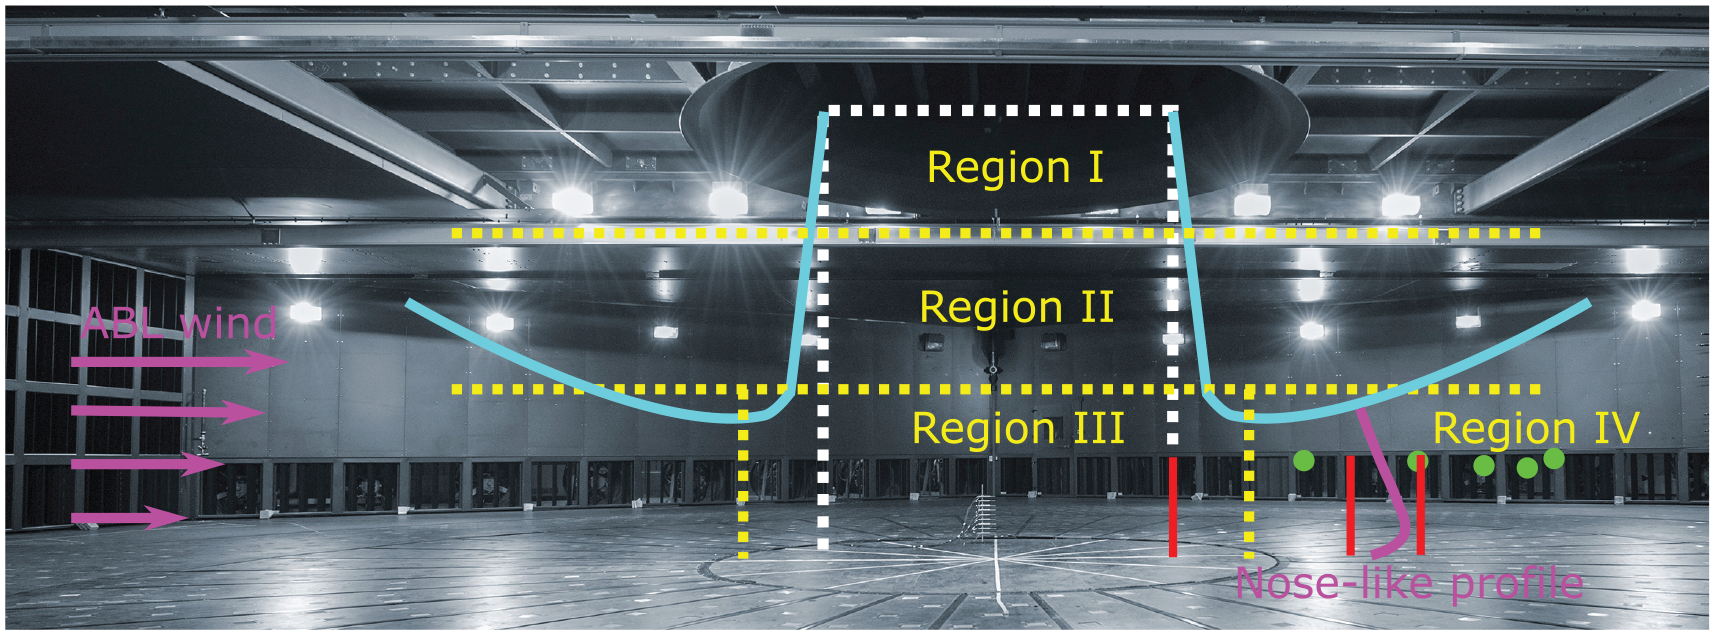
Schematics of cylinders’ location (red sticks) in different outflow regions (yellow lines) of an impinging jet (cyan line): potential core region (I), free-jet region (II), stagnation region (III), and wall jet region (IV). The shape of the ABL wind profile and the nose-like profile of DB-like outflows in the wall jet region (IV) also shown (magenta lines). The dotted white line shows the initial diameter of the downdraft at the bell mouth. The green circles show the height of the primary vortex center in the analyzed DB outflow from the PIV measurements of Junayed et al. (2019).
Figure 12 schematically demonstrates that all sides of the cylinders are similarly impacted by the downdraft at
Discussion of results and prospects for future research
First, we comment on the free end and aspect ratio (
Secondly, the choice of the proper reference pressure and velocity in transient flows, such as downbursts and tornadoes, is still an open question in wind engineering society. The absence of a unified theoretical framework for referencing these flows results in different experimental procedures of replicating transient wind loading from one wind simulator to another, as well as from one type of DB-like outflows to another. Here, we used the peak velocity in the slowly varying velocity record at the height of pressure taps as the proper reference velocity in both DB and DBABL outflows. In principle, the reference velocity height could either be the characteristic height of the structure or the height of the maximum streamwise velocity in the outflow (Figure 12). The proper choice of reference pressure is also a nontrivial task. Two-dimensionality of the undisturbed ABL winds and the independence of static pressure in the streamwise direction of developed ABL flow simplifies the choice of reference pressure in the standard engineering practice of testing structures to ABL winds. However, because DB-like outflows are naturally developing in all three spatial dimensions as well as time, this spatiotemporal transiency makes it rather difficult to pinpoint the representative location for reference pressure measurements in the DB-like outflows. This study measured the reference pressure at a location above the vortex height but inside the testing chamber. This choice of reference pressure, however, altered the values of ABL wind pressures from the values expected in the straight ABL winds (Figures 10 and 11). This discrepancy between the proper referencing for ABL and DB-like winds only demonstrates that more research is needed on relating physical simulations of downbursts to real events. For these reasons, we emphasized in section “Results” that the primary significance of the presented pressure results is in the relative comparisons between DB, DBABL, and ABL cases, and not necessarily in the absolute values of pressures.
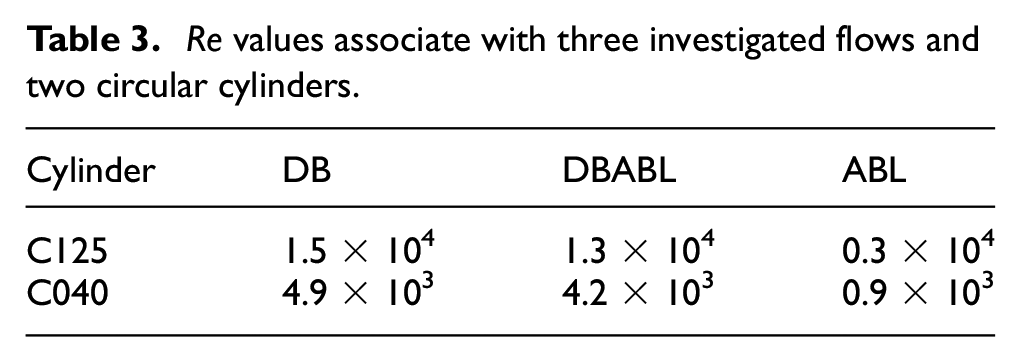
This research focuses on circular cylinders in which cases the flow features are highly susceptible to the value of Reynolds number (
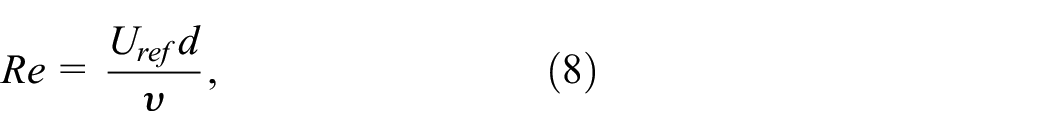
where
Peak velocities and their height at three radial locations in the two DB-like outflows.
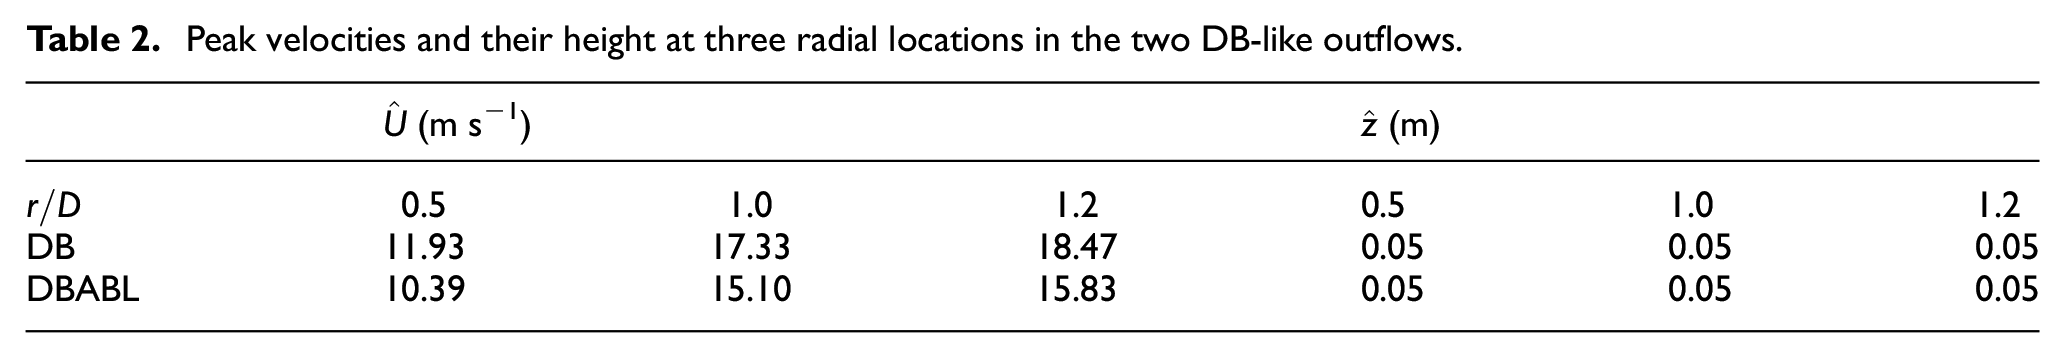
The resulting values of
At a ∼1:200 mean geometric scale of the WindEEE Dome downbursts (Romanic et al., 2020), the diameters of C040 and C125 cylinders correspond to full-scale structures with the diameter of 0.8 and 2.5 m, respectively. The former diameter is similar to the luminary poles usually installed along the highways, whereas the latter diameter is in the range of wind turbine towers and chimneys. The maximum height of the tested cylinders reached 180 m above ground at the full-scale equivalent.
Lastly, a topic that deserves further research is the coupling between the transient velocity and aerodynamic behavior of structures. Recently, this subject was investigated by Mason and Yuanlung (2019) by analyzing the transient aerodynamics of the CAARC (Commonwealth Advisory Aeronautical Council) building in non-stationary velocity profiles. However, like the present work, the velocity and pressure measurements in their study were also desynchronized. The proper approach to investigate this aerodynamic dependency is through the convolution (*) integral:
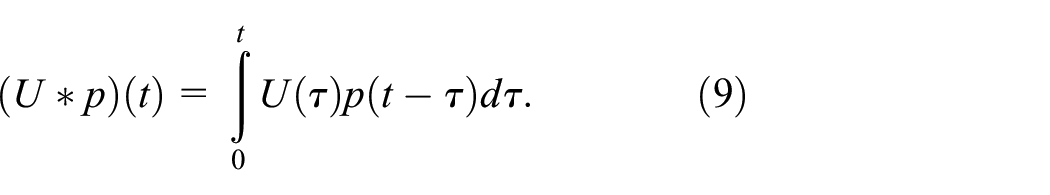
The blending of velocity (
Conclusion
This experimental study analyzed the surface pressures and aerodynamic coefficients on two circular cylinders with free end immersed in three different wind fields. The diameters of these two cylinders were 12.5 mm (C125) and 4 mm (C040). The investigated flow fields were (1) a downburst outflow (DB), (2) a downburst outflow supplemented by atmospheric boundary layer (ABL) winds (DBABL), and (3) the steady ABL wind. The motivation to conduct this research came from the continually increasing wind engineering interest to better quantify the wind effects of non-synoptic winds, such as thunderstorm downbursts, on various structures. Circular cylinders—being the classical bluff body that was most studied in the classical fluid mechanics literature—was, therefore, also the starting point of this research. The study provided the first comparisons between surface pressures and aerodynamic coefficients that resulted from these three different wind systems. The flow fields of experimentally produced DB and DBABL outflows were also examined. The main contributions are summarized below.
The ABL winds caused a higher drag coefficient (
The lift coefficients (
The location of the cylinders in the DB-like outflows is aerodynamically more significant than the diameter of a cylinder. This finding is profoundly different from the case of stationary ABL winds.
While the surface pressures for the windward and leeward taps at
Lastly, the study discussed various prospects for future experimental research in this field, such as the proper choices of pressure and velocity references in downburst outflows, and the velocity-pressure coupling that requires the synchronized measurements of these two quantities. Several uncertainties and underlining experimental assumptions were also critically discussed.
Footnotes
Acknowledgements
The authors thank Mr Hiroaki Shoji for his help with the experiments set up and MATLAB® coding. The authors also thank Prof. Massimiliano Burlando for his help with handling the Open Access publishing of this work. Lastly, the authors thank two anonymous reviewers for their comments that improved the quality of this work.
Declaration of conflicting interests
The author(s) declared no potential conflicts of interest with respect to the research, authorship, and/or publication of this article.
Funding
The author(s) disclosed receipt of the following financial support for the research, authorship, and/or publication of this article: The first, third and fourth authors acknowledge the support of the European Research Council (ERC) under the European Union’s Horizon 2020 research and innovation program (grant agreement no. 741273) for the project THUNDERR – Detection, simulation, modelling and loading of thunderstorm outflows to design wind-safer and costefficient structures – awarded with an Advanced Grant 2016. The second author acknowledges the support of the Italian Ministry of Education, University and Research (MIUR) “Fondo Giovani” grant. The first and last authors acknowledge the support of the Canada Foundation for Innovation (CFI) WindEEE Dome Grant (no. X2281B38).