
Abstract
This study integrates research on intergroup contact and the rejection–identification model to examine how negative and positive contact interact to influence both the health and well-being as well as the group identification (assessed as ingroup affect, ingroup ties, and centrality) of disabled people. We analysed data from a week-long diary study (Study 1; N = 83) and a longitudinal study (Study 2; N = 87) with three waves separated by 1 year. Results showed that positive contact can be associated with a reduction in, or even a cancelling out of, the association between negative contact and lower well-being and ingroup affect (buffering effect). We also found that negative contact was associated with higher ingroup ties only among those with higher levels of positive contact (facilitation effect). Results reveal the potential of positive contact to reduce the adverse effects of negative contact on disadvantaged group members’ outcomes, and its potential to facilitate nonharmful effects.
Extensive research has shown that perceived group-based discrimination has harmful effects on the well-being of disadvantaged group members (Pascoe & Smart-Richman, 2009; Schmitt et al., 2014), while social identification can protect the well-being of disadvantaged groups facing discrimination (Jetten et al., 2017). Theoretically, the evidence provides support for an explanation of these effects in terms of the rejection–identification model (Branscombe et al., 1999), which proposes that (a) perceived discrimination has negative effects on well-being, but (b) perceived discrimination can increase ingroup identification, which in turn has positive effects on well-being.
While such research on the negative side of intergroup experiences is of vital importance, it has left unexplored the potential of positive intergroup experiences (i.e., intergroup contact) to attenuate the consequences of negative experiences on health and well-being (Dovidio et al., 2017), with a few exceptions (e.g., cross-group friendships; Bagci et al., 2018a). Only more recently has research investigated the simultaneous effects of both positive and negative intergroup contact on disadvantaged group members to understand, especially, their effects on intentions for collective action (Hayward et al., 2018; Reimer et al., 2017). The present paper proposes a novel integration of research on the rejection–identification model and intergroup contact to examine how positive contact could buffer (1a) the association between negative intergroup contact (rather than group discrimination) and health and well-being as well as (1b) the association between negative intergroup contact and ingroup identification among disabled people. In this paper, we adopt a multidimensional approach to health and well-being, encompassing the physical, mental, and well-being dimensions of health (World Health Organization [WHO], 1948). For readability, we consistently use the term “well-being” throughout this work.
There are several reasons why we chose to focus on disabled people in the present research. Compared to other social groups, disabled people remain overlooked in social psychology (e.g., Olkin & Pledger, 2003), including the effects of negative intergroup experiences on disabled people’s well-being (e.g., Schmitt et al., 2014). However, disability-based discrimination (i.e., ableism) yields a stronger negative association with well-being, when compared to other types of group-based discrimination (Branco et al., 2019; Schmitt et al., 2014). Additionally, disability prejudice seems stronger (Nosek et al., 2007) and more stable over time (Charlesworth & Banaji, 2019), when compared to other types of prejudice. These patterns make even more crucial the potential role of positive intergroup contact in buffering the effects of negative experiences on disabled people’s well-being.
The Association Between Intergroup Contact and Well-Being
According to the rejection–identification model (Branscombe et al., 1999) and previous studies showing a negative association between group discrimination and psychological well-being (Schmitt et al., 2014), we expect that negative intergroup contact will be negatively associated with well-being. Although related, perceived discrimination and negative intergroup contact are conceptually different. Negative intergroup contact refers to direct or indirect interactions between members of different social groups that are characterized by negative emotions, tension, or hostility; perceived discrimination, in contrast, refers to the perception of being a target of prejudice and unfair treatment because of one’s group membership. Although there is less evidence regarding the effects of negative contact among disadvantaged groups, we expect that the effects observed with perceived discrimination will replicate with negative contact, as these concepts have been associated, with negative contact potentially contributing to the perception of discrimination. Previous studies found that, for members of disadvantaged groups, negative, but not positive, contact with advantaged group members was positively associated with perceived group discrimination (Hayward et al., 2018; Reimer et al., 2017). Negative contact, by increasing group membership salience (Paolini et al., 2010), may increase ingroup threats such as discrimination (Wright, 2013) and, consequently, be associated with lowering members’ well-being.
On the contrary, more frequent intergroup contact (valence unspecified) was found to be positively associated with the well-being of both the general population (Ramos et al., 2019) and disadvantaged groups specifically (e.g., refugees; Tip et al., 2019). In addition, cross-group friendships buffered the association between perceived discrimination and lower mental well-being among disabled people (especially for those with lower ingroup identification; Bagci et al., 2018a). Moreover, cross-group friendships with nondisabled people were positively associated with psychological well-being among disabled people, by increasing collective self-esteem (related to empowerment) and positive outgroup attitudes (related to social integration; Bagci et al., 2018b). Despite cross-group friendships (as studied by Bagci et al., 2018a) being a specific form of positive intergroup contact, and one associated with notably positive outcomes, general positive intergroup contact may have similar effects, which would be found more often because it does not rely on the more demanding criterion of establishing a cross-group friendship. In this study, we extend prior work by focusing on contact in general and investigating the interaction of general negative and positive intergroup contact, notably whether positive contact can attenuate and even cancel out the association between negative contact and reduced well-being. Moreover, despite greater research attention being paid to the positive effects of disability identity in the last decade (e.g., Bogart et al., 2018), it is not yet understood how positive intergroup contact may influence the association between negative experiences and disability identity.
The Association Between Intergroup Contact and Group Identification
The rejection–identification model posits that perceived discrimination is positively associated with ingroup identification (Branscombe et al., 1999). Similarly, negative, but not positive, contact with advantaged group members was positively associated, cross-sectionally, with group identification (Hayward et al., 2018; Reimer et al., 2017, Study 1). However, this prior research used a factor of (general) social identification, yet previous work has shown that the relationship between discrimination and social identification may vary depending on the type of dimension of social identification analysed (e.g., Ramos et al., 2012). We thus adopt a multidimensional perspective on social identification to explore this possibility, focusing on the dimensions of ingroup affect (i.e., an emotional evaluation of group membership), ingroup ties (i.e., the psychological ties that bind the self to the group), and centrality (i.e., the extent to which group membership is important to one’s self-concept; Cameron, 2004).
Adopting this multidimensional perspective on social identification, a longitudinal study by Ramos et al. (2012) found that perceived discrimination was positively associated with subsequent ingroup centrality, but not with either ingroup affect or ingroup ties. These authors also found that perceived discrimination was associated with lower ingroup affect within the same wave (i.e., correlation intrawave). This was in accordance with previous studies showing that perceived discrimination was negatively associated with ingroup affect (Crabtree et al., 2010; Eccleston & Major, 2006; McCoy & Major, 2003) and positively associated with centrality (Eccleston & Major, 2006). However, a longitudinal study by Reimer et al. (2017, Study 2) did not confirm the association between either group discrimination or negative contact and centrality. Despite expecting an association between perceived discrimination, or negative contact, and stronger ingroup ties, longitudinal research did not support the association between either perceived discrimination or negative contact and ingroup ties (Ramos et al., 2012; Reimer et al., 2017, Study 2). Based on these findings, despite negative contact being positively associated with ingroup identification (Reimer et al., 2017, Study 1), from a multidimensional perspective, we expect that negative contact will be positively associated with centrality and ingroup ties but could be negatively associated with ingroup affect (see Ramos et al., 2012).
Additionally, cross-group friendships have been negatively associated with ingroup identification (Dixon et al., 2010), whereas positive contact was not associated with group identification (Reimer et al., 2017). Negative contact is associated with the salience of group membership; however, positive contact can buffer this association (Árnadóttir et al., 2018; Paolini et al., 2014).
The Present Research
This research investigates how the interaction between negative and positive intergroup contact is associated with the well-being and group identification of disabled people (see Figure 1), differentiating between the three dimensions of group identification (i.e., ingroup affect, ingroup ties, and centrality). Recent approaches to the study of valenced contact (Árnadóttir et al., 2018; Schäfer et al., 2021) have proposed that it should be studied in terms of the interaction between the two distinct forms of valenced contact, positive and negative, instead of studying the effects of the two forms of contact separately. Previous research has shown that positive contact decreases the association between negative contact and outgroup orientations (Árnadóttir et al., 2018). Therefore, we expect a similar interaction effect in this study, such that positive intergroup contact buffer the association between negative contact and lower well-being among disabled people. Additionally, we expect that positive contact will decrease the association between negative contact and group identification (on all three dimensions). In turn, following the rejection identification model (Branscombe et al., 1999), the mediation path between negative contact, higher ingroup ties/centrality, and, in turn, higher well-being, should be diminished, or cancelled out, at higher levels of positive contact. Hence, we tested three hypotheses:
Hypothesis 1a: The association between negative intergroup contact and lower well-being will be diminished under higher (vs. lower) levels of positive contact.
Hypothesis 1b: The association between negative intergroup contact and ingroup identification (lower ingroup affect/higher ingroup ties/higher centrality) will be diminished under higher (vs. lower) levels of positive contact.
Hypothesis 1c: The association between negative intergroup contact and lower well-being, via ingroup affect, will be diminished under higher (vs. lower) levels of positive contact. The association between negative intergroup contact and higher well-being, via ingroup ties or centrality, will be diminished under higher (vs. lower) levels of positive contact.
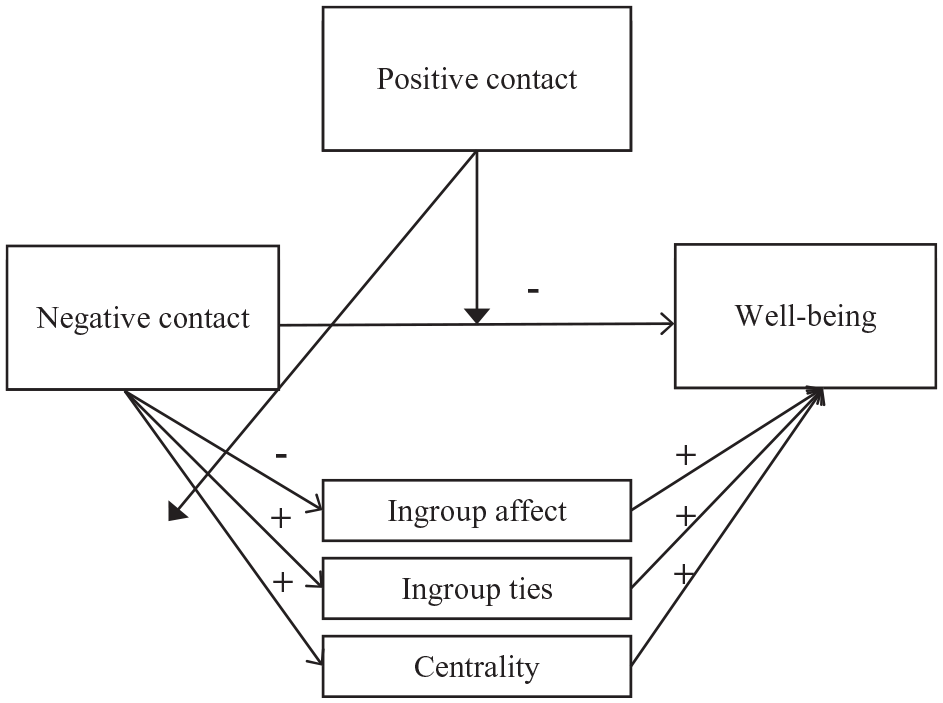
Proposed model.
We collected data using a week-long diary study (Study 1) and a longitudinal study (Study 2) with three waves separated by a 1-year gap. While a diary study allows us to understand the immediate or short-term variations in contact at the individual level, the longitudinal study with a 1-year gap between waves allows us to examine the longer term relationships between variables over time. The rationale for capturing people’s experiences from both a short-term (diary) and a long-term (longitudinal survey) perspective was that this could enhance our understanding of the significance of time within these processes and complement evidence adduced from previous longitudinal, and mostly cross-sectional, studies. This becomes particularly crucial when disparate results emerge between cross-sectional and longitudinal studies, such as in the association between perceived discrimination or negative contact and ingroup identification. Notably, previous longitudinal studies typically consisted of two waves, whereas Study 2 (below) encompasses three waves (the minimum required to disentangle the direction of the relationships between the variables; Hoffman, 2015; Ployhart & Vandenberg, 2010). Moreover, in longitudinal studies, the estimation of auto-regressive and regressive paths can provide additional insights into the likely direction of relationships.
Study 1
Participants and procedure
Participants were 83 disabled people in Portugal, who participated in an online diary study up to seven times a week (seven times: 35 respondents; six times: eight respondents; five times: six respondents; four times: seven respondents; three times: six respondents; twice: 10 respondents; once: 11 respondents), yielding a total of 400 observations. The main results in our analysis below are replicated when excluding participants who responded on only 1 or 2 days. As the multilevel analysis used is robust in cases where there are few observations per cluster, and we had a small sample, we chose to retain all participants in the analysis.
This sample included 47 females (56.6%) and 36 males (43.4%); the majority were single (69.9%), with ages ranging from 21 to 65 years (Mage = 40.1, SDage = 10.81). Participants had mostly university (57.8%) or higher (20.5%) education, and were employed (42.2%) or were pensioners or retirees (23.8%). A large majority of participants reported that they had a physical impairment (92.8%). Most reported they had a visible (89.2%) and acquired (66.3%) impairment. A small number of participants also reported hearing (two), visual (three), intellectual (three), and developmental/learning (two) impairments. Par-ticipants reported that they were mostly hampered “a lot” (50.6%) or “to some extent” (33.7%) in their daily living activities due to impairment.
Participants were recruited through social networks and organizations in the field of disability; 115 people signed up to participate in the study, from whom, 72.2% participated in the study from 1 to 7 days. Participants received €5 if they completed the questionnaires for a total of 5 days, or €10 if they completed all 7 days.
Data were collected through Qualtrics. In the first step, we asked participants if they were willing to take part in a 1-week/7-day diary study and provided information about the specific dates of the study (i.e., week of data collection). Participants read the informed consent with information about the purpose of the study, approximate duration, confidentiality/anonymity, and right to withdraw at any time. If they agreed, participants completed a sociodemographic questionnaire, after which, they were asked for their contact details so that they could receive an email with the survey link at the beginning of the study. On each day of the study, participants received an email in the afternoon to remind them to fill out the questionnaire for that day.
Measures
Positive and negative intergroup contact
Participants reported their experiences of positive and negative contact with nondisabled people, excluding their family members, on each day of the study. A single item measured the frequency of each type of contact: “Today, how often did you have negative/positive contact with nondisabled people?” to which participants responded from 0 to more than 20 times.
Group identification
We adopted the Multidimensional Scale of Identification (Leach et al., 2008; Portuguese version developed by Ramos & Alves, 2011) to measure the three dimensions of group identification: ingroup affect, ingroup ties, and centrality (in this scale, ingroup affect and ingroup ties are named “satisfaction” and “solidarity,” respectively). Response scales for all items were 7-point ones (1 = strongly disagree, 7 = strongly agree). We measured each dimension as follows: ingroup affect (two items: “It is pleasant to belong to the disabled people’s community” and “Being part of the disabled people’s community gives me a good feeling”), centrality (two items: “The fact that I am a disabled person is an important part of my identity” and “Being a disabled person is an important part of how I see myself”), and ingroup ties (two items: e.g., “I feel ingroup ties with disabled people” and “I feel committed to disabled people”). The three dimensions of group identification showed a substantial item-level reliability across the 7 days (lower and upper values of the Spearman–Brown coefficient: ringroup affect = .87 to .96; rcentrality = .79 to .95; ringroup ties = .76 to .97).
Health and well-being
We assessed self-reported health and well-being with three measures: (a) a single-item rating of general health and (b) a single-item rating of happiness (e.g., Branco et al., 2019; Ramos et al., 2019): “Overall, how would you describe your state of health today?” (1 = very bad, 7 = very good) and “Taking all things together, how happy would you say you feel today?” (1 = extremely unhappy, 7 = extremely happy), respectively; and (c) a two-item measure of depression (adapted from the eight-item version of the Center for Epidemiologic Studies – Depression Scale [CES-D]; Missinne et al., 2014; Radloff, 1977): “Thinking about how you felt today, please indicate how often you [felt depressed/felt lethargic and lacked motivation]?” (1 = always, 7 = never), with the two items reverse-coded to indicate the absence of depression, and combined in one factor (lower and upper values across the days: r = .69 to .94). A scale based on the combination of self-reported health, happiness, and (absence of) depression showed good reliability across the 7 days (upper and lower values: α = .76 to .84). These three variables—self-reported health, happiness, and (absence of) depression—were combined in a latent variable to measure health and well-being. In latent variables, it is a standard procedure to constrain to 1 the loading of one of the observed variables (generally, the variable that will have a higher loading on the latent variable; thus, the loading of happiness was constrained to 1).
Sociodemographic variables
We included the following sociodemographic variables associated with health and well-being: sex (coded with a dummy for “male,” using “female” as reference group), age (used as scale variable, in years), education (1 = no schooling, 2 = fourth year, 3 = seventh year, 4 = ninth year, 5 = 11th year, 6 = high school, 7 = higher education, used as scale variable), marital status (coded with a dummy for “married,” using the reference group “single/not married” [including those separated, divorced, or widowed]), employment status (coded with two dummies: 1 = unemployed, 2 = not in work [other], which included retired, pensioner, and students, with the reference group “employed”), feeling about household’s income (coded with a dummy for “difficult or very difficult on present income,” using the reference group “living comfortably or coping on present income”), impairment origin (coded with a dummy for “congenital,” using “acquired” as reference group), impairment visibility (coded with a dummy for “invisible,” using “visible” as reference group), and hampered in daily living activities (coded with two dummies: 1 = to some extent, 2 = not at all, using “a lot” as reference group).
Data analysis
To investigate if positive intergroup contact moderates the relationship between negative contact and well-being, via group identification, we conducted a multilevel conditional process analysis (Hayes, 2018; Stride et al., 2015) within the structural equation modelling framework, using Mplus 8.0. The intraclass correlation coefficients for the three dependent variables (health = .54, happiness = .57, and depression [reversed] = .62) supported a multilevel analysis. We ran a model for each of the three dimensions of group identification: ingroup affect, ingroup ties, and centrality. In each analysis, we followed the recommendations for multilevel mediation with repeated measurements obtained from diary studies (Card, 2012). At Level 1 (within), we introduced the time-variant variables, that is, the daily observations on intergroup contact, group identification, and well-being. At Level 2 (between), we introduced the time-invariant variables, that is, the sociodemographic variables (e.g., sex, age). Predictors (negative contact, positive contact, and time [at the within level]; age and education [at the between level]) were grand mean-centred, and we introduced a time control variable at Level 1.
In each conditional process model, we introduced negative intergroup contact as the predictor, group identification as a mediator, and well-being as the dependent variable. We introduced positive intergroup contact as a moderator in the relationship between negative contact and group identification, and between negative contact and well-being. Because in previous studies (a) positive contact was more common than negative contact (e.g., Graf et al., 2014), and (b) associations with negative contact were neutralized under higher levels, rather than average and low levels, of positive contact (Árnadóttir et al., 2018; Paolini et al., 2014), we plotted the conventional values of the moderator for the mean, and +1 SD and −1 SD relative to the mean, but we also plotted the maximum score of positive contact to better explore buffering and cancelling effects (i.e., lower–average–higher–highest values).
We used maximum likelihood parameter estimates with robust standard errors (MLR) and three goodness-of-fit indices: the chi-square, comparative fit index (CFI), and root mean square error of approximation (RMSEA). The chi-square measure shows the exact fit of the model, with p values above .05 implying an exact fit. Models with CFI values >.90 were considered to have an acceptable fit, and models with a CFI > .95, a good fit; RMSEA values <.08 indicate an acceptable fit, and <.05, a good fit (Bentler & Bonett, 1980; Hu & Bentler, 1999). For multilevel studies using samples with similar characteristics to ours, the minimum detectable effect size for direct effects at Level 1 is 0.16 (Arend & Schäfer, 2019). It is therefore unlikely that any nonsignificant results presented in what follows are due to an underpowered study.
Results and Discussion
Descriptive analyses
As in previous research, the frequency of negative contact was lower than the frequency of positive contact (see Table 1 for means, standard deviations, and correlations). Participants reported a mean of 0.81 daily experiences of negative (SD = 2.56) and six daily experiences of positive (M = 5.76, SD = 6.57) contact with nondisabled people; half of the participants reported up to three daily experiences of positive contact and zero daily experiences of negative contact. In addition, participants reported, on average, a somewhat positive disability identity in terms of all three components (ingroup affect: M = 4.17, SD = 1.51; ingroup ties: M = 5.65, SD = 1.26; ingroup centrality: M = 4.89, SD = 1.39). On average, participants reported relatively positive levels of health (M = 4.80, SD = 1.39) and happiness (M = 4.66, SD = 1.36), and a high score on absence of depression (M = 5.69, SD = 1.52).
Means, standard deviations, and correlations of the main variables under analysis: Study 1 .
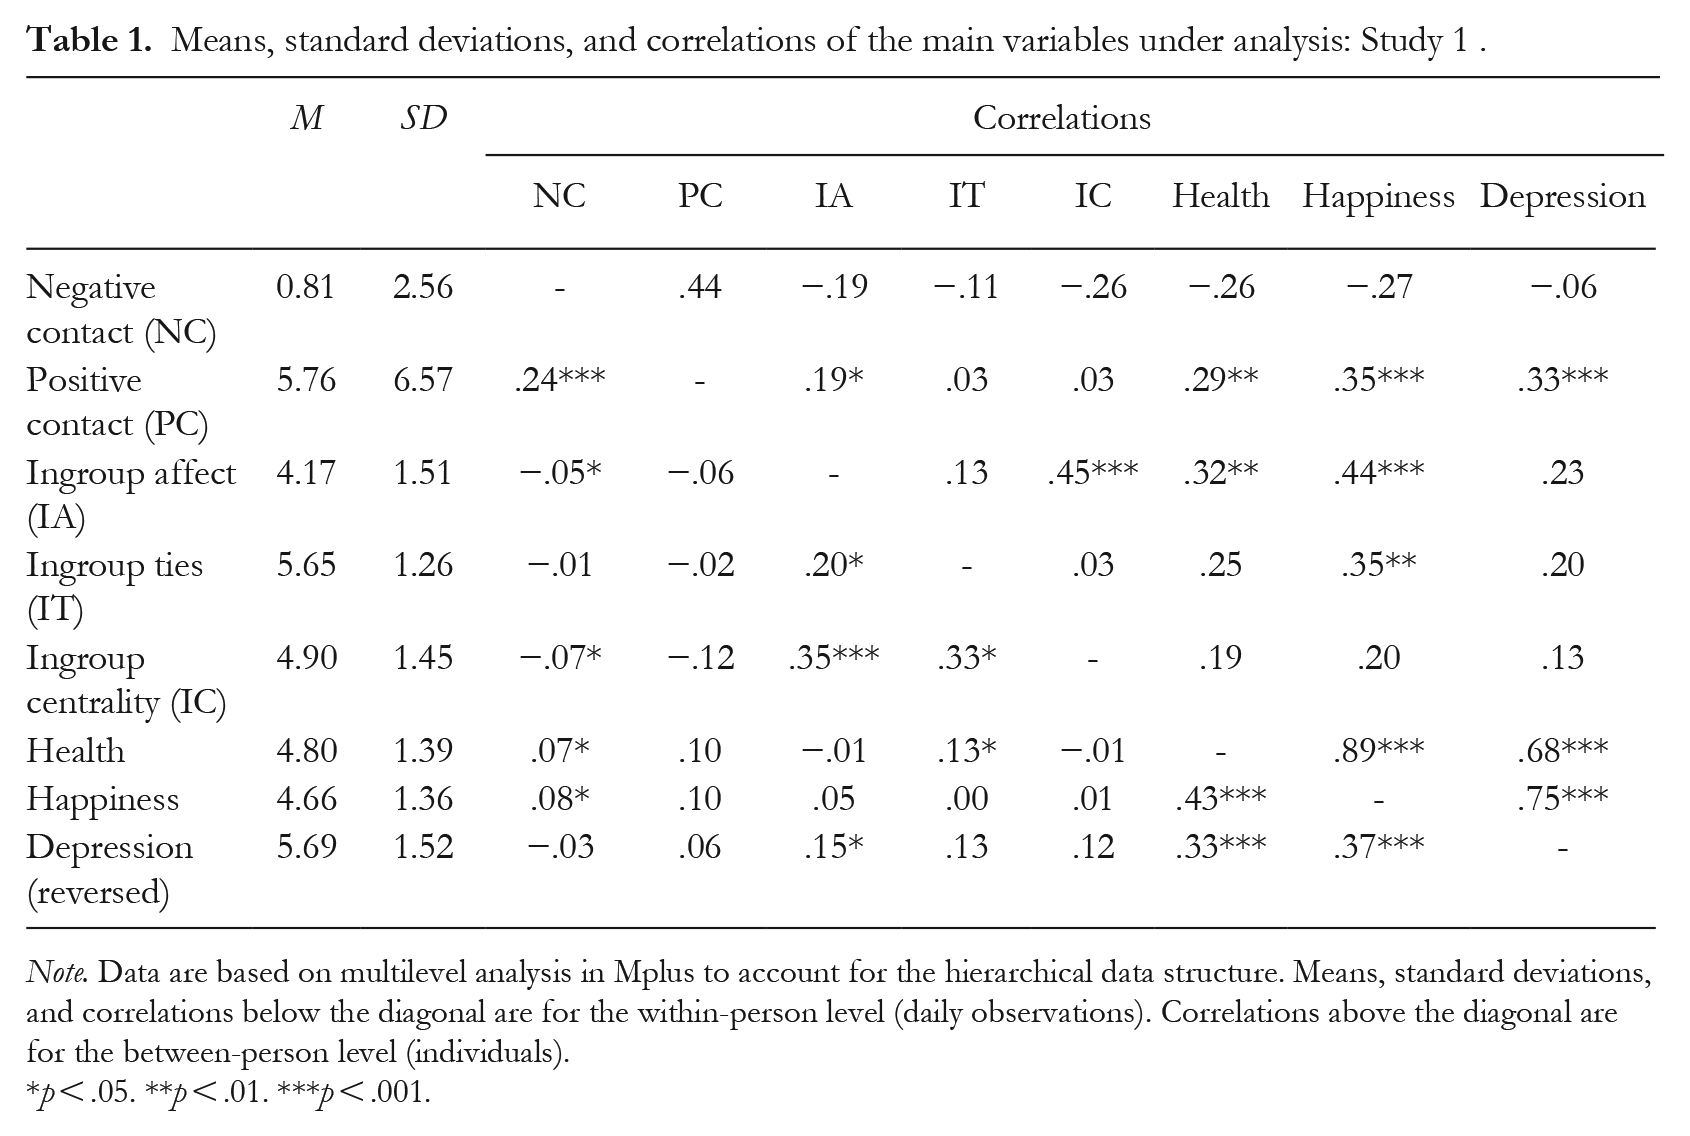
Note. Data are based on multilevel analysis in Mplus to account for the hierarchical data structure. Means, standard deviations, and correlations below the diagonal are for the within-person level (daily observations). Correlations above the diagonal are for the between-person level (individuals).
p < .05. **p < .01. ***p < .001.
Conditional process analyses
Fit indicators of multilevel conditional process analysis showed a good fit for the model of ingroup affect (χ2(32) = 38.35, p = .204, RMSEA = .02, CFI = .98), ingroup ties (χ2(32) = 30.89, p = .523, RMSEA = 0.00, CFI = 1.00), and centrality (χ2(32) = 31.61, p = .487, RMSEA = .00, CFI = 1.00).
Ingroup affect model
We did not find a significant direct association between negative contact and lower well-being (b = −0.04, p = .322), and positive contact did not significantly moderate this association (b = 0.00, p = .226), contrary to Hypothesis 1a (see Table S1 in the supplemental material for more details). However, the association between negative contact and lower ingroup affect was significant (b = −0.24, p = .003), and was moderated by positive contact (b = 0.01, p = .014), supporting Hypothesis 1b. The association between negative contact and lower ingroup affect was somewhat stronger for those who had lower positive contact (b = −0.34, p = .005), and became progressively weaker for higher (b = −0.15, p = .001) and highest (b = −0.03, p = .036) levels of positive contact (Figure 2 presents the model for the lower and highest values of positive contact).
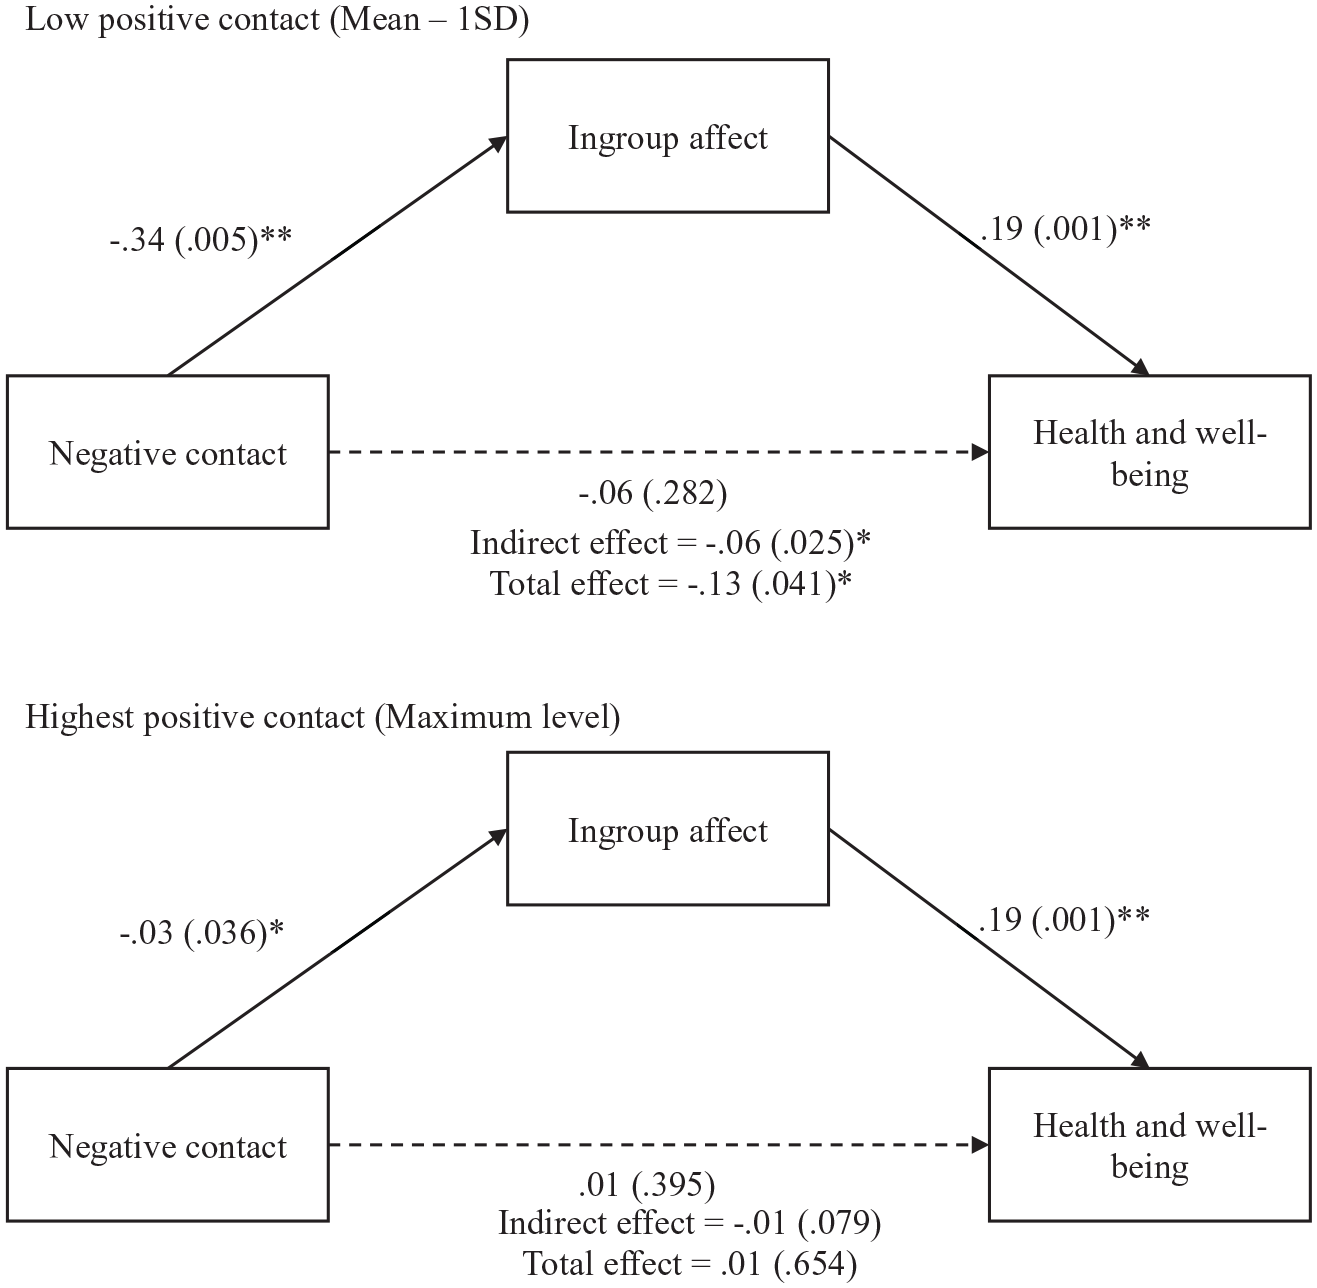
Conditional process model testing the association between negative intergroup contact and health and well-being, via ingroup affect, for lower and higher positive intergroup contact subgroups: Study 1.
Negative contact was associated with lower well-being via ingroup affect (b = −0.05, p = .021), while this association was stronger for participants with lower positive contact (b =− 0.06, p = .025) and weaker for participants with higher positive contact (b = −0.03, p = .015), and it was neutralized for participants with the highest positive contact levels (b = −0.01, p = .079), confirming Hypothesis 1c. Similarly, the total effect of negative contact on health and well-being, via ingroup affect, was significant and negative for those with lower positive contact (b = −0.13, p = .041), and became progressively weaker until it became nonsignificant for those with higher (b = −0.05, p = .071) and highest (b = 0.01, p = .654) levels of positive contact.
Ingroup ties model
We did not find a significant direct association between negative contact and lower well-being (b = −0.05, p = .171), and positive contact did not significantly moderate this relationship (b = 0.00, p = .131), contrary to Hypothesis 1a (see Table S2 in the supplemental material for more details). However, the association between negative contact and lower ingroup ties (b = −0.29, p = .048) was significant and was moderated by positive contact (b = 0.02, p = .022), supporting Hypothesis 1b. The association between negative contact and lower ingroup ties was stronger for those who had lower positive contact (b = −0.45, p = .037) and became progressively weaker until it became nonsignificant for respondents with higher levels (b = −0.14, p = .088) of positive contact. However, this association became positive for those who had the highest positive contact (b = 0.06, p = .001; see Figure 3). Therefore, we partially confirmed Hypothesis 1b for ingroup ties. Positive contact attenuated the association between negative contact and lower ingroup ties at both average and higher levels of positive contact. At the highest level of positive contact, we found an association in the opposite direction: negative contact was associated with higher ingroup ties.
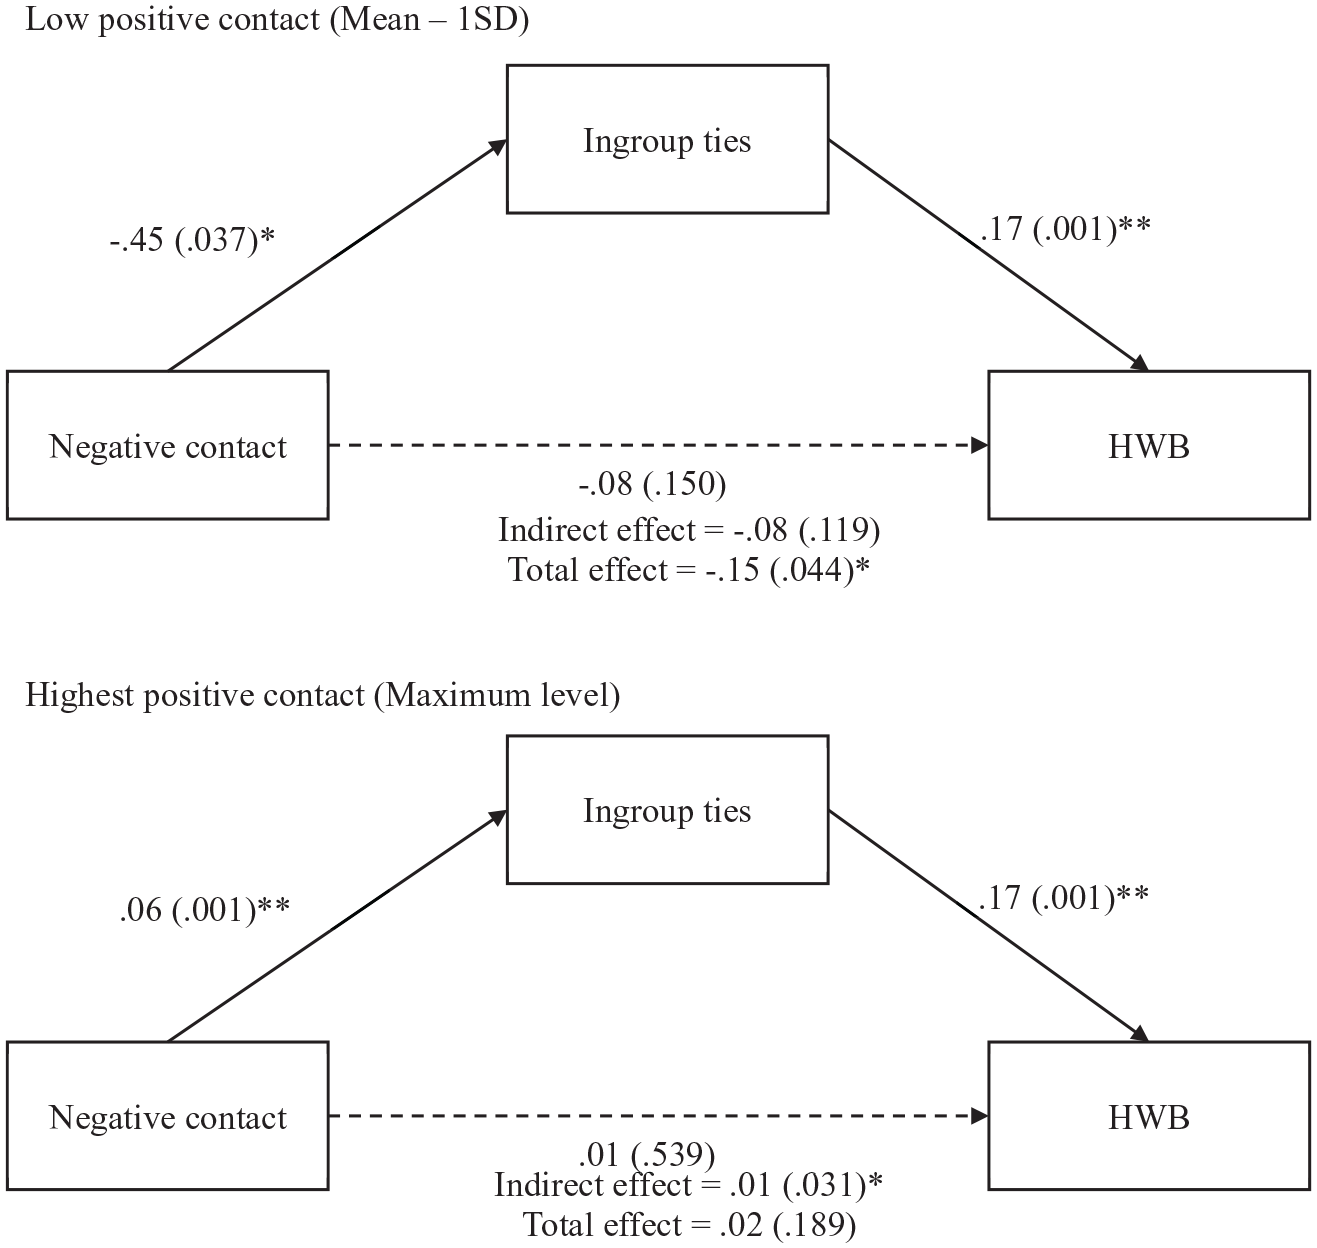
Conditional process model testing the association between negative intergroup contact and health and well-being, via ingroup ties, for lower and higher positive intergroup contact subgroups: Study 1.
Consequently, we found an effect opposite to that expected in Hypothesis 1c. The indirect effect of negative contact on well-being via ingroup ties became significant and positive only for participants with the highest positive contact (b = 0.01, p = .031). However, the total effect of negative contact on health and well-being was negative and stronger for participants with lower positive contact (b = −0.15, p = .044.), while it became nonsignificant for participants with the highest positive contact levels (b = 0.02, p = .189).
Ingroup centrality model
There was no significant direct association between negative contact and well-being (b = −0.05, p = .229), and positive contact did not significantly moderate this association (b = 0.00, p = .161). In addition, we found no evidence that positive contact moderated (b = 0.01, p = .153) the association between negative contact and lower centrality (b = −0.18, p = .044; see Table S3 in the supplemental material for more details). Therefore, we did not confirm either of our hypotheses in this model.
In sum, across all three models, we did not find a direct association between negative contact and lower well-being, and positive contact did not moderate this relationship, contrary to Hypothesis 1a. Supporting Hypothesis 1b, the association between negative contact and lower ingroup affect or ingroup ties was reduced under higher, compared to lower, levels of positive contact. However, we found a reverse pattern in which the association between negative contact and ingroup ties was positive under the highest level of positive contact. The indirect association between negative contact and lower well-being, via ingroup affect, was reduced for respondents with higher levels of positive contact, supporting Hypothesis 1c. In a reverse pattern, the association between negative contact and higher well-being, via ingroup ties, was significant for respondents with higher levels of positive contact. We found no moderation effects for the dimension of centrality.
In Study 2, we conducted a longitudinal survey study to investigate over a longer period (2 years) whether positive contact moderated these relationships. This approach does not distinguish between within-person and between-person effects; however, it enables us to investigate the temporal relations between variables over time. This allowed us to assess whether well-being and ingroup identification increased or decreased after self-reported frequency of negative contact, and the reverse effects, across the groups of lower and highest positive contact.
Study 2
Participants and Procedure
Participants (151 disabled people in Portugal) were asked to complete surveys across three waves (each wave, 1 year apart) of a longitudinal online study. Due to dropout, 99 disabled people participated in the second wave (retention rate of 65.6%), and 87 participated in the third wave (retention rate of 87.9%). This study focused on data obtained from the 87 disabled people who participated in all waves of the study. This sample included 44 females (50.6%) and 43 males (49.4%), the majority of whom were single (59.8%), with ages ranging from 20 to 76 years (Mage = 44.41, SDage = 11.76). Participants had, mostly, university (55.2%) or higher (27.6%) education, and were employed (51.7%) or were pensioners or retirees (26.4%). Generally, they were physically (94.3%) impaired, and they had an acquired (66.7%) and visible (88.5%) impairment. A small number of participants also reported hearing (three), visual (four), intellectual (four), and developmental/learning (three) impairments. They reported that they were hampered “a lot” (50.6%) or “to some extent” (39.1%) in their daily living activities due to impairment.
We recruited disabled people through social networks and organizations in the field of disability. Prizes were randomly drawn on the first (five prizes, each of €50), second, and third (three prizes, each of €50) waves. Data were collected through Qualtrics. Participants were asked if they would be willing to take part in a longitudinal study with three waves separated by 1 year. Before starting the survey, participants read an informed consent with information about the purpose of the study, approximate duration, confidentiality/anonymity, and right to withdraw at any time. At the end of the survey, they were asked for their contact details so that they could participate in the next phases of the study.
Measures
Positive and negative intergroup contact
Participants were asked to report on their experiences of positive and negative contact with nondisabled people, excluding their family members. A single item measured the frequency of each type of contact: “In general, how often do you have negative/positive contact with nondisabled people?” (1 = never, 2 = less than once a month, 3 = once a month, 4 = several times a month, 5 = once a week, 6 = several times a week, 7 = every day).
Group identification
We again measured the three dimensions of group identification (ingroup affect, ingroup ties, and centrality) with the Multidimensional Scale of Identification (Leach et al., 2008; for the Portuguese version, see Ramos & Alves, 2011). We measured the three dimensions on the following scales: ingroup affect (four items): “I think that disabled people have a lot to be proud of,” “It is pleasant to belong to the disabled people’s community,” “Being part of the disabled people’s community gives me a good feeling,” and “I am glad to be part of the disabled people’s community”; centrality (three items): “I often think about the fact that I am a disabled person,” “The fact that I am a disabled person is an important part of my identity,” and “Being a disabled person is an important part of how I see myself”; ingroup ties (three items): “I feel a bond with disabled people,” “I feel ingroup ties with disabled people,” and “I feel committed to disabled people” (1 = strongly disagree, 7 = strongly agree). The items showed substantial item-level reliability for ingroup affect (αT1 = .90, αT2 = .90, αT3 = .84), ingroup ties (αT1 = .72, αT2 = .82, αT3 = .78), and ingroup centrality (αT1 = .71, αT2 = .72, αT3 = .77).
Health and well-being
We assessed this construct with three items: a self-reported health question (“All in all, how would you describe your state of health?”; 1 = very bad, 7 = very good), a happiness question (“Taking all things together, how happy would you say you feel?”; 1 = extremely unhappy, 7 = extremely happy), and a life satisfaction 1 question (“How satisfied are you with your life in general?”; 1 = extremely unsatisfied, 7 = extremely satisfied; e.g., Branco et al., 2019; Ramos et al., 2019). We averaged responses across the three items, resulting in one factor reliably measuring health and well-being (αT1 = .82, αT2 = .84, αT3 = .84).
Sociodemographic variables
The same sociodemographic variables collected in Study 1 were included in the survey.
Data Analysis
We used the cross-lagged panel model (CLPM; Kearney, 2017; Kenny 1975), a structural equation modelling approach to examine longitudinal data. We conducted CLPM with multiple group analysis (i.e., we compared the same model for different groups; e.g., Mulder & Hamaker, 2021) to investigate whether positive intergroup contact moderated the longitudinal association between negative intergroup contact and (a) well-being and (b) identification. We do not present a mediation model of negative contact on well-being via group identification because group identification was not associated with health or well-being in a cross-lagged analysis, on any of the dimensions of identity (see Table S4 in the supplemental material). Excluding this variable lowered the number of parameters to be estimated and strengthened the effectiveness of our models.
We ran a separate CLPM with multiple group analyses for each dependent variable: the three dimensions of group identification and well-being. For each dependent variable, we compared the model fit and the cross-lagged association across two models: (a) a constrained model in which lagged parameters were constrained to be equal across groups, and (b) an unconstrained model in which lagged parameters were freely estimated across groups. To account for the stability of constructs as well as the nature of the relationships between constructs over time (i.e., stationarity; e.g., Kearney, 2017; Kenny, 1975), the lagged parameters were constrained to be equal across time (i.e., time-invariant). We compared the fit across the two models to understand which model better fit the data and if there was a difference between groups in the specific cross-lagged association between negative contact and identification/well-being. To define these groups, we used a median split of positive contact at both Waves 1 and 2, which corresponds to the highest value of positive contact (7 = every day) in both waves (median split of continuous variables into two groups has been previously used with cross-lagged analysis; Mulder & Hamaker, 2021). This meant that one of the groups reported that they experienced positive contact daily at both Waves 1 and 2, and the other group reported between no positive contact (never) and some amount of positive contact (several times a week). Therefore, we compared the groups of “highest” versus “lower” levels of positive contact. We were especially interested in comparing the highest value of positive contact against lower values because (a) positive contact is more frequent than negative contact (e.g., Graf et al., 2014), and (b) in Study 1, we found that some reliable associations emerged only at the highest level of positive contact.
We tested models with Mplus 8.0, using maximum likelihood (ML) parameter estimates with conventional standard errors and chi-square test statistics. Because constraints over time are imposed on the unstandardized coefficients, standardized coefficients can still differ (slightly) over time, and therefore all presented results are standardized coefficients. For CLPM, standardized coefficients of .03, .07, and .12 could be considered small, medium, and large effects, respectively (Orth et al., 2022).
Results and Discussion
Preliminary analyses
To examine whether there were sociodemographic differences between those who participated in all waves of the study and those who dropped out at Time 2 or 3, we performed a binary logistic regression to assess whether attrition was systematic. The outcome variable was coded as 0 = participated in all waves, 1 = dropped out. We found that being retired (β = 1.86, p = .005) or a pensioner (β = 1.25, p = .045) were significant predictors of dropout. However, other demographic variables (e.g., sex, age, education, marital status) or variables related to disability (e.g., type, visibility, nature [congenital or acquired], or extent of hampering in daily living activities) did not predict dropout. Collectively, demographic variables do not appear to be strong predictors of dropout (χ2(20) = 22.20, p = .330).
Descriptive analyses
As in Study 1, the frequency of negative contact was lower than the frequency of positive contact (see Table 2 for means, standard deviations, and correlations). For this sample of disabled participants, the mean level of contact with nondisabled people was “once a month” for negative (e.g., MT1 = 3.38, SDT1 = 1.88) and “several times a week” for positive (MT1 = 6.05, SD T1 = 1.48) contact across all waves. In addition, participants reported, on average, a somewhat positive disability identity in terms of all three identity components (ingroup affect: MT1 = 4.22, SDT1 = 1.70; ingroup ties: MT1 = 5.33, SDT1 = 1.28; ingroup centrality: MT1 = 4.40, SDT1 = 1.59). On average, participants reported a relatively good level of health and well-being (M T1 = 4.52, SD T1 = 1.17).
Means, standard deviations, and correlations of the main variables under analysis: Study 2 .
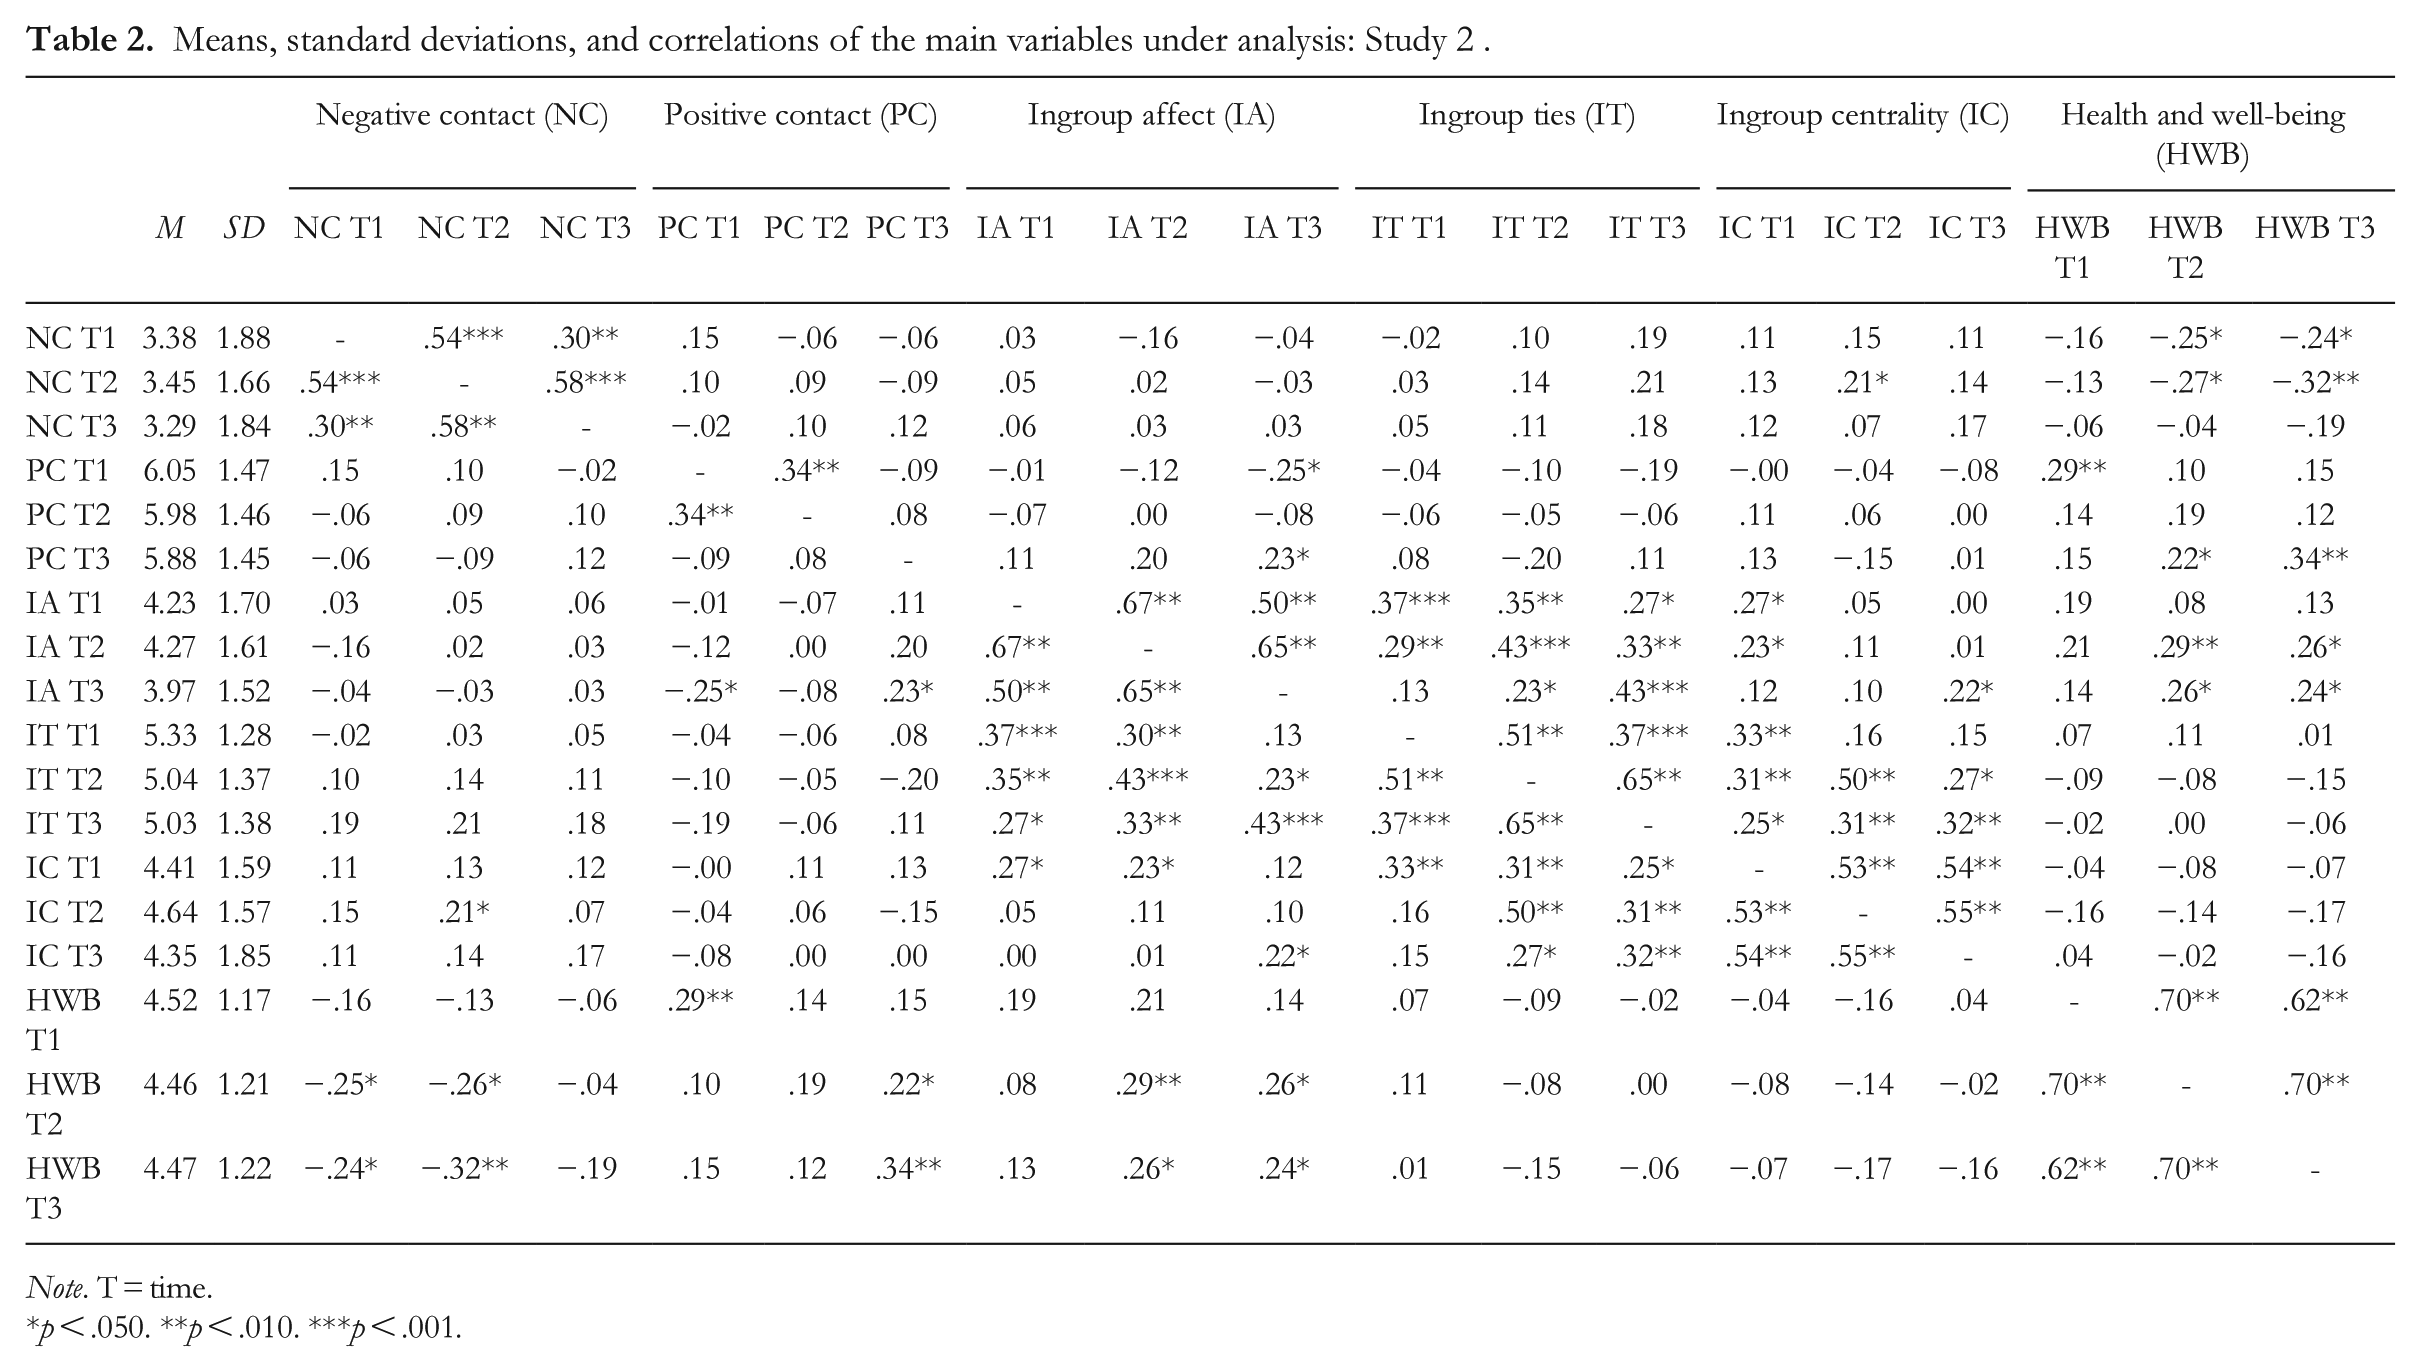
Note. T = time.
p < .050. **p < .010. ***p < .001.
Cross-lagged panel analysis of well-being
We first compared the constrained model across groups (equal parameters across groups) with an unconstrained model across groups (free parameters across groups). The chi-square difference test did not yield a significant result, Δχ2(4) = 7.25, p = .123, suggesting no significant difference in the overall fit between the two models. The latter model had a slightly better fit, and we found different results between groups in the specific cross-lagged association we wanted to test; constrained model across groups: χ2(20) = 25.67, p = .177, RMSEA = .08, CFI = .96; unconstrained model across groups: χ2(16) = 18.42, p = .300, RMSEA = .06, CFI = .99 (see Table S5 in the supplemental material).
The cross-lagged association between negative contact and lower subsequent well-being was significant over time, but only for those who had lower positive contact (T1 to T2: β = −.19, p = .022; T2 to T3: β = −.15, p = .025; see Figure 4 and Table 3). In turn, we found no significant cross-lagged association between negative contact and subsequent well-being for those who had the highest positive contact (T1 to T2: β = −.12, p = .216; T2 to T3: β = −.12, p = .209). This means that the cross-lagged association between negative contact and lower well-being was cancelled out at the highest level of positive contact, supporting Hypothesis 1a.
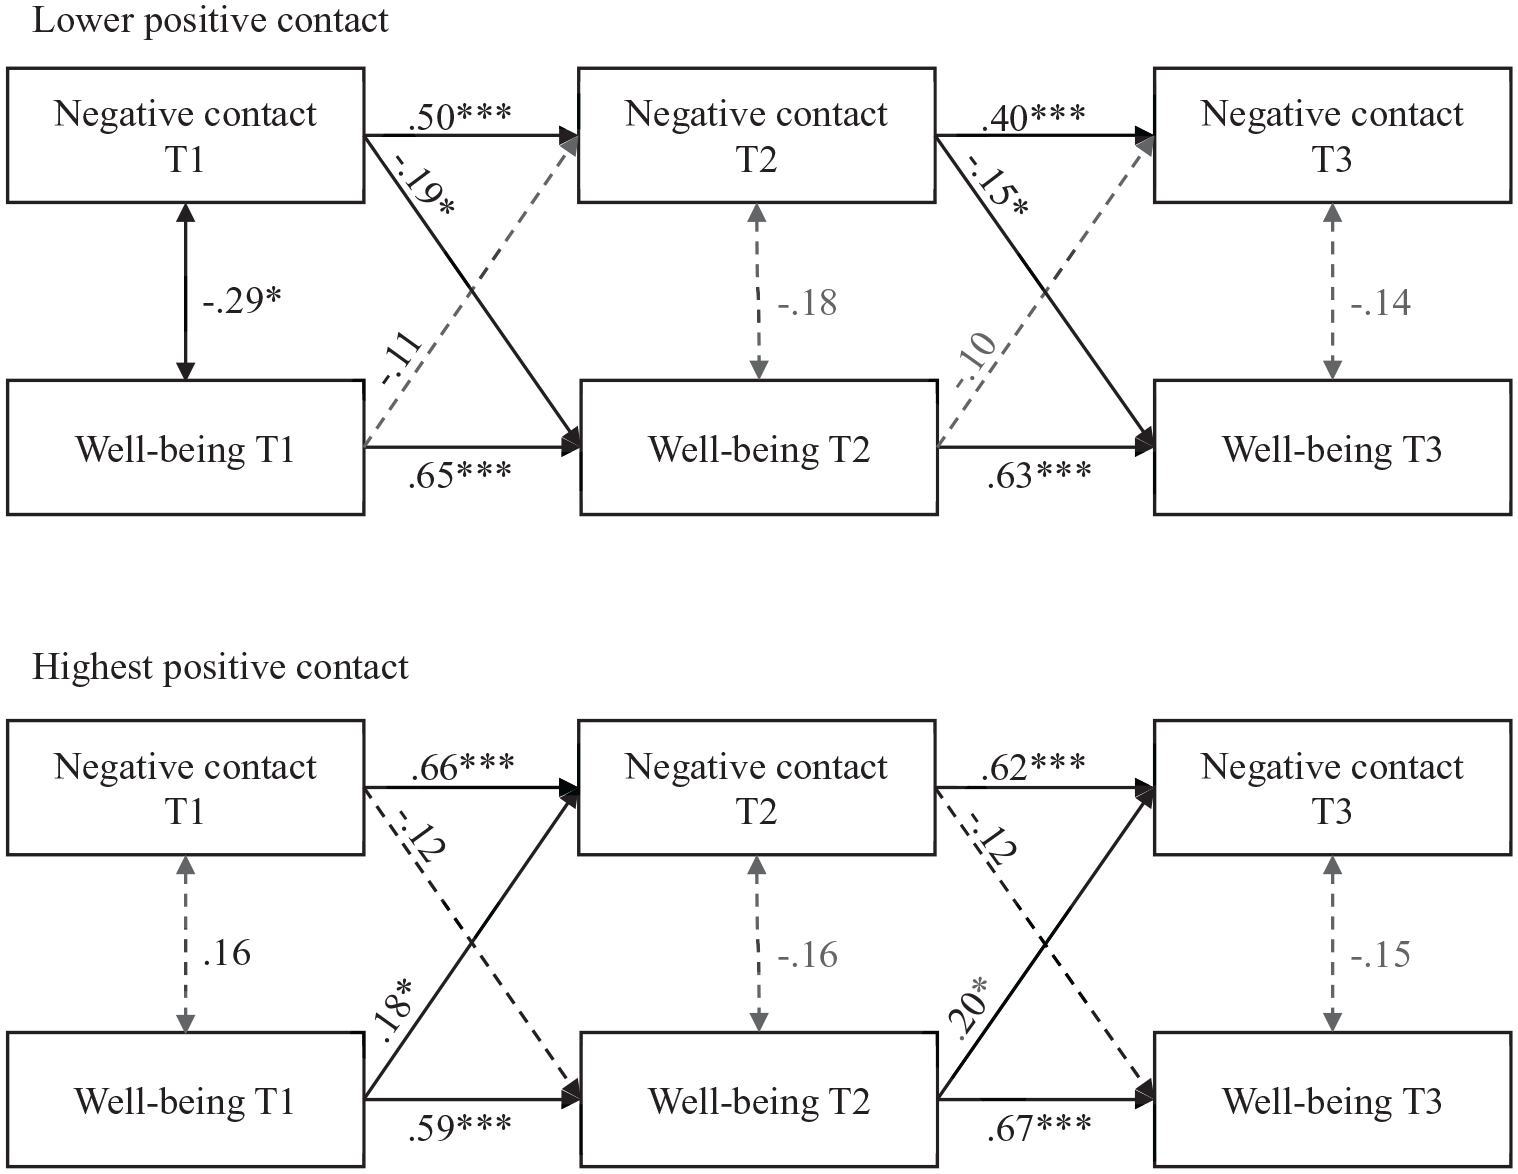
Cross-lagged panel model testing the association between negative intergroup contact and health and well-being, for lower and higher positive intergroup contact subgroups: Study 2.
Estimates from the cross-lagged panel model testing the association between negative intergroup contact and health and well-being, for lower and higher positive intergroup contact subgroups: Study 2.
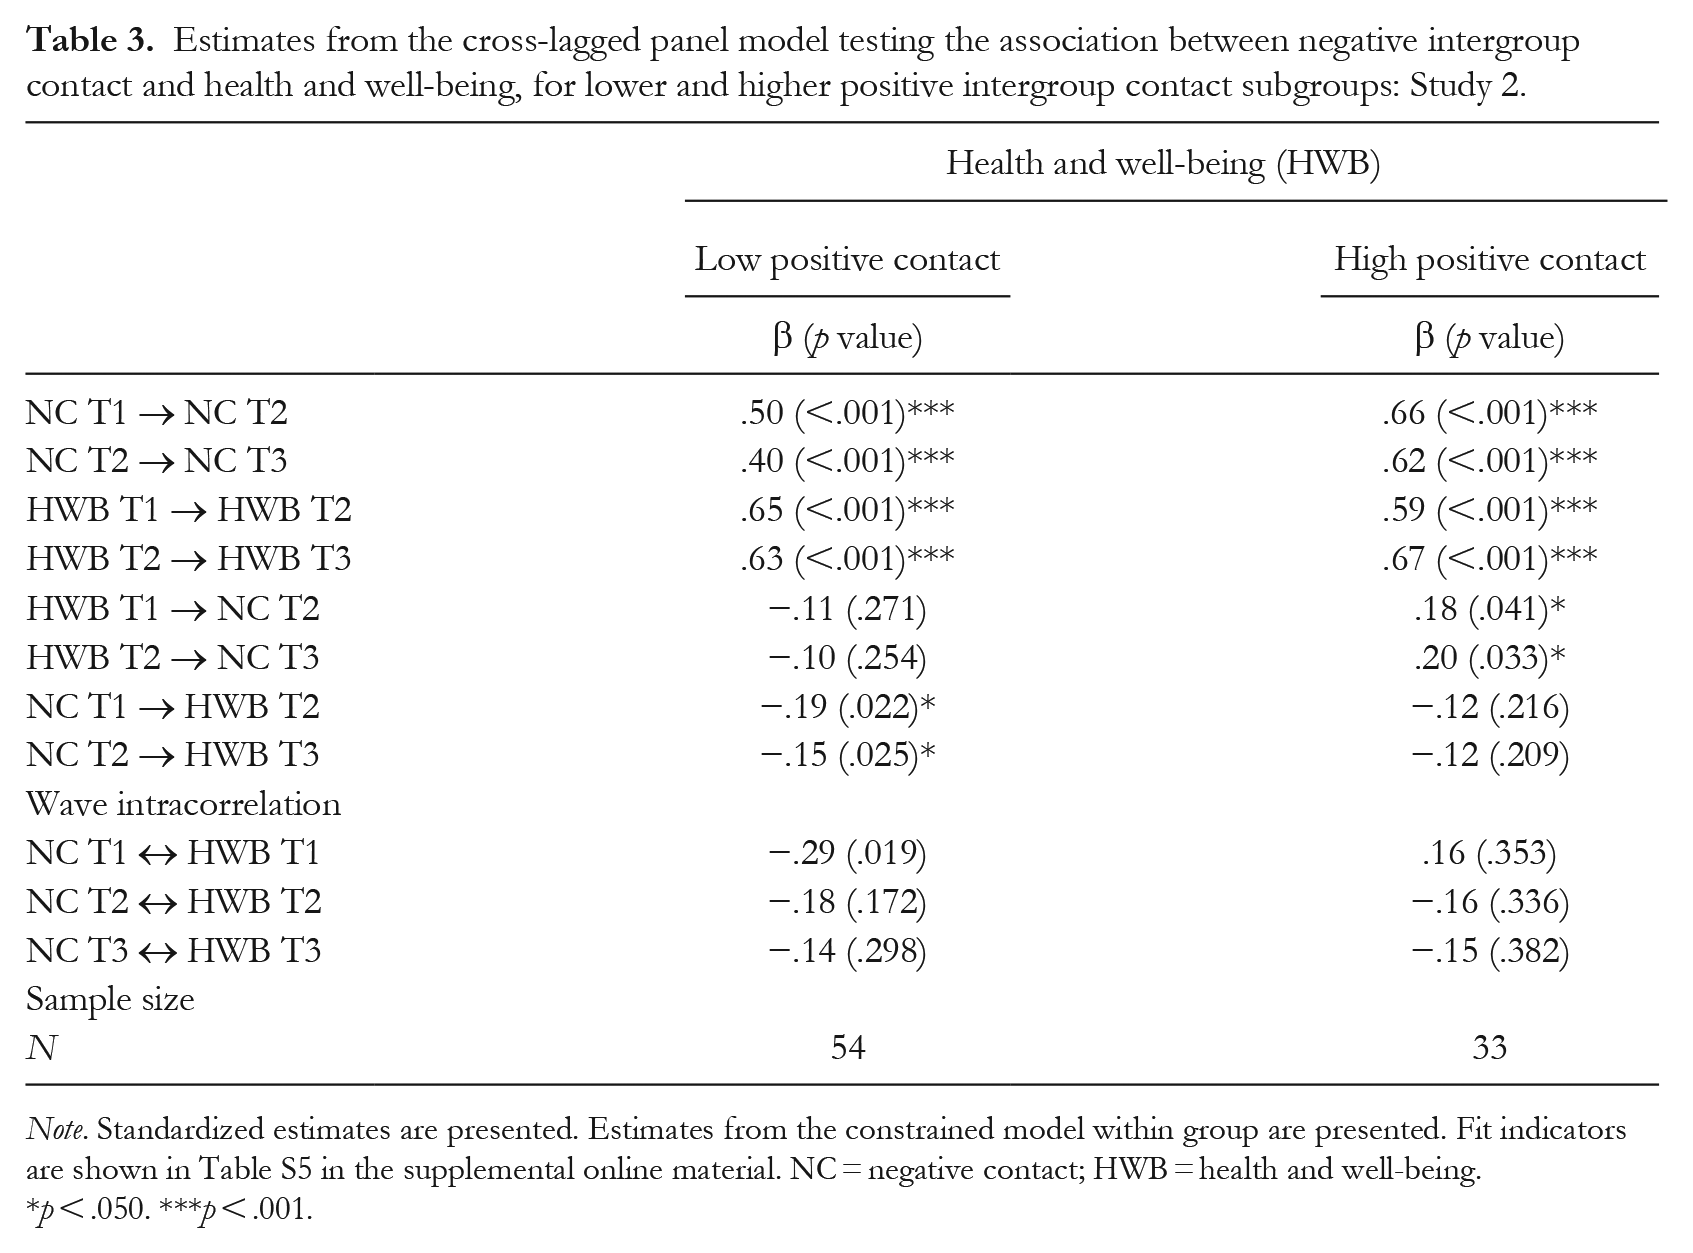
Note. Standardized estimates are presented. Estimates from the constrained model within group are presented. Fit indicators are shown in Table S5 in the supplemental online material. NC = negative contact; HWB = health and well-being.
p < .050. ***p < .001.
Auto-regressive paths were significant for well-being, which means that well-being was stable over time, and similar between the two groups (Table 3). We found a reverse association for those with the highest positive contact, that is, the cross-lagged association between well-being and subsequent higher negative contact was significant (T1 to T2: β = .18, p = .041; T2 to T3: β = .20, p = .033). This was an unexpected result. However, we can hypothesize that engagement in intergroup contact requires a certain level of well-being. Since self-expansion motives (e.g., personal and social development) and self-efficacy in promoting contact could be important predictors of willingness to engage in intergroup contact (Kauff et al., 2021), well-being may be positively associated with intergroup contact because people feel better and have more psychological resources and willingness to engage in such contact.
Cross-lagged panel analyses of group identification
We again compared the constrained model across groups of lower versus highest levels of positive contact (equal parameters across groups) with an unconstrained model across groups (free parameters across groups) for both dimensions of ingroup affect and ingroup ties. The chi-square difference test did not yield a significant result in these cases; ingroup affect: Δχ2(4) = 3.23, p = .520; ingroup ties: Δχ2(4) = 4.28, p = .370, suggesting no significant difference in the overall fit between the two models. However, we found different associations between groups in the specific cross-lagged association we wanted to test, for two of the three dimensions: (a) ingroup affect: constrained model across groups: χ2(20) = 13.54, p = .853, RMSEA = .00, CFI = 1.00; unconstrained model across groups: χ2(16) = 9.013, p = .913, RMSEA = .00, CFI = 1.00; and (b) ingroup ties: constrained model across groups: χ2(20) = 10.86, p = .950, RMSEA = 0.00, CFI = 1.00; unconstrained model across groups: χ2(16) = 6.58, p = .981, RMSEA = .00, CFI = 1.00 (see Table S5 in the supplemental material).
Ingroup affect model
The cross-lagged association between negative contact and lower subsequent ingroup affect was significant (T1 to T2: β = −.16, p = .023; T2 to T3: β = −.15, p = .016) for those who had lower positive contact. In contrast, we found no significant cross-lagged association between negative contact and subsequent ingroup affect (T1 to T2: β = −.07, p = .437; T2 to T3: β = −.08, p = .435) for those who had the highest positive contact (see Figure 5 and Table 4). This indicates that the cross-lagged association between negative contact and lower ingroup affect was cancelled out at the highest level of positive contact, supporting Hypothesis 1b.
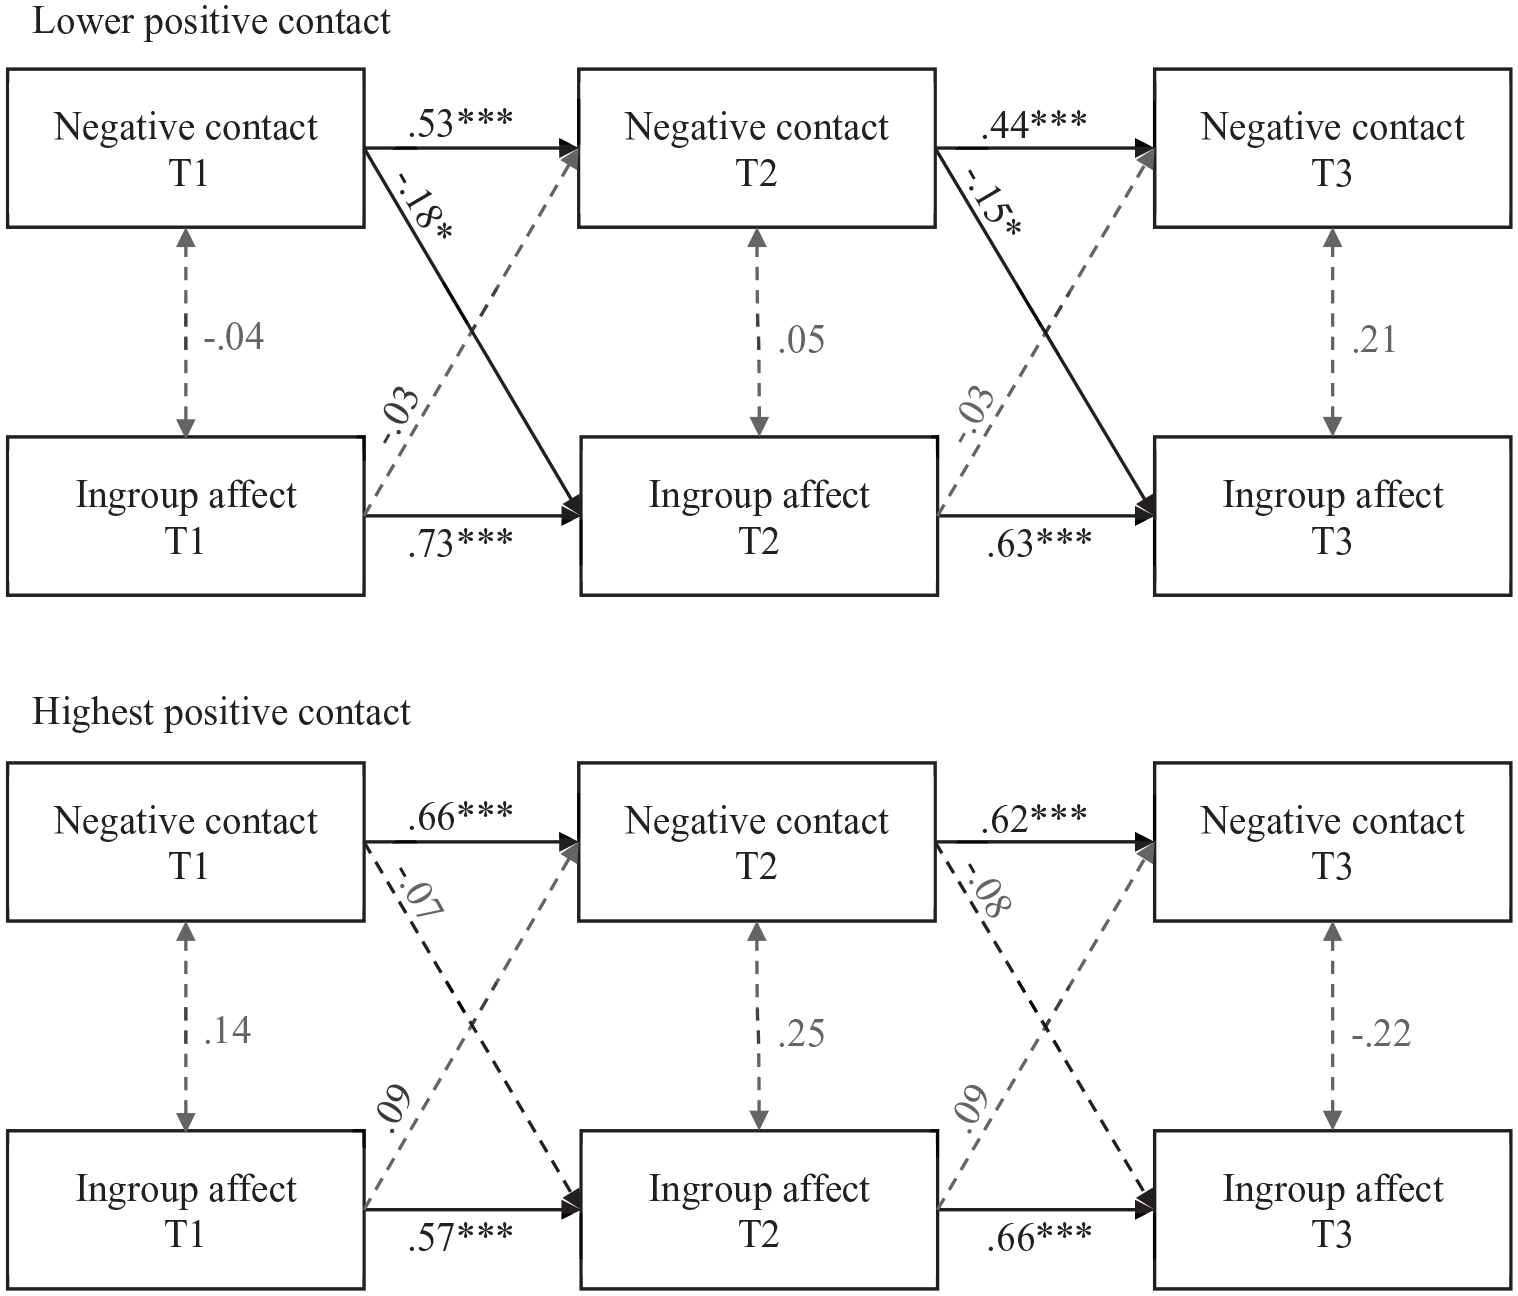
Cross-lagged panel model testing the association between negative intergroup contact and ingroup affect, for lower and higher positive intergroup contact subgroups: Study 2.
Estimates from the cross-lagged panel models testing the association between negative intergroup contact and the different dimensions of group identification, for lower and higher positive intergroup contact subgroups: Study 2.
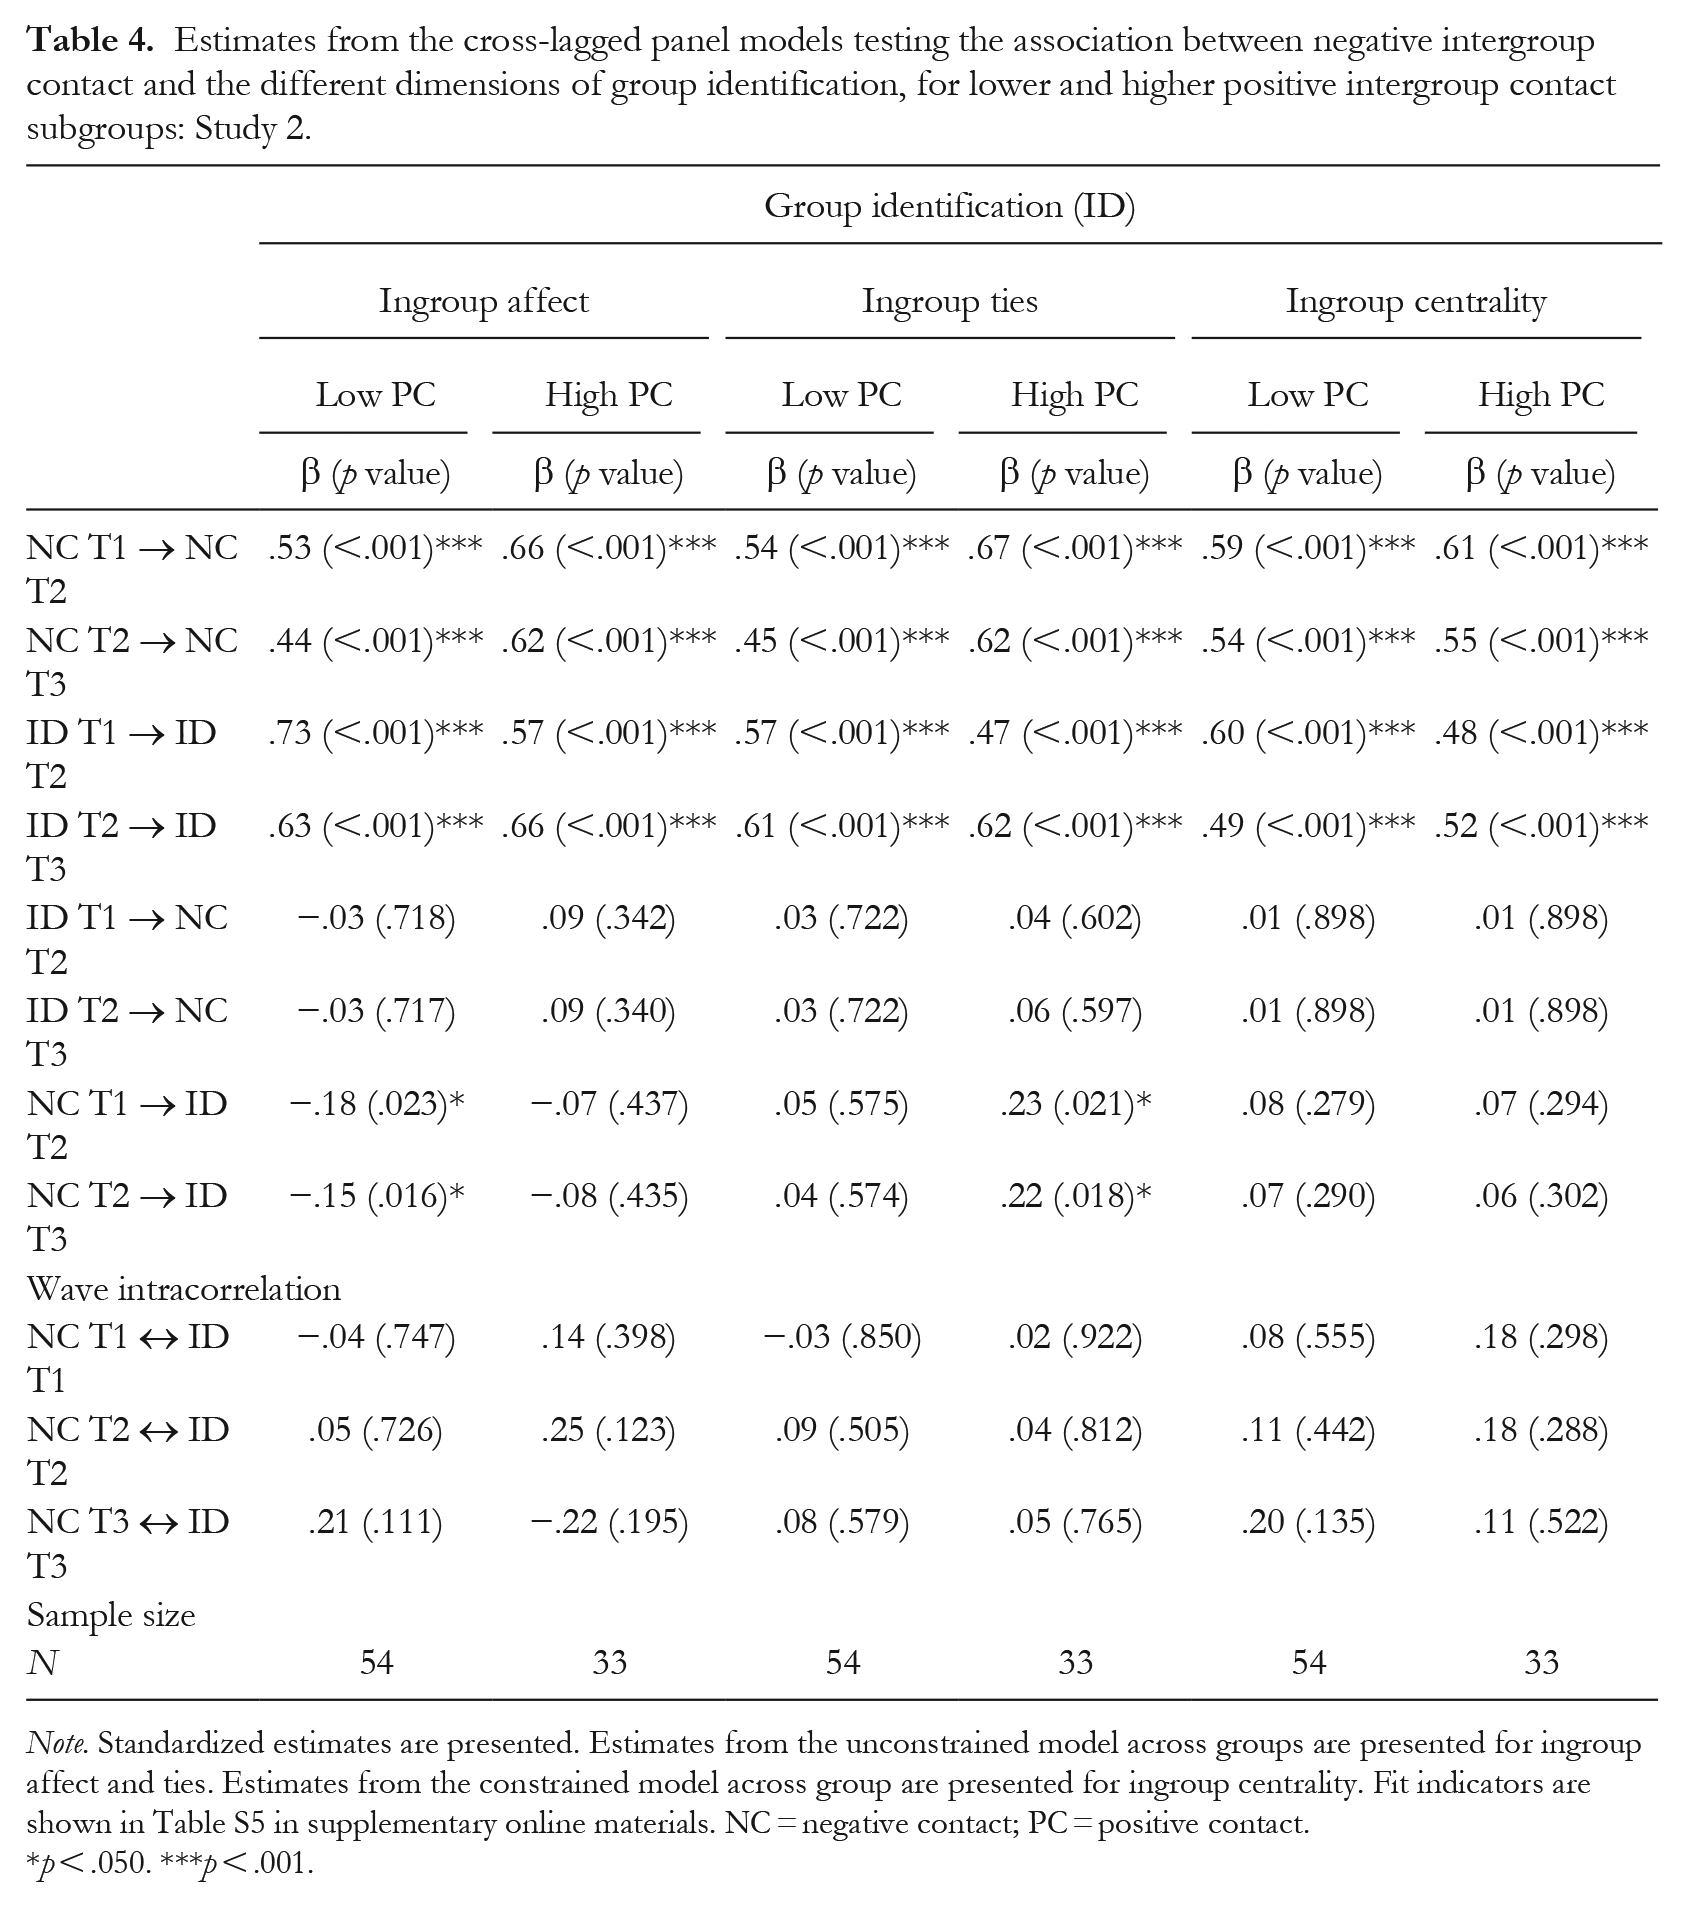
Note. Standardized estimates are presented. Estimates from the unconstrained model across groups are presented for ingroup affect and ties. Estimates from the constrained model across group are presented for ingroup centrality. Fit indicators are shown in Table S5 in supplementary online materials. NC = negative contact; PC = positive contact.
p < .050. ***p < .001.
Ingroup ties model
In this case, we found that the cross-lagged association between negative contact and stronger subsequent ingroup ties was significant for participants who had the highest positive contact (T1 to T2: β = .23, p = .021; T2 to T3: β = .21, p = .018). We found no significant cross-lagged association between negative contact and subsequent ingroup ties for those who had lower levels of positive contact (T1 to T2: β = .05, p = .575; T2 to T3: β = .04, p = .574; see Figure 6 and Table 4). Therefore, positive contact did not attenuate the cross-lagged association between negative contact and ingroup ties, as predicted by Hypothesis 1b. On the contrary, positive contact at the highest level enhanced the association between negative contact and higher ingroup ties.
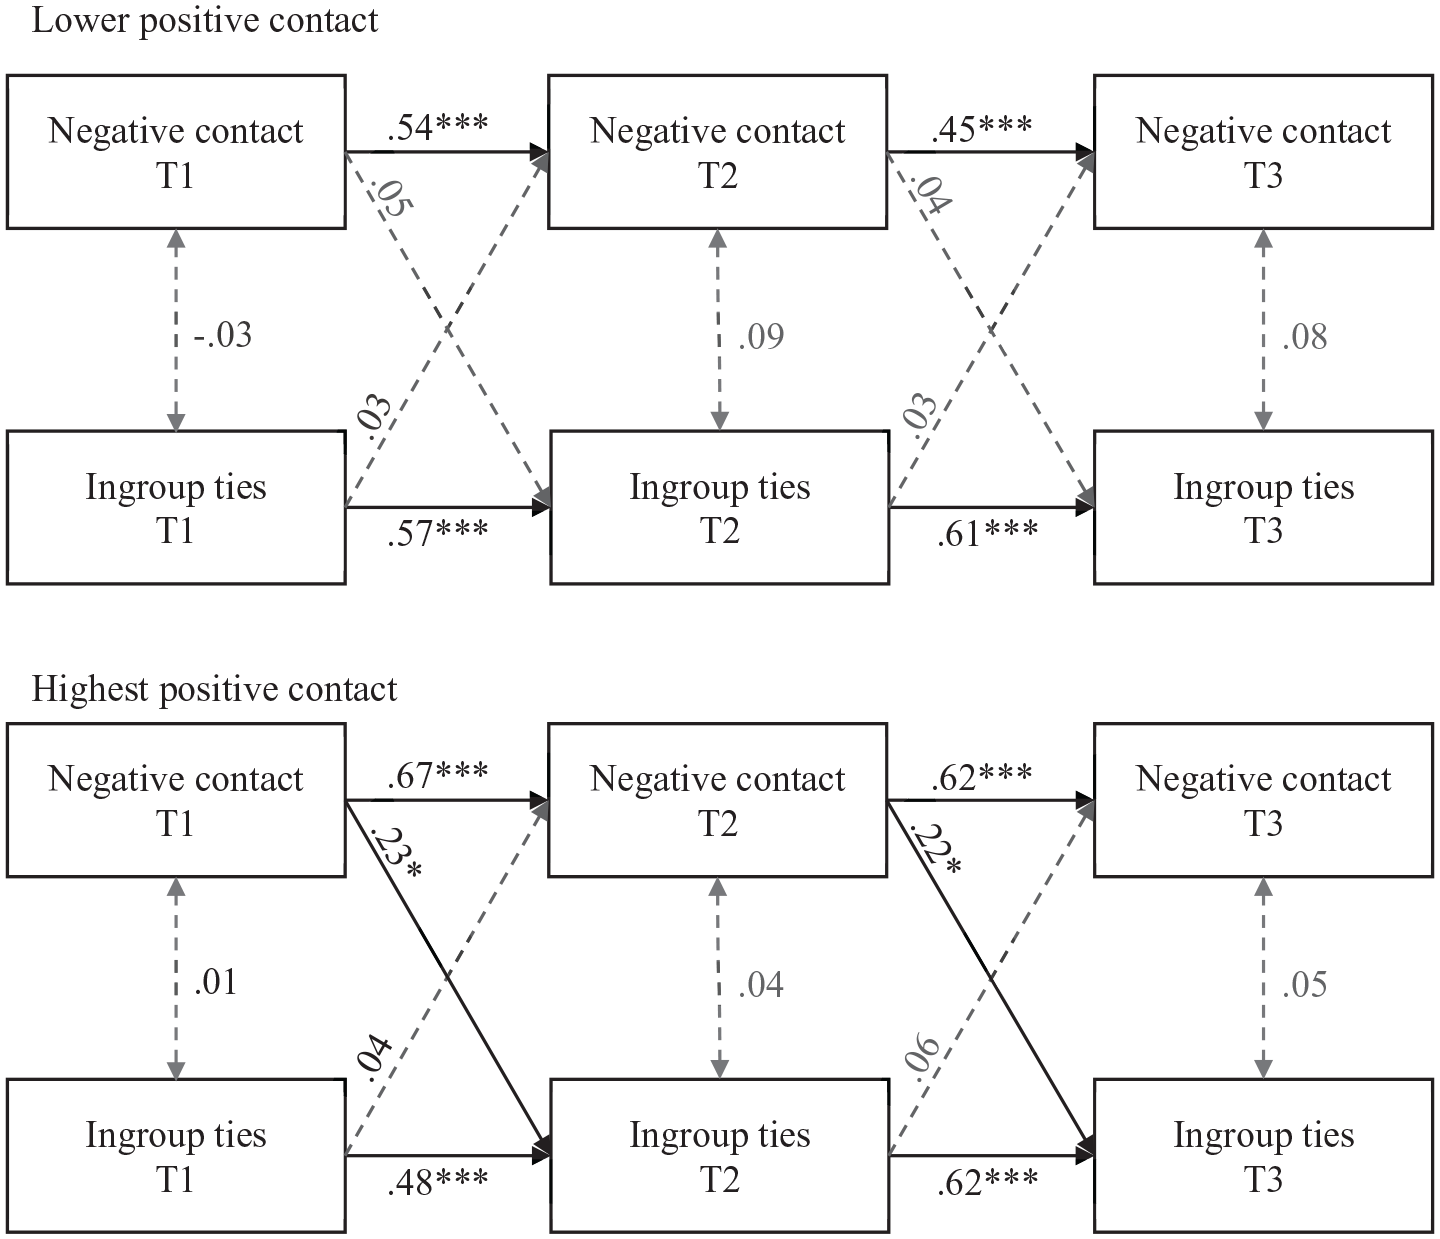
Cross-lagged panel model testing the association between negative intergroup contact and ingroup ties, for lower and higher positive intergroup contact subgroups: Study 2.
Ingroup centrality model
In the case of ingroup centrality, the chi-square difference test did not yield a significant result, Δχ2(4) = 3.48, p = .480, suggesting no significant difference in the overall fit between the two models. In this case, the constrained model across groups showed a slightly better fit than the unconstrained model across groups: constrained model across groups: χ2(20) = 29.26, p = .083, RMSEA = .10, CFI = .93; unconstrained model across groups: χ2(16) = 25.78, p = .057, RMSEA = .12, CFI = .93 (see Table S5 in the supplemental material). There were no differences between groups (based on their levels of positive contact), and thus we present the results for the constrained model across groups. Therefore, we did not confirm Hypothesis 1b for centrality, as positive contact did not moderate the association between negative contact and centrality. In addition, we found no significant cross-lagged association between negative contact and subsequent ingroup centrality (e.g., lower positive contact: T1 to T2: b = 0.08, p = .279; T2 to T3: b = 0.07, p = .290; see Table 4).
The reverse associations, that is, the cross-lagged path from each dimension of identity (ingroup affect, ties, and centrality) to subsequent negative contact were nonsignificant (see Table 4). In addition, negative contact and the three dimensions of identity predicted the same measures of the subsequent wave (i.e., auto-regressive paths), which means that they were stable over time.
To summarize, Study 2 found that the association between negative contact and lower well-being was significant only for those with lower levels of positive contact, supporting Hypothesis 1a. Similarly, the association between negative contact and lower ingroup affect was significant only for those with lower levels of positive contact, supporting Hypothesis 1b for this identity dimension. We found, similarly to the findings of Study 1, an association between negative contact and higher ingroup ties for the highest level of positive contact. In this study, negative contact was not significantly associated with centrality.
General Discussion
This research investigated how the interaction between negative and positive intergroup contact influences the well-being and group identification of disabled people, using a 1-week diary study (Study 1) and a three-wave, 2-year longitudinal study (Study 2). We found partial support for our main hypothesis that positive contact moderates the associations between negative contact and both lower well-being and lower group identification. Although there are some differences in findings across the two studies, which merit discussion below, our key findings follow a consistent pattern, despite the different methods used. We discuss these results in terms of the moderation effects of positive contact on well-being and group identification, exploring the consistencies and inconsistencies between studies.
Buffering Effects of Positive Intergroup Contact on Well-Being
The finding of an association between negative contact and lower well-being is in line with previous studies showing that perceived discrimination was associated with lower health and well-being (Pascoe & Smart-Richman, 2009; Schmitt et al., 2014). In this study, we extended these findings to investigate whether, and if so how, positive contact moderates the negative association between negative contact and well-being. In line with Hypothesis 1a, results show that positive contact can mitigate the association between negative contact and lower well-being. Across the two studies, negative contact was associated with reduced well-being, and this association was moderated by positive contact, although this emerged as an indirect effect via ingroup affect in Study 1, and as a direct effect in Study 2. In Study 1, we did not find a direct association between negative contact and lower well-being, nor did we find that positive contact moderated this relationship. This could be due to differences in within-person and between-person effects, as well as to the difference in time frame between the studies. Within-person effects from the diary study may differ from the effects observed over time using CLPMs, which do not allow separation of within-person from between-person effects. Negative contact might not have an immediate (direct) impact on individual well-being, but negative experiences may exert a more pronounced impact over an extended period. In other words, these negative experiences might have a greater influence on health and well-being in the long term, which is captured by our longitudinal study, but not by the individual and short-term perspective captured by our daily study. Overall, this could be an important finding for the design and evaluation of interventions. For example, an intervention that only included an immediate posttest might miss such adverse effects of negative contact, whereas the inclusion of a delayed posttest might capture such effects. On the other hand, negative contact was indirectly associated with well-being through ingroup affect and ingroup ties in the short term (Study 1), showing that well-being may be more sensitive, and thus change with short-term fluctuations in social identity.
Buffering (and Facilitation) Effects of Positive Intergroup Contact on Group Identification
In line with Hypothesis 1b, Study 1 showed that negative contact was more strongly associated with lower ingroup affect for those who had lower positive contact. Similarly, in Study 2, the cross-lagged association between negative contact and lower ingroup affect was significant only for respondents with lower levels of positive contact. The association between negative contact and lower ingroup affect is in line with previous studies showing that perceived discrimination was negatively related to ingroup affect (Ramos et al., 2012). Here, however, we found that this negative association was significant and strong (Study 1) or significant only (Study 2) at lower levels of positive contact.
In the case of ingroup ties, however, the moderation of positive contact took a different direction than expected at its highest level. In Study 1, negative contact was associated with lower ingroup ties at lower than average levels of positive contact (buffering effect), but at the highest level of positive contact, negative contact was associated with higher ingroup ties. Similarly, in Study 2, negative contact was associated with higher ingroup ties, but only for those who had the highest positive contact. Although the association between perceived discrimination, or negative contact, and ingroup ties has proved difficult to confirm in previous studies (e.g., Ramos et al., 2012; Reimer et al., 2017), a positive association between them is expected due to feelings of belongingness and social support among ingroup members (e.g., Jetten et al., 2017). In this research, we did find an association between negative contact and stronger ingroup ties, but here it only occurred at the highest level of positive contact, suggesting a facilitation effect, contrary to the predicted buffering effect. This finding supports the assumption that positive contact is not deleterious to ingroup identities; instead, positive contact can decrease negative feelings related to ingroup affect and increase ingroup ties, which in turn could be associated with higher well-being.
We expected that the mediation path between negative contact, identity, and well-being would be diminished, or cancelled out, at higher levels of positive contact (Hypothesis 1c), which happened in the case of ingroup affect. Negative contact was strongly associated with lower well-being via ingroup affect at lower levels of positive contact. However, we found an indirect effect between negative contact and higher well-being through ingroup ties for the highest level of positive contact. In Study 2 (longitudinal), we were not able to test the mediational path due to the small sample size. However, we found no association between identity dimensions and well-being over time in a cross-lagged analysis. There are two plausible explanations for this phenomenon: first, the null effect may be due to the small sample and lack of sufficient power in this study; second, this effect may reflect the absence of a sustained association over an extended period. In the diary study, this effect emerged as statistically significant, suggesting that the connection between identity and well-being might be particularly pertinent in the short term, closely linked to immediate experiences. However, a contrasting possibility is that identity may not be significantly associated with well-being over the long term. Corroborating this latter explanation, the relationship between identity and well-being was not statistically significant in a previous longitudinal study with a 1-year gap between two waves, involving international students and with a larger sample (Ramos, 2010). Consequently, it appears plausible that either this relationship does not endure over the long term or its magnitude may be weak (compared to other effects).
The relationship between negative contact and centrality
In both studies, we found no evidence that positive contact moderated the association between negative contact and lower centrality, whereas it did moderate the association between negative contact and both ingroup affect and ingroup ties. Moreover, we did not find a longitudinal association between negative contact and centrality in Study 2, which is in line with a previous longitudinal study (with a larger sample and two waves) showing a null association between negative contact and centrality over time (Reimer et al., 2017). Hence, it is plausible that the observed effect may be due to either a power limitation or differences in the time perspective between the two studies, though it cannot be definitively attributed to one factor over the other. Ingroup centrality, being a potentially more stable and enduring facet of identity, may exhibit less variation over time. Nonetheless, in the short term (diary study), it remains associated with negative experiences, given that the salience of group membership is likely more proximal to the experienced context.
It is worth noting, however, that we found an association between negative contact and lower centrality in Study 1, contrary to the anticipated positive association with perceived discrimination (e.g., Ramos et al., 2012). There are three plausible explanations for this result. First, although negative contact has been associated with higher perceived group discrimination (Hayward et al., 2018; Reimer et al., 2017), negative contact could have different implications than perceived discrimination, as it could be addressing experiences more at the personal level. The experience of personal discrimination has been strongly associated with lower psychological well-being (e.g., self-esteem), compared with group discrimination (Bourguignon et al., 2006; Schmitt et al., 2014). Therefore, negative contact could be more associated with the downplaying of group membership.
Second, we should consider whether different processes could be involved at the between and within levels. While, generally, past studies have been cross-sectional and between individuals (and do not differentiate between identity dimensions), this study addressed experiences and associations at the within level. This could mean that negative contact (or perceived discrimination) could have a positive association with identity (namely centrality) comparing individuals with different levels of negative experiences and identity, but still have a negative association with identity at the individual level.
Third, discrimination based on disability is more strongly negatively associated with well-being than are other types of discrimination (Branco et al., 2019; Schmitt et al., 2014), and disability prejudice has proved more intractable over time than other forms of prejudice (Charlesworth & Banaji, 2019; Harder et al., 2019). Moreover, disabled people are subject to several forms of benevolent and paternalistic discrimination (e.g., pity, unwanted help, infantilization; Nario-Redmond et al., 2019) that could be more difficult to recognize as illegitimate, an important condition for perceived discrimination to increase group identification (Branscombe et al., 1999; Jetten et al, 2011). This is not to say that these results stem solely from disability identity; the differences in methodology should be considered, and these findings may promote important advances for research on intergroup contact and identity.
Limitations, Considerations, and Future Directions
Although both studies are based on relatively small samples, this should be offset against the fact that the minority group studied, disabled people, has been largely overlooked in previous research and constitutes a stigmatized and hard-to-reach group. In Study 1, less than half of the respondents completed the diary every day for a week. However, in this case, the sample size met the sample-size criteria for a multilevel analysis, and the impact of unbalanced designs is rather negligible in diary research (Arend & Schäfer, 2019). In Study 2, despite aiming to collect a larger sample, there was attrition over time, but it was not systematic (with the exception that retirees and pensioners were more likely to drop out of the study). Therefore, the findings in Study 2 may not be generalizable due to the small sample size. Future studies may avoid these problems with new approaches to deal with attrition and missing values in diary studies, as well as longitudinal studies.
In addition, due to our sample and parameters, Study 2 could not test the mediational model. However, the main findings of Study 2—related to well-being, ingroup affect, and ingroup ties—show a similar pattern to those of Study 1. As previously mentioned, although caution is required based on considerations of statistical power (primarily in Study 2), we should, when comparing different or null findings with previous studies, consider both methodological differences (e.g., between- vs. within-level effects; short- vs. long-term effects, and time variations; cross-sectional and longitudinal surveys; and the novel use of a daily diary in this field) and differences related to the group studied. Additionally, we could not test the three dimensions of identity in the same model; thus, we acknowledge that there may be some covariance component that was not considered in these models.
While completing a daily diary, even for a week, appears to have posed a challenge, or required greater motivation, we are optimistic about the value of this approach in this field. We note, for example, the shocking finding that our respondents from the disabled group reported experience of negative contact daily when they kept a diary (Study 1). When they responded retrospectively, however (Study 2), they reported negative contact only “once a month.” This discrepancy might underline the value of diary studies in this area, which mitigate recall biases, and the high frequency of negative contact might help to explain the stronger negative association with well-being found for “ableism” compared to other types of group-based discrimination (Branco et al., 2019; Schmitt et al., 2014).
Despite these challenges, we collected data from an underrepresented group in the literature—disabled people—across time, using different and novel methods and statistical approaches. Additionally, this research opens new questions on the interaction between negative and positive contact for socially disadvantaged groups, taking into account plausible time (short/long term) and level (between/within) variations of effects in the existing literature. Future studies should test these relationships with other (and larger) samples, accounting for these variations in time and levels. Moreover, to ascertain the causal directions of these variables, future studies should adopt experimental methodology, although this poses significant ethical challenges, especially when manipulating negative contact, and when working with an already stigmatized group.
Another pathway for future research is the exploration of the mechanisms behind the buffering and facilitation effects of positive contact. One mechanism could be category salience, proposed in previous studies. While negative contact is more consistent with people’s negative expectations of outgroups (normative fit), the normative fit between positive contact and positive (or unclear) expectations could have a nullifying or reverse effect (Paolini et al., 2010). Therefore, positive contact can decrease the effects of negative contact (buffering effect) or exacerbate them (facilitation effect) when positive contact creates a contrast effect from previous experiences (Árnadóttir et al., 2018). Moreover, positive contact did not only buffer but neutralized some of the associations under higher than average levels of positive contact (Árnadóttir et al., 2018). In our research, cancelling out (Study 2) and facilitation (Studies 1 and 2) effects were found mostly at the highest value of positive contact, illustrating the potential of consistent positive contact experiences. Another possible mechanism could be that positive contact may promote the perception of intergroup respect and empowerment among disadvantaged group members (Hässler et al., 2021), attenuating the adverse consequences of negative contact, namely on well-being and ingroup affect, and, on the other hand, promoting positive ingroup ties.
Conclusion
This research is the first to test the interaction between negative and positive contact on well-being and group identification among disadvantaged group members. Results show that positive contact: (a) has the potential to attenuate or buffer the adverse consequences of negative contact on well-being and ingroup affect; and (b) can increase the association between negative contact and stronger ingroup ties, suggesting a facilitation effect of positive contact. These results support the proposition that positive contact does not necessarily harm collective action for social change, through reduced group identification (e.g., Hässler et al., 2021). Promoting positive intergroup contact could also protect the well-being and social identity of disadvantaged group members.
Supplemental Material
sj-docx-1-gpi-10.1177_13684302241280006 – Supplemental material for Exploring the interaction between negative and positive intergroup contact among disabled people
Supplemental material, sj-docx-1-gpi-10.1177_13684302241280006 for Exploring the interaction between negative and positive intergroup contact among disabled people by Carla Branco, Miguel Ramos and Miles Hewstone in Group Processes & Intergroup Relations
Supplemental Material
sj-docx-2-gpi-10.1177_13684302241280006 – Supplemental material for Exploring the interaction between negative and positive intergroup contact among disabled people
Supplemental material, sj-docx-2-gpi-10.1177_13684302241280006 for Exploring the interaction between negative and positive intergroup contact among disabled people by Carla Branco, Miguel Ramos and Miles Hewstone in Group Processes & Intergroup Relations
Supplemental Material
sj-docx-3-gpi-10.1177_13684302241280006 – Supplemental material for Exploring the interaction between negative and positive intergroup contact among disabled people
Supplemental material, sj-docx-3-gpi-10.1177_13684302241280006 for Exploring the interaction between negative and positive intergroup contact among disabled people by Carla Branco, Miguel Ramos and Miles Hewstone in Group Processes & Intergroup Relations
Footnotes
Declaration of Conflicting Interests
The author(s) declared no potential conflicts of interest with respect to the research, authorship, and/or publication of this article.
Ethics Statement
This manuscript adheres to ethical guidelines specified in the American Psychological Association’s (APA) Ethical Principles of Psychologists and Code of Conduct, as well as the authors’ national ethics guidelines.
Funding
The author(s) disclosed receipt of the following financial support for the research, authorship, and/or publication of this article: This work was supported by the Fundação para a Ciência e a Tecnologia (Grant No. PD/BD/128323/2017), Portugal.
Supplemental Material
Supplemental material for this article is available online.
Notes
References
Supplementary Material
Please find the following supplemental material available below.
For Open Access articles published under a Creative Commons License, all supplemental material carries the same license as the article it is associated with.
For non-Open Access articles published, all supplemental material carries a non-exclusive license, and permission requests for re-use of supplemental material or any part of supplemental material shall be sent directly to the copyright owner as specified in the copyright notice associated with the article.