
Abstract
The current research explores how respondents’ ideology influences their perception of political parties’ stances on various issues. Additionally, we examine how three distinct indicators of ideological strength—congruence between ideology and party affiliation, level of education, and engagement in political activities—affect these perceptions. Our empirical analyses rely on data from the 1968–2012 Cumulative American National Election Study dataset, which captures respondents’ views on the stances of US political parties regarding ten key issues. We find that, after controlling for respondents’ own issue positions, (i) perceptions of the positions held by the opponent party are strongly influenced by respondents’ ideologies, and (ii) this influence is more pronounced among individuals with stronger ideological convictions, as indicated by the three aforementioned indicators. Conversely, when examining perceptions of one’s favored party, ideology demonstrates a weak and inconsistent effect across the three markers of ideological strength. We discuss theoretical frameworks that may elucidate these findings, their implications for understanding political polarization, and we acknowledge limitations related to the dataset’s characteristics.
Political polarization in the US is on the rise (Dimock et al., 2014), and alarmingly, perception of this polarization is rising even faster (Abramowitz & Webster, 2016; Levendusky & Malhotra, 2016). Westfall et al. (2015) documented a consistent pattern of biased perception of the standings of the two major political parties on ten different issues. Specifically, their respondents viewed the issue positions of the Democratic Party as overly liberal and those of the Republican Party as overly conservative relative to the mean view of the party members themselves (see also Ahler, 2014). Our research attempts to extend these findings by examining in detail the role that respondents’ liberal/conservative ideology plays in biasing their perception of the parties’ standing on various issues.
To begin with, let us state the obvious: political parties are rich and complex entities, associated with many different, not necessarily congruent, informational messages. Therefore, it is not surprising that people with different ideologies have dissimilar (sometimes even contrasting) views of the political parties. Figure 1 schematically depicts a simplified model of how a respondent’s perception of a party’s position on a specific issue is related to the self-reported ideology. The figure highlights the general hypothesis that the processes involved in the perception of the party one affiliates with (called favored party) differ from those involved in the perception of the other party (called opponent party). This is further discussed below. The figure also illustrates our hypothesis that one’s ideology influences the perception of a party’s standing on an issue through two routes: one based on the personal opinion about the specific issue (Ellis & Stimson, 2012), and another unmediated by one’s own opinion on the issue, possibly reflecting the group identity associated with the ideology (Devine, 2015; Mason, 2018). Consequently, our study has two main objectives. Firstly, it aims to isolate the biasing effects of ideology that are independent of one’s own issue position (coefficients c & d in Figure 1), and compare these biases to the effects of one’s own issue position on the perceived party positions (coefficients a & b). Secondly, in order to gain deeper insight into the bias process we compare how three different markers of ideological strength impact the biasing effects of (1) ideology and (2) own issue position.
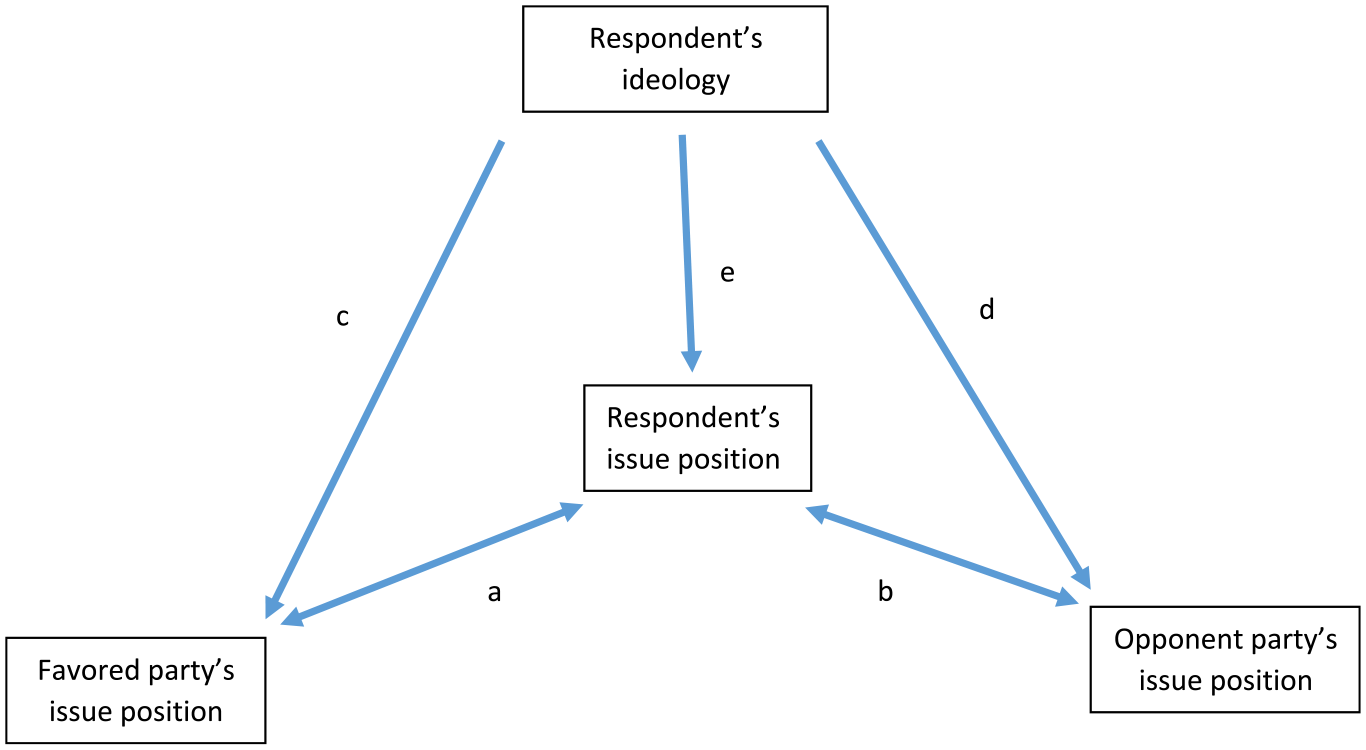
Simplified model relating ideology to the perception of the parties’ issue positions.
Convergence and Divergence of Own Position and Perceived Party Position
It is important to note that the assessments of ideology, own issue position, and the perceived party position differ in two seemingly technical aspects—question wording and response scales. Usually, the questions about one’s own position and the party’s position on an issue utilize nearly identical words and the same response scale. The only difference lies in the target of the judgment, either the self or the party. In contrast, the question about the respondent’s ideology employs different question wording and different response scales. Consequently, question wording and scale effects (see below) are likely to influence the relationship between the respondent’s own issue position and the perceived party position. However, when own position is controlled for, question-wording and scale effects cannot influence the relationship between ideology and perceived party position.
Question-wording Effects
Because the questions about one’s own position regarding an issue and the perceived party position on that issue refer to highly related sets of issue beliefs, thinking about one question can influence responses to the other. Indeed, past research highlights the key role of the self in prioritizing self-congruent information in terms of attention and interpretation and memory-cueing, leading to convergence 1 between one’s own standing on an issue and perception of the party position on that issue (Biernat, 2005; Ledgerwood & Chaiken, 2007; Waldfogel et al., 2021). Importantly, however, in the political arena there is also a powerful effect in the other direction. To wit, the position a respondent holds regarding a political issue might be influenced by the position advocated by his/her favored party (Bisgaard & Slothuus, 2018; Satherley et al., 2018), although it has been shown that partisans do not automatically shift their opinions in line with the party (Bullock, 2011; Nordø, 2021). Thus, the relationship between own position on an issue and the perceived position of the party is best conceived as bidirectional (symbolized by the double-ended arrows in Figure 1), and is therefore described by the terms convergence/divergence rather than assimilation and contrast. Regardless of the direction of influence, question-wording effects tend to lead to a convergence, especially when perception of the issue positions of one’s favored party is examined (Robbins & Krueger, 2005; see also Paolini & McIntyre, 2019).
Response-scale Effects
Research indicates that one’s own position anchors the response scale and affects its units (Biernat, 2005; Hare et al., 2015; Judd et al., 1983; Upshaw, 1965; Volkmann, 1951). Scale anchoring can lead to convergence of the self and the perceived position of the favored party and divergence of the self and the perceived position of the opponent party. In other words, the favored party appears to shift in the direction of the self, and the opponent party, away from the self. Such convergence/divergence tendencies are consistent with the assimilation–contrast model of Sherif and Hoveland (1961), which postulates that when a social object (e.g., a favored party) is similar to a reference point (e.g., the self), the two converge; when an object is distant (e.g., an opponent party), the two diverge (see also accentuation theory, Eiser & Stroebe, 1972; Vegetti & Širinić, 2019).
Convergence and Divergence of Ideology and Perceived Party Position
Ideology serves as a general orientation toward the political world (Fiorina & Abrams, 2008; Jost, Federico, & Napier, 2009; Rothschild et al., 2019; Van der Meer et al., 2009; Weber & Klar, 2019). Thus, the interplay between one’s position regarding any specific issue and the general perspective that an ideology offers leans heavily in favor of a directional influence of ideology on the perception of that issue. Accordingly, in Figure 1, the links from ideology are unidirectional, representing a bias that ideology induces on the perception of party position regarding any specific issue.
As a general orientation toward the political world, ideology is a powerful tool to divide the world into “us vs. them,” hence serving as a building block of one’s social/political identity (Devine, 2015; Mason, 2018; Tajfel & Turner, 2001). The pressure to maintain or enhance the social/political identity triggers convergence and divergence processes. Specifically, the desire to feel closer to one’s own group (i.e., the favored party) should increase convergence, whereas the desire to distance oneself from other groups (especially the opponent party) should increase divergence (see also Beauregard & Dunning, 1998). Such convergence/divergence could be achieved by the mechanisms of the selective-accessibility model (Mussweiler, 2003; Wedell et al., 2007). In particular, thinking about the favored party triggers a similarity-focus perspective, and consequently differences between the respondent and the favored party are reduced; thinking about the opponent party triggers a dissimilarity-focus perspective, and consequently differences between the respondent and the opponent party are magnified. Accordingly, the former leads to assimilation (e.g., individuals who hold more liberal ideologies tend to view their favored party as expressing a more liberal position on issues), the latter to contrast (e.g., individuals who hold more liberal ideologies tend to view the opponent party as expressing a more conservative position on issues).
The assimilation and contrast forces are unlikely to be equal, as the favored and opponent parties differ in terms of respondents’ knowledge/ignorance. People know more about their favored party than about their opponent party, or, put differently, there is more ambiguity about the opponent party’s position. This suggestion is supported by research showing that people sample more information about their ingroup (favored party) than outgroups (Derreumaux et al., 2022; Konovalova & Le Mens, 2020). The knowledge asymmetry is also consistent with the idea that the ingroup is viewed in a less stereotypical way than the outgroup (Park et al., 1991). From this perspective, perception of the opponent party is more vulnerable to perception bias, contributing to the asymmetry between ingroup love and outgroup hate (Brewer, 2017; Finkel et al., 2020). Moreover, the position attributed to the favored party regarding a specific issue may shape one’s own view about this issue. As a consequence, when we statistically control for one’s own views regarding an issue, ideology should confer weaker biases on the perception of the favored party than on the perception of the opponent party. Thus, we hypothesize that ideology induces a strong bias on the views of the opponent party, but weaker bias on the views of the favored party. To gain more insight into these predictions, we discuss below how the ideology-triggered biases are affected by ideology strength.
Ideology Strength Moderates Ideology-triggered Effects
The strength of ideology has many faces: it could mean the certainty with which the ideology is held, its importance, its centrality in one’s belief system, the amount of knowledge associated with it, its level of accessibility, and/or the extent of relevant behavioral actions it triggers. Research on attitude strength concludes that the different manifestations of strength do not form a single factor structure (e.g., Krosnick et al., 1993; Luttrell & Togans, 2021). Visser et al. (2006) suggest that instead of attempting to fit a single-factor model for different measures of strength, it is advantageous to examine whether alternative measures of strength lead to the same outcome. Our study employs this strategy. We examine three markers of strength as potential moderators of the biasing influence of ideology on the perceived parties’ issue positions. These moderators were chosen for two reasons. First, they do not involve introspective estimates of ideology strength. Second, they are associated with very different senses of strength. At the most general level, we investigate the hypothesis that respondents with stronger ideology (indicated by each of the three strength indicators) exhibit stronger ideology-triggered bias, and in particular, that stronger ideology leads to stronger divergence of the perceived opponent party’s issue position.
Method
We used the data collected by the American National Election Study (ANES), a nationally representative cross-sectional survey regarding various political issues, conducted biennially from 1968 until 2012. Following Westfall et al. (2015), our analyses include ten different issues that ANES respondents have considered over the years. Table 1 presents the set of issues and the scale endpoints of each issue. The original items and scales can be found at https://electionstudies.org/wp-content/uploads/2018/12/anes_timeseries_cdf_codebook_var.pdf.
The items used in our analyses.
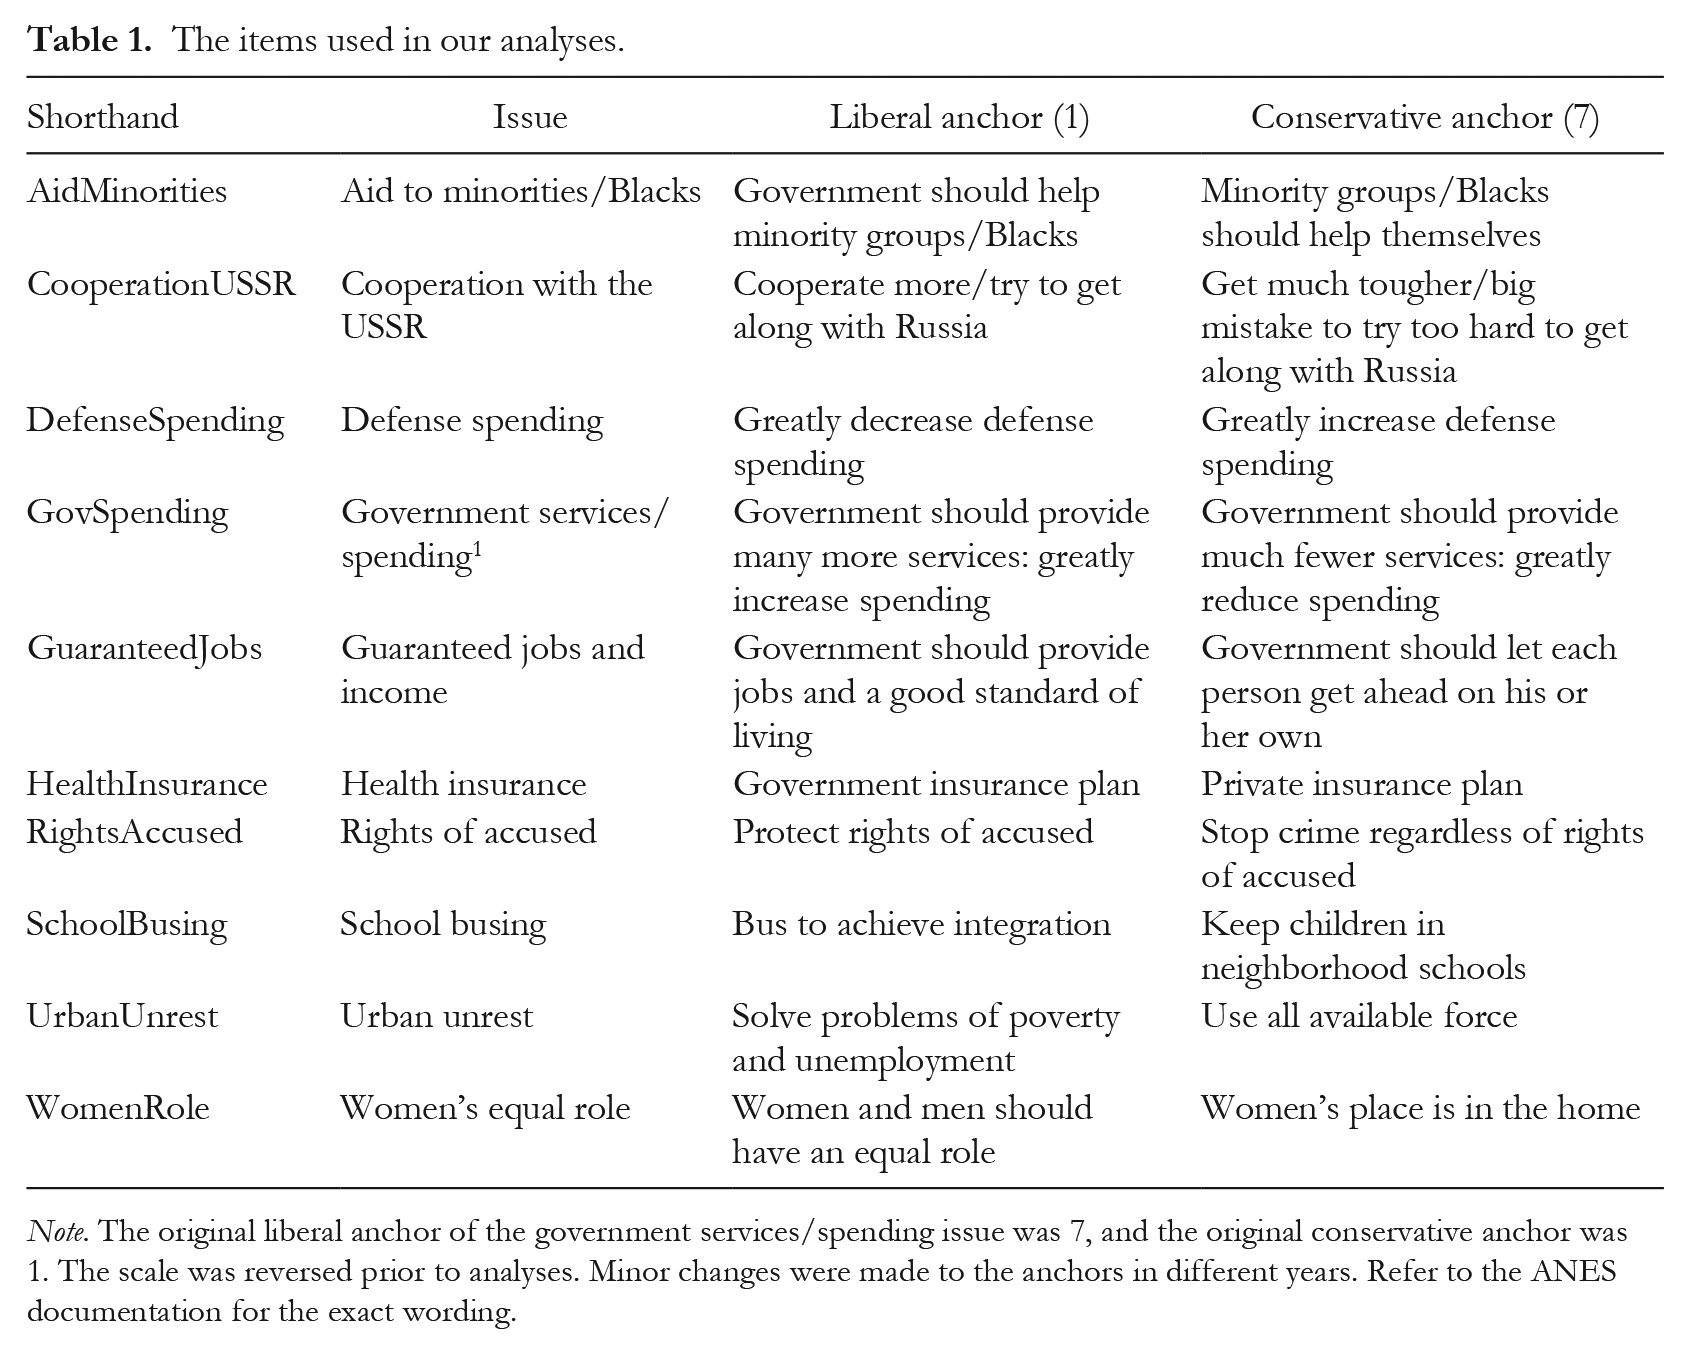
Note. The original liberal anchor of the government services/spending issue was 7, and the original conservative anchor was 1. The scale was reversed prior to analyses. Minor changes were made to the anchors in different years. Refer to the ANES documentation for the exact wording.
Among the many questions they answered, respondents rated their own attitude about several issues and estimated the attitudes of the Democratic Party and the Republican Party regarding these issues. Respondents also reported their liberal/conservative ideology, party affiliation, level of education, and whether they have participated in each of a series of campaign activities.
Results
Preliminary analysis
Table 2 presents the weighted average of the zero-order correlations between the respondent’s per-issue rating of the favored/opponent party’s position, the respondent’s own position on the same issue, and the self-rating on the liberal/conservative ideology scale. 2 The correlations are presented separately for the favored and opponent parties, which, as we noted, are determined by the respondent’s rating of party affiliation. The per-issue correlations appear in Table 2a in the online appendix.
Mean zero-order correlations between the perceived issue position of the party and the respondent’s issue position and liberal/conservative ideology (entire sample).
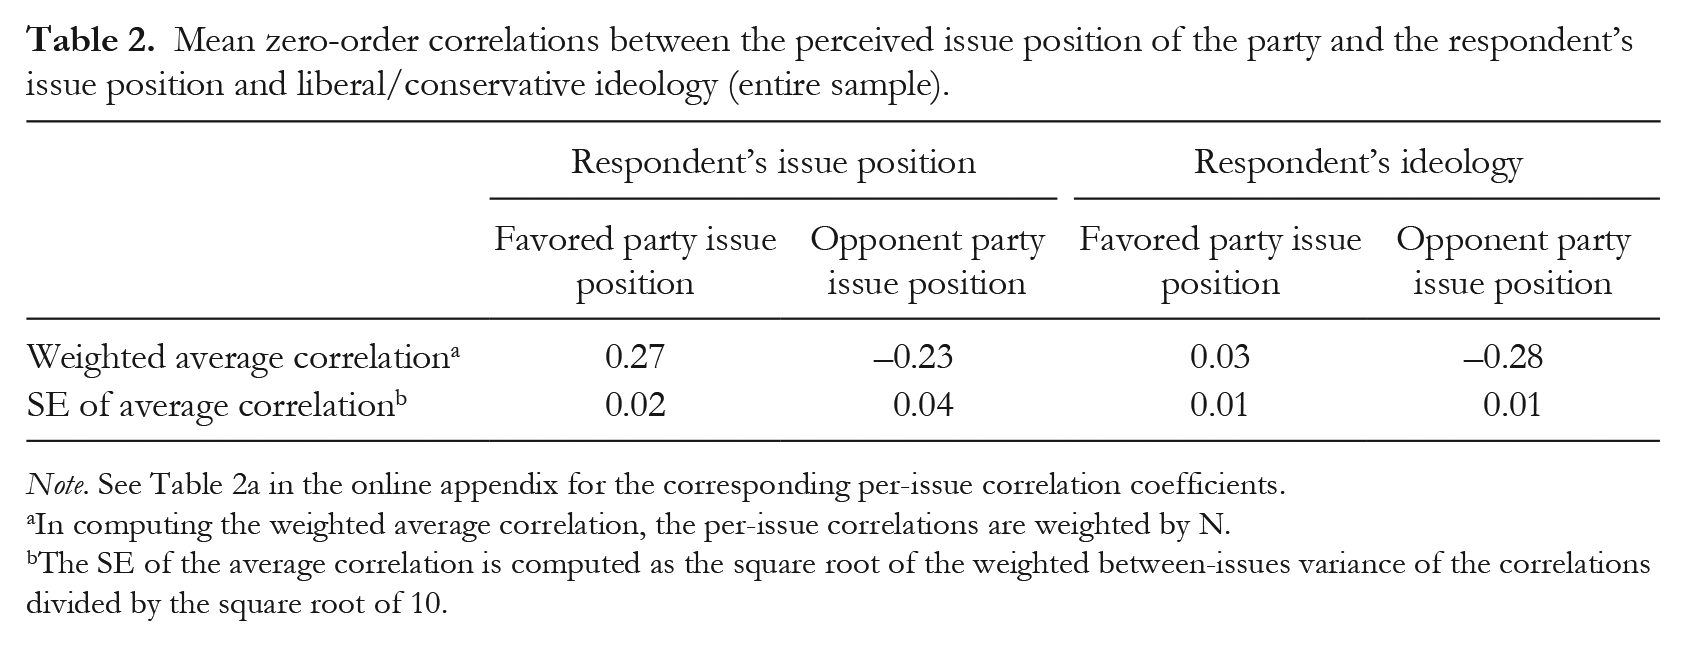
Note. See Table 2a in the online appendix for the corresponding per-issue correlation coefficients.
In computing the weighted average correlation, the per-issue correlations are weighted by N.
The SE of the average correlation is computed as the square root of the weighted between-issues variance of the correlations divided by the square root of 10.
Broadly, the findings are consistent for the ten issues. Respondents’ issue positions are positively correlated with perception of the favored party position on the issue (mean weighted r = .27, SE = 0.02) and negatively correlated with perception of the opponent’s party position (mean weighted r = −.23, SE = 0.04). The former is consistent with the hypothesis about convergence of own issue position and the judgment of the favored party position, the latter with the hypothesis about divergence of the own issue position and the judgment of the opponent party. The ideology was virtually uncorrelated with the issue positions attributed to the favored party (mean weighted r = .03, SE = 0.1) but was negatively correlated with perception of the positions of the opponent party (mean weighted r = −.28, SE = 0.01).
Despite broad consistencies observed, estimating convergence and divergence from these correlations is problematic for two reasons. First, the correlations are based on a sample containing both the congruent and incongruent respondents, who are hypothesized to differ in their strength of ideology and consequently in the magnitude of influence that ideology has on perception of party position. 3 Second, although the correlational analysis highlights the overall effect of ideology on party perception, it does not allow separation of the two routes of influence through which ideology can bias perception of favored and opponent parties. In particular, the correlational analysis cannot estimate the biasing influence of ideology on the perception of party issue position when the respondent’s issue position is controlled for. To overcome these difficulties, we next report the results of mixed-model analyses in which ratings of the issue positions attributed to the favored and opponent party are predicted simultaneously from respondents’ own issue position and ideology, and congruence is included as a factor in the design.
The Moderating Role of the Ideology/Affiliation Congruence
For each issue we regressed perception of the party’s issue position on the respondent’s own position on the issue and his/her ideology. This was done within a mixed model that included the favored and opponent parties as a repeated-measure factor, and the ideology/affiliation congruence as a between-respondents factor. 4 The coefficients derived from the ten issue-level analyses were combined meta-analytically using the procedure recommended by Schmidt and Hunter (2014).
From each issue analysis, we computed four influence coefficients, reflecting the prediction of the favored and the opponent party position from the respondent’s own issue position and his/her ideology. Since the effects of respondents’ own position and ideology were computed simultaneously for the favored/opponent parties in the congruent/incongruent subsamples, they were estimated based on the full model coefficients. The Appendix provides details of the estimation procedure. Table 3a in the online appendix presents the computed coefficients separately for each issue. Table 3 in this article presents the mean coefficients (averaged over the ten issues). In computing the [weighted] average coefficients, we weighted the different issues by the inverse variance of the coefficients computed per issue. The standard error of the average coefficient is estimated by the square root of the variances of the coefficients computed for the different issues divided by the number of issues.
Mean influence coefficients computed from the mixed model predicting the party’s issue position from the respondent’s issue position and ideology for the favored and the opponent parties by congruent and incongruent respondents.
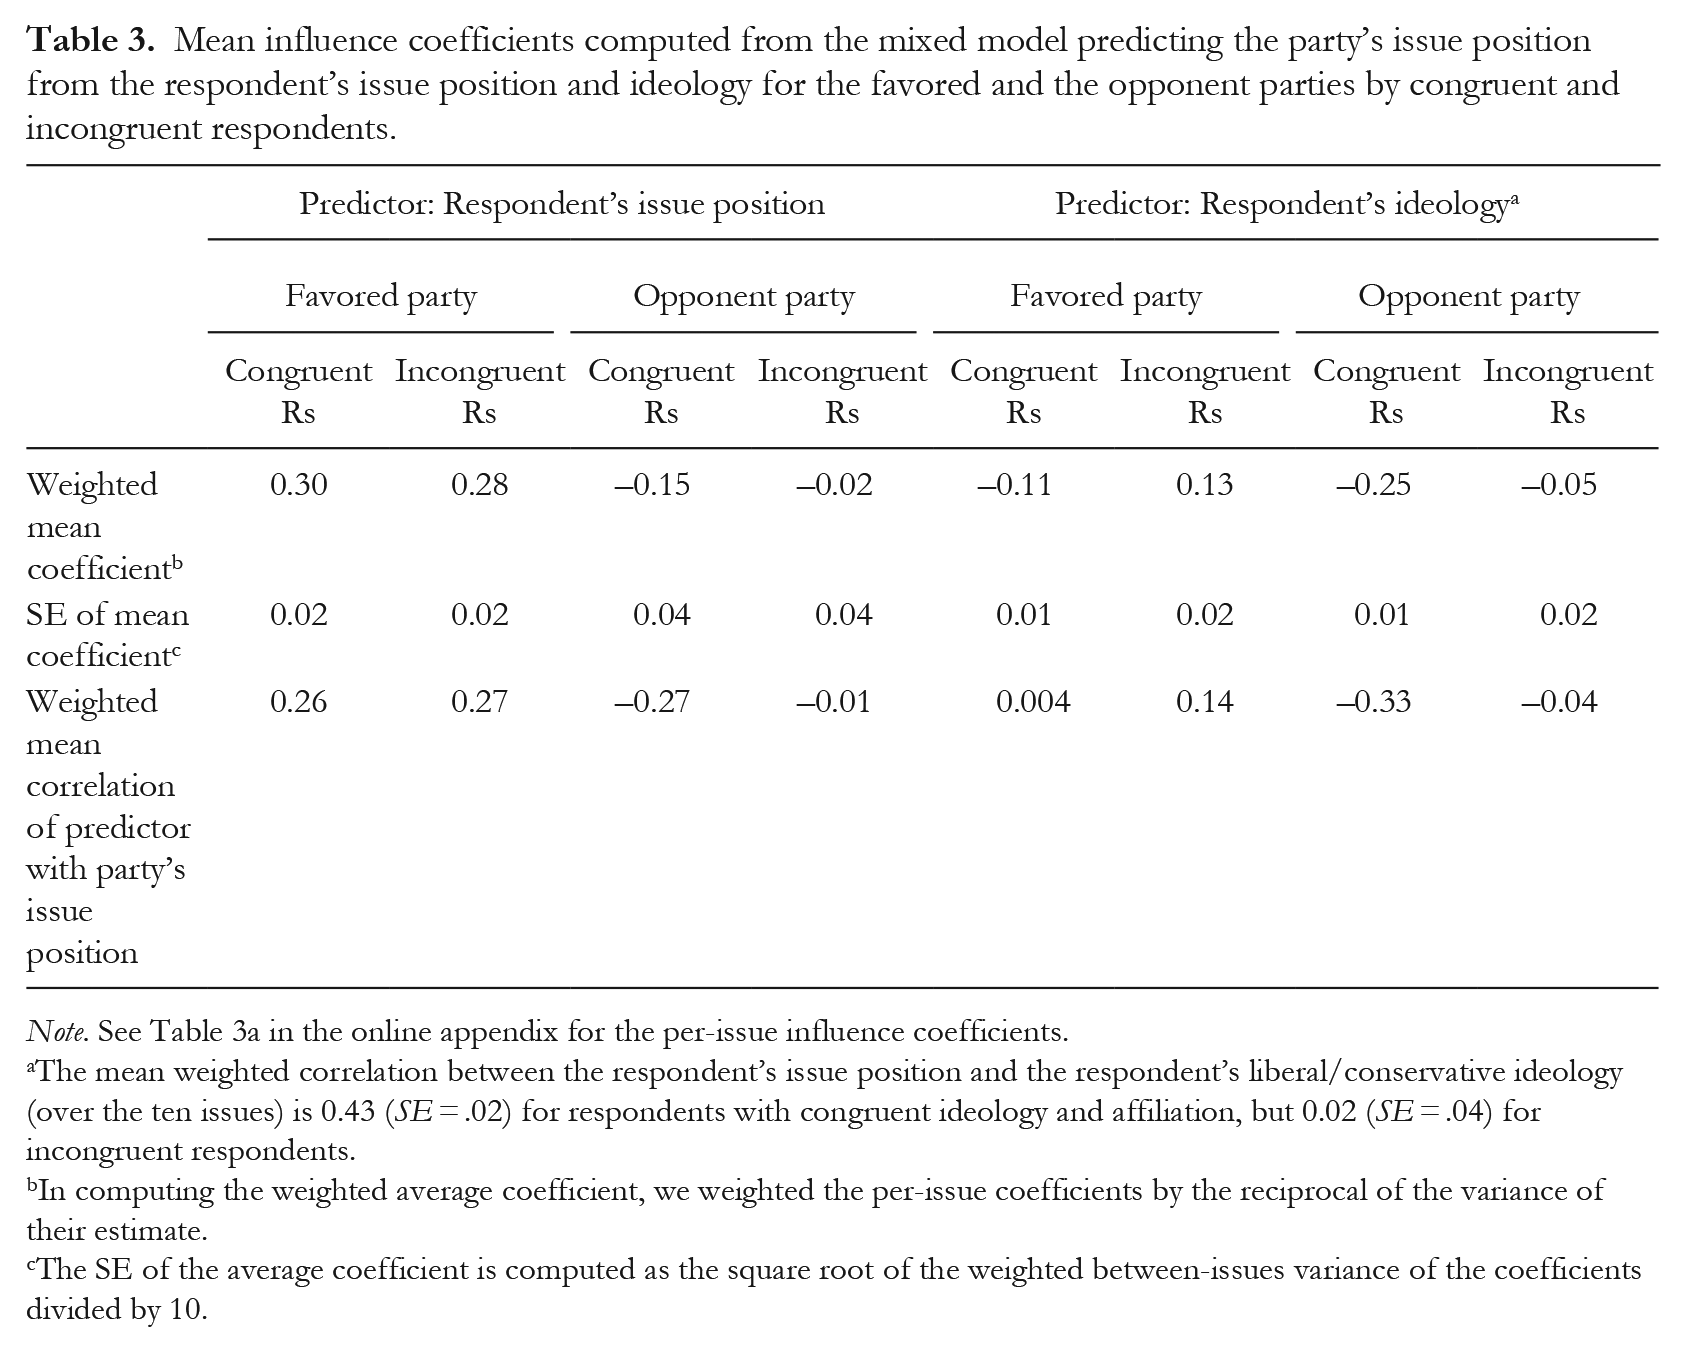
Note. See Table 3a in the online appendix for the per-issue influence coefficients.
The mean weighted correlation between the respondent’s issue position and the respondent’s liberal/conservative ideology (over the ten issues) is 0.43 (SE = .02) for respondents with congruent ideology and affiliation, but 0.02 (SE = .04) for incongruent respondents.
In computing the weighted average coefficient, we weighted the per-issue coefficients by the reciprocal of the variance of their estimate.
The SE of the average coefficient is computed as the square root of the weighted between-issues variance of the coefficients divided by 10.
Opponent party: Does ideology influence perception of the party’s issue positions? Does ideology strength moderate the effect?
The rightmost columns in Table 3 depict the estimates of coefficient d in Figure 1. There is a strong biasing influence of the ideology of congruent respondents (average b = −.25, SE = .01). That is to say, among the congruent respondents, those with more liberal views tended to perceive the issue positions of the Republican Party as more conservative, while those with more conservative views tended to perceive the Democratic Party’s positions as more liberal. This effect is evident across all ten issues, as shown in Table 3a in the online appendix. In contrast, incongruent respondents exhibited a different pattern, where party positions sometimes aligned with ideology (assimilation) and other times diverged from ideology (contrast), resulting in a near-zero average influence (average b = −.05, SE = .02). The 99% confidence interval (CI) for the differences between the ideology-triggered bias of congruent and incongruent respondents [−.26, −.13] supports the notion that respondents with stronger ideologies exhibit stronger bias. An alternative interpretation of this effect is discussed below.
Favored party: Does ideology influence perception of the party’s issue positions? Does ideology strength moderate the effect?
Table 3 indicates that when the effects of respondents’ own position are statistically controlled, the ideology-triggered bias coefficients differ as a function of congruence: They are significantly negative for congruent respondents (average b = −.11, SE = .01); they are significantly positive for incongruent respondents (average b = .13, SE = .02). The difference between the two types of respondents is significant, with a 99% CI [−.30, −.19]. The assimilative bias observed in incongruent respondents was expected, given the tendency to engage in similarity-focused processing when thinking about the favored party. The negative coefficient observed in the subsample of congruent respondents is surprising, as it may suggest that these individuals distance their assessment of the issue position of their favored party. However, it is important to consider that this coefficient should be interpreted in the context of the substantial correlation between the respondent’s ideology and their own stance on issues (average r = .43 among congruent respondents), which could result in significant suppression effects. We return to this phenomenon in the analysis of education, below.
Opponent party: Does own position influence perception of the party’s issue positions? Does ideology strength moderate the effect?
Table 3 reveals that the congruent respondents show a significant pattern of divergence—they increasingly distance the opponent party from their own position (coefficient b in Figure 1, average b = −.15, SE = .04). Own positions of incongruent respondents are virtually unrelated to the opponent party’s perceived positions (average b = −.02, SE = .04). Still, despite this numerical difference, the 99% CI for the difference between the congruent and incongruent respondents [−.28, .02] contains the null hypothesis, precluding strong inferences regarding the two populations of respondents. This caution is reinforced by inspection of the per-issue coefficients (Table 3a in the online appendix), which show large between-issues variation.
Favored party: Does own position influence perception of the party’s issue positions? Does ideology strength moderate the effect?
The left-side columns of Table 3 estimate the relationship between the respondent’s own position on an issue and the perception of the favored party issue position (coefficient a in Figure 1). On average, the respondent’s own position and the perception of the favored party’s position converged in the subsamples of congruent (average b = .30, SE = .02) and incongruent respondents (average b = .29, SE = .02). To illustrate, both congruent and incongruent respondents who hold more conservative positions regarding a specific issue tend to view their favored party as having a more conservative position on that issue. The data are consistent with the null hypothesis of no difference as a function of ideology/affiliation congruence—the 99% CI for the difference [−.07, .10]. Such an invariance to ideology/affiliation congruence is expected if the influence of respondent position has strong interpretation and response-scale components (Judd et al., 1983).
Interim summary
To sum up, our analyses investigate how the strength of ideology affects the biases involved in the issue positions attributed to the favored and opponent parties. This is done by comparing congruent respondents (whose party affiliation aligns with their ideology) and incongruent respondents (whose party affiliation contradicts their ideology). We assume that the ideology of congruent respondents is stronger, a premise we further discuss below.
When we consider the impact of ideology on the perception of party position through the direct routes (i.e., after controlling for own issue position, coefficients c and d in Figure 1), congruent respondents (but not incongruent ones) tend to distance the issue position of the opponent party away from themselves—a clear contrast bias. Yet, incongruent respondents (but not congruent ones) tend to assimilate the position attributed to the favored party to their ideology. Importantly, the findings suggest that the congruent and the incongruent respondents may not differ in the coefficients indicating convergence/divergence between one’s own view and the view attributed to the party (i.e., coefficients a and b in Figure 1). This finding aligns with our suggestion that question-wording and scale effects play a significant role in shaping these relationships.
The Role of Party Affiliation
Notwithstanding, the validity of our terminology must be examined. By construction, the subsample of congruent respondents confounds two characteristics—strength of ideology and strength of party affiliation—and as expected, respondents with stronger liberal [conservative] ideology tend to affiliate more strongly with the Democratic [Republican] party (r = .74, N = 24,378 in the ANES sample). This raises the possibility that the phenomenon we termed “the biasing effect of ideology” should, in fact, be attributed to party affiliation (Iyengar & Westwood, 2015; Mason, 2018). To examine this question, we computed the [partial] correlation between perception of party issue positions and ideology, controlling for party affiliation, and the [partial] correlation between perception of party issue positions and affiliation, controlling for ideology. This was done separately for the favored and the opponent parties.
Table 4 presents the weighted means of these partial correlations averaged over issues (Table 4a in the online appendix presents the per-issue correlations). The entries in Table 4 show two noteworthy trends. First, considering perceptions of the opponent party, ideology triggers a strong contrast (e.g., more liberal respondents attribute to the opponent party more conservative views); by comparison, party affiliation is virtually unrelated to the way the opponent party is perceived. Accordingly, with respect to perception of the opponent party positions, ideology seems a more potent predictor than party affiliation (cf. West & Iyengar, 2022). Second, whereas the perceived positions of the favored party are assimilated to ideology, they are contrasted with party affiliation. This has two implications. First, there is a stronger polarization of the views of the favored and opponent parties as a function of ideology than as a function of party affiliation. Second, such divergence provides another reason why the total effect of ideology is variable and weak.
Average per-issue partial correlations a between perceived party position and ideology or affiliation.
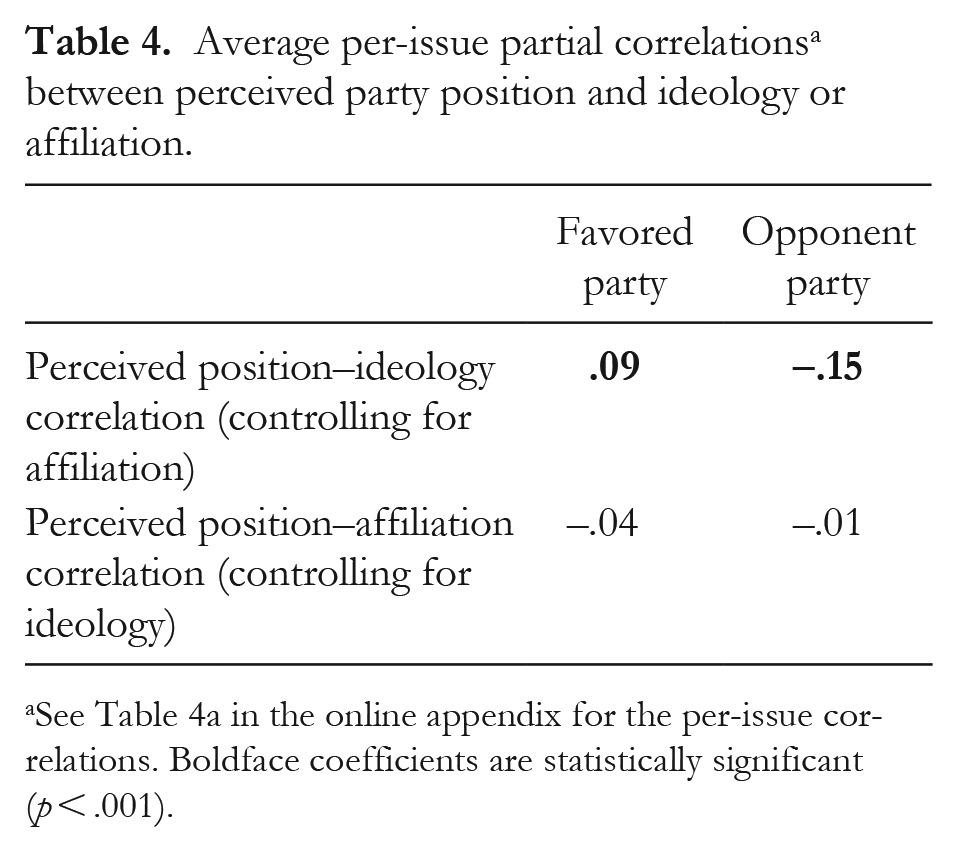
See Table 4a in the online appendix for the per-issue correlations. Boldface coefficients are statistically significant (p < .001).
Accordingly, the above analyses are consistent with the idea that in the framework of assimilation/contrast processes that we are considering, the ideology of congruent respondents is stronger than that of incongruent respondents. Still, it is clear that congruent and incongruent respondents differ in many characteristics besides strength of ideology. Therefore, before delving further into the discussion on ideology strength, it is important to replicate these findings using different conceptualizations of ideology strength. The next two sections focus on the subsample of congruent respondents in an attempt to investigate whether the finding that respondents with stronger ideology show stronger contrast in their perception of the opponent group generalizes to other variants of ideology strength. In the next section, we compare respondents with higher and lower education levels, assuming that higher education is associated with a stronger, more coherent ideology. Then we examine respondents with varying degrees of behavioral involvement in political campaigns, assuming that more involvement is associated with stronger ideology. We hypothesize that greater ideological coherence or strength leads to stronger contrasting influences of ideology on the perception of the opponent party.
The Moderating Role of Education for Congruent Respondents
We classified respondents according to their level of education, either below college (coded as −1) or college and above (coded as +1). The proportion of below-college respondents varied among the samples that answered questions about the different issues, ranging from 36% to 53%, with a mean of 40% (see Table 5a in the online appendix). To investigate the effect of college education, we analyzed only respondents with congruent affiliation/ideology. Analysis was carried out within a mixed model whereby the position attributed to the favored and opponent parties (a repeated-measure factor) was predicted from the respondent’s own issue position, ideology, and college education as a between-respondents factor. As in the previous analyses, for each respondent we computed four influence coefficients reflecting the effect of the respondent’s issue position and his/her ideology on the issue positions attributed to the favored and opponent parties. The effects were computed in an analogous way to the procedure outlined in the appendix. Table 5a in the online appendix presents the coefficients associated with the respondents’ issue position and ideology, separately for each issue. Table 5 presents the weighted mean coefficients.
Mean per-issue influence coefficients computed from the mixed model predicting the party’s issue position from the respondent’s issue position and ideology for the favored and opponent parties by congruent respondents with and without college education.
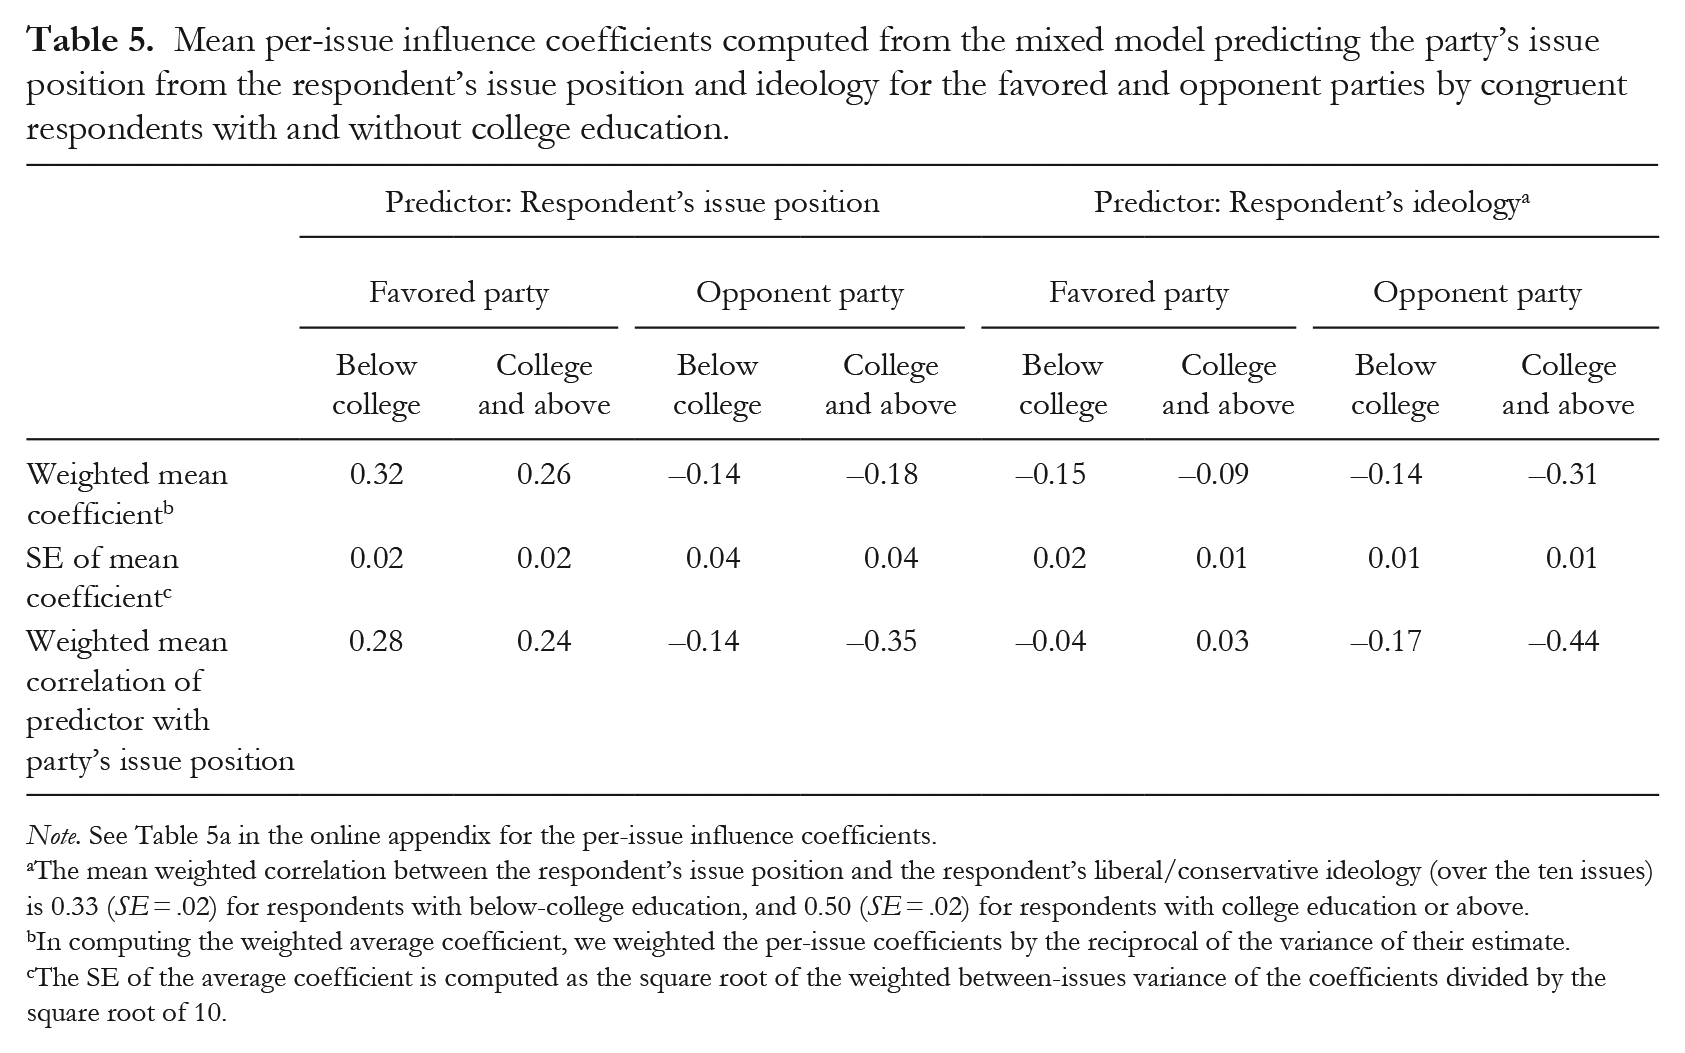
Note. See Table 5a in the online appendix for the per-issue influence coefficients.
The mean weighted correlation between the respondent’s issue position and the respondent’s liberal/conservative ideology (over the ten issues) is 0.33 (SE = .02) for respondents with below-college education, and 0.50 (SE = .02) for respondents with college education or above.
In computing the weighted average coefficient, we weighted the per-issue coefficients by the reciprocal of the variance of their estimate.
The SE of the average coefficient is computed as the square root of the weighted between-issues variance of the coefficients divided by the square root of 10.
Opponent party: Does ideology influence perception of the party’s issue positions? Does ideology strength moderate the effect?
Table 5 reveals an ideology-triggered contrast bias that is moderated by the level of education. Specifically, the right-side columns indicate that after controlling for the respondents’ own issue position, the ideology of respondents with college education had a stronger contrast effect on perception of the opponent party (b = −.31, SE = .01) than did the ideology of those without college education (b = −0.14, SE = .01), with a 99% CI for the difference [−0.21, −0.13]. This is consistent with the suggestion that the ideology of respondents with higher education is stronger in the sense of being more coherent, and consequently, it is associated with a stronger contrast effect. 5
Favored party: Does ideology influence perception of the party’s issue positions? Does ideology strength moderate the effect?
Level of education also moderated the perception of the favored party. Compared to respondents with below-college education (b = −.15, SE = −.02), those with college education show a reduced (yet statistically significant) effect of ideology (b = −.09, SE = .01). The 99% CI for the difference between the two subsamples [0.001, 0.12] does not include zero. The difference due to level of education is further supported when we examine the per-issue coefficients (Table 5a in the online appendix). For nine out of ten issues, ideology has a more negative coefficient in the below-college subsample. Similar to the examination of congruence discussed previously, the size of the negative coefficients should be considered in the context of the correlations between the respondents’ ideology and their personal stance on issues (r = .57 in the subsample with below college education, r = .33 in the subsample with college education and above), which could result in stronger suppression in the former subsample.
Favored/opponent party: Does own position influence perception of the party’s issue positions? Does ideology strength moderate the effect?
Numerically, below-college respondents show stronger convergence (b = .32, SE = .02) than do respondents with college education (b = .26, SE = .02). Yet we cannot exclude the possibility that these two effects are identical, as the 99% CI [−.15, .04] includes 0. Analogous patterns appear for ratings of the opponent party. The issue position attributed to the opponent party tended to diverge from the respondent’s position, numerically more by those with college education (b = −0.18, SE = .04) compared to respondents without college education (b = −0.14, SE = .04). Again, despite the numerical differences, our findings are consistent with the proposition that college education has no moderating influence, as the 99% CI for the difference [−0.19, 0.13] was fairly wide and included 0. Accordingly, we cannot reject the null hypothesis, which suggests that the influence of respondent’s issue position on the perception of party’s issue position is not moderated by education.
The moderating role of participation in campaign activities
Respondents indicated whether they have engaged in each of five campaign activities. Based on their responses, they were classified into three subsamples: those who did not engage in any activity, those who engaged in exactly one activity, and those who engaged in two or more activities. The analyses below examine whether the ideology of those who engaged in more activities has stronger contrastive influence on the perception of parties. To investigate this question, we analyzed only respondents with congruent affiliation/ideology within a mixed model whereby the position attributed to the favored and opponent parties (a repeated-measure factor) was predicted from the respondent’s own issue position, ideology, and number of campaign activities as a between-respondents factor. As in the previous analyses, for each respondent we computed four influence coefficients reflecting the effect of the respondent’s issue position and ideology on the issue positions attributed to the favored and opponent parties. Table 6a in the online appendix presents these coefficients for each issue. Table 6 in this article presents the mean coefficients over issues.
Mean per-issue influence coefficients computed from the mixed model predicting the party’s issue position from the respondent’s issue position and ideology for the favored and opponent parties and the number of campaign activities of the respondent.
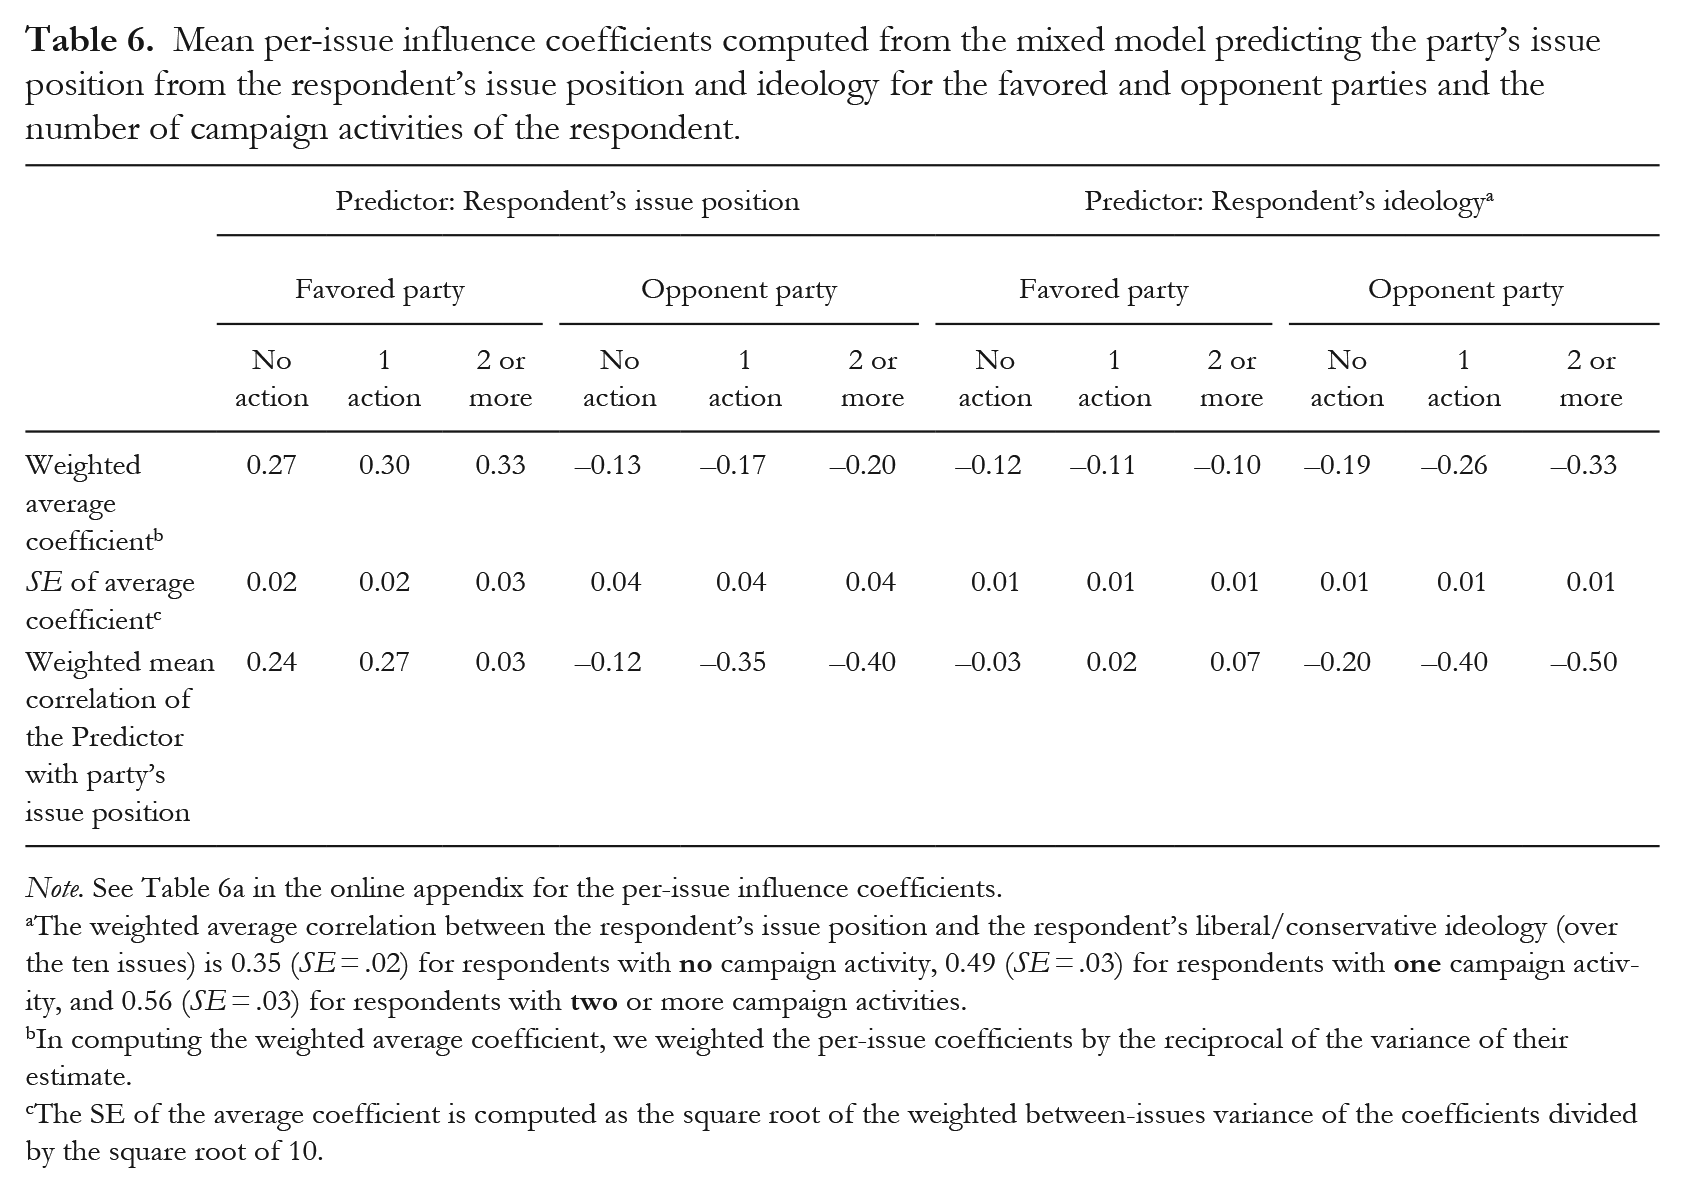
Note. See Table 6a in the online appendix for the per-issue influence coefficients.
The weighted average correlation between the respondent’s issue position and the respondent’s liberal/conservative ideology (over the ten issues) is 0.35 (SE = .02) for respondents with
In computing the weighted average coefficient, we weighted the per-issue coefficients by the reciprocal of the variance of their estimate.
The SE of the average coefficient is computed as the square root of the weighted between-issues variance of the coefficients divided by the square root of 10.
Opponent party: Does ideology influence perception of the party’s issue positions? Does ideology strength moderate the effect?
The entries in Table 6 suggest that as in previous analyses, once the effect of own position is statistically controlled, ideology biases the perception of the opponent party, and this bias increases from the subsample of respondents with zero activities (average b = −.19, SE = .01), to those with exactly one activity (b = −.26, SE = .01), to the subsample of respondents with two or more activities (b = −.33, SE = 0.10). The 99% CI [−.18, −.10] for the differences in magnitude of the ideology-triggered influence between the subsample of respondents with zero activities and those with two or more clearly reveals a stronger contrast bias in the latter subsample. Inspection of the entries in Table 6a in the online appendix reveals that the pattern of this effect was highly consistent over issues, occurring for all ten issues.
Favored party: Does ideology influence perception of the party’s issue positions? Does ideology strength moderate the effect?
Unlike perceptions of the opponent party, the ideology-induced influence on the perception of the favored party seems invariant to the level of involvement in campaign activities. The three subsamples show virtually identical levels of influence (−.12, −.11, −.10), and the 99% CI for differences in the effects in the subsamples of zero activities and two or more is narrow and around zero [−.04, −.06].
Opponent party: Does own position influence perception of the party’s issue positions? Does ideology strength moderate the effect?
The findings reveal the expected pattern of divergence, with respondents holding more liberal [conservative] positions perceiving the opponent party as more conservative [liberal]. But although the numerical magnitude of these relationships increased with the level of engagement in campaign activity, we cannot reject the null hypothesis of no moderation by level of campaign activity. In particular, the 99% CI [−.24, .10] for the differences in the effects in the subsamples of zero activities and two or more activities was not informative, precluding strong statements about moderation of action involvement. Thus, as in the two previous analyses (where ideology strength was indicated by ideology/affiliation congruence and by college education), the findings are consistent with the null hypothesis, which states that the magnitude of relationship between the respondent’s issue position and his/her perception of party issue position is not moderated by ideology strength.
Favored party: Does own position influence perception of the party’s issue positions? Does ideology strength moderate the effect?
Consistent with previous analyses, individuals’ own position and the perceived position of the favored party converge, namely, respondents whose own position on an issue was more liberal [conservative] attributed more liberal [conservative] views to their favored party. Importantly, this association was similar for the three subsamples. In particular, the 99% CI for the difference between respondents with zero activities and those with two or more activities [−.04, .16] is wide and includes the zero point. Consequently, once again, we cannot reject the null hypothesis that ideology strength, here conceptualized as level of involvement in campaign activity, moderated the relationship between individuals’ own position and their perceived party positions.
Discussion
Our research seeks to explore how ideology affects the perceptions about parties’ issue positions. Figure 1 portrays two routes through which ideology can influence such perceptions, indirect (through the respondent’s own position on the specific issue) and direct, in a route unrelated to one’s own issue position. The indirect route capitalizes on processes that have been documented in the past, specifically, informational effects (e.g., Biernat, 2005; Bisgaard & Slothuus, 2018; Ledgerwood & Chaiken, 2007; Satherley et al., 2018; Waldfogel et al., 2021) and response-level effects (e.g., Biernat, 2005; Hare et al., 2015; Judd et al., 1983; Upshaw, 1965). Broadly, the current findings indicate that the judgments of the issue position attributed to the favored party and judgments of one’s own position tend to converge (for the favored party) or diverge (for the opponent party), and, importantly, these patterns appear to be largely unaffected by the strength of ideology. This is consistent with the suggestion that such convergence and divergence are affected to a large extent by shared meanings and response-scale anchoring.
By controlling for the effects of respondents’ own positions, we were able to isolate the unique biasing influences of ideology, which are not attributed to these factors. The overall results reveal a consistent pattern across the ten different issues that we examined. Specifically, when respondents’ issue positions are statistically controlled, (i) perception of the opponent party’s position is contrasted away from one’s own ideology; and (ii) this bias in perception increases in magnitude for respondents with stronger ideology. In contrast to the robust influence that ideology has on perceptions of the opponent party, its influence on perceptions of the favored party is weaker and inconsistent across the three markers of ideology strength.
Why is the effect of ideology strength so different on assessments of the opponent and favored party? We believe that such a pattern reflects the two opposite forces associated with ideology strength: (i) a stronger biasing force that comes into play especially in perceptions of the opponent party, and (ii) a stronger resistance to bias (reflecting more knowledge and less ambiguity) that comes into play especially in perceptions of the favored party.
The net effect of these forces is that ideology strength is associated with increased bias against the opponent party, but weaker or no bias in relation to one’s favored party (Devine, 2015). This suggestion is consistent with the research of Abramowitz and Webster (2016) on affective polarization, who concluded that “A growing proportion of Americans dislike the opposing party more than they like their own party” (21). Similarly, Tyler and Iyengar (2023) concluded recently that partisan polarization is primarily due to distrust of the opponent party. The two outcomes, namely perception (of issue position) and affect, work in tandem and feed each other. The more one dislikes or distrusts the opponent party, the greater the tendency to focus on dissimilarities, and therefore, the more perceptually distant the opponent party becomes. At the same time, an opponent party that is viewed as more dissimilar triggers more negative affect. Both processes therefore result in a distancing of the opponent party.
Bias and Discrimination
The asymmetry we find between the ideology-triggered biased perception of favored and opponent parties is almost a mirror image of the findings reported by the rich literature on expression of intergroup discrimination. With a few exceptions (e.g., Lehr et al., 2019), this literature suggests that intergroup discrimination takes the form of ingroup favoritism much more than outgroup hostility (see reviews in Brewer, 2017; Greenwald & Pettigrew, 2014). Yet, our research suggests that ideology produces more pressure to distance oneself from the outgroup (i.e., contrast) than to feel closer to the ingroup (i.e., assimilation). Of course, there are many differences between acts of discrimination and reports of issue positions. We speculate that one central difference has to do with the amount of pressure that cultural norms of nondiscrimination have on the variables of interest.
The principle of nondiscrimination is one of the pillars of any democratic system. The Universal Declaration of Human Rights proposes that “All human beings are born free and equal and should be treated the same way.” Human-rights laws clearly recognize that nondiscrimination is a core tenet. Accordingly, social norms dictate that we are obliged to refrain from actions that might create situations of discrimination. Negative acts of hostility toward outgroup members, merely because they belong to an outgroup, are therefore strongly discouraged by nondiscrimination norms. Biased perceptions, however, are exempt from such pressures, because there is no clear yardstick to indicate veridical perception. If perception does not severely violate reality constraints, it is hardly censored by social norms. As a result, hostility is more easily captured by negative perceptions than by negative actions.
Moreover, at least when it comes to social perception, we often have no way of knowing what is true (e.g., what the party’s true position is on an issue). Lupyan (2017) suggests that the goal of perception in such cases is knowing what is true enough. Indeed, for most respondents the judgments of parties’ issue positions are reasonable, in the sense that the position attributed to the Democratic party is more liberal than that attributed to the Republican party. Still, a biased perception of opponents, be they political adversaries, business competitors, or social antagonists, might have significant consequences. Seeing the opponent as more dissimilar to oneself reduces one’s inclination to cooperate (Koch et al., 2020) and increases dislike (Mallinas et al., 2018) and discrimination (Sinclair et al., 2023).
Ideally, biased perceptions could be reduced by making people more knowledgeable about their opponents. But such an ideal might be difficult to achieve for two reasons. First, it is often the case that variables associated with increased knowledge are also associated with increased bias. To illustrate, although college education increases political sophistication, it also increases one’s ability to reason in a motivationally congruent fashion. Second, in a period of misinformation, it is becoming increasingly difficult to separate truth from falsehood (Jerit & Zhao, 2020). As a result, biased perception increases rather than decreases by exposure to one’s choice of information outlets (see below).
Limitations
Lastly, let us acknowledge a few limitations and directions for future research. Our study involves analyses of the US political system, which is characterized by a two-party system, involving parties that differ in their position on the liberal/conservative continuum. This is not the case in other political ecologies where the political competition may involve parties with similar rather than dissimilar ideology (Reiljan, 2020). In such ecologies it might be possible to disassociate ideological discrepancies from affective discrepancies and examine the contribution of both.
Second, our study involves ten different political issues that could be projected on the liberal/conservative continuum. The findings suggest that there are considerable inter-issue differences, and in future research we plan to investigate whether and how these differences are related to their association with the ideological dimension.
Third, our conclusions are based on analyses of data collected by a major survey organization (ANES) around the times of national elections. In such surveys the motivation for accuracy might be overpowered by the desire to express extreme positions. It is of interest to examine how different epistemic motivations (e.g., Bayes et al., 2020; Molden & Tory Higgins, 2012) interact in affecting the assimilation and contrast observed in the present findings.
Finally, the current study is based on data collected between 1968 and 2012. It is likely that while the processes involved in assimilation and contrast as well as in convergence and divergence remained relatively stable over the years, the environmental context has evolved significantly, introducing greater complexity and uncertainty into the model’s parameters in the current time. In particular, the advancements in technology, especially the internet and social media, have led to a substantial increase in the availability of valid and false political information in recent years. This abundance of information enables individuals to easily access sources that align with their existing views, contributing to the formation of echo chambers where individuals are disproportionately exposed to information and opinions that reinforce their own perspectives (e.g., Bandy & Diakopoulos, 2023; Clemm von Hohenberg, 2023; Garrett, 2009; Stroud, 2008). Concurrent with these trends, there has been a rise in ideological sorting, characterized by an increasing proportion of people whose ideology and party affiliation are congruent (Gallup, 2023; Weber & Klar, 2019). It is likely that the coefficients observed in our study may need to be adjusted to account for these trends. Future research should explore whether the effects of ideological strength on perception of the favored, and especially the opponent party, become stronger as the information ecology allows for more bias.
Supplemental Material
sj-docx-1-gpi-10.1177_13684302241264420 – Supplemental material for Divergent views of party positions: How ideology and own issue position shape party perception through convergence and divergence processes
Supplemental material, sj-docx-1-gpi-10.1177_13684302241264420 for Divergent views of party positions: How ideology and own issue position shape party perception through convergence and divergence processes by Yaacov Schul and Yoav Ganzach in Group Processes & Intergroup Relations
Footnotes
Appendix
Schematic table of the coefficients from the mixed-model analysis predicting party’s issue position.
Funding
The author(s) received no financial support for the research, authorship, and/or publication of this article.
Supplemental Material
Supplemental material for this article is available online.
Notes
References
Supplementary Material
Please find the following supplemental material available below.
For Open Access articles published under a Creative Commons License, all supplemental material carries the same license as the article it is associated with.
For non-Open Access articles published, all supplemental material carries a non-exclusive license, and permission requests for re-use of supplemental material or any part of supplemental material shall be sent directly to the copyright owner as specified in the copyright notice associated with the article.