
Abstract
People tend to think of the prototypical person as a man more than as a woman, but this bias has primarily been observed in language-based tasks. Here, we investigated whether this bias is also present in the mental imagery of faces. A preregistered cross-cultural reverse-correlation study including participants from six WEIRD and non-WEIRD countries varying in gender equality (i.e., China, Ghana, Norway, Pakistan, Turkey, and the US; N = 645) unexpectedly suggested that people imagine the face of a generic “person” more as a woman than as a man. Replicating this unexpected result, a second preregistered study (N = 115) showed that U.S. participants imagine the face of a typical person as being more similar to their imagined face of a woman than of a man. We discuss explanations for these unexpected findings, including the possibility that the prototypical person is male-biased—consistent with previous work—but the default face may be female-biased.
Androcentrism refers to the tendency to center men and prioritize men’s experiences, well-being, goals, and values in society while relegating women and other genders to the periphery (Bem, 1993; de Beauvoir, 1949/2010). In terms of psychological process, it involves thinking of men as more (proto)typical than women of generic person categories while thinking of women as “gender specific” (Bailey et al., 2019). Centering men as the typical person contributes to gender inequality (D. L. Hamilton et al., 2015). For instance, testing car safety only with men as models is thought to contribute to an increased risk of death in car crashes for women (Criado-Perez, 2019).
Despite the importance of androcentrism, the phenomenon has received less attention in psychology compared to other forms of gender bias (e.g., gender prejudice), and has mostly been investigated with language-based tasks and surveys (Bailey et al., 2019). Androcentrism has also been mainly examined in WEIRD contexts (i.e., Western, educated, industrialized, rich, and democratic; Heinrich et al., 2010). The current investigation examined androcentrism in people’s mental imagery of the face of a generic “person” in six WEIRD and non-WEIRD countries. We utilized the reverse-correlation task, an effective technique to measure and visualize biases (Lei & Bodenhausen, 2017).
Prior Research on Androcentrism
Interdisciplinary theories of androcentrism argue that men tend to be represented as generic people while women are represented as gender-specific (Bailey et al., 2019; Bem, 1993; de Beauvoir, 1949/2010). For instance, a large-scale analysis of text on the internet found that words for generic people are used in more similar linguistic contexts as words for men than as words for women (Bailey et al., 2022). U.S. English-speaking participants tend to use generic labels (e.g., person) to describe male characters, but gender-specific labels for female characters (e.g., woman; M. C. Hamilton, 1991). Similarly, Russian speakers used neutral terms about 20% of the time to describe male characters, but less than 1% of the time to describe female characters (Pashkova, 2018). U.S. participants’ stereotypes about generic country categories, such as “the British,” align closely with stereotypes about British men (Eagly & Kite, 1987). Evidence for this tendency to think of a person as a man more than as a woman emerges about a range of different race/ethnicity groups but may be less pronounced for beliefs about Asian people (Ghavami & Peplau, 2013; Schug et al., 2015).
Men participants often display more androcentrism than women (e.g., Bailey et al., 2020; for exceptions, see Eagly & Kite, 1987; Thorne et al., 2015). For example, men are more likely than women to describe men upon receiving a gender-neutral prompt, to select male representatives for a gender-inclusive category, and to associate “person” with men in an Implicit Association Test (IAT; Bailey et al., 2020; Bruckmueller et al., 2012; Gastil, 1990; M. C. Hamilton, 1991; Hegarty et al., 2011; Khosroshahi, 1989; Moyer, 1997; Switzer, 1990). In one study, when asked to come up with a typical person, men almost exclusively listed a man, while half of the women listed a man (Bailey & LaFrance, 2016). These results indicate gender differences in androcentric thinking.
Much of this prior research has focused on androcentrism in language, and investigated androcentric thinking using measures that rely on participants producing, classifying, or reasoning about words. Language practices themselves codify androcentrism. Several languages, including English, have masculine generic terms, such as “man,” “guys,” and “he,” that are used both to refer to men specifically and to people in general without parallel usage of terms for women (Hellinger & Bußmann, 2002; MacArthur et al., 2020). For instance, in everyday speech, college students often use “guys” (e.g., but not “gals” or “girls”) to refer to mixed gender groups (MacArthur et al., 2020). Although masculine generic terms are often used to refer to people of all genders, they bring men to mind (Ansara & Hegarty, 2013; Bigler & Leaper, 2015; Bodine, 1975; Sczesny et al., 2016). Some researchers have thus argued that language is critical to androcentric thinking more broadly (Hegarty et al., 2013; Pashkova, 2018; Thorne et al., 2015).
Little prior work has addressed androcentrism in mental imagery rather than in language. Vlasceanu and Amodio (2022) showed that online search algorithms for a “person” produced male-oriented image output, which arguably may reflect the androcentrism of its users. Some evidence suggests that, as in lexical tasks, men participants show more androcentrism in imagery than women. For instance, Bailey and LaFrance (2016) found that U.S. men participants were more likely to select images of men as representations of humanity, while women did not differ from chance. Gastil (1990) asked a small sample (< 100) of U.S. undergraduate students to read sentences aloud and explain the image that appeared in their minds. The supposedly inclusive term “they” resulted in men producing mainly images of men. Thus, some prior work has considered androcentrism in imagery, and generally found similar patterns as in lexical tasks. However, the methods used were limited in demonstrating spontaneous mental representations of faces because they utilized indirect data (e.g., online search results) or still relied on language production (e.g., by asking participants to describe images verbally).
Investigating Androcentrism Using the Reverse-Correlation Technique
The reverse-correlation technique is a procedure that is frequently used to assess participants’ spontaneous mental imagery that does not rely on language production. To investigate androcentrism, the present studies used the two-image forced-choice variant established by Dotsch and Todorov (2012). In this method, participants are shown two images generated from the same base image, but each with a different pattern of random noise overlaid. In hundreds of trials, participants must repeatedly select which image resembles a target category best. After completion of the task, aggregate images can be generated that are thought to reflect participants’ mental representation of the face of the target category (Dotsch & Todorov, 2012).
Previous work shows this technique is well suited to uncover biases about social categories (Dotsch et al., 2008; Fiset et al., 2007; Imhoff et al., 2011; Krosch & Amodio, 2014). For instance, within the gender domain, people represented feminist women’s faces as looking more masculine compared to women with “moderate” gender-related attitudes (Gundersen & Kunst, 2018). Moreover, the technique has uncovered that individuals are visually represented in a gendered manner depending on their occupation (e.g., physicists vs. language teachers; Degner et al., 2019) and social status (e.g., leaders vs. nonleaders; Giacomin et al., 2022; Sun et al., 2021). In addition, reverse-correlation studies have identified how certain emotional expressions in faces are disproportionally associated with specific genders (Brooks et al., 2018). Beyond face perception, even gendered body types can be revealed using the technique (Lick et al., 2013). Thus, the reverse-correlation method seems well suited to assess a variety of gender biases, making it an appropriate tool for investigating androcentrism.
Investigating androcentrism in the mental imagery of faces is important for several reasons. For gender and other social identities, physical cues often play a role in evaluations beyond the effects of categorization per se (Deaux & Lewis, 1984; Eagly et al., 1991). For instance, the presence and strength of different gender-typical facial cues can predict unique discriminatory behavioral inclinations and stereotypes (e.g., Giacomin et al., 2022). Whereas testing these unique consequences is beyond the scope of the present paper, these previous studies emphasize the social importance of investigating mental imagery of faces. Furthermore, because participants are not directly asked about gender in the reverse-correlation task, it provides a relatively implicit (i.e., indirect) measure of potential bias. Previous work shows that people tend to project certain facial features to what they perceive as the typical face of superordinate categories, and that this tendency can be observed even among those who show no such bias on explicit tasks (Imhoff et al., 2011). Also, in the gender domain, biases at the level of mental representations are often only partly consistent with biases on explicit measures (Brooks et al., 2018; Degner et al., 2019; Gundersen & Kunst, 2018).
Investigating Androcentrism Cross-Culturally
In addition to the scarcity of research on androcentrism in mental imagery, much of the prior work has focused on the US or Western European context (for reviews, see Bailey et al., 2019; Sczesny et al., 2016), with a few non-Western country investigations (Ng, 1990; Pashkova, 2018; Vlasceanu & Amodio, 2022). Thus, the cross-cultural prevalence of this bias is not well understood. Cross-cultural research can also inform our understanding of factors that exacerbate androcentrism. Some have argued that historically rooted cultural differences in gender inequality may influence androcentrism (Hibbs, 2014). This notion is plausible because cultural differences in gender inequality have been linked to various gendered outcomes (Naidu & Chand, 2017). Cultures also differ in their responses to gender inequality, which may influence androcentrism (see Kinias & Kim, 2012; Vlasceanu & Amodio, 2022).
The Gender Inequality Index (GII) is a metric for quantifying cultural differences in gender equality between countries, with higher values indicating increased disparities between women and men (United Nations Development Programme, 2019). The index is measured through three key aspects: reproductive health, empowerment, and economic status. For the first study presented in this manuscript, six countries that demonstrate a wide range of rankings on this index were strategically chosen (Norway = .044, China = .136, the US = .182, Turkey = .305, Ghana = .541, and Pakistan = .547). This variation can give us key information about whether and how androcentrism varies across diverse cultural contexts. If the findings are similar across cultures, androcentrism (or the absence of it) in mental imagery may represent more of a fundamental process that emerges relatively independent of culture. If the findings show systematic variation across cultures, it could be considered a more culturally malleable phenomenon. The ability to assess the relative cultural influence is a strength of the present cross-cultural design and broad selection of countries.
The Present Research
Prior work has mainly focused on androcentrism in language-related tasks and single countries with disproportionate representation from Western contexts (i.e., WEIRD cultures; Heinrich et al., 2010). Thus, a systematic and cross-cultural investigation of androcentrism in mental imagery of faces is lacking, especially with participants from countries with diverse gender inequality ratings. Two preregistered studies aimed to fill these gaps. The first preregistered two-step study aimed to assess androcentrism in mental imagery of faces cross-culturally (including WEIRD and non-WEIRD countries), utilizing the reverse-correlation method with data-driven machine-learning ratings corroborated by human ratings. In the image generation step (Step 1), participants from six countries completed a revere-correlation task, resulting in a single image for each participant approximating their imagined face. In the image gender ratings step (Step 2), a machine-learning algorithm and human raters rated these images. The second study aimed to replicate the main findings from the first study in a U.S. sample, using an adapted method to rule out alternative explanations.
In the present research, it is also essential to note that both studies used a racially White base image in the reverse-correlation tasks. We discuss the rationale for this methodological approach in the Method section, and return to its limitations in the General Discussion section. Although stimuli based on White base images can produce substantial racial variation in classification images in reverse-correlation tasks (e.g., Dotsch et al., 2008; Kunst et al., 2022), the results must be interpreted in light of this constraint. Whereas our results may reflect participants’ tendency to visualize a typical “person,” they may also primarily reflect how participants imagine a “White person.” This is key to emphasize considering how race and gender stereotypes intersect (Phills et al., 2023; Shu et al., 2022).
Study 1
This first study examined how participants in six countries visualized the face of a typical “person.” Our main goal was to test for country-level differences by comparing six countries strategically chosen based on their variation on the Gender Inequality Index.
In addition to testing country-level differences, the study tested for the influence of individual-level variables on androcentric imagery, including participants’ gender, hostile sexism, perceived power and influence, explicit androcentrism, and self-reported exposure to men (vs. women) in daily life. For instance, androcentrism in mental imagery may be connected to individuals’ hostile sexism, which captures negative attitudes toward women as inferior to men and varies in magnitude cross-culturally (Glick & Fiske, 1996; Glick et al., 2000; Hill & Marshall, 2018). In the same way, beliefs that men are more powerful than women may also influence androcentrism. Androcentrism in mental imagery may also be related to people’s ideological endorsement of androcentrism; previous work found that participants higher in explicit androcentrism were more likely to list a man as an example of a person (Bailey et al., 2020). Finally, androcentrism may be connected to more passive cognitive processes, such as overexposure to men compared to women, which may cause people to think of men as the norm (Bailey et al., 2019). Research on nonsocial categories supports this notion that overexposure to specific exemplars fosters the belief that those exemplars are the norm (Bear & Knobe, 2017; Lynch et al., 2000).
We tested the following preregistered hypotheses:
H1: People imagine a “person” as a man more than as a woman, indicating androcentrism in mental imagery.
H2: Androcentrism in mental imagery is strongest in less gender-egalitarian countries.
H3: Androcentrism in mental imagery is stronger among men than women.
H4–H6: Androcentrism in mental imagery is strongest for participants who score high in hostile sexism, explicit androcentric beliefs, or have less exposure to women.
Method
Participants
Based on previous research (see Brinkman et al., 2017), and as preregistered, we aimed to recruit a minimum of 60 participants in each country for Step 1 of this study—the image generation step (Step 1). This sample size would provide > 95% power to detect small between-group differences (f = .25) at a .05 significance criterion. Participants were university students from six countries: China, Ghana, Norway, Pakistan, Turkey, and the US (see Table 1 for demographics). As preregistered, we excluded 24 participants who completed the survey in an unreasonable amount of time (< 10 minutes) and/or indicated that they did not take it seriously.
Ethnicity, age, and gender in all six countries: Study 1, Step 1.
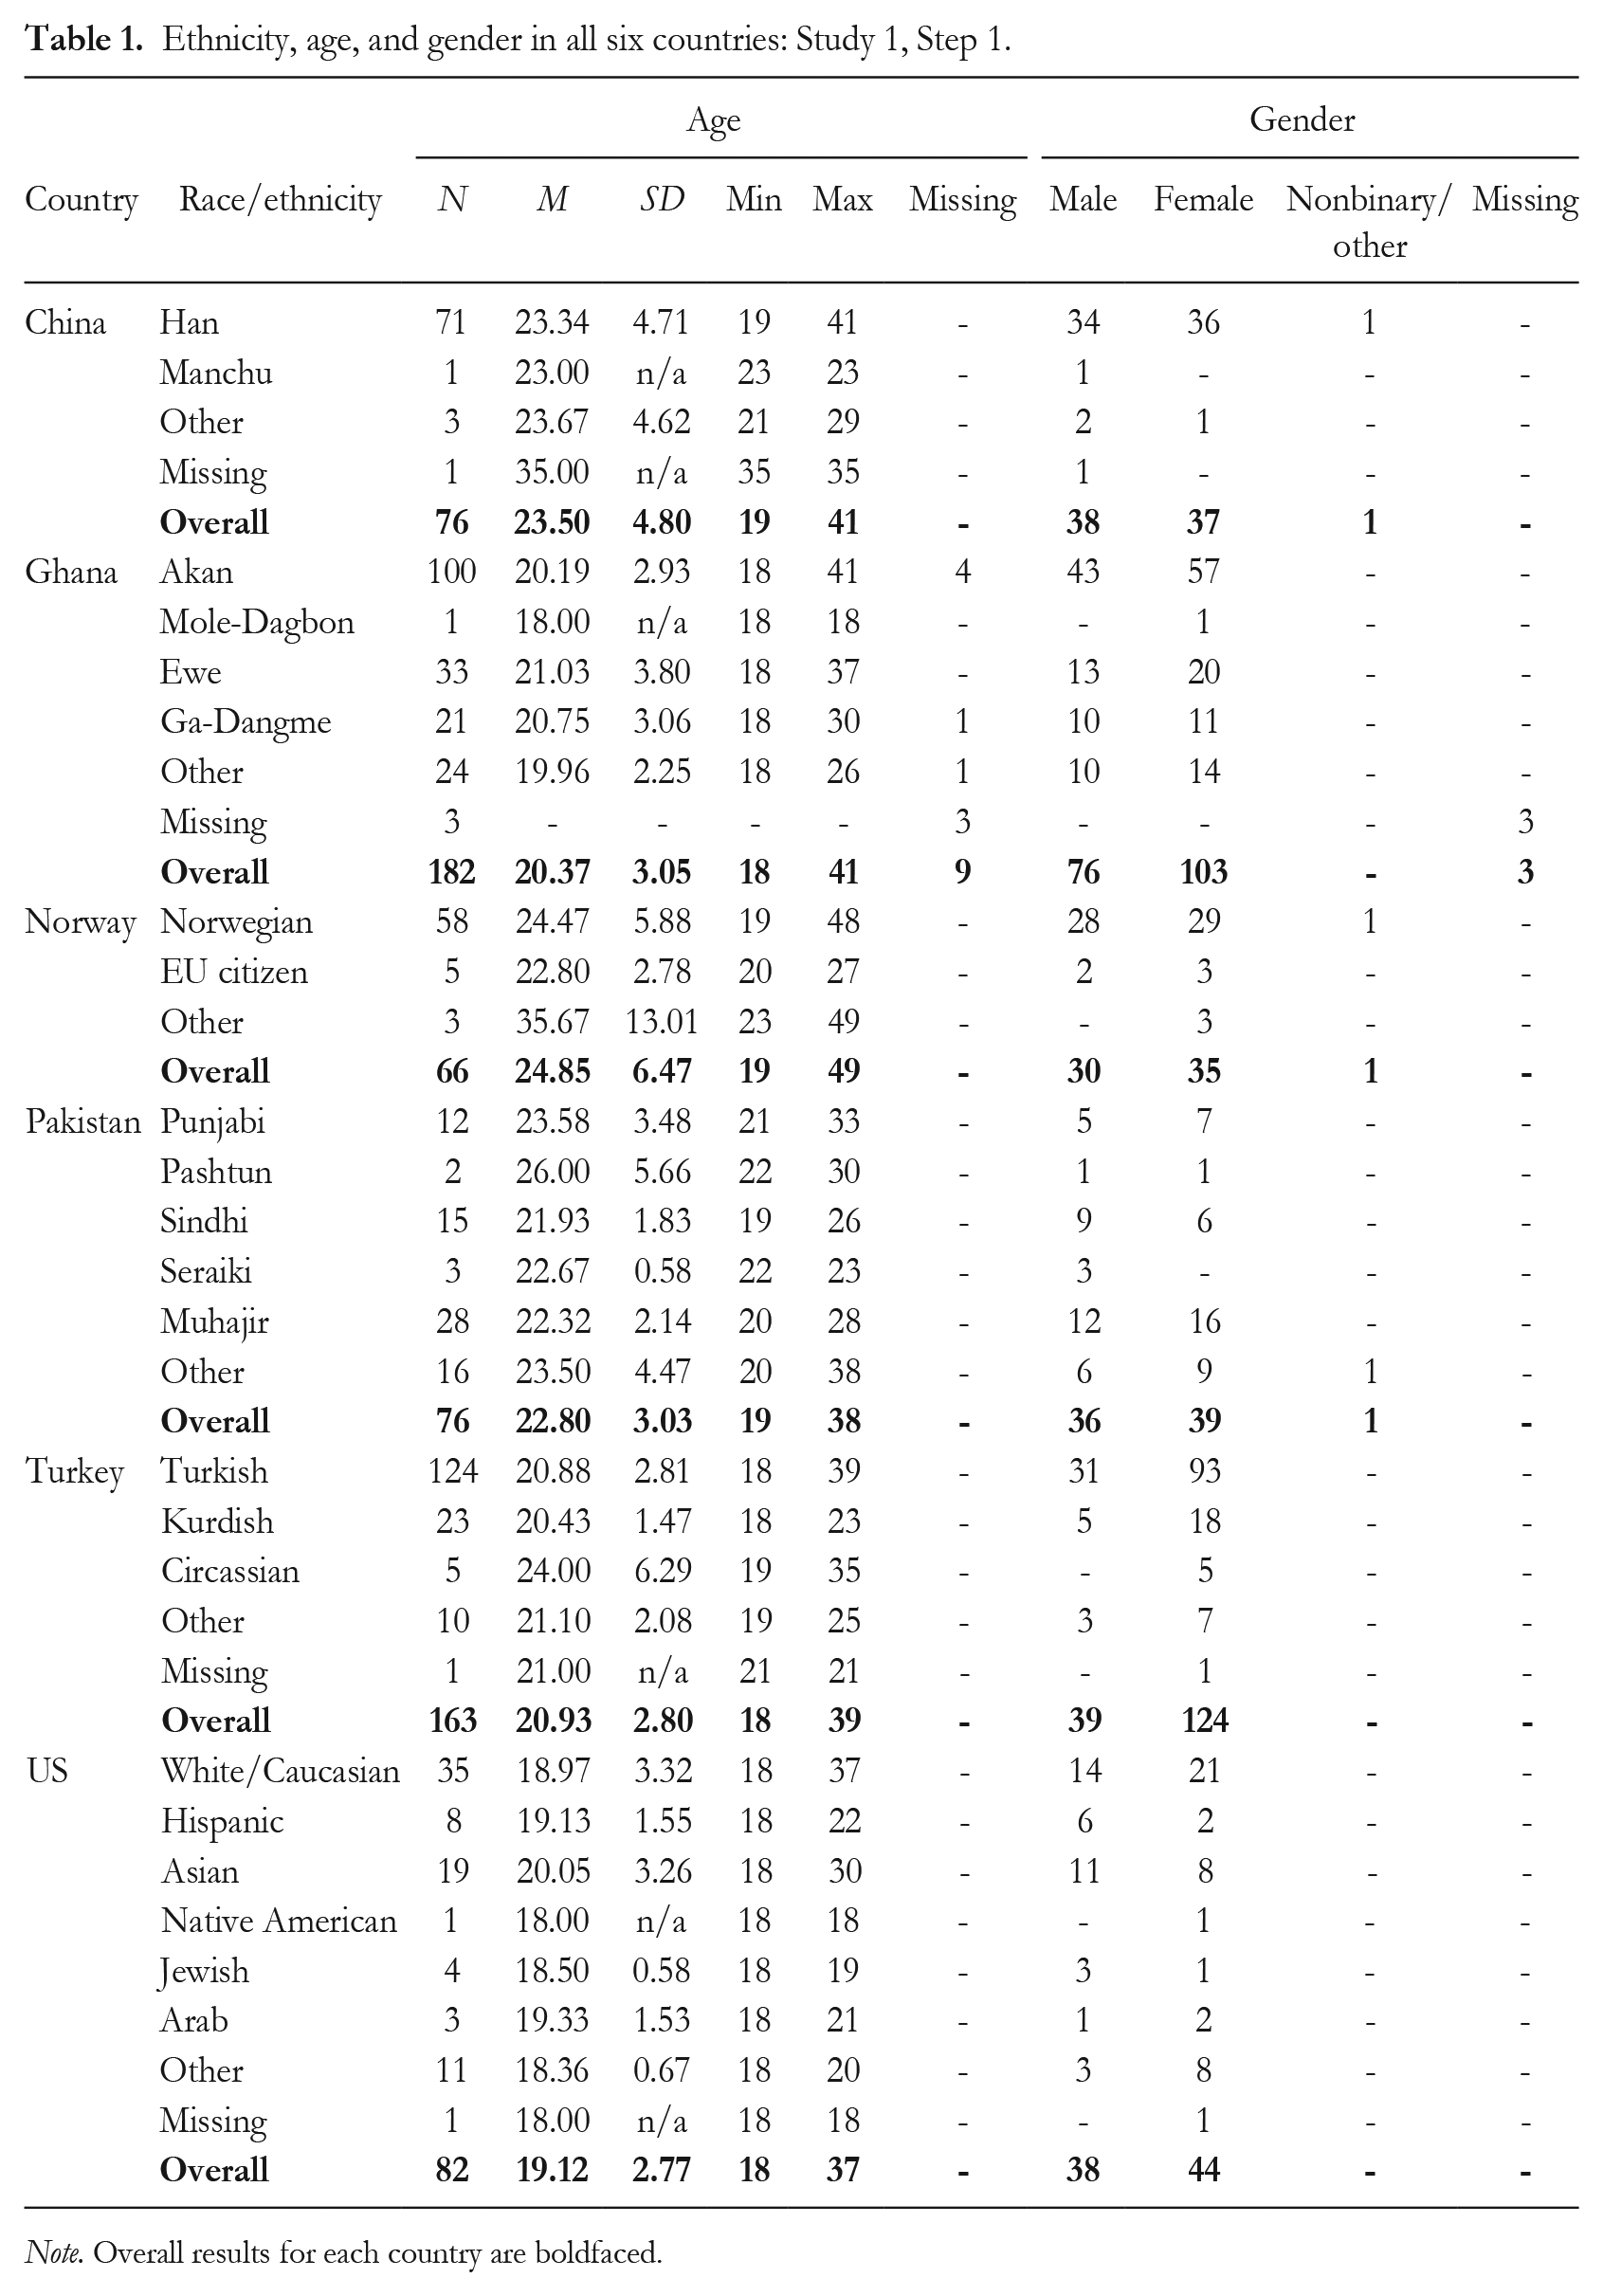
Note. Overall results for each country are boldfaced.
Step 2 of this study, the image gender ratings step, was completed by a machine-learning algorithm and corroborated by human ratings. For this supplementary human sample, we collected data from 40 raters (Mage = 31.55, SDage = 11.60; 47.5% women, 2.5% other; U.S. Americans). These raters were recruited through Prolific (Prolific.co) and paid £7.20 for their participation. The sample size 40 resulted in 25,800 ratings nested within the classification images. According to a multilevel power analysis (Olvera Astivia et al., 2019), this provides perfect power (100%) to observe a small (d = 0.20) Level 2 effect (i.e., of the individual differences).
Procedure
The present research was approved by the Institutional Review Board at the Department of Psychology of the University of Oslo (No. 4869655). When necessary, additional ethics approval was obtained in the participating countries.
In each country, participants were recruited through social and academic settings (e.g., classes or social gatherings), and through advertisements spread through social media platforms and list servers between August 2019 and February 2020. The survey was hosted on Qualtrics. The researchers in each country aimed to recruit at least the minimum number of participants within this time frame. One of the first authors helped to coordinate the data collection for this and the second step. Unless official translations were available, a forward–back translation was used to translate surveys into Mandarin, Norwegian, and Turkish. Materials were presented in English in Ghana and Pakistan—where English is an official language—and in English in the US. Participants in each country received some financial or study credit benefit to participate (see the supplemental online material [SOM] for details).
Step 1: Image generation
After providing informed consent, participants completed the reverse-correlation task (Dotsch & Todorov, 2012) to measure their mental representations of the face of a typical “person.” Specifically, as demonstrated in Figure 1, a base image was generated by averaging the aggregate images of all male and female faces from the Karolinska Face Database (Lundqvist et al., 1998; Lundqvist & Litton, 1998). This database was chosen as the reverse-correlation method generally produces sufficient variation with the database’s average images (Dotsch & Todorov, 2012), and within research focusing on gender dimensions specifically (Gundersen & Kunst, 2018). Next, random noise patterns were superimposed on this image using the default parameters to create 600 visually altered versions of the base image (Dotsch, 2016; Dotsch & Todorov, 2012). Each participant completed 300 trials and saw the same 600 images. For each trial, two images were presented to participants using opposite noise patterns, and they were always asked to select the one that looked the most like a “typical person.” 1 To create individual classification images, the noise patterns from all images that a participant had selected were extracted and then superimposed on the base image, generating a visual approximation of how the participant mentally represented a typical person’s face. The resolution of the images was standardized, but participants could complete the task on a computer of their choosing. Having finished the reverse-correlation task, participants completed the following measures (reliability estimates for each country are presented in Table 2).
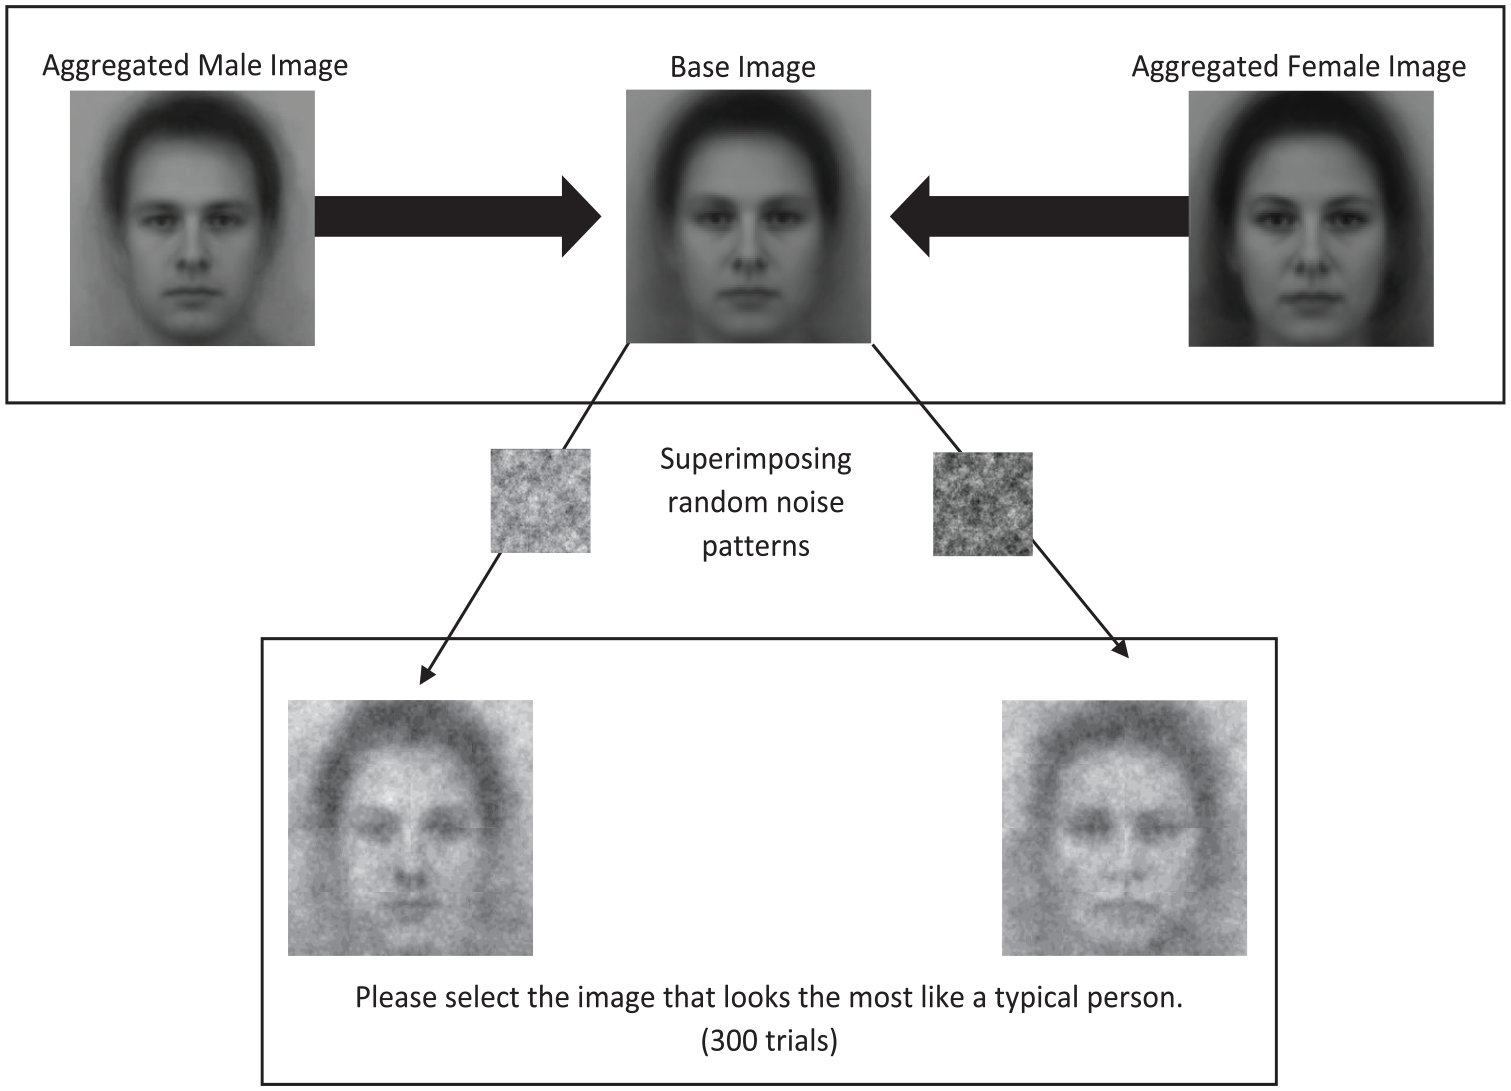
Demonstration of base image creation and an example of a reverse-correlation trial in Step 1: Studies 1 and 2.
Cronbach’s alpha values for the different countries: Study 1, Step 1.
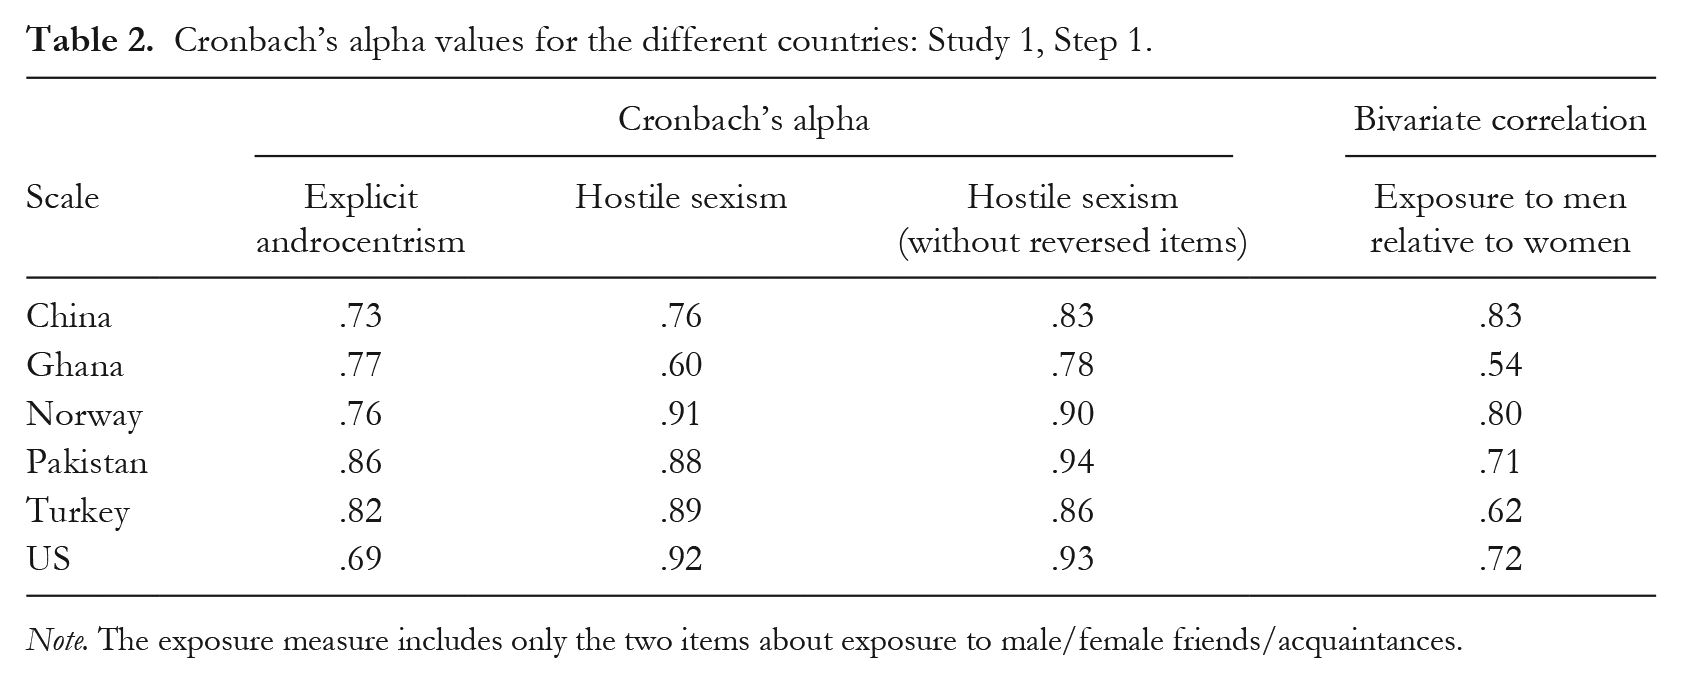
Note. The exposure measure includes only the two items about exposure to male/female friends/acquaintances.
Men’s relative perceived power and influence
Two items (“How much power and influence do you think men have in the society you live in?” and “How much power and influence do you think women have in the society you live in?”) measured the perceived power and influence of men and women. Responses were scored on an 11-point Likert scale (0 = no power/influence at all, 10 = very much power/influence). To test perceived gender inequality in power and influence, the value from the female power item was subtracted from the value of the male power item.
Hostile sexism
Eleven items (e.g., “Most women interpret innocent remarks or acts as being sexist”; 0 = strongly disagree, 5 = strongly agree) from the well-established Ambivalent Sexism Inventory (Glick & Fiske, 1996) measured participants’ hostile sexism. After dropping the three reversed-scored items, the scale had satisfactory reliability in each country.
Explicit androcentrism
Ten items from Bailey et al. (2020; e.g., “Men should be more central to society than women”) measured participants’ explicit androcentrism (1 = strongly disagree, 7 = strongly agree).
Gender exposure
Participants rated four items on a 100-point sliding response scale with “100% women” and “100% men” as endpoints, and “equal % of men and women” as the midpoint: “Thinking about your work place or your place of education, what percentage of your colleagues/fellow students are women or men?”; “What percentage of your supervisors at work or professors at your university are women or men?”; “What percentage of your acquaintances are women or men?”; and “What percentage of your friends are women or men?” Interitem correlations were low; only the two items asking about acquaintances and friends showed robust correlations across cultures (see Table 2) and were therefore mean-scored. Responses were coded such that higher scores indicated greater relative exposure to men than women.
Step 2: Image gender ratings
We then obtained gender ratings of the images created in Step 1, using both machine-learning and human raters. To acquire machine-learning ratings, we used the FACE API of the Cognitive Services module (formerly “Project Oxford”) provided by the crowd computing service Microsoft Azure. The API uses 27 face landmarks to classify faces on various dimensions using artificial intelligence algorithms. Regarding gender detection, its accuracy is nearly perfect (97%; Jung et al., 2018). Two variants of the algorithm were used to gender-classify the images generated by participants in Step 1.
First, we used the API’s standard gender detection algorithm to classify faces by their gender in a categorical fashion as either a woman, a man, or genderless/gender-neutral. Second, to obtain a more refined estimate, we trained a model with the aggregate male and female images that are displayed in Figure 1. Using this trained model, we estimated the probability that each image generated by the participants in Step 1 represented either the aggregate male image or the aggregate female image, relative to the base image. To do so, we first calculated two probability scores for each participant-generated image to capture the degree to which each image represented the aggregate male image and the aggregate female image shown in Figure 1. These two resulting scores ranged from 0 to 1, with 1 indicating maximum probability. Next, it was necessary to adjust these scores for the base image to control for the possibility that, due to random chance, the different iterations of the base image (i.e., base image + noise) may have been more male- or female-looking. Thus, we estimated the probability that the different iterations of the base image (i.e., the base image + 600 different patterns of random noise) represented the aggregate male image and female image on average. Finally, we subtracted these average probability values obtained for the base images from those obtained for each participant-generated image. Through this process, we obtained two final values for each participant-generated image, one reflecting the probability that the image represented the aggregate female image relative to the base image, and another reflecting the probability that the image represented the aggregate male image relative to the base image.
To corroborate these two types of machine-learning ratings, we asked a supplementary sample of human raters to rate all classification images and 300 images generated by superimposing random noise on the base image (i.e., all original noise stimuli): “To what extent does the individual in the image look like a man or a woman?” (1 = definitely a man, 11 = definitely a woman). The base image stimuli used in Step 1 of this study were created with random noise, and thus it was possible that, just due to random chance, the base image stimuli themselves may have inadvertently encouraged participants to produce images biased toward one gender over the other. To account for this possibility, we had the human raters rate the perceived gender of each of the 300 base image stimuli. We then separately averaged each rater’s gender ratings of these 300 base image stimuli. Next, we subtracted this average score from each rater’s rating of each classification image produced by participants in Step 1. A resulting positive score indicates that a given rater perceives a given classification image more as a woman relative to the base image stimuli. Conversely, a negative score indicates that a given rater perceives a given classification image more as a man. We then merged these adjusted ratings (Level 1) with the individual differences provided by the image generators (Level 2).
Analytic approach
Given recent recommendations regarding the rating of reverse-correlation images, we rated all individual images (rather than the aggregated country-level images; for details, see Cone et al., 2020). We set out to test for the presence of androcentrism in participant-generated images of faces in the different countries based on machine-learning classification. To do so, we adopted two approaches, as described in detail above: (a) we obtained categorical classifications (woman, man, genderless/gender-neutral) for each participant-generated image and chi-square tests for each country, and (b) we obtained probability estimates for each participant-generated image (probability man, probability woman, adjusted for the base image). To analyze the latter probability estimates, we then tested whether the difference between these scores was significant and whether this difference was moderated by the country of investigation, using multilevel analyses in R 4.2.2 (R Core Team, 2022) using the “lme4” (Bates, 2010) and “lmerTest” (Kuznetsova et al., 2016) packages. We visualized results using “ggplot2” (Wickham et al., 2016). When the score for the comparison with the male image was significantly higher than the score for the comparison with the female image, this indicated the presence of androcentrism in the mental imagery of faces. The opposite case—higher comparison scores with the female image than with the male image—indicates the tendency to imagine the typical person’s face as a woman.
In addition, we tested whether these differences were influenced by participants’ beliefs about the relative power of men, hostile sexism, explicit androcentrism, and exposure to men (vs. women), using multilevel modeling. Again, we tested whether these effects would be moderated by country. Finally, we further corroborated the findings from the machine-learning ratings by running corresponding multilevel analyses with the data obtained from the human raters.
Open science practices and data availability
All data, materials, and supplemental online materials are available at the Open Science Framework (OSF). 2 We report all measures, manipulations, and exclusions.
The study was preregistered through the OSF. 3 We conducted additional nonpreregistered analyses, clearly reported as such at the end of the Results section. We also made three changes from the preregistration. (a) In the gender rating step (Step 2), we adopted automated machine-learning techniques in addition to the preregistered human raters to obtain gender ratings of the images. The reason for this addition was to obtain a more objective measure than human ratings alone, which reflect the cultural biases of the raters and thus may limit any cross-cultural conclusions. (b) Recent recommendations for rating reverse-correlation images emphasize the importance of rating all individual images rather than the aggregate country-level images; this approach helps to prevent Type I error inflation because variance and sample size are not factored into analyses when using aggregate images (see Cone et al., 2020). We thus adopted this approach in the present study. (c) Different to the preregistration, we treated individual difference variables continuously in all multilevel models, rather than reducing their variance artificially by creating median splits.
Results
Country differences in individual difference variables
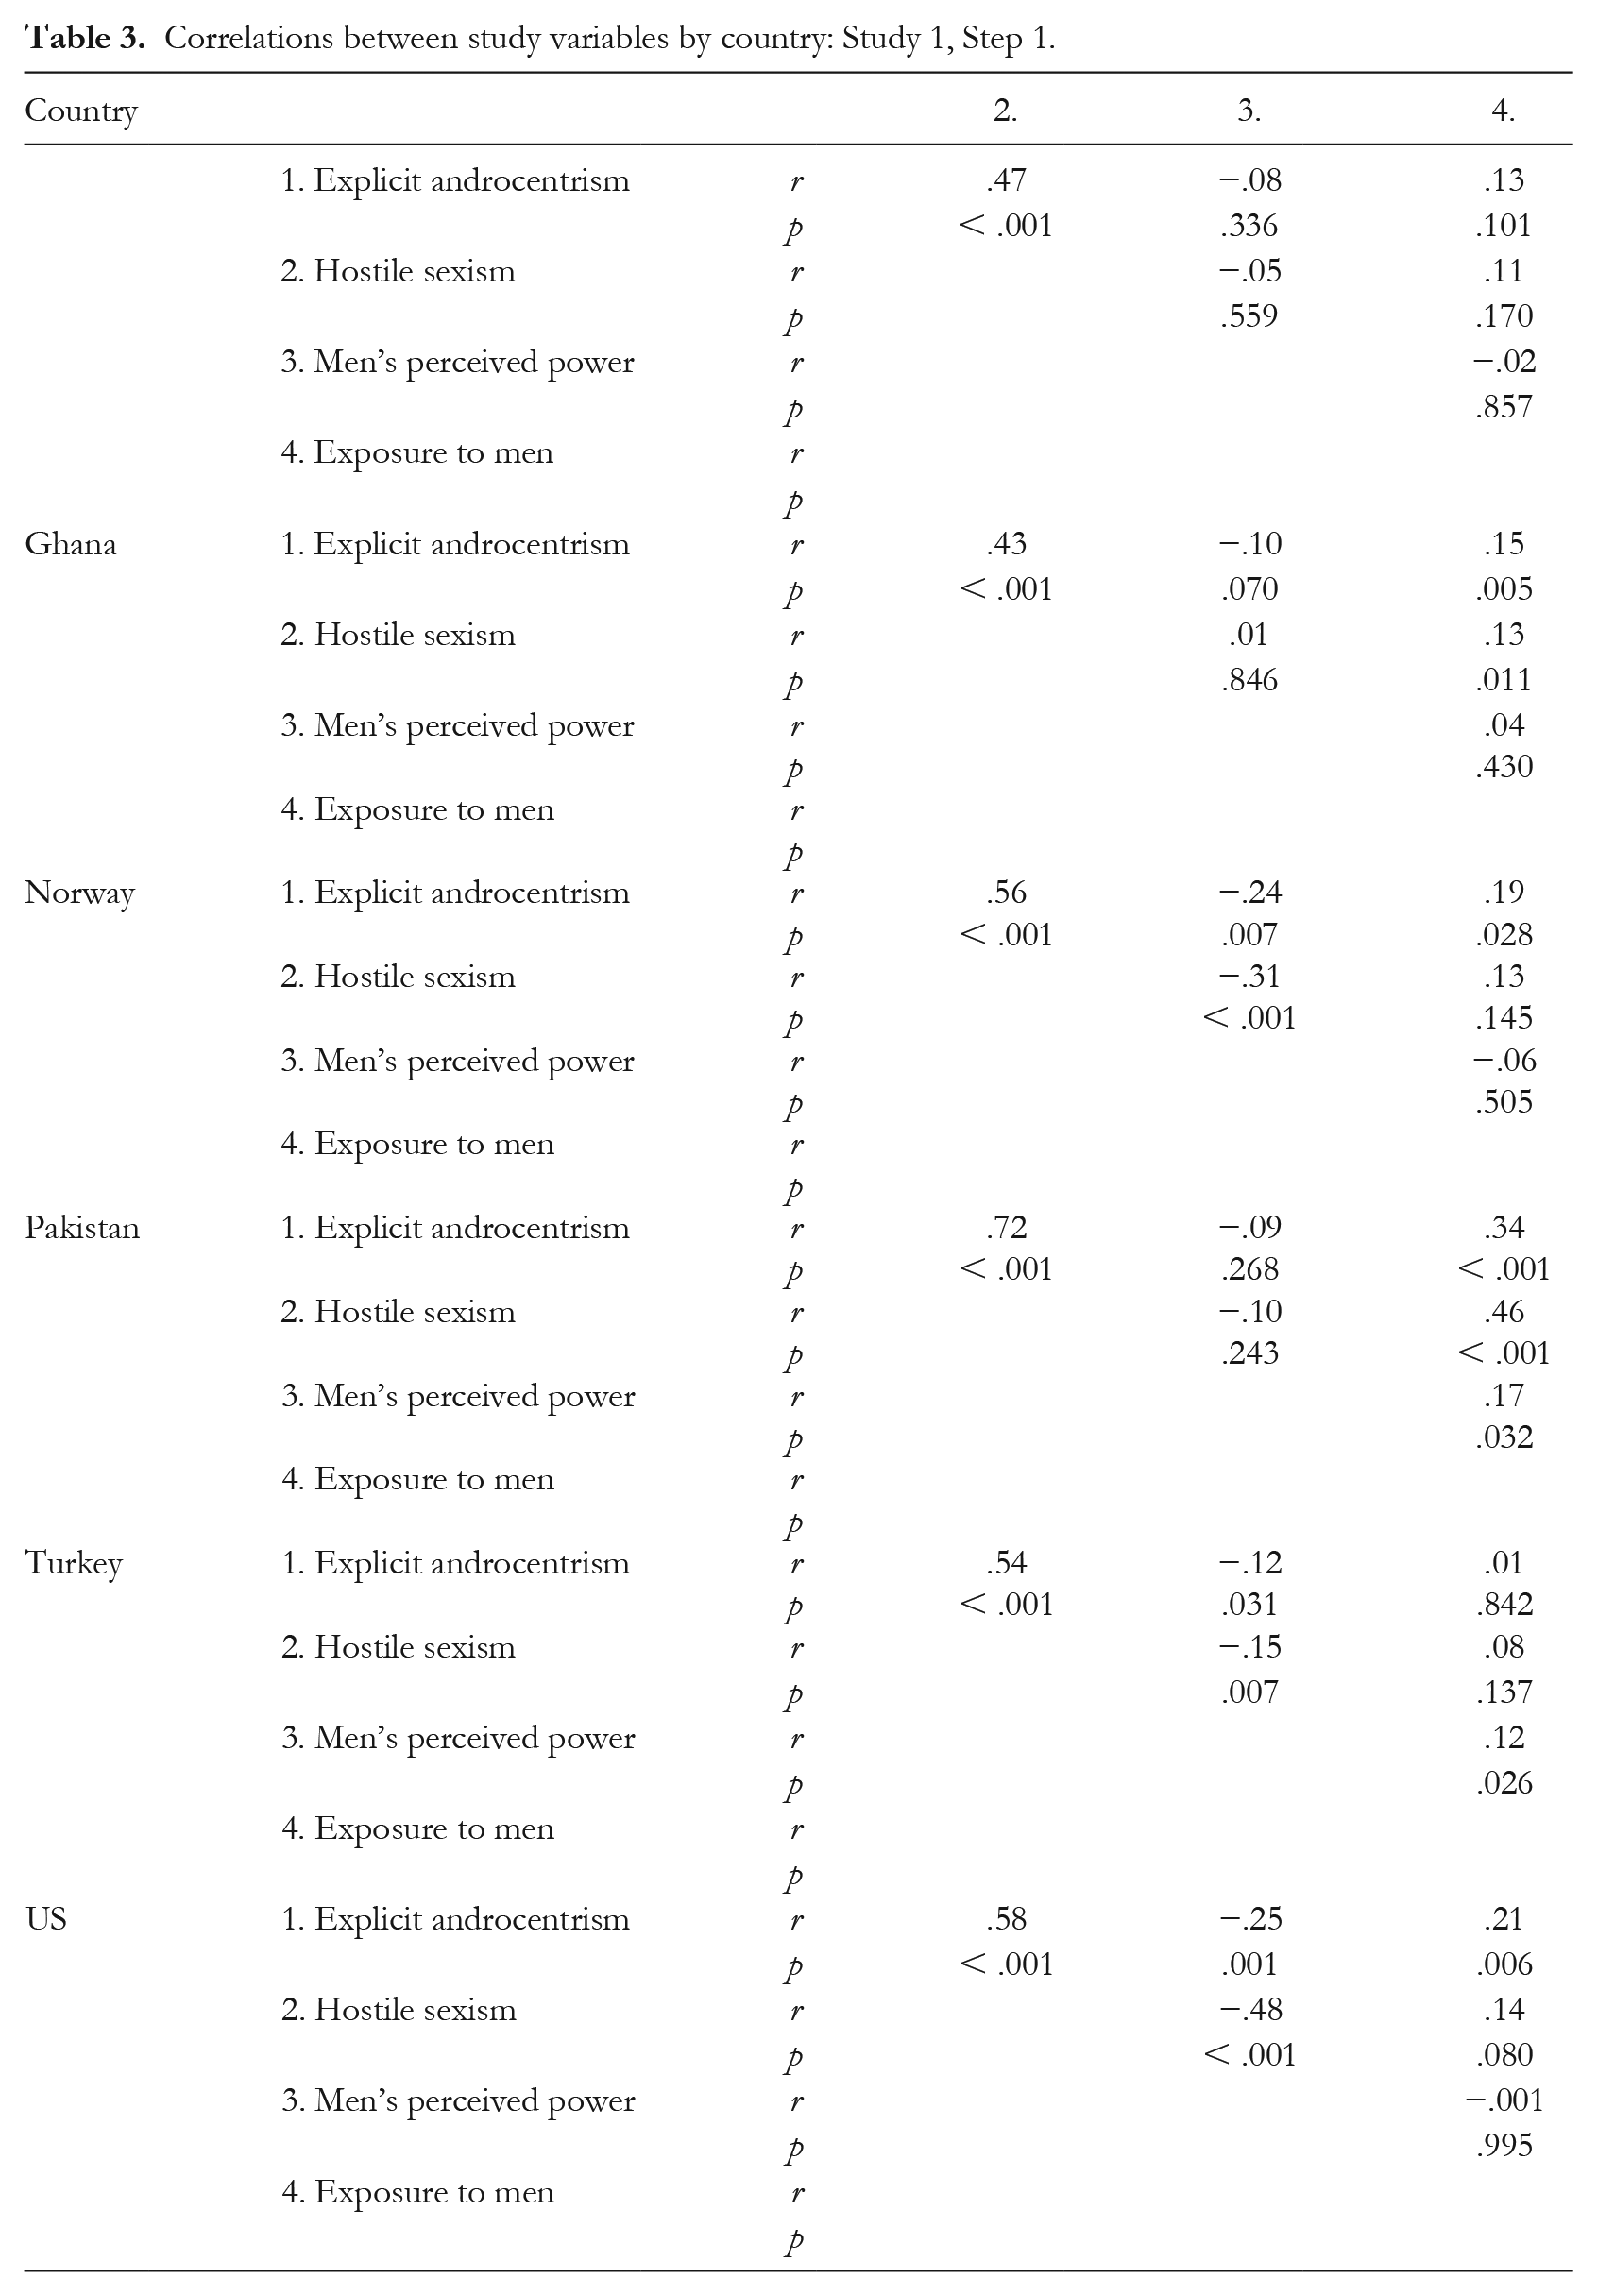
Scores on the individual difference variables mapped onto the different levels of gender equality in the respective countries generally, as expected. For brevity, we here present violin charts with boxplots in Figure 2, whereas ANOVAs and contrasts are presented in the SOM. Gender attitudes and perceptions tended to be more favorable in Norway and the US than in Ghana, China, and Pakistan. Scores for Turkey mainly fell in between these two groups of countries. Correlations between the variables in each country can be found in Table 3.
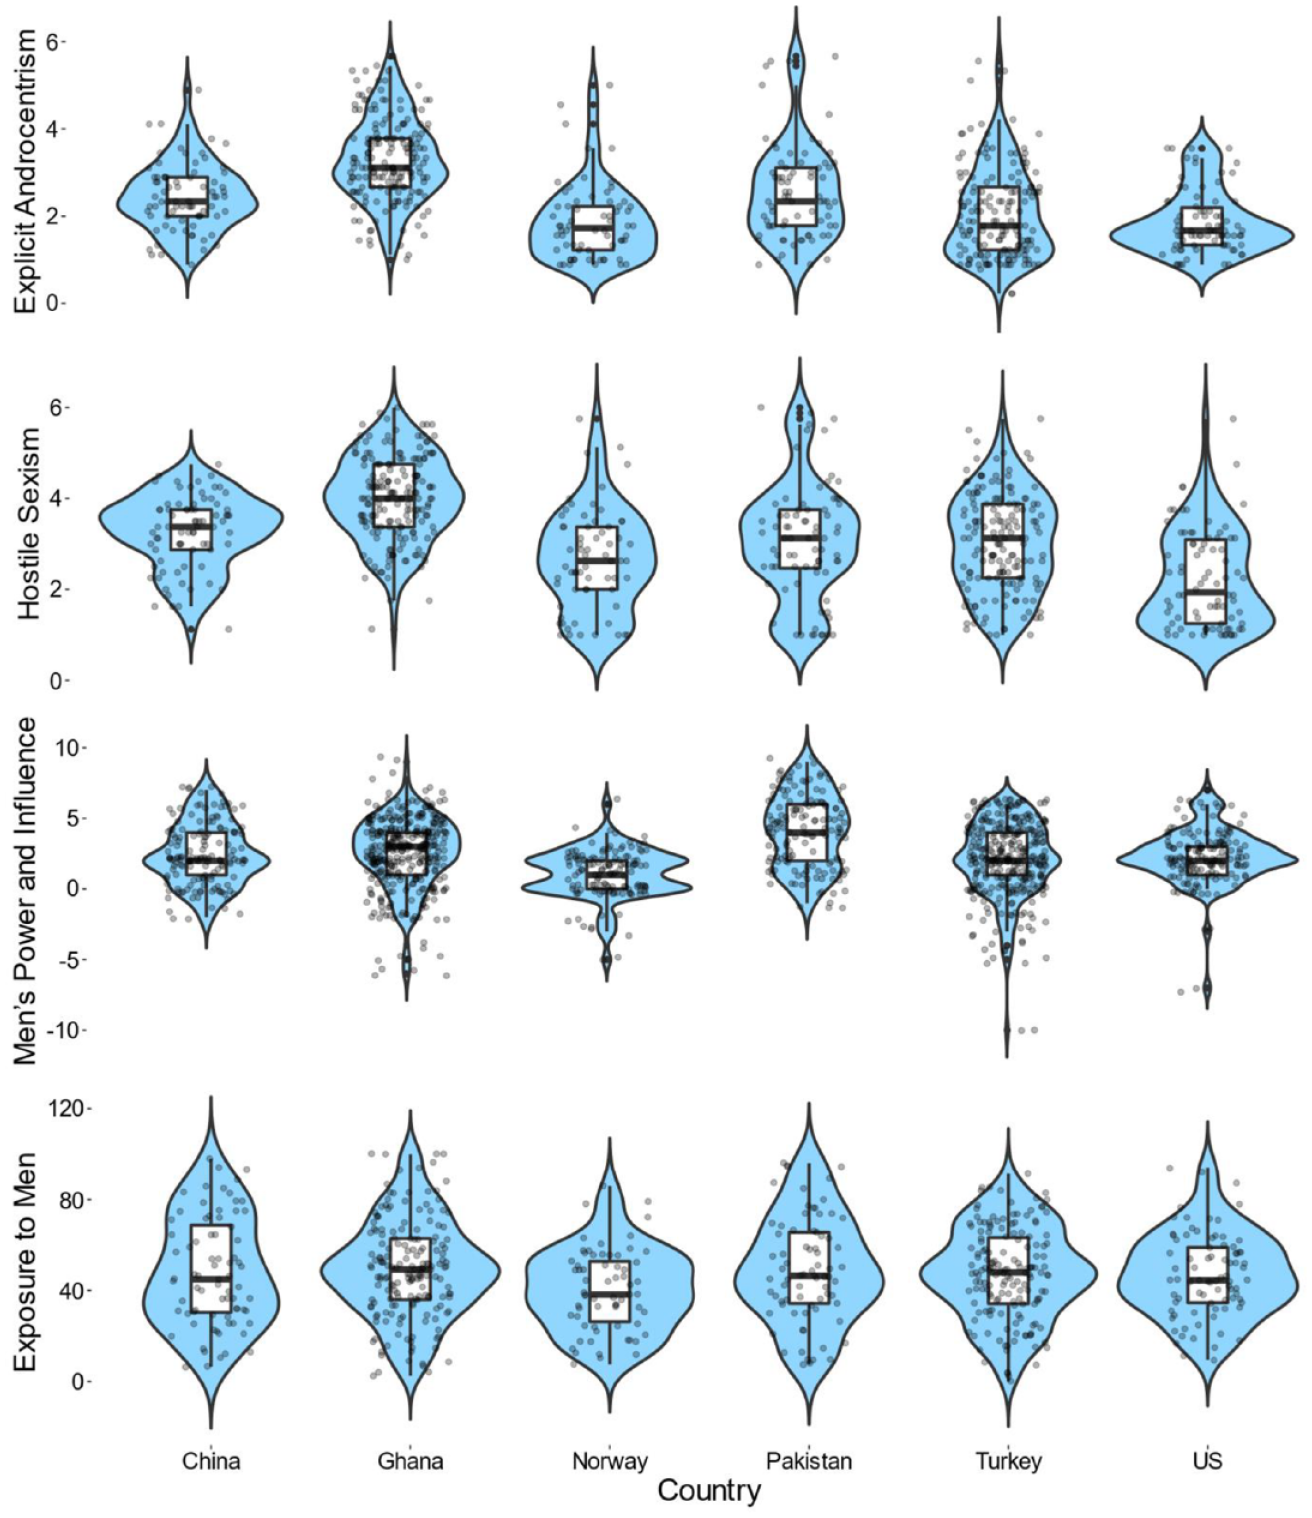
Country differences in individual difference variables: Study 1, Step 1.
Correlations between study variables by country: Study 1, Step 1.
Reverse-correlation output
To guide interpretation, aggregate classification images are presented across participants in each country (see Figure 3). However, we only present analyses with individual images, as described earlier (Cone et al., 2020).
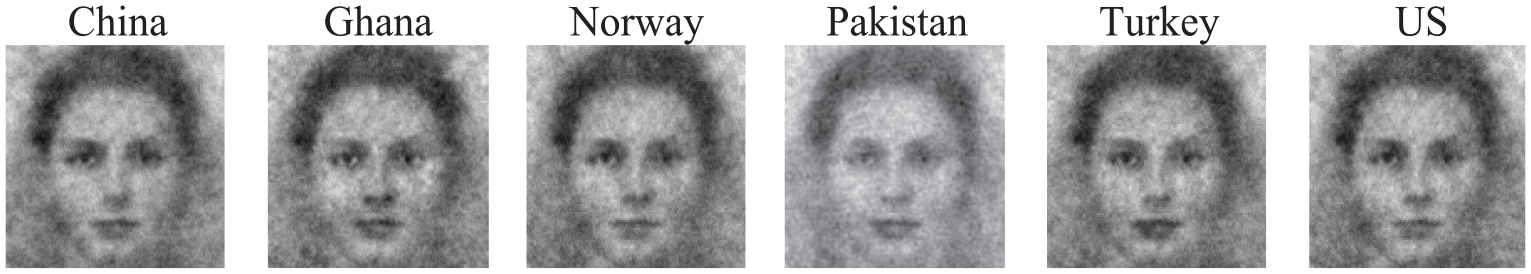
Reverse-correlation classification images across participants: Study 1.
Differences in the machine-learning classification of images
As displayed in Figure 4, in all countries, the vast majority of images were categorized as women (vs. men; no image was categorized as genderless/gender-neutral) according to the categorical machine-learning ratings. A chi-square goodness of fit test across the samples showed that the observed distribution differed significantly from a distribution where men and women are equally represented, χ2(df = 1) = 505.49, p < .001. A chi-square test of independence further suggested that this distribution was independent of the country in which the data were collected, χ2(df = 5) = 7.66, p = .176.
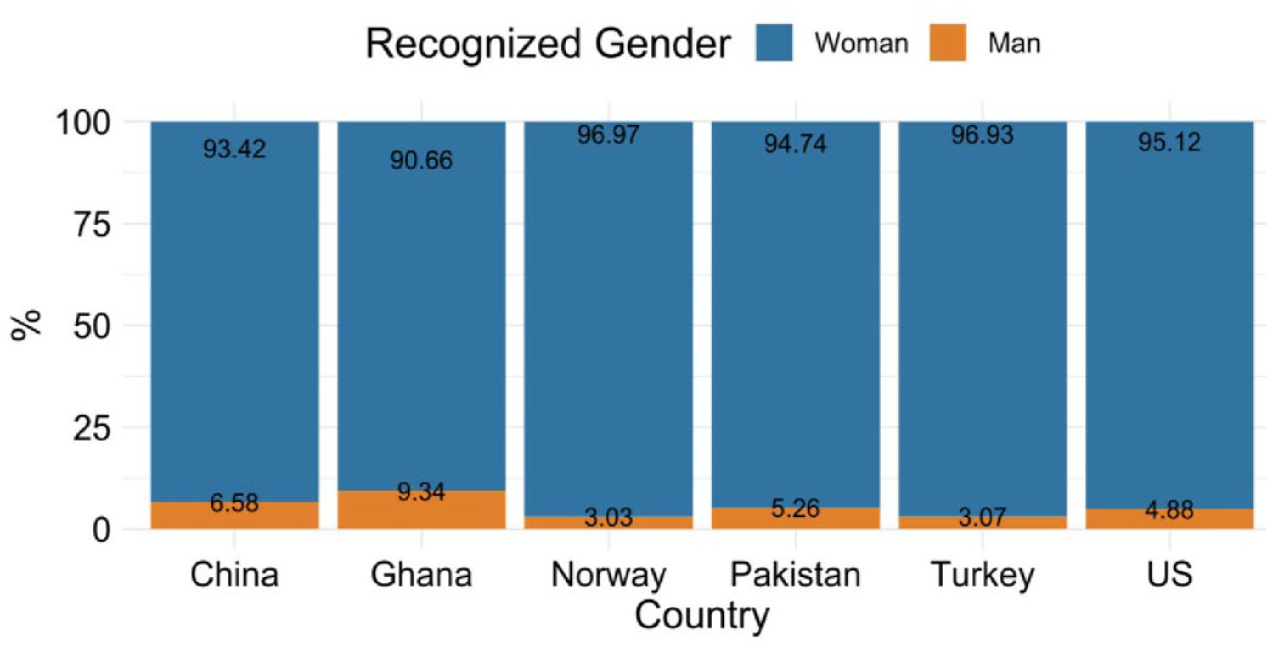
Percentage of individual images rated as a woman or as a man by the machine-learning algorithm in the different countries: Study 1.
Next, we conducted analyses with the machine-learning probability estimates that each image reflected the aggregate female and the aggregate male images. In the first model, intercepts were allowed to vary between participants and countries, and the image comparison factor (comparing each image to the female = 0, and the male = 1 aggregate images) was entered as a fixed effect. The image comparison was significant, B = −0.06, SE = 0.001, t(644) = −11.17, p < .001, drm = 0.62, showing that, across countries, the images were more likely to represent the aggregate female image, M = 0.23, SE = 0.01, 95% CI [0.22, 0.25], than the aggregate male image, M = 0.18, SE = 0.01, 95% CI [0.16, 0.19], relative to the base image. Next, we tested whether allowing the effect of the image comparison factor to be random (i.e., different for each country) would improve the model fit, which was not the case, ΔAIC = 1.33, ΔBIC = 16.82, ΔLoglikelihood = 2.30, χ2(df = 3) = 4.67, p = .198 (also see distributions for each country in Figure 5). Hence, findings converged with those from the chi-square analyses.
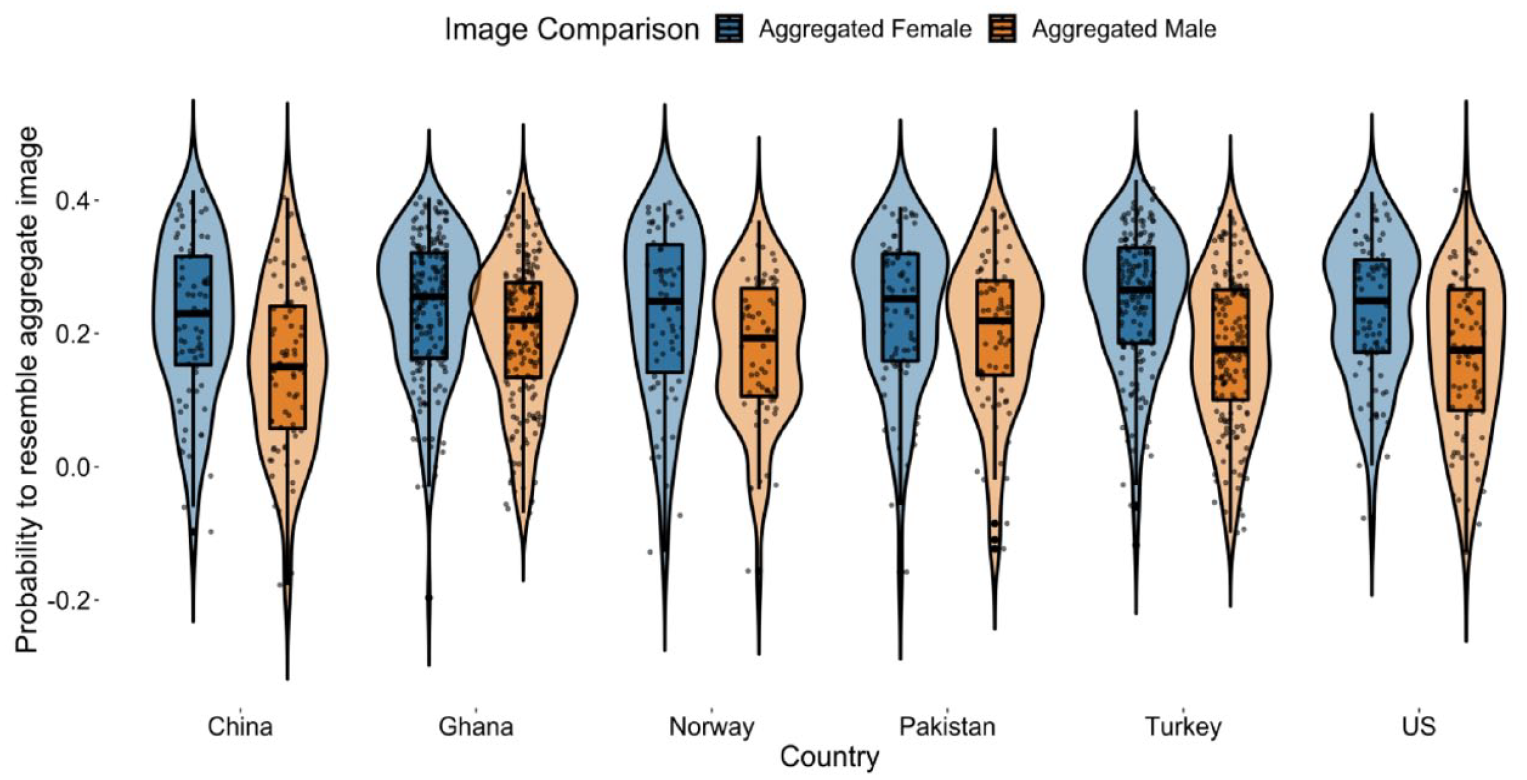
Probability for individual images to resemble aggregate female and male images relative to the base image: Study 1.
Having observed this main effect, we tested for the influence of individual difference variables using a multilevel logistic regression model with a binary outcome, as no image was categorized as genderless/gender-neutral. Before doing so, we z-scored all variables to increase the interpretability of the effects. The variables were not group-mean-centered due to the lack of representative samples to establish the exact group mean, and because it biases results (Kelley et al., 2017). The intraclass correlation coefficient was .29, justifying the estimation of a multilevel model. In the model presented in Table 4, we tested whether the individual difference variables would moderate the effect of image comparison. The intercept was allowed to be random for country and participants. All other effects were entered as fixed effects. None of the variables significantly moderated the effects. In an extended model, we allowed all effects to be random (i.e., different for each country), but this did not improve the model fit but rather worsened it, ΔAIC = 196.94, ΔBIC = 731.36, ΔLoglikelihood = 6.03, χ2(df = 104) = 12.06, p > .999.
Logistic multilevel regression testing for the influence of individual differences on classifying images as women or men: Study 1.
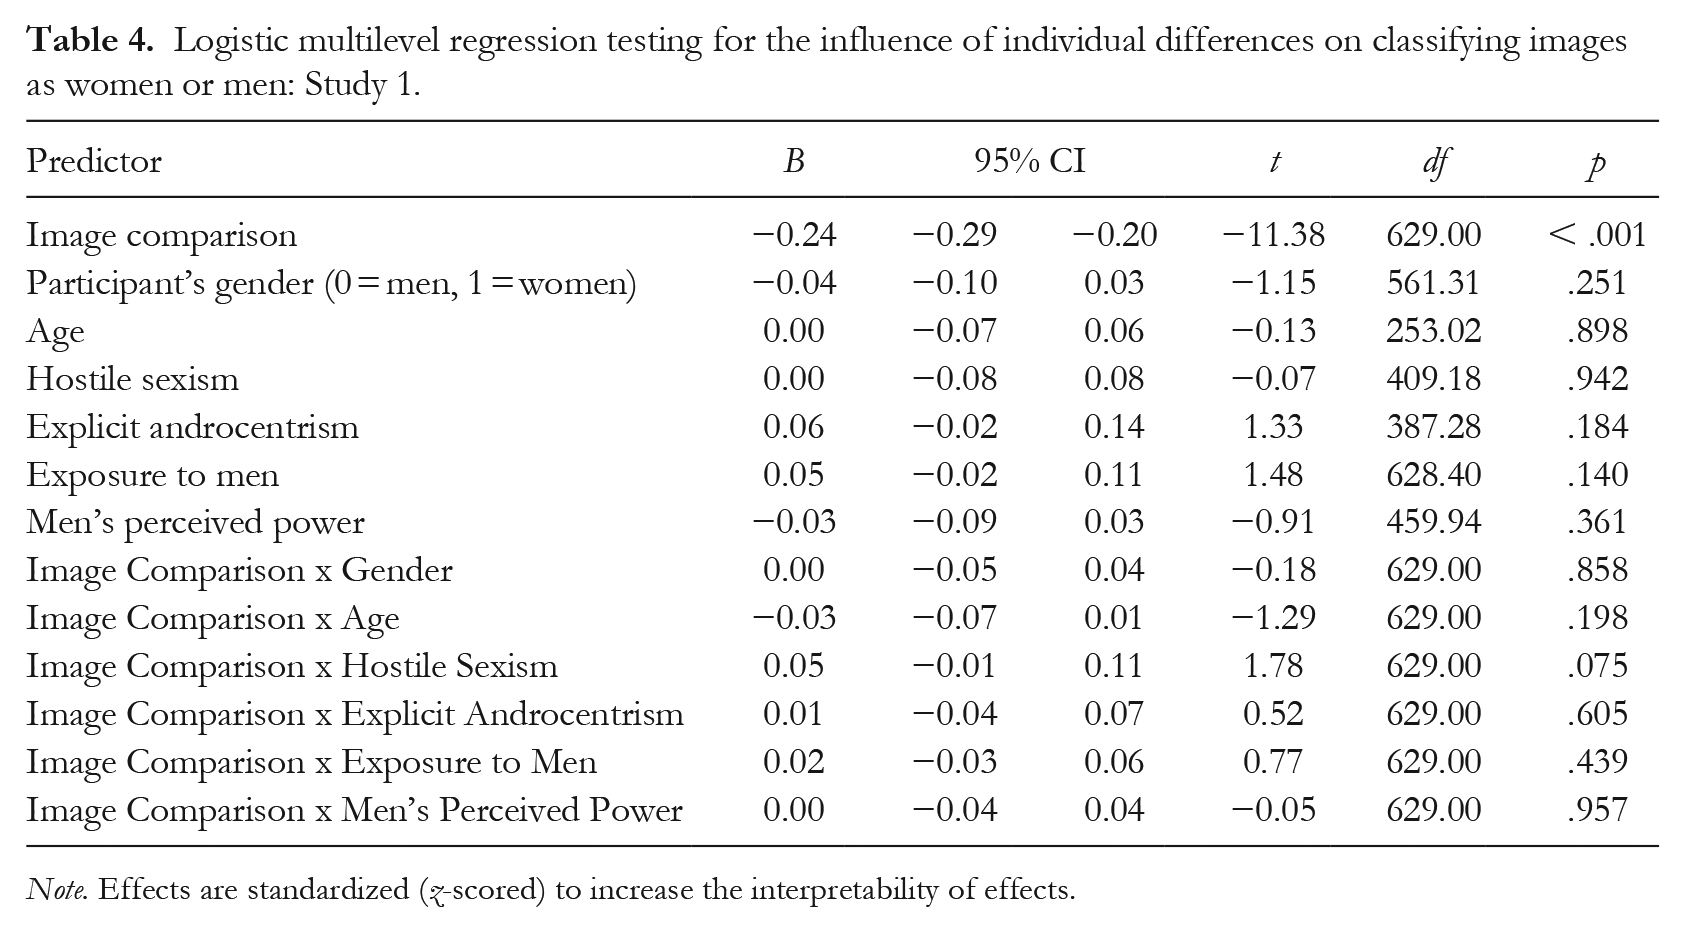
Note. Effects are standardized (z-scored) to increase the interpretability of effects.
Ruling out alternative explanations through exploratory analyses
We expected to find evidence for androcentrism in mental imagery of faces but instead found evidence for the opposite—participants imagined a typical person’s face more as a woman. In exploratory analyses, we considered four alternative explanations for this finding.
First, the machine-learning algorithm we used to classify the images as men or women may have been biased toward women classifications of noise-imposed images. If so, it should produce more errors in classifying images generated with a male base image than a female base image (i.e., the two original images merged to create the base image used in the reverse-correlation task). Thus, as a validation check, we tested the algorithm’s accuracy in recognizing each of the 300 image stimuli generated with the male or female base image, because these images should be unambiguously classified as either men or women, respectively. The accuracy was perfect for both male and female images (100%), making the proposed alternative explanation unlikely.
A second possibility was that participants may have picked images for a “typical person” that were easier for them to see and recognize because these faces showed higher contrast between the skin and facial features (e.g., eyes; Diego-Mas et al., 2020; Porcheron et al., 2013). High skin-to-feature contrast is more typical of women than men (Porcheron et al., 2013). Thus, if participants systematically picked a face with high skin-to-feature contrast and our algorithm systematically classified images with high skin-to-feature contrast as women, the present female-biased findings could be due to this low-level confound. To assess this possibility, we tested whether images with higher contrast values would have a higher probability of representing a woman (relative to the base image) and a lower probability of representing a man (relative to the base image). The contrast was operationalized as the standard deviation of the pixel intensity values (Peli, 1990), calculated on masked images where only the face was visible and considered in calculations. Values were standardized to facilitate interpretation. Contrast values negatively predicted both probability values, B = −0.02, SE = 0.003, t(1154) = −5.84, p < .001, and did not interact with the gender image comparison factor, B < 0.01, SE = 0.01, t(1281) = 0.06, p = .950. Thus, an underlying process of participants selecting high skin-to-feature contrast faces did not seem to explain the results.
Third, given the small effects, it is crucial to test for the informational value of each classification image using the infoVal metric (Brinkman et al., 2019). This metric measures the intensity of changes in an image by calculating the vector length relative to a reference distribution of simulated vector lengths based on random responses. The infoVal of the classification images was low on average, M = 0.65, SD = 1.29. This finding points to the possibility that many participants responded randomly, possibly due to minimal associations between “person” and gender in their mental imagery. Nevertheless, when systematic bias did emerge, it appeared to be female-biased and not male-biased.
A fourth possibility was that there may have been some other issue with the machine-learning classifications that compromised their validity. To account for this possibility, we also collected gender classifications from human raters (the original preregistered plan) to examine if they would corroborate the conclusions from the machine-learning classifications. Recall, human raters indicated the gender of the images on a scale from 1 (definitely a man) to 11 (definitely a woman). The base image stimuli, intended to fall in the middle, were rated close to the scale’s midpoint, M = 4.95, SD = 1.19. If anything, the ostensibly gender-neutral base images were perceived by human raters as slightly more male than not. As would be expected, the human ratings correlated positively with the dichotomous (0 = men, 1 = women) machine-learning classification, r(644) = .22, p < .001. Further, as would be expected given the bipolar scale, the human ratings correlated negatively with the machine-learning probability that the images represented a man, r(644) = −.39, p < .001, and positively, albeit weakly, with the machine-learning probability that the images represented a woman, r(644) = .08, p = .035. Thus, the machine-learning designations and human ratings were descriptively similar.
To test our androcentrism hypothesis with the human ratings, we then subtracted each participant’s ratings of the stimuli images (base image + 300 random noise patterns) from their ratings of the classification image—with positive scores indicating the image was perceived as more female relative to the base image, and negative scores indicating that the image was perceived as more male relative to the base image. In each country, the average rating was above zero and the 95% CIs did not include zero (see Figure 6). Thus, this analysis with human raters replicated the findings from the machine-learning ratings that the classification images were rated as more likely to be a woman than a man in each country. Yet, country differences were observed, F(5, 25755) = 22.46, p < .001. Bonferroni-corrected comparisons showed that scores were higher in Turkey than in Ghana, z = 9.94, p < .001; Norway, z = 5.89, p < .001; Pakistan, z = 6.84, p < .001; and the US, z = 4.83, p < .001. In addition, scores in China were higher than in Ghana, z = 4.06, p < .001.
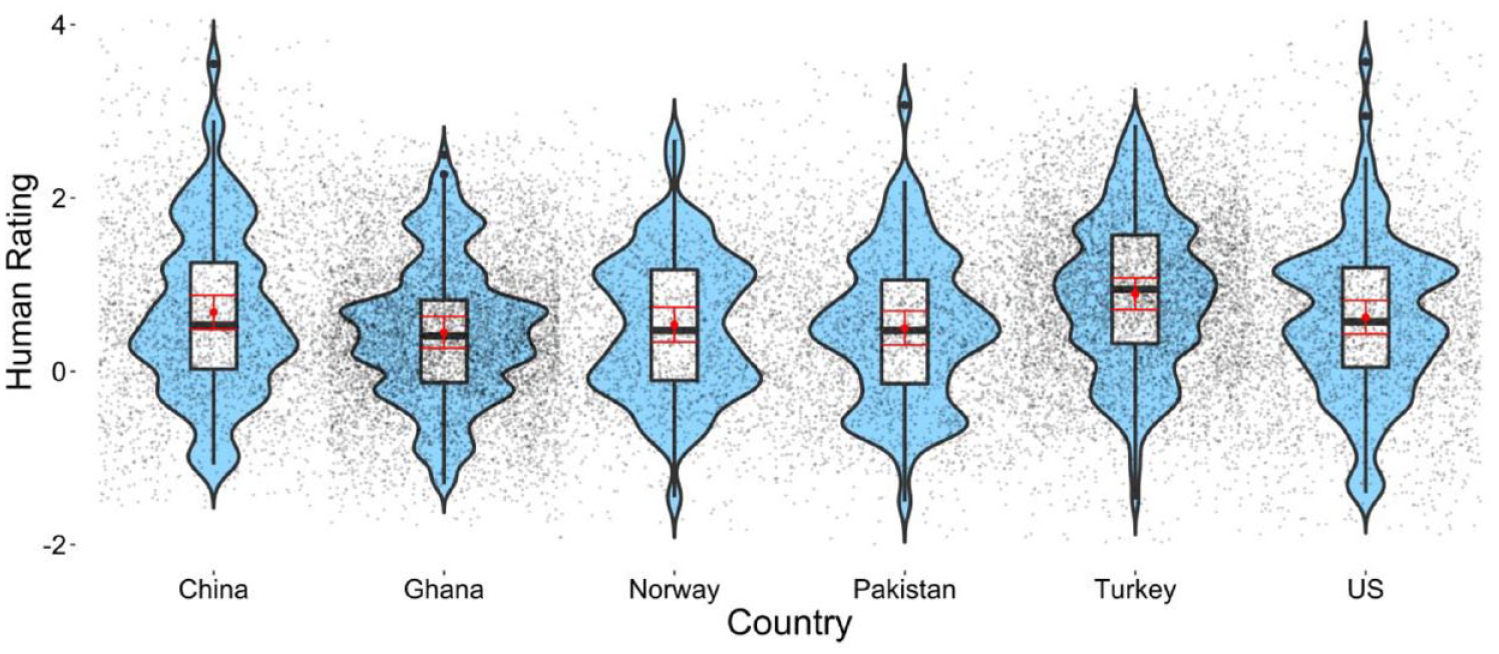
Human ratings of the classification images from the different countries: Study 1.
In the final step of analyses involving human raters, we estimated a multilevel model testing whether the individual difference variables would predict the human rating of the images (see Table 5). As setting random slopes prevented model convergence, only random intercepts for country and image generator were set. The only effect that reached significance was that the images generated by women were rated slightly more female-biased, M = 0.73, 95% CI [0.59, 0.87], than the images generated by men, M = 0.47, 95% CI [0.31, 0.62]. Thus, the results with human raters roughly corroborated those from machine-learning ratings, suggesting that the specifics of the machine-learning algorithm cannot explain our unexpected results.
Multilevel regression testing for the influence of individual differences on the human ratings of the classification images: Study 1.
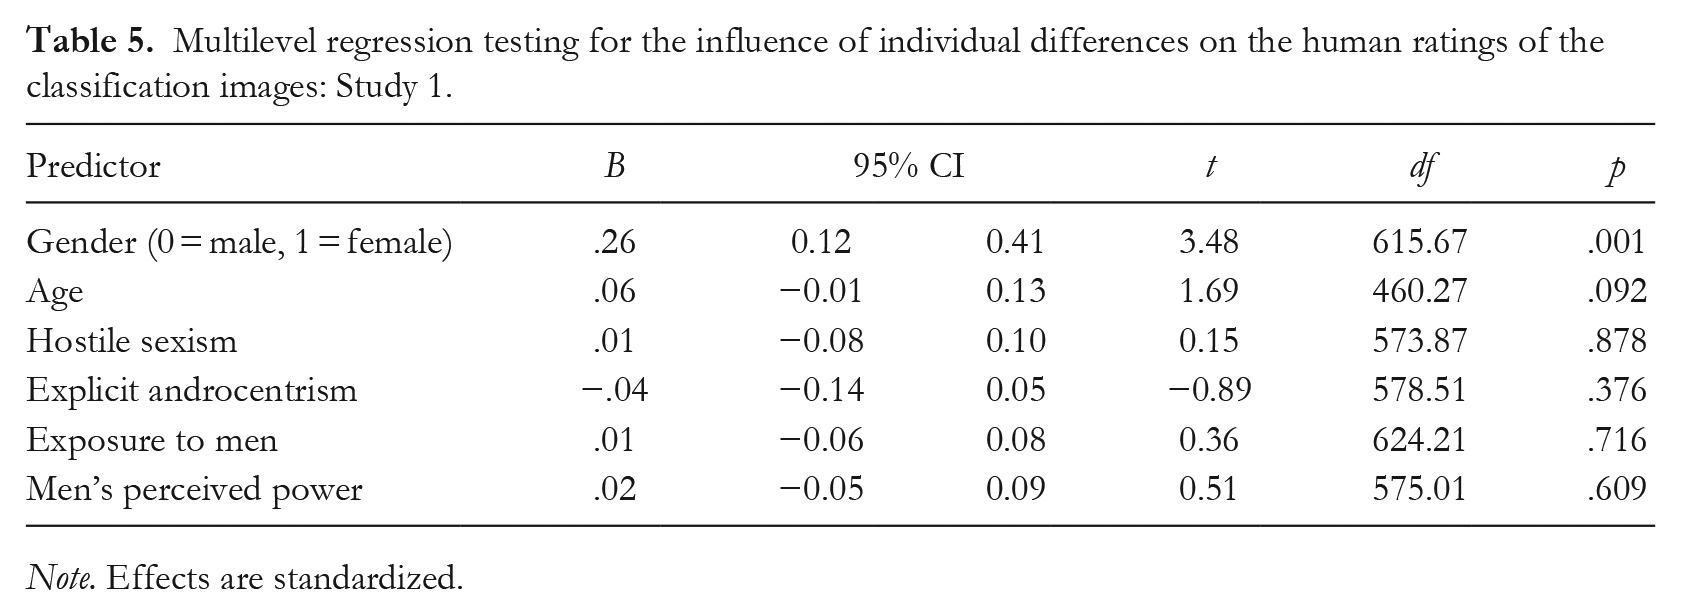
Note. Effects are standardized.
Preliminary Discussion
Based on interdisciplinary theories of androcentrism and prior work showing that people think of a generic person as a man more than as a woman, we expected to find evidence that mental imagery of a person was also male-biased. However, instead, we found that mental imagery of a face was female-biased as classified by a machine-learning algorithm and human coders alike. This unexpected result emerged across a range of cultural contexts and individual differences. Our next study sought to replicate this finding and rule out further alternative explanations.
Study 2
We conducted another preregistered reverse-correlation study using the same base image as in our first study. Due to the lack of cross-cultural differences in Study 1, we conducted this study in a single cultural context. This present study tested whether our unexpected findings from Study 1 would replicate in a new sample.
In the present study, we also made one key change: Instead of asking only about a typical person, we asked each participant to imagine a person, a woman, and a man. We then compared the correlation between the resulting image of a person and a woman to the correlation between that of a person and a man. If the first correlation is stronger than the latter, this would corroborate the results from the previous study and provide additional evidence that people tend to imagine the face of a “person” more as a woman than as a man. If, instead, the second correlation is stronger, this would suggest the presence of androcentrism.
By examining the relative overlap among these three categories, the present study addresses two alternative explanations for our unexpected results in Study 1. First, perhaps the base image is biased to look more like a woman than a man, causing participants to generate more female-looking images in Study 1. Or, similarly, perhaps all face morphs look more like women than men because the morphing procedure creates fuzziness and rounder jaw lines (Little & Hancock, 2002). If this alternative explanation is true, these factors would affect the images generated for all three categories in the present study—those of a person, a woman, and a man—allowing us to test for relative differences in the overlap. (Recall also there was no evidence in Study 1 that the machine-learning algorithm or the human raters classified the noise-superimposed base image stimuli as more female-looking.) A second alternative explanation involves the possibility that people imagine a typical person’s face as somewhat female-looking (Study 1), but they imagine a woman’s face as extremely female-looking, more so than they imagine a man’s face to be male-looking (Armann & Bülthoff, 2012). If this explanation is accurate, we will find less overlap between the image of a person and that of a woman than between the image of a person and that of a man in the present study.
Method
Participants
A preregistered power analysis suggested that 119 participants would give 90% power to detect a moderate effect (Cohen’s dz = 0.30) at a .05 significance criterion. Given the different design used, this effect size was set conservatively to about half of the effect size observed in our previous studies. We recruited participants via Prolific Academic for a survey of how people categorize different images. Using the predefined screening categories of the platform, all participants were prescreened to live in the US, to be university students (to match participants in Study 1), to have a ⩾ 95% approval rate, and to have at least completed 100 tasks. A total of 115 participants (Mage = 31.07, SDage = 10.41; 58 men, 56 women, one other) completed the survey, and all participants passed both attention checks (described below). Participants were paid the equivalent of £7.50 per hour.
Procedure
Participants were asked to complete three reverse-correlation tasks, each consisting of 150 trials, rather than 300 trials, to prevent participant fatigue. Using the same instructions as in Study 1, participants were asked to (a) select the image that looked most like a person in the first task. Next, in the second and third tasks, presented in a counterbalanced order, participants were asked to select the individual who looked (b) most like a woman and (c) most like a man. Finally, participants completed demographic questions. These included two attention checks: “To show that you pay attention, please select ‘Blue’” (response options: Green, Dark, Yellow, Blue) and “To show that you pay attention, please select ‘7’” (response options: 1–10).
Open science practices and data availability
All data, materials, and supplemental online materials are available at the OSF (see Endnote 2). We report all measures, manipulations, and exclusions. The present study was preregistered at the OSF. 4 We made only one change from the preregistration: We added a test of the informational value of each classification image (Brinkman et al., 2019).
Analyses and Results
We first calculated the group-level classification images across all participants for intuitive visualizations, as in Study 1 (see Figure 7). Although these images seemed to markedly differ, the infoVal of the individual classification images was low on average (typical man: M = 0.52, SD = 1.00; typical person: M = 0.62, SD = 1.19; typical woman: M = 0.58, SD = 1.15).
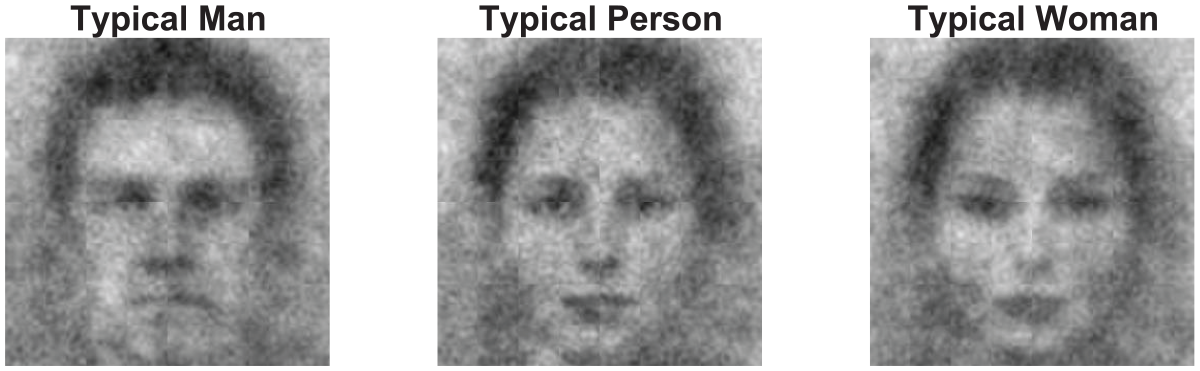
Classification images: Study 2.
For analyses, we calculated the three classification images that each participant generated for each of the three categories (i.e., of a person, a woman, and a man). We then used the “magick” (Ooms, 2021) library in R to extract the pixel values for each classification image (three images per participant) and saved them in 512 × 512 matrices. These matrices containing 262,144 pixels were used to calculate the two correlations. As the correlation coefficients can be expected to be inflated due to the same base image being used across categories (i.e., person, woman, man), we conducted analyses using the classification images (i.e., the base image with the noise patterns layered on top) and just the noise patterns (i.e., the classification images with the base image mathematically subtracted).
To compare the two correlations, we computed multilevel models with the correlation coefficients (dependent variable) predicted by comparison type (person with woman, person with man), with random intercepts to account for the correlations being nested within participants. In our first model examining the unadjusted correlations of the classification images (i.e., base image + noise patterns), the correlation coefficients differed for person with woman compared to person with man, B = −0.02, 95% CI [−0.02, −0.01], SE = 0.002, t(228) = −5.58, p < .001. An inspection of the marginal means showed that the average correlation coefficient between the image of a person and that of a woman was stronger, M = 0.89, 95% CI [0.88, 0.89], than that between a person and a man, M = 0.87, 95% CI [0.87, 0.88]; see Figure 8. This difference was substantial according to the effect size estimate, drm = 0.74. In the same model but examining the adjusted correlations of just the noise patterns (i.e., classification images – base image), a significant difference was observed, B = −0.07, 95% CI [−0.10, −0.03], SE = 0.02, t(228) = −3.52, p < .001. Again, the correlations between a person and a woman were stronger, M = 0.07, 95% CI [0.05, 0.10], than the correlations between a person and a man, which approached zero, M = 0.01, 95% CI [−0.02, 0.03], drm = 0.46 (see Figure 8).
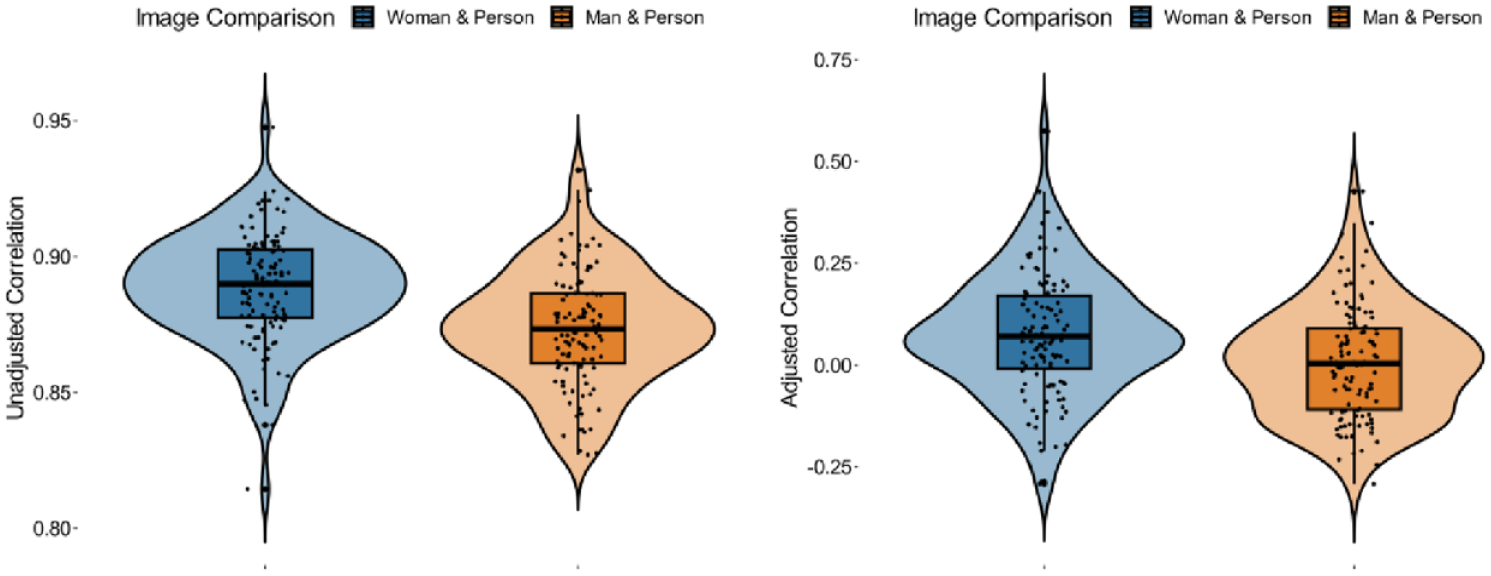
Raw (left panel) and adjusted (right panel) correlation coefficients between classification images for women and person, and man and person: Study 2.
As preregistered, we also tested for moderation by participant gender, by including it as a factor and as part of an interaction term (Participant Gender x Image Comparison) in these multilevel models. For unadjusted correlations (i.e., base image + noise patterns), the interaction between type of correlation and participant gender was significant, B = −0.02, 95% CI [−0.03, −0.005], SE = 0.005, t(112) = −2.87, p = .005. For men, the correlation between the image of a person and that of a woman was stronger, M = 0.884, 95% CI [0.88, 0.89], than that between a person and a man, M = 0.877, 95% CI [0.87, 0.88] (we report three decimals for these correlations to show the direction of the difference that would be lost when rounding to two digits). Still, this difference was small to moderate, and fell just below the .05 significance criterion, t(112) = 2.00, p = .048, drm = 0.37. By contrast, among women, there was a strong and significant difference, with the correlation between the image of a person and that of a woman being stronger, M = 0.89, 95% CI [0.89, 0.90], than that between a person and a man, M = 0.87, 95% CI [0.86, 0.88], t(112) = 5.99, p < .001, drm = 1.13.
Also, when using the adjusted correlation coefficients (i.e., classification images – noise patterns), the interaction between type of correlation and participant gender was significant, B = −0.11, 95% CI [−0.19, −0.04], SE = 0.04, t(224) = −3.90, p = .002. For men, the correlations between the images of a person and a woman, M = 0.03, 95% CI [−0.01, 0.07], and between a person and a man, M = 0.02, 95% CI [−0.02, 0.06], both approached zero and did not differ significantly, t(112) = 0.35, p = .725, drm = 0.06. However, among women, there was a strong and significant difference, with the correlation between a person and a woman, M = 0.12, 95% CI [0.08, 0.15], being stronger than the correlation between a person and a man, which approached zero, M = −0.01, 95% CI [−0.04, 0.03], t(112) = 4.68, p < .001, drm = 0.88.
Preliminary Discussion
Participants’ mental image of a person’s face was more strongly correlated with their image of a woman than a man, especially among women participants. Thus, this second study replicated the unexpected results from the first study, while further ruling out alternative explanations for the initially unexpected female-biased finding.
General Discussion
Participants across six countries seemed to be more likely to imagine a “person’s” face as a woman than as a man, based on automated machine-learning classifications and human ratings. In addition, there was some indication from the analyses with human ratings that women generated images that were rated slightly more female-biased than the images generated by men. Study 2 corroborated these unexpected results, showing that U.S. participants (and especially women) were more likely to imagine a “person” more similar to a “woman” than a “man.” Thus, men were relatively more male-biased than women, consistent with previous work on androcentrism (e.g., Bailey & LaFrance, 2016; M. C. Hamilton, 1991), but participants were overwhelming female-biased overall, and seemed to imagine a person’s face more as a woman than as a man.
What explains why, contrary to predictions, participants imagined a person’s face more as a woman than as a man? To first consider a more mundane possibility, participants’ female-biased face selections could reflect their desire to appear nonprejudiced and nonsexist. However, if this were the case, we should have observed androcentrism at least among participants who explicitly endorsed a sexist or androcentric worldview. The fact that none of the individual difference variables, including hostile sexism and androcentric ideology, were predictive of mental imagery in Study 1 renders this explanation unlikely (though note that reverse-correlation results do not always correlate with explicit measures, as we discussed in the introduction). A second possibility is that there was a low-level visual factor that could explain the present results. Although we cannot rule out all low-level explanations, exploratory analyses could not account for the female-biased findings in Study 1 (e.g., skin-to-feature contrast analyses). Study 2 further suggested that the effects observed in the first study were unlikely to be driven by a low-level feature in the base image. Study 2 examined relative overlap among three categories—person, woman, and man—all of which were based on, and thus accounted for, the same base image. Jointly, the studies tentatively suggest that the present findings may reflect a meaningful phenomenon.
A Female Default Face?
One possibility is that people may think of the concept of a person as a man, consistent with prior work on the psychological roots of androcentrism (e.g., Bailey et al., 2022; Eagly & Kite, 1987; M. C. Hamilton, 1991), but envision the default face as being more female-looking (Bailey, 2022). Some research on face perception finds evidence for a female default face (Thorne et al., 2015; Uddenberg & Scholl, 2018). For instance, Wardle et al. (2022, 2023) find that face-like objects (e.g., a traffic cone that looks like a face) are overwhelmingly perceived as men more than as women, but in supplementary analyses, they find that male/female morphs of human faces are perceived as women more than as men (although low-level explanations were not entirely ruled out).
A female default face is at least speculatively plausible for a few reasons. To consider one, female facial features may be overrepresented in people’s experiences of faces in general. Consider how gender-typical facial features develop across the lifespan (Martin & Ruble, 2010). Features perceived as typical of men, such as facial hair, are only present in a subset of adult men (Bruce et al., 1993; Dixon et al., 2016; Mareckova et al., 2011). By contrast, features perceived as typical of women, such as large eyes, are present in many adult women and children (Porcheron et al., 2017; Russell, 2009). Further, although men and boys are overrepresented in diverse media compared to women and girls (Niemi & Pitkänen, 2017; Varner, 2021), female faces may be more prominent and attention-grabbing, particularly in visual media due to widespread objectification and sexualization of women and girls (Kehinde & Abiodun, 2018; Ward et al., 2018). These two factors may contribute to the prevalence and prominence of female facial features and female faces, and result in a female default face.
An additional conjectural reason for why people may develop a female default face comes from a separate literature on face perception and the connection between typical faces and positive attributes. A well-established finding is that the more a face resembles a typical face (operationalized as the average of many faces), the more people see it as having positive attributes such as attractiveness, happiness, and trustworthiness (Dotsch et al., 2016; Sofer et al., 2014). Women also tend to elicit positive reactions and are regarded as happier and more trustworthy than men (Eagly et al., 1990; Kveraga et al., 2019; Miles, 2009). Considering the existing evidence and the results from the present study, the default face may include relatively more female facial features because both the default face and women are associated with positive attributes. Possibly because of this mechanism, some work also finds that typical faces (i.e., the average of many faces) tend to look less masculine to perceivers (Little & Hancock, 2002). Relatedly, it is possible that emotional expressions guided the selection of images. Previously, positive emotions have been associated with visual representations of women in reverse-correlation tasks (Brooks et al., 2018). While we did not assess the emotional valence of faces in the present study, future research may productively test this possibility by including it as a moderating factor.
Another factor that may have contributed to why we did not observe androcentrism in the present research is that we focused on mental imagery rather than language perception or production. Androcentrism may manifest most strongly in tasks that emphasize language. Recall that several languages codify androcentric practices via masculine generic terms by using male-specific terms (e.g., he) to refer to people of any and unknown gender (Hellinger & Bußmann, 2002; MacArthur et al., 2020; Sczesny et al., 2016).
When interpreting our results, it is crucial to remember that we focused only on one aspect of androcentrism. We examined participants’ mental imagery of faces, but interdisciplinary theories of androcentrism define it as a societal system organized around men that is evident in individual biases and institutional policies (Bailey et al., 2019; Bem, 1993; de Beauvoir, 1949/2010). For instance, historically, medication and pharmaceutical dosing have sometimes only been tested on men, which is often taken as an example of androcentric societal practices (Harrison, 2016). Although this practice seems to have been reduced or reversed with much of medical research nowadays focusing on women and women’s health issues (Bueter, 2017; Thelwall et al., 2022), women continue to face health inequities because of this historical practice (Harrison, 2016; Merone, 2023). While the possibility of female bias in mental imagery of faces is theoretically intriguing, its practical consequences may be limited, considering these larger societal androcentric forces. Thus, future research is needed to investigate the potential social implications of the tendency we observed in the current study in social contexts with varying degrees of androcentrism.
Limitations
After weighing the pros and cons, we used a base image adapted from prior work based on Scandinavian faces and most often used in reverse-correlation research (Dotsch et al., 2008). On the one hand, using images tailored to each cultural group would have increased the external validity of our results. On the other hand, it would have reduced the comparability across our cultural contexts, as different base images show different degrees and qualitative differences in distortion after random noise is added. Future research should examine if cross-cultural differences are more likely to emerge when the base image is from the local cultural context. Note, however, that we found similar results in countries for which the base image broadly matched the ethnic majority group of the cultural context (e.g., Norway, US) as in those where it did not (e.g., China, Ghana). Nevertheless, it is generally advisable to test whether findings can be replicated with different stimuli sets in reverse-correlation tasks (Brinkman et al., 2017). For instance, using base images from different racialized groups or of racially ambiguous faces could provide information about whether our effects emerge primarily for White faces or generalize to faces from other groups. Moreover, such replications and extensions of our work are important as visual representations of race and gender intersect (Phills et al., 2023; Shu et al., 2022).
Another limitation in Study 1 was that the human raters were all from the US. As such, their ratings may reflect perceptual biases specific to this cultural context. The use of machine-learning classification may avoid such influences (Gaetano et al., 2016); it is purported to be based on rich training sets that capture the diversity in the world (Roach, 2018). But complete information about the training sets is not publicly available.
Both studies are limited in that they relied on student samples across countries (Hanel & Vione, 2016). Although Study 2 was collected via a general participant pool, we opted to collect a student sample to ensure comparability across studies. It is possible that the effects observed in the present research represent a generational shift in gender attitudes (Pew Research Center, 2022). Thus, future research should test whether the effects are moderated by age with broader samples. Extant psychological research on androcentrism includes samples of children (Hsiao et al., 2021), students (Sesko & Biernat, 2010), and adults (Bailey et al., 2020), but there has been little systematic work on possible age and generational differences.
Finally, it is worth noting that the informational value in the individual classification values was comparably low. This finding may suggest that people may not have clear prototypes of a person at the level of mental imagery. Although the fact that we replicated our Study 1 findings in Study 2 gives us some confidence in our results, future research should aim to replicate our findings with a higher number of trials (Brinkman et al., 2017, 2019). Low infoVals may result from response biases in reverse-correlation tasks, such as order effects and runs (repeated left or right responding; Kevane & Koopmann-Holm, 2021). Including stricter attention checks and more conservative prescreening of participants based on their attentiveness than in the present study may increase the data quality.
Conclusion
Androcentrism, including the psychological bias to think of a typical person as a man more than as a woman, has adverse consequences for women, but has mostly been investigated using tasks that emphasize language (Bailey et al., 2019; Hegarty et al., 2013; Sczesny et al., 2016). This research aimed to increase our understanding of androcentrism in the mental imagery of faces and cross-culturally. Yet, we did not find evidence of such male bias across six countries. Instead, we found tentative evidence that people imagine the face of a typical person more as a woman than as a man. One possibility is that male bias might emerge most strongly in tasks that emphasize language. Future research could directly compare gender bias resulting from tasks involving imagery of faces to tasks involving language production or interpretation. Despite a prominent view that people think of a typical person as a man more than as a woman, we find that people imagine the face of a typical person as a woman more than as a man.
Footnotes
Acknowledgements
The authors thank Dr Clara Colombatto and Dr DongWon Oh for their insightful comments on previous versions of this manuscript.
Author Contributions
MJ, JRK, and AHB designed Study 1. All authors collected the cross-cultural data in Study 1. JRK collected the machine-learning results and human ratings, and analyzed the data in Study 1. JRK and AHB designed Study 2. JRK collected the data and conducted the analyses in Study 2. JRK, AHB, and MJ drafted the manuscript. JRK and AHB revised the manuscript. All authors provided critical revisions.
Funding
The author(s) received no financial support for the research, authorship, and/or publication of this article.