
Abstract
Previous research has followed a binary perspective in analyzing the effects of modernization and globalization, often assumed to produce the societal camps of both “winners” and “losers” in economic, cultural, and political terms. However, our understanding of these individual differences and the social groups that perceive themselves as disadvantaged by society is still limited. Hence, in contrast to previous findings we argue that the phenomenon may be better grasped by following a “pattern approach.” Hence, in three different samples (total N = 2,566), we applied Latent Class Analysis to investigate subgroups representing individual differences in Perceived Societal Marginalization (PSM). Furthermore, we explored sociodemographic, personal-resource-related, attitudinal, and personality determinants of people’s class membership probabilities to better understand the subgroups—or: patterns—we identified in substantive terms. In the discussion, we focus on the implications of our findings regarding societal cleavages, prejudice toward minority groups, and the support of far-right political parties.
Research in the social sciences argues that globalization and modernization produce both “winners” and “losers” in economic, cultural, and political terms. Whereas some people welcome the opportunities of open markets, group equality, and multilateralism, others view these developments as a source of marginalization and as a threat to their own social groups (e.g., Branscombe et al., 1993; Goodhart, 2017; Zürn & de Wilde, 2016). The resulting societal cleavage manifests itself in cultural and national identity struggles (Koopmans & Zürn, 2019), as illustrated by growing nationalist movements (Goodhart, 2017; Raines et al., 2017), anti-immigrant attitudes (Decker & Brähler, 2018; Esses et al., 2001, 2017; Lengfeld & Dilger, 2018; Stewart et al., 2019), and anti-multilateralism (McLaren, 2002; Peitz et al., 2018; Raines et al., 2017). In this article, we question this binary approach and explore the assumption that rather than thinking about “winners” and “losers” of globalization, we should conceive of large societal developments creating a more complex setting of social groups who deviate from each other in perceiving societal marginalization on divergent dimensions to different degrees (pattern approach). Hence, we argue that these social conflicts can be better understood by analyzing individual differences in profiles of Perceived Societal Marginalization (PSM), that is, individual differences in the subjective perception that one’s own social group is being depreciated and rendered unimportant by society in the domains of economy, culture, and politics (Bollwerk et al., 2022). This approach allows us (a) to identify subgroups of more or less marginalized individuals and (b) to provide a detailed characterization of such groups in terms of sociodemographic, attitudinal, and personality differences.
Previous Research on Marginalized Groups
Most past psychological research has focused on specific concepts of marginalization (e.g., the degree of subjective social status or political alienation, e.g., Adler et al., 2000; Calabrese & Adams, 1990) and followed a variable-centered approach investigating how differences in one specific variable are associated with a variety of correlates and outcomes. This research did not consider how different aspects of marginalization manifest in combination within individuals (i.e., a person-centered or pattern approach) and which groups of individuals can be distinguished. The existing approaches in sociology and political science, in contrast, that do differentiate between groups of individuals, applied various binary conceptualizations of (subjectively) disadvantaged groups and their associated nationalist and anti-immigrant attitudes. This included “somewheres” (as opposed to “anywheres”; Goodhart, 2017), “communitarians” (as opposed to “cosmopolitans”; Zürn & de Wilde, 2016), and “authoritarians” (as opposed to “liberals”; Raines et al., 2017), among others. Consistent sociodemographic characteristics of these groups include an older age, maleness, a lower level of education, a lower income, and the rurality of one’s place of residence, whereas their attitudinal characteristics span higher levels of religiousness, political right-wing attitudes, and threat perception in the face of ethnic diversity, among others (Branscombe et al., 1993; Esses et al., 2017; Goodhart, 2017; Issmer & Wagner, 2015; Landmann et al., 2019; McLaren, 2002; Minkenberg, 2000; Norris & Inglehart, 2019; Peitz et al., 2018; Raines et al., 2017; Stephan & Stephan, 2017).
Regarding the modality of these groups’ societal discontent, previous studies have mostly focused on economic, cultural, and political aspects (see Minkenberg, 2000; Norris & Inglehart, 2019). Although these aspects are related (e.g., someone may regard the growing cultural change as a threat to their economic situation), people do not necessarily experience them simultaneously (e.g., someone may be wealthy and still reject immigration). However, the existing literature and its binary focus lacks a differentiated view on these relationships. That is, subjectively disadvantaged groups and their reasons for societal discontent are largely treated as homogeneous. It is unknown whether different subjectively marginalized groups (e.g., people who experience cultural but not economic marginalization and vice versa) can be distinguished consistently and, if so, on the basis of which sociodemographic and psychological characteristics. Following a pattern approach, understanding the patterns of perceived disadvantage and the characteristics of the associated groups of people is crucial because it will enable us to better identify and respond to the reasons for societal discontent and its negative outcomes.
Individual Differences in Perceived Societal Marginalization
In explaining societal discontent, there is a large body of research that has focused on measures intended to capture objective criteria of marginalization, such as socioeconomic status (e.g., Manstead, 2018), ethnic origin (e.g., Stephan & Stephan, 2017), or political party affiliation (e.g., Minkenberg, 2000). Although these factors are related to societal discontent, their explanatory value is limited because the attitudes of people within certain categories (e.g., people with low socioeconomic status) often still show great variability (Norris & Inglehart, 2019; Raines et al., 2017). Subjective measures of marginalization provide additional explanatory value, including the concepts of subjective social status (Adler et al., 2000), relative deprivation (Smith et al., 2012), and political alienation (Calabrese & Adams, 1990). These subjective measures are associated with objective indicators of marginalization but are even more strongly shaped by a range of psychological processes such as motives, expectations, and social comparisons. Thus, they only partially overlap with objective indicators. Importantly, they are also much more strongly related to relevant political attitudes, behaviors, and decisions: when it comes to feeling threatened by immigrants and distrusting politicians and political institutions, for example, it is more important how much people perceive to be societally included versus marginalized as compared to how much they actually are (e.g., Back et al., 2022; Bollwerk et al., 2022).
Even though these more subjective psychological constructs contribute to our understanding of societal discontent, they are limited in several ways. Most of the existing constructs refer to individual-level perceptions with no reference to people’s social groups. However, previous studies have shown that collective experiences predict negative societal outcomes (e.g., outgroup devaluation) more strongly than individual experiences do (e.g., Smith & Ortiz, 2001). In addition, societal developments affecting entire groups are more likely to elicit group-level reactions than developments affecting single individuals (Jetten et al., 2001). Finally, the discussed measures lack the kind of standardized and comparable content coverage (i.e., economic, cultural, and political domains) that is necessary to allow for the investigation of the aforementioned patterns or clusters of societal discontent.
Therefore, we recently introduced the concept of PSM that differentiates perceptions of marginalization in the domains of economy, culture, and politics (Bollwerk et al., 2022). In focusing on these three domains, we specifically take into account the recent debates about the effects of globalization and modernization on societal and political discontent, that have been ascribed to an economic “losers of modernization,” a “cultural backlash,” and a politics-based “post-democratization” hypothesis (e.g., Norris & Inglehart, 2019; Schäfer, 2022). Bollwerk et al. (2022) showed that PSM can be measured reliably, follows the theoretically derived structure, and is robustly associated with a wide range of theoretically derived and preregistered correlates. With excellent psychometric properties and a stable cross-sample nomological network, PSM provides a theoretically and psychometrically sound basis from which to explore subgroups of subjectively more or less marginalized individuals.
Identifying and Characterizing PSM Subgroups with Latent Class Analysis
A variable-centered approach to PSM is sufficient as long as individuals can only be differentiated from each other with regard to their level of perceived marginalization (across economic, cultural, and political PSM domains). It is, however, silent with respect to level-independent patterns, in which the PSM domains differ in their level within individuals. The presence of groups of individuals with such patterns remain undetected with the regular variable-centered approach although it has very relevant consequences both with regard to understanding feelings of marginalization theoretically and when it comes to deriving political measures to counteract PSM. For example, the existence of a group with strong economic but low cultural or political marginalization might call for economic measures and a more detailed analyses of how such individuals also become culturally and/or politically marginalized. Thus, it is important to analyze whether such groups exist and what concrete patterns of PSM aspects these groups are made of. The results of such analyses are theoretically and practically relevant independent of how they look. In the case that we only find groups that differ in their level of PSM across all PSM aspects, this speaks for a strong common core of economic, cultural, and political feelings of marginalization and/or strong mutually reinforcing pathways that hold for most individuals. This in turn would justify more generic means to counteract PSM that target one or more PSM aspects simultaneously. In contrast, in the case that we additionally find groups of individuals that show high levels of PSM only in some PSM domains, this speaks in favor of additional domain-specific causal pathways and calls for domain-specific means to counteract PSM.
To identify subgroups who differ in their PSM, we used Latent Class Analysis (LCA) for data based on polytomous rating scales (Gollwitzer, 2012; Lazarsfeld, 1950; Lazarsfeld & Henry, 1968). LCA is an established method for identifying subgroups of people on the basis of subjective constructs, for example, with respect to environmental concerns (e.g., Rhead et al., 2018), workplace attitudes (e.g., Jessiman-Perreault et al., 2021), and narcissism (e.g., Wetzel et al., 2016), among others. A strength of LCA is its ability to identify quantitative and qualitative differences in response patterns. In contrast to other approaches (e.g., regression), it does not assume a unidimensional construct but can capture differences across and within the domains of a multidimensional construct (e.g., PSM with its economic, cultural, and political domains). Furthermore, LCA allows for the correlation of participants’ latent class membership probabilities with sociodemographic, attitudinal, and personality measures. Such correlations enable a differentiated characterization of the latent PSM subgroups.
The Present Research
In this study, we applied LCA to (a) distinguish PSM subgroups that differ in item response patterns and (b) identify sociodemographic, attitudinal, and personality correlates of PSM subgroup membership. 1 The present research builds on the work of Bollwerk et al. (2022), in which we have established the construct of PSM and explored its structure and nomological network. Importantly, this previous work only looked at PSM following a variable-centered approach, investigating the correlates of different levels of PSM overall and for each PSM domain separately. The present research provides a complementary person-centered approach that allows for the first time to investigate groups of individuals with differing patterns across PSM domains. In three large online surveys, we administered the 15-item PSM scale. In all three samples, we distinguished the PSM subgroups on the basis of predefined criteria and investigated the relationships between latent class membership probabilities and sociodemographic measures. In Samples 1 and 3, in addition, we investigated attitudinal and personality correlates of the latent class membership probabilities. All study material (i.e., surveys, data, statistical code, and Supplemental Material) is available at https://osf.io/b3u87/. The three samples were used because (a) they were available from the context of an earlier study with the goal of developing and validating the PSM scale 2 (Bollwerk et al., 2022), because they allowed for a (b) statistically powerful initial test of PSM subgroups based on (c) a diverse composition of participants, and (d) offering a broad set of sociodemographic, attitudinal, and personality correlates.
Method
Participants
Participants were recruited for Sample 1 via the online platform Psyweb and in Facebook groups expected to vary in terms of sociodemographic measures and political orientation, whereas participants were recruited for Samples 2 and 3 via the research institute respondi. The respondi online access panels enabled the sampling from a panel with a higher representativeness than convenience samples in terms of age, gender, and educational level. Sample size planning for each sample was based on an earlier study and corresponded to the conservative recommendation that at least 500 participants should be sampled to obtain reliable estimates of correlations (Comrey & Lee, 2013). To account for the partial invalidity of observations, we oversampled by recruiting at least 1,000 participants per sample. We excluded participants on the basis of non-German citizenship (106 participants in total), zero variance on the PSM items (67 participants in total), and abnormal completion duration of the surveys, that is, an average of less than 5 s per item (287 participants). The final Sample 1 consisted of 870 participants (60% women) between the ages of 18 and 85 (Mage = 45.89, SDage = 16.20), with 51% of the participants having at least a university degree. Sample 2 included 939 participants (50% women) between the ages of 18 and 74 (Mage = 46.04, SDage = 14.82), with 19% of the participants having at least a university degree. Sample 3 consisted of 757 participants (51% women) between the ages of 18 and 74 (Mage = 48.67, SDage = 15.72), with 16% of the participants possessing at least a university degree.
Clearly, Sample 1 differed from the other two samples—and from the German population—especially in terms of educational level. This needs to be taken into account, given that sample composition can have an effect on the range and distribution of perceived marginalization we observe. Therefore, we added the label “highly educated” to Sample 1 and “representative” to Samples 2 and 3 in the remainder of the text in places where it helps to better explain the results. Table S1 in the Supplemental Material online presents the sample characteristics of all three samples (see also the Supplemental Results at https://osf.io/b3u87/).
Procedure
In all three surveys, we began by asking participants to consent to the data protection regulations, followed by a series of sociodemographic items (e.g., age, gender, and educational level). Afterwards, participants completed the 15-item PSM scale for which each item was scored on a 6-point Likert scale ranging from 1 (strongly disagree) to 6 (strongly agree). The survey for Sample 2 ended at this point, and we thanked participants for their participation, after which they received a respondi-specific participation incentive. In the other two surveys, we subsequently administered a series of attitudinal (e.g., right-wing attitudes) items. In the survey administered to the third sample, we additionally administered a series of personality (e.g., openness) items. All measures are described in detail in the following section. At the end of the first survey (i.e., Sample 1), participants were thanked, given optional feedback on their Right-Wing Authoritarianism (RWA) and Social Dominance Orientation (SDO) scores, and were informed they could participate in a lottery with the chance to win an online voucher worth 25 Euro. At the end of the second respondi survey (i.e., Sample 3), participants were thanked and given a respondi-specific participation incentive.
Measures
The described sociodemographic measures and PSM items were included in all three surveys. All other measures were only administered to Samples 1 and 3, except for the Big Five personality items, which were only administered to Sample 3. All intercorrelations of the administered scales are presented in Table S2 (sample-specific) and Table S3 (pooled sample) in the Supplemental Material.
Perceived societal marginalization
All PSM items were scored on a 6-point Likert scale ranging from 1 (strongly disagree) to 6 (strongly agree). The 15 items corresponded to three societal domains, with each being represented by five PSM items. These domains were economy (e.g., “The work of people like me is not valued enough by society”), culture (e.g., “The cultural interests of people like me are given too little consideration in society”), and politics (e.g.,“Most politicians do not care what people like me think”). Descriptive statistics for the 15 PSM items and the three PSM subscales (i.e., perceived economic marginalization, perceived cultural marginalization, and perceived political marginalization) are depicted in Table 1 for the pooled sample and Tables S4 to S6 for each of the individual samples.
Means, standard deviations, and intercorrelations of PSM items and scales in the pooled sample (N = 2,566).
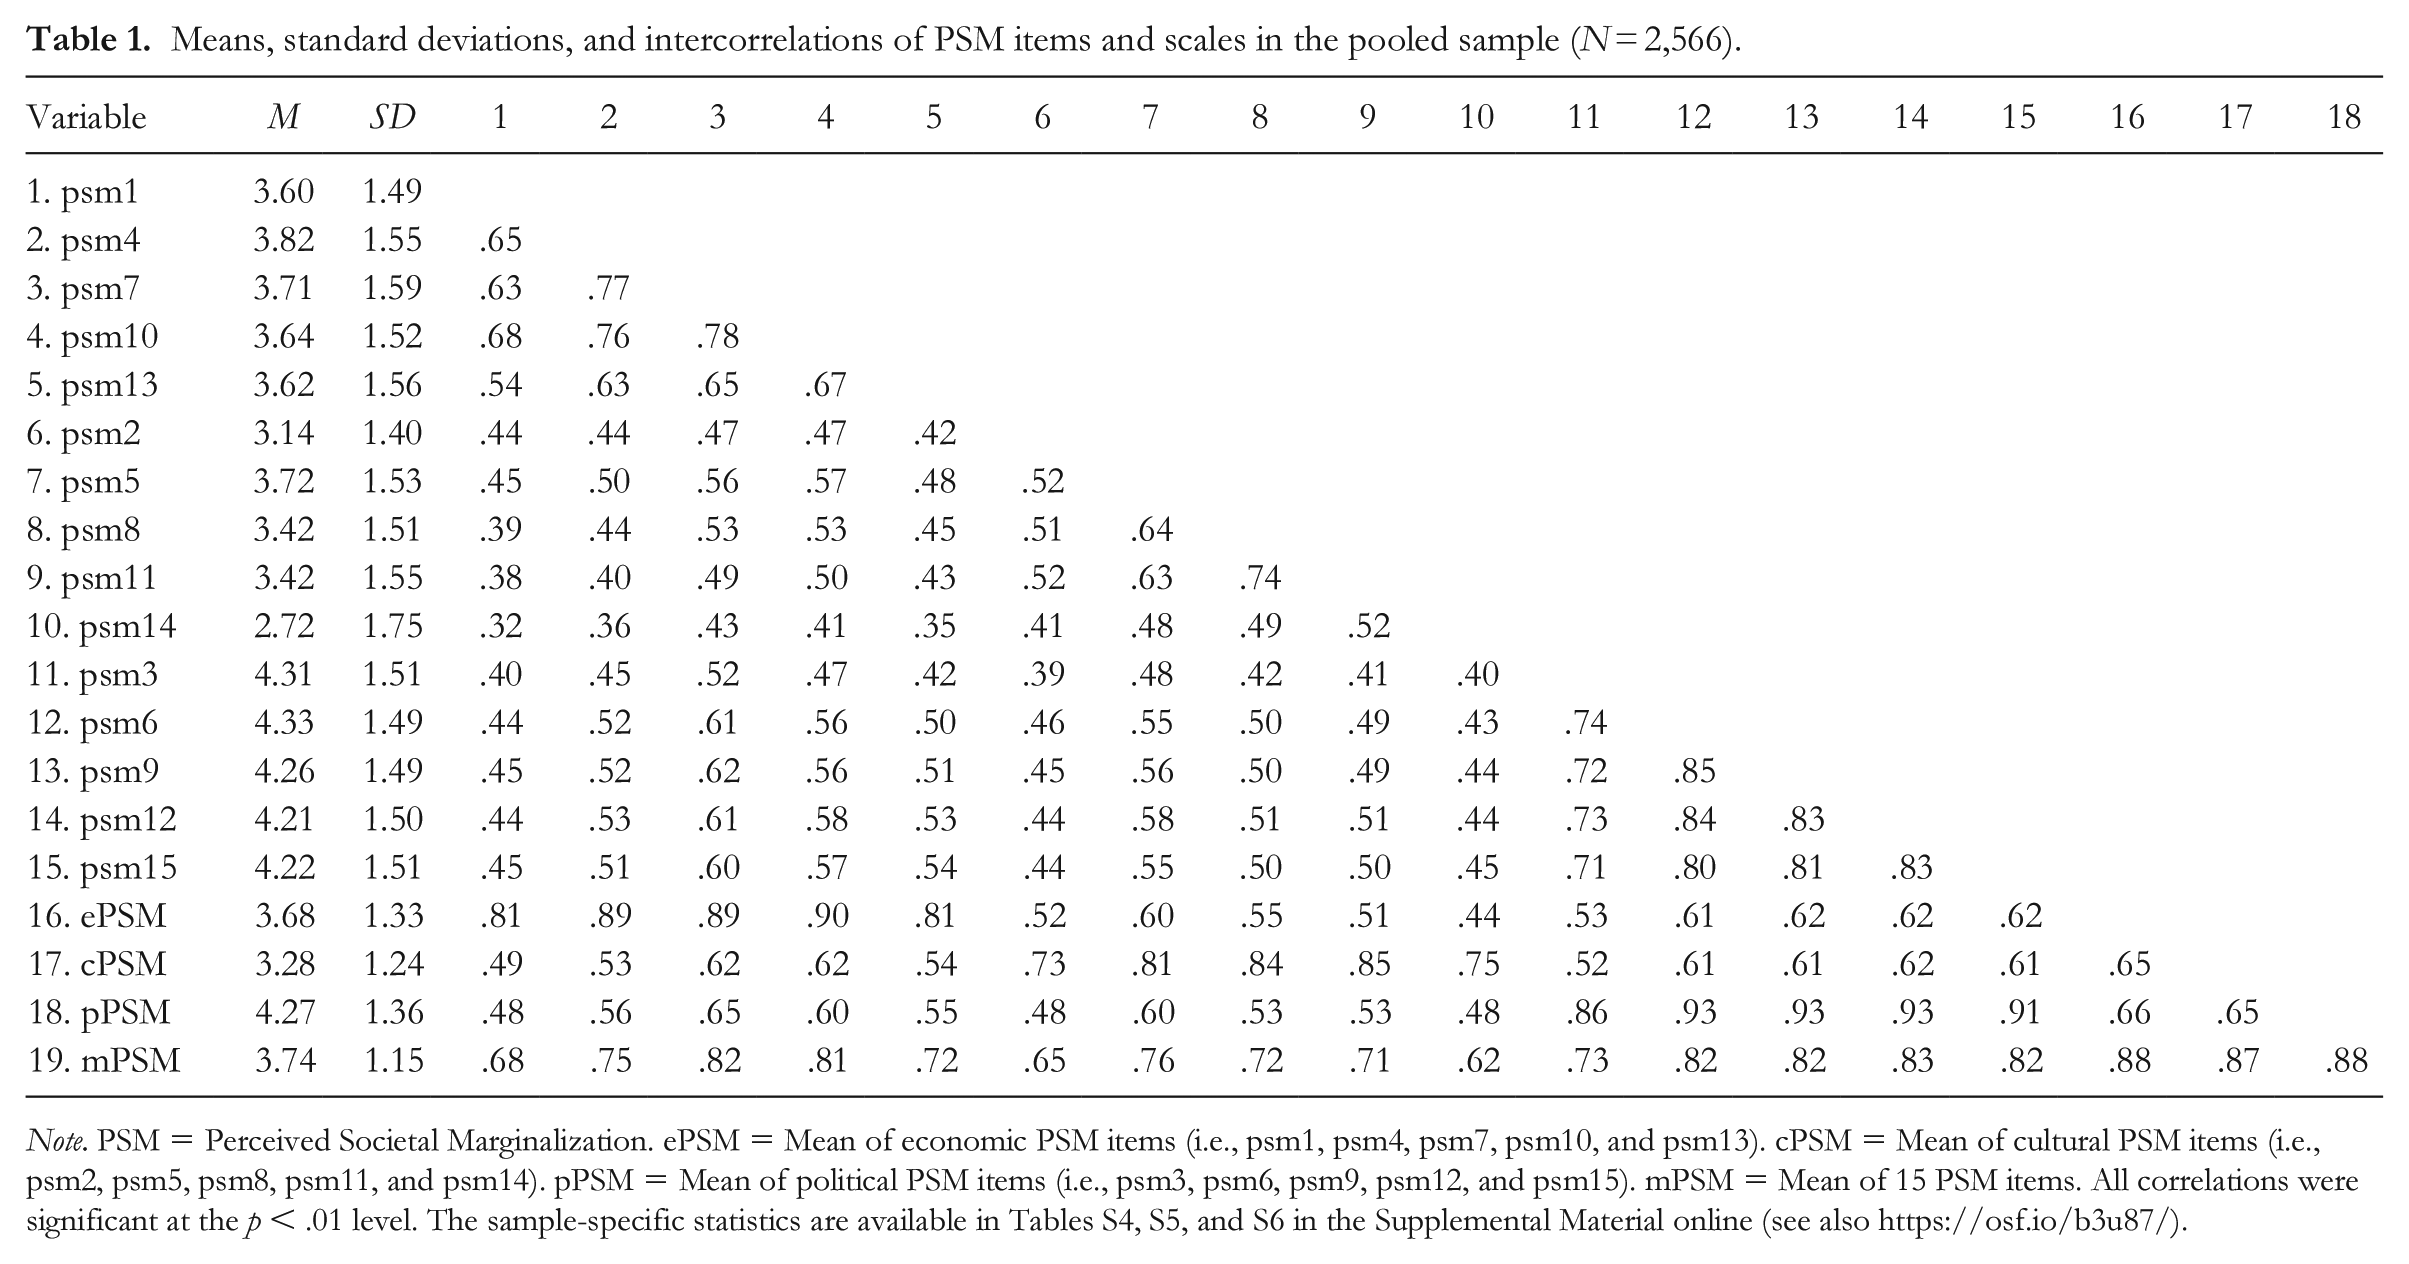
Note. PSM = Perceived Societal Marginalization. ePSM = Mean of economic PSM items (i.e., psm1, psm4, psm7, psm10, and psm13). cPSM = Mean of cultural PSM items (i.e., psm2, psm5, psm8, psm11, and psm14). pPSM = Mean of political PSM items (i.e., psm3, psm6, psm9, psm12, and psm15). mPSM = Mean of 15 PSM items. All correlations were significant at the p < .01 level. The sample-specific statistics are available in Tables S4, S5, and S6 in the Supplemental Material online (see also https://osf.io/b3u87/).
Sociodemographic measures
We assessed participants’ gender, age, relationship and occupational status, educational level (from 1 = no high school diploma to 10 = doctoral degree), nationality, monthly net income (from 1 = less than 500 Euro to 7 = more than 4,000 Euro), religion, and size of their place of residence (from 1 = fewer than 5,000 inhabitants to 7 = more than 500,000 inhabitants).
Personal-resource-related measures
Subjective societal status was assessed with the MacArthur Scale of Subjective Social Status, translated into German (SSS; Adler et al., 2000). Participants were asked to rank themselves on a 10-step social ladder—with “1” representing the lowest and “10” the highest SSS—while considering their income, educational level, and occupational status in relation to all other members of society.
Subjective social class was measured by asking participants to indicate their social class by selecting one of six options (1 = lower class, 2 = working class, 3 = middle class, 4 = upper middle class, 5 = upper class, 6 = none of these classes [coded as missing]).
Personal relative deprivation was assessed with a four-item scale presented by Callan et al. (2008) translated into German. All items were scored on a 6-point Likert scale ranging from 1 (strongly disagree) to 6 (strongly agree) and aggregated into a mean score for personal relative deprivation (α = .67 in Sample 1 and α = .61 in Sample 3).
To assess subjective social support, we used an eight-item Likert scale ranging from 1 (not true) to 4 (exactly true; Schwarzer & Schulz, 2000). Four of the items assessed subjective emotional support, whereas the other four measured subjective instrumental support. Both item sets were aggregated into single mean scores for subjective emotional support (α = .88 in Sample 1 and α = .89 in Sample 3) and subjective instrumental support (α = .90 in Sample 1 and α = .92 in Sample 3).
Attitudinal measures
To assess RWA, we used an authoritarianism short scale (KSA-3; Beierlein et al., 2014) with all items scored on a 5-point Likert scale ranging from 1 (strongly disagree) to 5 (strongly agree) and aggregated into a mean RWA score (α = .84 in Sample 1 and α = .85 in Sample 3). The KSA-3 consists of three subscales, namely Authoritarian Aggression (e.g., “We should take strong action against misfits and slackers in society”), Authoritarian Submissiveness (“We need strong leaders so that we can live safely in society”), and Conventionalism (“Well-established behavior should not be questioned”).
To assess SDO, we used two different scales. In the first sample, we applied a four-item short scale (Pratto et al., 2013) with all items scored on a 10-point Likert scale ranging from 1 (strongly disagree) to 10 (strongly agree) and aggregated into one mean SDO score (α = .49). Because the scale’s internal consistency was not satisfactory, in Sample 3, we used a different eight-item short version (Sibley & Duckitt, 2009) that was translated into German by Six et al. (2001). The SDO items were scored on a 7-point Likert scale ranging from 1 (very negative) to 7 (very positive). After reverse-coding some of the items, we aggregated the scores into a single mean SDO score (α = .82).
We measured left–right ideology with three separate 9-point scales that represented social, economic, and general issues and were scored from 1 (extreme left) to 9 (extreme right), where 5 represented a moderate position (Imhoff & Bruder, 2014).
We assessed religiousness by administering a 7-point Likert scale ranging from 1 (not at all religious) to 7 (very religious).
Personality measures
To measure the Big Five personality dimensions, we administered the 30-item BFI-2-S (Rammstedt et al., 2018). All items were scored on a 5-point Likert scale ranging from 1 (strongly disagree) to 5 (strongly agree) and aggregated into single mean scores for extraversion (α = .71), agreeableness (α = .64), conscientiousness (α = .75), neuroticism (α = .83), and openness (α = .70).
Internal locus of control was assessed with a four-item Likert scale (Kovaleva et al., 2012) scored from 1 (strongly disagree) to 5 (strongly agree). After reverse-coding two items, we aggregated the four items into one mean internal locus of control score (α = .71 in Sample 1 and α = .67 in Sample 3).
General trust was assessed by asking participants to indicate the extent to which they trust other people in general on a single-item scale ranging from 1 (you cannot be cautious enough) to 10 (you can trust most people; GESIS – Leibniz-Institut für Sozialwissenschaften, 2017).
Data Analysis
We applied LCA for polytomous rating data with the “poLCA” package in R (Linzer & Lewis, 2011). LCA is a classification method that allows observed item response patterns to be assigned to a fixed number of subgroups (i.e., the levels of a categorical latent variable). These subgroups (i.e., latent classes) can be characterized by both quantitative (e.g., high vs. low scores on a measure) and qualitative differences (i.e., interactions between the latent class variable and manifest item response patterns). To reliably distinguish the latent classes from each other, the LCA algorithm aims to maximize homogeneity within and heterogeneity between latent classes. For every individual, LCA estimates the probability of belonging to each of the latent classes. Subsequently, individuals can be manifestly assigned to the latent class for which they have the highest probability of membership. These class memberships allow for a between-subgroups comparison of item response patterns. In addition, correlates of the class membership probabilities can be investigated.
LCA represents a parsimonious method that does not require the data to be normally distributed or unidimensional (McCutcheon, 1987; Wetzel et al., 2015). This makes LCA a valuable method for the present study because PSM is assumed to be a non-normally distributed and multidimensional construct, consisting of the domains of economy, culture, and politics (Bollwerk et al., 2022). To investigate the relationships of the latent PSM classes with the administered sociodemographic, attitudinal, and personality measures, we applied latent class regression by incorporating these measures as predictors of participants’ latent class membership probabilities.
To determine the appropriate number of latent classes, we applied five common criteria. First, we used the Bayesian Information Criterion (BIC; Schwarz, 1978) to compare LCA models with one to 10 latent classes, with the lowest BIC indicating the best model fit. Previous studies have shown the superiority of the BIC over other information criteria in determining the number of latent classes (Li et al., 2009; Nylund et al., 2007). Second, each latent class should have a reasonable size (i.e., at least 5% of the total sample). Third, we applied a threshold of .85 (Rost et al., 1999) for the mean class membership probability in each of the latent classes. Stated differently, in each latent class, the certainty of assigning the individuals to the latent class must be, on average, at least 85%. Fourth, each latent class should be interpretable with respect to its expected value profiles (e.g., the expected values on items pertaining to the same domain should be similar for a particular latent class). Finally, the only latent classes we regarded as meaningful were the ones that were substantially reproduced and, thus, comparable across the three samples.
Results
The PSM subscales correlated .65 (cultural PSM with both economic and political PSM) and .66 (economic PSM with political PSM). Thus, although we found that the three subscales were interrelated, they can be concluded to represent distinct constructs that might be differentially related to different latent PSM classes (for a detailed discussion of the PSM scale, see Bollwerk et al., 2022). In the following, we will first describe the results of the latent class analyses including the interpretation of the main classes. Then, we will report which sociodemographic, personal-resource-related, attitudinal, and personality measures predicted latent class membership.
Latent Class Analyses
Table 2 shows the results of the latent class models for the 15 PSM items in the three samples. Based on the BIC, the models with six (Sample 1), seven (Sample 2), and five (Sample 3) latent classes showed the best fits, respectively.
Latent class model results for the three samples.
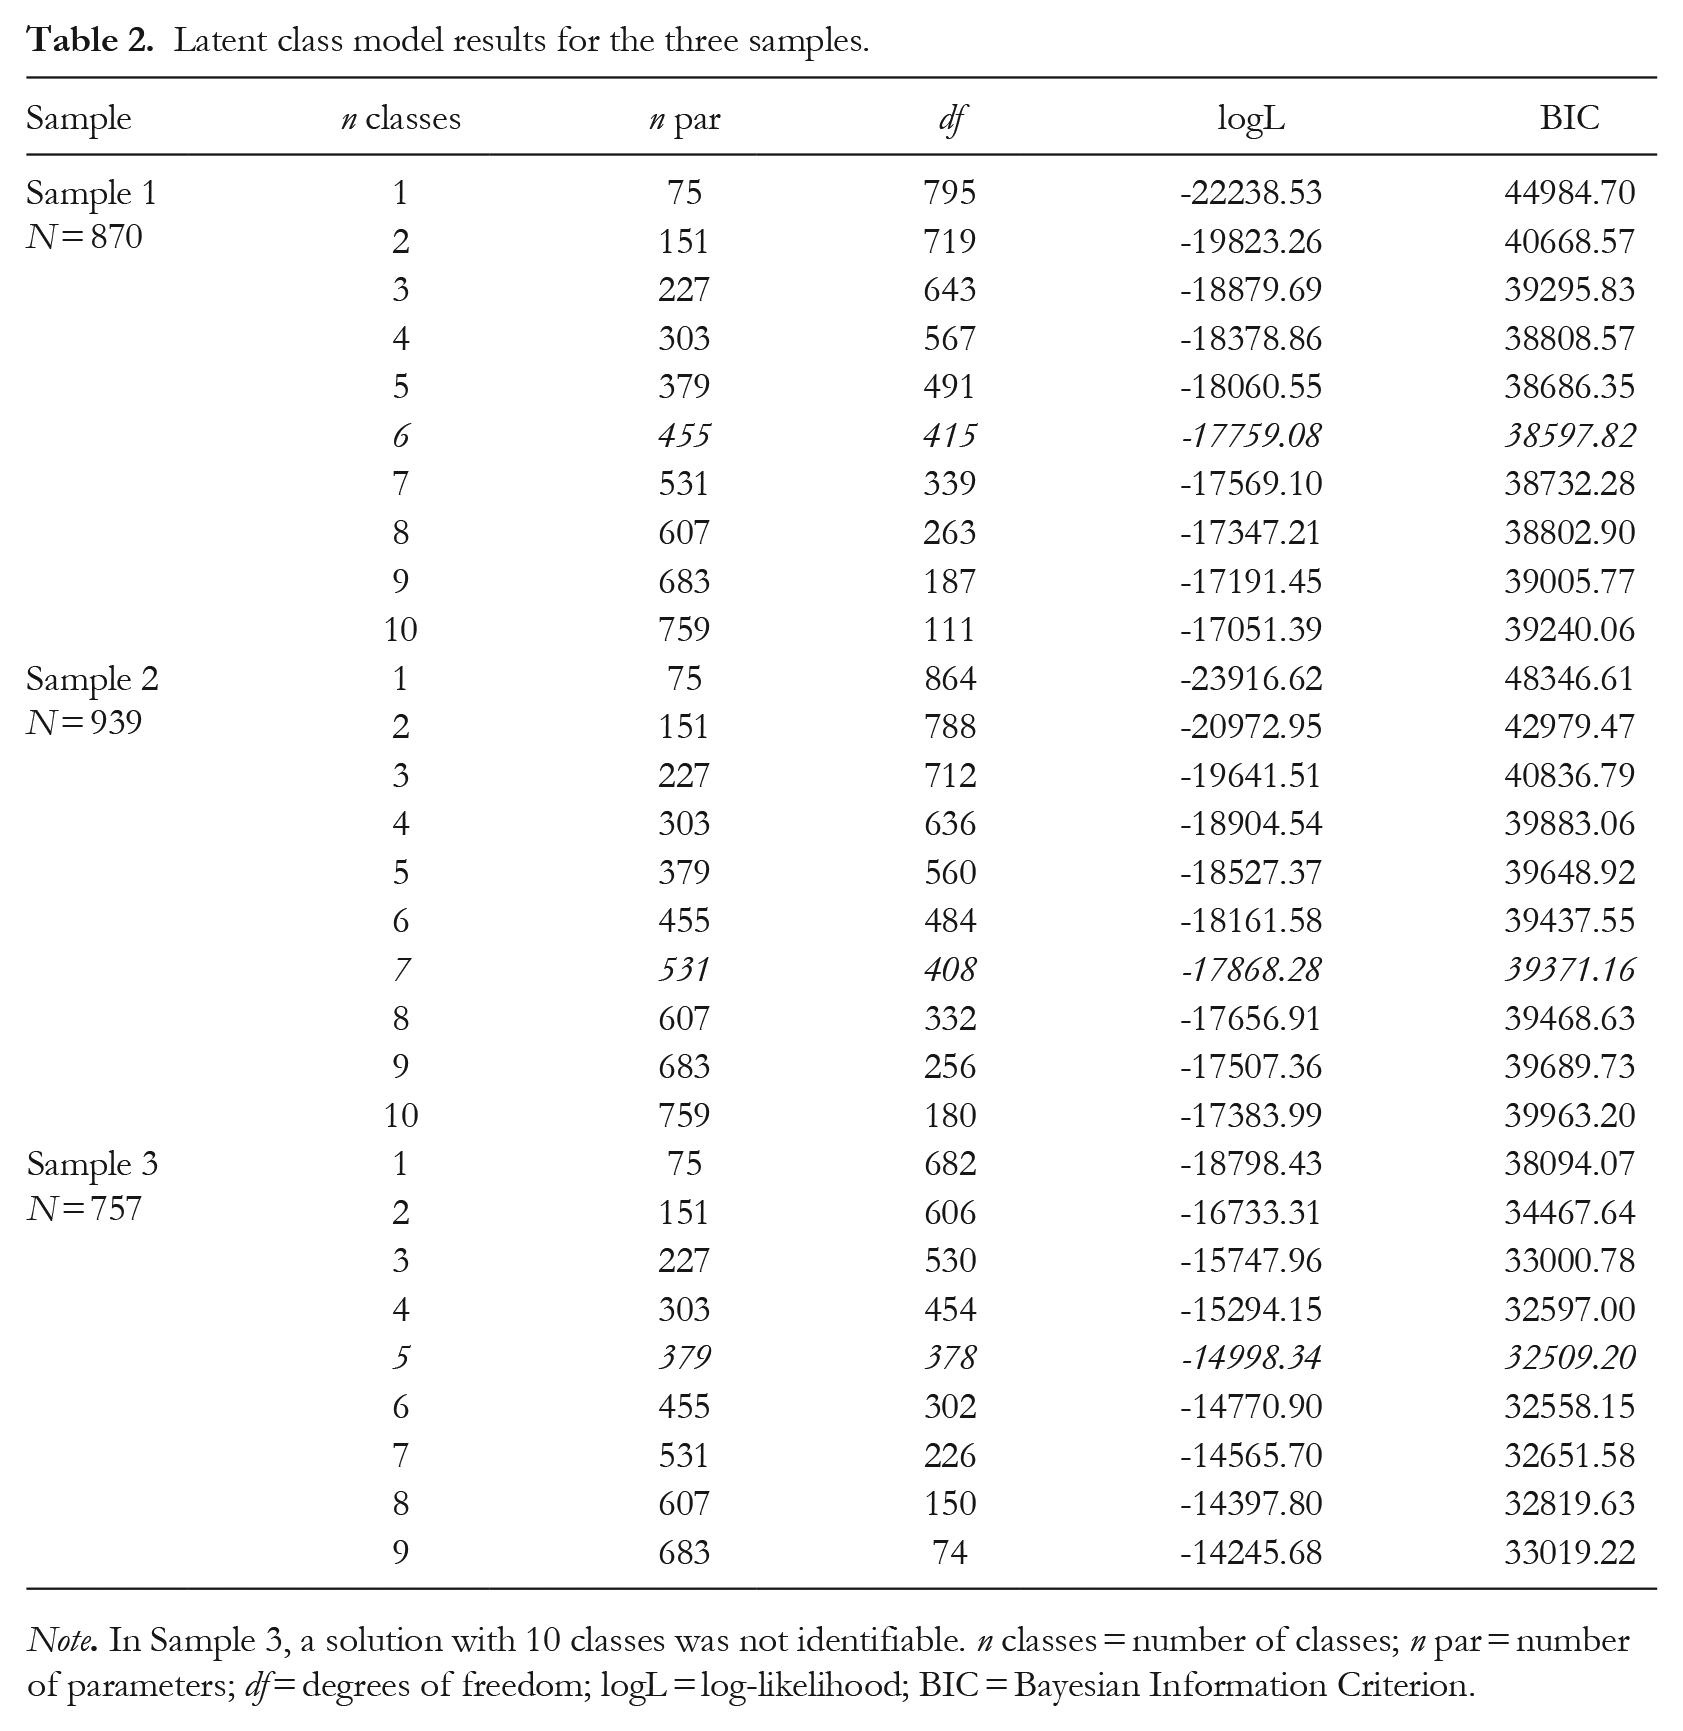
Note. In Sample 3, a solution with 10 classes was not identifiable. n classes = number of classes; n par = number of parameters; df = degrees of freedom; logL = log-likelihood; BIC = Bayesian Information Criterion.
The relative sizes of the seven classes ranged from 10% to 22% in Sample 1, from 8% to 26% in Sample 2, and from 15% to 25% in Sample 3. Hence, none of the classes were particularly small or large, indicating that they were all important with respect to the number of respondents they represented. Participants were classified with a high degree of certainty across samples and latent classes: the average class membership probabilities in the three samples were .96, .95, and .96, respectively, with values ranging from .93 to .98 across samples.
Our interpretations of the obtained solution focus on the latent classes that were substantially reproduced in each of the three samples. For interpretating the latent classes substantively, we examined plots of the expected values on the PSM items (see Figure 1 for the main classes and Figure S1 for all classes). The noncrossing lines of the expected value profiles indicate quantitative (linear) differences, whereas the crossing lines indicate qualitative (nonlinear) differences (Kempf, 2012). We found four latent classes that were stable and reproducible across the different samples. The first class was characterized by the lowest average expected values across PSM domains (i.e., economics, culture, and politics) and is henceforth called “low PSM.” The second latent class had an expected value profile that was most similar to the overall mean value profile across PSM domains and is from now on referred to as “medium PSM.” The third latent class showed the highest average expected values across PSM domains and is hereafter referred to as “high PSM.” Finally, the fourth latent class was characterized with an above-average level of political PSM and a below-average level of economic and cultural PSM and is henceforth referred to as “politically marginalized.” The subgroups “low PSM,” “medium PSM,” and “high PSM” were consistently distinguished by quantitative (linear) differences across samples, as indicated by noncrossing and largely parallel value profile lines. The expected value profile of the “politically marginalized” latent class exhibited a nonlinear effect, as shown by the crossing expected value lines (see Figure 1 and Tables S7–S9 for the means of the three PSM subscales for each latent class in each sample).
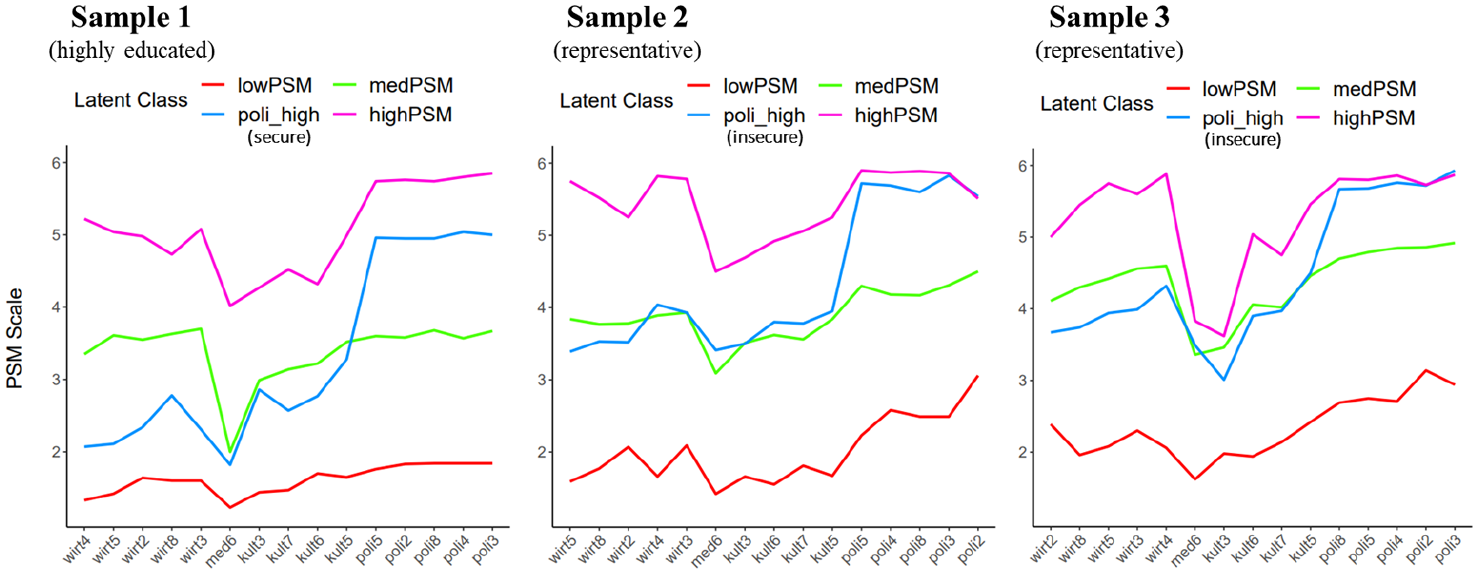
Expected values of the PSM items for the four main latent classes.
The “low PSM” class showed the lowest expected values across items, ranging from 1.42 to 3.06 (M = 2.01, SD = 0.47) in Sample 2. These values indicate that participants who were allocated to this class endorsed the second-lowest response category across domains on average. The expected values of the “medium PSM” class ranged from 3.09 to 4.50 (M = 3.89, SD = 0.37) in Sample 2. Hence, participants in the “medium PSM” class endorsed, on average, the third or fourth response categories across PSM domains. The “high PSM” class endorsed, on average, the fifth response category across PSM domains, as indicated by expected values ranging from 4.50 to 5.90 (M = 5.44, SD = 0.47) in Sample 2 (see Tables S7 and S9 for the values in Sample 1 and 3, respectively).
The “politically marginalized” latent class showed inconsistencies between the highly educated Sample 1 on the one hand and the representative Samples 2 and 3 on the other hand with respect to both the associated PSM scores and the subgroup’s predictors. For ease of interpretation and on the basis of the empirical findings that follow, we refer to this subgroup as “secure politically marginalized” with respect to Sample 1 and as “insecure politically marginalized” with respect to Samples 2 and 3 in the description and discussion of the results.
Whereas the “secure politically marginalized” subgroup in Sample 1 endorsed, on average, low PSM item categories in the domains of economy and culture, the “insecure politically marginalized” indicated, on average, medium item categories in both domains. Regarding political PSM, both groups endorsed, on average, high response categories. Both the “secure politically marginalized” and the “insecure politically marginalized” classes were comparable to the “high PSM” class with respect to their expected political PSM scores.
When comparing only the cross-domain PSM mean scores of the latent classes, the “medium PSM” class and the “politically marginalized” class (i.e., both “secure politically marginalized” and “insecure politically marginalized”) appeared similar from a quantitative perspective (see Figure S2 and Tables S7–S9 in the Supplemental Material). However, the LCAs showed a crucial qualitative distinction related to the domain of political PSM, with mean political PSM scores for these two classes of 3.62 versus 5.00 in Sample 1, 4.29 versus 5.67 in Sample 2, and 4.83 versus 5.75 in Sample 3, respectively.
Predicting Latent Class Membership Probabilities with Sociodemographic, Personal-Resource-Related, Attitudinal, and Personality Measures
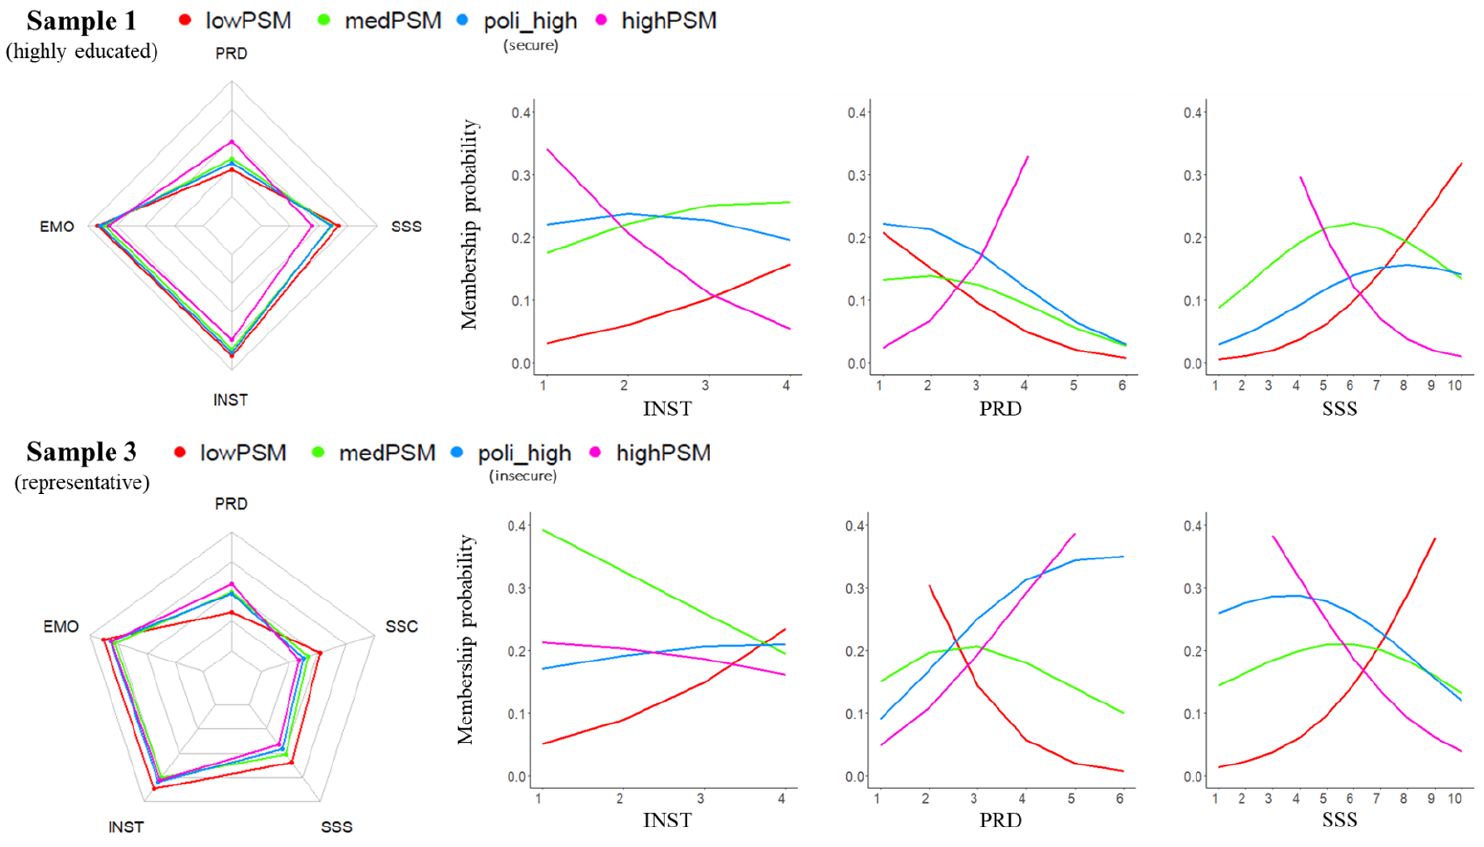
To understand how the latent PSM classes were related to other variables, we predicted latent class membership probabilities with various sociodemographic, personal-resource-related, attitudinal, and personality measures. Tables S7 to S9 in the Supplemental Material (see also https://osf.io/b3u87/) show the class-specific means as well as the odds ratios (OR) of these predictors. For ease of interpretation, all means are displayed in the form of radar charts in Figures 2 to 5. In the latent class regression analyses, the “low PSM” class functioned as the reference group. Concerning the “medium PSM” and the “high PSM” classes, we describe only the significant associations that were consistently found across samples. Due to the aforementioned sample inconsistencies regarding the “politically marginalized” class, we describe and interpret the results separately for Sample 1 (i.e., the “secure politically marginalized”) and for Samples 2 and 3 (i.e., the “insecure politically marginalized”), respectively. For OR < 1, we inverted it to 1/OR and discuss the effects from the perspective of increasing likelihoods (as opposed to decreasing likelihoods) to provide a common framework for describing the results.
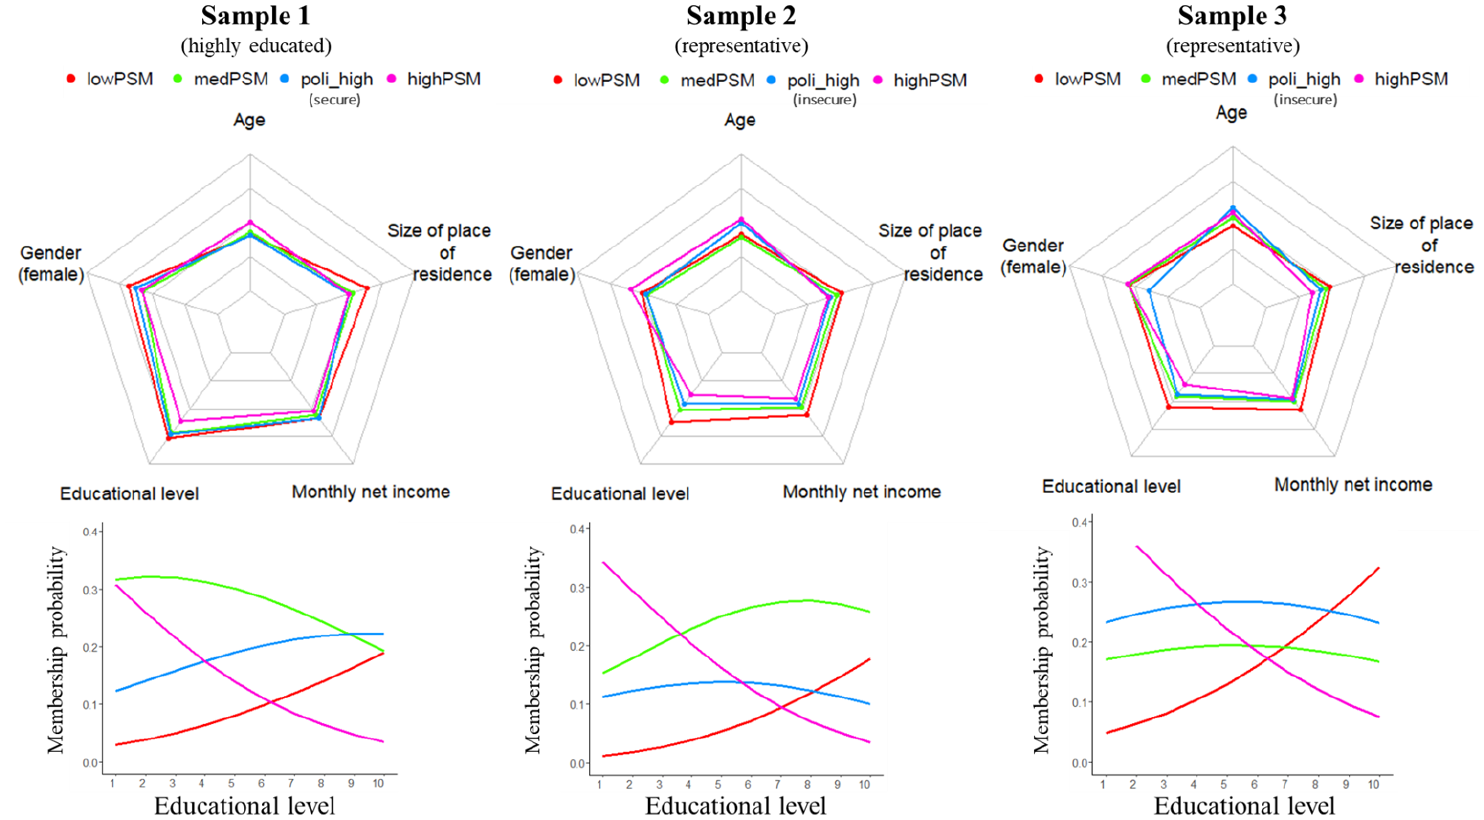
Means and significant regression slopes for the sociodemographic measures in the three samples.
Means and significant regression slopes for the personal-resource-related measures in Samples 1 and 3.
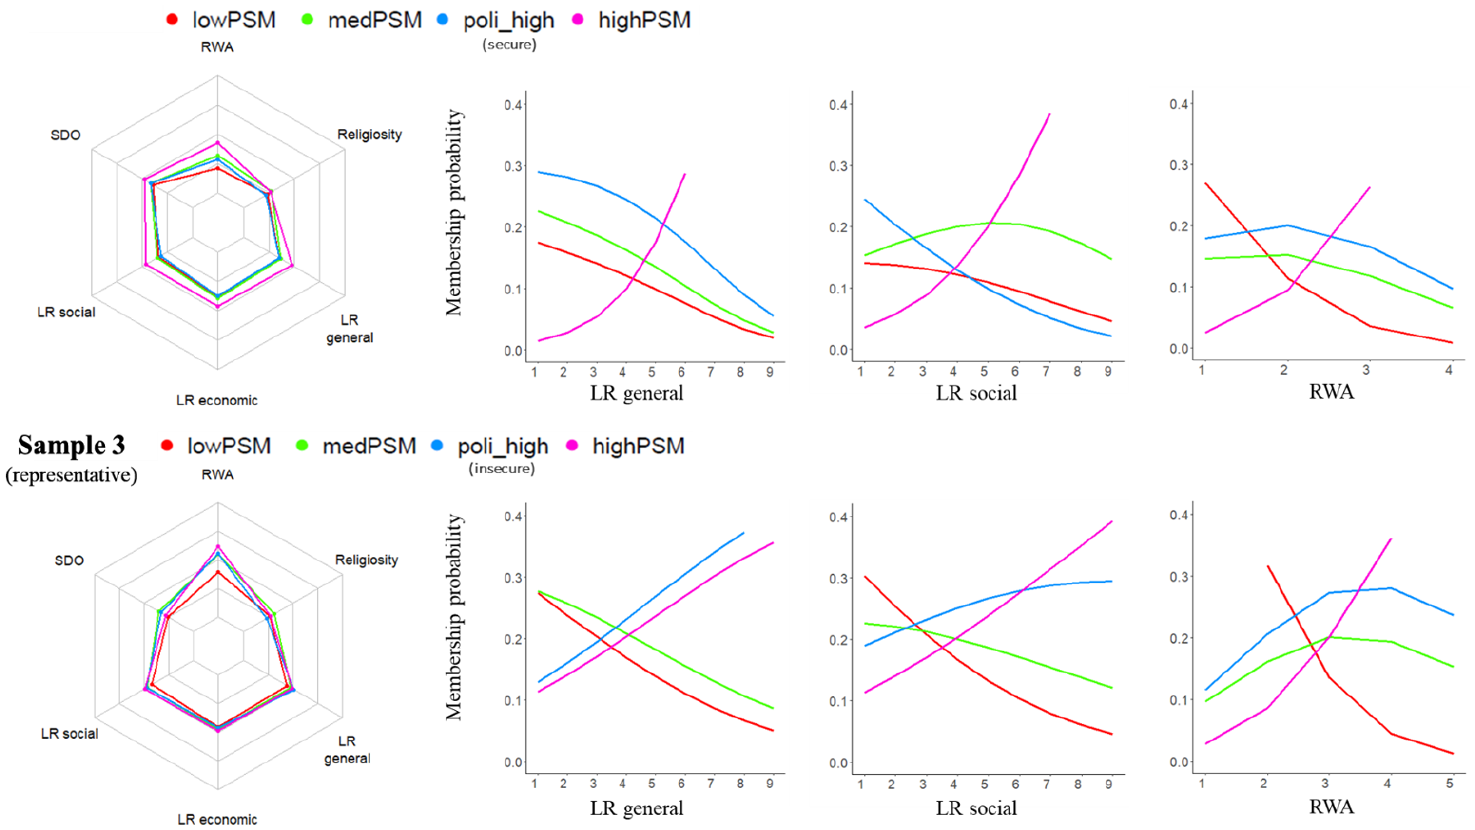
Means and significant regression slopes for the attitudinal measures in Samples 2 and 3.
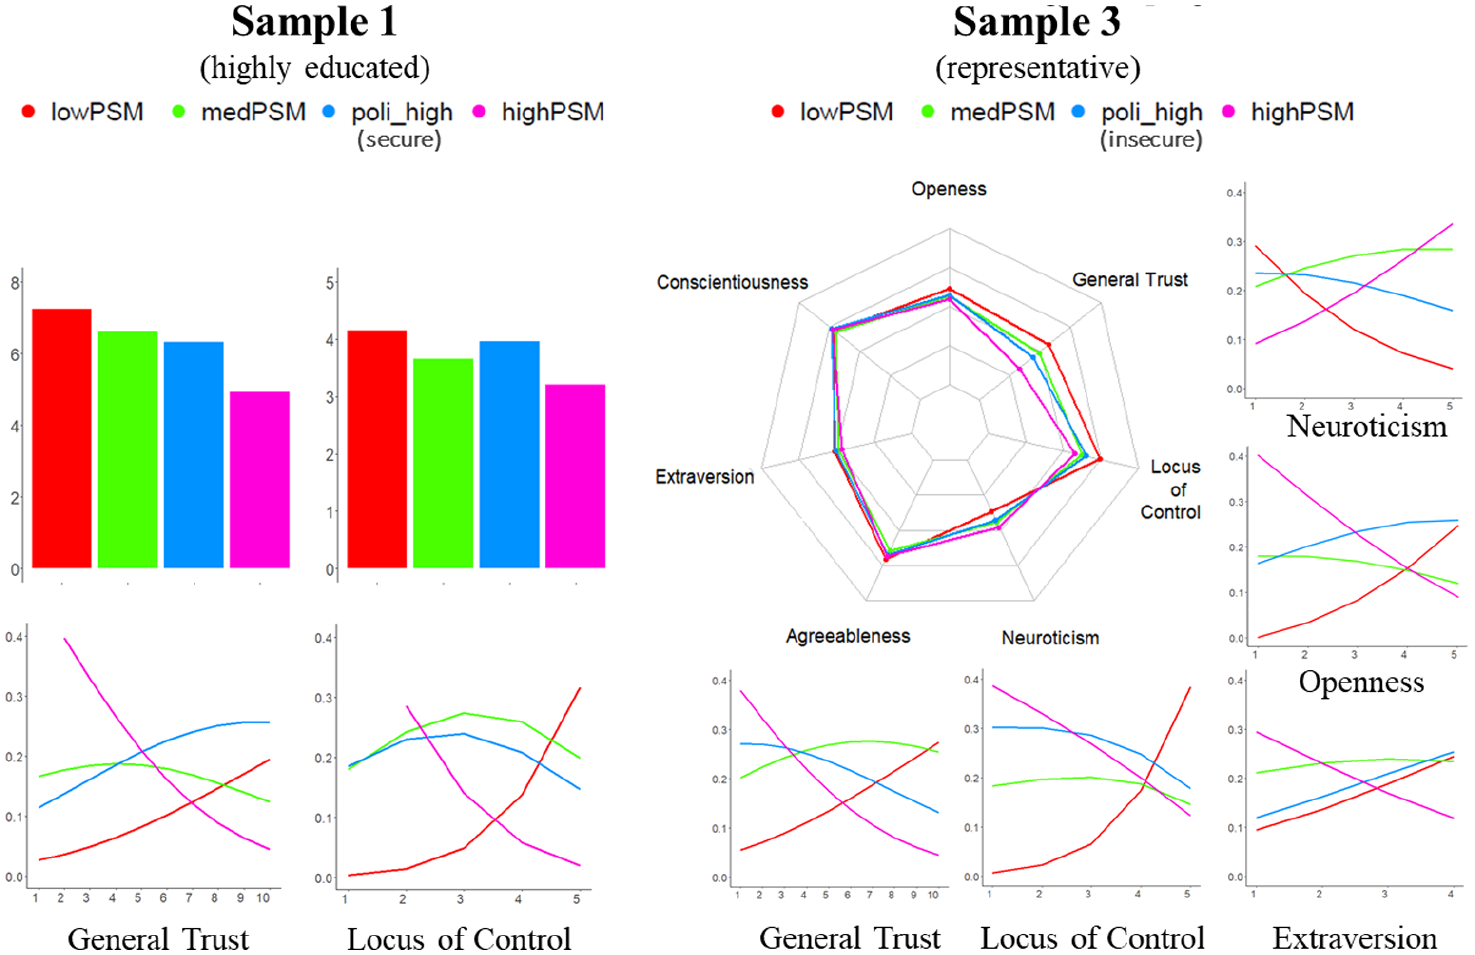
Means and significant regression slopes for the personality measures in Samples 1 and 3.
When inspecting the latent class regression slopes in Figures 2 to 5, it is important to bear in mind that the colored lines represent the latent class membership probabilities (as opposed to the odds ratios). Therefore, even though the absolute probability of belonging to a certain latent class might decrease as a function of higher levels of some predictor, the relative probability of belonging to that class—in comparison with the probability of belonging to the “low PSM” class—might grow, which would be reflected by a positive odds ratio. In the following sections, we describe the latent class regression results in terms of odds ratios using the “low PSM” class as the reference category. This corresponds to our primary objective of investigating why members of certain latent classes indicate social discontent.
Sociodemographic measures
Concerning the sociodemographic measures, educational level was the only significant predictor of latent class membership probabilities across samples. Each unit increase in educational level significantly increased participants’ likelihood of belonging to the “low PSM” group compared with the “high PSM” group (e.g., OR = 1.72, p = .001 in Sample 2).
Personal-resource-related measures
With respect to the personal-resource-related measures, an increased likelihood of belonging to the “low PSM” group compared with the “high PSM” group was associated with higher instrumental support (OR = 3.13, p < .001 in Sample 1 and OR = 1.82, p < .012 in Sample 3), lower personal relative deprivation (OR = 3.93, p < .001 in Sample 1 and OR = 3.80, p < .001 in Sample 3), and a higher subjective societal status (OR = 2.56, p < .001 in Sample 1 and OR = 2.00, p < .001 in Sample 3). A higher subjective societal status also increased participants’ likelihood of belonging to the “medium PSM” class (OR = 1.52, p = .001 in Sample 1 and OR = 1.51, p = .013 in Sample 3). For the “secure politically marginalized” (i.e., in the highly educated Sample 1) and the “insecure politically marginalized” (i.e., in the more representative Sample 3) subgroups, several effects differed. Whereas the likelihood of belonging to the “secure politically marginalized” subgroup increased with lower emotional support (OR = 2.04, p = .012) and lower instrumental support (OR = 1.79, p < .025), these effects were absent from the “insecure politically marginalized” subgroup. By contrast, the likelihood of belonging to the latter subgroup increased with higher levels of personal relative deprivation (OR = 3.15, p < .001) and lower levels of subjective societal status (OR = 1.64, p = .003).
Attitudinal measures
Regarding the attitudinal measures, higher RWA scores increased the likelihood of being a member of the “medium PSM,” “secure politically marginalized” or “insecure politically marginalized” and “high PSM” class (e.g., for high PSM: OR = 9.01, p < .001 in Sample 1 and OR = 5.48, p < .001 in Sample 3). An increased likelihood of belonging to the “low PSM” group compared with the “high PSM” group was associated with stronger left-wing attitudes concerning social issues (e.g., OR = 1.48, p = .017 in Sample 3) and stronger left-wing attitudes in general (e.g., OR = 1.43, p = .026 in Sample 3). Again, the “secure politically marginalized” and “insecure politically marginalized” subgroups differed in important aspects. The likelihood of belonging to the “insecure politically marginalized” subgroup was associated with increased levels of Conventionalism (OR = 2.55, p < .001), Social Dominance Orientation (OR = 1.70, p = .004), and general right-wing attitudes (OR = 1.42, p = .031), but none of these predictors were significantly associated with the probability of belonging to the “secure politically marginalized” subgroup.
Personality measures
With respect to the personality measures we administered, each unit increase in openness (OR = 2.13, p = .015) and extraversion (OR = 1.86, p = .015) increased participants’ likelihood of belonging to the “low PSM” group, whereas higher levels of neuroticism (OR = 2.27, p = .001) were associated with a higher likelihood of belonging to the “high PSM” group. Furthermore, neuroticism was positively associated with membership in the “medium PSM” group (OR = 1.77, p = .022). Higher levels of agreeableness were associated with an increased likelihood of belonging to the “low PSM” group compared with the “medium PSM” group (OR = 2.50, p = .033) and the “insecure politically marginalized” group (OR = 2.33, p = .037). Locus of control significantly predicted the class membership probabilities across all latent classes (e.g., OR = 2.86, p = .003 for “medium PSM” in Sample 3). Thus, the higher the participants’ locus of control, the more likely they were to belong to the “low PSM” group. In addition, general trust was associated with a higher likelihood of belonging to the “low PSM” group (OR = 1.61, p < .001 in Sample 1 and OR = 1.52, p < .001 in Sample 3) and a lower likelihood of belonging to the “insecure politically marginalized”—but not the “secure politically marginalized”—subgroup (OR = 1.30, p = .008).
Summary of Results
In summary, participants’ likelihood of belonging to the “high PSM” class (compared with the “low PSM” class) increased with lower levels of education, higher levels of personal relative deprivation, lower levels of instrumental support (i.e., having people around to help when needed) and subjective societal status, a stronger preference for right-wing ideology (especially regarding social issues), lower levels of openness and extraversion, higher levels of neuroticism, lower levels of perceived control over one’s life, and lower levels of general trust in other people. Participants’ likelihood of belonging to the “secure politically marginalized” subgroup increased with lower levels of instrumental and emotional (i.e., having people around who like you) support and higher levels of RWA (but not conventionalism). By contrast, participants’ likelihood of belonging to the “insecure politically marginalized” subgroup increased with lower levels of education, higher levels of personal relative deprivation, a lower subjective societal status, higher levels of RWA (including conventionalism), higher levels of SDO, and stronger general right-wing attitudes. Both “politically marginalized” subgroups had lower levels of perceived control over their lives, higher levels of authoritarian aggression, and higher levels of authoritarian submissiveness in common.
Discussion
In the present study, we identified PSM subgroups based on participants’ PSM item response patterns using LCA. In addition, we explored sociodemographic, personal-resource-related, attitudinal, and personality predictors of the probabilities of belonging to each of these subgroups.
PSM Subgroups
Here, using LCA we show (a) that most identified groups (the “low PSM,” “medium PSM,” and “high PSM” groups) differ with regard to the level of PSM across the PSM domains. This underlines the potential existence of strong common causal pathways to PSM and/or strong mutually reinforcing influences as well as the relevance of generic approaches to counteract PSM. At the same time, however, we (b) identified a fourth group of individuals with a specific nonlinear pattern (the “politically marginalized” group), that is, high levels of political PSM but lower levels of economic and cultural PSM. This might indicate that there exist additional causal pathways that are specific to political PSM. This finding underlines the relevance of political communication when it comes to counteract political PSM and its downstream consequences.
This “politically marginalized” group differed between the highly educated sample on the one hand (“secure politically marginalized”) and the two representative samples on the other (“insecure politically marginalized”). Whereas both groups indicated high levels of political PSM, they differed in the PSM domains of economy and culture, with the “secure politically marginalized” subgroup indicating lower response categories in both domains. These findings suggest that our pattern approach’s differentiated view on social groups that suffer from discontent and the societal domain of their discontent is more adequate than a binary approach consisting in simplified dichotomous characterization (e.g., “winners” vs. “losers”) without content-related specifications. People may experience PSM in varying degrees of intensity and in different societal areas. At the same time, the substantive differences between the “secure politically marginalized” and the “insecure politically marginalized” groups show that people may exhibit similar response patterns (i.e., high levels of political PSM) for different reasons (see the next section). To best reflect reality and enable optimal evidence-based policymaking, this variation in overall intensity and in the domain-specificity of PSM should be considered when conceptualizing conflicting social groups.
Predictors of PSM Subgroups
What distinguishes the identified latent PSM classes in terms of sociodemographic, attitudinal, and personality characteristics? Given the potential negative consequences of strong societal discontent (e.g., Decker & Brähler, 2018; Goodhart, 2017; Raines et al., 2017), understanding the predictors of belonging to the “high PSM” class (i.e., experiencing high levels of PSM across societal domains) is one of the key contributions of the present study. The likelihood of belonging to this subgroup was significantly higher for participants with lower levels of education, a higher personal relative deprivation level, less social support, a lower subjective societal status, a preference for right-wing ideology, lower openness and extraversion, higher neuroticism, less sense of control over one’s life, and less trust in other people in general.
Concerning particularly strong political discontent (i.e., belonging to the “politically marginalized” groups), the results offered a more differentiated picture. The likelihood of belonging to either the “secure politically marginalized” or the “insecure politically marginalized” subgroups increased with higher levels of authoritarian aggression and submissiveness as well as with less perceived control over one’s life. Thus, both groups favor strong leadership and harsh treatment of societal dissidents while experiencing little personal power. In addition, the probability of being a member of the “secure politically marginalized” subgroup increased with lower levels of social support, whereas that of being a member of the “insecure politically marginalized” subgroup increased with lower levels of education, higher levels of personal relative deprivation, a lower subjective societal status, higher levels of conventionalism and SDO, and stronger general right-wing attitudes. Such findings corroborate other social-psychological research indicating higher levels of marginalization being associated with higher levels of aggressive behavior (Issmer & Wagner, 2015).
The role of education
Interestingly, educational level was the only sociodemographic measure that significantly predicted people’s group membership probabilities across samples and latent classes. This counters the common idea that experiencing high levels of PSM is automatically associated with—or even caused by—lower levels of income, higher age, and/or living in smaller places of residence. Whereas the average levels of these variables may differ across PSM subgroups, the effects are too weak to predict group membership. Consistent predictive effects were found for education: lower levels of education increased the likelihood of belonging to the medium PSM, high PSM, and insecure politically marginalized group. A higher education is a key resource in modern and knowledge-based societies and allows for successful adaptation to changing circumstances. Furthermore, society noticeably values a high educational level (e.g., higher status, salary, and job security), which directly affects people’s PSM. Thus, education, which can bring about success and garner the appreciation of others, seems to be the sociodemographic key variable for understanding and countering PSM independent of a person’s current age or income. Previous research has supported this notion by showing that individual attitudes toward international developments, such as international trade (Hainmueller & Hiscox, 2006) and globalization (Bekhuis et al., 2014), are affected and moderated by educational level.
Personal resource predictors
Both higher levels of personal relative deprivation and lower levels of subjective societal status were associated with belonging to the “high PSM” class. Thus, the perception of having less than others and being further down the social hierarchy is related to the feeling that one is disrespected and depreciated by society. In this context, future research could investigate whether people’s locus of control moderates this relationship. We would expect to find that a high internal locus of control makes people believe in their own abilities to change their social status, thus changing the extent to which society appreciates them. Furthermore, lower levels of perceived instrumental support increased the likelihood of belonging to the “high PSM” group. As these effects were nonsignificant in the other classes, they were specific to this class. A possible explanation for this finding is that being part of a helpful and trustworthy community buffers the effects of societal changes on PSM. Consistent with recent findings in work on the effects of unemployment (e.g., Pohlan, 2019), one may assume that even when people hold very skeptical views of their society’s economic, cultural, and political situation, a network of close people might counter the feelings of being disadvantaged. Future research using longitudinal designs is needed to address these important hypotheses.
Attitudinal predictors
Lower levels of RWA increased the likelihood of belonging to the “low PSM” class compared with all the other latent classes. This finding applies to all facets of RWA (i.e., Authoritarian Aggression, Authoritarian Submissiveness, and Conventionalism). Stated differently, valuing strict social norms, strong leadership, and conventionalism increases one’s likelihood of being a member of any subgroup other than the “low PSM” group. 3 As globalization and modernization change all these facets (e.g., equal rights for minorities, flattening social hierarchies, and dilution of traditions), people who favor them are likely to experience higher levels of PSM. This idea is in line with a “cultural backlash” hypothesis, which argues that societal changes concerning cultural traditions activate authoritarian attitudes, which in turn lead to stronger support of populist parties (see Norris & Inglehart, 2019, but see Schäfer, 2022). Across samples, stronger right-wing attitudes in general and in social issues increased participants’ likelihood of belonging to the “high PSM” group.
Concerning the association between right-wing attitudes and the “politically marginalized” group, the results differed between the “secure politically marginalized” and the “insecure politically marginalized” subgroups. Only the probability of belonging to the latter group increased with stronger general right-wing attitudes and conventionalism. This contradicts the common stereotype that socially discontent people are generally in favor of right-wing ideology, and again, it highlights the need to go beyond dichotomous characterizations (“left” vs. “right”) in understanding these conflicting social groups. Previous political science studies have already partly addressed this shortcoming by introducing a four-field matrix, whereby people can have different scores on each of the two axes (i.e., economic and cultural issues) with respect to their left–right attitudes (e.g., Hooghe et al., 2002). However, our results suggest that considering the variety of societal domains (i.e., economics, culture, and politics) as well as sociodemographic, attitudinal, and personality characteristics is warranted to understand the true complexity of the conflicting social groups.
Personality predictors
Lower levels of openness and extraversion as well as higher levels of neuroticism significantly increased the likelihood of belonging to the “high PSM” class. A higher level of neuroticism was also associated with membership in the “medium PSM” class but not with the “politically marginalized” classes. These findings show that personality profiles vary across latent PSM classes and that they might explain differences in PSM profiles. For instance, a higher level of extraversion is generally associated with a variety of success-related life outcomes (e.g., Seibert & Kraimer, 2001), and a higher level of openness may help people embrace and successfully adapt to changes (e.g., Wanberg & Banas, 2000). Neuroticism might moderate the relationship between societal changes and PSM by increasing the focus on dangers and the potential negative outcomes of these changes.
Regarding its large effect sizes and consistency across samples and latent classes, locus of control represented another key personality measure that can be used to distinguish the latent PSM subgroups. A higher perceived control over one’s life strongly increased the likelihood of belonging to the “low PSM” group. A possible explanation for this finding is that a stronger internal locus of control is associated with higher self-efficacy (e.g., Wanberg & Banas, 2000) and, thus, a readiness to take action to change one’s situation if needed. Thereby, locus of control might be a crucial predictor of whether someone views these changes as opportunities or threats.
Finally, lower levels of general trust in other people increased the likelihood of belonging to the “high PSM” group. A lack of trust in other people may automatically result in less trust in domestic and international political elites or society as a whole (e.g., Dellmuth & Tallberg, 2020). It is self-evident that people with this perception are unlikely to believe that society will listen to—or take care of—their economic, cultural, and political concerns. Future research needs to disentangle the exact relationship between general trust and PSM, as all directions of effects are conceivable from a substantive point of view.
Across samples, our findings are based on large samples from online access panels with a higher representativeness of the German population than convenience samples in terms of age, gender, and education. Only the first sample had an above-average level of education and is thereby limited to highly educated samples regarding its representativeness (see “Method” section). We cannot rule out the possibility of obtaining different effects (i.e., latent PSM classes) in other countries, because the societal context (e.g., current economic and political situation) is very likely to affect participants’ response patterns. However, considering the characteristics of Germany (e.g., democratic system, high level of industrialization, market economy) and the cross-cultural similarity of current social conflicts between “losers” and “winners” of modernization and globalization, we believe that our findings are generalizable to a reasonable extent to other Western countries. To replicate our findings, researchers should administer standardized surveys—thereby ensuring the procedure’s objectivity—to representative samples in terms of age, gender, and educational level. We have no reason to assume that our findings depend on other study characteristics (Simons et al., 2017).
Limitations and Future Prospects
Future studies should consider the distinct characteristics of the “secure politically marginalized” subgroup (e.g., less emotional and instrumental support, as well as stronger left-wing attitudes) and the “insecure politically marginalized” subgroup (e.g., lower levels of education, higher levels of personal relative deprivation, and stronger right-wing attitudes) when aiming to reproduce the latent classes we obtained. Incorporating these distinctive elements in the sampling quotas will ensure that the corresponding subpopulations are adequately represented.
Moreover, the samples used in the current study focused solely on the German population. Given the relevance of societal discontent across countries, the stability of our obtained latent class solutions in different countries remains to be shown by cross-country surveys. This will also allow for investigations of the effects of country-level moderators (e.g., average income or political party landscape) on PSM subgroups.
In addition, the current study was cross-sectional in nature, and thus, we have yet to determine whether, why, and how people’s latent PSM class memberships change over time. To address this question—and to account for contextual changes (e.g., economic ups and downs, changing immigration rates, or political elections)—longitudinal research designs are needed.
Finally, investigating the negative societal outcomes of PSM remains an important task for future research. In times of growing ethnic, religious, and political conflicts, PSM may contribute to a better understanding of people’s threat and negative attitudes toward various outgroups. In this context, it is especially important to consider the interactions of PSM, religiosity, and political attitudes in predicting these outcomes in order to cover the existing lines of conflict. Thereby, PSM could contribute to the reduction of societal tensions.
Conclusion
Moving from a predominant binary to what we call a pattern approach, we argued that developments like globalization and modernization should have resulted in more than two social groups opposing each other. Deviating from the current literature’s preference for dichotomous camps such as cosmopolitans vs. communitarians, or somewheres vs. anywheres, we explored the distribution of perceived societal marginalization among individuals and groups. We applied LCA and consistently identified three latent PSM classes (i.e., a “low PSM,” a “medium PSM,” and a “high PSM” class) across samples as well as two particularly “politically marginalized” classes (i.e., a “secure politically marginalized” and an “insecure politically marginalized” subgroup) that differed between our highly educated sample on the one hand and the two more representative samples on the other. Our results showed that the latent classes differed in terms of the intensity and domain-specificity of their PSM experience. Furthermore, the probabilities of belonging to these latent classes were consistently predicted by educational level as well as by a series of attitudinal and personality measures. These findings highlight the importance of a differentiated view of conflicting social groups that goes beyond dichotomous categorizations (e.g., “winners” vs. “losers”). By exploring these different subgroups and their predictors as part of a pattern approach, we add important insights to the debate about the consequences of globalization and modernization (e.g., Goodhart, 2017; Norris & Inglehart, 2019) on the one hand, and individual-based measures of societal deprivation on the other hand (Bollwerk et al., 2022). Finally, the predictors of latent PSM groups we identified may contribute to more evidence-based policymaking with the goal of reducing societal discontent and its negative social outcomes.
Supplemental Material
sj-docx-1-gpi-10.1177_13684302231182924 – Supplemental material for Who feels marginalized? A latent class analysis of perceived societal marginalization
Supplemental material, sj-docx-1-gpi-10.1177_13684302231182924 for Who feels marginalized? A latent class analysis of perceived societal marginalization by Michael Bollwerk, Eunike Wetzel, Bernd Schlipphak and Mitja D. Back in Group Processes & Intergroup Relations
Footnotes
Funding
The author(s) disclosed receipt of the following financial support for the research, authorship, and/or publication of this article: This research was supported by the Cluster of Excellence “Religion and Politics” from the German Research Foundation (DFG) and the research initiative “Psychological Aspects of Refugee Integration [PARI].” Eunike Wetzel was supported by the research-training group Statistical Modeling in Psychology (GRK 2277) funded by the German Research Foundation.
Open Practices
We embrace the values of openness and transparency in science (Schönbrodt et al., 2015; osf.io/4dvkw). Therefore, we follow the 21-word solution (Simmons et al., 2012) or refer to the complete documentation of the project on the OSF. There, we have also published all the raw data necessary to reproduce the reported results and provide scripts for all analyses reported in this article (![]() ).
).
Supplemental material
Supplemental material for this article is available online.
Notes
References
Supplementary Material
Please find the following supplemental material available below.
For Open Access articles published under a Creative Commons License, all supplemental material carries the same license as the article it is associated with.
For non-Open Access articles published, all supplemental material carries a non-exclusive license, and permission requests for re-use of supplemental material or any part of supplemental material shall be sent directly to the copyright owner as specified in the copyright notice associated with the article.