
Abstract
Serious concerns about public distrust of scientific experts and the spread of misinformation are growing in the US and elsewhere. To gauge ideological and psychological variability in attitudes toward science, we conducted an extensive analysis of public opinion data based on a nationally representative survey of U.S. adults (N = 1,500) and a large replication sample (N = 2,119). We estimated the unique effects of partisanship, symbolic and operational forms of political ideology, right-wing authoritarianism (RWA), social dominance orientation (SDO), and general system justification (GSJ), after adjusting for demographic factors. Multiverse analyses revealed that (a) conservatism and SDO were significant predictors of distrust of climate science in > 99.9% of model specifications, with conservatism accounting for 80% of the total variance; (b) conservatism, RWA, religiosity, (male) sex, (low) education, (low) income, and distrust of climate science were significant predictors of skepticism about science in general (vs. faith) in > 99.9% of model specifications; (c) conservatism, RWA, (low) education, and distrust of climate science were significant predictors of trust in ordinary people (over scientific experts) > 99.9% of the time; and (d) GSJ was a significant predictor of trust in scientific experts (over ordinary people) 81% of the time, after adjusting for all other demographic and ideological factors. Implications for the role of science in democratic society are discussed.
Keywords
The future of democracy is allied with the spread of the scientific attitude. It is the sole guarantee against wholesale misleading by propaganda.
Introduction
The public’s lack of knowledge about scientific matters—and the amount of misinformation that is shared through digital social networks—is increasingly viewed as problematic in American society (FORRT, 2019; Scheufele & Krause, 2019). Although ordinary citizens appear to be quite trusting of the scientific community in general (Funk et al., 2019), systematic analysis of online communication reveals that rumors, “fake news,” and conspiracy theories about scientifically pertinent topics are commonplace (e.g., Lazer et al., 2018). To take just one example, 29% of American adults believe—falsely, the available evidence indicates—that the COVID-19 virus was created deliberately in a laboratory rather than developing naturally (Schaeffer, 2020).
There are other indications that distrust of scientific experts is a genuine problem in the US (and presumably other countries as well). Only 40% of Americans believe that humans evolved over time through a process of natural selection without the influence of God (Pew Research Center, 2019). Likewise, many Americans still doubt that anthropogenic climate change is a significant problem, although the percentage of believers varies according to how the question is asked (Annenberg Public Policy Center of the University of Pennsylvania, 2019). Given the extent of scientific skepticism, it is important for social scientists to understand the political and psychological processes that lead citizens in a democracy to make reasonable, informed decisions about complex scientific questions such as those pertaining to climate change, childhood vaccination, and the handling of pandemic diseases, among many other topics.
Of course, some citizens are more susceptible to scientific misinformation than others. People who are less educated are, perhaps unsurprisingly, more prone to accept false explanations, including conspiracy theories (Schaeffer, 2020; van Prooijen, 2017). Highly religious people are much less likely than others to believe in evolution (Pew Research Center, 2019), and they may also discount other scientific approaches (Blank & Shaw, 2015; Pennycook et al., 2020; Rutjens, Heine, et al., 2018; Rutjens, Sutton, & van der Lee, 2018), especially if they view scientific findings as inconsistent with religious doctrine. From the perspective of political psychology, there are several other important factors to consider in addition to education and religiosity, beginning with political partisanship and ideology.
Hypothesized Effects of Partisanship and Ideology
Antiscientific attitudes, it turns out, are especially prevalent in politically conservative circles(e.g., Blank & Shaw, 2015; Carl et al., 2016; Hornsey et al., 2016; Jacquet et al., 2014; Lazer et al., 2018; Lewandowsky & Oberauer, 2016; MacCoun & Paletz, 2009; Mooney, 2005; Pennycook et al., 2020; Rutjens, Heine, et al., 2018; Tullett et al., 2016; van Liere & Dunlap, 1980). However, the reasons for this are not entirely clear or agreed upon. It has become clear in recent decades that skepticism about climate science has been “manufactured” by powerful financial interests, including gas and oil companies, and these interests overwhelmingly support and influence probusiness conservatives in the Republican Party (Dunlap & McCright, 2011). The public relations offensive by contemporary oil companies is reminiscent of tobacco companies’ efforts in previous decades to cast doubt on scientific claims linking smoking to lung cancer (Oreskes & Conway, 2011).
Indeed, conservatives in the US are much more likely than liberals to doubt the scientific consensus pertaining to climate change (e.g., Gauchat, 2012; Hornsey et al., 2016; Jacquet et al., 2014; McCright & Dunlap, 2011). Recent work by Rutjens, Sutton, and van der Lee (2018) suggested that conservatism was consistently linked to attitudes about climate science but not attitudes about childhood vaccination or genetically modified food. However, other research shows that conservatives are significantly more distrustful of the scientific community than liberals in general, and that conservative skepticism extends well beyond specific issues such as global warming (Blank & Shaw, 2015; Carl et al., 2016; MacCoun & Paletz, 2009; Tullett et al., 2016). For instance, Pennycook et al. (2020) found that conservatives were more likely than liberals to doubt scientific recommendations about modern medicine, stem cell research, childhood vaccination, genetically modified foods, the Big Bang, and the age of the earth.
According to historical analyses of trends in public opinion, trust in science has been declining steadily among American conservatives—but not other groups—since the 1970s (Gauchat, 2012). In response to this evidence, Cofnas et al. (2018) argued that conservatives distrust scientists only because of their allegedly biased advocacy of liberal policies, and that conservatives are not distrustful of the scientific process in general. These claims were strongly contested on several fronts by Larregue (2018). By investigating attitudes toward science as well as attitudes toward scientists, the present research program contributes new empirical evidence bearing on at least parts of this debate.
Because of our focus on political ideology, it is important to point out that some social scientists doubt that ordinary citizens are motivated by specific ideological concerns at all. Instead, they claim that U.S. citizens are ideologically “innocent” or “ignorant,” and that they simply parrot the opinions of political elites with whom they happen to identify (Kalmoe, 2020; Kinder & Kalmoe, 2017). For instance, Achen and Bartels (2016) argue that, for most people, what appears to be ideologically motivated behavior is really “a rather mechanical reflection of what their favorite group and party leaders have instructed them to think” (p. 12). The idea is that partisanship and identification with social groups such as “liberals” and “conservatives” (what political scientists refer to as “symbolic ideology”) matters much more than the positions on specific political issues (what is referred to as “operational ideology”). Applying this logic to the case of scientific distrust, one would hypothesize that people who are strongly identified with the Republican Party and with conservatives as a social group would be more likely than others to pick up and act on skeptical cues from conservative elites and Republican leaders (see Tesler, 2018). According to some social scientists, then, political partisanship should trump ideology when it comes to attitudes about science.
Others, however, maintain that there are important differences between liberals and conservatives when it comes to beliefs, opinions, and values (e.g., Ellis & Stimson, 2012; Fowler, 2020; Goren, 2013; Jacquet et al., 2014; Jost, 2006; McCright & Dunlap, 2011). Furthermore, some scholars believe that ideological differences are themselves grounded in political and psychological processes that help to explain why certain people are drawn to liberal ways of thinking, while others are drawn to conservative points of view (Caprara & Vecchione, 2017; Hibbing et al., 2014; Jost, 2017). From the perspective of political psychology, there are many reasons to hypothesize that there would be meaningful left/right or liberal/conservative differences when it comes to attitudes about science.
Ideological Asymmetries in Epistemic Motives and Abilities
Many psychological differences that have been observed between liberals and conservatives pertain to epistemic motives and abilities—and are therefore directly relevant to the question of whether there are meaningful asymmetries when it comes to attitudes about science. Qualitative and quantitative reviews consistently reveal that liberals score higher than conservatives on measures of need for cognition (or enjoyment of thinking), tolerance of ambiguity, integrative complexity, and cognitive reflection (Jost, 2017), as well as actively open-minded thinking, which involves a commitment to changing one’s mind on the basis of new evidence (Pennycook et al., 2020; Price et al., 2015). In addition, liberals perform better than conservatives on tests of cognitive ability and intelligence (e.g., Deary et al., 2008; Deppe et al., 2015; Heaven et al., 2011; Hodson & Busseri, 2012; Onraet et al., 2015; Saribay & Yilmaz, 2017). All of these factors would lead one to hypothesize that liberals would be especially interested in and open to the scientific process.
Conservatives, on the other hand, score higher than liberals on measures of dogmatism; cognitive and perceptual rigidity; and personal needs for order, structure, and closure (Jost, 2017). They also exhibit more self-deception (Jost et al., 2010; Wojcik et al., 2015) and, perhaps relatedly, an intuitive—rather than analytic—thinking style (Jost & Krochik, 2014; Talhelm et al., 2015). Conservatives, at least in the US, are more susceptible than liberals to paranoid, conspiratorial mindsets (van der Linden et al., 2020) as well as “bullshit,” that is, meaningless but seemingly profound generalizations (Pennycook & Rand, 2017; Pfattheicher & Schindler, 2016; Sterling et al., 2016). Conservatives are also more likely to spread rumors, “fake news,” and political misinformation in their online social networks (Allcott & Gentzkow, 2017; Benkler et al., 2017; Guess et al., 2019; Marwick & Lewis, 2017; Miller et al., 2016). For all of these reasons, then, we would expect that conservatives would be less likely than liberals to embrace the scientific enterprise—not only when it comes to climate change but more generally.
At the same time, some researchers draw a very strong distinction between the social and economic dimensions of left/right ideologies (Feldman & Johnston, 2014) and argue that, when it comes to differences in epistemic motives and abilities, the social dimension matters more than the economic one (Federico & Malka, 2018). Consistent with this idea, Nilsson et al. (2019) provided evidence from Sweden (not the US) that social conservatism was consistently associated with a lack of cognitive reflection and a receptivity to pseudoprofound “bullshit,” whereas economic conservatism was not. Taking a more extreme position on this issue, Carl et al. (2016, p. 300) argued that economic conservatives were “as or more scientifically literate and optimistic about science” than economic liberals (or progressives). Although the focus of our investigation was not on scientific literacy per se, we were able to explore associations between social and economic dimensions of ideology, on one hand, and attitudes about science and scientists, on the other.
Right-Wing Authoritarianism, Social Dominance Orientation, and System Justification
There are other psychological reasons as well to suspect that scientific distrust would be greater on the political right than the left. In Western-style democracies, self-identified conservatives tend to score higher than liberals on various measures of authoritarianism (Nilsson & Jost, 2020). To the extent that authoritarian impulses are at odds with democratic forms of decision-making and the pursuit of free scientific inquiry—as John Dewey (1939), Kurt Lewin (1943/1999), and many others have argued—we would expect right-wing authoritarianism (RWA) to be associated with suspicion and rejection of scientific methods and evidence (Altemeyer, 2006). There is, in fact, much evidence linking RWA to the denial of climate science (e.g., Carrus et al., 2018; Häkkinen & Akrami, 2014; Stanley & Wilson, 2019). However, it is less clear whether RWA is associated with antiscientific attitudes in general. Presumably, it depends upon the extent to which scientific authority is regarded as legitimate or illegitimate in society. As noted before, many right-wingers in the US today reject scientific expertise as a basis for authority (e.g., Gauchat, 2012).
Likewise, people who score high on social dominance orientation (SDO) should be less open to persuasion on the basis of scientific facts, all other things being equal (Sidanius & Pratto, 2001). Presumably, this is because the assumption that “might makes right,” which undergirds the ideology of the high SDO individual, is fundamentally antidemocratic and antiscientific. Indeed, several studies confirm that SDO is a significant predictor of antienvironmental attitudes (Milfont et al., 2018) and skepticism about global warming (Carrus et al., 2018; Clarke et al., 2019; Jylhä & Akrami, 2015; Jylhä et al., 2016; Stanley & Wilson, 2019). It has been argued that this is because people who are high in SDO “may be more willing to exploit the environment in unsustainable ways because to do so aids the production and maintenance of hierarchical social structures” (Meleady et al., 2020, p. 1147). The extent to which SDO predicts antiscientific attitudes in general has yet to be fully explored.
There is yet another psychological variable—namely, system justification, defined as a motivational tendency to defend, bolster, and justify aspects of the societal status quo—that is typically correlated with conservative ideology (Jost, 2020). On one hand, previous research has found that system justification in general, and with respect to the capitalist economic system in particular, is linked to skepticism about anthropogenic climate change (Feygina et al., 2010; Hennes et al., 2012; Hennes et al., 2016; Jylhä & Akrami, 2015). This is consistent with the idea that scientific progress often comes at the expense of long-standing cultural traditions. The fact that science upends common sense and received wisdom means that it will frequently elicit motivated system defensiveness and backlash against the scientific community whenever it forces a critical reassessment of the status quo, as in the case of climate science. On the other hand, the scientific establishment is considered to be a legitimate part of the social system in the US, at least among certain segments of the population, including those who are more liberal and more highly educated. For this reason, high (vs. low) system justifiers may not necessarily hold more antiscientific attitudes across the board.
Overview of the Research Program
In the present research program, we sought to analyze the political and psychological bases of antiscientific attitudes, focusing especially on ideological factors. By adopting a multivariate framework, we were able to tease apart the effects of Democratic versus Republican partisanship, symbolic and operational forms of political ideology, religiosity, education, authoritarianism, social dominance, and system justification. The goal was to use these variables to account for as much statistical variability in attitudes toward science as possible, and to identify which predictors were the most important. As described before, there are theoretical and empirical reasons to assume that all of these demographic and political psychological variables would play some role, but to our knowledge, no systematic investigation has pitted them against one another or compared the magnitudes of their influences when it comes to explaining attitudes about science and scientists.
Method
We report results based on two datasets: (a) an exploratory, quota-based sample that was nationally representative in terms of age, education, income, and sex, and (b) a confirmatory (replication) convenience sample from the same population that we analyzed to minimize the influence of false positives and to maximize the generalizability and robustness of our results. Both samples completed the same study materials in the same order and manner.
Participants
Sample 1
We hired Survey Sampling Incorporated (SSI; now called Dynata), a market research firm that recruits participants from a panel of over 7 million U.S. citizens, to recruit a nationally representative sample of 1,500 Americans (50.67% women) in the months preceding the 2016 U.S. presidential election (from August 16 to September 16, 2016). The quotas were designed to match the 2014 American Community Survey (ACS) from the U.S. Census Bureau with respect to age, income, education, and sex. The representativeness of the sample is addressed in the supplemental online material, which shows an average absolute deviation of 10.38% (Mdn = 6.67%) from the desired quotas, with age showing an average absolute deviation of 0.88% (Mdn = 0.91%), sex 2.94% (Mdn = 2.94%), and income 8.78% (Mdn = 8.12%). Overall, the sample achieved a moderate level of national representativeness. The biggest departure had to do with education, which showed an absolute deviation of 27% (Mdn = 12%); our sample included approximately 25% of the expected frequency associated with the category of “Less than high school/No high school diploma.”
In addition to administering a much greater number and variety of political and psychological instruments (including complete scales) than in other nationally representative surveys (such as ANES, GSS, and WVS), we took a number of steps to ensure that the quality of the data would be especially high. For one thing, we followed professional recommendations to minimize the impact of careless responding and satisficing behavior in online survey studies (Meade & Craig, 2012). Specifically, we employed 11 random attention questions, as well as page time, survey total, and click count controls. A total of 2,424 participants were directed to the survey, and 1,885 of them finished it (resulting in an attrition rate of 22%). There were 385 (16%) participants who failed more than two attention checks or finished the survey in under ~22 minutes and were therefore excluded. The final sample of 1,500, participants who successfully completed all study materials had a completion time of 69.29 minutes on average (Mdn = 51.28 min).
The final age distribution of Sample 1 was as follows: 18–24 years (12.87%), 25–34 (17.6%), 35–44 (17.53%), 45–54 (19.47%), 55–65 (15.6%), and older than 65 (16.93%). The ethnic breakdown was: White (82.47%), Black/African American (7.67%), Latino (5.87%), Asian/Pacific Islander (1.93%), Native American (0.87%), and Middle Eastern (1.2%). In terms of religion, 67.6% identified as Christian, 0.6% as Muslim, 3.47% as Jewish, 15.33% as either atheist or agnostic, and 13% responded were unsure or declined to answer. With respect to education, 3.4% reported their highest educational achievement to be less than high school, 31.67% indicated they graduated from high school (or equivalency), 31.4% reported some college (including an associate degree), 20.67% indicated having received a bachelor’s degree, and 12.87% received a graduate or professional degree. The median income was $35,000 to $49,999. The income distribution was as follows: less than $15,000 (11.87%), $15,000 to $24,999 (12%), $25,000 to $34,999 (11.73%), $35,000 to $49,999 (15.13%), $50,000 to $74,999 (19.47%), $75,000 to $99,999 (12.8%), $100,000 to $149,999 (10.67%), and $150,000 or more (6.33%).
Sample 2
Also through SSI, we administered the same survey to a large convenience sample of 2,119 American adults (21.47% women) in the months preceding the 2016 U.S. presidential election (from August 20 to September 13, 2016). We applied the same quality control criteria described before. A total of 3,425 participants were directed to the survey, and 2,662 of them finished it (for an attrition rate of 22%). There were 543 (16%) participants who failed more than two attention checks or finished the survey in under ~22 minutes and were therefore excluded. The final sample of 2,119 participants who successfully completed all study materials had a completion time of 92.01 minutes on average (Mdn = 57.77 min).
The final age distribution of Sample 2 was as follows: 18–24 years (9.06%), 25–34 (13.83%), 35–44 (11.42%), 45–54 (2.74%), 55–65 (3.63%), and older than 65 (59.32%). The ethnic breakdown was: White (85.89%), Black/African American (5.05%), Latino (4.11%), Asian/Pacific Islander (2.17%), Native American (0.94%), and Middle Eastern (1.84%). In terms of religion, 70.65% identified as Christian, 0.52% as Muslim, 5.57% as Jewish, 13.69% as either atheist or agnostic, and 9.58% were unsure or declined to answer. With respect to education, 1.04% reported that they did not finish high school, 15.15% graduated high school (or equivalency), 40.4% attended some college (including associate degree), 23.88% completed a bachelor’s degree, and 19.54% received a graduate or professional degree. The median income was $50,000 to $74,999. The income distribution was as follows: less than $15,000 (10.15%), $15,000 to $24,999 (8.07%), $25,000 to $34,999 (11.09%), $35,000 to $49,999 (14.39%), $50,000 to $74,999 (21.24%), $75,000 to $99,999 (14.91%), $100,000 to $149,999 (11.89%), and $150,000 or more (11.89%).
Measures
Partisan identification
We assessed political partisanship with the traditional two-part question from the American National Election Studies, which begins as follows: “Generally speaking, do you usually think of yourself as a Republican, a Democrat, an independent, or what?” Response options were: “Democrat,” “Independent,” “Republican,” “Don’t know,” “No preference,” or “Other.” If participants chose either “Republican” or “Democrat,” they were asked about strength of partisanship: “Would you call yourself a strong [Republican/Democrat] or not very strong?” If participants chose “Independent” or “Other,” they were asked, “Do you think of yourself as closer to the Republican or Democratic Party or no preference?” Participants were then given a score on a 7-point Likert scale (1 = strong Democrat, 7 = strong Republican).
Political ideology
The construct of political ideology was assessed using two types of measures: ideological self-placement (or symbolic ideology) and issue-based preferences (or operational ideology). With respect to the former, participants located themselves on bipolar scales of political orientation in general, with respect to economic issues, and with respect to social/cultural issues. In all three cases, the response scales ranged from 1 (strongly liberal) to 9 (strongly conservative). Responses to these three items were strongly intercorrelated, ranging from .73 to .83 with a mean of r(3617) = .80, p
Issue-based ideological preferences were assessed using five different instruments: (a) the Core Domains of Social and Economic Conservatism Scale, which contains seven items, four measuring economic conservatism and three measuring social conservatism (Feldman & Johnston, 2014); (b) the Core Issues in American Politics Scale, which is comprised of 12 items (e.g., “The government needs to do more to make health care affordable and accessible”; Zell & Bernstein, 2014); (c) the Social and Economic Conservatism Scale, which includes five economic and seven socially conservative items (Everett, 2013); (d) the Political Issue Statements Scale, which is comprised of 10 items measuring political orientation on the left/right ideological space (e.g., “A woman should have the right to choose what to do with her body, even if that means getting an abortion”; Inbar et al., 2009); and (e) an adapted 16-item version of Henningham’s (1996, 1997) Social and Economic Conservatism Scales, which are contemporary versions of the “classic” Wilson and Patterson (1968) scale for measuring liberalism–conservatism (see Azevedo et al., 2019, for the full list of items).
Religiosity
We assed religiosity with a single item: “How about in terms of religion, how would you consider yourself?” (1 = not religious/agnostic, 9 = very religious).
Right-wing authoritarianism
Participants completed Funke’s (2005) 12-item Right-Wing Authoritarianism (RWA) Scale, which measures authoritarian submission (RWA-S; e.g., “Obedience and respect for authority are the most important values children should learn”); authoritarian aggression (RWA-A; e.g., “What our country really needs is a strong, determined president which will crush the evil and set us on our right way again”); and authoritarian conventionalism (RWA-C; e.g., “The withdrawal from tradition will turn out to be a fatal fault one day”). Responses were provided on a scale ranging from 1 (very strongly disagree) to 9 (very strongly agree).
Social dominance orientation
Participants completed the Social Dominance Orientation Scale-7 (SDO7; Ho et al., 2015), which consists of two eight-item subscales that measure group-based dominance (SDO-D; e.g., “In getting what your group wants, it is sometimes necessary to use force against other groups”) and opposition to equality (SDO-E; e.g., “We should strive to make incomes more equal” [reverse-coded]). Responses were given on a scale from 1 (very strongly disagree) to 9 (very strongly agree).
General system justification
Participants completed the eight-item General System Justification Scale (Kay & Jost, 2003), which contains items such as, “In general, the American political system operates as it should” and “American society needs to be radically restructured” (reverse-scored). Responses were provided on 9-point scales (1 = strongly disagree, 9 = strongly agree), with a higher overall score indicating stronger system justification in general.
Distrust of climate science
Five items were used to measure distrust of scientists and their work on the topic of climate change. Two items, which were also used in research by van der Linden et al. (2020), focus on conspiracy theories: “Climate scientists and their political allies are deliberately misleading the public about global warming” and “Selfish interests are scheming to convince the public that global warming is a major threat.” Responses to these items, which were provided on 9-point scales (1 = strongly disagree, 9 = strongly agree), were strongly intercorrelated, r(3617) = .86, p
Skepticism about science (vs. faith)
Two items were used to measure attitudes toward science in general: “We believe too often in science, and not enough in faith and feelings” and “When it comes to really important questions, scientific facts don’t help very much.” Responses to both items, which were provided on 9-point scales (1 = strongly agree, 9 = strongly disagree), were strongly intercorrelated, r(3617) = .50, p
Trust in ordinary people (vs. scientific experts)
Two items were used to measure attitudes towards epistemic authorities, comparing trust in ordinary people versus trust in scientific and other experts: “I’d rather put my trust in the wisdom of ordinary people than the opinions of experts and intellectuals” and “Ordinary people can really use the help of experts to understand complicated things like science and health” (reverse-scored). Responses to both items, which were provided on 9-point scales (1 = strongly agree, 9 = strongly disagree), were intercorrelated, r(3617) = .24, p
Results
We conducted linear regression models with a large number of theoretically relevant variables (15) to comprehensively investigate the political psychological basis of attitudes about science while adjusting for demographic and other variables. Because several of the variables included in the multiple regressions were highly intercorrelated, there was a significant likelihood of encountering methodological problems associated with multicollinearity, variance inflation, and overfit, leading to violations of ordinary least squares (OLS) assumptions, high variability in coefficients, and sample error (Bruce et al., 2020; Hastie et al., 2009; James et al., 2013). As a means of avoiding overinflation and significant fluctuation in coefficients of correlated variables, we conducted a series of regularized regressions to identify a subset of predictors that exhibited the most robust effects via elastic nets (Zou & Hastie, 2005). We cross-validated these analyses using several other statistical techniques (backward, forward, and stepwise regression as well as k-fold cross-validation) to ensure that the results were not produced by idiosyncratic methodological choices (Bainter et al., 2020; de Rooij & Weeda, 2020).
For each model, we provide the variance inflation factor; none of these surpassed the threshold of 10 (O’Brien, 2007; Vittinghoff et al., 2011). We also conducted multiverse analyses for each dependent variable and across samples, so that we were able to assess how robust the conclusions are in relation to (perhaps arbitrary) analytical choices and idiosyncratic specifications (Simonsohn et al., 2019; Steegen et al., 2016). In addition to finding the most robust models according to specified fit criteria (i.e., Akaike’s, Bayesian information criterion, and highest model R2), we examined the proportion of times each predictor was selected, as well as the overall distribution of beta coefficients, thus providing information about which variables reliably predicted the outcome, accounting for uncertainty in the other predictors in the model. The hope is that these analyses illuminate as much as possible the generalizability of the findings from this research program. 1
Sample 1
Distrust of climate science
Consistent with previous research, we observed that Republicans and conservatives were more distrusting of climate science than Democrats and liberals. The correlation between partisan identification and distrust of climate science was, r(1498) = .56, p
We also checked to see whether the association between political ideology (measured operationally) and distrust of climate science was linear or curvilinear. A visual summary is provided in Figure 1 (Panel A) and it shows that, for the majority of operational instruments, the association seems to be linear. This leads us to conclude that linear regression is an appropriate statistical technique for modeling the data in this case, and that distrust of climate science was associated with political conservatism in particular and not with ideological extremity in general.
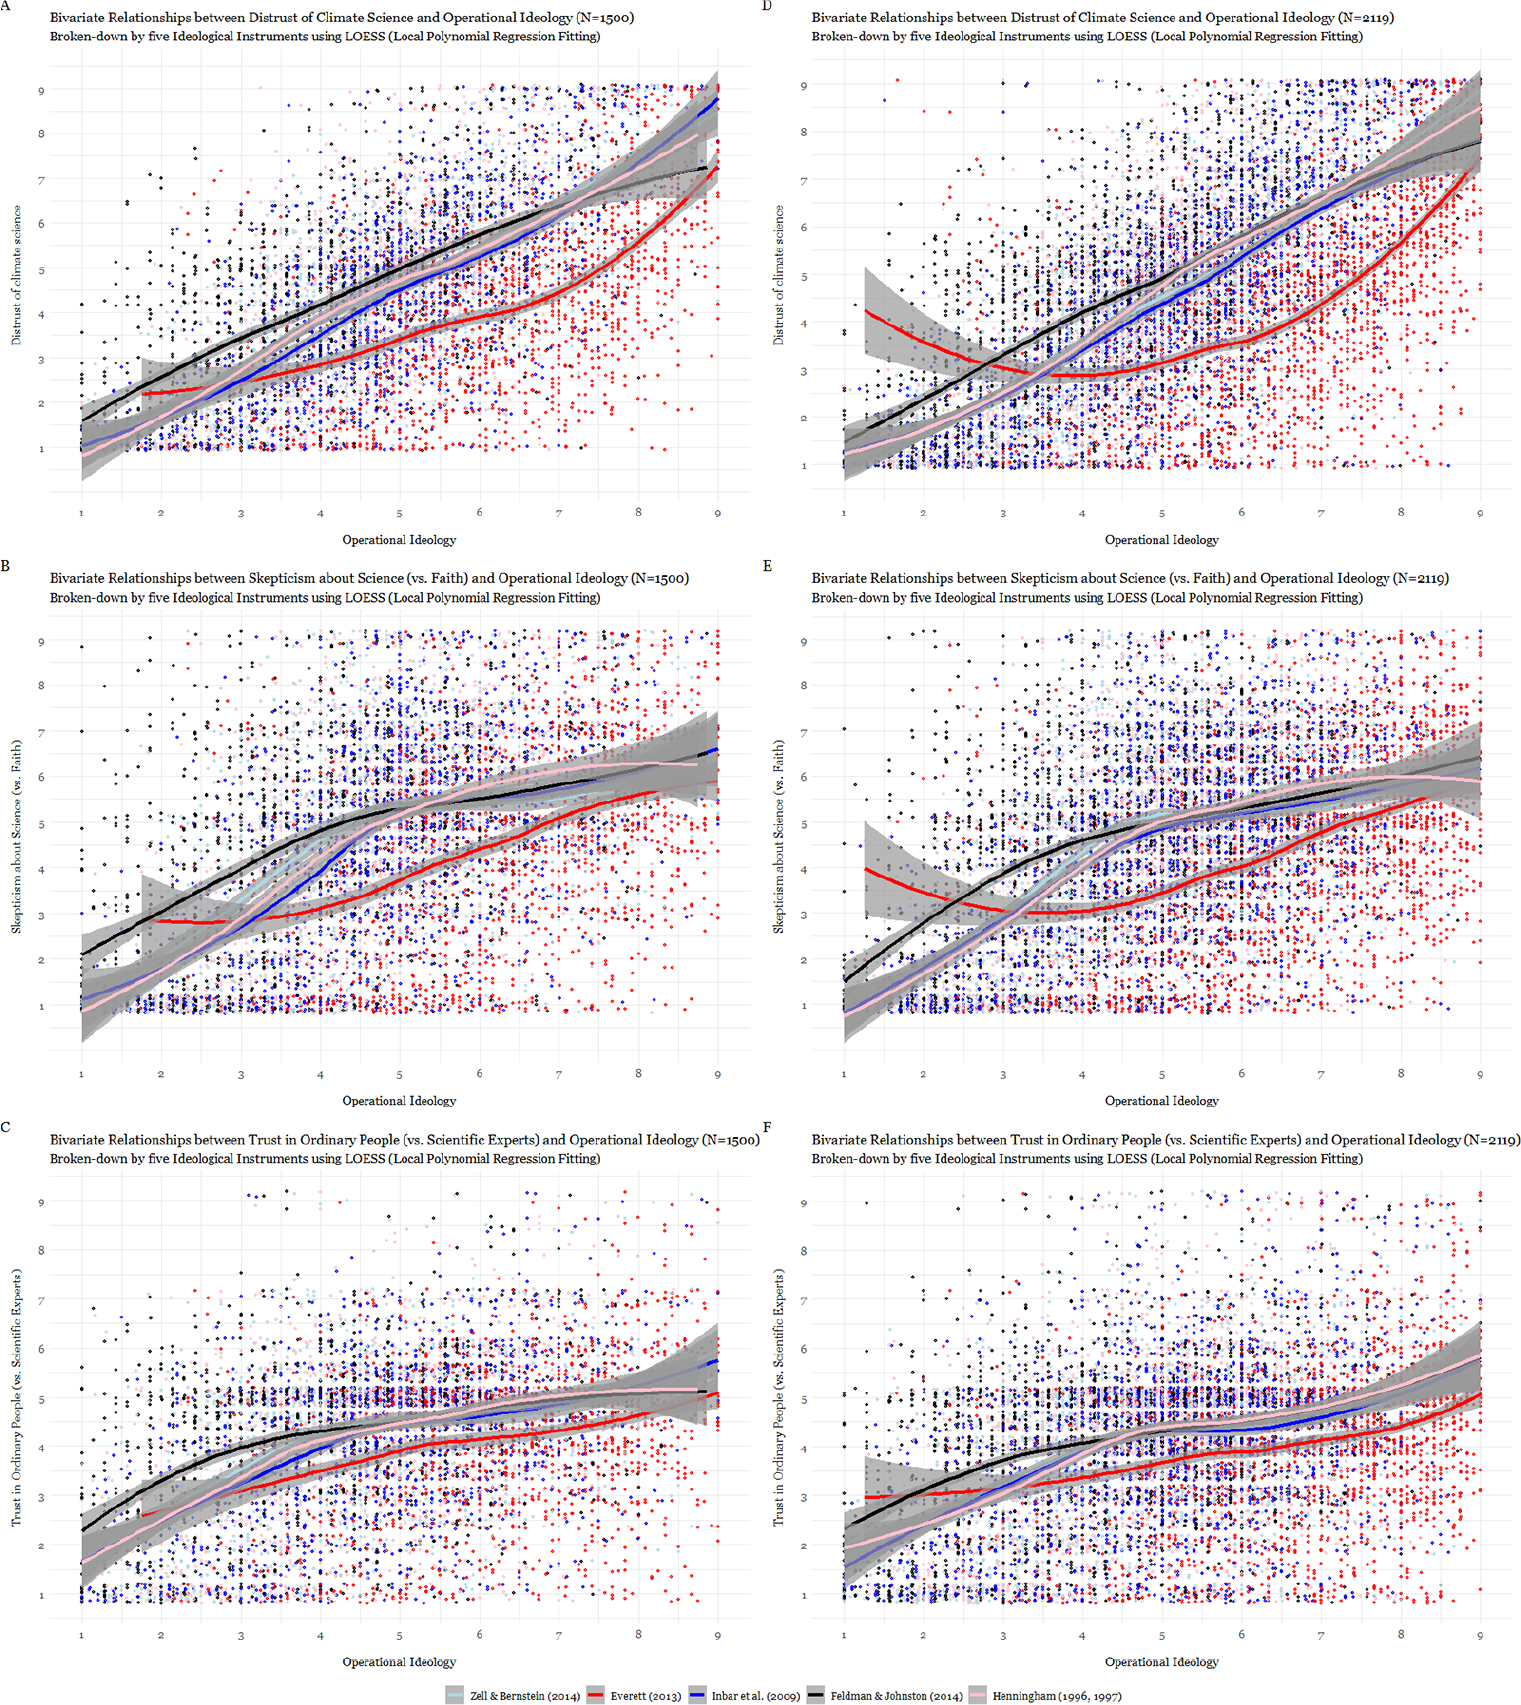
Assessment of curvilinearity between dependent variables and ideology per sample.
Results of the regularized regression analysis revealed that seven of the 15 predictors (including demographic variables) were significantly related to distrust of climate science. They were education, religiosity, symbolic ideology, scores on two of the operational measures of ideology (Inbar et al., 2009; Zell & Bernstein, 2014), RWA, and SDO. Model tuning parameters yielding the lowest root mean square error (RMSE) had an α = .65 and λ = 0.001, indicating a heavier lasso (vs. ridge) penalty. A visual summary of the saturated linear model can be seen in the supplemental material (Figure S1). To ensure that these results were not merely a consequence of a particular statistical technique, we applied four different statistical approaches (backward, forward, and stepwise regression, as well as k-fold cross-validation) and generally arrived at the same results.
We then proceeded to fit a linear regression model with the selected predictors (by elastic net) to the data and, as indicated in Table 1, the model was significant, F(7, 1492) = 303.70, p
Multiple linear regression results with distrust of climate science as the criterion (N = 1,500).
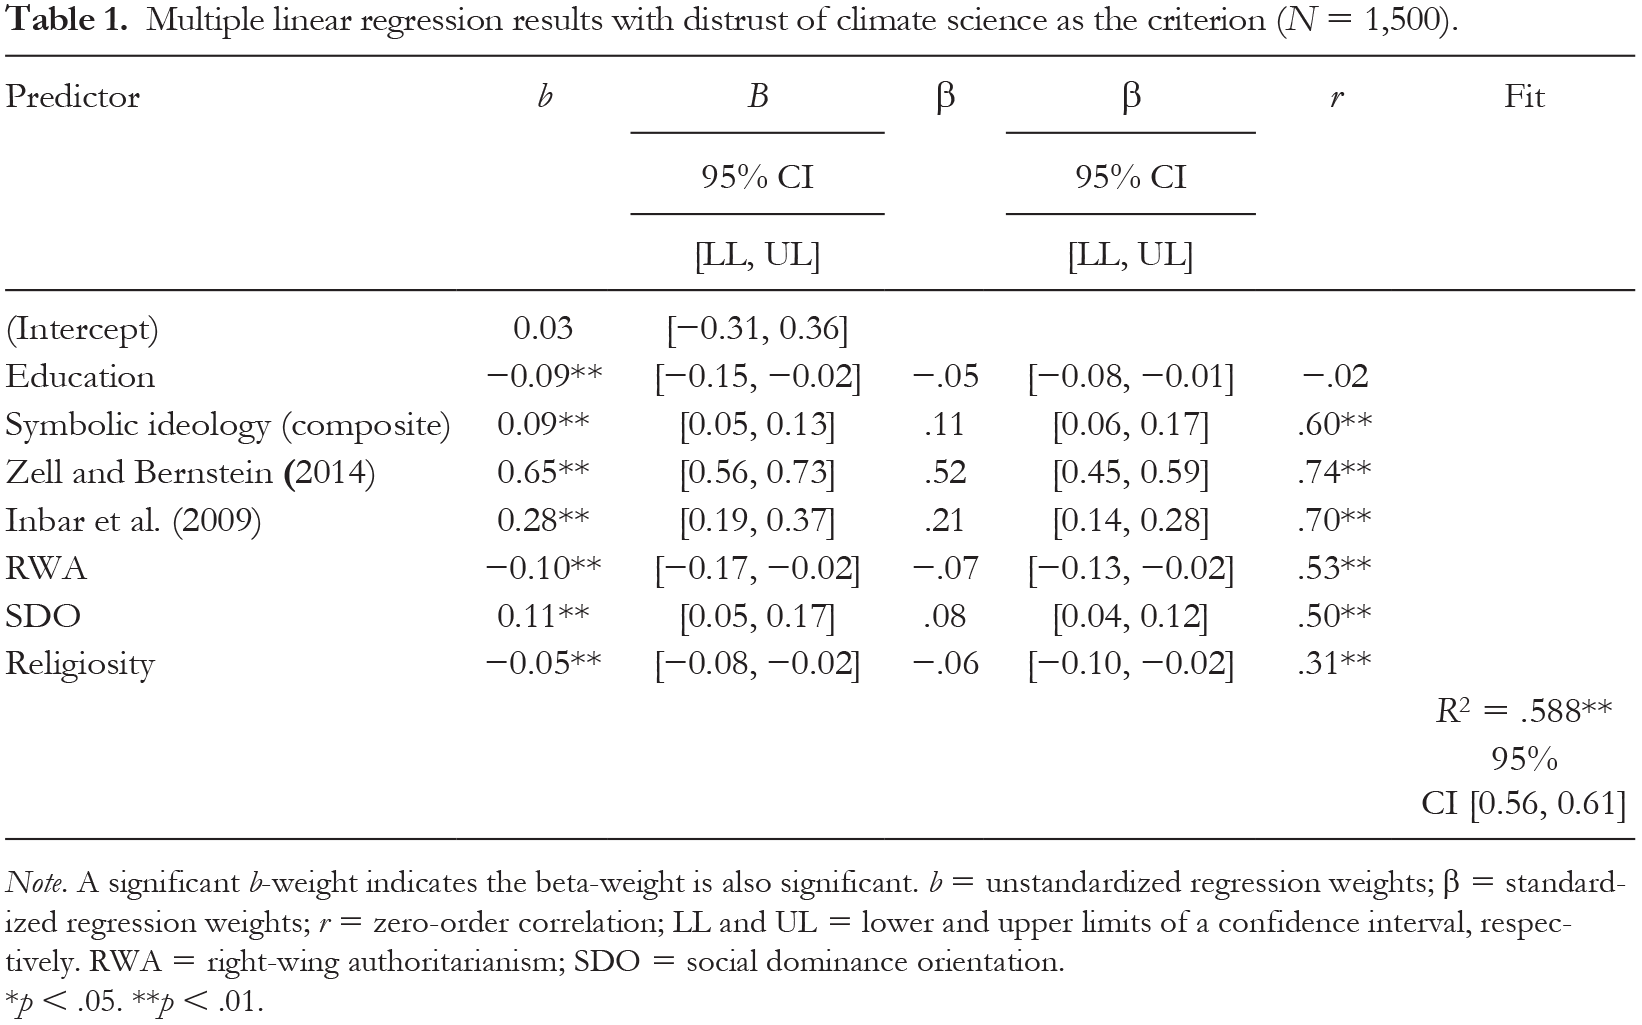
Note. A significant b-weight indicates the beta-weight is also significant. b = unstandardized regression weights; β = standardized regression weights; r = zero-order correlation; LL and UL = lower and upper limits of a confidence interval, respectively. RWA = right-wing authoritarianism; SDO = social dominance orientation.
p < .05. **p < .01.
Furthermore, RWA and SDO were significant predictors of distrust of climate science (tRWA = −2.60, p
We were also interested in estimating the relative importance of each of the predictors, in addition to estimating their magnitude and direction. Therefore, we followed recommendations by Grömping (2006) to partition model-explained variance (R2) into its regressor components. Results, which are presented in Table 2, reveal that, as hypothesized, political ideology was not only the largest contributor with respect to effect size, but it occupied the first three positions in variance explained. This means that when we quantified the contributions of each individual predictor in the final multiple linear regression model, liberalism/conservatism was far and away the most important variable when it comes to explaining distrust of climate science. It was more important than political partisanship, education, and religiosity.
Estimation of the relative importance of predictors of distrust of climate science and the VIF for each (N = 1,500).
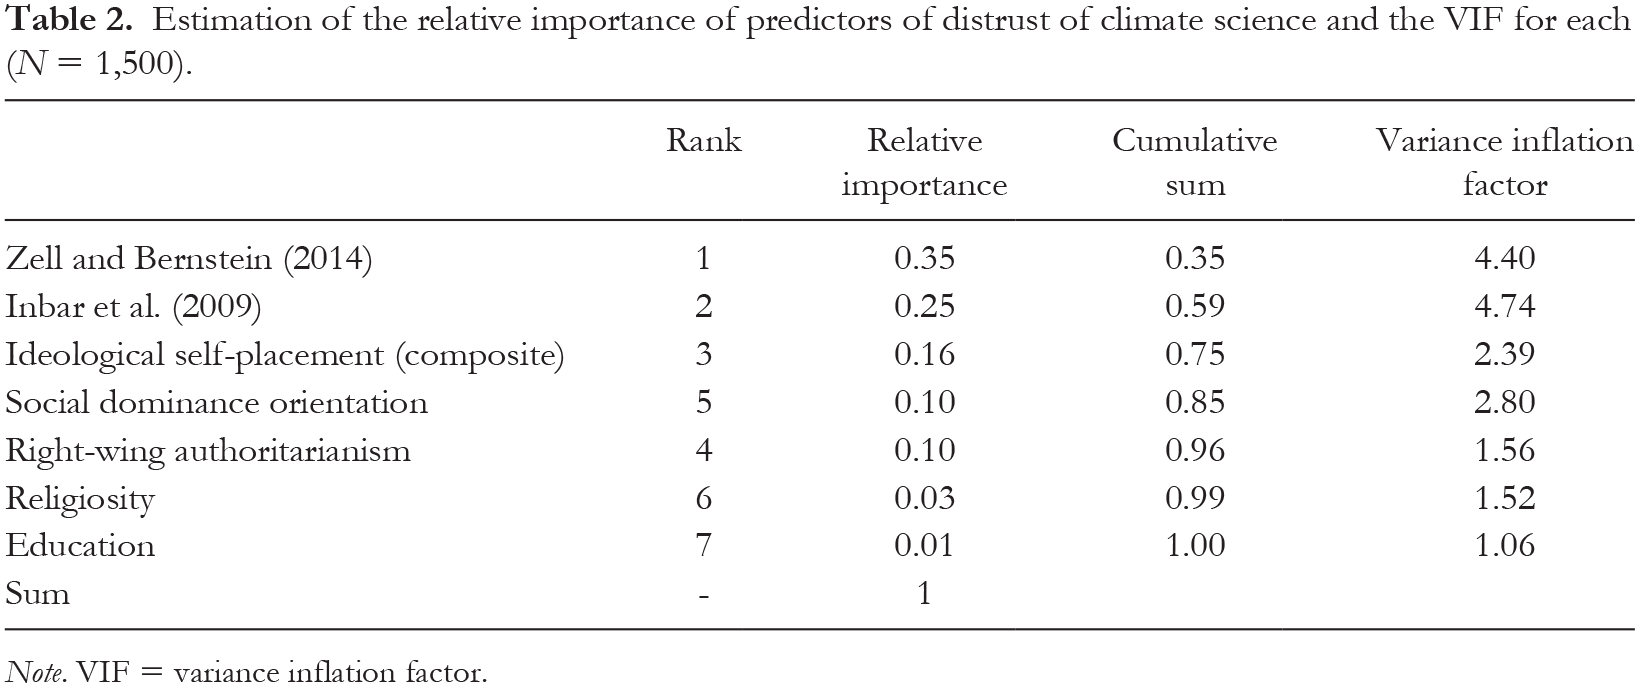
Note. VIF = variance inflation factor.
Skepticism about science (vs. faith)
As expected, Republicans and conservatives were more skeptical about science in general than were Democrats and liberals. The correlation between partisan identification and skepticism about science was r(1498) = .34, p
With respect to operational measures of ideology, correlations with skepticism about science in general ranged from .41 to .57 (p
We also checked to see whether the association between political ideology and trust in science (vs. faith) was linear or curvilinear. A visual summary is provided in Figure 1 (Panel B). It suggests that the true association might be curvilinear, so for the sake of precision, we included quadratic terms in the regularized regressions.
Results of this analysis revealed that seven of the predictors were significantly related to skepticism about science in general. They were education, religiosity, partisanship, scores on three of the operational measures of ideology (Everett, 2013; Henningham, 1996, 1997; Zell & Bernstein, 2014), distrust of climate science, and RWA. Model tuning parameters yielding the lowest root mean square error (RMSE) yielded α = .10 and λ = 0.001, indicating a heavier ridge (vs. lasso) penalty. To ensure that the results were not merely a consequence of a particular statistical technique, we again applied four different statistical approaches (backward, forward, and stepwise regression, as well as k-fold cross-validation) and generally arrived at the same conclusions.
We then proceeded to fit a regression model with the selected predictors (by elastic net) to the data and, as indicated in Table 3, which also adjusts for skepticism about climate science in particular, the model was significant, F(8, 3517) = 179.80, p < .001, R2 = .49. The model explained 49% of the total variance in skepticism about science in general. Education was the only significant demographic predictor (teducation = −8.58, p < .001), indicating that people who were more educated were less skeptical about science. As expected, people who were more religious were more skeptical about science (treligiosity = 11.15, p < .001).
Multiple linear regression results with skepticism about science (vs. faith) as the criterion (N = 1,500).
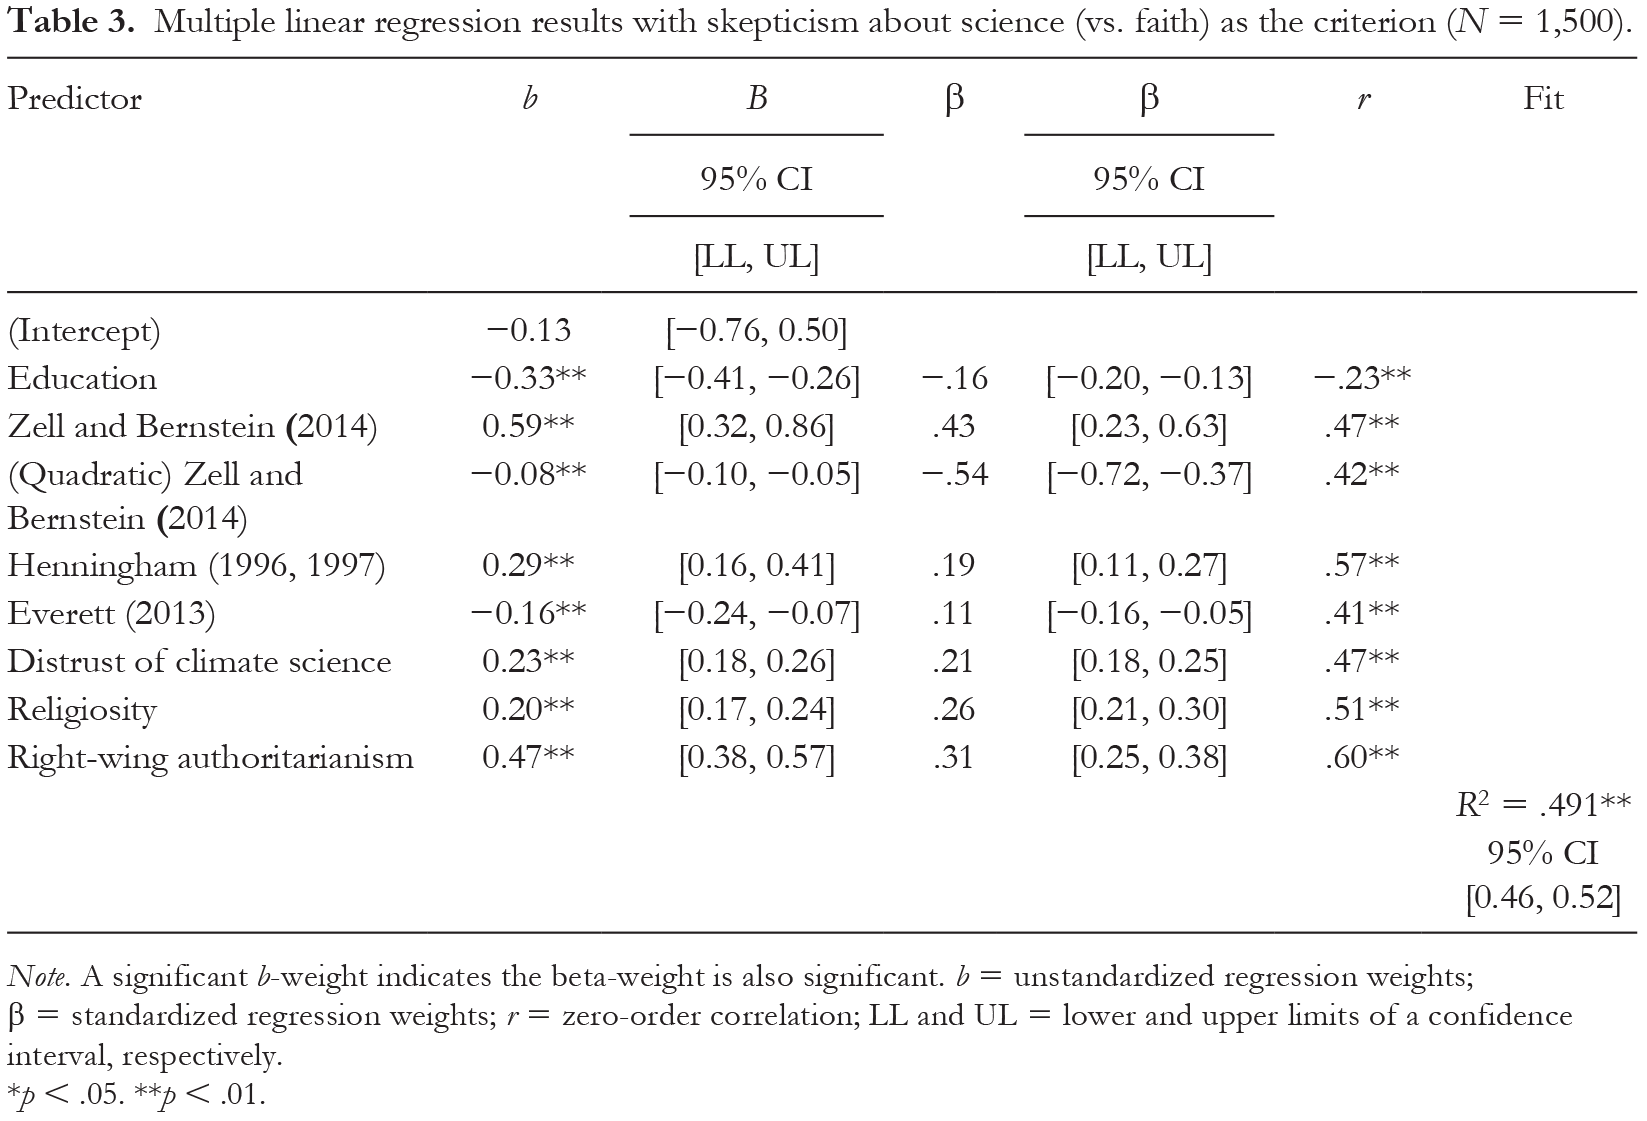
Note. A significant b-weight indicates the beta-weight is also significant. b = unstandardized regression weights; β = standardized regression weights; r = zero-order correlation; LL and UL = lower and upper limits of a confidence interval, respectively.
p < .05. **p < .01.
Scores on three of the operational ideology instruments (t
Zell and Bernstein (2014)
= 4.25, p
After adjusting for ideology, partisanship was no longer a significant predictor of skepticism about science in general (t = −1.90, p = .057). RWA remained a strong predictor of skepticism (tRWA = 9.48, p
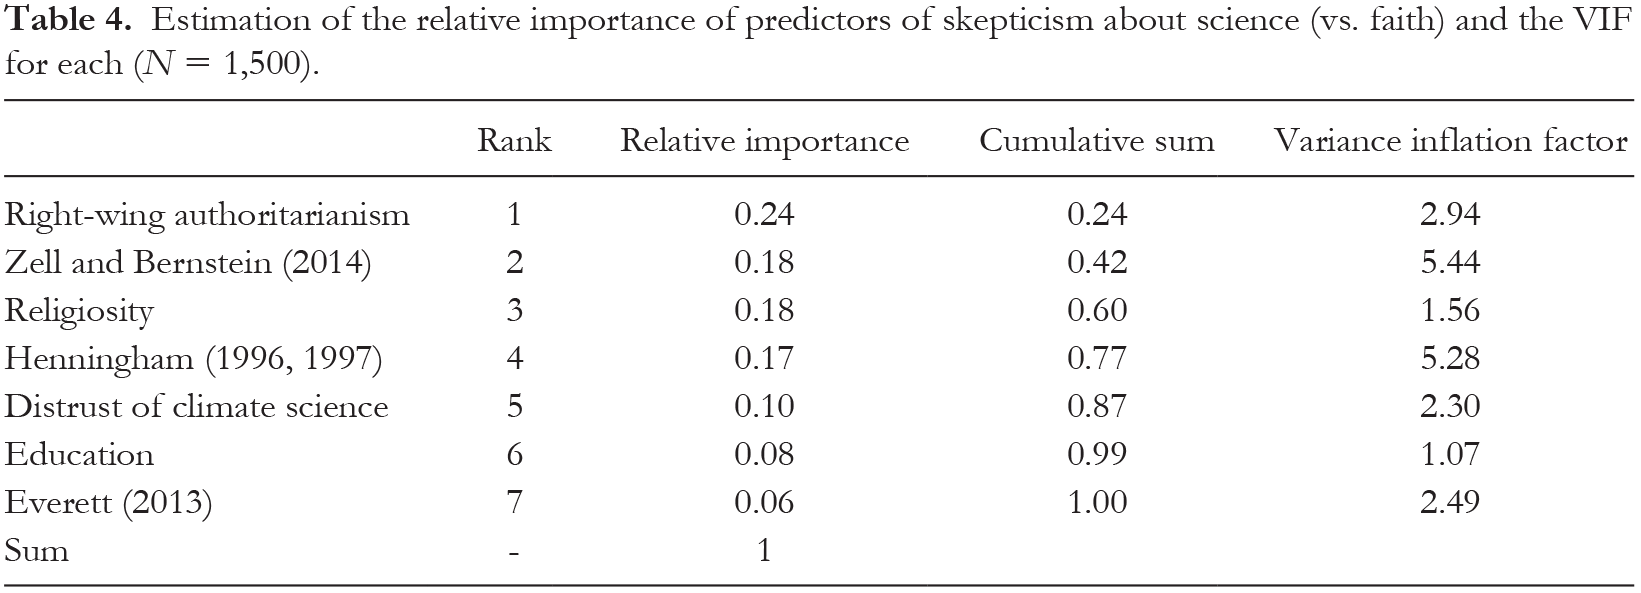
To understand the importance of various predictors, we summarize relative rankings in Table 4, following recommendations by Grömping (2006). Results revealed that RWA was the first and largest contributor, followed by scores on the Zell and Bernstein (2014) conservatism scale, religiosity, scores on the Henningham (1996, 1997) scale, distrust of climate science, education, and scores on the Everett (2013) scale. Taken in conjunction, political ideology was the largest contributor, amounting to a total of 41% of the variance explained. Thus, skepticism about science in general (vs. faith) was predicted more strongly by RWA and conservatism than by partisan identification, education, religiosity, or skepticism about climate change in particular.
Estimation of the relative importance of predictors of skepticism about science (vs. faith) and the VIF for each (N = 1,500).
Trust in ordinary people (vs. scientific experts)
Republicans and conservatives were more trusting of ordinary people (vs. scientific experts) than were Democrats and liberals. The correlation between partisan identification and trust in ordinary people was, r(1498) = .25, p
With respect to operational measures of ideology, correlations with trust in ordinary people (vs. experts) ranged from .28 to .44 (p
We also checked to see whether the association between ideology and trust in ordinary people was linear or curvilinear. A visual summary is provided in Figure 1 (Panel C). It suggests that the association may be curvilinear, so we included quadratic terms in the regularized regressions via elastic net.
Results revealed that seven predictors were significantly related to trust in ordinary people (vs. experts). They were education, partisanship, scores on two of the operational measures of conservatism (Henningham, 1996, 1997; Zell & Bernstein, 2014), RWA, system justification, and distrust of climate science. Model tuning parameters yielding the lowest root mean square error (RMSE) had an α = .10 and λ = 0.01, indicating a much heavier ridge (vs. lasso) penalty. To ensure that these results were not the consequence of a particular statistical technique, we applied four different statistical approaches (backward, forward, and stepwise regression, as well as k-fold cross-validation) and, once again, generally arrived at the same results.
We then proceeded to fit a linear regression model with the selected predictors (via elastic net) to the data. As shown in Table 5, the model was significant, F(8, 1457) = 78.31, p
Multiple linear regression results with trust in ordinary people (vs. scientific experts) as the criterion (N = 1,500).
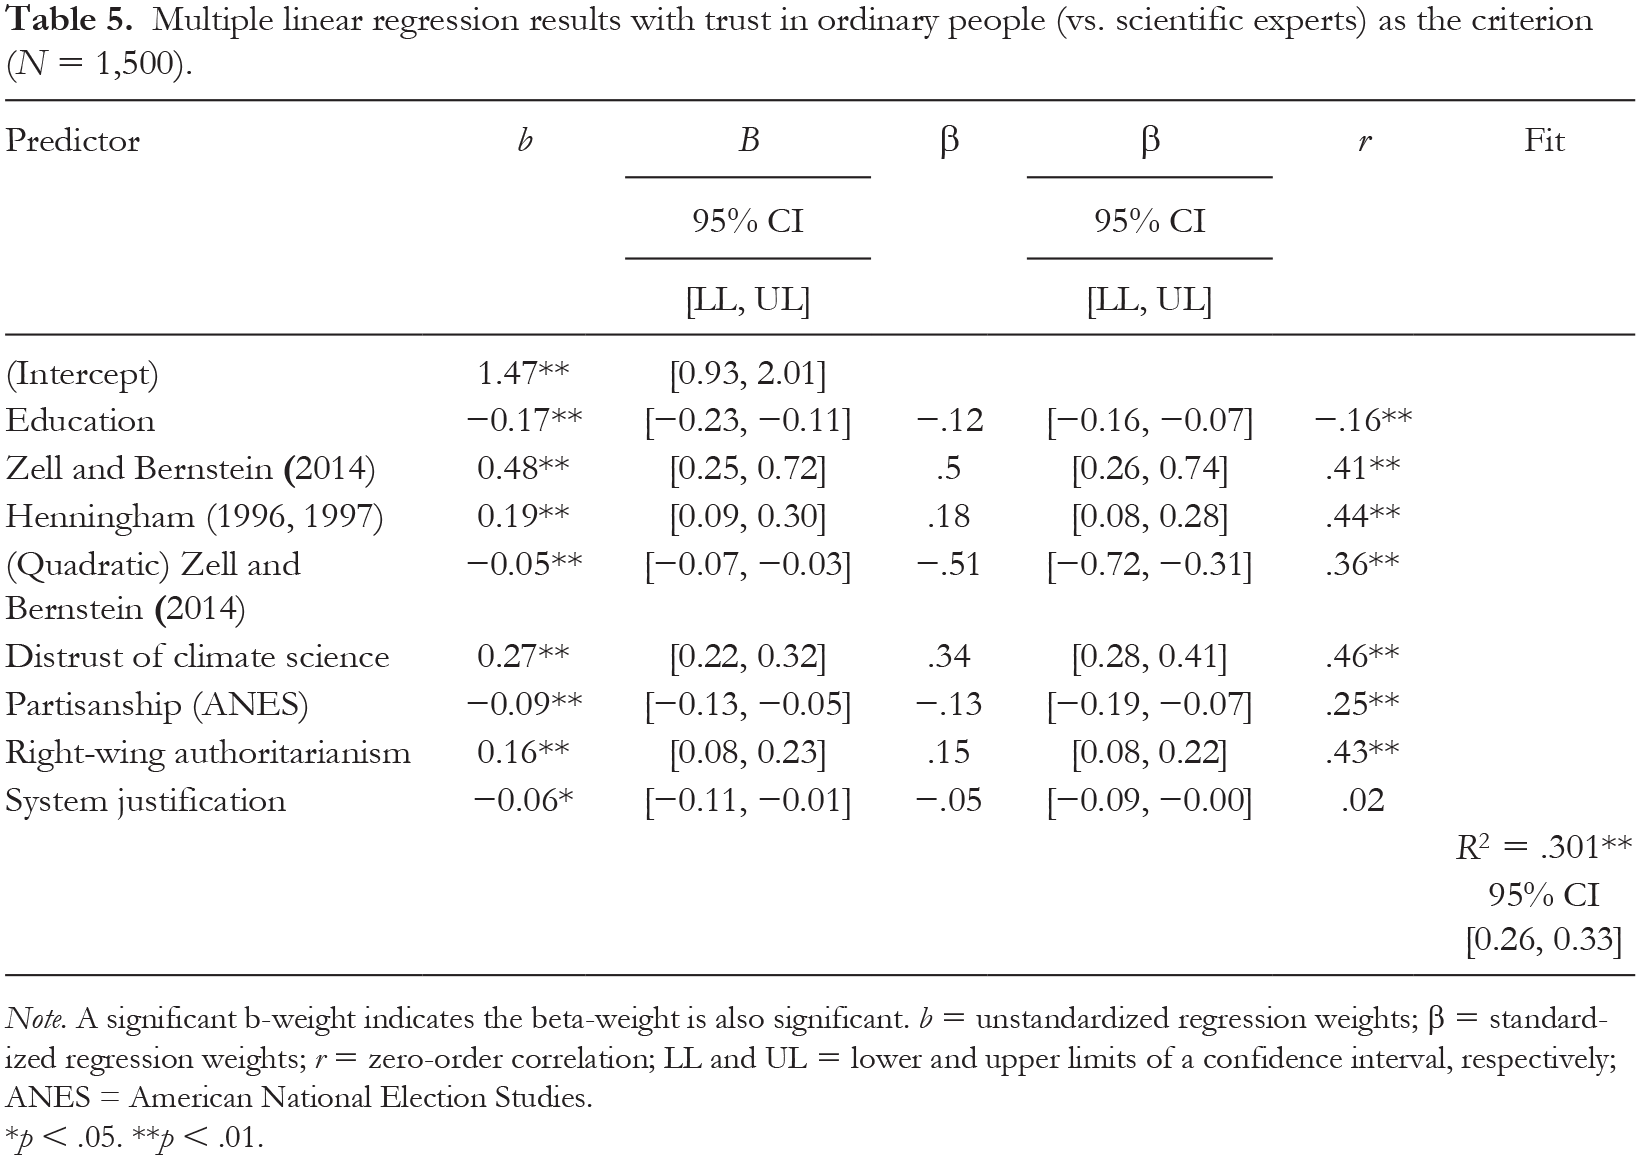
Note. A significant b-weight indicates the beta-weight is also significant. b = unstandardized regression weights; β = standardized regression weights; r = zero-order correlation; LL and UL = lower and upper limits of a confidence interval, respectively; ANES = American National Election Studies.
p < .05. **p < .01.
After adjusting for ideology, partisanship exerted a small but significant effect on trusting ordinary people over experts (t = −4.22, p
To estimate the relative importance of predictors, we again rank-ordered the variables (see Table 6). In this case, conservatism held the second and third ranks, explaining slightly less than half of the total variance. The largest contributor to trust in ordinary people (over experts) was distrust of climate science, and the fourth largest contributor was RWA. All of these variables accounted for more variance than education, partisanship, and other factors.
Estimation of the relative importance of predictors of ordinary people (vs. scientific experts) and the VIF for each (N = 1,500).
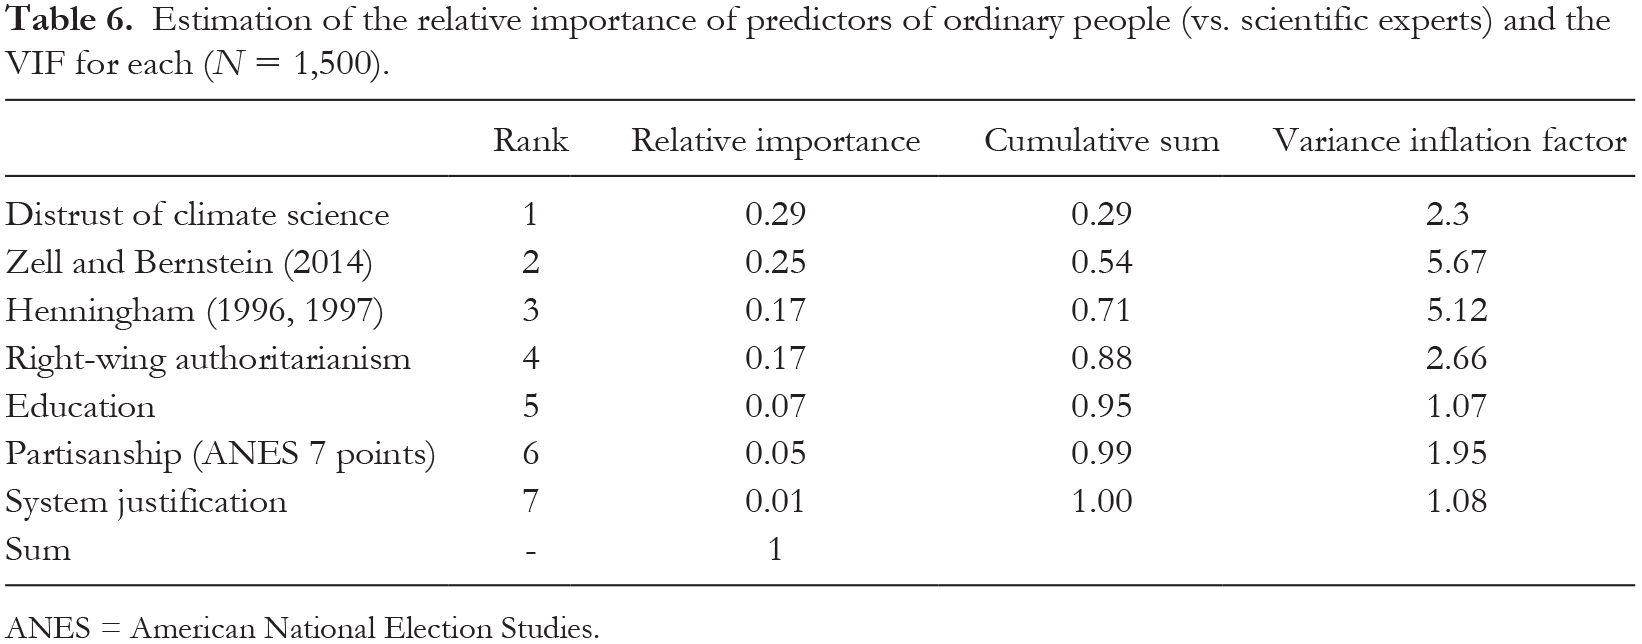
ANES = American National Election Studies.
Sample 2
Distrust of climate science
With only a few exceptions (discussed in what follows), we replicated the results summarized before in a second (confirmatory) sample. As before, Republicans were more distrusting of climate science than Democrats, r(2117) = .58, p
Regularized regression analyses revealed that seven of the 15 predictors (including demographic variables) were significantly related to distrust of climate science. They were age, education, religiosity, symbolic ideology, scores on two of the operational measures of ideology (Inbar et al., 2009; Zell & Bernstein, 2014), and SDO. Model tuning parameters yielding the lowest root mean square error (RMSE) had an α = .91 and λ = 0.02, indicating a heavier lasso (vs. ridge) penalty. To ensure that these results were not merely a consequence of a particular statistical technique, we applied four different statistical approaches (backward, forward, and stepwise regression, as well as k-fold cross-validation) and arrived at very similar conclusions.
We proceeded to fit a linear regression model with the selected predictors (via elastic net) to the data and, as indicated in Table 7, the model was significant, F(7, 2111) = 484.10, p
Multiple linear regression results with distrust of climate science as the criterion.
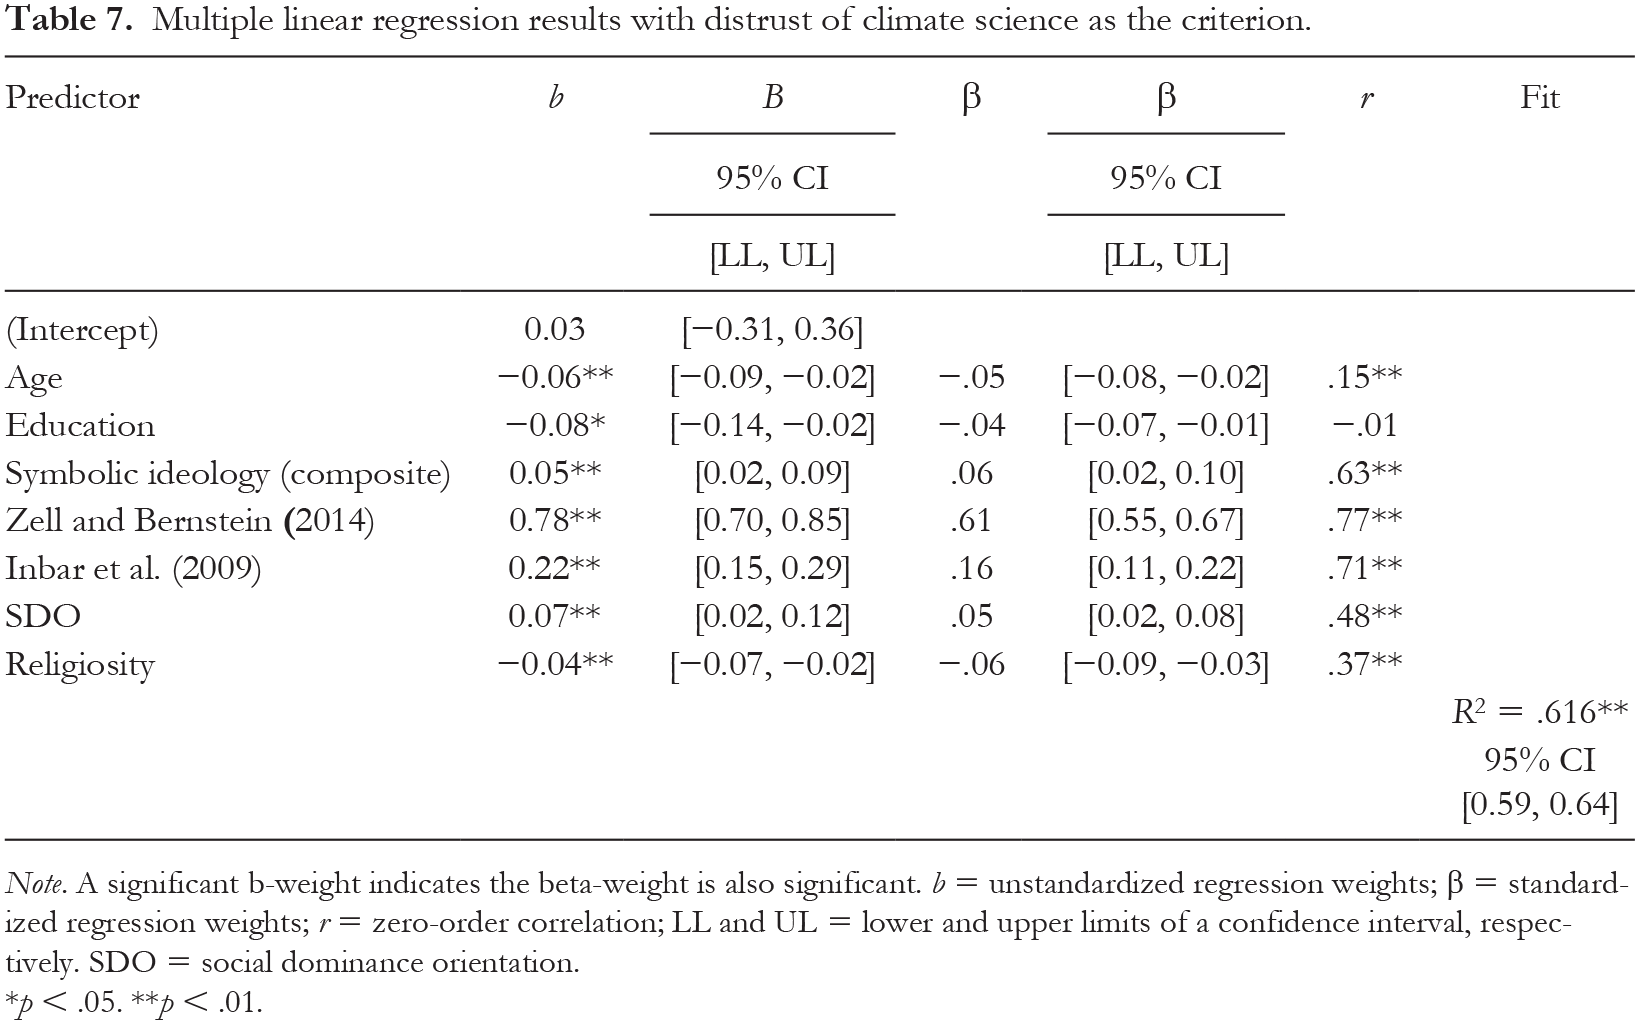
Note. A significant b-weight indicates the beta-weight is also significant. b = unstandardized regression weights; β = standardized regression weights; r = zero-order correlation; LL and UL = lower and upper limits of a confidence interval, respectively. SDO = social dominance orientation.
p < .05. **p < .01.
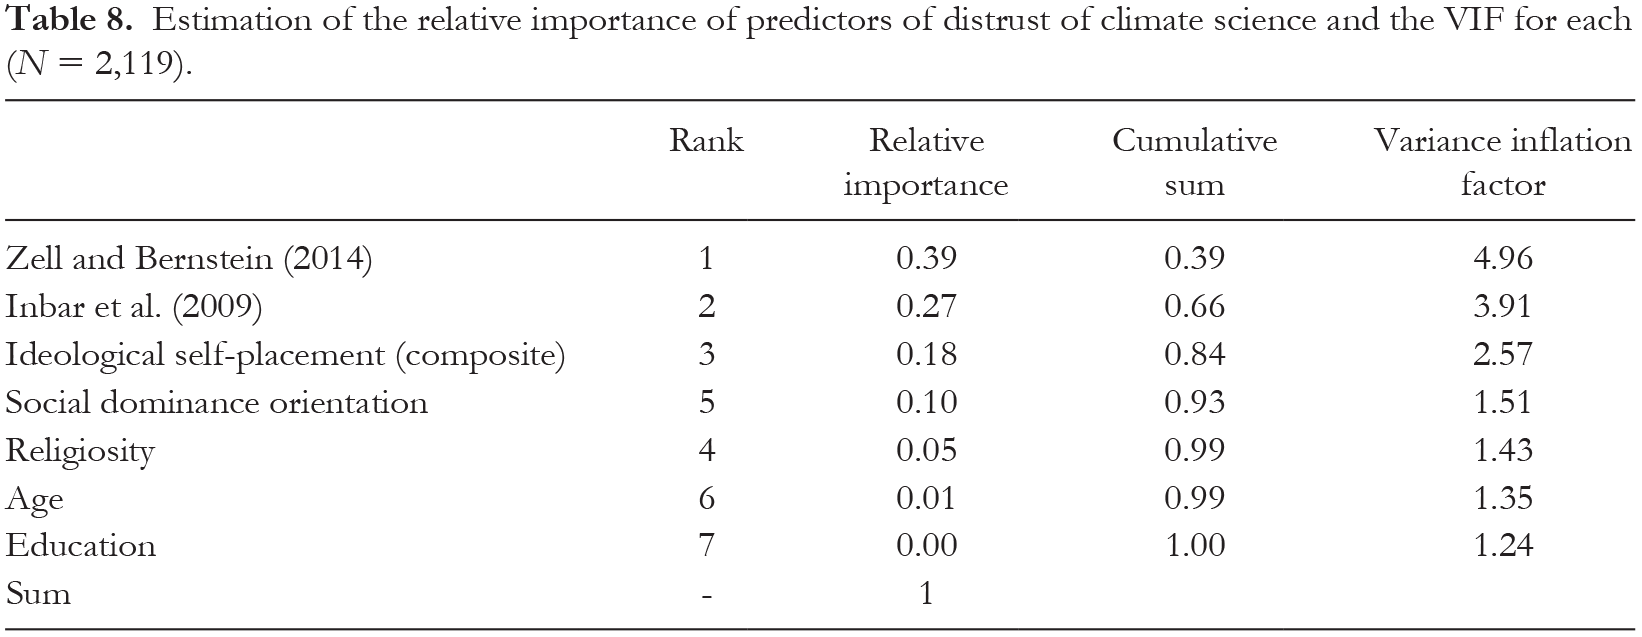
We again estimated the relative importance of each predictor, partitioning model explained variance (R2) into its regressor components. Results, which are presented in Table 8, revealed that political ideology was not only the largest contributor with respect to effect size, but it occupied the first three positions in variance explained, amounting to 84%. As in Sample 1, liberalism/conservatism was far and away the most important variable when it came to explaining distrust of climate science.
Estimation of the relative importance of predictors of distrust of climate science and the VIF for each (N = 2,119).
Skepticism about science (vs
faith).
Republicans and conservatives were again more skeptical about science in general than were Democrats and liberals. The correlation between partisan identification and science skepticism was r(2117) = .35, p
With respect to operational measures of ideology, correlations with skepticism about science in general ranged from .42 to .56 (p
Results of this analysis revealed that nine of the predictors were significantly related to skepticism about science in general. They were education, sex (male), income, religiosity, partisanship, scores on two of the operational measures of ideology (Henningham, 1996, 1997; Zell & Bernstein, 2014), distrust of climate science, and RWA. Model tuning parameters yielding the lowest root mean square error (RMSE) had an α = .34 and λ = 0.001, indicating a heavier ridge (vs. lasso) penalty. To ensure that the results were not merely a consequence of a particular statistical technique, we again applied four different statistical approaches (backward, forward, and stepwise regression, as well as k-fold cross-validation) and obtained very similar results.
We then proceeded to fit a regression model with the selected predictors (by elastic net) and found that the model, which also adjusts for skepticism about climate science in particular, was significant, F(10, 2053) = 196, p
Multiple linear regression results with skepticism about science (vs. faith) as the criterion (N = 2,119).
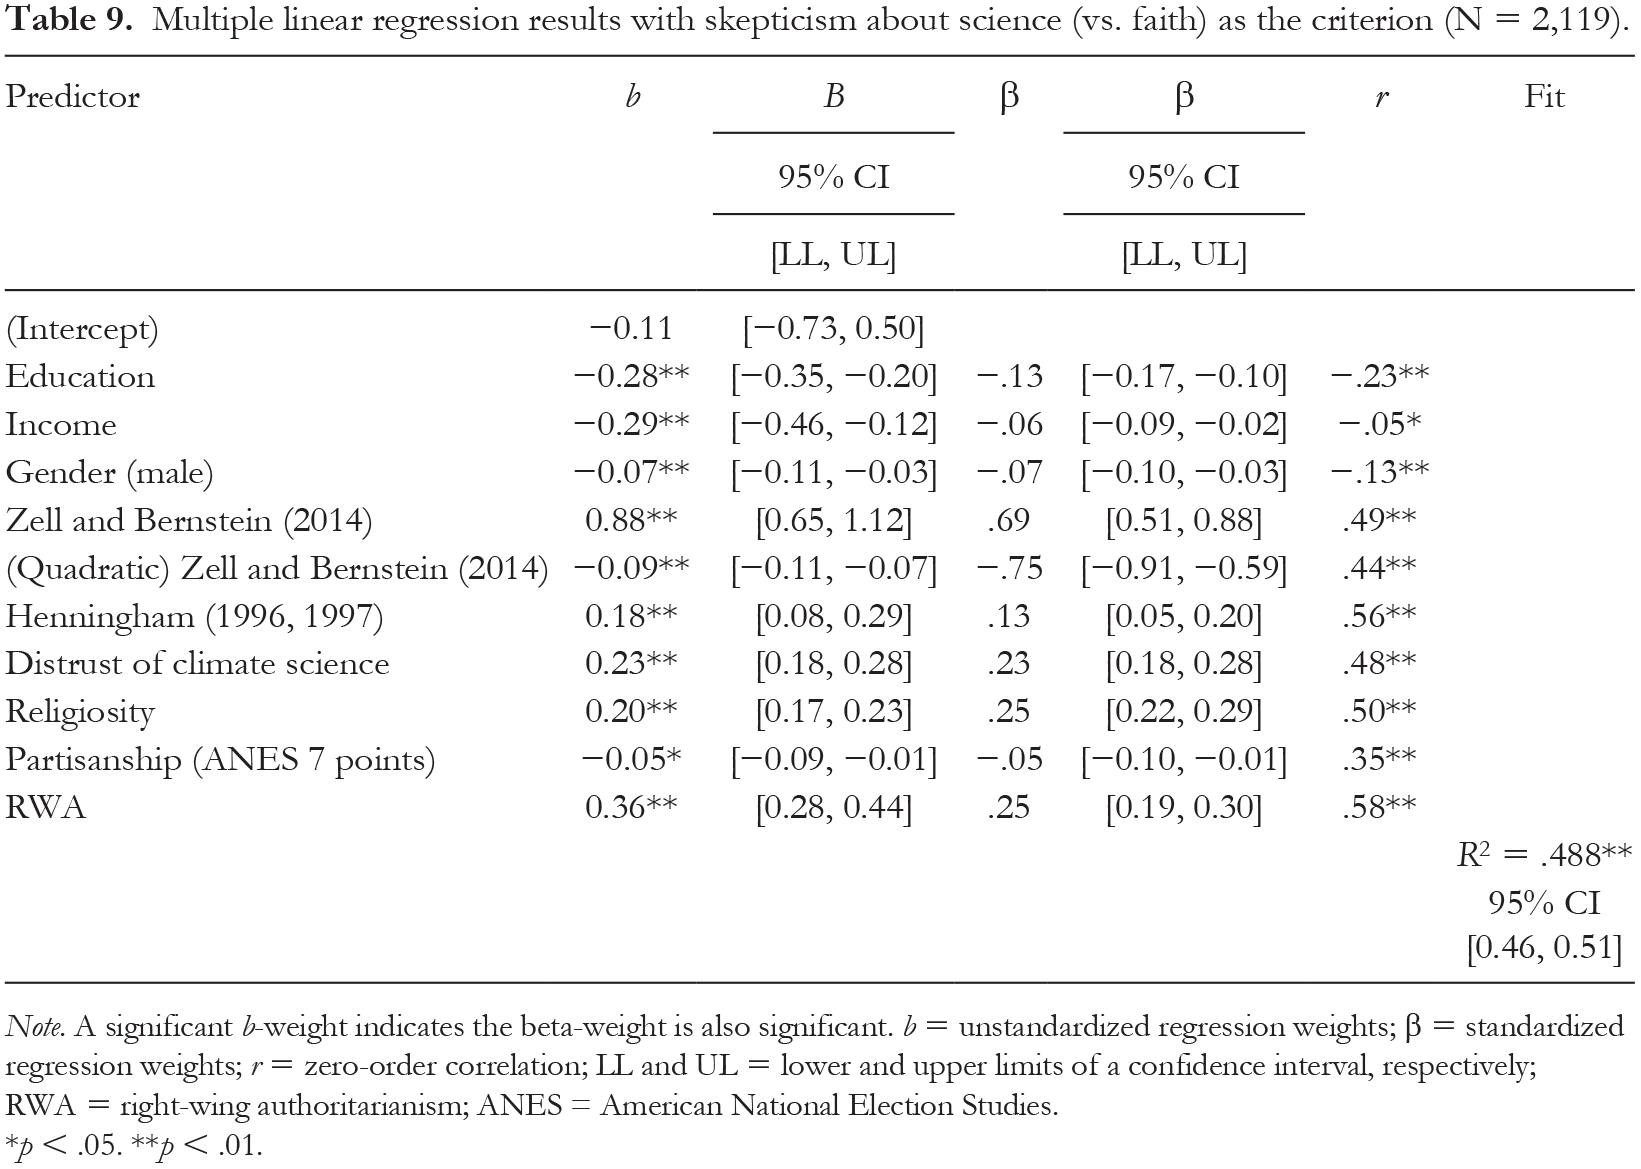
Note. A significant b-weight indicates the beta-weight is also significant. b = unstandardized regression weights; β = standardized regression weights; r = zero-order correlation; LL and UL = lower and upper limits of a confidence interval, respectively; RWA = right-wing authoritarianism; ANES = American National Election Studies.
p < .05. **p < .01.
Scores on three of the operational ideology instruments (t
Zell and Bernstein (2014)
= 5.15, p
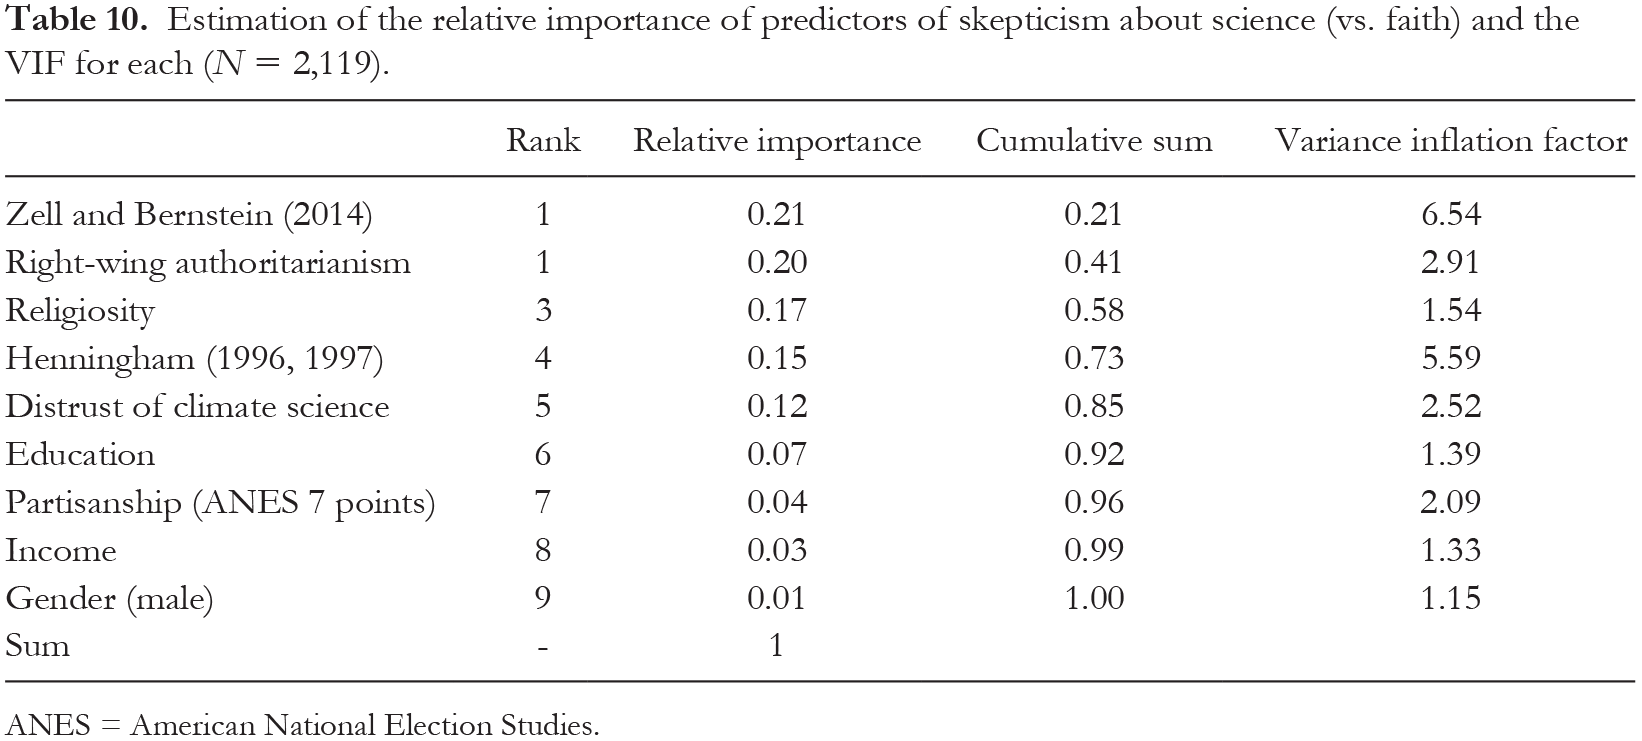
To understand the importance of the various predictors, we present relative rankings in Table 10, which reveal that political ideology was the largest contributor (Zell & Bernstein, 2014), occupying the first and fourth positions with respect to variance explained. RWA was the second largest contributor, and religiosity the third. Across various models estimated during a process of cross-validation, we observed that education and distrust of climate science were always significant predictors of skepticism about science in general, although they explained less variance than ideology, RWA, and religiosity. In summary, then, the holding of antiscientific attitudes was better predicted by conservatism, RWA, and religiosity than by partisanship, education, or climate skepticism.
Estimation of the relative importance of predictors of skepticism about science (vs. faith) and the VIF for each (N = 2,119).
ANES = American National Election Studies.
Trust in ordinary people (vs. scientific experts)
Republicans and conservatives were more trusting of ordinary people (vs. scientific experts) than were Democrats and liberals. The correlation between partisan identification and trust in ordinary people was, r(2119) = .25, p
With respect to operational measures of ideology, correlations with trust in ordinary people (vs. experts) ranged from .27 to .42 (p
Results revealed that seven predictors were significantly related to trust in ordinary people (vs. experts). They were education, partisanship, scores on two of the operational measures of ideology (Henningham, 1996, 1997; Zell & Bernstein, 2014), RWA, system justification, and distrust of climate science. Model tuning parameters yielding the lowest root mean square error (RMSE) had an α = .43 and λ = 0.001, indicating a much heavier ridge (vs. lasso) penalty. To ensure that these results were not the consequence of a particular statistical technique, we applied four different statistical approaches (backward, forward, and stepwise regression, as well as k-fold cross-validation) and again arrived at highly similar results.
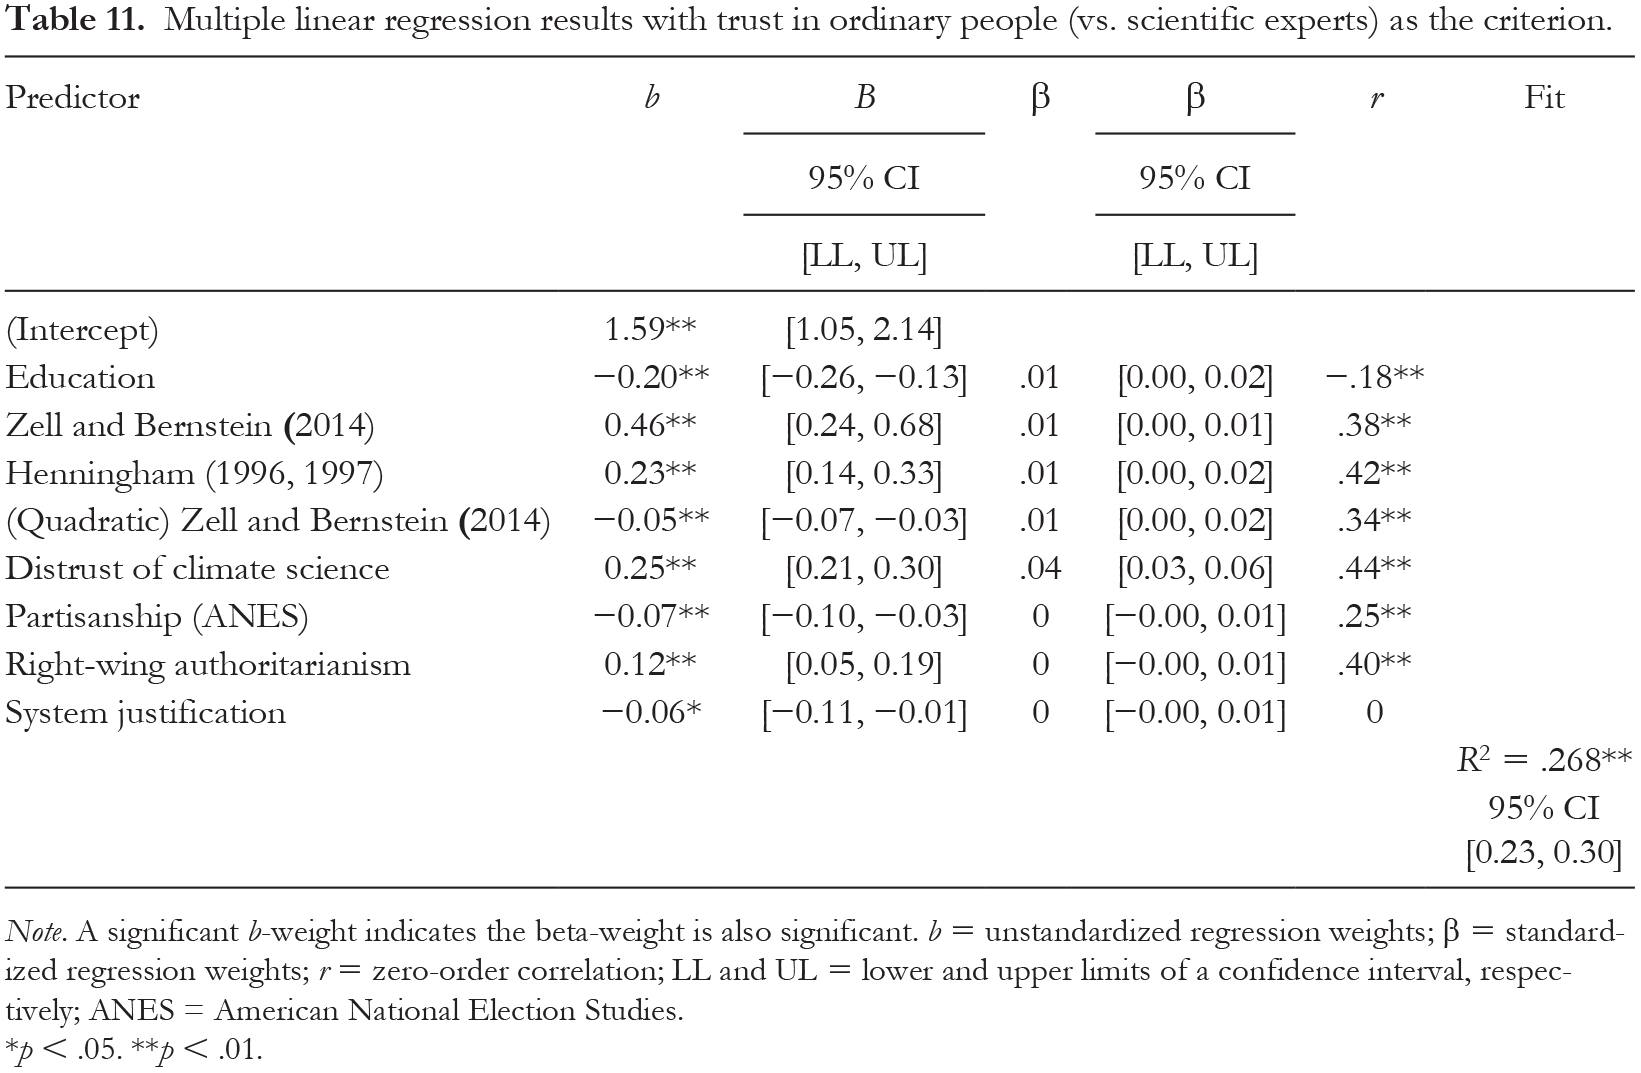
We then proceeded to fit a linear regression model to the data. As shown in Table 11, the model was significant, F(8, 255) = 93.96, p
Multiple linear regression results with trust in ordinary people (vs. scientific experts) as the criterion.
Note. A significant b-weight indicates the beta-weight is also significant. b = unstandardized regression weights; β = standardized regression weights; r = zero-order correlation; LL and UL = lower and upper limits of a confidence interval, respectively; ANES = American National Election Studies.
p < .05. **p < .01.
After adjusting for ideology, partisanship exerted a small but significant effect on trusting ordinary people over experts (t = −3.38, p
To estimate the relative importance of predictors, we rank-ordered the variables (see Table 12). In this case, ideology held the second and third ranks, explaining nearly half of the model’s variance. The largest contributor to trust in ordinary people (over experts) was distrust of climate science, and the fourth largest contributor was RWA. All of these variables accounted for more variance than education, partisanship, and other factors.
Estimation of the relative importance of predictors of trust in ordinary people (vs. scientific experts) as the criterion and the VIF for each (N = 2,119).
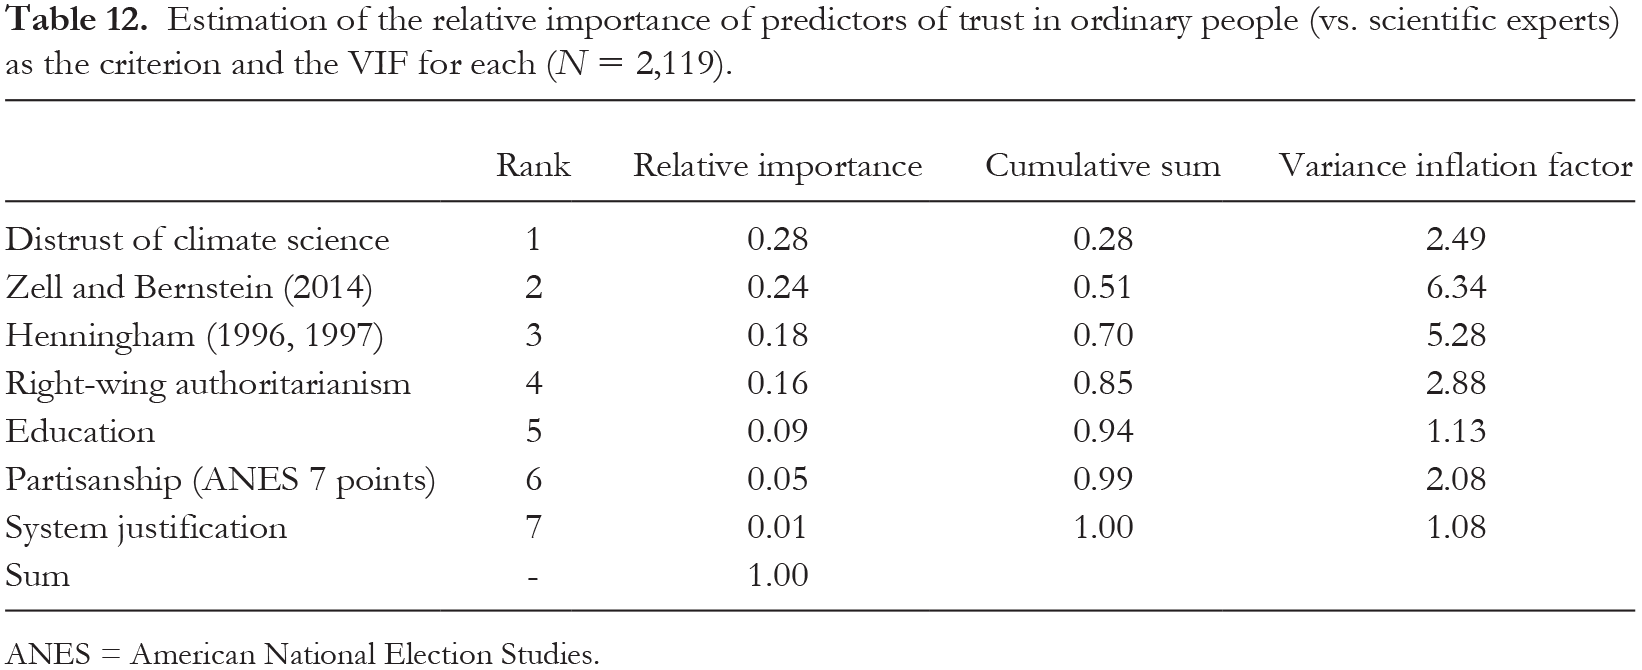
ANES = American National Election Studies.
Consolidating Results: Multiverse Analyses
To a very high degree, we obtained similar results in two U.S. samples using different statistical techniques and various operationalizations of ideology and attitudes toward science. In particular, we observed strong and consistent evidence that liberals held more favorable attitudes toward science (and the community of scientists) than conservatives. However, there were some minor differences between the two samples, and it is useful to investigate the generalizability of results across various model specifications. 3 For this reason, we conducted a series of multiverse analyses.
Taking all available data, we calculated 32,767 linear regression models ensuing from all possible combinations of model–variable specifications to show that (a) the set of variables identified through the regularized regression method described before explained as much variance in skepticism about climate science as the best models resulting from a literally exhaustive model search (multiverse analyses), as illustrated by the red line in Panel A of Figure 2; (b) as the number of variables selected by elastic nets increased, so, too, did the amount of variance explained (R2), as shown in the last line (selected predictors) of Panel B; and (c) the variables that accounted for the most unique variance in our independent analyses of Samples 1 and 2 are the same variables that were most likely to be significant predictors in all universe models, as shown in Panel C.
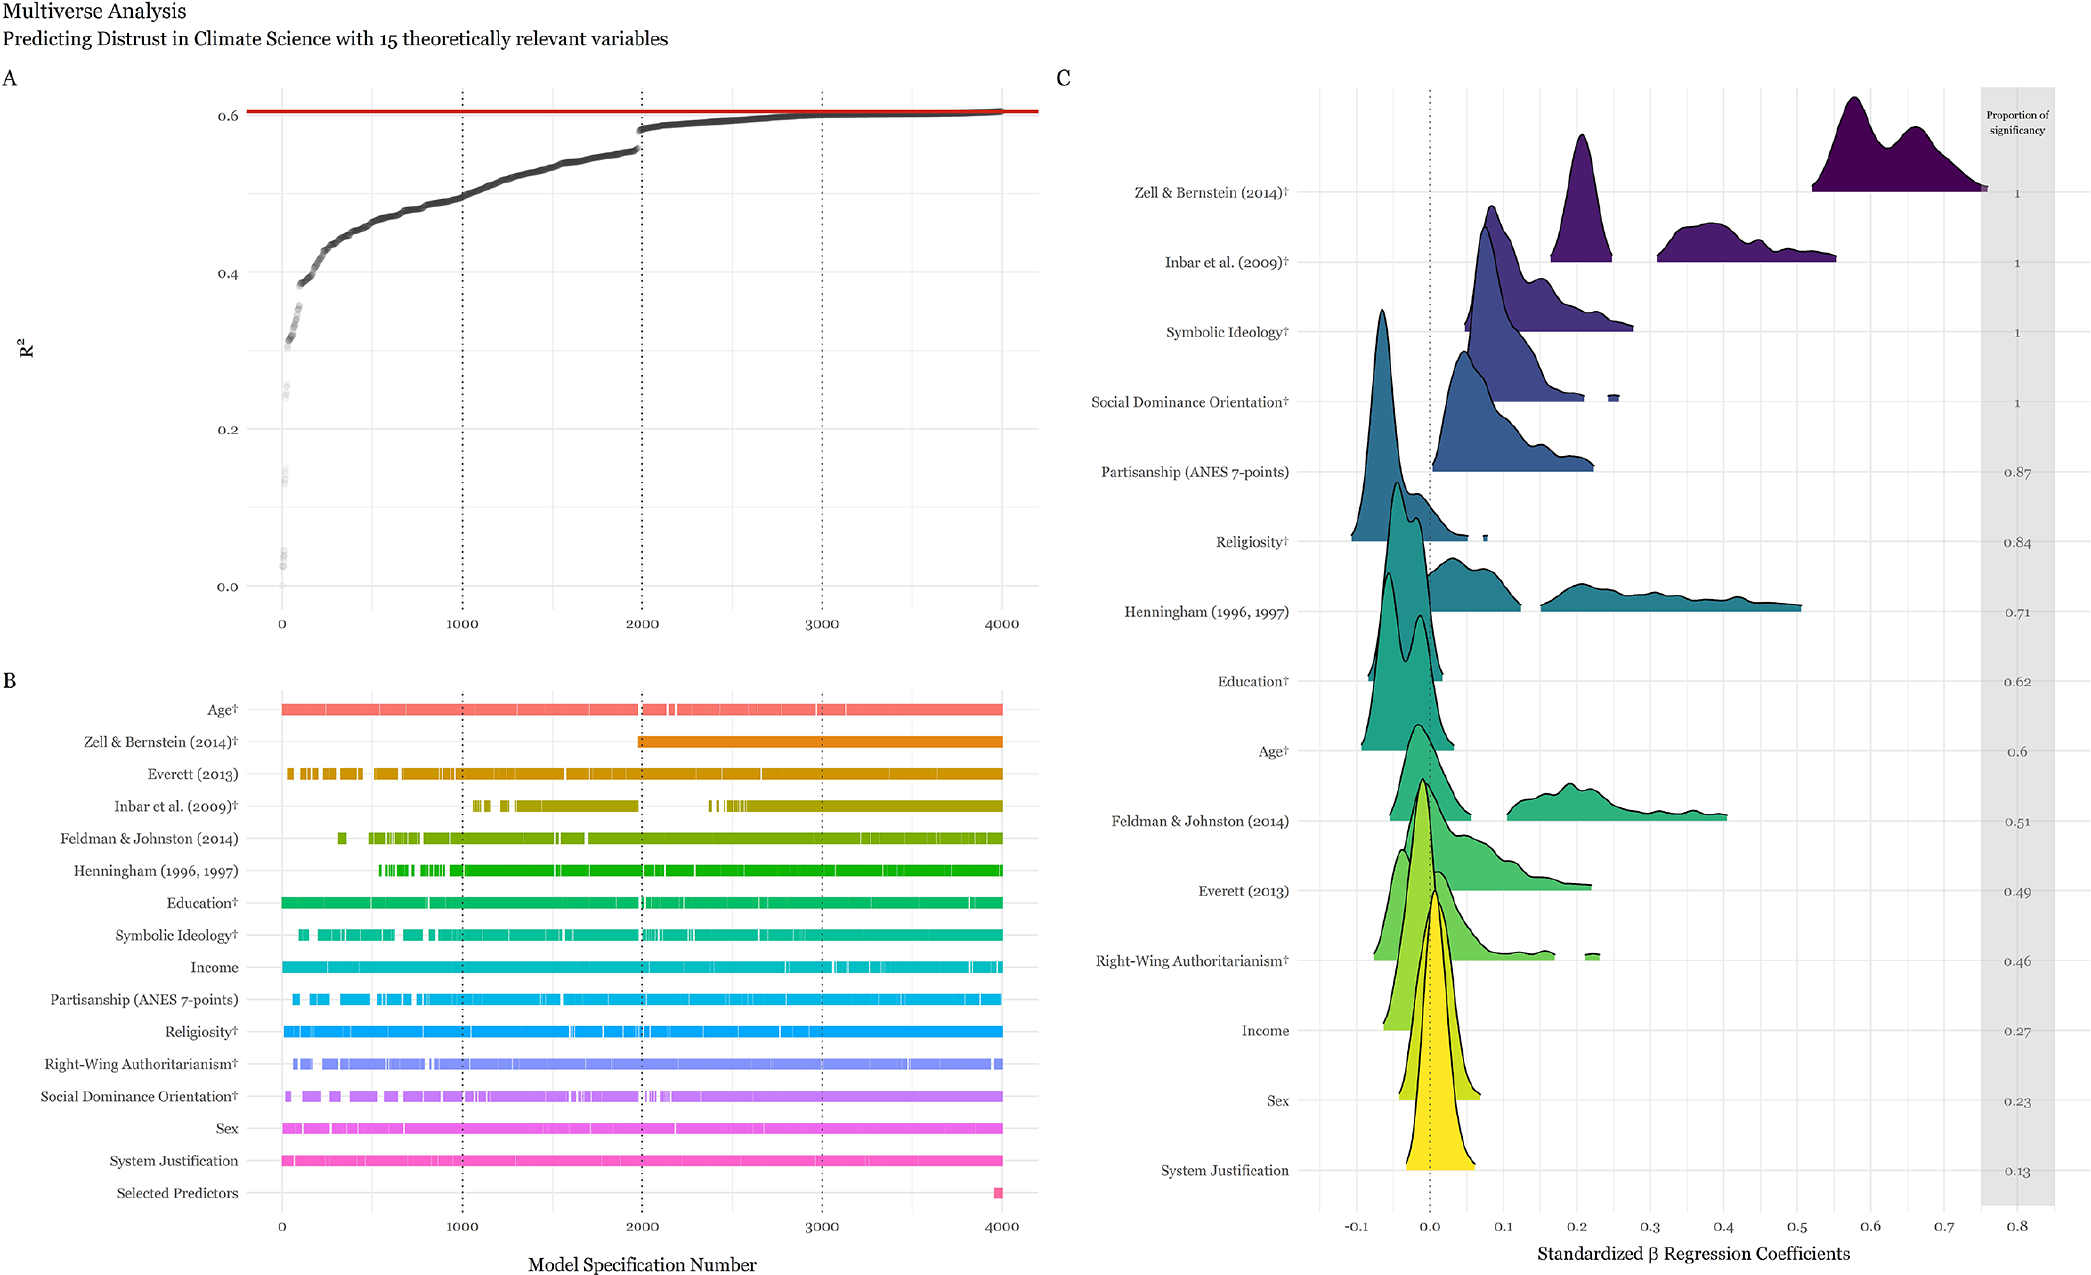
Multiverse analysis predicting distrust of climate science with 15 theoretically relevant variables.
Three additional conclusions can be derived from an inspection of Panel C of Figure 2, which displays the distribution of standardized regression coefficients across all multiverse models. The first is that political conservatism, whether measured symbolically or operationally, clearly reigns supreme as the most robust predictor of distrust of climate science, irrespective of model specifications; on average, it accounts for 80% of the explained variance. SDO is also a very robust predictor, but it only accounts for 10% of the variance. A second conclusion is that while partisanship is a robust predictor of distrust of climate science (significant in 87% of all possible models), it fails to explain unique variance in models that include symbolic and operational measures of ideology and SDO. A third conclusion is that different scales for measuring operational ideology behave quite differently from one another, at least when it comes to explaining variability in attitudes toward science.
With regard to skepticism about science (vs. faith), we calculated 2,057,151 linear regression models ensuing from all possible combinations of model–variable specifications and observed, again, that (a) the variables identified through the regularized regression method explained as much variance in attitudes about science in general as the best models resulting from the multiverse analyses, as illustrated by the red line in Panel A of Figure 3; (b) as the number of variables selected by elastic nets increased, so, too, did the amount of variance explained, as shown in the last line of Panel B; and (c) the same variables that accounted for the most unique variance in our independent analyses of Samples 1 and 2 were the most likely to be significant predictors in universe models. We can also conclude from Panel C that distrust of climate science, RWA, religiosity, education, income, (male) sex, and political conservatism as measured with the Henningham (1996, 1997) scale were significant predictors of skepticism about science in 99.9% of the multiverse analyses. Conservatism was also a significant predictor in at least 76% of the analyses when measured with the Zell and Bernstein (2014) or Inbar et al. (2009) scales. Partisanship was again a robust predictor of distrust of science (significant in 71% of all possible models), but it failed to explain unique variance in multivariate models that included ideology, RWA, religiosity, and climate skepticism.
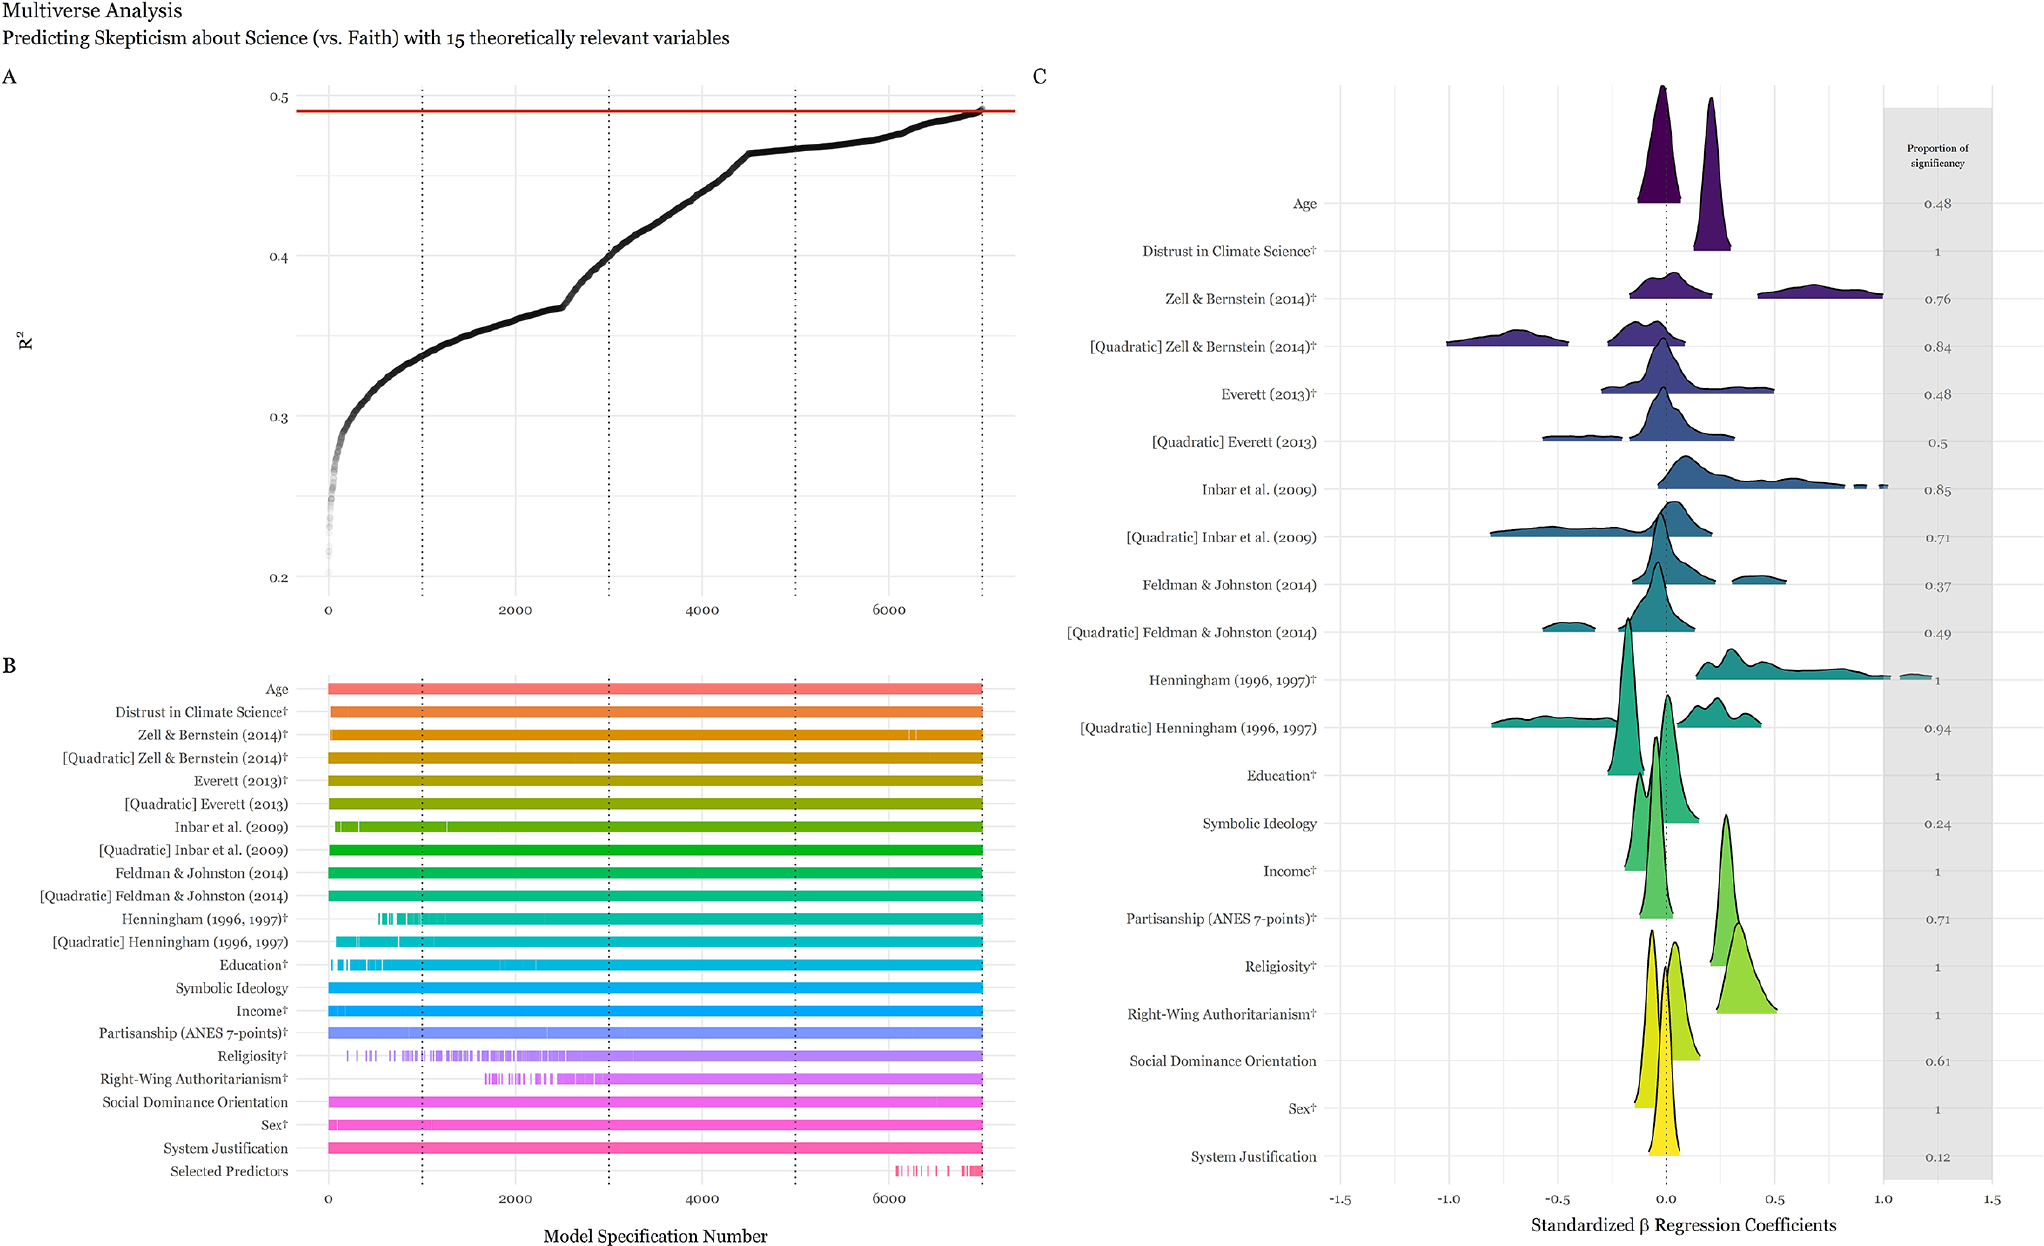
Multiverse analysis predicting skepticism about science (vs. faith) with 15 theoretically relevant variables.
With regard to trust in ordinary people (vs. scientific experts), the multiverse analysis revealed that distrust of climate science, RWA, education, and political conservatism as measured with the Henningham (1996, 1997) scale were significant predictors 99.9% of the time (see Figure 4). In addition, conservatism was a significant predictor in at least 79% of the analyses when measured with the Everett (2013), Inbar et al. (2009), or Zell and Bernstein (2014) scales, and SDO was a significant predictor in 83% of the analyses. Interestingly, in multivariate models, general system justification was a significant predictor of trust in scientific experts (over ordinary people) in 81% of the models. This suggests that scientific experts are indeed considered to be part of the established status quo, at least for many American adults.
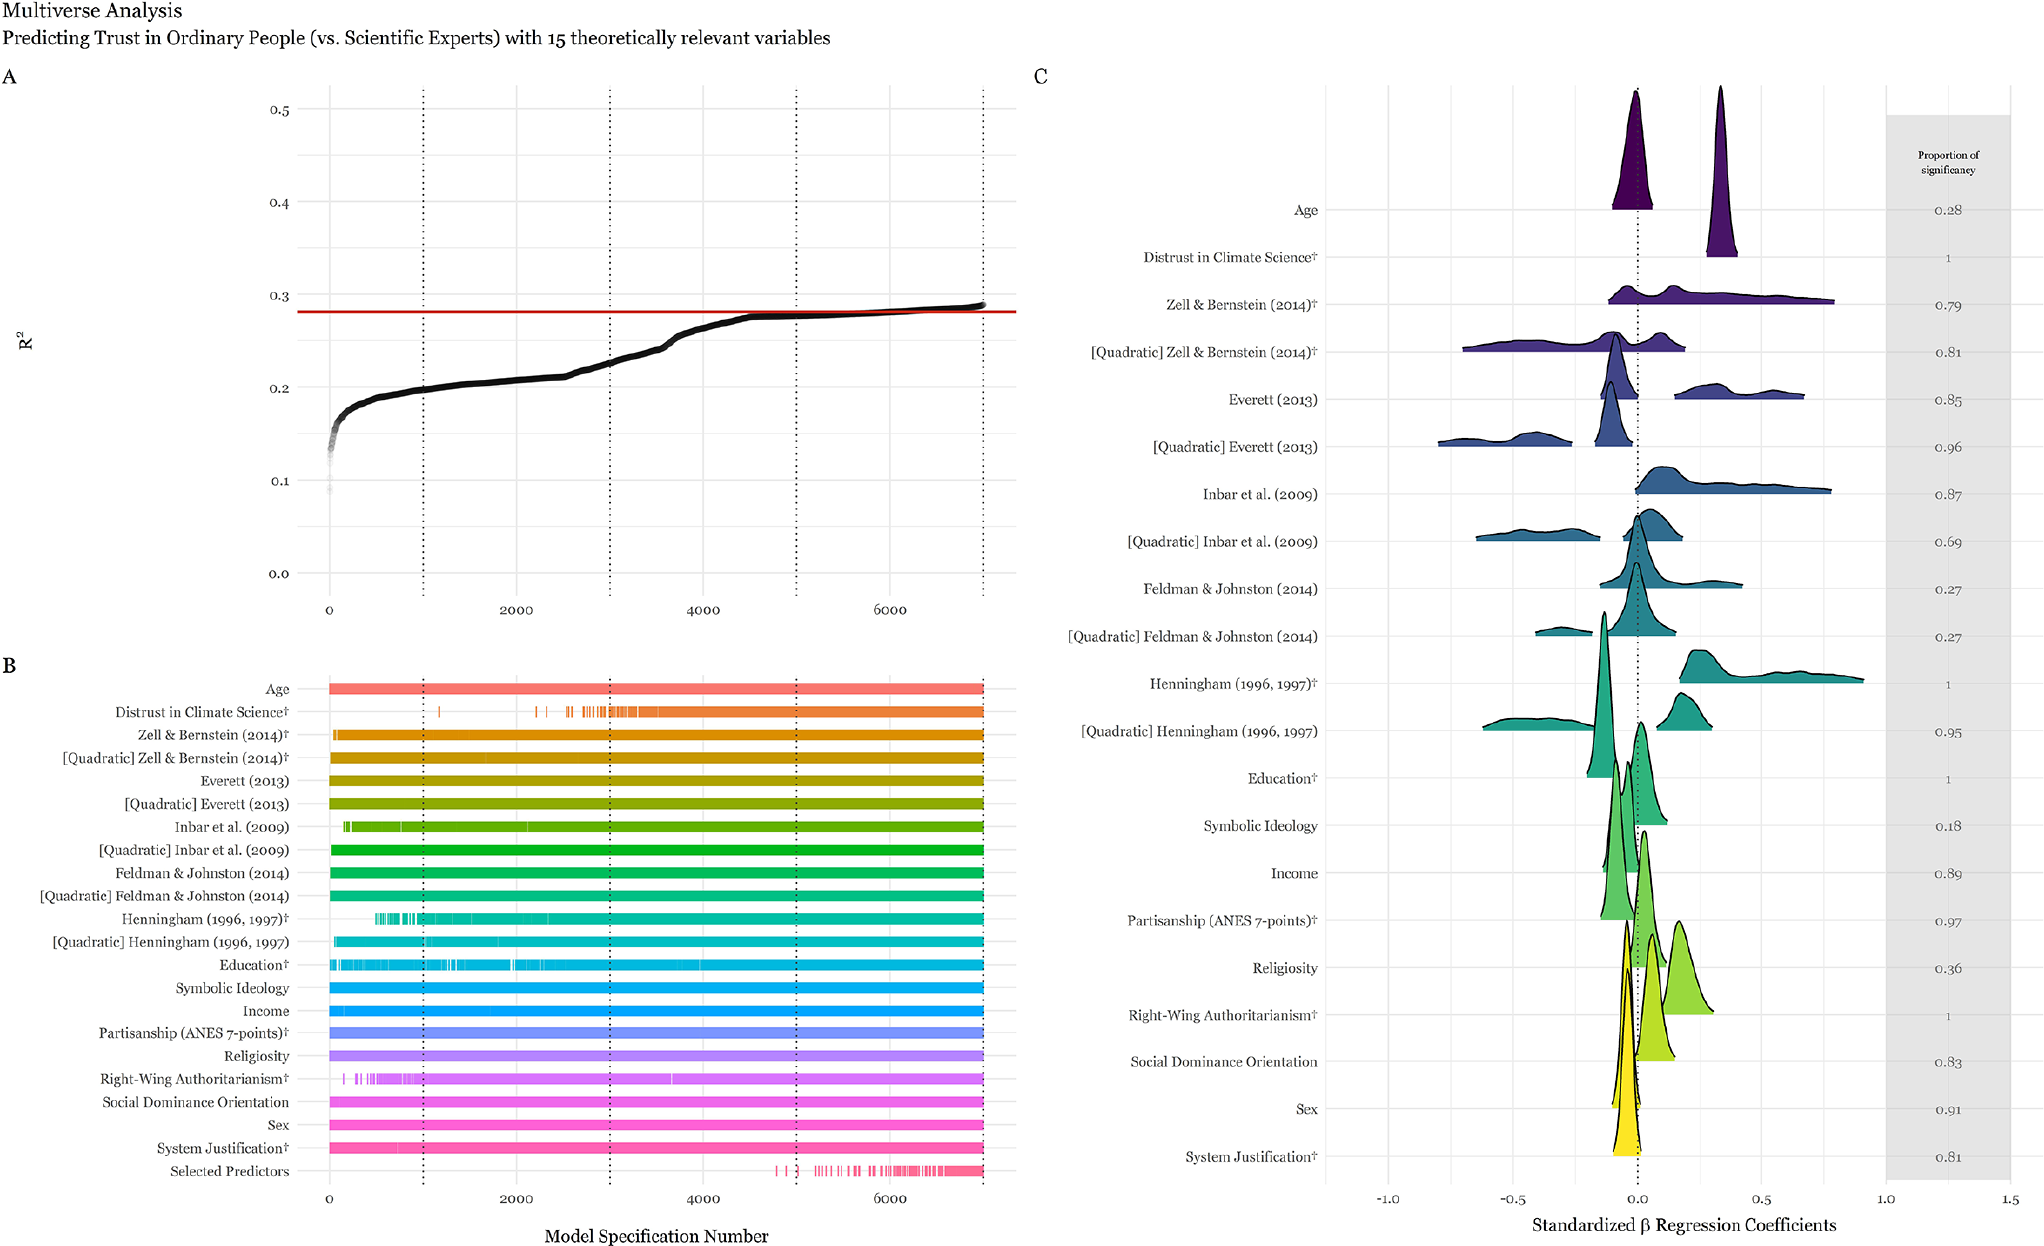
Multiverse analysis predicting trust in ordinary people (vs. scientific experts) with 15 theoretically relevant variables.
General Discussion
A major goal of our investigation of attitudes about science and scientists was to tease apart the effects of political partisanship, symbolic and operational forms of political ideology, religiosity, education, authoritarianism, social dominance, and system justification. At a bivariate level of analysis, all of these variables were correlated with attitudes about science, as shown in Table 1. That is, Republicans, conservatives, religious people, those who were less educated, and individuals who scored higher on authoritarianism, social dominance, and system justification were more likely than others to express antiscientific attitudes. These results are broadly consistent with previous findings in social science (e.g., Blank & Shaw, 2015; Gauchat, 2012; Lewandowsky & Oberauer, 2016; MacCoun & Paletz, 2009; Mooney, 2005; Rutjens, Heine, et al., 2018; Rutjens, Sutton, & van der Lee, 2018; Stanley & Wilson, 2019; Tullett et al., 2016), but the number and specificity of the measures we administered to a nationally representative sample (and a replication sample) add richness, texture, detail, and confidence to the scientific analysis of the role of ideology in motivating skepticism about science.
When all of the variables were entered simultaneously into multiple regression models, it became very clear that the operational endorsement of politically conservative ideology was the dominant predictor. As hypothesized, conservatives expressed less favorable attitudes toward science, scientists, and their claims, in comparison with liberals. Other factors, including partisanship, education, and religiosity were less important, in comparison with ideology. These findings are at odds with the claim that ideological beliefs, opinions, and values are meaningless for most U.S. citizens (Kalmoe, 2020; Kinder & Kalmoe, 2017). Given that operational ideology was a far more important predictor than both symbolic ideology and partisanship, our results contradict the assumption that people’s attitudes about science are a “mechanical reflection of what their favorite group and party leaders have instructed them to think” (Achen & Bartels, 2016, p. 12).
Furthermore, scientific skepticism among conservatives was not confined to the issue of climate change, as previous research by Rutjens, Sutton, and van der Lee (2018) suggested. Nor was conservative skepticism focused exclusively on the political motives of scientists, as Cofnas et al. (2018) proposed. On the contrary, conservatism was a strong predictor of general skepticism about science (vs. faith) and of trust in ordinary people (vs. experts), even after adjusting for distrust of climate science in particular. Our findings are also hard to square with the claim that liberals and conservatives are equally indifferent to the kinds of epistemic norms and practices valued by the scientific community at large (Ditto et al., 2019; Washburn & Skitka, 2018). On the contrary, we observed—in the context of a nationally representative sample and a replication study—that liberals expressed more trust in the scientific method as well as in the community of scientific experts than did conservatives.
Consistent with previous suggestions in the literature (Federico & Malka, 2018; Nilsson et al., 2019), social conservatism was a slightly more important factor than economic conservatism when it came to explaining some antiscientific attitudes. In other cases, however, the effect sizes were not statistically different from one another. Furthermore, economic conservatism was significantly correlated with antiscientific attitudes in every case. There was no evidence that economically conservative individuals held attitudes that were more congenial to the scientific enterprise than those held by economic liberals (or progressives), as proposed by Carl et al. (2016).
The clarity, consistency, robustness, replicability, and generalizability of our findings indicate that there are genuine and significant liberal/conservative differences in attitudes toward the scientific community and, by extension, the scientific process. These findings are consistent with a voluminous literature in political psychology, which demonstrates that, in comparison with conservatives, liberals exhibit epistemic motives and abilities that are more conducive to scientific inquiry, including need for cognition, tolerance of ambiguity, integrative complexity, cognitive reflection, intelligence, and actively open-minded thinking (e.g., Deary et al., 2008; Hodson & Busseri, 2012; Jost, 2017; Pennycook et al., 2020; Price et al., 2015). Broadly speaking, our findings are also consistent with evidence that conservatives are more prone than liberals to accept and share messages—including messages about scientifically relevant topics—that are unduly suspicious, misleading, and false (Allcott & Gentzkow, 2017; Benkler et al., 2017; Guess et al., 2019; Marwick & Lewis, 2017; Miller et al., 2016; Pfattheicher & Schindler, 2016; Sterling et al., 2016; van der Linden et al., 2020). It remains to be seen whether a similar elective affinity exists between rightist (vs. leftist) political orientation and antiscientific attitudes in Europe, Asia, and the Global South.
The fact that RWA and SDO were associated with antiscientific attitudes in general extends previous work linking these variables to skepticism about climate science in the US, Europe, and Latin America (e.g., Carrus et al., 2018; Häkkinen & Akrami, 2014; Jylhä & Akrami, 2015; Jylhä et al., 2016; Milfont et al., 2018; Stanley & Wilson, 2019). Given that RWA and SDO are both positively correlated with political conservatism, these findings provide an additional (albeit related) reason why liberals would hold more favorable attitudes toward science than conservatives, above and beyond differences in epistemic motivation and ability. At the same time, one can easily imagine a contemporary society in which scientific experts were treated as legitimate authorities. Under such circumstances, it is quite possible that authoritarians and system justifiers would be more—rather than less—deferential to the scientific community. Indeed, we observed in our multiverse analysis that system justification was positively associated with trust in scientific experts after adjusting for all other demographic and ideological factors.
Several potential limitations of our research should be noted. The first is that some of our dependent variables—namely, skepticism about science (vs. faith) and trust in ordinary people (vs. scientific experts)—were measured with only two items each, which raises reasonable concerns about construct validity. This situation is due to the fact that the survey administered in 2016 focused on political behavior, including voting intentions in the presidential election, rather than on attitudes about science. Future research would do well to replicate and extend our analyses using better measures of attitudes about science, including complete scales with stronger psychometric properties. Another obvious limitation is that our analysis was confined to the US. Given that Democrats and Republicans clearly disagree about matters of scientific policy, this focus is useful but far from globally representative. In addition to investigating the role of ideology in attitudes about science in other geopolitical contexts, it would be valuable to consider whether the experience with the COVID-19 pandemic has or has not altered the political landscape with respect to attitudes about science.
Concluding Remarks
Throughout the 20th century, social scientists noted a great many conflicts between those who were motivated by traditional, authoritarian, and dominance-oriented concerns, on one hand, and those who were inspired by the democratically oriented values of the scientific community, on the other (e.g., Dewey, 1939; Lewin, 1943/1999). It is no accident that the Enlightenment spawned not only a rejection of absolute religious authority and ancient forms of hegemonic stratification but also a spirit of secular humanism that gave rise, more or less simultaneously, to scientific rationality and democratic political forms (Shapiro, 2012). In our time, it is no exaggeration to suggest, as Dewey (1939) observed nearly a century ago, that the fate of our democracy is yoked to a socially shared capacity and willingness to understand and trust scientific evidence and expertise, not because they are infallible but because they are vastly superior to the propagandistic alternatives at hand.
Supplemental Material
sj-pdf-1-gpi-10.1177_1368430221990104 – Supplemental material for The ideological basis of antiscientific attitudes: Effects of authoritarianism, conservatism, religiosity, social dominance, and system justification
Supplemental material, sj-pdf-1-gpi-10.1177_1368430221990104 for The ideological basis of antiscientific attitudes: Effects of authoritarianism, conservatism, religiosity, social dominance, and system justification by Flávio Azevedo and John T. Jost in Group Processes & Intergroup Relations
Footnotes
Acknowledgements
This article was prepared for a special issue of Group Processes & Intergroup Relations on “A Group Processes Approach to Antiscience Beliefs and Endorsement of Alternative Facts” (guest edited by Bastiaan Rutjens, Sander van der Linden, and Romy van der Lee). Work on this project commenced when the first author was a Fulbright Fellow at NYU under the supervision of the second author. The authors would like to thank Sam Parsons for the much needed help with the multiverse analyses and comments on an earlier draft of this manuscript.
Funding
The author(s) received no financial support for the research, authorship, and/or publication of this article.
Supplemental material
Supplemental material for this article is available online.
Notes
References
Supplementary Material
Please find the following supplemental material available below.
For Open Access articles published under a Creative Commons License, all supplemental material carries the same license as the article it is associated with.
For non-Open Access articles published, all supplemental material carries a non-exclusive license, and permission requests for re-use of supplemental material or any part of supplemental material shall be sent directly to the copyright owner as specified in the copyright notice associated with the article.