
Abstract
Aims and objectives:
We were interested in group differences in Indonesia in bilingualism, whether vocabulary knowledge shows a differential pattern across the languages, and whether language skill and usage differences between groups are moderated by contextual factors, such as ethnic group size.
Data and analysis:
We examined group differences in language usage at home and in public, self-reported proficiency, and vocabulary scores in both languages among 632 adolescents (292 males, Mage = 14.57 years) from four ethnic groups in Indonesia (214 Javanese, 115 Batak Toba, 108 Toraja, and 195 Chinese). Differential item functioning analysis was conducted to test whether adolescents had different vocabulary they only know in one language, which would indicate equality or inequality in access to knowledge in the two languages.
Findings:
There were large differences in language knowledge and usage. The lowest scores in ethnic language vocabulary and usage were found among the Chinese group. Across groups, scores for Bahasa Indonesia (L2) vocabulary were higher than ethnic language (L1) vocabulary. However, the ranking from easy to difficult words was similar across the languages and there were no specific sets of items that were differentially known in any language.
Implication:
Despite the differences in bilingualism skill and usage, all groups have similar access to different domains of the languages, and L2 (Bahasa Indonesia) seems to have become the dominant language in all groups. Our findings also imply that bilingualism comprises various domains, including language skill, self-reported proficiency, and self-reported usage, and that the associations between these components are not very strong.
Originality:
We investigated bilingualism among non-immigrant adolescents in an under-researched, non-WEIRD (western, educated, industrialized, rich, democratic) society. The study shows the role of language usage and skill that is different from a western context in various aspects, such as the dominance of L2 in all groups.
Bourhis, Moïse, Perreault, and Senécal (1997) stated that there have been debates about what kind of state policies can enhance the integration of immigrants within a host majority. They described a model, called the interactive acculturation model, which proposes that relational outcomes are the product of the acculturation orientations of both the host majority and immigrant groups that are influenced by state integration policies with three domains: (1) acculturation orientations adopted by immigrant groups in the host community; (2) acculturation orientations adopted by the host community towards specific groups of immigrants; (3) interpersonal and intergroup relational outcomes that are the product of combinations of immigrant and host community acculturation orientations. But what about a non-immigration multicultural context, where the state also makes policies about language usage, such as Indonesia?
Indonesia provides a unique multicultural context for studying bilingualism because almost all ethnic groups, including the dominant Javanese group, need to acquire Bahasa Indonesia, which is the lingua franca (Suryadinata, Arifin, & Ananta, 2003). Indonesia is different from many other contexts where the second language of the minority group is usually the language of the dominant group. Only around 12% of the research focuses on youth and adolescents – and most of this research is conducted in western, educated, industrialized, rich, democratic (WEIRD) societies (Celenk & van de Vijver, 2011; Henrich, Heine, & Norenzayan, 2010). Moreover, only a few studies on bilingualism have been carried out in Indonesia (e.g. Barlett, 1952; Kurniasih, 2006; Marlina, 2016; Nababan, 1985), and those studies have limitations in their sample size and methodology. For instance, Marlina (2016) only used two adult cases from which the conclusion was drawn that the educational system could strengthen bilingualism. Another study on bilingualism in education was conducted by Kurniasih (2006) in Jogjakarta (Java). This study gave information about how bilingualism patterns differ across social classes of Javanese children. She studied the patterns of language use among 108 Javanese school-age children (11 and 14 year-olds) at home and at school, and the language that the parents used to talk to the children and to their social networks. The middle-class parents and children used Bahasa Indonesia much more than their working-class counterparts, and girls spoke Bahasa Indonesia more than boys (Kurniasih, 2006). From these studies we obtained some information about bilingualism in Indonesia, but there is still a lack of knowledge about bilingualism patterns among many other ethnic groups in Indonesia, how bilingualism patterns are similar or different across ethnic groups, and how bilingualism is influenced by the cultural context of each ethnic group, especially among adolescents. This knowledge is important for developing language policies for education and migration in a multicultural context.
Our previous studies showed that there were substantial group differences in ethnic language usage at home and in public, though Bahasa Indonesia usage in public did not differ between Javanese and Chinese (Sari, Chasiotis, van de Vijver, & Bender, 2018a, 2018b). We also found that ethnic language usage related positively to the vocabulary knowledge of the ethnic language, but Bahasa Indonesia usage did not relate to Bahasa Indonesia vocabulary knowledge among Javanese, Toraja, or Chinese adolescents in Indonesia (Sari et al., 2018b). From these studies, the question was raised whether the differences in the relationship between the language usage and skill of the two languages might be related to the differential ages of acquisition of the two languages or whether vocabulary knowledge would show some ethnic specificity (which would be confirmed if at least one ethnic group showed relatively little or much knowledge in a specific domain of words). Such differential knowledge would reveal itself as item bias of the vocabulary knowledge measurement, the Picture Naming Test (Kharkhurin, 2012) in the present study. Procedures can be employed to test whether specific items, words in our case, are relatively easy or difficult compared with other items in the test; these procedures identify what has become known as item bias or differential item functioning (DIF) (Van de Vijver & Leung, 1997). If there were ethnic groups that ‘specialized’ in teaching specific types of words, children would find those items relatively easy in comparison with children from other ethnic groups, even if the global vocabulary level of the children from different ethnic groups was similar. Further, we would be able to answer the question of whether the differences between groups on language skill reflect differences in educational accessibility and power which is usually found in immigration contexts in western countries.
Indonesia as a non-immigration multicultural context
Most studies on bilingualism have been conducted in countries with a majority host group and immigrant minority groups and the dominant language is the native tongue of the dominant group. In Indonesia, there is no majority group, because the biggest group, Javanese, is only around 40% of the population; there are more than 300 different languages spoken by hundreds of ethnic groups (Ananta, Arifin, Hasbullah, Handayani, & Pramono, 2015; Suryadinata et al., 2003). Furthermore, Bahasa Indonesia, the national language, was originally the mother tongue of the Melayu ethnic group, which makes up only 2% of the population in Indonesia (Ananta et al., 2015; Suryadinata et al., 2003). All of the participants in this study are taught formal Bahasa Indonesia at school. Hence, they have a formal register of the language. In Indonesia, spoken Bahasa Indonesia as a formal language is different from the local languages used primarily as colloquial languages (Cohn & Ravindranath, 2014). In this study, we investigate how adolescents from Javanese, Toraja, Batak Toba, and Chinese ethnic groups use their ethnic language alongside Bahasa Indonesia as the national language, and the languages are labelled in accordance with the classification by Simon and Charles (2018) as: Javanese, Toraja, Batak Toba, Mandarin, and Bahasa Indonesia.
Javanese
Most Javanese live in Java which is the most populated island; around 60% of the Indonesian population live in Java (Ananta et al., 2015; Suryadinata et al., 2003), where we sampled our Javanese participants (Central and East Java). Besides Javanese, there are other smaller ethnic groups in Java such as the Sundanese (West Java), Betawi (Jakarta), Madura (East Java), Banten (West Java), and Cirebon (West Java). The Javanese language is spoken by 70% of the population on the island of Java, and their dominance in the social and political arena enables the Javanese to maintain their ethnic language from generation to generation (Suryadinata et al., 2003). The Javanese were found to be most fluent in the ethnic language, whereas the Toraja had the highest sum scores on L1 and L2 vocabularies (Sari et al., 2018b).
Toraja
The Toraja have similarities with the Javanese in maintaining their ethnic language and culture and mainly live in the area of Tana Toraja, South Sulawesi. They are a minority group (0.37% of the Indonesian population) (Ananta et al., 2015; Suryadinata et al., 2003). The Toraja are a much smaller group than the Javanese; as a consequence, they may interact more with people that have a different ethnic language. This is in line with our observation that they speak Bahasa Indonesia more often than the Javanese (Sari et al., 2018b).
Chinese
Unlike other ethnic groups, there is no home province for the Chinese (Ananta et al., 2015). The Chinese in Java speak their ethnic language much less than Bahasa Indonesia (Sari et al., 2018a, 2018b; Suryadinata et al., 2003). Their ethnic language is only used among a very small group and Chinese children were only officially allowed to acquire the Mandarin language after the fall of Soeharto, who reigned from 1967 to 1998 (Suryadinata et al., 2003). This prohibition may have led to language loss among the Chinese population in Indonesia. The language loss may also relate to the social position of the Chinese group in Indonesia. There are two social classes of Chinese in Indonesia and these two groups have used their ethnic language differently. The first group is Chinese Peranakan or upper-class Chinese; the majority of them live in Java (Oetomo, 1988). These upper-class Chinese in Java had shifted their language of intimacy (in the private area) to the Malay language in the nineteenth century as a marker of their social class, which is higher than the Chinese Totok (lower-class Chinese). The Chinese language with a variety of dialects was more commonly spoken among these Totok (Oetomo, 1988). Respondents in this study were born in or after 1998, so they would have had, in principle, the opportunity to acquire the Mandarin language.
Batak Toba
The Batak, who constitute 42% of the population in North Sumatra, speak Bahasa Indonesia during official occasions and in daily conversation when relating to other ethnic groups, while they speak Batak when interacting with their own ethnic group (Sari et al., 2018a; Suryadinata et al., 2003). North Sumatra is home to the Batak ethnic group (which makes up less than 10% of the Indonesian total population; Ananta et al., 2015; Suryadinata et al., 2003). Like the Toraja, the Batak also show similarities with the Javanese in their strong ethnic culture orientation, but the Batak speak Bahasa Indonesia more in public than the Javanese. The Javanese speak the Javanese language in public more than other minority groups speak their ethnic languages (Sari et al., 2018a, 2018b; Suryadinata et al., 2003). We are interested in the implications of these contextual differences for language usage and knowledge.
Bilingualism and development of bilingual skills
Some researchers suggested that bilinguals are those who are native-like in their proficiency of both languages (Cutler, Mehler, Norris, & Segui, 1992). Children who are exposed to two languages from birth can become native-like speakers of both, while adults often struggle with second language learning and rarely attain native-like fluency (e.g. Flege, Yeni-Komshian, & Liu, 1999; Huang & Jun, 2011). Another relevant concept is simultaneous bilingualism which occurs when two languages are acquired from birth or prior to one year of age (De Houwer, 2005). Bilingualism can be seen as a condition in which L1 (first) oral language skills are related to L2 (second) oral language skills, and children with strong L1 skills show better acquisition of L2 (Cummins, 1991). However, language skills can be different in both languages. Lambert (1983) attributed the positive influence of bilingualism to additive contexts in which the second language is socially relevant and is learned by supplementing the first language, that is, without replacing the first language. The negative consequences are due to subtractive bilingualism where the first language is replaced by the second language. But this explanation clearly does not apply to all bilinguals. Hence, although there are various explanations of bilingualism, it is not easy to define for all contexts.
Within the context of our study, bilingualism refers to the knowledge of an ethnic language (almost always acquired first) and Bahasa Indonesia (almost always acquired later), but the age of acquisition of the languages may vary between groups. Bilingualism in Indonesia may differ across ethnic groups, although we know that L2 is acquired after L1. Not much is known about the pattern of bilingualism and vocabulary development among Indonesian bilinguals of different ethnic descent. Among bilinguals, vocabulary development is typically delayed in learning a second language (August, Carlo, Dressler, & Snow, 2005). It is relatively more difficult to develop a depth of vocabulary knowledge in the second language (Feldman & Healy, 1998). This study especially addresses the measurement of L1 and L2 vocabulary among adolescents in Indonesia, in addition to self-reported language skill and usage to understand the bilingualism pattern.
Measuring language skill in two or more languages
For many studies it is necessary to consider language dominance in more detail and to obtain precise measurements of particular aspects of a bilingual’s ability, such as a measure of their vocabulary or fluency to complement the information that can be obtained through a questionnaire (Daller, Yildiz, De Jong, Kan, & Basbagi, 2011). Bilingualism measures vary depending on the concept that is used for the construction of the linguistic measurement. The existing measures of bilingualism use rating scales and lexical richness tests in the education studies, whereas measures on bilingualism in many psycholinguistic studies are mainly built on the linguistic dominance concept which deals with the question of how two languages are processed in the individual’s mind (Pienemann & Keβler, 2007). Measuring vocabulary in two or more languages is a way to assess language dominance in more detail and to obtain precise measurements of particular aspects of a bilingual’s ability, to complement the information that can be obtained through a questionnaire (Daller et al., 2011). Daller et al. (2011) argue that evaluating language dominance is highly relevant in a number of areas of research but it is difficult to achieve because many bilinguals, in particular those living in an immigrant setting, use two or more languages with large structural differences (e.g. Chinese/Indonesian and other pairs) in their everyday life. Daller et al. (2011) believe that a simple measure of language fluency can reveal language dominance in bilinguals. However, it is a challenge to measure bilingual ability in these language pairs, because it is difficult to ensure that the measures are comparable across languages (e.g. language system, word order). That is why it is necessary to test whether specific items are more easy or difficult than other items of the test in different languages, which we want to do in this study. Moreover, if proficiency in one language is higher than in the other, would it mean that the language with the higher score is also used more both in private life and in public? This study also examines whether dominance in language usage implies higher proficiency.
It is necessary to have a reliable and valid tool that can be applied across cultures. A solution that can be considered to measure bilingualism is by combining a language performance test with self-reported language proficiency and self-reported language usage. A combined measure comprising language performance, self-rated skill, and self-reported language usage will be used in this study. One of the instruments used to measure language performance is the Picture Naming Test (e.g. Kharkhurin, 2012). This test was developed by Kharkhurin (2012) and uses 120 pictures to test vocabulary knowledge. The Picture Naming Test for the English language correlates significantly with the Test of English as a Foreign Language (TOEFL) score, which shows the validity of the Picture Naming Test for English language ability, especially productive vocabulary knowledge (Kharkhurin, 2012). By combining both cognitive (Picture Naming Test; Kharkhurin, 2012) and self-reported language use (e.g. Language Experience and Proficiency (LEAP) by Marian, Blumenfeld, & Kaushanskaya, 2007) we examine how language dominance among bilingual adolescents can be similar or different depending on the context.
Present study
We investigated the differences in the patterns of bilingualism for four different ethnic groups in Indonesia, and conducted DIF to test whether adolescents would have different sets of types of words they only know in one language. Our earlier studies among adolescents in Indonesia showed that there were differences in the language vocabulary and age of being proficient in the language; the Javanese became proficient in their ethnic language earlier and they used it more than the Chinese, Batak, and Toraja; the Toraja showed the highest scores on both vocabulary tests, whereas the Chinese scored the lowest in ethnic language vocabulary (Sari et al., 2018a, 2018b). We found that language usage and language vocabulary showed different patterns (e.g. participants with a high score on Bahasa Indonesia vocabulary reported high usage of Bahasa Indonesia, but they scored much lower on the ethnic language vocabulary than on Bahasa Indonesia, although they reported high ethnic language usage). We were interested in differences in word difficulty across languages: Is there a certain discourse associated with each language (e.g. words could be domain-specific, such as school terms in Bahasa Indonesia, and words for everyday objects in the ethnic language)? This specificity of words across languages would mean that the difficulty of words would be different across languages (e.g. the name of a tool would be easier in the ethnic language than in Bahasa Indonesia). This domain specificity is studied here using procedures for DIF.
DIF procedures are used to examine whether there are specific words or items which are easier or more difficult in a specific language (Jodoin & Gierl, 2001). DIF procedures test whether the relative order of difficulty of an item is invariant across languages. The focus of our analyses is on relative difficulty and not on identity of difficulty level of a word across languages; so, a bilingual can be more proficient in one language than in another, which has implications for how many words he or she will know in both languages. When we study domain specificity, we want to know whether words have the same difficulty rank order across the languages. So, even if a Mandarin- and Bahasa Indonesia-speaking adolescent would be more proficient in Bahasa than in Mandarin, we would expect (under the assumption of no domain specificity) that the rank order from easy to difficult words would be the same in the two languages, which implies that all groups are similarly knowledgeable in the languages across different domains.
Hypotheses on group differences on bilingualism
The following differences are expected:
Regarding Bahasa Indonesia usage at home: The Chinese, as the smallest group, previously exposed to a ban on using their language, are expected to speak Bahasa Indonesia at home more than the other groups, and the Javanese, as the dominant and largest group, are expected to speak Bahasa Indonesia at home the least. The Batak and Toraja, who are also smaller and less dominant groups, are also expected to use Bahasa Indonesia more than the Javanese at home, but less than the Chinese.
Regarding ethnic language usage at home: The Chinese are expected to speak their ethnic language the least at home, and the Javanese to speak their ethnic language the most. The Toraja, who strongly focus on their own culture, are expected to speak their ethnic language more than the Chinese and the Batak, and the Batak more than the Chinese.
Regarding Bahasa Indonesia usage in public: It is expected that there will be no differences among the smaller groups (Toraja, Batak, and Chinese), but the Javanese will score lower because the Javanese language is also often used in public in Java beside Bahasa Indonesia.
Regarding ethnic language usage in public: The Chinese are expected to speak their ethnic language in public the least, and the Javanese to speak their ethnic language in public the most. The Toraja, who strongly identify with their own culture, are expected to speak their ethnic language more than the Chinese and Batak, and the Batak more than the Chinese.
Regarding self-rated ethnic language proficiency: The Javanese will score higher on self-rated ethnic language proficiency than the Chinese; the Toraja and Batak will also score higher than the Chinese; and the Chinese will score the lowest.
Regarding ethnic language vocabulary knowledge: The Chinese will score the lowest on ethnic language vocabulary (Picture Naming Test score), and the Javanese will score the highest, followed by the Toraja and Batak.
Differential item functioning
The DIF part of the study is exploratory; we do not specify any hypothesis.
Method
Participants
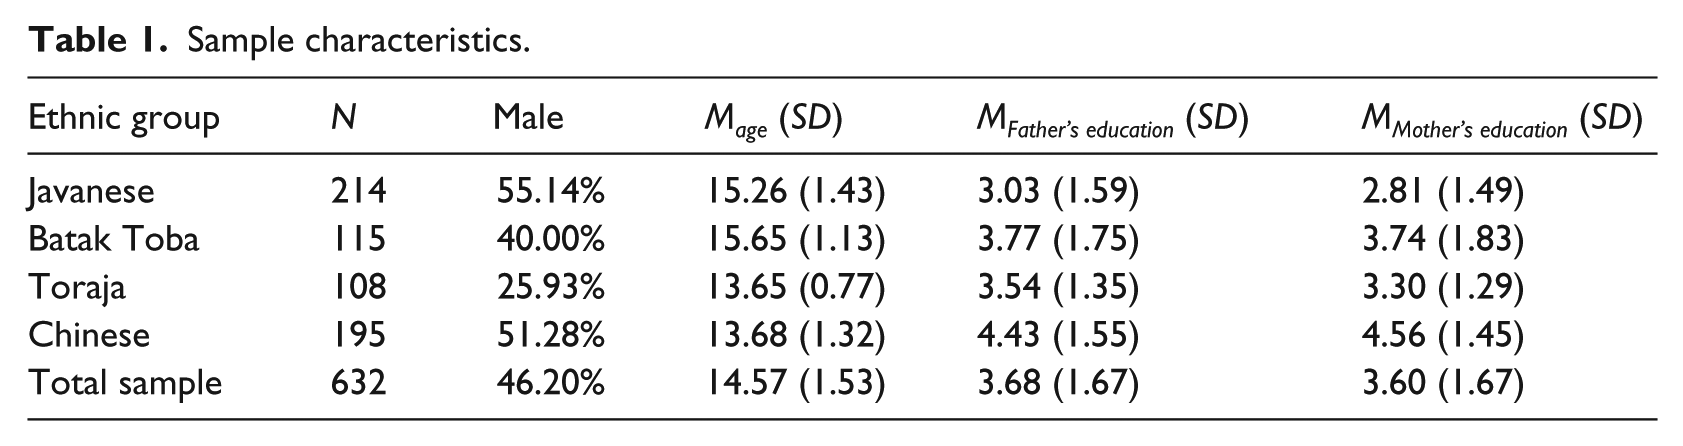
Participants were 632 school-going adolescents (292 males). They were Javanese from Java (214), Batak from North Sumatra (115), Toraja from Tana Toraja in South Sulawesi (108), and Chinese minority group mainly from Java (195). Their ages were between 12 and 19 years with Mage = 14.57 years (see Table 1), and the median parental education level was college (13–15 years of education).
Sample characteristics.
Procedure
Participants were recruited from schools in five provinces in Sumatra, Sulawesi, and Java islands: North Sumatra, South Sulawesi, DKI (Special Province of Capital) Jakarta, Central Java, and East Java. Participants were contacted through their high schools with the help of some local universities and institutes. The consent forms were collected from the heads of the schools, teachers, parents, and respondents. Nine research assistants who were native speakers of the respective languages scored the answers in the Picture Naming Test following the guidance of word lists provided by the researcher with the help of local language teachers (Kharkurin, 2012). Instruments were administered in Bahasa Indonesia in the class during regular school hours. All questionnaires were translated from English into Bahasa Indonesia following a translation/back-translation procedure (Van de Vijver & Leung, 1997) with the help of language teachers in Indonesia.
Measurements
Demographic characteristics
Demographic characteristics about participants’ age, gender, parental education level, and ethnicity were asked.
Bahasa and ethnic language usage at home questionnaire
Regarding the language spoken at home, information about the four directions of language interaction between parents and child were collected: mother’s language spoken to child, father’s language spoken to child, child’s language spoken to mother, and child’s language spoken to father (Han & Huang, 2010). Sample items are ‘Mother speaks Bahasa Indonesia to you’ and ‘You speak Bahasa Indonesia to your father’. There were one national (Bahasa Indonesia) and three ethnic languages spoken by the three ethnic groups in this study: Javanese, Toraja, Batak Toba, and Mandarin. Each language interaction pair consisted of four possible language-use frequencies: never, sometimes, often, or very often speaks Bahasa Indonesia (αJavanese = .94, αBatak Toba = .94, αToraja = .91, αMandarin = .88) and the ethnic language (αJavanese = .92, αBatak Toba = .97, αToraja = .91, αMandarin = .89).
Self-rated Bahasa Indonesia and ethnic language proficiency
This scale is part of the LEAP questionnaire by Marian et al. (2007). The scale assesses how well the respondent can comprehend, speak, and read Bahasa Indonesia on a scale from 1 to 10 (αJavanese = .81, αBatak Toba = .87, αToraja = .80, αMandarin = .84) and the ethnic language (αJavanese = .84, αBatak Toba = .87, αToraja = .93, αMandarin = .89). The lowest score is 3 and the highest score is 30 for each language.
Bahasa and ethnic language usage in public areas
This scale is part of the LEAP questionnaire by Marian et al. (2007). The scale assesses how much the participant uses Bahasa Indonesia (αJavanese = .80, αBatak Toba = .96, αToraja = .90, αMandarin = .85) and the ethnic language (αJavanese = .90, αBatak Toba = .94, αToraja = .95, αMandarin = .95) on a scale from 1 to 10 when watching television, listening to the radio, learning or studying, speaking with friends and reading. There are 10 items for each language. Sample items are ‘On a scale of 1–10 how much do you use Bahasa Indonesia for listening to the radio?’ or ‘On a scale of 1–10 how much do you use your ethnic language for reading?’ The lowest score is 10 and the highest score is 100 for each language.
Picture Naming Test
The test on vocabulary knowledge (Kharkurin, 2012) consists of 120 pictures and respondents should give the name of each object in the picture such as ‘chair’, ‘pencil’, and ‘mouse’. A correct answer is scored 1 and an incorrect answer is scored 0; the total score can range from 0 to 120 (a higher score denotes higher vocabulary knowledge). The test is given for Bahasa Indonesia (αJavanese = .93, αBatak Toba = .92, αToraja = .84, αMandarin = .92) and the ethnic language (αJavanese = .92, αBatak Toba = .97, αToraja = .97, αMandarin = 1.00).
DIF procedure
To explore whether there is item bias or not in the Picture Naming Test, DIF procedures were used (Jodoin & Gierl, 2001). We used dummy scoring for culture, with the Javanese group as the reference group. We calculated deviance scores for each language, and the interaction of each deviance score on each language with each culture. We ran logistic DIF analyses for each item with six different blocks with dependent variables; block 1: total Picture Naming Test score for the respective language of the item; block 2: total Picture Naming Test score for Bahasa Indonesia and total Picture Naming Test score for the ethnic language; block 3: total Picture Naming Test score for Bahasa Indonesia, total Picture Naming Test score for the ethnic language, and culture dummies; block 4: total Picture Naming Test score for Bahasa Indonesia, total Picture Naming Test score for the ethnic language, culture dummies, and interaction of the deviance score for Bahasa Indonesia with culture; block 5: total Picture Naming Test score for Bahasa Indonesia, total Picture Naming Test score for the ethnic language, culture dummies, and interaction of the deviance score for the ethnic language with culture; block 6: total Picture Naming Test score for Bahasa Indonesia, total Picture Naming Test score for the ethnic language, culture dummies, and the interaction of the deviance score for both languages with culture. The details about the DIF procedures are available in an online appendix.
Results
Group differences on bilingualism pattern
Univariate tests revealed that all scales showed significant group differences (see Table 2). Bahasa Indonesia vocabulary knowledge was highest among the Toraja ethnic group, followed by the Javanese and Chinese, and was lowest among the Batak Toba ethnic group. The group differences in ethnic language vocabulary were very large (the effect size was η2 = .49, which is about four times the effect size of the differences on the Bahasa Indonesia vocabulary). Remarkably, the post hoc test revealed that all group differences on ethnic language vocabulary were significant. The lowest scores were achieved by the Chinese group, followed by the Batak Toba, Toraja, and Javanese groups. As can be seen in Table 2, mean scores for the ethnic languages were much lower than the scores for Bahasa Indonesia, which points to the language dominance of Bahasa Indonesia in all groups. This is an important finding, as Bahasa Indonesia is the second language for most, if not all, participants, showing a language shift going on in Indonesia (see Abtahian, Cohn, & Pepinsky, 2016). As for language usage at home, the Chinese spoke Bahasa Indonesia at home more than the other groups, and the Javanese spoke Bahasa Indonesia at home the least. Ethnic language usage at home follows the opposite pattern, with the Chinese speaking their ethnic language the least and the Javanese speaking their ethnic language at home the most. Combining the two languages, a consistent pattern emerges: the Toraja and Batak Toba speak both languages regularly at home, whereas in Chinese families more Bahasa is spoken and in Javanese families more Javanese is spoken. Group differences in Bahasa usage in the public domain are small (η2 = .02); the Toraja scored highest on this scale. The pattern of ethnic usage in public replicated the pattern of ethnic usage at home (with the Javanese and Chinese as the highest and lowest scoring groups). Finally, the Javanese scored lower on Bahasa self-rated proficiency than the other three groups, which did not differ from each other. The self-rated proficiency in the ethnic language was smaller for the Chinese than for the other groups; the latter three groups did not differ from each other. In summary, hypotheses 1 to 6 are fully supported. We found in all groups that Bahasa Indonesia knowledge is larger than ethnic language knowledge; the pattern in self-rated proficiency was similar. Language usage follows a consistent pattern in that the Javanese use their ethnic language more and the Chinese use Bahasa Indonesia more, whereas the Toraja and Batak Toba seem to speak both languages equally often.
Descriptive statistics and post hoc test.
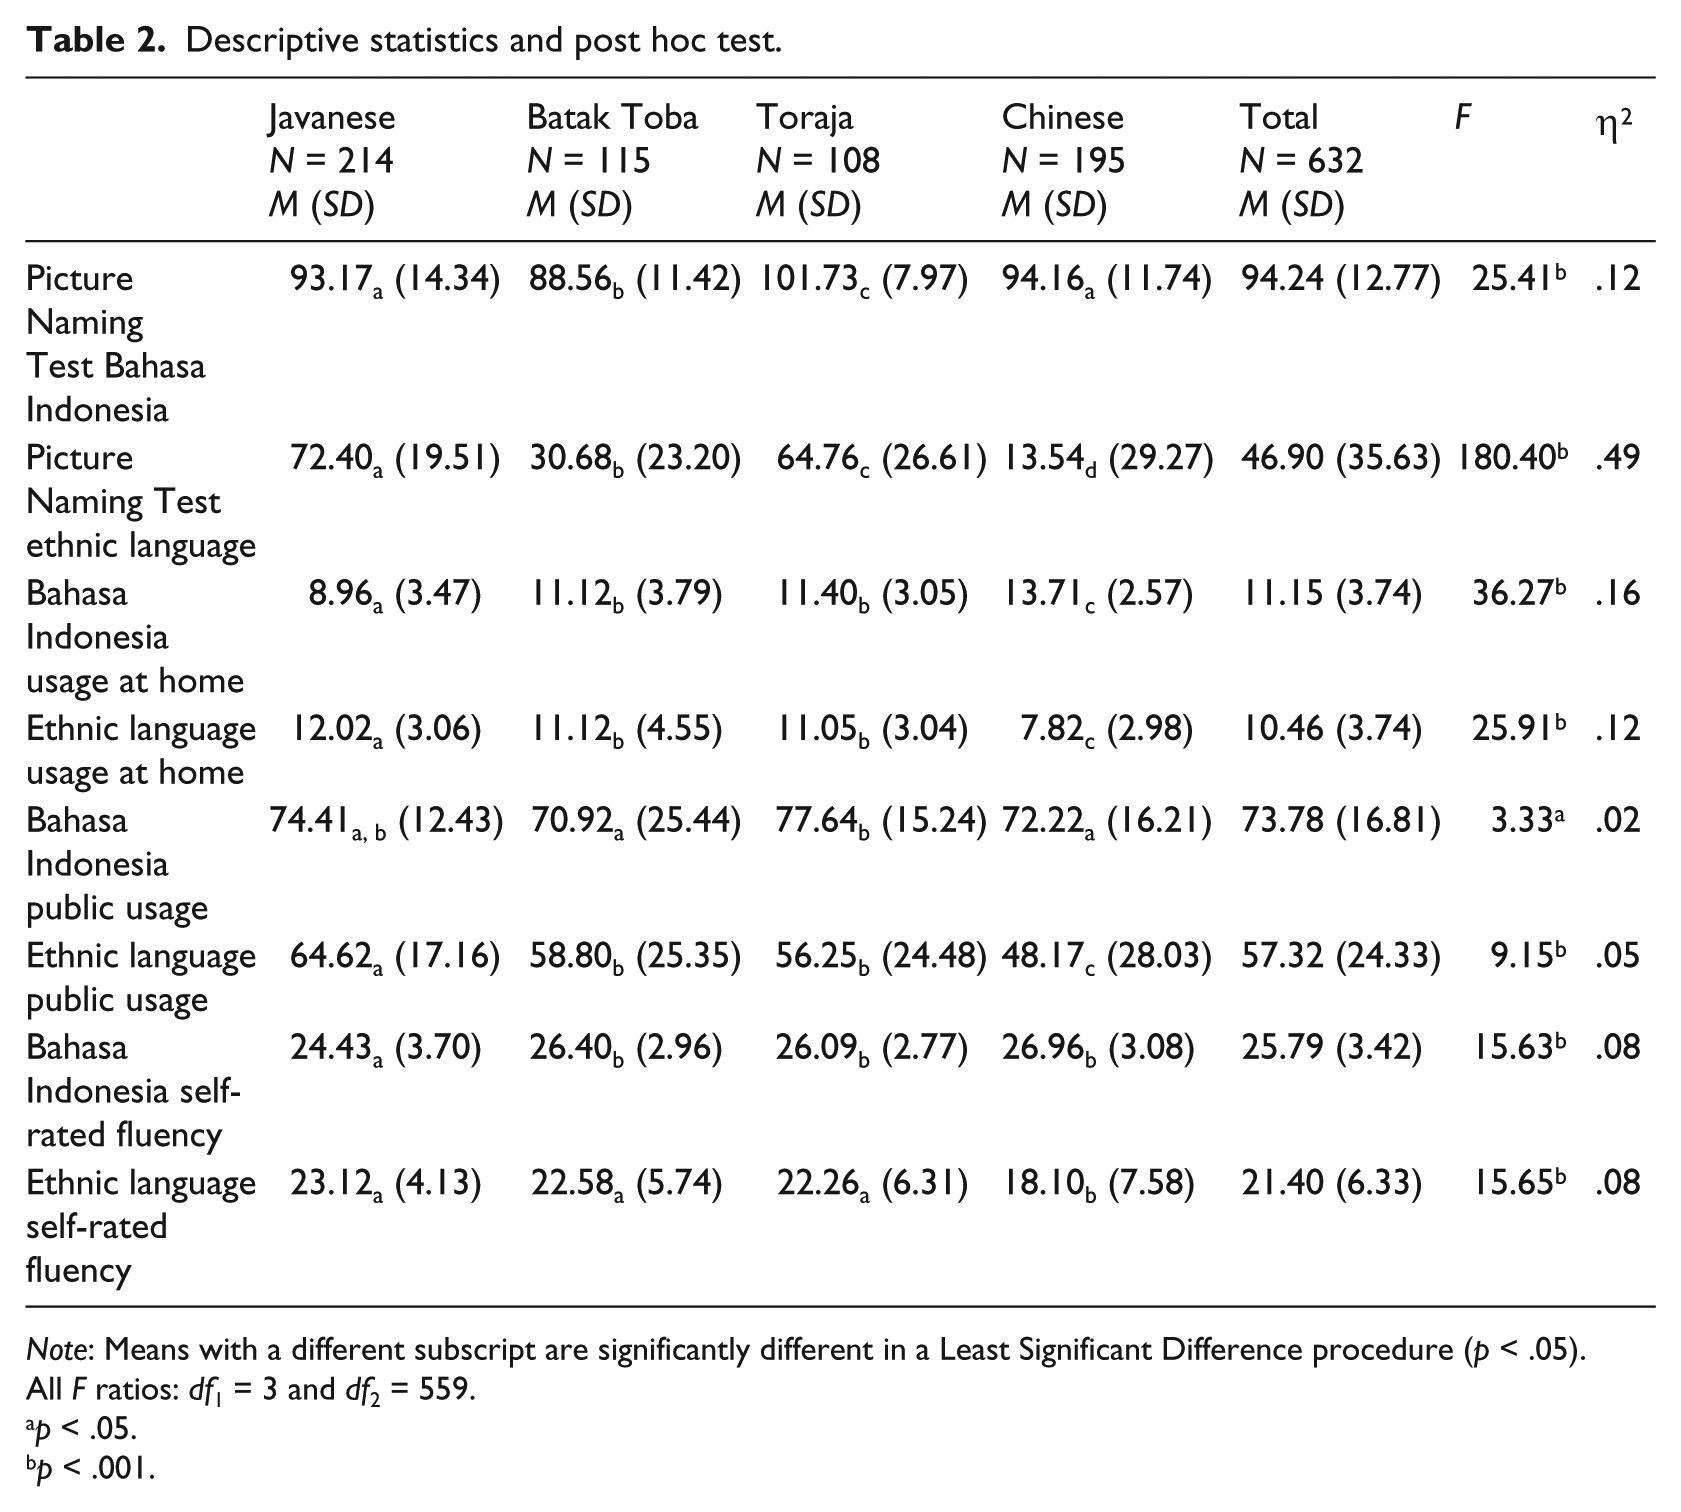
Note: Means with a different subscript are significantly different in a Least Significant Difference procedure (p < .05). All F ratios: df1 = 3 and df2 = 559.
p < .05.
p < .001.
Item bias on language vocabulary knowledge with DIF analyses
The results of the logistic DIF analyses can be accessed in the online appendix. The analysis results showed that there was neither uniform nor non-uniform DIF. All ∆ Nagelkerke R2 values of both Bahasa Indonesia and ethnic language from all blocks for all 120 items in the Picture Naming Test were below .50 (a table with ∆ Nagelkerke R2 values is given in the online appendix). These findings indicate that DIF had a very low impact on the size of cross-cultural differences and the difficulty of words is rather similar across languages (De Mars, 2009; Jodoin & Gierl, 2001; Roussos & Stout, 1996). These findings suggest that despite the substantial differences in word knowledge, there is no evidence that these adolescents have different sets of types of words they only know in one language. What are easy and difficult words remains the same across languages. Domain specificity of word knowledge does not affect the vocabulary of these adolescents.
Discussion
We studied bilingualism in Indonesia as a truly multi-ethnic and multilingual country to understand the patterns of language dominance in groups of adolescents, to compare their Bahasa Indonesia and ethnic language usage in public and private spheres across the groups, and to examine whether the rank order of difficulty of common words is the same for Bahasa Indonesia and the ethnic languages across groups. We found similarities in Bahasa Indonesia usage in public, yet differences in language usage at home and language skill between groups. The absence of item bias can be an indicator of an equally accessible lingua franca, which is not used for power differentials in society, unlike bilingualism in many western immigrant contexts where the country’s dominant language is often the language with the highest status and where speaking the dominant language can be used as a marker of status. Education plays a crucial role in language dissemination in Indonesia. Bahasa Indonesia is taught to all students in schools, has become the language many Indonesians are most proficient in and is the single most important language in public. There is much more variation in ethnic language mastery and usage. All groups can be called bilingual, yet with quite different patterns of bilingualism. The difference may be influenced by several factors such as speaker population size, religion, and geographical factors, such as location on an inner as opposed to an outer island (see Abtahian et al., 2016). The Chinese group especially is not tied to a specific geographical area, whereas the other three groups are.
The Javanese, as the most dominant group, used their ethnic language the most and reported the highest fluency in the ethnic language, followed by the Toraja and Batak Toba, whereas the Chinese are almost monolingual regarding their vocabulary knowledge. Although the Chinese almost lost their heritage language, they still report that they use the language at home and in the public area although less than the other three groups. It is obvious that there is a huge difference in the vocabulary knowledge in the ethnic language between the Chinese and the other three groups, as well as between the minority Batak Toba and Toraja with the Javanese. Interestingly, although there is a difference in the scores in the Picture Naming Test between the Batak and Toraja, there is no difference between the two groups on Bahasa Indonesia and ethnic language self-rated fluency. Hence, both groups had a similar perception of how well they used the language, but they differed in the actual knowledge of the language as measured by the Picture Naming Test.
It is remarkable that although there are substantial differences in ethnic language vocabulary (the effect size was η2 = .49) and all group differences on ethnic language vocabulary were significant, DIF had only a very low, non-significant impact on the size of cross-cultural differences. The absence of DIF suggests that L1 and L2 vocabulary knowledge of the adolescents in these four Indonesian ethnic groups does not show domain dependence and that the ethnic cultures do not show differential patterns of words taught to language learners. We cannot rule out that there may be ethnically specific words related to cultural practices that adolescents only know in their ethnic language. The Picture Naming Test does not tap into these specificities. Thus, our instrument may have underestimated the number of culturally specific words. Yet, we would not expect that these words would constitute a large part of the adolescents’ lexicons.
Different from an immigration context, where the host majority dominates the language usage, our results also showed that Bahasa Indonesia is the dominant language for all groups, which is remarkable compared with the findings in immigration contexts, because Bahasa Indonesia is the second language for most, if not all, participants. This finding confirms the previous finding that there is a rapid language shift going on across Indonesia (Abtahian et al., 2016). This study offers an interesting and nuanced lens on how this shift can be analysed through an analysis of bilingual vocabulary mastery. The pattern of language mastery across the groups was largely in line with our predictions, which supports the idea that structural characteristics, such as group size in a region, may play an important part in ethnic language and Bahasa Indonesia usage. There is also a consistent pattern of language usage in Indonesia: the Toraja and Batak speak both languages regularly at home, whereas in Chinese families more Bahasa Indonesia is spoken and in Javanese families more Javanese is spoken.
Overall, our study shows how bilingualism is contextualized in Indonesia. All groups are dominant in the lingua franca, yet the knowledge and usage of their ethnic language is moderated by elements such as geographical factors, group size (bigger groups speak their ethnic language more) and political factors (Bahasa Indonesia is strongly supported in education and public life, where the use of Chinese has been forbidden in most of the second half of the previous century). Our study also shows that bilingualism comprises several domains and these domains are not strongly related to each other (e.g. high usage of L1 at home, but low usage of L1 in the public domain, and high score on language knowledge). Differences in language skill do not reflect differences in the accessibility of languages, which are an expression of equal opportunities for all groups to engage with the language and with one another.
Limitations
It needs to be noted that this study is correlational and not causal. Another note is that the median of parental education level is high (13–15 years of education) which may relate to the results of the higher score on Bahasa Indonesia, because highly educated parents tend to speak Bahasa Indonesia more than their ethnic language (e.g. Kurniasih, 2006). Another limitation is that DIF procedures require a large sample for a strong statistical power, which was not the case in the present study (see De Mars, 2009; Jodoin & Gierl, 2001; Roussos & Stout, 1996).
Conclusion
The difference in patterns of bilingualism among adolescents from different ethnic groups in Indonesia is an example of the way that bilingualism is moderated by contextual factors. Bahasa Indonesia as the national language is mainly driven by education and usage in public, whereas the pattern of knowledge and usage of ethnic languages is dependent on factors such as ethnic orientation, group size, political and geographical factors. Although there are substantial differences between groups, DIF do not have a significant impact on the size of cross-cultural differences, suggesting equal acquisition of Bahasa Indonesia and ethnic language vocabulary and equal power as well as access to both languages across groups. It also reflects the fact that language usage and language knowledge are different domains of their bilingualism pattern. Therefore, we recommend using DIF procedures as an important tool for testing hypotheses about the contextual characteristics of bilingualism skill among different ethnic groups. We also recommend that studies among bilinguals from different groups should include both measures of language behaviour (e.g. daily usage at home and in public areas) and language skill (e.g. language vocabulary knowledge), combining L1 and L2 in at least these domains.
Supplemental Material
Sari_et_al__Online_Appendix_Contextualized_Bilingualism_DIF_Procedures_Results – Supplemental material for Contextualized bilingualism among adolescents from four different ethnic groups in Indonesia
Supplemental material, Sari_et_al__Online_Appendix_Contextualized_Bilingualism_DIF_Procedures_Results for Contextualized bilingualism among adolescents from four different ethnic groups in Indonesia by Betty Tjipta Sari, Fons J R van de Vijver, Athanasios Chasiotis and Michael Bender in International Journal of Bilingualism
Footnotes
Declaration of Conflicting Interests
The author(s) declared no potential conflicts of interest with respect to the research, authorship, and/or publication of this article.
Funding
The author(s) received no financial support for the research, authorship, and/or publication of this article.
Supplemental Material
Supplemental material for this article is available online.
Author biographies
References
Supplementary Material
Please find the following supplemental material available below.
For Open Access articles published under a Creative Commons License, all supplemental material carries the same license as the article it is associated with.
For non-Open Access articles published, all supplemental material carries a non-exclusive license, and permission requests for re-use of supplemental material or any part of supplemental material shall be sent directly to the copyright owner as specified in the copyright notice associated with the article.