
Abstract
Autism spectrum disorders are potentially associated with gastrointestinal dysfunction, although the underlying mechanisms remain unclear. Recently, the oral cavity has gained attention as the starting point of the digestive tract. We aim to explore the potential association between altered oral microbiota and oxidative stress in individuals with autism spectrum disorders. We conducted a case-control study involving 54 subjects with autism spectrum disorders and 46 typically developing participants. Oral epithelial cells and saliva samples were collected to analyze oxidative stress markers and oral microbiota composition using 16S rDNA sequencing. Compared with typically developing participants, individuals with autism spectrum disorders exhibited suppressed mRNA levels of superoxide dismutase 2 and RAR-related orphan receptor α, increased H3K9me2 modifications at superoxide dismutase 2 promoter, elevated levels of 8-oxo-dG in oral epithelial cells, and a reduced ratio of reduced glutathione/oxidized glutathione (GSH/GSSG) ratio in saliva. In addition, alpha and beta diversity analyses showed significant differences in microbial richness, evenness, and intersample variation between the autism spectrum disorder and typically developing groups. Statistical analyses confirmed marked distinctions in microbial diversity and community structure between the two groups. Individuals with autism spectrum disorders show increased oxidative stress and altered oral microbiota compared with typically developing participants. While the underlying mechanisms remain unclear, these findings suggest that altered oral microbiota may be linked to oxidative stress, providing insights into autism spectrum disorder pathology and potential avenues for clinical intervention.
Lay Abstract
Autism spectrum disorders are linked to gut-related issues, but the exact causes are still unclear. Recent research focuses on the mouth, the first part of the digestive system, to understand how it may play a role. This study looked at how the oral microbiome (the community of microorganisms in the mouth) and oxidative stress (an imbalance between harmful free radicals and antioxidants in the body) differ in people with autism spectrum disorders compared with typically developing individuals. Researchers studied 54 people with autism spectrum disorders and 46 typically developing individuals by analyzing their saliva and oral cells. Results showed that people with autism spectrum disorders had higher levels of oxidative stress markers and noticeable differences in their oral microbiota diversity and structure. These findings suggest a potential connection between changes in oral bacteria and oxidative stress in autism spectrum disorders, opening the door for new ways to study and treat autism spectrum disorders–related health issues.
Introduction
Autism spectrum disorder (ASD) is a complex neurodevelopmental disorder that typically manifests in early childhood and is characterized by impairment in social/communication skills and repetitive behaviors (Li et al., 2018; Thangarajah et al., 2009). Over the past 20 years, the prevalence of ASD has risen significantly, reaching a ratio of one in 36 in 2023 (Maenner et al., 2023). While the precise etiology of ASD remains unclear, research suggests that genetic/epigenetic, environmental, and neurodevelopmental factors play critical roles (Liang et al., 2023; Vashisth & Chahrour, 2023). Although there is no cure for ASD, early intervention and behavioral therapy can help improve skills and improve the quality of life for ASD individuals (Soto et al., 2024; Vasudevan et al., 2024).
Emerging evidence links ASD to abnormalities in gut microbiota. Individuals with ASD frequently experience gastrointestinal issues such as constipation and diarrhea, which are associated with reduced microbial diversity or imbalances in specific gut bacteria. The gut microbiota influences brain function by regulating the immune system, producing metabolic byproducts, and interacting with the gut–brain axis (Xiao et al., 2023; Zeng et al., 2022). Recently, the role of oral microbiota in ASD has gained attention. As the starting point of the digestive tract, the oral cavity plays a critical role, and individuals with ASD often exhibit significant changes in oral microbial diversity (Evenepoel et al., 2024; Tao et al., 2024). These alterations may impact the nervous system via inflammation, immune responses, and the microbiota–brain axis (Kong et al., 2019). In addition, ASD patients frequently experience oral health issues such as cavities and periodontal disease, which may further disrupt microbial balance (Qiao et al., 2022). Although the exact mechanisms linking oral microbiota to ASD remain unclear, improving oral hygiene and regulating microbial composition may provide novel strategies for managing ASD (Hicks et al., 2018).
Maternal diabetes and prenatal exposure to hormones such as progestins, androgens, and synthetic estrogens have been reported to trigger oxidative stress and epigenetic changes (Jia et al., 2023), resulting in persistent gene suppression in neurons, which contributes to ASD development (Crider et al., 2014; Kosidou et al., 2024; Wang et al., 2019; Xiang et al., 2020; Zou et al., 2017). In addition, these prenatal exposures can induce epigenetic changes and oxidative stress in hematopoietic stem cells, which are inherited by peripheral blood mononuclear cells (PBMC) during differentiation in autistic patients. These findings suggest the potential utility of PBMC as biomarkers for ASD prescreening (Jia et al., 2023; Jiao et al., 2023; Lu et al., 2020). Here, we hypothesize that similar oxidative stress and epigenetic changes may occur in oral epithelial cells during differentiation, potentially contributing to the altered oral microbiota observed in ASD subjects.
This research aims to explore the potential association between altered oral microbiota and oxidative stress in saliva and oral epithelial cells of individuals with ASD. In a human case-control study, 46 ASD cases and 54 typically developing (TD) participants were recruited, and oral epithelial cells and saliva samples were collected. Superoxide dismutase 2 (SOD2) (Wang et al., 2019) and RAR-related orphan receptor α (RORA) (Xiao et al., 2022; Yu et al., 2022), two previously identified ASD biomarkers (Jia et al., 2023; Jiao et al., 2023; Lu et al., 2020), were analyzed for mRNA expression. Epigenetic changes were assessed via histone methylation analysis of the SOD2 promoter using chromatin immunoprecipitation (ChIP) (Wang et al., 2019), while redox balance was evaluated by measuring 8-oxo-dG formation via immunostaining and the GSH/GSSG ratio in saliva. In addition, oral microbiota was purified for full-length 16S rDNA sequencing to characterize microbial diversity and composition. This research will provide insights into the interplay between oral microbiota, oxidative stress, and epigenetic changes, potentially uncovering novel biomarkers or therapeutic targets for ASD.
Materials and methods
The extended “Methods” section, along with detailed raw data and analysis for 16S rDNA sequencing, is provided in the Supplementary Information. The primers used in this research are provided in Supplemental Table S1.
Human case-control study
ASD subjects were screened using the Autism Behavior Checklist and subsequently evaluated by a licensed clinical team. Diagnoses were made through Diagnostic and Statistical Manual of Mental Disorders, 5th Edition (DSM-5) criteria for children aged 2 to 6 years (Jia et al., 2023). Inclusion criteria for participants required the absence of febrile illnesses, upper respiratory tract infections, pneumonia, or other infectious diseases within the past 2 weeks, as well as no antibiotic use during this period. Participants were also excluded if they exhibited dental conditions such as gum redness, bleeding, or other oral diseases. TD subjects had no history of ASD or developmental delays (DD) and achieved scores above 70 on both MSEL and VABS (Kim et al., 2022). A total of 54 ASD subjects and 46 TD subjects were included in the study. Each ASD subject was matched to a TD subject based on age, sex, and intelligence quotient (IQ), ensuring no significant differences between groups. Participant demographics and matching criteria are summarized in Supplemental Table S2.
Sample preparation
Participants were instructed to avoid eating, drinking, brushing their teeth, or chewing gum, and to rinse their mouths with warm water 30 min prior to sample collection. Each child chewed a cotton swab for approximately 2 min, after which the swab was placed into a saliva collection tube (#511534, Salivette). Approximately 1.0 mL of saliva was allowed to flow naturally into the tube. The tube was then properly labeled and transferred to an ice box for storage. The cell pellet and supernatant were separated from saliva samples by centrifugation at 3000 to 5000 rpm for 5 to 10 min. The supernatant was used for analyzing the GSH/GSSG ratio, while the cell pellet was resuspended in PBS (phosphate buffered saline) for downstream analyses, including mRNA expression via qPCR, epigenetic modifications on the SOD2 promoter via ChIP techniques, 8-oxo-dG formation through immunostaining, or preparation for microbiome analysis by removing human DNA and extracting total microbial DNA using the QIAGEN QIAamp Microbiome DNA Kit (#51704). Purified microbiome DNA samples were then sent to Shanghai Jingneng Biotechnology Co., Ltd. for full-length 16S rDNA sequencing.
DNA methylation analysis
Genomic DNA was extracted from treated cells and bisulfite-converted, and then the DNA was amplified with these primers: methylated primers: Forward: 5′-ttg ttt tgg aat agg ttt taa ggt c-3′, Reverse: 5′-aaa cct aac tac taa tca acg ccg-3′; unmethylated primers: Forward: 5′-tgt ttt gga ata ggt ttt aag gtt g-3′, Reverse: 5′-acc taa cta cta atc aac acc acc-3′. The resulting products were 140 bp (methylated) and 137 bp (unmethylated), with a CpG island of 113 bp. The melting temperatures were 64.4°C (methylated) and 64.2°C (unmethylated). Methylation levels were normalized to the corresponding unmethylated controls (Eads et al., 2000; Nosho et al., 2008; Ogino et al., 2006).
Statistics and reproducibility
Data were presented as mean ± standard deviation (SD). Group differences were evaluated using unpaired Student’s t tests. For categorical variables such as detection ratios, χ2 tests were used. To correct for multiple comparisons in bacterial abundance analyses, we applied the Benjamini–Hochberg false discovery rate (FDR) correction. Adjusted p values (q values) below 0.05 were considered statistically significant. All statistical analyses were performed using SPSS 22.0 software.
16S-rDNA sequencing and data analysis
DNA preparation and amplification
Genomic DNA is extracted using the CTAB method, and its purity is checked with agarose gel. DNA is diluted to 1 ng/μL and used as a template for PCR with primers containing barcodes. High-fidelity PCR is conducted using New England Biolabs’ Phusion® High-Fidelity PCR Master Mix. PCR products are verified using 2% agarose gel. Equal amounts of each product are pooled, mixed, and purified using a Qiagen gel recovery kit.
Library construction and sequencing
Sequencing adapters are added to DNA fragments, which are purified and size-selected using AMpure PB beads and the BluePipin system. The library is quantified (Qubit) and checked for insert size (Agilent 2100) before sequencing on the PacBio platform.
Data analysis
Sequencing Data Processing: Raw data are exported as BAM files and sorted by barcode using Lima software. CCS software corrects sequences with stringent quality filters (minimum accuracy of 99%). Sequences outside the size range (1340–1640 bp) or with low-quality features are removed. Primers are trimmed, and clean reads are saved for further analysis. OTU Clustering and Species Annotation: Clean reads are grouped into OTU at a 97% identity threshold using Uparse software. OTU are annotated using the SILVA SSU rRNA database, and phylogenetic relationships are determined with MUSCLE. Alpha Diversity Analysis (Sample Complexity): Diversity metrics (e.g. Chao1, Shannon, Simpson) are calculated using Qiime. Rarefaction and rank abundance curves are plotted in R software, with statistical tests applied to compare groups. Beta Diversity Analysis (Between-Sample Diversity): UniFrac distances are calculated in Qiime, and clustering trees and diversity plots (principal component analysis (PCA), principal coordinates analysis (PCoA), and non-metric multi-dimensional scaling (NMDS)) are created in R. Statistical tests (e.g. T test, Wilcoxon test) identify group differences, and tools like LEfSe and Metastats analyze species with significant differences. Environmental Factor Correlation: Spearman correlations between species and environmental factors are visualized with heatmaps (R software). Canonical correspondence analysis (CCA) and redundancy analysis (RDA) determine environmental factors influencing species distributions.
Network analysis
Correlation matrices of bacterial genera are built based on abundance data, using thresholds to filter weak links. Graphs representing genera as nodes and correlations as edges are created with Graphviz.
Results
Oxidative stress in oral cells and saliva of ASD subjects
Oral epithelial cells and saliva samples were collected from ASD subjects (n = 54) and TD controls (n = 46) for analysis. ASD group exhibited significantly lower mRNA expression SOD2 (Figure 1(a)) and RORA (Figure 1(b)) compared with TD group. While DNA methylation levels on the SOD2 promoter showed no significant difference between groups (Figure 1(c)), histone methylation analysis revealed a marked elevation in H3K9me2 modifications in ASD subjects. In contrast, no differences were observed in H3K9me3, H3K27me2, or H3K27me3 modifications (Figure 1(d)). Evaluation of redox balance further demonstrated oxidative stress in ASD subjects. Specifically, 8-oxo-dG formation was significantly increased in oral epithelial cells of the ASD group (Figure 1(e) and (f)), while the GSH/GSSG ratio in saliva was significantly reduced compared with the TD group (Figure 1(g)).
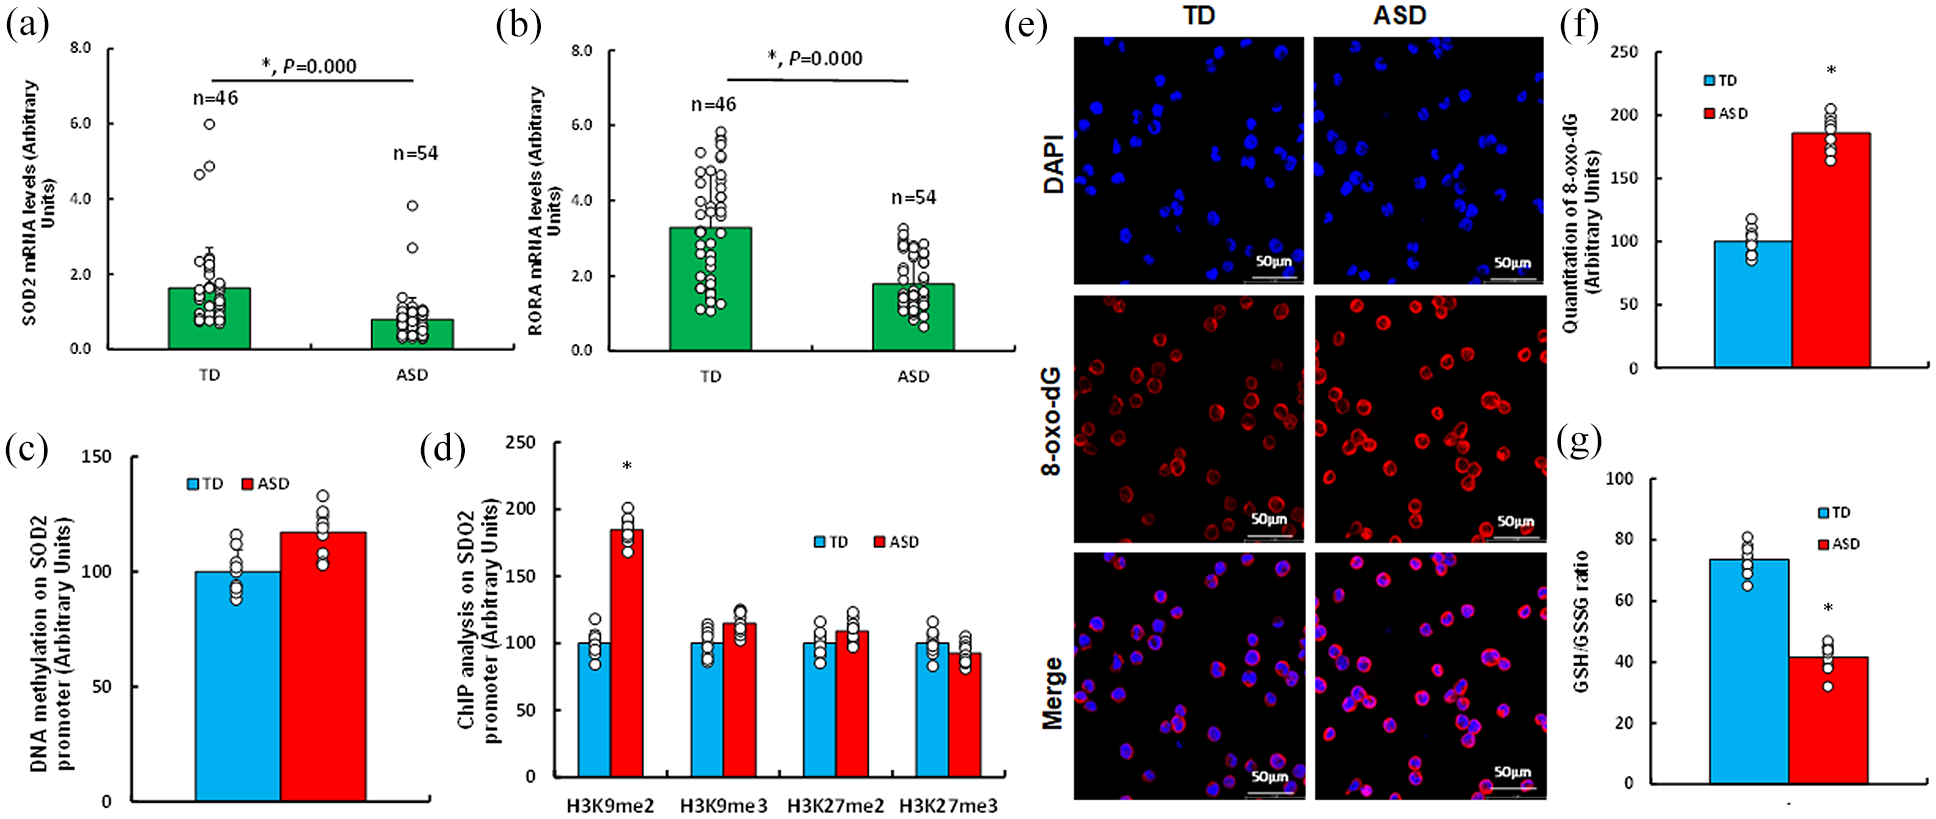
Oxidative stress in oral cells and saliva of ASD subjects. (a–f) Oral epithelial cells were isolated from TD (n = 46) and ASD (n = 54) subjects for biological assays. (a, b) mRNA analysis of SOD2 (a) and RORA (b). (c) DNA methylation analysis, n = 9. (d) Histone methylation analysis, n = 9. (e) Representative images of 8-oxo-dG staining. (f) Quantification of 8-oxo-dG, n = 9. (g) GSH/GSSG ratio in saliva, n = 9. *p < 0.05 compared to TD subjects.
Sequencing data processing
Purified oral microbiome DNA samples were obtained from ASD subjects (n = 54) and TD subjects (n = 46). These samples were sent to Shanghai Jingneng Biotechnology Co., Ltd. for full-length 16S rDNA sequencing using PacBio technology. The raw sequencing data were provided as BAM files. Initial processing involved CCS (circular consensus sequencing) correction to generate highly accurate single-molecule consensus reads, followed by filtering of sequences that were excessively short or long. Demultiplexing based on barcode sequences was then performed to differentiate samples, and primer trimming was applied to produce Clean Reads, suitable for downstream analyses. Detailed statistical results for each processing step are presented in Supplemental Table S3.
OTU analysis and taxonomic annotation
To analyze species composition diversity, Clean Reads from all samples were grouped into OTU at 97% sequence identity. Taxonomic annotation was then conducted on the representative sequences of the OTU. A comprehensive summary of results is provided in Supplemental Figure S1. To facilitate exploration of species composition and abundance, an interactive heatmap display was developed for the OTU and species annotation results, viewable in a web-based format (partly shown in Supplemental Figure S2). For species classification across samples or groups, key species of interest (typically the 10 most abundant genera) were used for phylogenetic tree analysis. These results were visualized using a custom-developed plotting tool, with an example phylogenetic tree for a single sample shown in Supplemental Figure S3. Species annotation results were further illustrated using KRONA, where concentric circles represent different taxonomic levels from innermost to outermost, and sector sizes correspond to the relative proportions of OTU annotations. Representative samples from ASD (sample ID: ASD152, Figure 2(a)) and TD (sample ID: TD202, Figure 2(b)) groups are highlighted. Detailed species annotation results for all samples are available at supplementary file: result/02.OTUanalysis/all_rep_set_tax_assignments.krona.html.
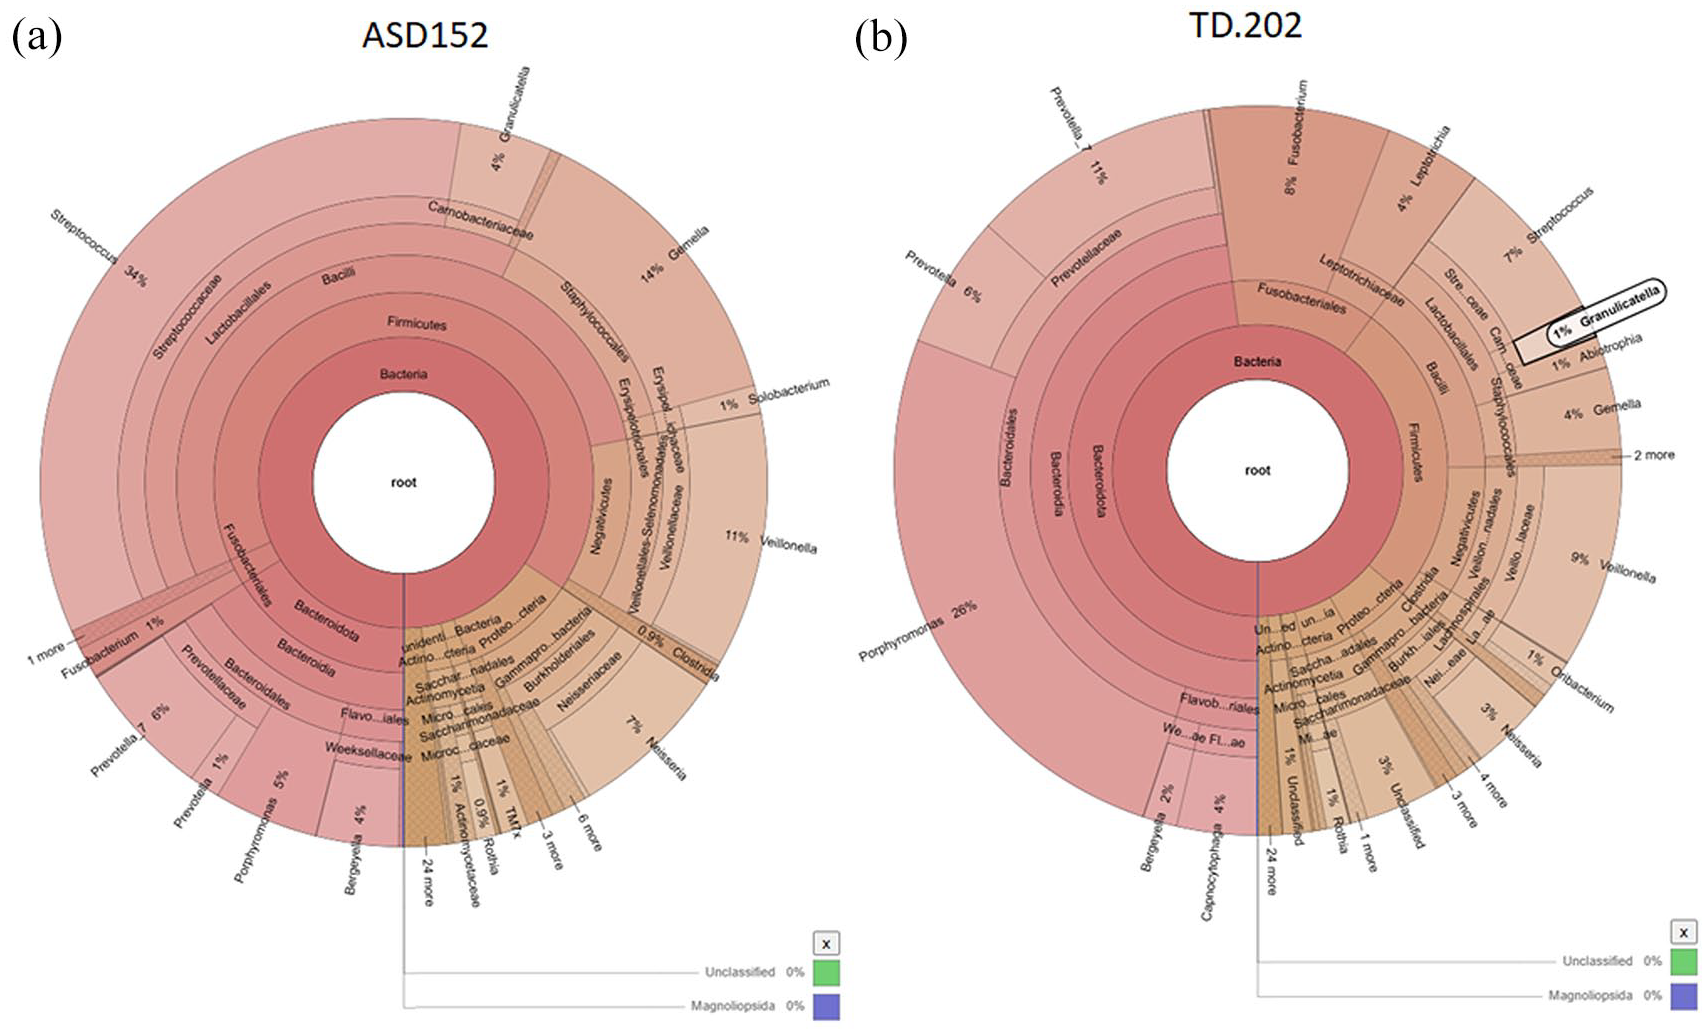
Representative visualization of species annotation results. (a) Results for sample ID ASD152. (b) Results for sample ID TD202.
Species distribution
Display of species relative abundance
The species annotation analysis identified the top 10 species with the highest relative abundance at each taxonomic level (Phylum, Class, Order, Family, Genus) for each sample or group. To illustrate these data, stacked bar charts were created, showing the proportions of these species across different taxonomic levels. Figure 3 provides an example of a species relative abundance bar chart at the phylum level. Bar charts for the top 10 species at all five taxonomic levels are available at supplementary file: result/02.OTUanalysis/top10/.
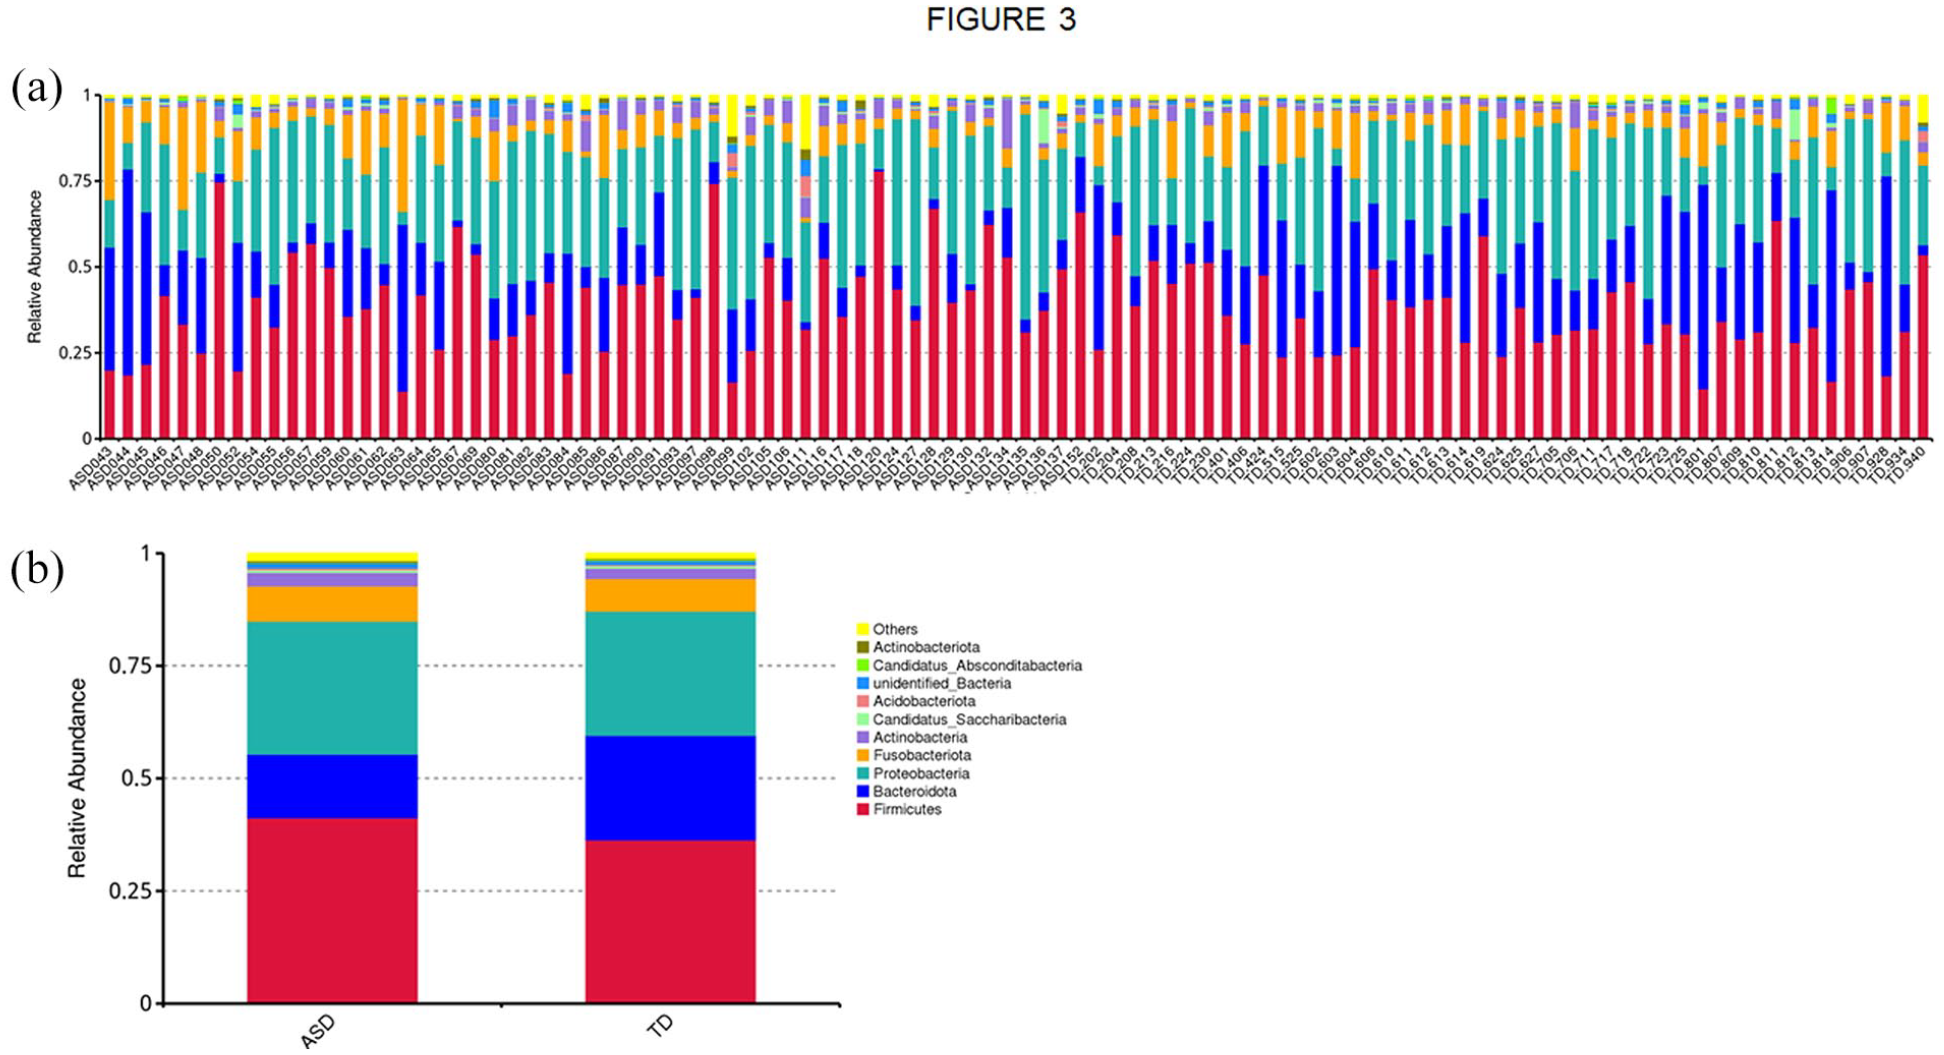
Relative abundance at the phylum level. (a) Abundance results for each sample. (b) Accumulated abundance results for TD and ASD subjects.
Species abundance clustering heatmap
To analyze abundance patterns at the genus level across all samples, the 35 genera with the highest relative abundance were selected. A clustering heatmap was generated to reveal species abundance patterns, highlighting genera that are more concentrated or less prevalent in specific samples (see Figure 4). Heatmaps for species abundance clustering at different taxonomic levels are available at supplementary file: result/02.OTUanalysis/taxa_heatmap/cluster/.
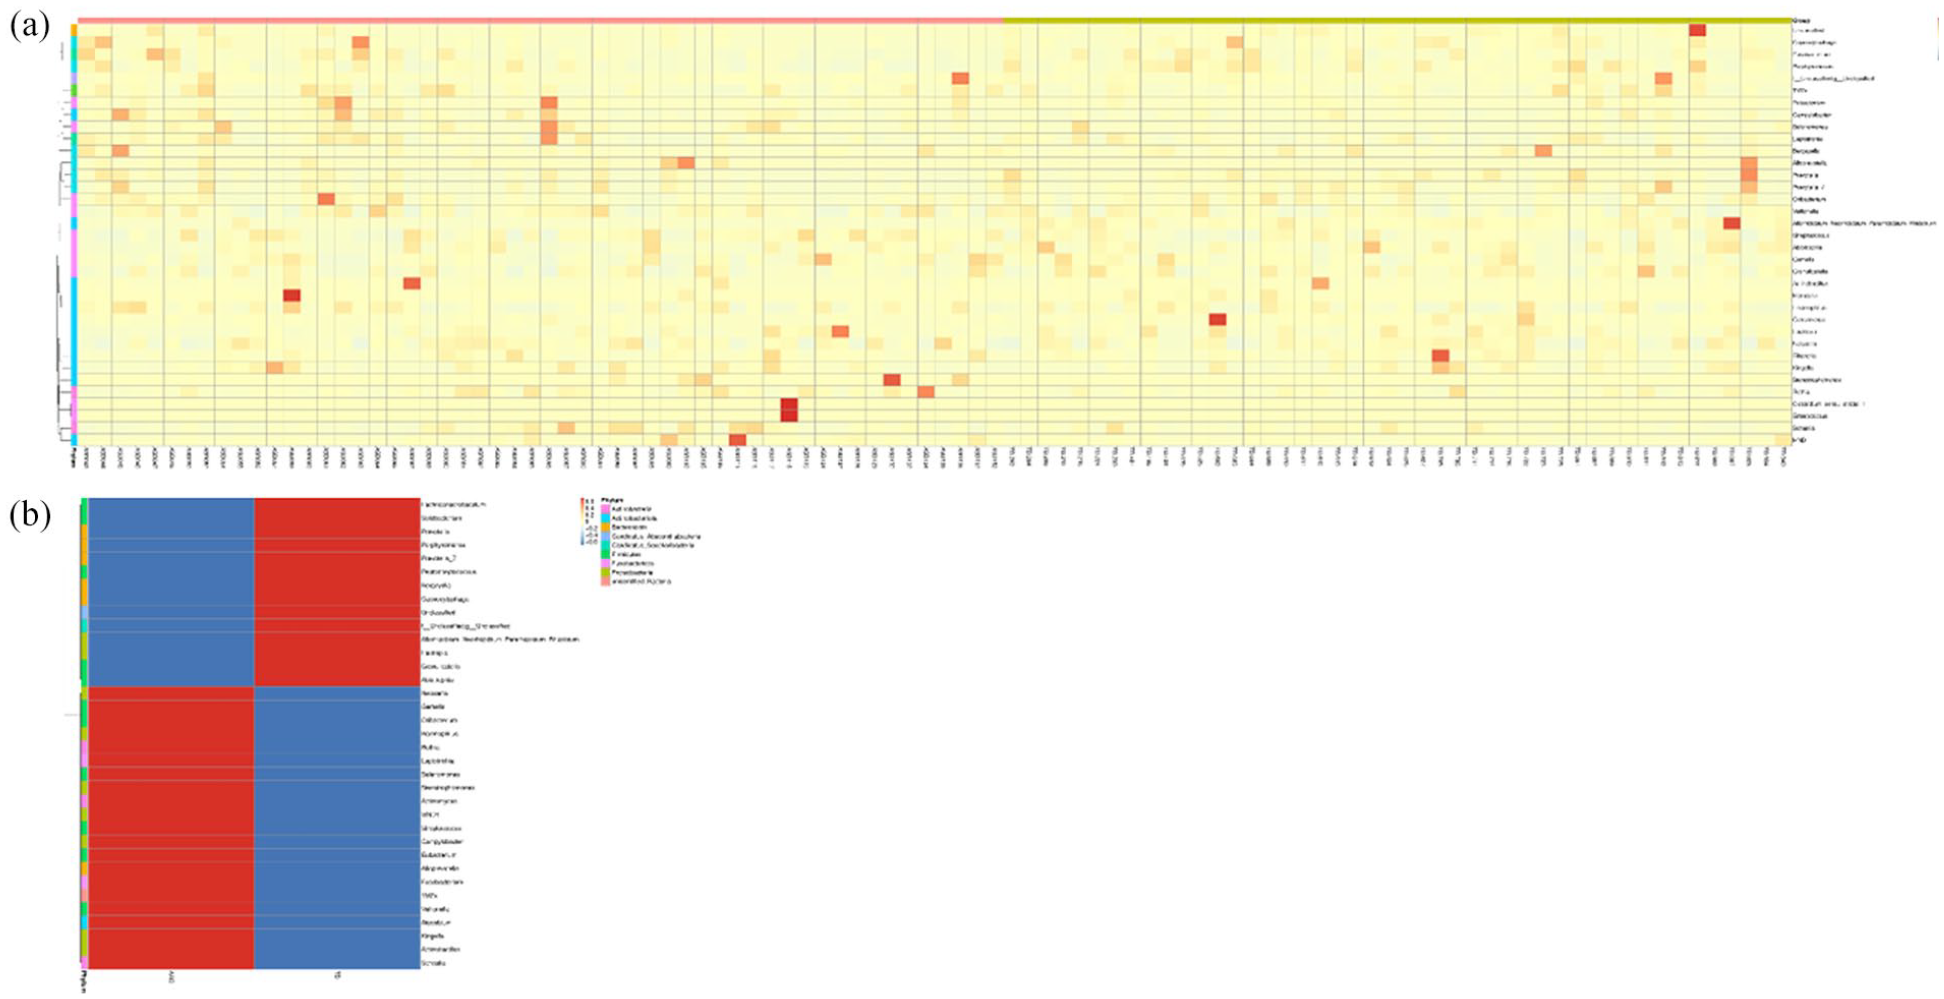
Species abundance clustering heatmap. (a) Heatmap results for each sample. (b) Accumulated heatmap results for TD and ASD subjects.
Phylogenetic tree of species at genus level
To investigate the phylogenetic relationships among genera, the representative sequences of the top 100 genera were aligned using multiple sequence alignment, followed by the construction of a phylogenetic tree. This visualization highlights the evolutionary relationships among these genera (see Figure 5). The genus-level phylogenetic tree based on the analysis is available at supplementary file: result/02.OTUanalysis/genus_evolutionary_tree/genus_100.tree.
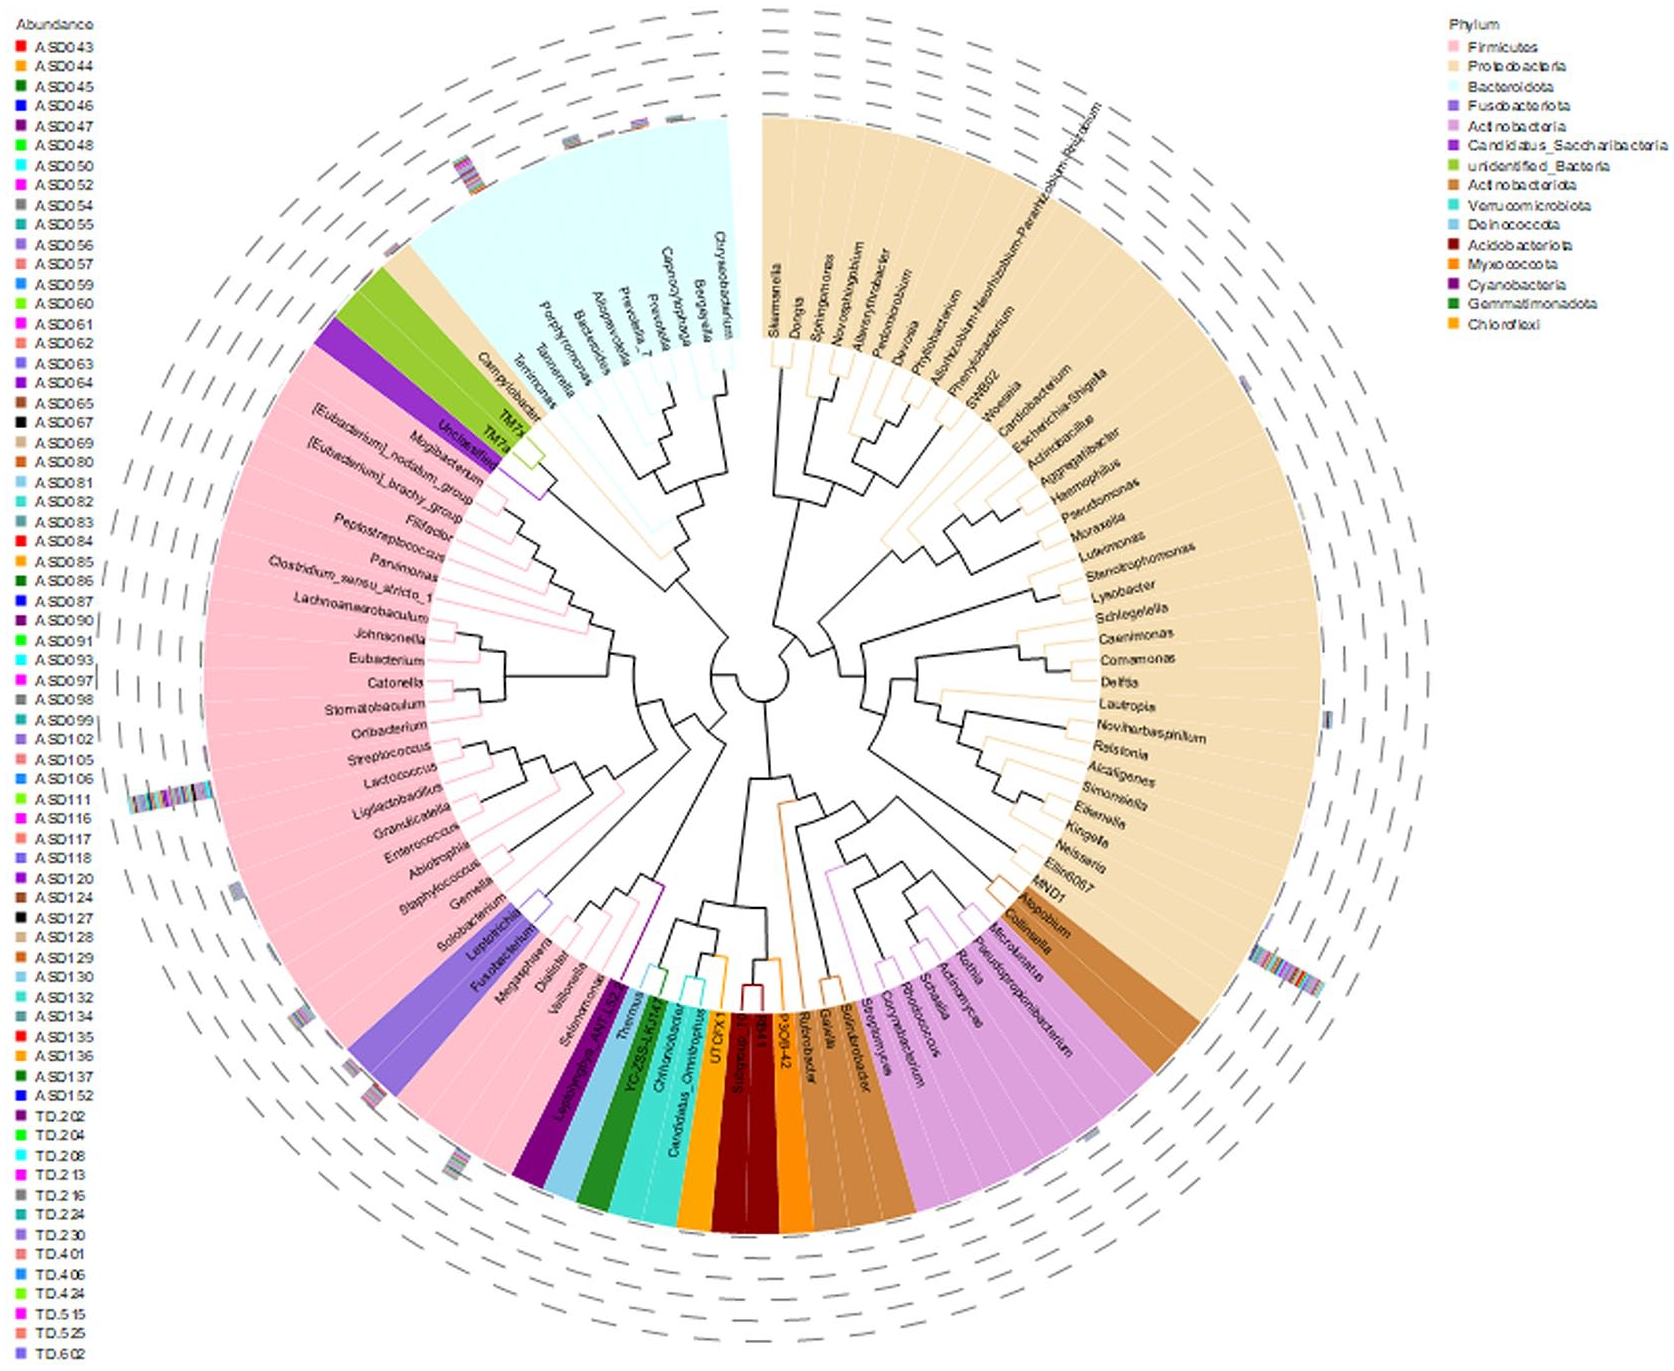
Phylogenetic relationships of species at the genus level.
Alpha diversity
OTU clustering and diversity analysis
Sequences with ⩾97% similarity were grouped into OTU, indicating species boundaries. Alpha diversity indices for the different samples at this 97% similarity threshold were then analyzed statistically, with the results summarized in Supplemental Table S4. Data normalization was performed with a cutoff value of 36,876 sequences, and the significance of each Alpha diversity index is detailed in the “Methods” section.
Species diversity curve
The Rank Abundance Curve was generated by ranking OTU in each sample by their relative abundance (or sequence count) from highest to lowest and assigning corresponding rank numbers. The horizontal axis shows OTU rank, while the vertical axis indicates their relative abundance (percentage of sequences in each OTU). Connecting these points produces the curve, which intuitively reflects species richness and evenness. Horizontal dimension: Species richness is indicated by the curve’s width—the wider the curve, the greater the richness. Vertical dimension: Species evenness is reflected by the curve’s smoothness—a flatter curve indicates more even species distribution. Figure 6(a) shows the rank abundance curves for individual samples, while Figure 6(b) compares the ASD and TD groups. Further details on these curves can be found at supplementary file: result/03. AlphaDiversity/rank_abundance/.
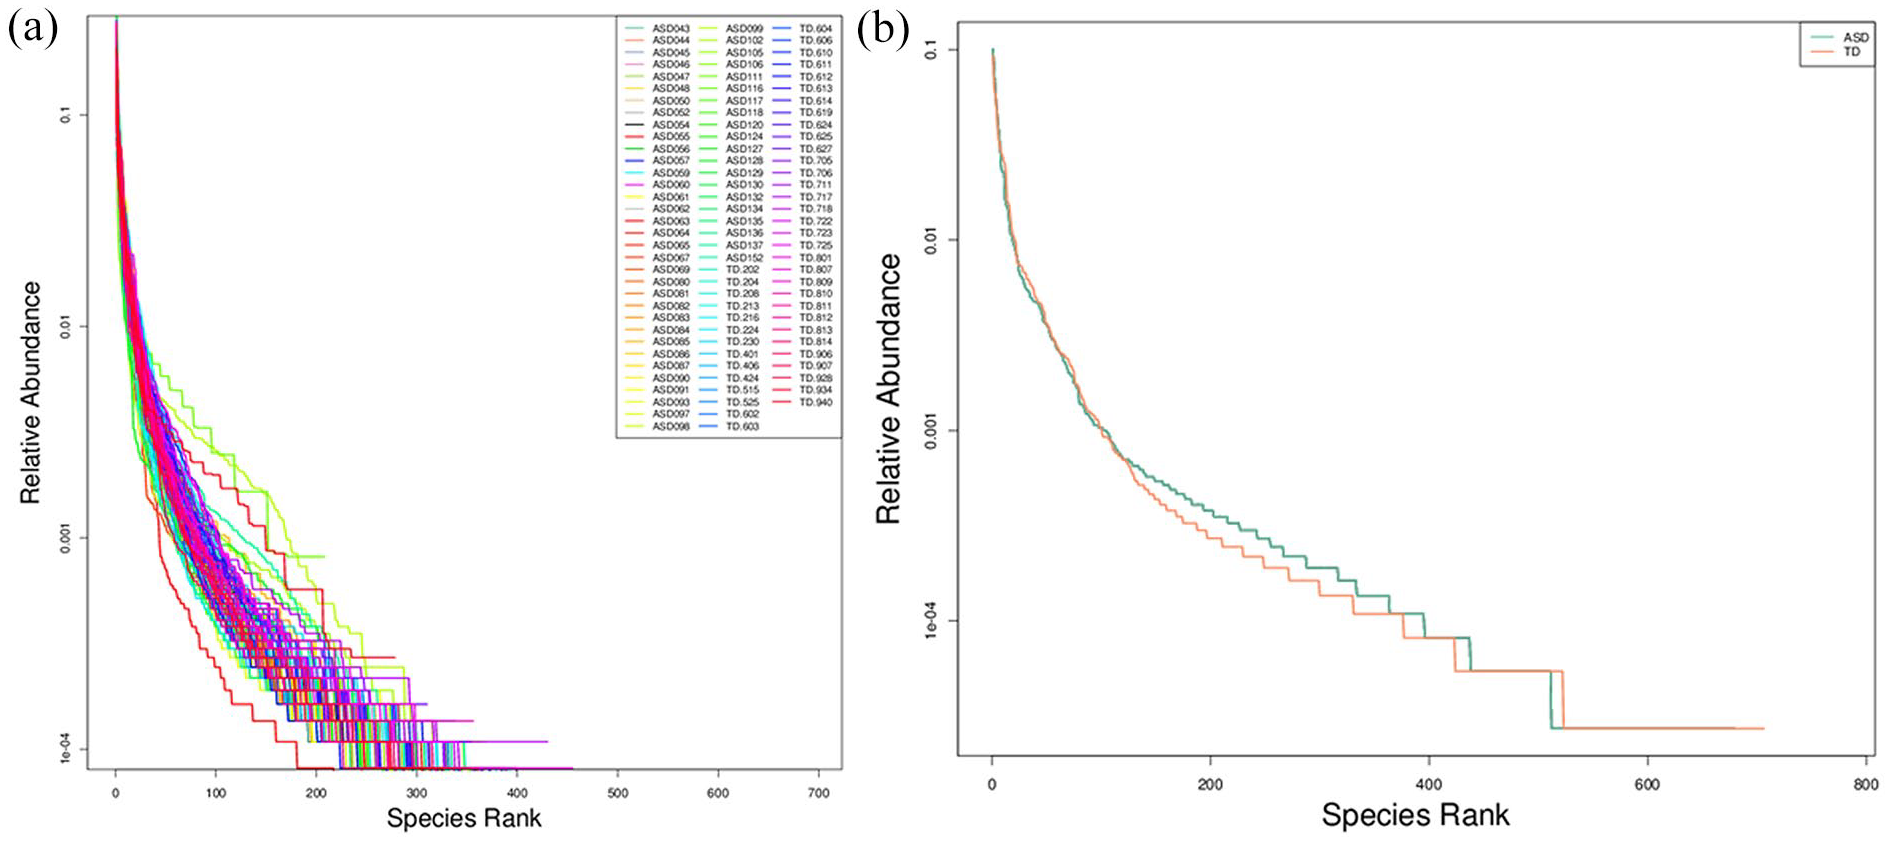
Rank abundance curve. (a) Rank abundance curve for each sample. (b) Rank abundance curve for TD and ASD subjects.
Species accumulation boxplot
The Species Accumulation Boxplot illustrates how species diversity increases with larger sample sizes. This analysis is crucial for understanding species composition, assessing the adequacy of sampling efforts, and predicting species richness in a community. It is commonly used in biodiversity and community studies to evaluate whether the sample size is sufficient. If sample size sufficiency is met, the boxplot can further predict species richness. The species accumulation boxplot is shown in Supplemental Figure S4.
OTU-based Venn diagram
To analyze OTU among samples or groups, Venn diagrams were constructed based on OTU clustering results. Samples were normalized before generating the diagrams to ensure consistency (see Supplemental Figure S5).
Beta diversity index
Distance matrix heatmap
Beta diversity analysis utilizes Weighted UniFrac or Unweighted UniFrac distances to determine the dissimilarity in species diversity among samples. Smaller values indicate greater similarity in species composition between two samples. The results are presented as heatmaps, providing a visual representation of the pairwise distance matrices for Weighted or Unweighted UniFrac distances (see Supplemental Figure S6). The Beta diversity index heatmap is available at supplementary file: result/04. BetaDiversity/beta_div_heatmap/beta_diversity.heatmap.
Beta diversity intergroup difference analysis
A boxplot of Beta diversity intergroup differences visually summarizes key metrics, including the median similarity, dispersion, maximum and minimum values, and outliers for each group. Beta diversity differences between groups were assessed for statistical significance using T tests, Wilcoxon rank-sum tests, and Tukey tests. The resulting boxplot is shown in Supplemental Figure S7.
Principal coordinates analysis
PCoA identifies the most significant patterns in multidimensional data by ranking eigenvalues and eigenvectors. Weighted or Unweighted UniFrac distances were employed for this analysis. The principal coordinates with the highest contribution rates were selected for 2D visualization. Samples with comparable community compositions group closely, whereas samples with distinct compositions are widely separated. The 2D PCoA results are displayed in Supplemental Figure S8a and S8b.
Principal component analysis
By representing the data in a 2D plot, PCA highlights patterns and differences between samples. In this plot, samples with similar community compositions appear closer together. The PCA results at the OTU level are shown in Supplemental Figure S8c.
Non-metric multi-dimensional scaling
NMDS is a nonlinear ordination technique tailored for ecological datasets, addressing the limitations of linear models like PCA and PCoA. It represents sample data as points in a multidimensional space, with intersample differences reflected in the distances between points. NMDS effectively highlights both intergroup and intragroup variation. The NMDS results at the OTU level are displayed in Supplemental Figure S8d.
UPGMA clustering tree
UPGMA is a hierarchical clustering method employed to examine similarities among samples. It iteratively clusters the two samples with the smallest distance into a new node, recalculates average distances, and repeats this process until all samples are grouped into a clustering tree. Using Weighted UniFrac distance matrices, UPGMA clustering analysis was performed, integrating the clustering results with species relative abundance at phylum level for visualization. The UPGMA clustering tree is shown at Figure 7.
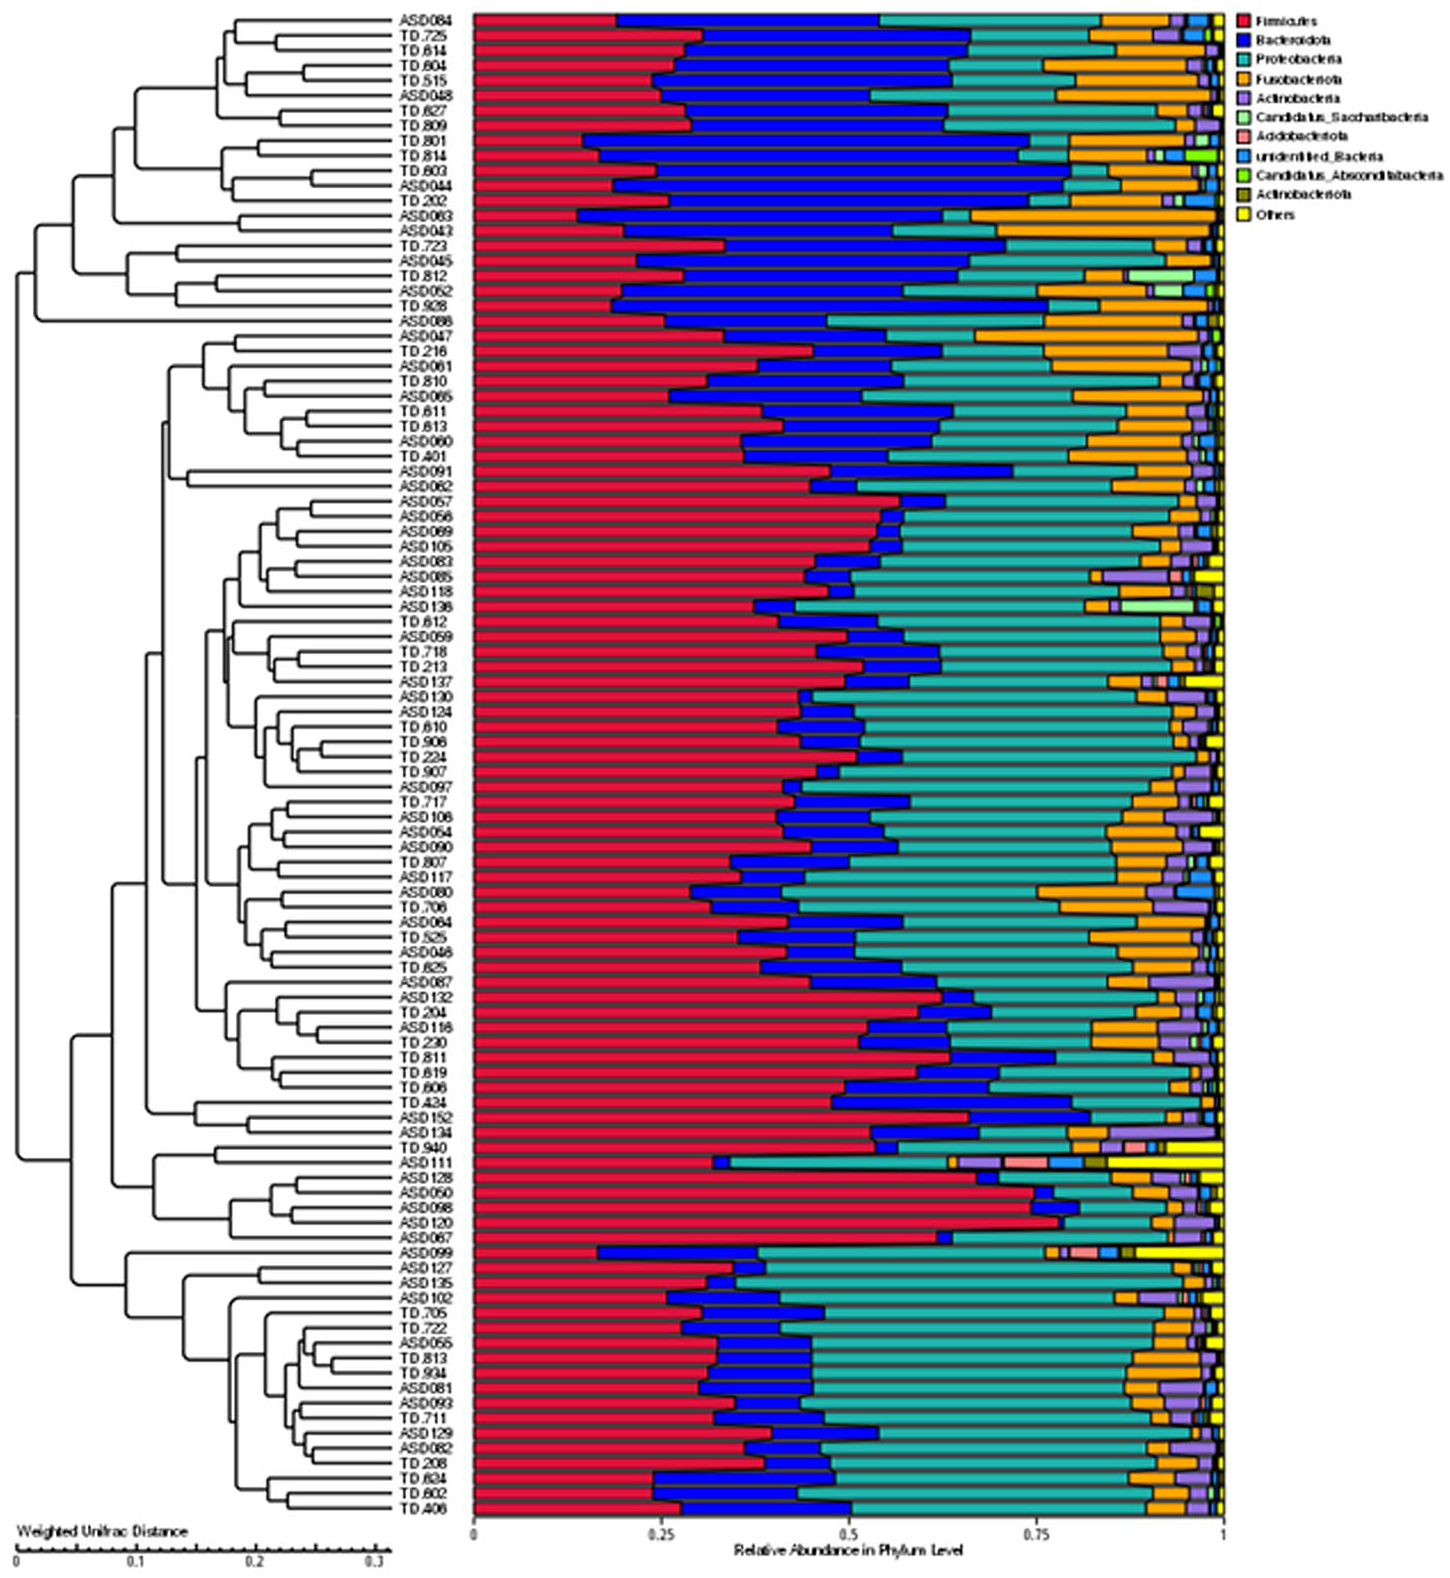
UPGMA clustering tree based on weighted UniFrac distance.
Inter-group community structure significance test
ANOSIM analysis
The ANOSIM analysis results are presented in Figure 8(a). Ranks are calculated based on pairwise distances between samples, with “between” indicating intergroup distances and “within” indicating intragroup distances. The analysis generates three categories of data, which are displayed in a boxplot. If the notches of two boxes do not overlap, this indicates a significant difference in their medians (see Figure 8(b)).
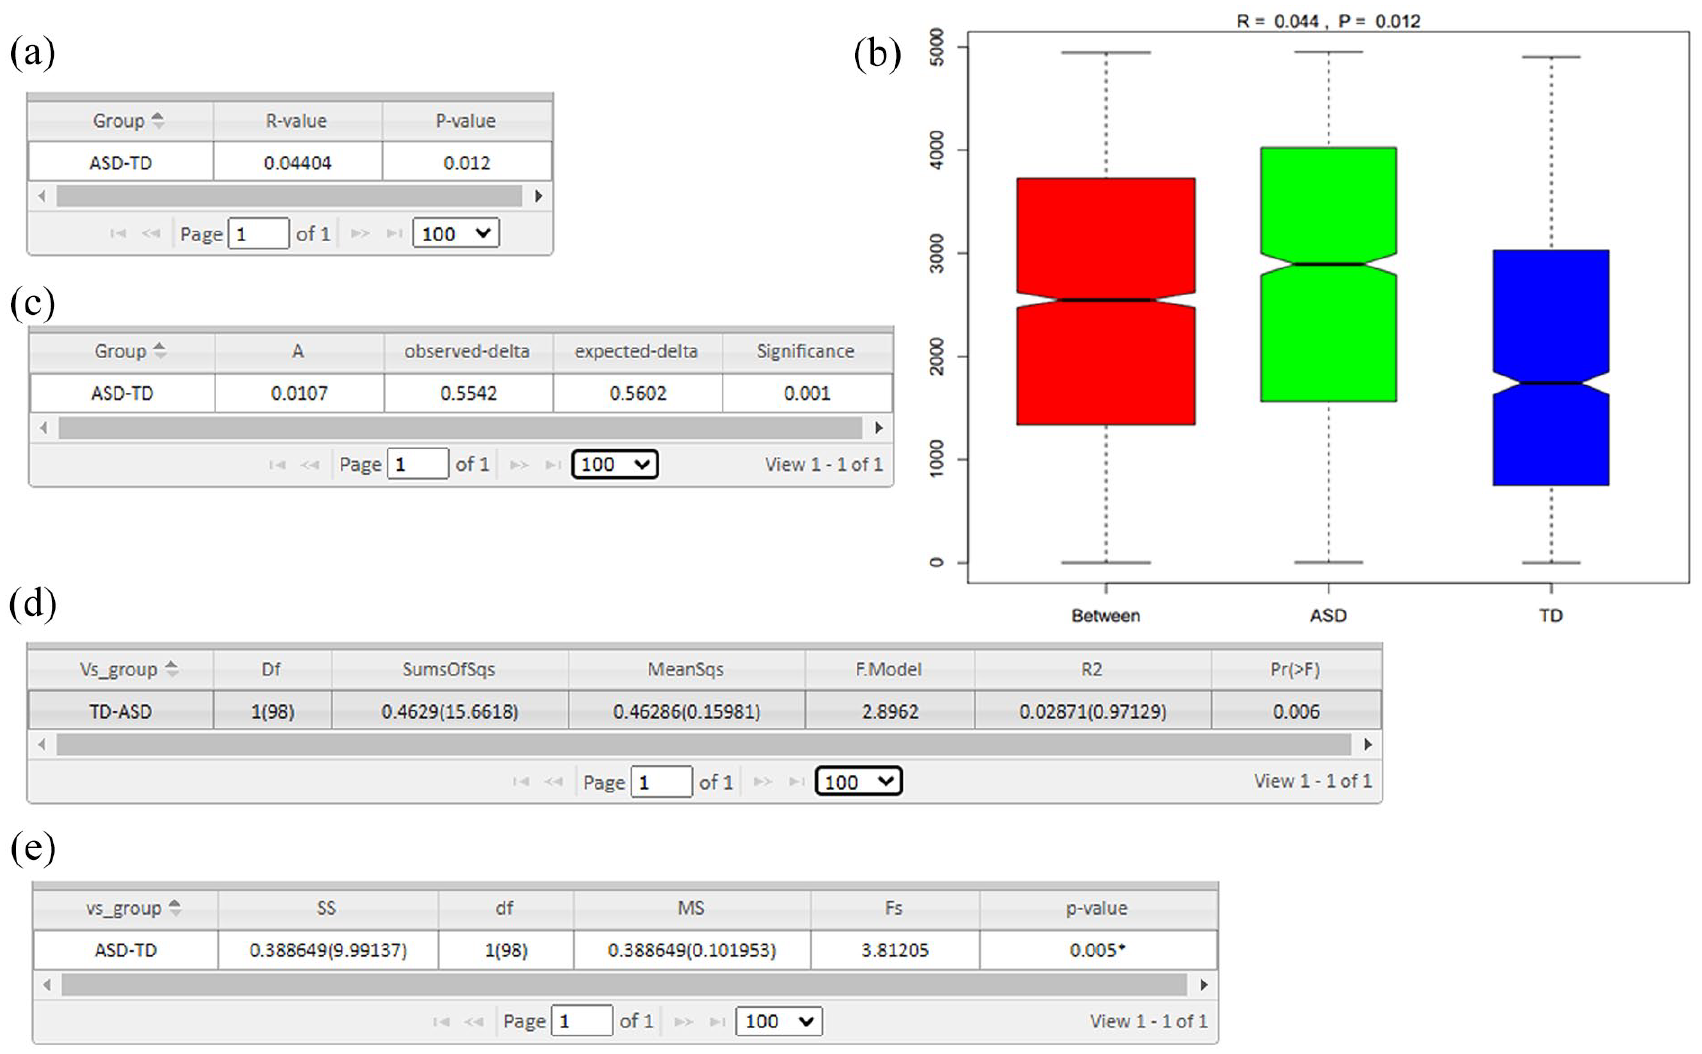
Inter-group community structure significance test. (a) ANOSIM inter-group difference analysis. Note: The R-value ranges between –1 and 1. A value greater than 0 indicates significant inter-group differences. The reliability of the analysis is represented by the p value, with p < 0.05 indicating statistical significance. (b) Boxplot for Anosim analysis.
MRPP analysis
MRPP (Multi-Response Permutation Procedure) test is often used alongside dimensionality reduction plots such as PCA, PCoA, and NMDS. The MRPP analysis results are shown in Figure 8(c).
ADONIS analysis
ADONIS (Analysis of Dissimilarity) is a non-parametric method for multivariate variance analysis, based on distance matrices (e.g. Bray-Curtis, Euclidean), and the results are presented in Figure 8(d).
Molecular variance analysis
Molecular variance analysis (AMOVA) is a non-parametric method, similar to analysis of variance (ANOVA), that uses distance matrices to test the differences between groups. The detailed calculation procedure can be found in the relevant section, and the AMOVA analysis results are displayed in Figure 8(e).
Analysis of species differences between groups
T test analysis
To detect species with significant differences between groups across different taxonomic levels, a T test was conducted for intergroup comparisons. Species with significant differences (p < 0.05) were identified. Results are displayed by default at the Phylum level; if no significant species are found at this level, the analysis proceeds to the next taxonomic level, and so on (see Supplemental Figure S9).
MetaStat analysis
MetaStat was applied to species abundance data across different taxonomic levels to determine species with significant intergroup differences. The top 12 significantly different species at the Phylum level are shown by default; if no significant species are found at this level, the analysis moves to the next taxonomic level. The results are presented in Figure 9, and the MetaStat results for each taxonomic level can be found at supplementary file: result/04. BetaDiversity/MetaStat.
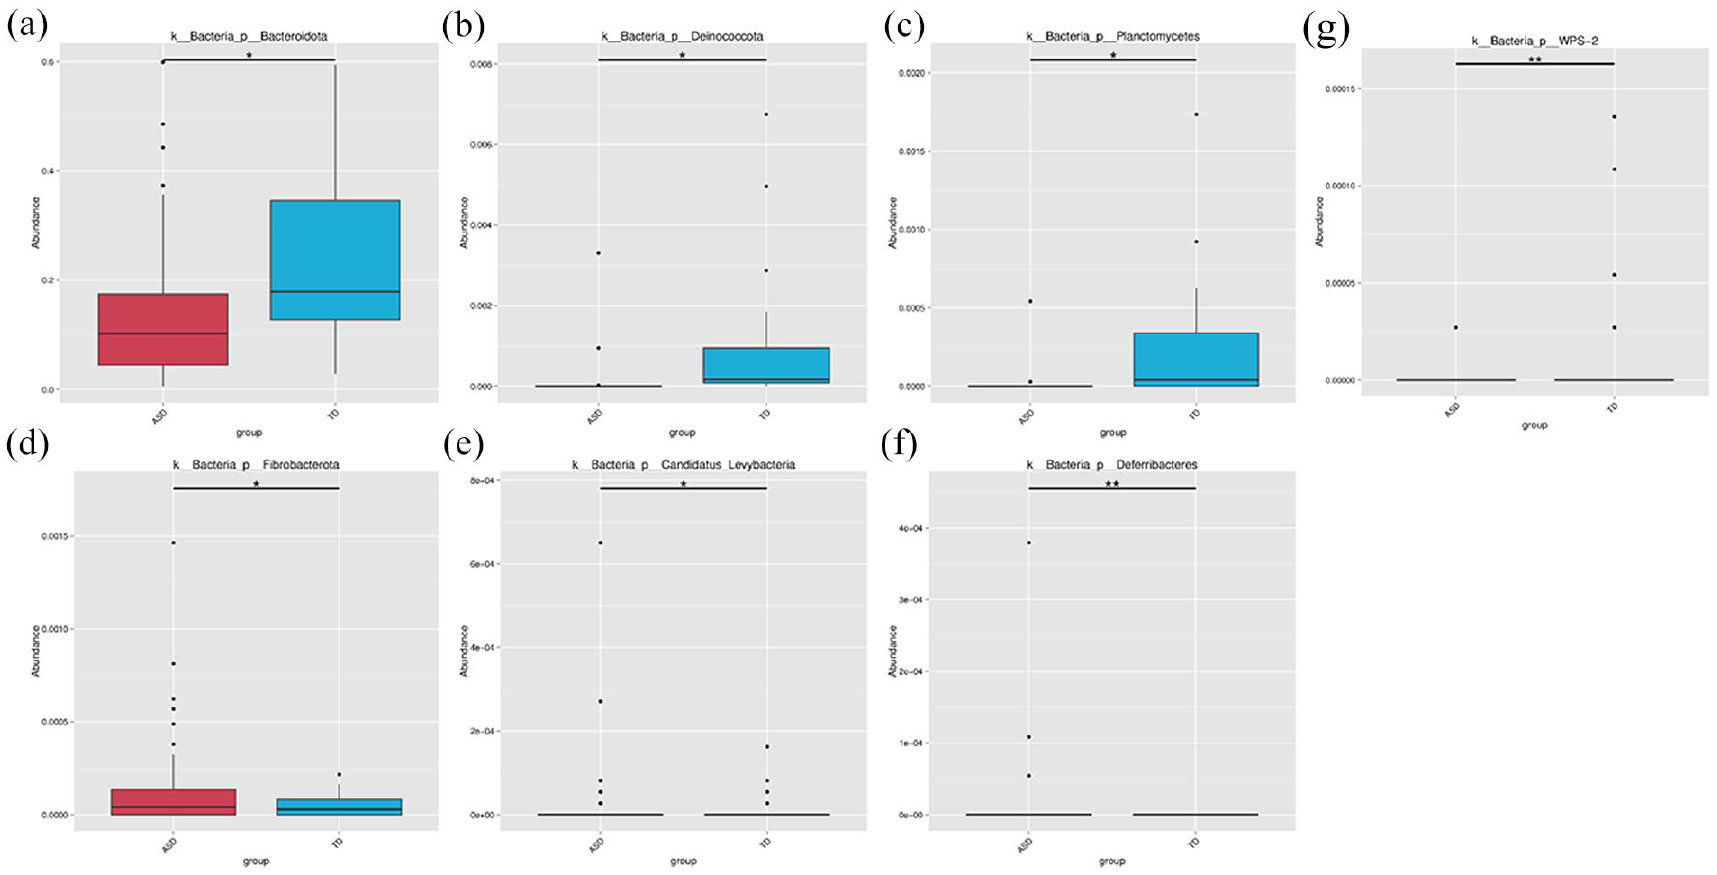
Statistical chart of significant species differences between groups. (a) p_Bacteroidota. (b) p_Deinococcota. (c) p_planctomycetes. (d) p_Fibrobacterota. (e) p_Candidatus-Levybacteria. (f) p_Deferribacteres. (g) p_WPS-2.
LEfSe analysis
LEfSe (LDA Effect Size) identifies biomarkers with significant differences between groups, focusing on species with statistically meaningful intergroup differences. LEfSe is a powerful tool designed to discover high-dimensional biomarkers and genomic features (e.g. genes, metabolites) that distinguish between biological conditions or groups. It combines statistical significance with biological relevance, allowing researchers to identify species with different abundances and associated categories. The statistical results from LEfSe include two components: LDA Score Distribution Bar Chart (see Supplemental Figure S10a) and Evolutionary Branching Diagram (Phylogenetic Distribution) (see Supplemental Figure S10b)
Network analysis
Co-occurrence network analysis provides an innovative method for studying community structure and function in microbial environments. As microbial co-occurrence relationships vary across environments, these network graphs provide insights into how environmental factors influence microbial adaptability. By filtering these coefficients with a cutoff of 0.6 and combining them with species abundance data, a network graph is produced (see Supplemental Figure S11).
Discussion
In this study, a total of 54 cases of ASD and 46 cases of TD subjects were analyzed. The oral microbiota of the ASD group exhibited significant differences compared with the TD group across all taxonomic levels. Furthermore, the ASD group showed notable oxidative stress in both saliva and oral epithelial cells when compared with the TD group, suggesting a potential association between altered oral microbiota and oxidative stress in individuals with ASD.
Oxidative stress in ASD subjects
Our findings indicate that in oral epithelial cells, ASD subjects exhibit reduced mRNA levels of SOD2 and RORA, potentiated H3K9me2 modification on the SOD2 promoter, and elevated 8-oxo-dG formation compared with the TD group. In addition, in saliva, ASD subjects have a decreased GSH/GSSG ratio compared with the TD group, pointing to heightened oxidative stress in the ASD group. This heightened oxidative stress may be linked to persistent epigenetic changes induced by prenatal risk factors (Lu et al., 2020; Wang et al., 2019; Zou et al., 2017) and SOD2 suppression (Wang et al., 2019).
Altered oral microbiota in ASD subjects
In this study, we analyzed oral microbiome samples from 54 ASD and 46 TD subjects using 16S rDNA sequencing. The data processing pipeline included sequence correction, filtering, demultiplexing, and OTU clustering at 97% similarity, followed by taxonomic annotation. The results were visualized using heatmaps, phylogenetic trees, and interactive tools such as KRONA. Species diversity and abundance were assessed through bar charts, heatmaps, and evolutionary trees. Alpha and beta diversity analyses were conducted to measure richness, evenness, and intersample differences, revealing significant differences between the ASD and TD groups. Statistical tests identified key biomarkers and co-occurrence patterns, highlighting distinct microbial profiles in the ASD group. Comprehensive visualizations provided valuable insights into the microbial diversity and community differences between ASD and TD groups (Maitre et al., 2020; Olsen & Hicks, 2020; Qiao et al., 2018).
Potential association between altered oral microbiota and oxidative stress in ASD subjects
In this study, we observed increased oxidative stress and altered oral microbiota in ASD subjects compared with TD subjects; however, the primary underlying factors remain unclear. The dysbiosis of the oral microbiota in ASD may lead to the overgrowth of pro-inflammatory species and increased production of reactive oxygen species (ROS), triggering immune responses that lead to chronic inflammation and depletion of antioxidants like glutathione. Dysbiosis may also disrupt host pathways that maintain redox balance, further amplifying oxidative stress and exacerbating microbial imbalances (Abdulhaq et al., 2021; Tong et al., 2022). Alternatively, prenatal risk factors may mediate oxidative stress, which in turn drives alterations in the oral microbiota. Oxidative stress in ASD subjects can favor the growth of ROS-resistant pathogens, impair immune function, damage oral tissues, and cause shifts in microbial metabolism (Aljumaiah et al., 2022; Li et al., 2022). These changes promote dysbiosis, initiating a cycle of sustained oxidative stress and microbial imbalance (Wang et al., 2019). Together, these factors create a feedback loop between altered microbiota and oxidative stress, potentially influencing ASD pathology.
Our findings may reflect broader disruptions in neuroimmune and neurooxidative pathways implicated in autism neurobiology. Altered oral microbiota composition and elevated oxidative stress levels in individuals with ASD may interact with central nervous system function through the microbiota–gut–brain axis, influencing neurodevelopmental trajectories (McCartney et al., 2021). These microbial shifts could modulate systemic inflammation or oxidative stress, both of which are implicated in altered synaptic pruning and neural connectivity in ASD (Hu et al., 2021). (Dando et al., 2017). Understanding these links may inform the development of adjunctive treatment strategies—such as antioxidant supplementation or microbiome-targeted interventions—that complement existing behavioral or pharmacologic therapies in ASD management.
Limitations
This study has several limitations that should be acknowledged. First, the relatively small sample size limits the statistical power and precludes a more nuanced within-group analysis of heterogeneity in the ASD group. Given the known heterogeneity in ASD, larger samples are needed to explore relationships between microbial changes and specific phenotypic traits such as language ability, motor function, and core symptom domains. Second, while participants were matched on age, sex, and IQ, the matching was not 1:1 due to sample size imbalance, and IQ matching was based on comparable full-scale scores rather than identical tests across all participants, which may introduce bias. Third, we did not adjust for potential covariates such as diet, oral hygiene behaviors, dental history, or time of sampling—all of which may influence oral microbiota profiles. Fourth, although we observed a higher rate of unidentified bacteria in controls, we did not include sequencing quality metrics (e.g. yield or read depth) or account for these in the analysis; this will be addressed in future studies. Finally, the observed link between oxidative stress and microbial shifts was correlative; further analysis is needed to evaluate redox–microbiome relationships within groups and clarify biological mechanisms.
Conclusions
In this study, we identified 54 cases of ASD and 46 cases of TD subjects. We found that ASD subjects exhibited suppressed expression of SOD2 and RORA, increased H3K9me2 modifications on the SOD2 promoter, elevated 8-oxo-dG formation in cells, and a decreased GSH/GSSG ratio in saliva compared with the TD group. In addition, alpha and beta diversity analyses showed significant differences in richness, evenness, and intersample variations between the ASD and TD groups. Statistical tests identified key biomarkers and co-occurrence patterns, while detailed visualizations provided valuable insights into the microbial diversity and community structure differences between the groups. Taken together, these findings suggest that altered oral microbiota is associated with oxidative stress in ASD subjects.
Supplemental Material
sj-docx-1-aut-10.1177_13623613251362259 – Supplemental material for Potential association between altered oral microbiota and oxidative stress in individuals with autism
Supplemental material, sj-docx-1-aut-10.1177_13623613251362259 for Potential association between altered oral microbiota and oxidative stress in individuals with autism by Liyan Zhong, Pengcheng Ren, Haibo Wang, Chenghui Fu, Dingxia Feng, Min Wang, Liqin Zeng, Paul Yao and Tao Wang in Autism
Footnotes
Correction (December 2025):
Article updated online to correct the author affiliations.
ORCID iDs
Ethical Considerations
The protocol was reviewed and approved by the Ethical Committee of Hainan Women and Children’s Medical Center.
Consent to participate
All the participants provided written consent forms.
Author contributions
Funding
The author(s) disclosed receipt of the following financial support for the research, authorship, and/or publication of this article: This study was financially supported by The National Natural Science Foundation of China, #82060260; The Excellent Talent Team of Hainan Province, # QRCBT202121 and Hainan Province Clinical Medical Center, # QWYH202175.
Declaration of conflicting interests
The author(s) declared no potential conflicts of interest with respect to the research, authorship, and/or publication of this article.
Data availability statement
All original raw DNA sequencing data (~8GB) are available and will be uploaded to a publicly accessible shared repository upon request or upon manuscript acceptance. The data can be made available to researchers for validation and further analysis.
Supplemental material
Supplemental material for this article is available online.
References
Supplementary Material
Please find the following supplemental material available below.
For Open Access articles published under a Creative Commons License, all supplemental material carries the same license as the article it is associated with.
For non-Open Access articles published, all supplemental material carries a non-exclusive license, and permission requests for re-use of supplemental material or any part of supplemental material shall be sent directly to the copyright owner as specified in the copyright notice associated with the article.