
Abstract
Measures of autistic traits are only useful – for pre-diagnostic screening, exploring individual differences, and gaining personal insight – if they efficiently and accurately assess autism as currently conceptualised while maintaining psychometric validity across different demographic groups. We recruited 1322 autistic and 1279 non-autistic adults who varied in autism status (non-autistic, diagnosed autistic, self-identifying autistic) and gender (cisgender men, cisgender women, gender diverse) to assess the psychometric properties of the Comprehensive Autistic Trait Inventory, a recently developed measure of autistic traits that examines six trait domains using 42 self-report statements. Factor fit for the six subscales was appropriate, as was total-scale and subscale reliability. Importantly, measurement invariance was demonstrated based on both autism status and gender, indicating that Comprehensive Autistic Trait Inventory scores of these group members can be directly compared. Autistic traits were highly similar between diagnosed and self-identifying autistic adults, while gender-diverse participants showed more autistic traits than their cisgender counterparts. A total-scale discrimination threshold of 147.5 calculated was suggested which corresponded to sensitivity and specificity of 77.20 and 87.41, respectively. Our analysis indicates that the Comprehensive Autistic Trait Inventory is a practical measure of autistic traits in non-autistic and autistic participants that is useful for researchers and clinicians and for affirming self-identity.
Lay abstract
The Comprehensive Autistic Trait Inventory (CATI) is a free questionnaire designed to measure autistic traits in both autistic and non-autistic adults. The CATI includes 42 items focusing on six areas: Social Interactions, Communication, Social Camouflage, Self-Regulating Behaviours, Cognitive Flexibility, and Sensory Sensitivity. Here, we set out to determine whether the CATI can accurately measure autistic traits in both autistic (both diagnosed and self-identifying) and non-autistic people, as well as people of different genders. We also wanted to explore the extent to which trait scores differed between these groups of individuals. Our study recruited over 2600 participants, including 1322 autistic and 1279 non-autistic adults. Our findings suggest that the CATI works the way it was designed to. It is a reliable and accurate tool for measuring autistic traits, can distinguish between autistic and non-autistic people, and appears appropriate for people of different genders. Notably, we found that people who self-identify as autistic have similar trait scores to those with a clinical diagnosis of autism and that gender-diverse people scored higher on autistic traits compared to cisgender people. Our data suggest that the CATI is a useful tool for measuring autistic traits in autistic and non-autistic people and for understanding the way that autistic people vary from one another. It should be helpful for researchers and clinicians, and support a public understanding of autism.
Autism is a neurodevelopmental divergence affecting people across the lifespan (Kapp et al., 2013; Silberman, 2015). In current diagnostic handbooks, autism is characterised by atypical social interaction and communication, as well as repetitive behaviours, sensory differences and an insistence on sameness (American Psychiatric Association [APA], 2022). Qualitatively similar characteristics are reported in the non-clinical population, with ‘sub-threshold’ autistic traits observed in parents of autistic children (Bailey et al., 1998; Kanner, 1944; Rutter, 2000; Sucksmith et al., 2011) and, more broadly, normally distributed within the general population (Baron-Cohen et al., 2011; Ruzich et al., 2015). Supporting the notion of an autism continuum that extends into non-clinical populations, large-scale studies suggest an overlapping genetic aetiology for autism and autistic traits that is evidenced through twin concordance (Lundström et al., 2012) and common (Bralten et al., 2018; Robinson et al., 2016) and de novo (Robinson et al., 2016) genetic variance.
Self-report autistic-trait questionnaires have facilitated research on the autistic continuum and bring several advantages to assessing autistic traits in clinical and non-clinical adult populations (for review, see Lyall, 2023). Theoretical models linking autistic characteristics to particular psychological sequelae can be evaluated by sampling the general population (Johnston et al., 2013; Mosner et al., 2019), easing the recruitment of large samples and avoiding the need to control for the substantial number of co-occurring conditions typically reported for formally diagnosed autistic groups (Jarrold & Brock, 2004; Landry & Chouinard, 2016). Trait-based studies provide accessible preliminary evidence that can inform studies exploring clinical populations. Furthermore, though trait dimensions often align with diagnostic criteria (e.g. communication difficulties), there is growing recognition of the diverse presentation of autism (Belcher et al., 2022; Lundström et al., 2012; Sasson & Bottema-Beutel, 2022). Self-report surveys can reveal emerging traits not currently used in formal diagnosis (e.g. social camouflaging; (Adkin, 2023; Chahboun et al., 2022; Lundin Remnélius & Bölte, 2023; Miller et al., 2021; Pearson & Rose, 2021; Sucksmith et al., 2011).
Finally, an increased need exists for assessing autistic traits in the general population using psychometrically accurate screeners, especially as demand for diagnostic services increases for both children and adults (L. Jones et al., 2014; Levy et al., 2009; McKenzie et al., 2015). This latter advantage is important because access to autism assessments is not equitable. Certain groups are particularly affected by a dearth of services, including cisgender women, gender minority groups, people with intellectual disabilities, individuals with limited financial means (or support), and those who live in underserviced regions (Anderson et al., 2018; Dababnah et al., 2018; Davis et al., 2022; Lockwood Estrin et al., 2021; Malik-Soni et al., 2022). When access to formal diagnosis is unavailable (for either child or adult) or otherwise undesired (Lewis, 2017), self-reported measures of autistic traits can help people embrace an autistic identity and, if desired, navigate towards a formal diagnosis (Botha et al., 2020; Crawshaw, 2023; Davies et al., 2023).
Concerns with established measures of autistic traits
Given their potential benefits, several self-report surveys and questionnaires have been developed to quantify autistic traits in adults. These vary in length (i.e. number of items) and the breadth of dimensions captured. As the understanding and exploration of autism has evolved (Conner et al., 2019; Gunderson et al., 2023; Murray et al., 2005), with diagnostic criteria updated accordingly, once commonly employed measures have become outdated (Agelink van Rentergem et al., 2019; Ashwood et al., 2016; Conner et al., 2019; Dorlack et al., 2018; Yu et al., 2023). For example, broad measures of autistic traits, such as the Broad Autism Phenotype Questionnaire (BAPQ; Hurley et al., 2007), Autism-Spectrum Quotient (AQ; Baron-Cohen et al., 2001) and Social Responsiveness Scale (SRS-A; Constantino, 2012), have too few, if any, items to appropriately assess differences in sensory sensitivity. The Ritvo Autism Asperger Diagnostic Scale–Revised (RAADS-R; Ritvo et al., 2011) partially addresses this issue, but the combined ‘Sensory Motor’ subscale limits the specificity of the results. Other scales (e.g. AQ, SRS-A, RAADS-R) focus heavily on social rather than non-social characteristics, limiting the representation of non-social autistic features in research and screening processes. For example, while the RAADS-R examines autistic traits across four subscales, the ‘Social Relatedness Problems’ subscale makes up 39 of the total 80 items, disproportionately contributing towards the total-scale score (Ritvo et al., 2011).
Of further concern is the statistical properties of many autistic trait measures. An influential paper by Nishiyama et al. (2014) compared the psychometric properties of most trait measures available at the time, with some of the most prominent measures (e.g. AQ, SRS-A) showing troubling internal consistency reliability and discriminant validity. Others are comprised of subscales with poor reliability (e.g. Imagination in the AQ; Austin, 2005) and/or have factor models not replicated in independent analyses (Constantino et al., 2003; English et al., 2020; Sturm et al., 2024). Most scales have shown questionable screening properties when applied to clinical settings (for review, see Wigham et al., 2019). For example, the RAADS-R showed no predictive ability in identifying whether 50 adult users of a UK National Health Service specialist autism service would go on to receive an autism diagnosis (S. L. Jones et al., 2021). Similar outcomes are reported for the AQ and SRS-A (Adamou et al., 2021; Ashwood et al., 2016; Bezemer et al., 2021).
Finally, terms and language used in some measures can stigmatise and reinforce outdated stereotypes (e.g. ‘I am fascinated by dates’, ‘I would rather go to the theatre than a museum’; Agelink van Rentergem et al., 2019). The language used to describe autistic traits is increasingly important when considering the development of a questionnaire since ableist, non-inclusive or stigmatising phrasing can lead to relational ‘ruptures’ between test-takers – who are often autistic people – and test administrators, researchers and clinicians – who may not be autistic (Bottema-Beutel et al., 2021; S. C. Jones, 2022). This issue is one best addressed by involving autistic people in the design, acquisition and analysis of research (Fletcher-Watson et al., 2019; Nicolaidis et al., 2011; Poulsen et al., 2022). Co-design methodology is demonstrated to ensure research outcomes better align with research priorities identified by the autistic community (Pellicano et al., 2021).
The Comprehensive Autistic Trait Inventory
The Comprehensive Autistic Trait Inventory (CATI) is a recently developed self-report measure of autistic traits that aims to overcome many of the concerns related to outmoded or outdated assessments (English et al., 2021). It achieves this by (1) including domains measuring social camouflaging and sensory sensitivities and (2) involving key stakeholders – autism researchers, clinicians and autistic adults – in its development. Development of the CATI required a thorough psychometric process spread across three studies. In the first study (Study 1), 1119 participants recruited from the general population were presented with 107 pilot items from which exploratory factor analysis reduced the final set to 42, spread evenly across six subscales labelled Social Interactions, Communication, Social Camouflage, Repetitive Behaviours, Cognitive Rigidity and Sensory Sensitivity. In Study 2, the factor structure was validated in an additional set of 1068 individuals and found to be measurement invariant between cisgender men and women. Study 2 also demonstrated that the CATI outperformed the existing AQ and BAPQ measures both in terms of internal consistency, reliability and the classification of autistic and non-autistic participants (English et al., 2021). Finally, in Study 3, convergent validity was confirmed for each of the six CATI subscales, with the scores for each subscale correlating strongly with a conceptually similar established measure. While these outcomes are encouraging and demonstrate that the CATI presents a reliable and comprehensive tool for assessing autistic traits in the general population, the lack of analyses using a sizable autistic sample means it remains to be determined whether it is well suited for reliably measuring traits in autistic people.
The current study
Here, we aimed to investigate the psychometric properties of the CATI and its associated clinical utility in autistic adults beyond the preliminary assessment conducted by English et al. (2021). In addition, we set out to determine whether the CATI is consistently reliable across different genders. Finally, we set out to determine the CATI’s reliability among both clinically diagnosed and self-identifying autistic adults. To address these aims, we combined data across four separate datasets to generate large samples of autistic and non-autistic people. To test the CATI’s psychometric properties, we conducted a series of analyses comparing autistic and non-autistic people, as well as diagnosed autistic and self-identifying autistic people. These analyses included confirmatory factor analyses (CFAs), measurement invariance testing and internal consistency reliability examinations. To test the CATI’s clinical utility, we examined group differences across the total-scale and subscale scores, assessed sensitivity and specificity for classifying autistic and non-autistic people, and identified an optimal total-score threshold for classification. Finally, we examined how gender interacts with the trait profiles of autistic and non-autistic participants to assess the appropriateness of the CATI for different genders.
Method
Participants
We combined datasets from surveys that administered the CATI to both non-autistic and autistic people, including English et al. (2021; Study 2, Sample 1; n = 1113), Brett et al. (2024; Study 2, Sample 2; n = 268) and Poulsen et al. (2025, Sample 3; n = 381). We further supplemented these datasets with additional data collection (Sample 4; n = 839) to increase the representation of autistic (formally diagnosed and self-identifying) people, balance gender representation within the autistic groups and improve the general representation of gender-diverse people. Ethical approval was received to recruit participants in the Sample 4 dataset from the University of Western Australia’s Human Research Ethics Office (2019/RA/4/20/5546), and written consent was obtained from each participant. Similar ethical approvals for data collection and analysis were also obtained for the pre-existing datasets prior to data collection.
The pooled dataset consisted of 2601 participants (for descriptive statistics, see Table 1; for individual datasets, see Table S1 in Supplemental Materials), including participants who reported (1) being autistic with a formal diagnosis (n = 737; ‘Autistic DX’), (2) self-identified as autistic, but without an accompanying formal diagnosis (n = 585; ‘Autistic SELF’), and (3) being non-autistic (n = 1279). For statistical comparisons, we occasionally combined the diagnosed and self-identifying autistic groups in our analyses (n = 1322; ‘Autistic ALL’). All participants were recruited either via Prolific Academic (Samples 1, 2, and 4) or advertising on social media (Sample 3) and completed the CATI and demographics-related questions online using survey software (Qualtrics or REDCap). Where a participant recruited via the Prolific Academic platform contributed to multiple datasets (detected via unique user identifiers), the more recent participant record was retained. Participants completed the CATI using consistent item ordering and the response options outlined in English et al. (2021). 1
Demographic information for participants, including age, autistic identity, and gender identity.
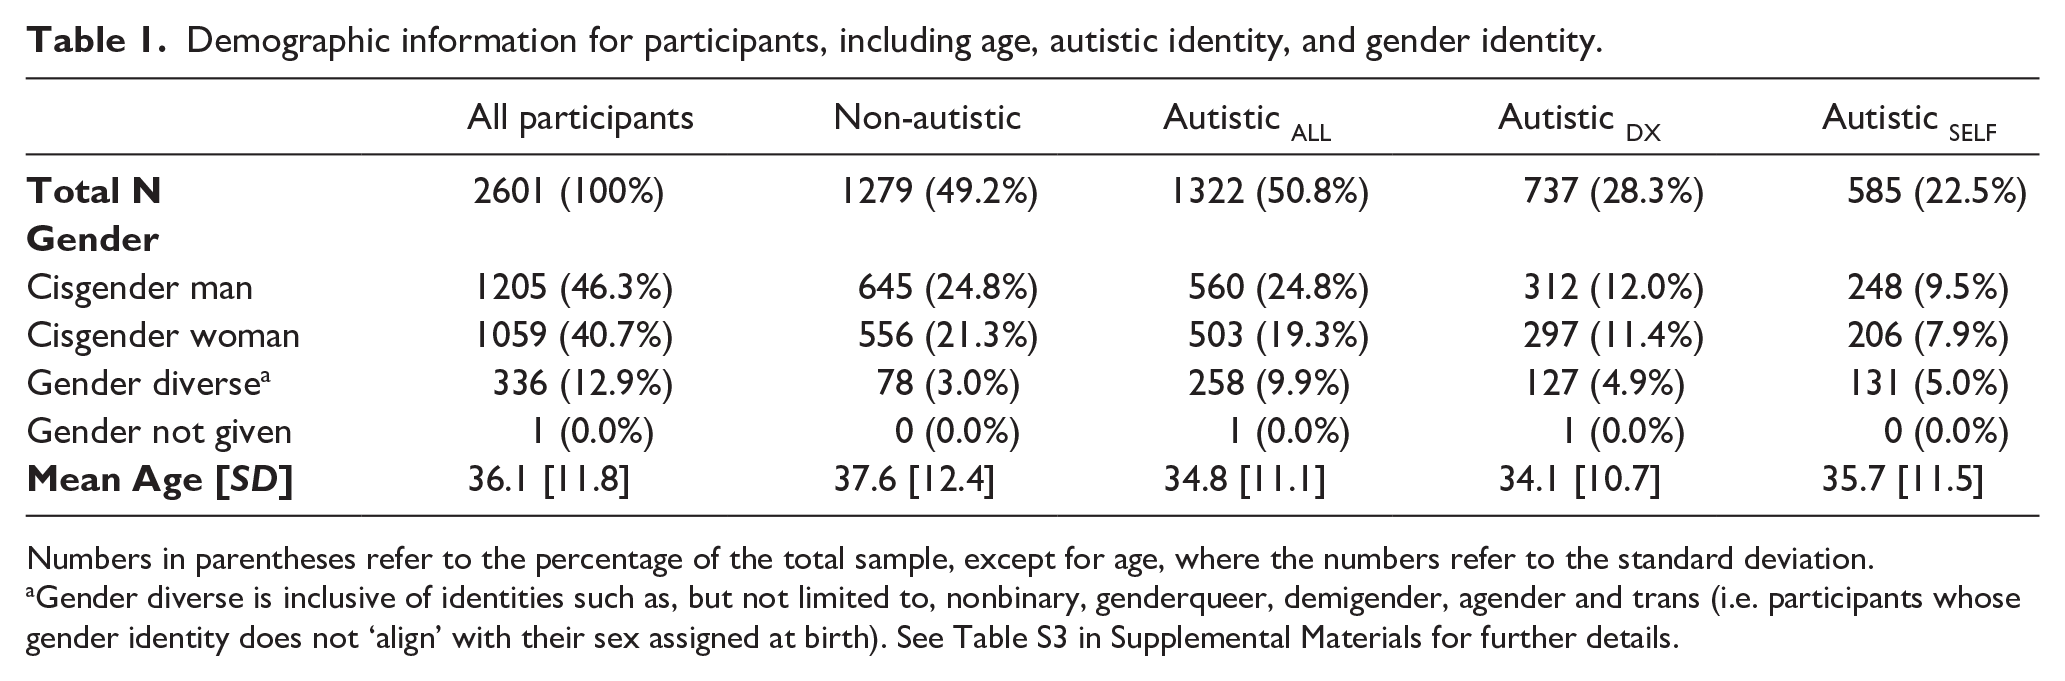
Numbers in parentheses refer to the percentage of the total sample, except for age, where the numbers refer to the standard deviation.
Gender diverse is inclusive of identities such as, but not limited to, nonbinary, genderqueer, demigender, agender and trans (i.e. participants whose gender identity does not ‘align’ with their sex assigned at birth). See Table S3 in Supplemental Materials for further details.
Participant recruitment varied between specific samples. All participants were required to speak English. For samples collected via Prolific Academic (i.e. Samples 1, 2 and 4), participants were restricted mainly to people from the United Kingdom, the United States, Australia, Canada and New Zealand, and were remunerated for their participation. Sample 3 had no location restriction and no remuneration. All participant responses were screened for atypically fast completion times and response patterns, which indicate fabrication. Participants in Samples 1 and 4 were also subject to attention checks in the form of items integrated into parts of the online survey that required a particular response.
Demographic information collected included participants’ age, sex (referring to one’s biological characteristics and/or assignment at birth), gender (referring to one’s gender identity as distinct from sex) and ethnicity. Participants were categorised into three groups – cisgender men, cisgender women and gender-diverse people (encompassing the spectrum of nonbinary and transgender identities) – to examine differences associated with sex assigned at birth and gender identity. Henceforth, we refer to this variable as ‘gender’ though, here, we also examine ‘sex differences’ by comparing cisgender men and women. Cisgender participants encompassed 87% of the overall sample, and of the 13% of gender-diverse participants, 63.4% identified as nonbinary (see Table S3 in Supplemental Materials). The study included five intersex participants, who reported their gender identities to be man (n = 1), woman (n = 1) and gender diverse (n = 3). The overall sample was predominantly White (81%). A breakdown of participant ethnicity is found in Table S4 in Supplemental Materials.
Materials
The Comprehensive Autistic Trait Inventory
The CATI is a self-report questionnaire designed to quantify traits and characteristics qualitatively like those shown in autistic people (English et al., 2021; www.cati-autism.com). The CATI contains 42 items spanning six subscales, each containing seven items. These subscales, while not exhaustive of autistic characteristics, are intended to represent those most readily quantified across the general population and include:
Social Interactions – examining desire for, and self-appraisal in, social interactions.
Communication – examining the use and understanding of non-verbal communicative behaviours.
Social Camouflage – relating to masking and compensatory behaviours used to fit in or appear non-autistic.
Self-Regulatory Behaviours (previously Repetitive Behaviours) – describing (typically repetitive) actions and physical behaviours that can help alleviate stress and anxiety.
Cognitive Flexibility (previously Cognitive Rigidity) – relating to adaptability to changes, insistence on sameness, and flexibility around routines.
Sensory Sensitivity – describing oversensitivity (or hypersensitivity) to external stimuli across several sensory modalities. 2
CATI items are presented in the form of statements to which respondents report their level of agreement on a 5-point Likert-type scale containing the options ‘strongly disagree’, ‘somewhat disagree’, ‘neither agree nor disagree’, ‘somewhat agree’ and ‘strongly agree’. Responses are scored on a 1–5 scale (with several reverse-keyed items), which can be aggregated to form a total-scale score (range 42–210 and subscale scores (range, 7–35)), with higher scores indicative of a greater endorsement of autistic traits.
Community involvement
Early in the development of the CATI, six autistic adults were engaged (by M.C.W.E. and M.T.M.) to establish the content of the CATI, including which trait dimensions to focus on and the types of items that would respectfully represent each dimension. This process provided valuable input concerning survey items piloted in the initial assessments and helped justify the inclusion of a ‘social camouflage’ dimension. Yet, it was the researchers who ultimately decided on the naming of the final six subscales.
For the current study, an autistic research team member recruited a working group of six autistic adults to discuss subscale labels and provide alternatives as necessary. Group members aimed to ensure the labels were respectful and inclusive, and accurately represented the items in each subscale. The autistic working group endorsed the Social Interactions, Communication, Social Camouflaging and Sensory Sensitivity labels, but recommended that Cognitive Rigidity and Repetitive Behaviours subscales be renamed Cognitive Flexibility and Self-Regulatory Behaviours to avoid negative connotations of language and, for the latter, to represent the purpose of such behaviours better. These changes are reflected throughout this report to encourage users of the CATI to employ the modified nomenclature. An updated version of the CATI with these changes is available in the Supplemental Materials.
Statistical analyses
Analyses were performed using R v4.2.0 (R Core Team, 2022) and RStudio v2023.06.1 + 524 (Posit Team, 2023) primarily using the lavaan v0.6-19 (Rosseel, 2012), psych v2.4.12 (Revelle, 2024), semTools v0.5-6 (Jorgensen et al., 2022), GPArotation v2024.3-1 (Bernaards & Jennrich, 2005), pROC v1.18.5 (Robin et al., 2011) packages and Jamovi v2.6.24 (The jamovi project, 2024).
Primary analyses
The initial set of analyses (1) tested the psychometric properties of the CATI across three groups – non-autistic, formally diagnosed autistic and self-identifying autistic people – and (2) determined whether formally diagnosed and self-identifying autistic people significantly differed, to assess whether combining these groups for subsequent analyses would be appropriate. These analyses were performed on the overall sample, separately on each of the three participant groups (Non-autistic, Autistic DX and Autistic SELF), and on the combined autistic groups.
Next, CFAs were performed to test the fit of the CATI factor structure. The original analyses of the CATI conducted on a sample of primarily non-autistic participants (English et al., 2021) indicated support for a bifactor structure that included the six subscales previously described and two additional factors: a social factor comprised of items on the Social Interactions, Communication and Social Camouflaging subscales, and a non-social factor consisting of items on the Self-Regulatory Behaviours, Cognitive Flexibility and Sensory Sensitivity subscales. For the current study, we examine an alternative, hierarchical factor model (see Figure 1) similar to the previously described bifactor model but with the broader social and non-social factors as hierarchical factors directly defined by the previously associated subscales. The hierarchical model was chosen as it lends itself better to the retention of specific factors, or subscales, which can be used for greater specificity by researchers and clinicians. Such specificity may also be key to distinguishing autism from other overlapping conditions, though this challenge is beyond the scope of the current article. Furthermore, it is difficult to say that the bifactor model in English et al. (2021) was definitively better than the hierarchical equivalent, given bifactor models are relatively less constrained and generally allow for greater fit than a hierarchical counterpart (Markon, 2019; McFarland, 2016).
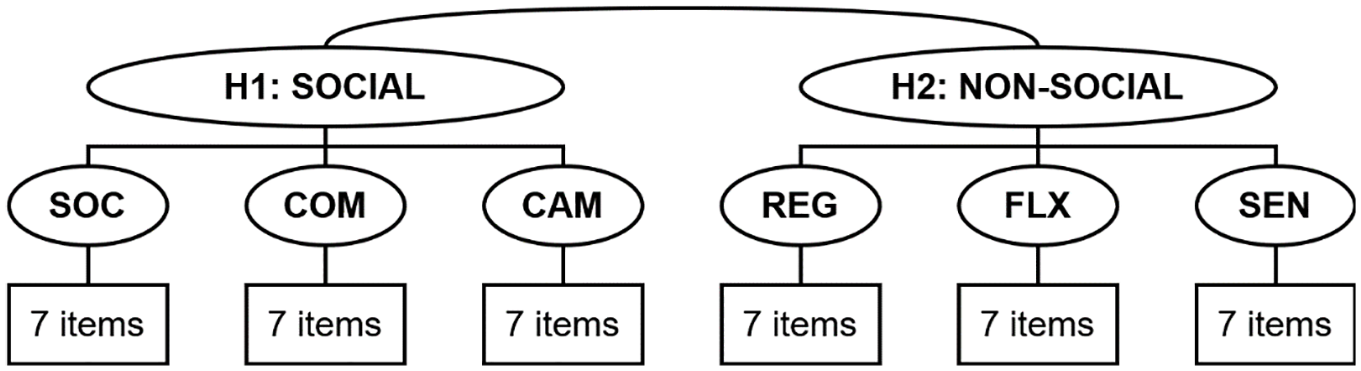
Factor structure of the CATI examined in the present study.
CFA was conducted (using lavaan) with polychoric correlations and weighted least squares estimation. Model fit was assessed using the comparative fit index (CFI), Tucker–Lewis Index (TLI), root mean square error of approximation (RMSEA) and standardised root mean square residual (SRMR). CFI and TLI >0.90 are typically considered ‘fair’ when used in conjunction with other criteria, and >0.95 ideal, while RMSEA and SRMR are expected to be <0.06 and <0.08, respectively (Hu & Bentler, 1999). For completeness, the overly sensitive chi-square test was also included.
These tests were followed by tests of measurement invariance (using semTools) to determine if the factor structure meaningfully differed between the three participant groups (Non-autistic, Autistic DX and Autistic SELF) as this would preclude direct comparison of subscale scores. Establishing measurement invariance ensures that CATI scores can be interpreted similarly regardless of group differences (i.e. between different autism or gender groups). This process involves testing a sequence of models with increasingly restrictive parameters and examining whether fit indices substantially change between the following steps: configural invariance (testing the same factor structure across groups), metric invariance (comparing factor loadings) and scalar invariance (examining item intercepts). Changes between models of CFI > 0.01 or RMSEA > 0.015 would indicate a potential violation of the invariance assumption (Chen, 2007; Cheung & Rensvold, 2002).
For all CFAs and tests of measurement invariance, a ‘method’ factor consisting of the reverse-keyed items was included in the model to help account for variance associated with the valence of item phrasing, but the associated results are not reported for the factor.
Correlation and reliability analyses were performed (using psych) to observe the strength of associations between and within the CATI subscales. Once the validity of the factor structure and reliability of the CATI were established, we compared total-scale and subscale scores between the three participant groups. Predictive ability of the CATI to classify correctly autistic and non-autistic participants was assessed using binomial logistic regression (using Jamovi). Finally, we identified an optimal threshold for discriminating autistic and non-autistic participants by finding the total-scale score that maximised the combined classification accuracy of both autistic (i.e. sensitivity) and non-autistic (i.e. specificity) participants (using pROC).
Secondary analyses
Additional analyses explored whether gender impacted the psychometric properties of the CATI and investigated differences in autistic trait profiles as a function of this demographic variable. To maximise statistical power, we combined the two autistic groups into a single group (Autistic ALL), deemed justifiable following the results of the primary analyses. Otherwise, analyses exploring gender differences followed the methodology of the primary analyses.
Results
Re-assessing the CATI using larger clinical samples
Verifying the factor structure using confirmatory factor analysis
CFA was performed to examine the fit of the hierarchical factor model defined earlier. The fit indices for the total sample and subsamples (see Table 2) generally exceeded the ‘fair’ fit criteria and surpassed the ‘good’ fit criteria in many cases. Thus, the hierarchical model appears appropriate for each participant subsample.
Incremental and absolute model fit indices assessing the structure of the hierarchical model of the CATI.
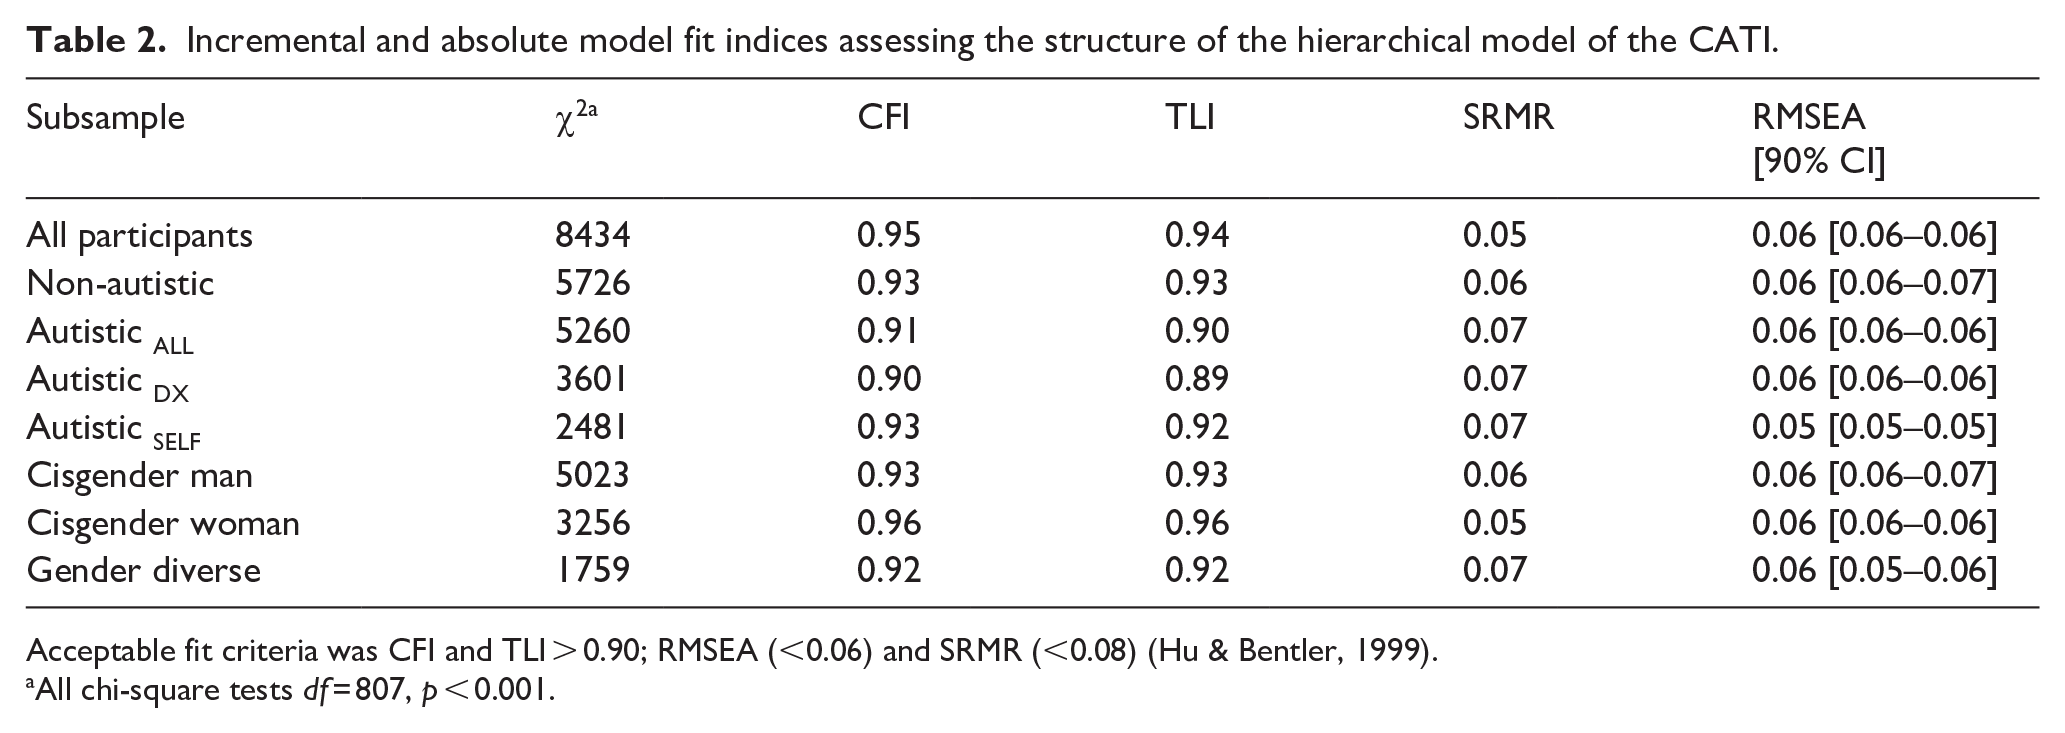
Acceptable fit criteria was CFI and TLI > 0.90; RMSEA (<0.06) and SRMR (<0.08) (Hu & Bentler, 1999).
All chi-square tests df = 807, p < 0.001.
Next, we conducted a multi-group factorial analysis to determine whether the model fit was comparable between the participant groups. We first tested for invariance between the two groups of autistic participants, Autistic DX and Autistic SELF (Comparison 1 in Table 3). The finding of both scalar (‘strong’) and residual (‘strict’) invariance indicates that the hierarchical, six-factor structure showed comparable fit for the two autistic groups and that their scores can be compared directly and meaningfully (Wu et al., 2007). Given the invariance between Autistic DX and Autistic SELF groups, we combined them into a single, larger group (Autistic ALL) to test for invariance with non-autistic participants (Comparison 2 in Table 3). As with the previous test, both scalar (‘strong’) and residual (‘strict’) invariance was indicated, meaning the hierarchical factor structure was comparable in fit for the autistic and non-autistic participants.
Results of multiple-group factorial analyses assessing measurement invariance of the CATI as a function of participant subsample, comparing (1) formally diagnosed autistic and self-identifying autistic participants, (2) non-autistic and autistic participants (combined formally diagnosed and self-identifying), and (3) cisgender men, cisgender women, and gender-diverse participants.
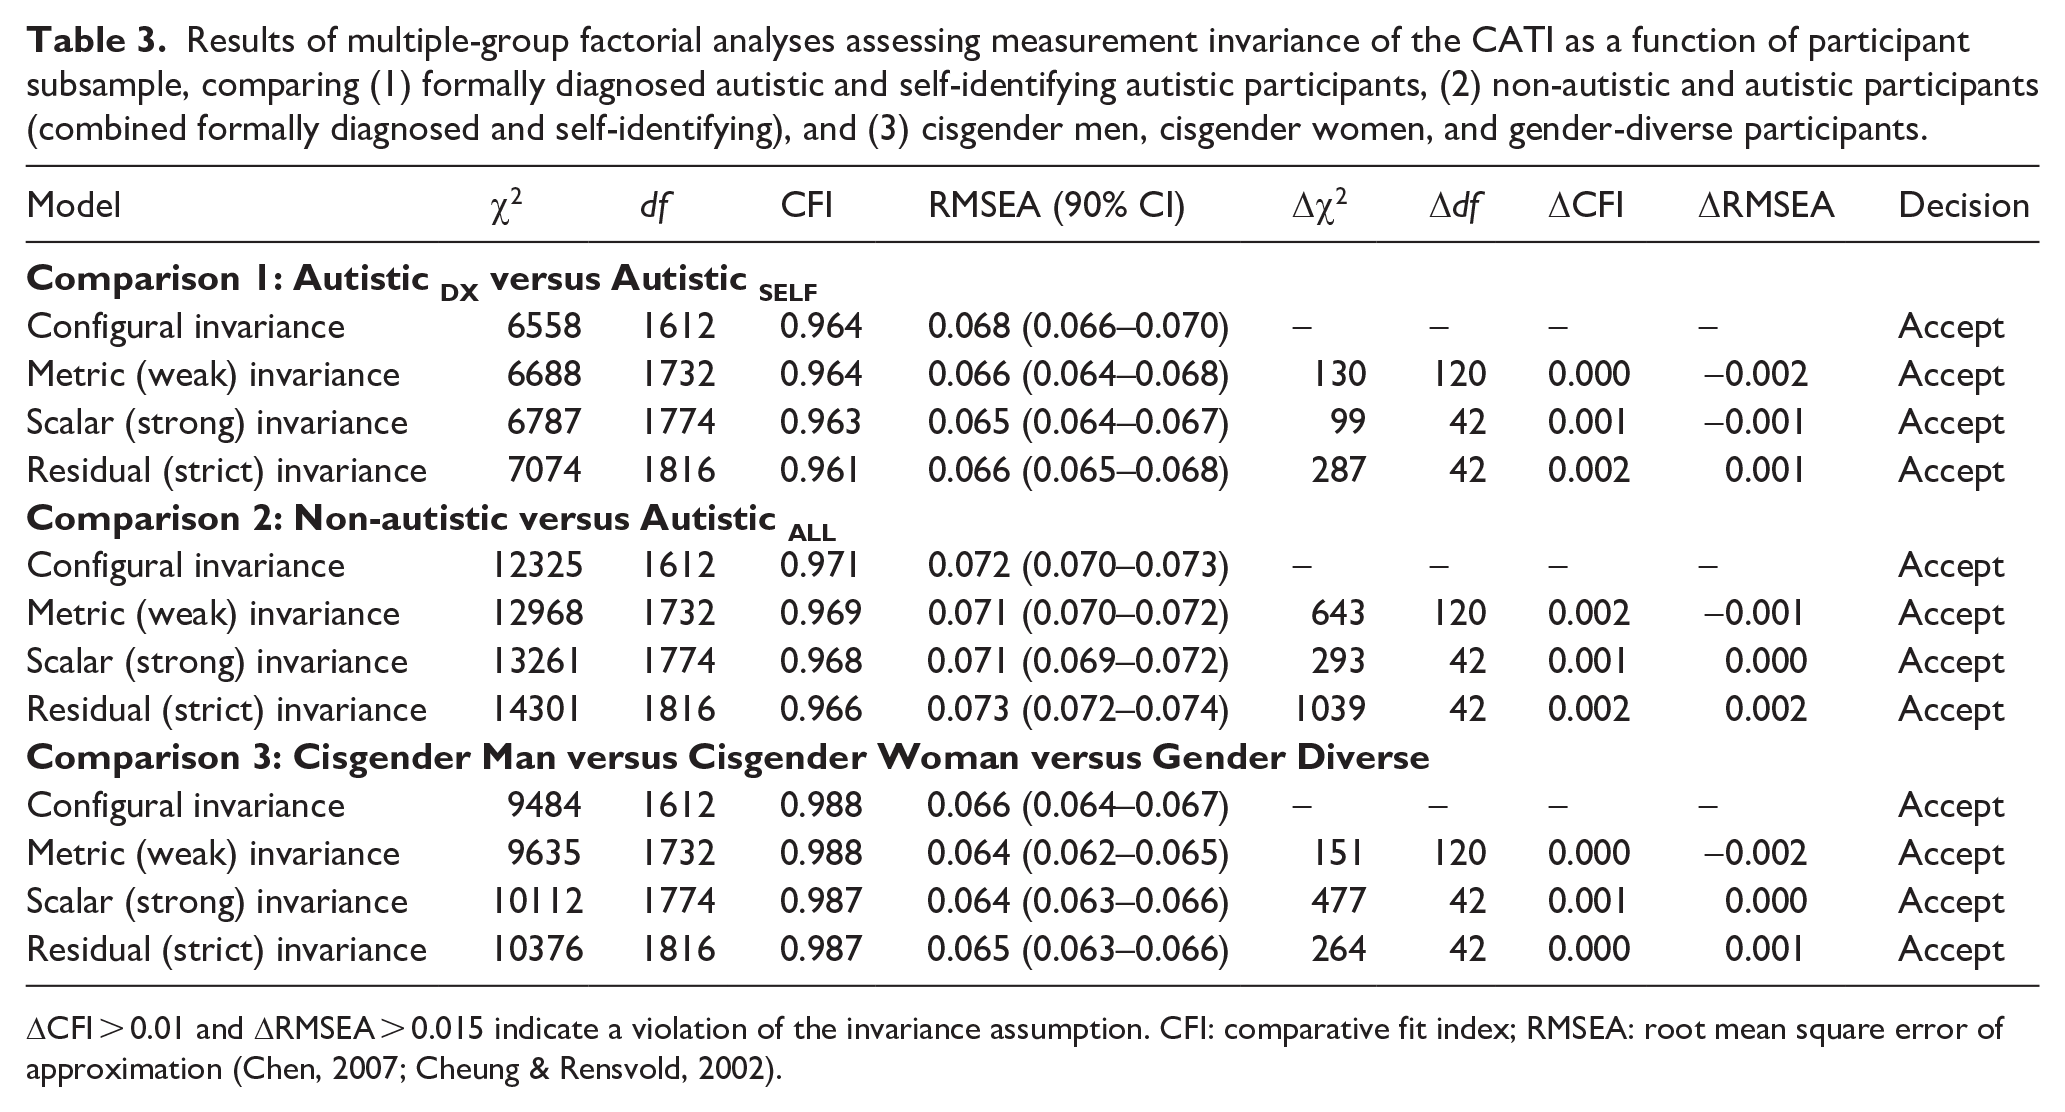
ΔCFI > 0.01 and ΔRMSEA > 0.015 indicate a violation of the invariance assumption. CFI: comparative fit index; RMSEA: root mean square error of approximation (Chen, 2007; Cheung & Rensvold, 2002).
Correlations between subscales
Next, we performed a series of correlation analyses to assess the strength of the relationships between the CATI subscale scores – for the overall sample, the two autistic participant groups, separately and combined, and the non-autistic participant group – to determine whether variations existed as a function of autism status or subgroup. Across all groups, correlations between the six subscales were significant and positive (r range = 0.12–0.64, r mean (total sample) = 0.35, largest p = 0.01; full details in Supplemental Table S5).
Internal consistency reliability
Internal consistency reliability of the CATI and its subscales calculated using both Cronbach’s alpha and McDonald’s omega are summarised in Table 4 for the total sample and separate participant groups. Cronbach’s alpha and McDonald’s omega exceeded generally accepted thresholds for all groups across the total scale, higher-order subscales and specific subscales. Omega hierarchical, which indicates the reliability of an overall general factor, was relatively lower, suggesting that the total score is not strongly representative of a single underlying autistic trait dimension. As the omega hierarchical is based on inter-subscale correlations (as opposed to inter-item correlations), these weaker reliability estimates reflect the relatively modest correlations between individual subscales (see Supplemental Table S5). Relatively weaker omega hierarchical is also not surprising given diagnostic manuals for autism refer to multiple dimensions (e.g. Diagnostic and Statistical Manual of Mental Disorders, 5th ed., text rev., DSM-5-TR; APA, 2022), and users of the CATI would likely benefit in considering the subscale scores alongside any interpretation of the total-scale score.
Internal consistency reliability (omega hierarchical) for the total sample and separately for diagnostic status and gender subgroups.
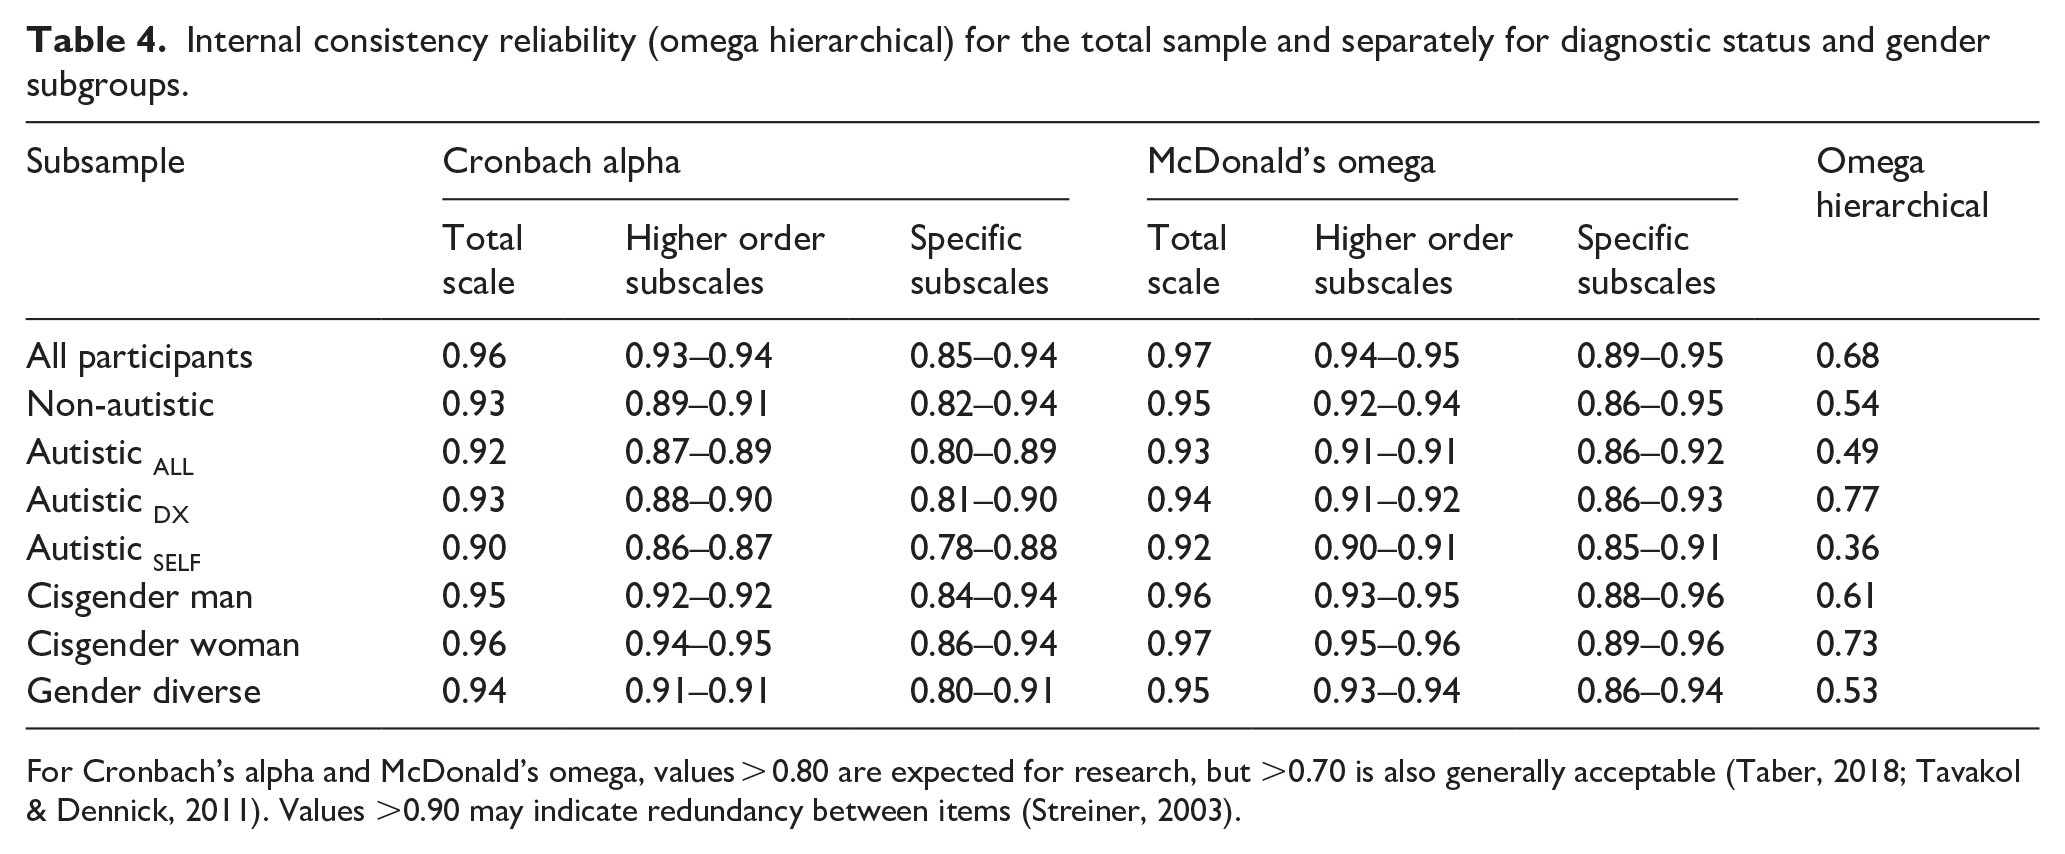
For Cronbach’s alpha and McDonald’s omega, values > 0.80 are expected for research, but >0.70 is also generally acceptable (Taber, 2018; Tavakol & Dennick, 2011). Values >0.90 may indicate redundancy between items (Streiner, 2003).
Score distributions and diagnostic-status group comparisons
Box-and-whisker plots for the CATI total-scale and subscale scores separated by diagnostic-status group revealed differences in total scores and subscale scores between non-autistic and autistic groups (Figure 2; see Table S6 in Supplemental Materials for additional statistics). While independent samples t-tests demonstrated that CATI total-scale and hierarchical subscale scores did not differ significantly between Autistic DX and Autistic SELF participants, differences were apparent on some CATI subscales. Specifically, the Autistic SELF group had higher scores on the Social Interactions subscale than the Autistic DX group. At the same time, the reverse was found for the Communication and Self-Regulatory Behaviours subscales. However, the effect sizes for these three differences were relatively small (all ds ⩽ 0.20, see Figure 2).
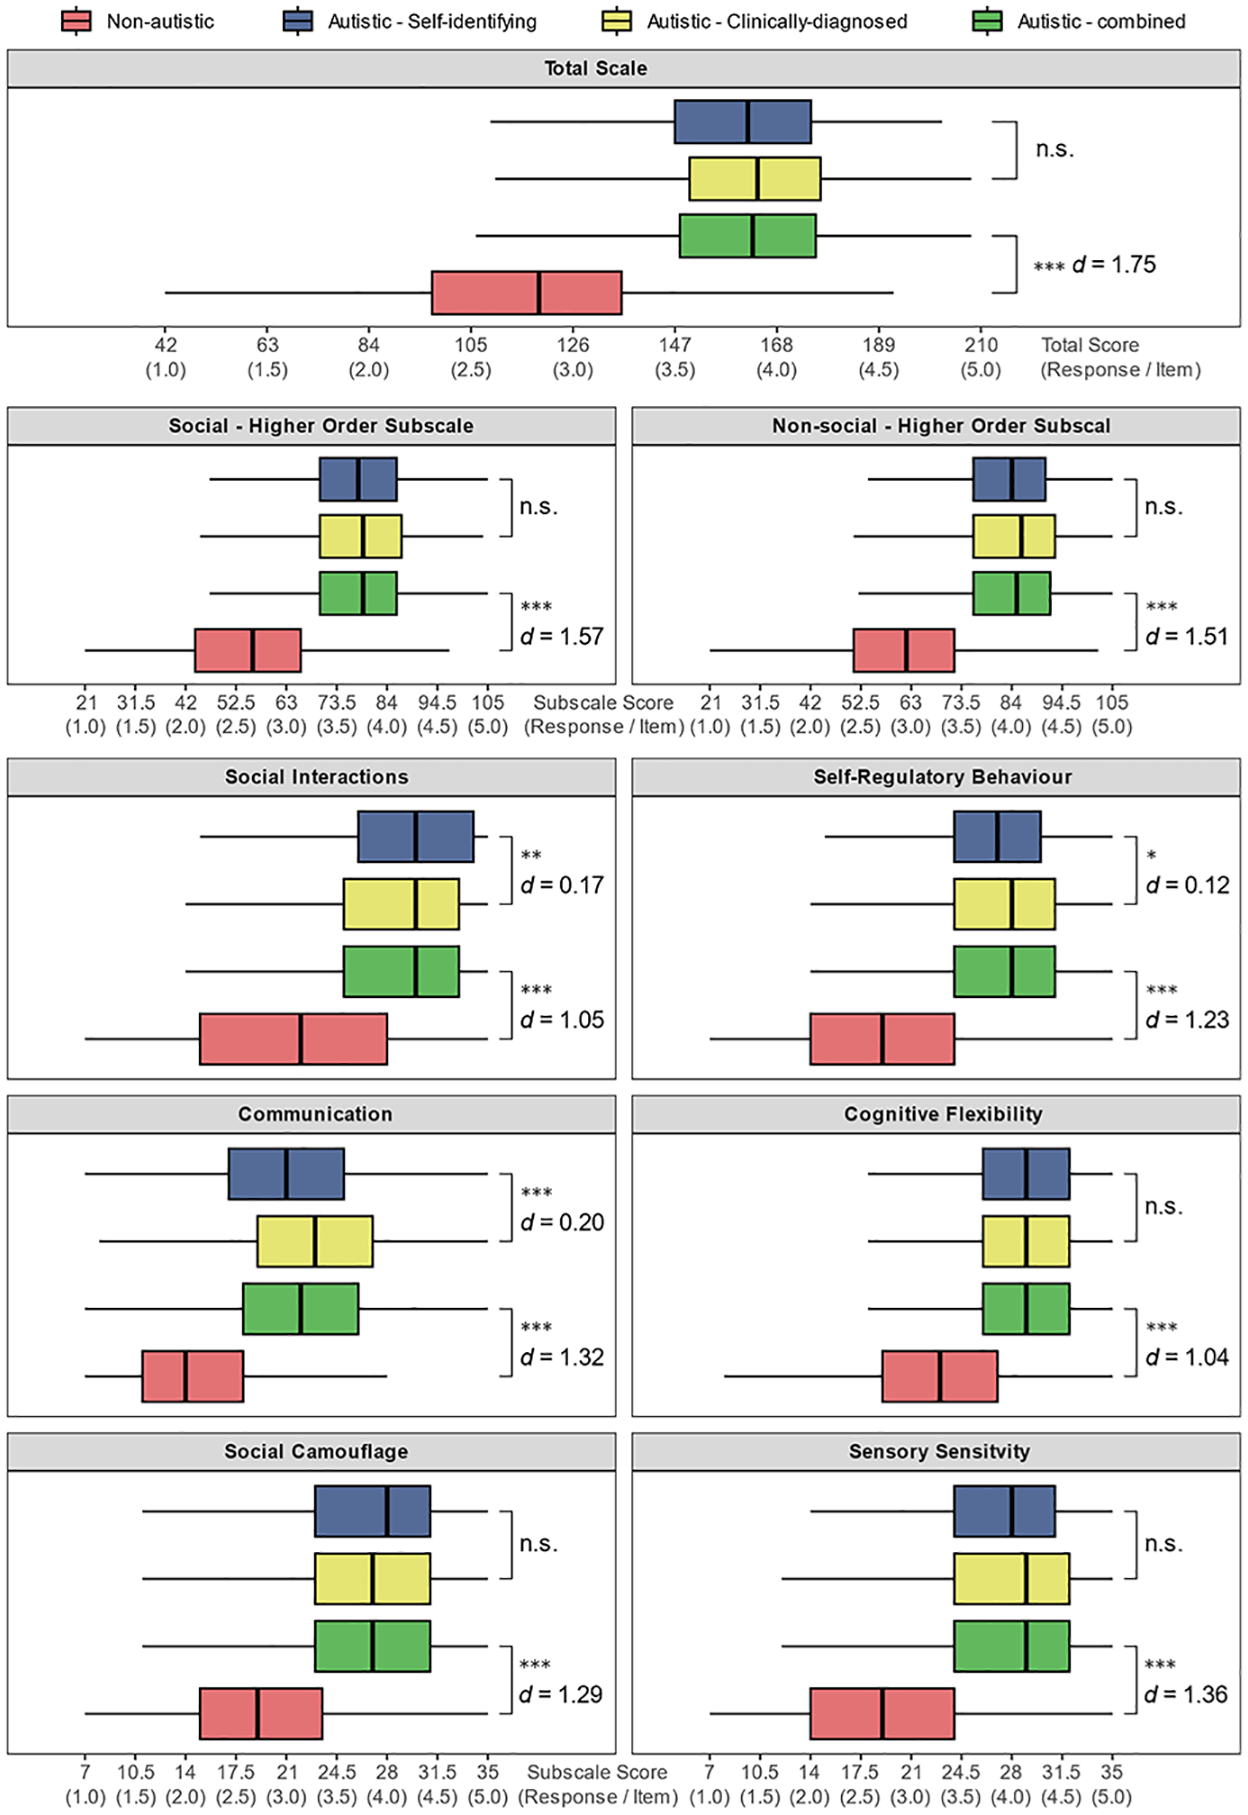
Box-and-whisker summaries of CATI total scores and subscale scores divided by participant group. The mid-line represents the group median, and the whiskers extend to the furthest score within the inter-quartile range multiplied by 1.5. Independent samples t-tests summarise comparisons between the two autistic groups (Autistic DX vs Autistic SELF) and between the non-autistic group and the combined autistic group.
These analyses were followed with a similar set of t-tests comparing non-autistic participants and the combined autistic groups (Autistic ALL). As expected, all tests were significant and showed large effect sizes (all ps < 0.001, all ds > 1.04; see Figure 2). Autistic participants scored substantially higher on the CATI total-scale score and all subscales compared to non-autistic participants.
Assessing the predictive capacity to classify autism using logistic regression analyses
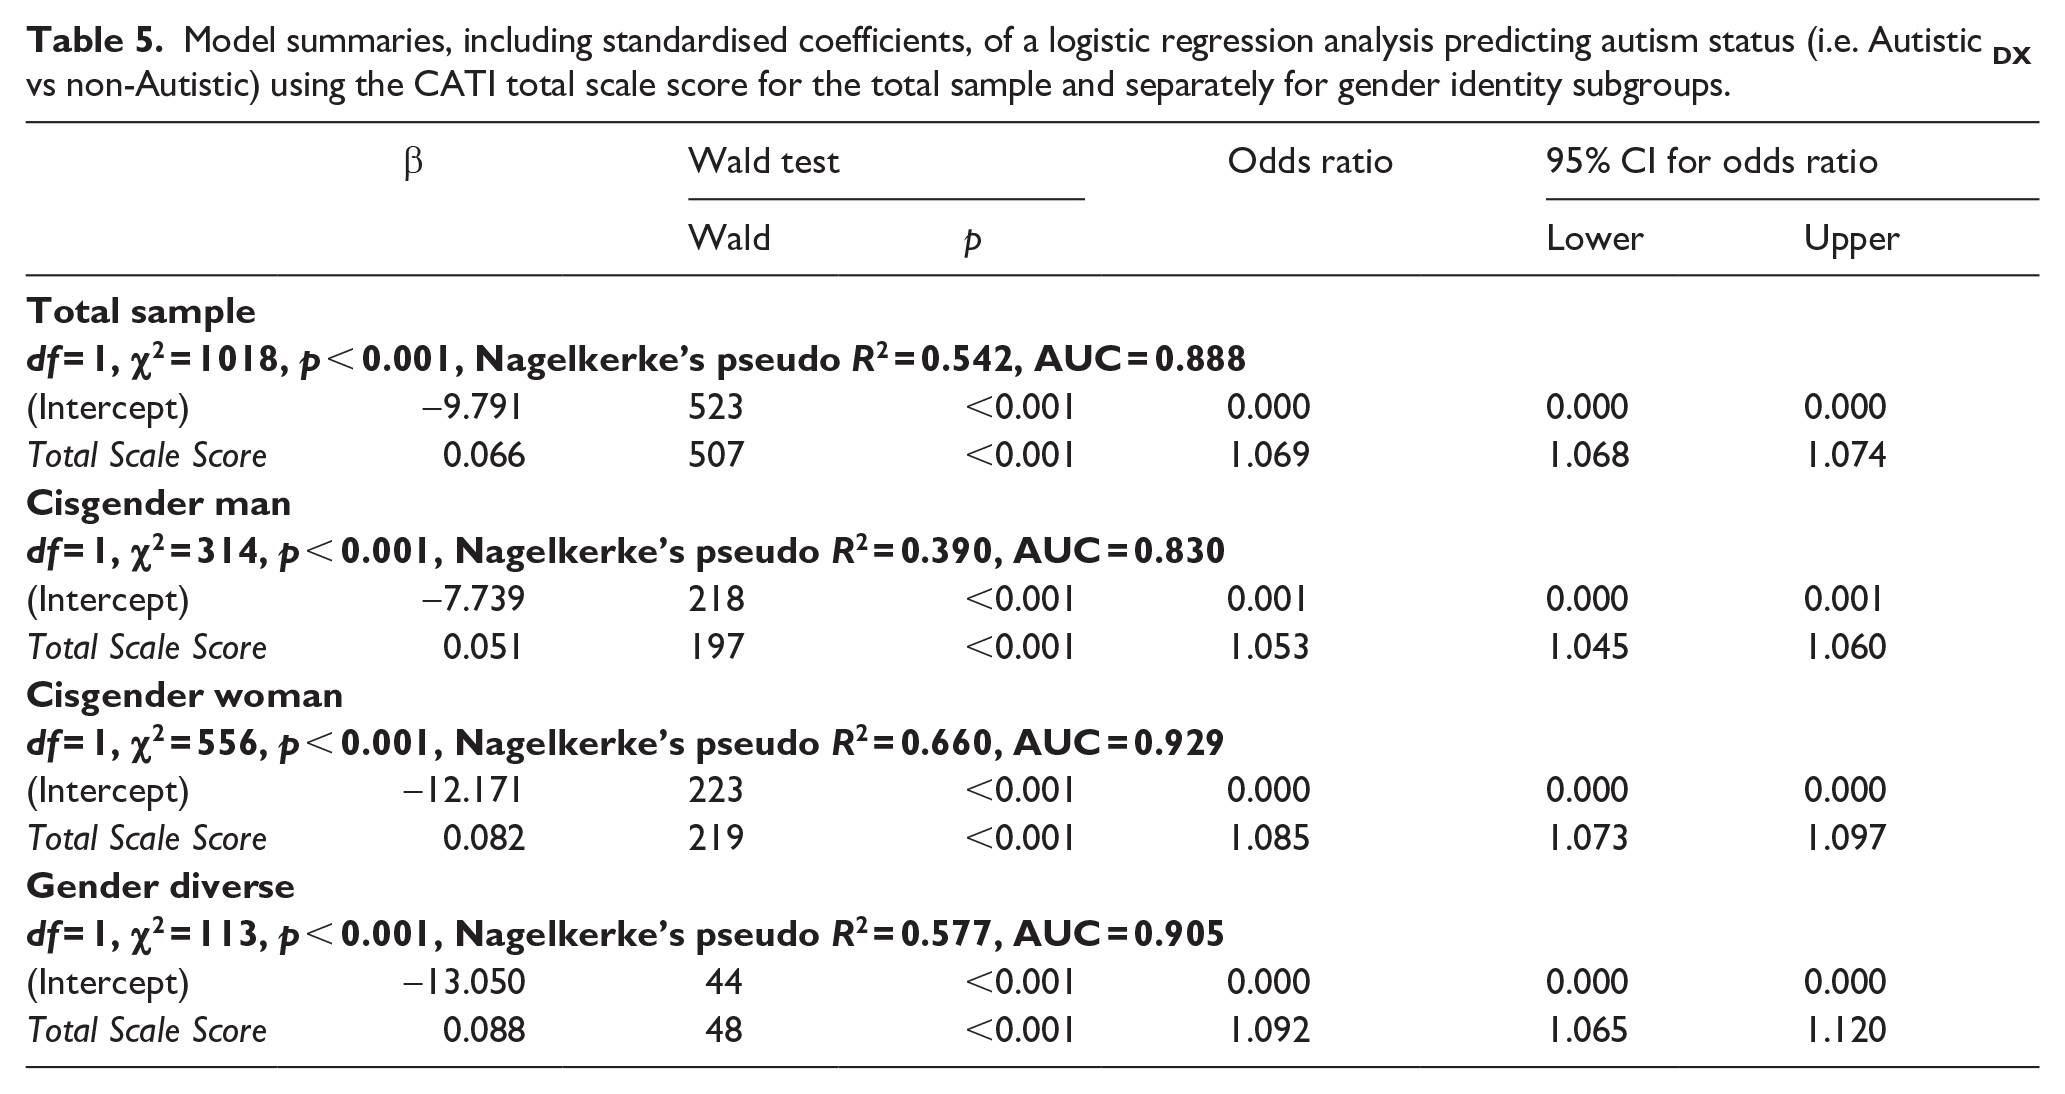
Next, criterion-related validity was assessed by performing logistic regression analyses that determined how well total-scale CATI scores distinguished between autistic and non-autistic participants. We selectively focused on non-autistic and autistic participants with a formal diagnosis participants to perform a binary logistic regression (0 = non-autistic, 1 = autistic). The results of this analysis (see Table 5) indicate that the total-scale score was a good predictor of autism status, with Nagelkerke’s pseudo R2 suggesting that this single variable accounted for 54% of the total variance in autism status. Identical logistic regressions were conducted using the two higher-order subscales and six specific subscales as predictors (see
Model summaries, including standardised coefficients, of a logistic regression analysis predicting autism status (i.e. Autistic
Sensitivity, specificity, and a useful ‘cut-off’ for classifying autism
While the CATI was initially designed for assessing autistic traits in non-autistic people, it potentially has additional utility as a screener for identifying possible autism in research, clinical, and personal settings. To support this utility, we identified the optimal threshold score that best discriminated between autistic participants who reported having a formal diagnosis (Autistic DX) and non-autistic participants. A score of 147.5 was associated with the maximum possible combined specificity (87.41%) and sensitivity (77.20%) (see Table 6 for confidence intervals). A 95% confidence interval (10,000 ordinary bootstrapped samples) of 140.5–150.5 around the threshold was calculated, indicating the greatest classification uncertainty score range.
Classification indices and 95% bootstrapped confidence intervals (10,000 samples), including ‘best’ total-scale score thresholds for discriminating non-autistic and diagnosed autistic participants across the total sample and separately by gender.
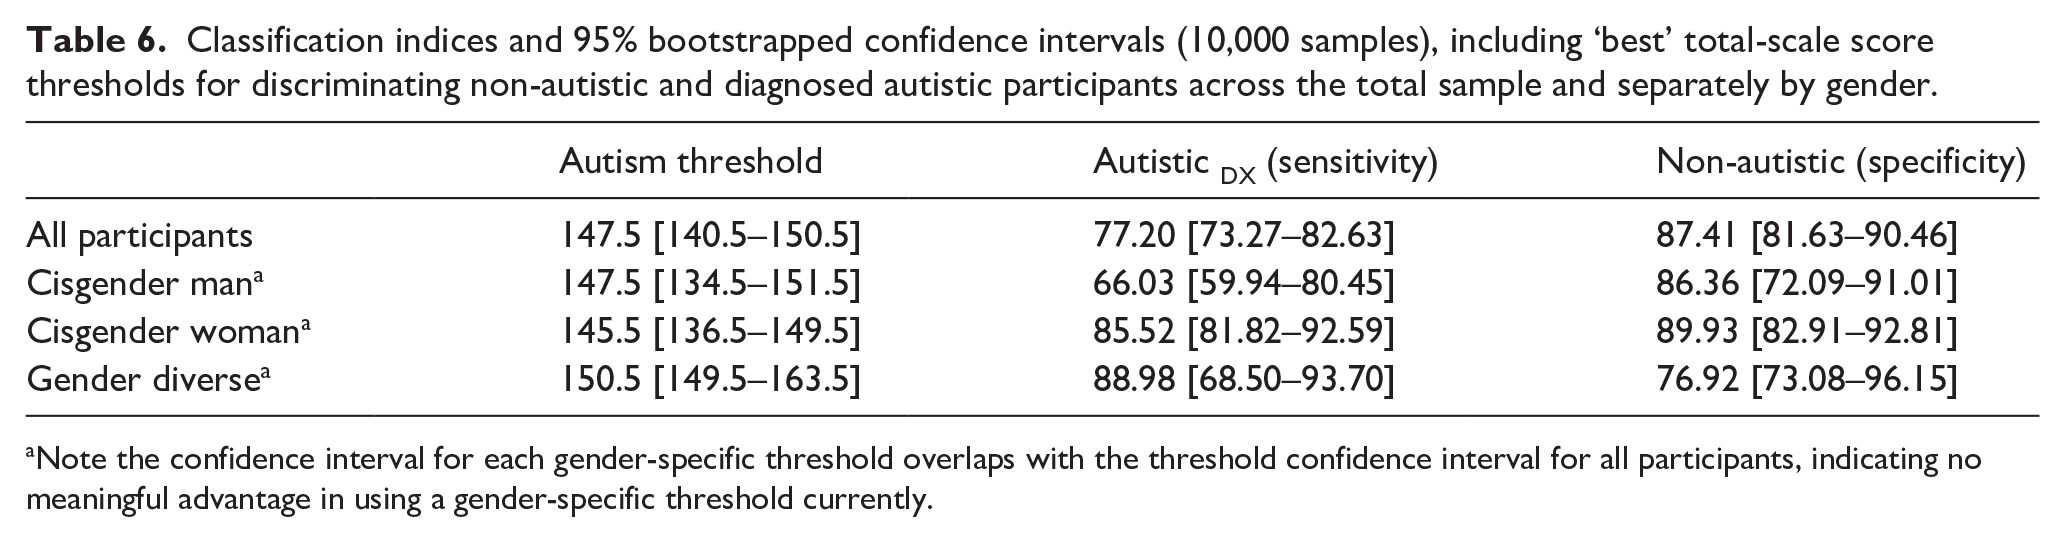
Note the confidence interval for each gender-specific threshold overlaps with the threshold confidence interval for all participants, indicating no meaningful advantage in using a gender-specific threshold currently.
Assessing the interaction between gender and autism on CATI scores
Having identified satisfactory psychometric properties for the CATI when considering the overall sample, we next examined the psychometric properties in separate gender groups. We conducted a series of analyses like the first but employing gender identity (cisgender man, cisgender woman and gender diverse) as an additional grouping factor, with the former two categories representing sex-assigned-at-birth differences and gender-diverse participants also represented. Our analysis revealed little meaningful distinction between formally diagnosed and self-identifying autistic participants; we, therefore, combined these groups to enable a more robust examination of potential sex and gender differences.
Verifying the factor structure using confirmatory factor analysis
As a first step, using separate confirmatory CFAs, we tested the goodness of fit for the hierarchical model of the CATI for each of the three gender groups, collapsed across autism group. The results (summarised in Table 2) indicate that all groups showed levels of fit at least ‘fair’ and often ‘good’ without substantial variability in fit indices between the groups.
Measurement invariance
Having established that model fits were satisfactory for each gender group independently, we then directly compared model fit for the hierarchical model as a function of gender (cisgender man vs cisgender woman vs gender diverse), collapsed across autism group. As before, a series of factor models were tested with greater restrictions on model parameters implemented in subsequent models and with scalar (strong) invariance typically required to make meaningful comparisons of factor scores between different groups. The data (summarised in Table 3) provide evidence for measurement invariance, indicating that the scale structure does not differ substantially as a function of gender and autism status and that, therefore, total-scale and subscale scores between these groups may be compared directly and meaningfully.
Correlations between subscales
Having established measurement invariance for autism status and gender, we then explored correlations between subscales for each gender. Significant positive correlations between all six subscales were evident across all three gender groups (r range = 0.23–0.66, r mean (all gender groups) = 0.51, largest p < 0.001; full details in
Internal consistency reliability
Internal consistency was assessed for each comparison group using a set of reliability analyses identical to those used in the first section (see Table 4). As before, Cronbach’s alpha and McDonald’s omega values were generally acceptable for the total scale and subscales. Again, omega hierarchical was relatively lower, suggesting caution when solely interpreting the total-scale alone and encouraging the use of the subscales.
Score distributions and group comparisons
To illustrate differences in the distribution of total-scale and subscale scores as a function of both autism status and gender, box-and-whisker plots were generated and annotated with Tukey’s Honestly Significant Difference (HSD) test outcomes (see Figure 3; see
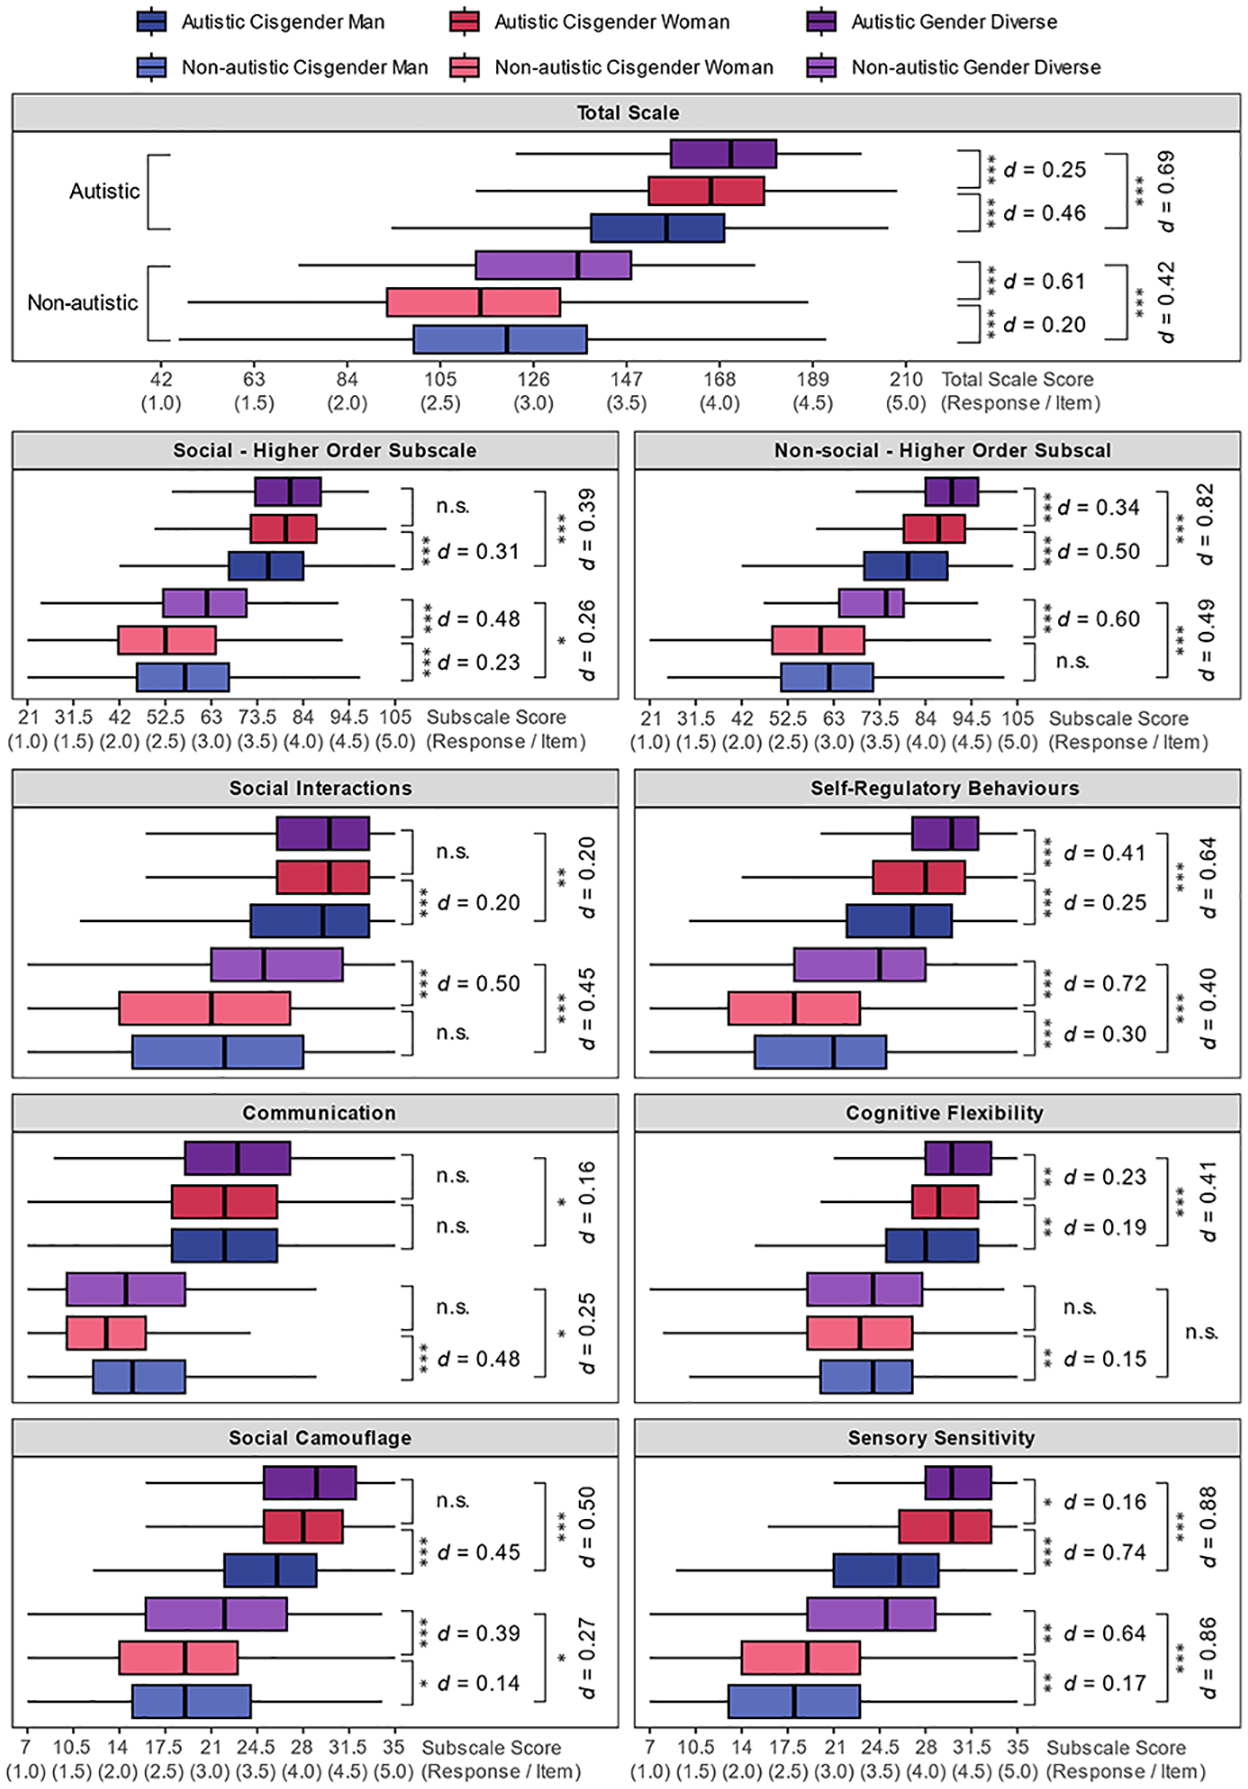
Box-and-whisker summaries of CATI total and subscale scores divided by autism group and gender. The mid-line represents the group median, the box represents the inter-quartile range, and the whiskers extend to the furthest score within the interquartile range multiplied by 1.5. Independent samples t-tests summarise specific gender comparisons within the autism groups.
With respect to subscales, a complex pattern of gender differences was evident across the six autistic trait dimensions. Among non-autistic participants, the gender-diverse participants showed substantially higher scores for Social Interactions, Social Camouflage, Self-Regulatory Behaviour and Sensory Sensitivity than cisgender men and cisgender women. Communication scores were lowest for cisgender women and comparable between cisgender men and gender-diverse participants. In contrast, Cognitive Flexibility scores were broadly similar across gender categories (largest d = 0.15).
Among autistic participants, cisgender women and gender-diverse participants showed higher Social Camouflage and Sensory Sensitivity scores than cisgender men, while gender-diverse participants showed the highest scores for Self-Regulatory Behaviour. In contrast, Social Interaction and Communication scores were relatively similar across gender groups (largest d = 0.21). Cognitive Flexibility scores increased from cisgender men to cisgender women and then to gender-diverse participants. Interestingly, the largest differences were observed on the Sensory Sensitivity subscale among autistic participants, where cisgender women and gender-diverse participants showed much higher scores than cisgender men (both ds > 0.78).
Gender differences in performance of classifying autism
Next, using binomial logistic regression analyses, we assessed the capacity of the CATI total-scale scores to discriminate between the Autistic ALL and non-autistic participants in each gender group (see Table 5). Nagelkerke’s pseudo-R2 was largest for cisgender women, followed by gender-diverse participants, and smallest for cisgender men, with the models accounting for 66%, 58% and 39% of the total variance, respectively.
Finally, we calculated gender-specific thresholds for identifying autism using the same calculation procedure used for the overall sample. Total-scale scores of 147.5, 145.5 and 150.5 maximised the discriminability of autistic and non-autistic participants for cisgender men, cisgender women and gender-diverse participants, respectively. However, as all the 95% confidence intervals around these thresholds (see Table 6) overlapped with each other and the gender-nonspecific threshold of 147.5 previously reported, the current data suggests there is no meaningful advantage in using gender-specific autism thresholds. CATI users are recommended to use the general threshold of 147.5, noting the 95% confidence interval of 140.5–150.5 around the threshold.
Discussion
The present study significantly extends the original psychometric analysis of the CATI (English et al., 2021) by providing the first psychometric evaluation that includes a large sample of autistic and non-autistic people. The psychometric performance of the CATI in both diagnosed and self-identifying autistic participants was comparable and largely distinguishes autistic and non-autistic groups. Furthermore, the structure and reliability of the CATI was found to be comparable across different genders, including gender-diverse participants, suggesting that the CATI may be appropriate across a broad demographic range. We now examine the impact of our findings in the broader autism context.
General psychometric performance
Our analyses permitted a much deeper psychometric examination of the CATI than English et al. (2021) achieved, and the results are encouraging in terms of a clear identification of phenotypic differences for autistic and non-autistic populations. A CFA for the total sample produced fit indices supporting a hierarchical factor structure of the CATI with two broader higher level factors, each subsuming three lower level factors. Critically, this factor structure was supported across all three autism groups – formally diagnosed autistic adults, self-identifying autistic adults and non-autistic adults from the general population. This psychometric similarity was further supported by the observed measurement invariance between the autistic and non-autistic groups; thus, there were no meaningful differences in how the different groups completed the CATI, and their total and subscale scores could be meaningfully compared. Reliability analyses were similarly supportive of this perspective, with total-scale and subscale Cronbach’s alpha and McDonald’s omega values exceeding the minimum of 0.70 recommended for research purposes for the overall sample and for each individual group of autistic and non-autistic participants (Taber, 2018; Tavakol & Dennick, 2011). That said, omega hierarchical values were notably lower, suggesting caution when using the total-scale score alone to classify autism. This outcome is not entirely surprising – diagnostic manuals, such as the DSM-5-TR (APA, 2022), contain clinical descriptions of autism with separate social and non-social domains, and thus users of autistic trait scales and screeners should examine total-scale scores along with subscale scores in their classification making decisions.
The present study re-evaluated the cut-off for classifying autistic and non-autistic people, taking advantage of the larger sample. A total-scale score of 147.5 was found to best discriminate between diagnosed autistic and non-autistic people, achieving classification accuracy of 77% and 87%, respectively, for these two groups. These values should be particularly useful for clinicians wishing to introduce the CATI into screening procedures. The classification rates are respectable, considering the scale was not developed first and foremost as a screening tool and given the continuum-like nature of autism across the general population. The total-scale threshold of 147.5 and above is higher than that calculated in the original study (134 and above; English et al., 2021), possibly due to using a larger, more representative autistic sample in the current study. The calculation of a confidence interval for the total-score threshold (i.e. 140.5–150.5) is intended to emphasise particular caution in interpreting individual scores within this range.
Similarity of formally diagnosed and self-identifying autistic participants
A notable outcome of our study is the high concordance between formally diagnosed and self-identifying autistic participants across all analyses and the finding of measurement invariance for the factor structure across the two groups. While the two groups differed significantly on several subscales, the effects were relatively small (i.e. d ⩽ .20; Cohen, 2013). Furthermore, the differences were not always in the suspected direction (i.e. that self-identifying autistic people would have lower scores), suggesting that self-identifying autistic people may not simply be displaying ‘milder’ traits compared to those who have received a formal diagnosis. Comparable similarities have been noted on other measures – for example, Sturm et al. (2024) reported striking similar psychometric properties on the RAADS-R between adults with an autism diagnosis, and adults self-identifying as autistic without a diagnosis.
One interpretation of the high level of similarly between self-identifying and clinically diagnosed autistic participants in the present study is that the two groups are similar except for the path towards autistic identity. If true, this would tentatively support the inclusion of self-identifying autistic people in autism research, which would yield several benefits, such as increasing the potential pool of ‘autistic’ participants available for research studies and make autistic samples more representative by including people who lack ‘official’ diagnoses for various reasons (e.g. gender biases, limited access to diagnostic services and prohibitive costs of diagnostic evaluations; (Anderson et al., 2018; Botha et al., 2020; Kapp et al., 2013; Lewis, 2017; Lockwood Estrin et al., 2021). However, work using other screening instruments has tended to find low concordance between adults identified as autistic using existing screening instruments and their likelihood of receiving a clinical diagnosis (for review, see Wigham et al., 2019). It is possible that previous screeners simply underperformed in identifying autism, and a sufficiently well-designed screening instrument would not face this issue, but the CATI remains untested in this regard.
To our knowledge, no research has examined what proportion of self-identified autistic adults who seek formal assessment ultimately receive a clinical autism diagnosis. Understanding to what extent clinicians and formal diagnostic methods agree with self-identification is an issue that is well worth investigating further. The formation of an autistic identity, either through self-identification or diagnosis, contributes positively to the mental health and well-being of autistic people (Bervoets & Hens, 2020; Davies et al., 2023; Fletcher-Watson, 2023; Leedham et al., 2019; Lewis, 2016; Lilley et al., 2021), facilitating access to appropriate support that can improve quality of life, and shifting perceptions from negative labelling to a more nuanced understanding of personal identity (Arnold et al., 2020; Cerda et al., 2023; Davies et al., 2023; Huang et al., 2022a, 2022b; Hume & Burgess, 2021; McDonald, 2020; Smith-Young et al., 2020). Establishing reliable and accessible pathways to self-identity and developing ways to validate self-identity, potentially with tools such as the CATI, would magnify the positive outcomes described above.
Gender differences
The original work developing the CATI included a limited set of analyses comparing cisgender men and women, reporting the crucial finding of measurement invariance and several sex differences between cisgender men and women (English et al., 2021). Here, we extended these analyses by examining the interaction between gender and autism status, as well as considering gender-diverse participants in addition to cisgender men and women. Fit indices calculated from separate CFAs indicated that the hierarchical factor structure of the CATI was supported in cisgender men, cisgender women and – for the first time – in gender-diverse adults. Reliability indices for each gender were similar to that for the overall sample. Together, these findings provide confidence in using the CATI across gender identities.
While the psychometric properties of the CATI across genders were similar, several gender differences in the total-scale and subscale scores were evident, with a relatively complex pattern emerging. Among non-autistic participants, cisgender men had particularly high Communication and Self-Regulatory Behaviour scores compared to cisgender women. Among autistic participants, cisgender women reported more pronounced autistic traits than cisgender men for the total scale and every subscale except Communication. Thus, taking the autistic and non-autistic participants together, cisgender women showed a larger range of scores than cisgender men, consistent with outcomes from the AQ (Baron-Cohen et al., 2001). Finally, gender-diverse participants reported higher scores for the total scale and most of the subscales compared to cisgender men and cisgender women, with these differences observed within both the autistic and non-autistic groups. However, the gender differences were much more pronounced among the non-autistic groups, where the gender-diverse group reported trait levels midway between the levels reported by the cisgender non-autistic groups, and the autistic groups (consistent with Warrier et al., 2020).
One general outcome from our study is that gender differences in traits cannot be assumed to be identical for autistic and non-autistic people, as we report many instances where gender differences were found for one group but not the other, or they presented in opposite directions. For example, while autistic cisgender women showed higher Self-Regulatory Behaviour and Cognitive Flexibility scores relative to autistic cisgender men, the reverse was true for non-autistic participants (i.e. cisgender women < cisgender men).
Notably, while we found traits associated with social-camouflaging behaviours and sensory sensitivity to be markedly higher in autistic cisgender women compared to autistic cisgender men, these dimensions are often underrepresented (or not represented at all) in older measures of autistic traits (Baron-Cohen et al., 2001; Hurley et al., 2007). This historical absence of the representation of trait dimensions more characteristic of autistic cisgender women compared to autistic cisgender men is likely linked to the traditional concept of autism as a condition predominantly affecting males (Aykan et al., 2020). On one hand, the inclusion of traits such as heightened sensory sensitivity and social camouflage in the CATI may serve to narrow the gender gap in autistic traits. However, the inclusion of these traits may also reduce diagnostic specificity when attempting to discern autism from other conditions given many other neuropsychiatric conditions feature traits such as altered sensory sensitivity or anxiety-linked social masking (Ahmmed & Mukherjee, 2021; Bijlenga et al., 2017; Miller et al., 2021).
Furthermore, the diagnostic process for gender-diverse people or cisgender women can be complicated by additional factors, including stigma or gender-based interpretation biases from referral sources (e.g. family, school, general practitioners) and a greater likelihood of diagnostic overshadowing by other conditions (e.g. other neurodevelopmental disorders, anxiety, depression) or misdiagnoses (e.g. borderline personality disorder or gender dysphoria) (Bysph et al., 2023; Hilton et al., 2022; Lai et al., 2015). The consequence of ‘biased’ assessment criteria is that they likely do not fully represent the breadth of autistic presentations (here, specifically non-male presentations), meaning women were more likely to miss opportunities for diagnosis (potentially accounting for a later average age of diagnosis in women compared to men), and that cisgender women needed ‘more’ traits before a diagnosis was conferred (D’Mello et al., 2022; Glidden et al., 2016; Warrier et al., 2020). The latter contention is supported by the current study (i.e. autistic cisgender women reported higher scores than autistic cisgender men) and in previous reports (e.g. using the AQ – Baron-Cohen et al., 2001). Furthermore, as diagnostic criteria have now broadened to be generally more inclusive, prevalence rates between males and females have become considerably more comparable (Zeidan et al., 2022).
The observation that self-identified gender-diverse participants showed higher scores in several trait domains could reflect the fact that some autistic characteristics may overlap with the characteristics of gender-diverse people. For example, gender-diverse people can show camouflaging to ‘pass’ as a particular gender or increased sensory sensitivities towards aspects of their body that are nonconformant with their sense of gender (Hilton et al., 2022; Kallitsounaki & Williams, 2023). Future assessments might better distinguish between characteristics that are linked to both autism and gender, though it is unlikely that such traits can be perfectly disentangled. Similarly, there is growing recognition that the prevalence of autism is substantially higher among gender-diverse people than among cisgender men and cisgender women (Nobili et al., 2018; Warrier et al., 2020), with a recent meta-analysis estimating rates of autism to be up to 11 times higher for gender-diverse people compared to the general population (Kallitsounaki & Williams, 2023). Given the interaction between gender diversity and autism and that gender-diverse people are estimated to account for 0.1%–2% of the population (Goodman et al., 2019), future research might concentrate on confirming whether autistic trait measures are psychometrically appropriate for gender-diverse people in addition to cisgender men and women.
Limitations and future research
The current study develops the promising findings of the original description of the CATI (English et al., 2021) and highlights its utility as a validated and up-to-date measure of autistic traits. Nevertheless, several outstanding issues remain to be addressed. First, our sample of diagnosed autistic participants relied on self-reporting of a diagnosis without confirmation by a clinician. We also did not distinguish between diagnostic methods or historical diagnostic categories such as Asperger’s syndrome. Future studies should aim to test the replicability of our findings in a clinically confirmed autistic population.
Further to this point, and as noted above, the real-world application of the CATI as a screening tool should be tested by examining how well the CATI identifies subsequent autism diagnoses in adults undertaking an autism assessment. As outlined in studies that have examined this issue using other screening instruments (for review, see Wigham et al., 2019), the results have tended call into question the accuracy of screening instruments in clinical settings. Until the CATI’s predictive capacity is tested in such applied settings, clinicians should refrain from relying heavily on the results provided by the CATI in their decision-making process. Similarly, future research should examine self-identification accuracy more deeply, particularly the concordance between self-identification and subsequent clinical diagnosis (assuming accurate diagnoses), and involving groups not extensively represented in this study (e.g. multiply marginalised or of minority racial/ethnic backgrounds).
Second, the classification accuracy of the proposed scoring thresholds is intrinsically related to how accurately autism is diagnosed and self-reported in our samples and the extent to which people identifying as non-autistic have been adequately screened. For example, it has been argued that females are historically underdiagnosed (Belcher et al., 2022; Lockwood Estrin et al., 2021) and may require relatively ‘more’ autistic traits than their male counterparts before a positive diagnosis is proffered. As diagnostic practices change over time and autism in cisgender women is better recognised, future studies like the current one may see downward trends in the overall trait levels of autistic cisgender women, with the result of potentially lower thresholds than what we report here. A similar outcome may also be apparent for gender-diverse people, as autism becomes better identified for this group and more nuanced analyses are developed for specific gender identities (e.g. nonbinary, trans, genderfluid). These issues affect all autism screening tools to some extent, given that classification accuracy is intrinsically linked to the accuracy of current diagnostic practices.
It is well established that autism co-occurs with a range of conditions (Mosner et al., 2019), increasing the complexity of diagnosis. We did not distinguish between autism presenting with the many other conditions reported to co-occur with autism (e.g. anxiety disorders, attention-deficit hyperactivity disorder, obsessive-compulsive disorder) (Johnston et al., 2013; Mosner et al., 2019). Future use of the CATI should examine the impact of co-occurring conditions on autistic traits, an issue the present research team is actively working on, in addition to how well the CATI can accurately classify autism in people with common co-occurring conditions in the context of screening.
Finally, future work should examine the outcomes of several other psychometric tests to determine the extent to which the CATI is a useful clinical and research tool. Test–retest reliability should be established to assess the stability of the CATI at different measurement time points. While convergent validity and classification performance of the CATI compared to the AQ (Baron-Cohen et al., 2001) and BAPQ (Hurley et al., 2007) was examined in the original study, similar tests should be performed against more contemporary measures such as the SRS-A (Aldridge et al., 2012) and RAADS-R (Ritvo et al., 2011). Comparisons should also be made against the CATI-R (Hechler et al., 2025), a heavily modified version of the original CATI that aimed to improve further the clarity and respectfulness of language (and published late in the revision process of the present study). While on the surface, the alternatively worded and edited CATI-R may appear interchangeable with the original, it is highly likely that the underlying psychometric properties differ and may not be directly applicable to each other (e.g., the threshold for identifying autism calculated in the present study may not be valid in the CATI-R).
Conclusion
The concept of autistic trait dimensions that can be assessed in general and clinical populations remains relevant to autism researchers, clinicians making diagnostic decisions and members of the public seeking to understand autism and, potentially, themselves better. To that end, the available tools for measuring autistic traits must reflect the current understanding of autism in an accessible and respectful manner. The CATI is one such measure. Our findings build upon the strong psychometric results reported for the CATI (English et al., 2021) by demonstrating, in a large sample of diagnosed and self-identifying autistic participants, that the CATI and its six subscales continue to demonstrate a consistent factor structure and high levels of reliability. Furthermore, measurement invariance was established as a function of autism diagnostic status and gender, meaning that CATI scores can be meaningfully interpreted and compared between the different demographic groups, crucially including those of gender-diverse backgrounds. These findings hold promise for researchers and clinicians seeking alternatives to older general measures of autistic traits that may not reflect the currently known breadth of autistic traits. However, we also stress that further psychometric study is encouraged to assess the usefulness of the CATI in a clinical context.
Supplemental Material
sj-docx-1-aut-10.1177_13623613251347740 – Supplemental material for Psychometric evaluation of the Comprehensive Autistic Trait Inventory in autistic and non-autistic adults
Supplemental material, sj-docx-1-aut-10.1177_13623613251347740 for Psychometric evaluation of the Comprehensive Autistic Trait Inventory in autistic and non-autistic adults by Michael CW English, Rebecca E Poulsen, Murray T Maybery, David McAlpine, Paul F Sowman and Elizabeth Pellicano in Autism
Supplemental Material
sj-zip-1-aut-10.1177_13623613251347740 – Supplemental material for Psychometric evaluation of the Comprehensive Autistic Trait Inventory in autistic and non-autistic adults
Supplemental material, sj-zip-1-aut-10.1177_13623613251347740 for Psychometric evaluation of the Comprehensive Autistic Trait Inventory in autistic and non-autistic adults by Michael CW English, Rebecca E Poulsen, Murray T Maybery, David McAlpine, Paul F Sowman and Elizabeth Pellicano in Autism
Footnotes
Acknowledgements
We wish to thank Jack Brett for making available the ‘Sample 2’ data for analysis. We additionally thank the autism researchers and clinicians, and, most importantly, the autistic people, who have made contributions and provided feedback on the development and direction of the CATI.
Author contributions
Declaration of conflicting interests
The author(s) declared no potential conflicts of interest with respect to the research, authorship and/or publication of this article.
Funding
The author(s) disclosed receipt of the following financial support for the research, authorship and/or publication of this article: This work was partially supported by an Australian Research Council Discovery Project grant awarded to M.T.M. (DP190103286) and a Simons Foundation SFARI Grant awarded to R.E.P., D.M., P.F.S., and E.P. (RFA-873809). M.C.W.E. is supported by Embrace at The Kids Research Institute Australia.
ORCID iDs
Availability of data and materials
The datasets generated and analysed during the current study are not publicly available but may be obtained from the corresponding author on reasonable request.
Supplemental material
Supplemental material for this article is available online.
Notes
References
Supplementary Material
Please find the following supplemental material available below.
For Open Access articles published under a Creative Commons License, all supplemental material carries the same license as the article it is associated with.
For non-Open Access articles published, all supplemental material carries a non-exclusive license, and permission requests for re-use of supplemental material or any part of supplemental material shall be sent directly to the copyright owner as specified in the copyright notice associated with the article.