
Abstract
A recent study suggests that parent report on the Social Symptom and Prosocial scales of the Childhood Joint Attention Rating Scale provides useful information about differences in the social development of school-aged autistic children. The current study provides additional psychometric data on the Childhood Joint Attention Rating Scale regarding the longitudinal stability of its scales, its construct validity, and its sensitivity to differences in the social development of clinical samples of children. The study included 64 autistic children without co-occurring intellectual disability, 27 children with symptoms of attention deficit/hyperactivity disorder, and 36 neurotypical children between the ages of 10 and 18 years. Results indicated that scores from parent report on the Childhood Joint Attention Rating Scale were stable across a 15-month period in middle childhood for the three groups and groups received significantly different Childhood Joint Attention Rating Scale scores. Finally, construct validity was supported by the observation of correlations between tester observations of items on Autism Diagnostic Observation Scale-2 Social Affect and subsequent parent report on the Childhood Joint Attention Rating Scale. These results provide further evidence that the Childhood Joint Attention Rating Scale provides meaningful and potentially unique information about prosocial and social symptom development of school-aged autistic children.
Lay abstract
This study tested a measure designed to capture social development in childhood and adolescence called the Childhood Joint Attention Rating Scale. This is important to study as most measures of social behavior are for preschool-aged children. We asked parents of 64 autistic children, 27 children with attention deficit/hyperactivity disorder, and 36 neurotypical children to fill out a new parent questionnaire designed to assess social skills. Specifically, our measure asks about both strengths and difficulties their child has with sharing experiences, engaging in cooperative efforts with others, and more. It is important to have strengths included in measures, as many autism measures only take difficulties into account. The findings of this study show that this new measure can assess social skill strengths and difficulties in children and adolescents. This measure may be useful in future research to help us understand how strengths and challenges in social behaviors develop or change throughout childhood and adolescence in autistic people.
Keywords
Understanding the social development of autistic children is one of the abiding goals of autism science (Volkmar et al., 1993). Several useful quantitative measures of the social development of autistic children have been developed (for review, see Anagnostou et al., 2015; Grzadzinski et al., 2020) but many of these were designed to assess children in the first 6 years of life (McConachie et al., 2015). For a comprehensive understanding of social development, it is also important to have measures applicable to school-aged autistic children. The Childhood Joint Attention Scale (C-JARS) was developed to provide such a measure (Birkeneder et al., 2024; Mundy et al., 2017). The development of the C-JARS was guided by several goals.
First, it was important to develop a parent report measure for school-aged children because of its potential for efficient applications in large sample developmental, treatment outcome, and bio-behavioral studies (Fountain et al., 2012; Georgiades et al., 2013; Interagency Autism Coordinating Committee [IACC], 2019; Lombardo et al., 2019; Lord et al., 2015; Robinson et al., 2015; Scahill & Lord, 2004). Second, the C-JARS was designed to address the need for measures of the development of both social competence and social symptoms in research on the development of autistic children (Clarke & Lord, 2024; Locke et al., 2017; Wilkinson et al., 2022; Yager & Iarocci, 2013). Finally, it was devised to provide a measure of a specifiable bio-behavioral, developmental construct (i.e. joint attention) that research suggests is important to social communication and social competence in childhood for both neurotypical (NT) and autistic children (Bottema-Beutel, 2016; Kasari et al., 2008; Locke et al., 2017; Mundy, 2023; Mundy & Bullen, 2022; Stallworthy et al., 2023; Stephenson et al., 2021; Stout et al., 2021; Travis et al., 2001; Vaughan Van Hecke et al., 2007, 2012).
The C-JARS measures three types of joint attention, or spontaneous sharing of experience behaviors: (a) nonverbal joint attention gaze following and gaze directing behaviors, (b) verbal joint attention bids that spontaneously sharing experiences with others (e.g. confiding in others and/or directing another person’s attention to objects, events, or topics), and (c) joint attention expressed in the tendency to engage in joint action with other people (see Table 1 for example items). A pool of 60 items scored on a 5-point scale was initially created to develop the C-JARS. Factor analysis identified 56 items that converged on a single factor (Mundy et al., 2017). A single item with the lowest factor loading (.40) was removed for final pool of C-JARS research items (Birkeneder et al., 2024). Of these 55 items, the C-JARS includes 14-item Social Symptom (SS) scale and a 41-item Prosocial (PS) scale. A Summary Joint Attention Scale (SJAS) score is computed from the subscale scores by subtracting the SS scores from the PS scores (SJAS = PS – SS). Thus, this score reflects the degree to which parent report yields a higher average prosocial or symptom score for each child, with positive scores indicating more prosocial behaviors observed, whereas a negative score indicates more social symptom behaviors observed.
Examples from the Social Symptom (SS) and Prosocial (PS) Scales.

SS higher score indicates more consistent parent report of infrequent or atypical joint attention behaviors. PS higher score reflects the degree to which parents frequently observe joint attention and spontaneous sharing of experience in children.
To date, one other study has investigated the psychometrics of the subscales (Birkeneder et al., 2024). This study indicated that the C-JARS SS score displayed significant sensitivity and specificity for the autism phenotype in 8- to 16-year-old children with and without co-occurring intellectual disability. Birkeneder et al. (2024) also reported convergent and discriminant validity data that indicate that all C-JARS scores were significantly correlated with ADOS-2 Social Affect (SA) scores, but not with Restricted and Repetitive Behavior (RRB) scores in autistic children. Further, the PS but not the SS score was sensitive to differences in affiliative joint attention behavior in higher (IQ >79) and lower (IQ ⩽79) IQ subgroups and the PS score was sensitive to sex difference between boys and girls in the higher IQ subgroup.
The current study extended the psychometric evaluation of the C-JARS subscales through the exploration of five hypotheses. First, the study was designed to test the hypothesis that scores for parent reports on the C-JARS would exhibit longitudinal stability over a 15-month longitudinal interval. Longitudinal stability is a desirable characteristic of developmental outcome measures (Anokhin et al., 2022), and previous research suggests that individual difference in initiating sharing of experience may be stable across development (Mundy et al., 2017).
Second, based on previous research, the study was designed to test that hypothesis that, as a group, parent reports on the C-JARS would indicate more evidence of social symptoms and less evidence of prosocial behavior in autistic children than NT children or children with symptoms of attention deficit/hyperactivity disorder (ADHD). The ADHD children, however, were expected to display some evidence of social behavior problems (Rosello et al., 2022). Third, previous results indicate that the C-JARS may be sensitive to sex differences in social development (Birkeneder et al., 2024; Mundy et al., 2017). Other studies also suggest that girls with autism may display less evidence of difficulty with joint attention than boys (Burrows et al., 2022; Del Bianco et al., 2022). Therefore, the third hypothesis of the study was girls and boys in autism sample would display differences on PS and SS scores. Fourth, the study tested the construct validity and longitudinal stability-related hypothesis that tester observations in joint attention items on the ADOS-2 would predict parent report of C-JARS joint attention across a 30-month developmental interval in the autism sample.
The children in this study were assessed with Module 3 and 4 of the ADOS-2, which do not have identified joint attention items on the SA scale (Gotham et al., 2007). Nevertheless, on the basis of their face validity we judged unusual eye contact, facial expressions directed to examiner, share enjoyment in interaction, and reporting of events items of the Module 3 and 4 SA to be related to the construct of joint attention and spontaneously sharing experience in childhood. Measures of joint attention in infancy including modules of the ADOS-2 use indications of eye contact, facial expressions/smiling, and interaction with the tester as indicators of joint attention skills (e.g. Mundy et al., 2017; Nowell et al., 2018). Thus, the chosen items likely reflect aspects of joint attention captured in lower ADOS-2 modules and other measures of joint attention in infancy. These items have been used in previous work as indicators of joint attention ability in children and adolescents (Birkeneder et al., 2024).
Finally, criterion validity of the C-JARS was examined by testing the hypothesis that parent report on PS and SS scales would be significantly correlated with parent reports on standardized measures of social symptoms in autistic children.
Method
Participants
One hundred and forty-five children in a longitudinal study of 8- to 16-year-old autistic children’s academic and social development participated in this study (e.g. Bullen et al., 2020; Solari et al., 2019). Participants were assessed at three time points (Time 1, Time 2, Time 3) separated by 15-month intervals. Demographic and diagnostic data were collected at Time 1. C-JARS data were collected at Time 2 and Time 3. At Time 2, the study included 72 autistic children (M = 12.59 years, SD = 2.10), 34 children with symptoms of ADHD (M = 13.17 years, SD = 2.27), and 39 NT children (M = 12.69 years, SD = 2.26). 1 At Time 3, the study included 64 autistic children (M = 13.84 years, SD = 2.11), 27 children with symptoms of ADHD (M = 14.42 years, SD = 2.32), and 36 NT children (M = 14.07 years, SD = 2.37). In this sample, 73% identified as White, 13% identified as multiracial, 3% identified as Asian, and 2% indicated other racial identity not listed in the survey. One person identified as Native Hawaiian/Pacific Islander and two individuals declined to state their racial or ethnic identity. In the total sample, seven individuals indicated they identify as Hispanic or Latinx. See Table 2 for sample demographics and group differences.
Time 3 demographic characteristics and group differences for the autism, ADHD, and NT samples.

Demographic information, including FIQ, was collected at Time 1. ADOS-2 scores were not collected for the NT group. ADHD = attention deficit/hyperactivity disorder; NT = neurotypical; ADOS-2 = Autism Diagnostic Observation Scale, Second Edition; SA = Social Affect; RRB = Restricted and Repetitive Behavior.
denotes that the group is significantly different from the NT group.
All procedures in this study were performed in accordance with the ethical standards for research with human participants of the institutional and national research committee (UC Davis Office of Research Institutional Review Board Protocol 236498-14). Research participants were recruited from local elementary and high schools with flyers describing a study of academic development in students with learning problems.
Families of autistic children, children with ADHD, and NT children were recruited through several school districts in a metropolitan area of Northern California. Interested parents contacted the research team and completed a phone interview screening to determine if their child met the eligibility criteria. Autistic children were recruited if they were between the ages of 8 and 16 years, able to answers questions in complete sentences, and did not have any major coexisting medical problems that caused children to be absent for long periods of the academic year, such as a neurological, sensory, or motor disorder. Co-occurring diagnoses of ADHD and anxiety were permitted since these are common diagnoses in autistic children (Stevens et al., 2016). Children were included in the ADHD group if they had received a community diagnosis of ADHD, and had current parent report of ADHD symptoms, but did not have a co-occurring diagnosis of autism. For the purposes of this study, children with a co-occurring intellectual and developmental disability (IDD; full-scale IQ (FIQ) below 70) were not included in this study (see Birkeneder et al., 2024 for data on IDD children). Where applicable, these criteria were also used for children with ADHD or NT development. There was no direct community involvement in this study; however, in-services reporting the results of some of the studies of academic development (e.g. Solari et al., 2019) were provided for community school personnel.
Measures
Autism characteristics
Autism verification was collected with the ADOS-2 (Lord et al., 2012) at Time 1 of this study using Module 3 or 4 administered by a research reliable tester to the autism and ADHD groups. Of primary interest in this study were data from four items of the SA scale that are related to the construct of joint attention. These included: (a) facial expressions directed to examiner, which provides a rating of whether the participant’s facial expressions are directed to the examiner for the purpose of communicating emotional experiences or internal states, (b) reporting of events, which provides a rating of the participant’s ability to describe an event comprehensibly either spontaneously or in response to an examiner’s question, (c) unusual eye contact, which provides a rating of the participant’s appropriate and socially modulated gaze, and (d) shared enjoyment in interaction, which provides a rating of participant’s pleasure during any of the tasks or conversations and is directed toward the examiner. Previous studies support the validity of analyses of subsets of SA scale items in autism research (Sano et al., 2021; Thurm et al., 2007; Zachor & Ben-Itzchak, 2020).
At Time 1, parents of all participants filled out the Social Communication Questionnaire (SCQ)-Lifetime Version (Rutter et al., 2003), the Autism Symptom Screening Questionnaire (ASSQ) for autistic children without intellectual disability (Ehlers et al., 1999), and the Social Responsiveness Scale (SRS; Constantino & Gruber, 2005) to rule out autism symptoms in the ADHD and NT groups and provided additional symptom reports in the autism group.
Attention symptoms
At Time 1, parent report on the Conners 3 (Conners, 2008) was used to assess symptoms of ADHD in all participants. The Conners 3 yields standardized T-scores for measures of inattention, hyperactivity-impulsivity, executive functions, and learning problems based on a normative sample of 1200 parents of 8- to 18-year-olds. The Conners 3 is characterized by good estimates of internal consistency which ranges from .77 to .97 (Conners, 2008).
Cognitive ability
The Wechsler Abbreviated Scale of Intelligence, Second Edition (WASI-2; Wechsler, 2011) was administered at Time 1 to provide a measure of general cognitive ability for each participant. The WASI-2 contains four subtests that provide estimates of verbal, non-verbal, and FIQ. FIQ was used to determine if participants met criteria for this study (FIQ >70). The FIQ index has established internal consistency of .96 (Wechsler, 2011). Cronbach’s alpha coefficients for our study sample were between .87 and .92 across subtests.
Childhood Joint Attention Rating Scale
The C-JARS includes a 55-item parent report each rated for frequency of occurrence: 0 = Never, 1 = Seldom, 2 = Sometimes, 3 = Often, and 4 = Always. Higher scores on the 14-item SS scale indicate parents observed fewer joint attention and spontaneous sharing behaviors in their child. The SS mean scale score is computed by dividing the SS total score (range 0 to 56) by the number of scale items (14). The SS scale has an internal consistency estimate of .91 (Birkeneder et al., 2024). Higher scores on the 41-item PS scale indicate parent reports of more frequent joint attention and spontaneous sharing behaviors. The total PS scores can range from 0 to 164, and the mean scaled score is computed by dividing the PS total score by 41. The PS scale has an internal consistency estimate of .98 (Birkeneder et al., 2024). For examples of questions refer to Table 1.
The C-JARS subscale scores can be summarized by the SJAS score which is computed by subtracting the SS scaled score from the PS scaled score (SJAS = PS – SS). Positive SJAS scores indicate that a parent reported observing a higher average frequency of PS than SS behaviors for their child, while a negative score indicates that a parent reported a higher average frequency of SS than PS behaviors in their child.
Data analysis plan
Analyses were conducted using IBM SPSS version 29. All the hypotheses in this study were directional. Alpha was set at .05 for all analyses but the directional nature of the hypothesis resulted in the equivalent of a more conservative .025 for all two-tailed tests (Leventhal & Huynh, 1996).
Hypothesis 1: longitudinal stability
Intraclass correlations (ICCs) were conducted for each of the three groups to determine interrater reliability between the two time points. ICCs were calculated using single-rater, consistent-agreement, two-way mixed effects model between Time 2 and Time 3 ratings for each of the three C-JARS scales. ICC values of less than .50 are considered poor, .60–.75 are considered good, and .75 and above are considered indicators of excellent reliability (Cicchetti, 1994). We additionally reported the Cronbach’s alpha and Pearson correlations between the Time 2 and Time 3 C-JARS variables. To assess the stability of mean group scores, Repeated Measures multivariate analysis of variance (MANOVA) of Time 2 and Time 3 C-JARS scores was computed. Because C-JARS data from a subsample of Time 2 data that included 54 of autistic participants and 34 of the NT had been previously reported (Mundy et al., 2017), C-JARS group comparison and validity analyses were reported only for Time 3 C-JARS data in this study.
Hypotheses 2 and 3: group and sex differences
A multivariate analysis of covariance (MANCOVA) controlling for age and FIQ was conducted to assess differences between group, sex, and their interaction on Time 3 C-JARS SS and PS scores. Post hoc analyses were conducted with Bonferroni corrections. A univariate analysis of covariance (ANCOVA) was conducted with the Time 3 SJAS score controlling for age and FIQ was conducted to assess differences between group, sex, and their interaction. The SJAS ANCOVA was conducted separately as inclusion in the MANOVA would violate homogeneity of variances and covariances. To further determine the ability of the C-JARS to distinguish groups, two discriminant function analyses were conducted. The first assessed the ability of the C-JARS to distinguish the autism from NT groups, whereas the second assessed the autism versus ADHD groups.
Hypothesis 4: criterion and discriminant validity of the C-JARS with the ADOS-2
Spearman’s rho correlations between C-JARS variables and ADOS-2 RRB scores were used to determine discriminant validity. The ADOS-2 SA subscale items were combined into a short joint attention scale. Correlations between the ADOS-2 SA total and the short joint attention scale were used to determine criterion validity. Spearman’s rho was chosen due to the ordinal nature and non-normal distribution of ADOS-2 scores.
Hypothesis 5: convergent validity of the C-JARS with parent report
Finally, convergent validity was assessed with correlations of C-JARS scores and parent report measures of autism symptomology. The parent report data violated assumptions of normality; therefore, Spearman’s rho correlations were also conducted between C-JARS scores and SRS-2, SCQ, and ASSQ total scores.
Results
C-JARS score stability
The ICC coefficients for the SS scale were adequate in each of the three groups (ICC = .74–.80). ICCs for the PS scale were excellent for each of the three groups (ICCs = .80–.87) and the SJAS score (ICCs = .80–.87). Pearson correlations additionally provided evidence of score stability in the three groups (rs = .74–.88, ps < 0.001; see Tables 3 and 4). Next, we examined the degree to which C-JARS scores remained stable over the 15-month period using a 2 (Time 2, Time 3) by 3 (C-JARS SS, PS, SJAS scores) by 3 (groups: autism, ADHD, NT) repeated measures MANOVA. The multivariate tests indicated no significant effect of time, F(1, 119) = .07, Wilk’s Λ = .99, p = 0.79, η p 2 = .001, and no significant interaction of time and group, F(2, 119) = 1.23, Wilk’s Λ = .98, p = 0.28, η p 2 = .02 (see Table 5 for Time 2 and Time 3 means).
Pearson correlations of C-JARS scores across 15 months.

ADHD = attention deficit/hyperactivity disorder. NT = neurotypical; T2 = Time 2; T3 = Time 3; SS = C-JARS Social Symptoms subscale; PS = C-JARS Prosocial subscale; SJAS = C-JARS Summary Joint Attention Scale score.
p < .001; *** p < 0.001.
ICC and Cronbach’s alpha values for C-JARS measures.

ADHD = attention deficit/hyperactivity disorder; NT = neurotypical; SS = C-JARS Social Symptoms subscale; PS = C-JARS Prosocial subscale; SJAS = C-JARS Summary Joint Attention Scale score.
Group means, standard deviations, and ranges for C-JARS scale scores.

ADHD = attention deficit/hyperactivity disorder; NT = neurotypical; T3 = Time 3; C-JARS = Childhood Joint Attention Rating Scale; SS = C-JARS Social Symptoms subscale; PS = C-JARS Prosocial subscale; SJAS = C-JARS Summary Joint Attention Scale score.
Significantly different from autism group.
Significantly different from ADHD group.
Significantly different from NT group.
Significant sex difference.
C-JARS scores group differences
The 2 (Time 3 C-JARS SS and PS) by 3 (group) by 2 (sex) MANCOVA with age and FIQ as covariates indicated a significant main effect for group, F(4, 236) = 16.45, Wilk’s Λ = .61, p < 0.001, η p 2 = .22. Post hoc univariate analyses with Bonferroni corrections indicated significant differences between all three groups on C-JARS SS scores with the autism group higher than the ADHD group and the latter higher than the NT group. For C-JARS PS scores, the autism group differed from both the ADHD and NT groups, but the latter two were not significantly different from each other (see Table 5). We did not observe a main effect for sex, F(2, 118) = 2.72, Wilk’s Λ = .96, p = 0.07, η p 2 = .04, or a group by sex interaction, F(4, 236) = 0.91, Wilk’s Λ = .97, p = 0.46, η p 2 = .02. In addition, neither the covariates of age, F(2, 118) = 0.16 Wilk’s Λ = .99, p = 0.87, η p 2 = .003, nor FIQ, F(2, 118) = 0.24, Wilk’s Λ = .99, p = 0.79, η p 2 = .004, was significant. See Figure 1 for score distributions in the three groups.
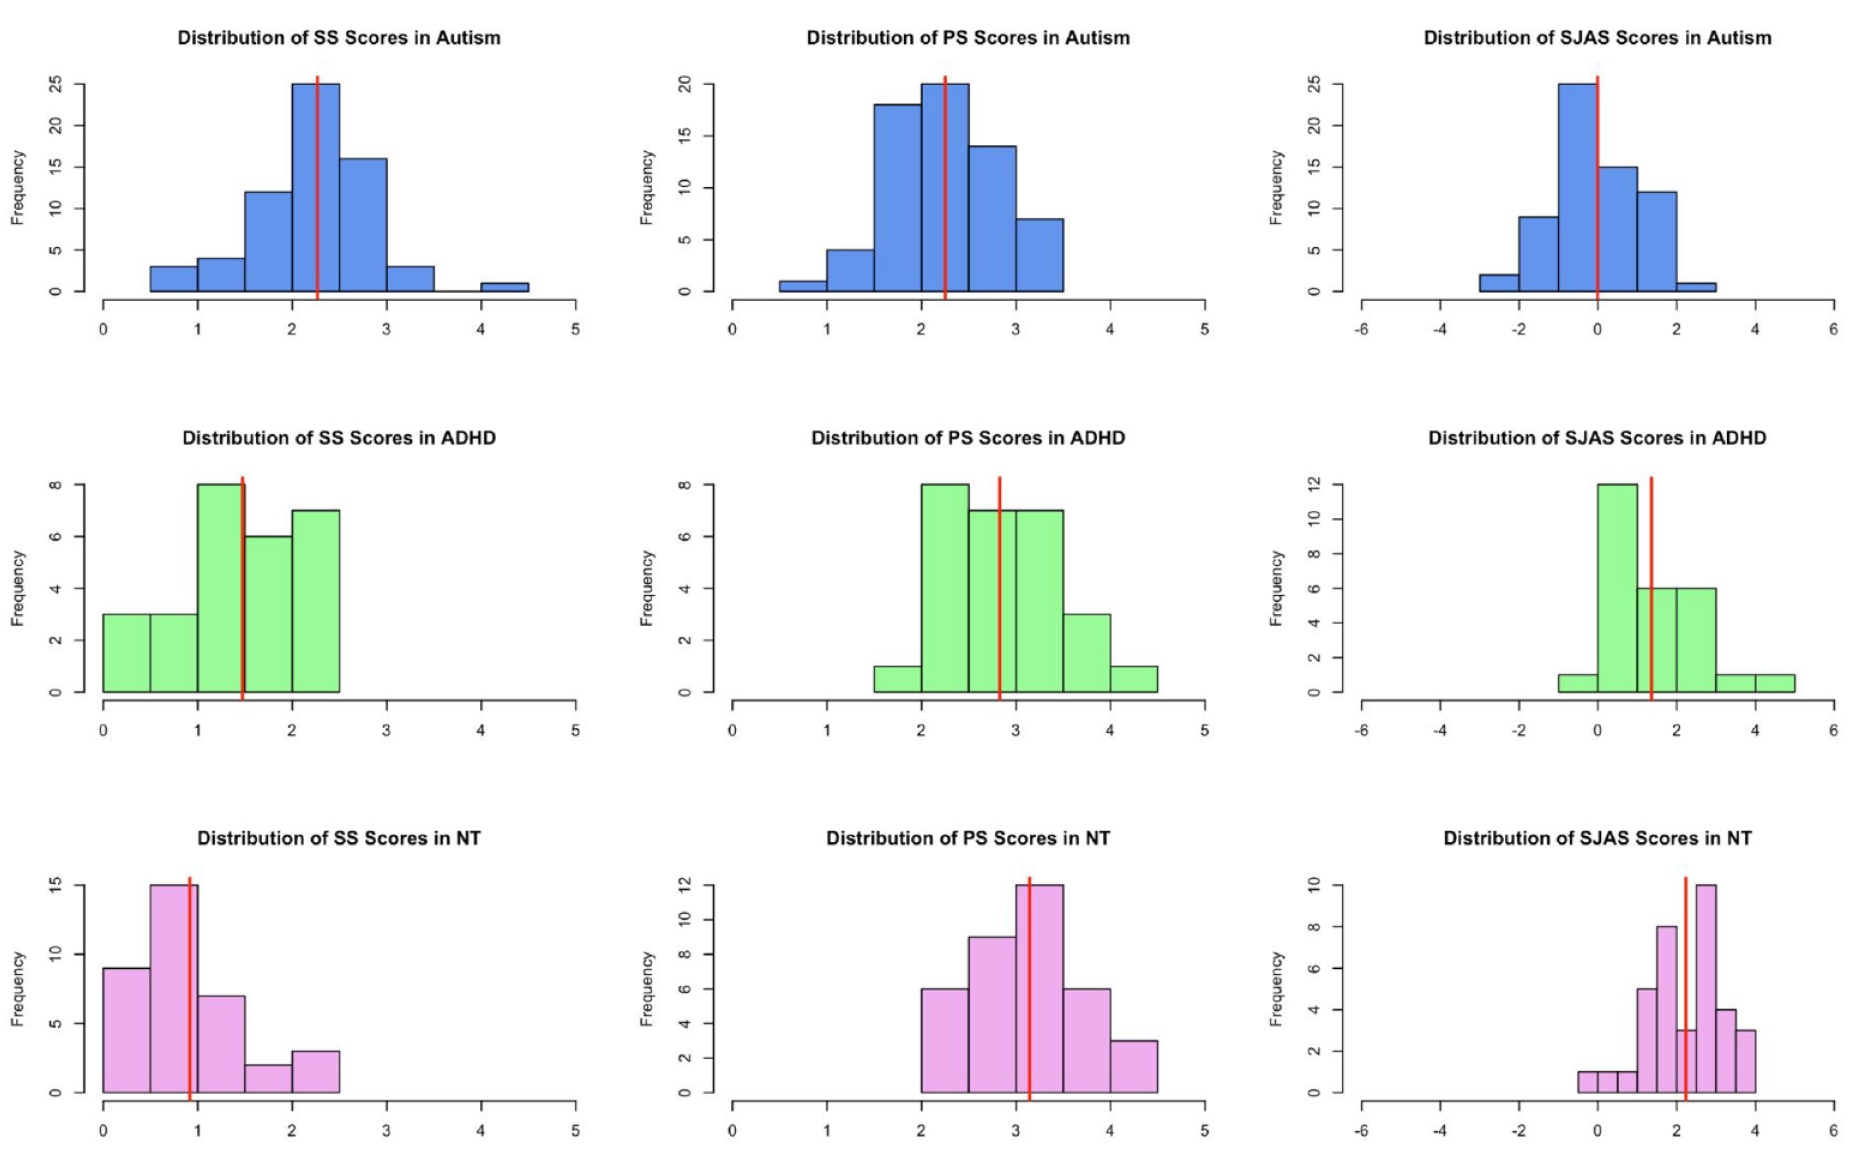
Distributions of Time 3 C-JARS scores for autism, ADHD, and NT groups.
The ANCOVA to assess diagnostic group and sex differences on C-JARS SJAS scores resulted in mixed effects. We observed a significant main effect for group, F(2, 127) = 34.53, p < 0.001, η p 2 = .37, and sex F(1, 127) = 5.47, p = 0.02, η p 2 = .04. We did not observe a significant interaction between group and sex, F(2, 127) = 1.84, p = 0.16, η p 2 = .03. The mean SJAS scores were higher for girls than for boys in all groups. It should be noted, however, that the sex difference on SJAS was only significant in the ADHD group, t(25) = 2.38, p = 0.01, and this was based on data from only four girls (Table 5).
Discriminant function analyses
We also examined the extent to which the C-JARS scores were sensitive to differences across the groups with discriminant function analyses. A discriminant function analysis comparing the autism and NT groups indicated that the Time 3 C-JARS SS correctly identified 87% of the sample, with a sensitivity estimate of 88.9% and a specificity estimate of 85.9%, χ2(1) = 76.38, Wilk’s Λ = .46, p < 0.001. Time 3 C-JARS PS scores correctly identified 80% of the sample, with a sensitivity of 77.8% and specificity of 81.3%, χ2(1) = 47.15, Wilk’s Λ = .62, p < 0.001. Time 3 SJAS scores correctly identified 87% of the sample, sensitivity = 88.9%, specificity = 85.9%, χ2(1) = 72.86, Wilk’s Λ = .46, p < 0.001.
The discriminant function analysis of the autism and ADHD groups indicated that the Time 3 C-JARS SS scores correctly identified 73% of the sample, with a sensitivity of 66.7% and specificity of 75%, χ2(1) = 24.98, Wilk’s Λ = .75, p < 0.001. Time 3 PS scores correctly identified 70% of the sample, with a sensitivity of 66.7% and specificity of 71.9%, χ2(1) = 18.43, Wilk’s Λ = .81, p < 0.001. Time 3 C-JARS SJAS scores correctly identified 71% of the sample, with a sensitivity of 63% and specificity of 75%, χ2(1) = 25.87, Wilk’s Λ = .75, p < 0.001.
Criterion and discriminant validity with ADOS-2
Correlations between C-JARS scores and ADOS-2 variables are presented in Table 6. Consistent with our hypothesis, the Time 1 ADOS-2, but not the Time 1 ADOS-2 RRB, was correlated with C-JARS SS, PS, and SJAS scores in the autism group. In addition, the values from our ADOS-2 joint attention short scale were correlated with C-JARS scores (Table 6).
Spearman’s rho correlations of ADOS-2 total and subscale scores with C-JARS scores.

The ADOS-2 Joint Attention Scale was based on an aggregate of the items: unusual eye contact, facial expressions directed to examiner, share enjoyment in interaction, and reporting of events. ADHD = attention deficit/hyperactivity disorder; T3 = Time 3; C-JARS = Childhood Joint Attention Rating Scale; ADOS-2 = Autism Diagnostic Observation Scale, Second Edition; SA = Social Affect; RRB = Restricted and Repetitive Behavior; SS = C-JARS Social Symptoms subscale; PS = C-JARS Prosocial subscale; SJAS = C-JARS Summary Joint Attention Scale score.
p < 0.05; **p < 0.01.
In the ADHD group, SS, PS, and SJAS scores were moderately correlated with ADOS-2 SA total scores, but the ADOS-2 joint attention short scale was not correlated with C-JARS scores. Unexpectedly, we also observed a positive association between PS (ρ = .35, p = 0.04) scores with ADOS-2 RRB total scores in the ADHD group. Evidence of this association was not observed in the autism group (p > 0.05; Table 6).
Criterion-related validity and parent report measures
In the autism group, individual differences in Time 3 C-JARS SS scores were moderately and positively predicted by Time 1 parent report on the SCQ total, ASSQ total, and SRS-2 total scores (Table 7). C-JARS PS scores were moderately and negatively correlated with each of these parent report measures. Similarly, C-JARS SJAS scores were moderately and negatively correlated with all parent report measure scores. We observed an identical pattern of correlation in the ADHD group. C-JARS SS scores were moderately and positively correlated with parent report scores. C-JARS PS and SJAS scores were moderately and negatively correlated with each of the parent report measures. Further, we observed a similar pattern in the NT group. C-JARS SS scores demonstrated weak to moderate positive correlations with parent report measures. C-JARS PS and SJAS scores were moderately and negatively correlated with all parent measures (Table 7).
Spearman’s rho correlations of C-JARS scores with parent report on the SRS, SCQ, and ASSQ.

ADHD = attention deficit/hyperactivity disorder; NT = neurotypical; T2 = Time 2; T3 = Time 3; C-JARS = Childhood Joint Attention Rating Scale; SS = C-JARS Social Symptoms subscale; PS = C-JARS Prosocial subscale; SJAS = C-JARS Summary Joint Attention Scale score; SRS = Social Responsiveness Scale; SCQ = Social Communication Questionnaire; ASSQ = Autism Symptom Screening Questionnaire.
p < 0.05; **p < 0.01; ***p < 0.001.
Discussion
Research on the development of prosocial competencies, as well as social difficulties in childhood, is needed because of the heterogeneous outcomes of autistic people (Clarke & Lord, 2024; Wilkinson et al., 2022; Yager & Iarocci, 2013). Measures of the development of joint attention, joint action, and the spontaneous sharing of experience assess a theoretically meaningful facet of development that may be useful in this area of research (Mundy & Sigman, 2015; Zachor & Ben-Itzchak, 2020). In conjunction with previous research (Birkeneder et al., 2024), the data from this study support the hypothesis that the C-JARS provides useful information on the joint attention abilities of autistic children and adolescents.
One new observation here was that the SS, PS, and SJAS components of the C-JARS displayed strong evidence of score stability across a 15-month interval for autistic, ADHD, and NT individuals. The correlation values observed in this study (Table 3) are in the .80 range, similar to those observed on the Vineland (rs = .86–.87; Sparrow et al., 2016), with the exception of the SS scale in the autism group, which was still adequately high at .74. These data indicate that the C-JARS can provide a reliable and stable measure of individual differences in social competence and symptoms for studies of autistic children and adolescents. Additional support for this conclusion was provided by data indicating that behavioral observations on the ADOS-2 SA scale were weakly but significantly predictive of parent report on the C-JARS across a 30-month interval. The longitudinal nature and range of variance in ADOS-2 scores in an autism sample may have contributed to the level of correlation observed.
More specifically, items of the SA scale, such as unusual eye contact, facial expressions directed to examiner, share enjoyment in interaction, and reporting of events, predicted C-JARS scores. This is the first report of correlations between the direct observation of joint attention-related behaviors and parent report on the C-JARS and it provides support for the construct validity of the scales. In general, these results were also consistent with research that indicates that joint attention-related ADOS-2 SA items may be predictive of outcomes in autism (Zachor & Ben-Itzchak, 2020). It is also consistent with evidence that the PS scale of the C-JARS is associated with differences in the affiliative behaviors of autistic children (Birkeneder et al., 2024).
Evidence of the construct validity of the C-JARS was also provided by the observation of significant group differences on the C-JARS SS, PS, and SJAS scales. As expected, parents rated their autistic children significantly higher on the C-JARS SS scale and significantly lower on the PS scale than did either parents of NT children or children with ADHD, similar to the data from Birkeneder et al.’s (2024) study. Also as expected these group differences on the C-JARS scales were associated with strong effect sizes and the discriminant analyses indicated that the C-JARS distinguished a majority of the autism group from both the NT and the ADHD groups. Thus, the data from both studies are consistent with the hypothesis that the C-JARS assesses a significant aspect of the social-communicative phenotype of school-aged autistic children.
The comparison of C-JARS scores for the autism and ADHD, however, also revealed a notable level of overlap in behavior scores for a substantial subset of children. This was consistent with other observations of the bio-behavioral and phenotypic overlap of autism and ADHD (Baribeau et al., 2019; Stergiakouli et al., 2017). Autism and ADHD are both neurodevelopmental disorders of attention that share some common mechanisms (Gangi et al., 2021), but not others (Hatch et al., 2020). A more precise understanding of the similarities and differences is needed. One pertinent aspect of this study may be that the autism group scores on the PS scale were significantly different from those in the ADHD and NT groups, but the latter two groups did not differ on this measure (Table 5). These data suggest that studies of prosocial communication and affiliative behaviors may contribute to understanding of important phenotypic differences between autism and ADHD in childhood. In particular, it may be important to provide comparative studies of the childhood development of social attention and joint attention in autism and ADHD (Braithwaite et al., 2020; Mundy, 2023). To date, a few relevant studies have observed that autistic children and ADHD children significantly differ with respect to the behavioral (Temeltürk et al., 2024), information processing (Mundy et al., 2017), and electrophysiological responses (Groom et al., 2017) associated with joint attention and gaze cues.
Two other sets of observations from the data were important. First, analyses of correlations with SCQ, SRS, and ASSQ total scores revealed a pattern of moderate to strong correlations between parent report on the C-JARS and parent report on the SCQ, SRS, and ASSQ in all three groups. The strongest correlations in each group were observed for the C-JARS with the SRS. These observations are inconsistent with a previous report showing little evidence of an association between parent report on the C-JARS and parent report on SCQ, SRS, and ASSQ (Mundy et al., 2017). This may reflect the larger sample size of the current study with its greater power to observe effects. Given their covariance, future studies will be necessary to examine the incremental validity of these measures and more specifically test the hypothesis that the theory-based measurement focus of the C-JARS adds demonstrably useful and unique information for autism research.
Finally, the data in this study were also inconsistent with a previous observation of a significant but weak interaction effect of sex and diagnostic groups on C-JARS scores (see Birkeneder et al., 2024). Here only a weak main effect of sex was observed such that girls in all groups displayed a higher average C-JARS PS than average C-JARS SS scores that was not observed in boys. Moreover, this effect appeared to largely be carried by a small sample of girls in the ADHD group. Additional research will be needed to determine if the C-JARS is sensitive to sex differences in childhood social communication development.
Limitations
The data in this study and others (Birkeneder et al., 2024; Mundy et al., 2017) provide evidence that the C-JARS is a valid measure for research on the social development of school-aged autistic children. However, there are several limitations that should be addressed in future research. First, the study was limited by relatively small comparison sample sizes, especially within the ADHD group, which limit the power to conduct clinical group comparisons. The use of clinical comparison groups is important to understand the utility of the C-JARS.
In addition, this study did not collect information from objective experimental measures of joint attention. The study was strengthened by information from objective, clinical observations of joint attention behaviors on the ADOS-2 SA scale, but a more complete examination of the C-JARS requires a study that includes more precise quantitative measures of childhood joint attention. We are now engaged in research that will collect this type of data.
Finally, interpretation of the longitudinal data is limited by the particular period and interval of development examined in this study. Other studies have observed change in social competence over a longer 5-year longitudinal interval (Clarke & Lord, 2024). It is also possible that change in joint attention behaviors may be observed in studies of earlier elementary school development (kindergarten through first grade) than the grade range observed in this study. To understand the developmental nature of joint attention in childhood and adolescence, longitudinal research spanning a longer age range of childhood and adolescence is needed.
Footnotes
Declaration of conflicting interests
The author(s) declared no potential conflicts of interest with respect to the research, authorship, and/or publication of this article.
Funding
The author(s) disclosed receipt of the following financial support for the research, authorship, and/or publication of this article: The research reported in this paper was supported by IES Grant # IES R324A120168, and the UC Davis Department of Psychiatry Lisa Capps Endowment for Research on Education and Neurodevelopmental Disorders.