
Abstract
Despite several psychometric advantages over the 50-item Autism Spectrum Quotient, an instrument used to measure autistic traits, the abridged AQ-28 and its cross-cultural validity have not been examined as extensively. Therefore, this study aimed to examine the factor structure and measurement invariance of the AQ-28 in 818 Dutch (Mage = 37.4, 581 females, 233 males, 4 others) and 437 Malaysian (Mage = 23.0, 328 females, 99 males, 10 others) participants from the general population. The hierarchical structure of the AQ-28 showed fair and good fit in Malaysia and in the Netherlands, respectively. A multi-group invariance analysis supported that the AQ-28 is cross-culturally invariant. Malaysians (M = 68.63, SD = 8.33) scored significantly higher than Dutch participants (M = 51.48, SD = 10.30) on the AQ-28 while gender was controlled for. While the measurement invariance suggests that the AQ-28 functions similarly in Malaysia and the Netherlands in terms of structure, exploratory analyses showed 11 items with differential item functioning. Hence, while the AQ-28 possesses a stable factor structure and appears to measure the same latent traits in Malaysia and the Netherlands, some items potentially display cultural bias which, in turn, might explain the differences in AQ scores.
Lay abstract
The AQ-28 is a questionnaire measuring autistic traits, that is, traits that are related to Autism Spectrum Conditions, but its reliability in other cultures has not been thoroughly evaluated. We, therefore, tested whether the properties of the AQ-28 are comparable between two countries with different cultures, Malaysia and the Netherlands. A total of 437 Malaysian and 818 Dutch participants completed the AQ-28 online. We measured whether the AQ-28 measures autistic traits similarly in Malaysia and the Netherlands. The AQ-28 measures autistic traits similarly, and the reliability was acceptable and good in the general population of Malaysia and the Netherlands, respectively. However, Malaysians scored higher than Dutch participants. Moreover, 11 AQ-28 items showed cultural bias, indicating that these items are answered/interpreted differently in Malaysia and the Netherlands. Cross-cultural differences in interpreting, reporting, and/or expressing autistic traits highlighted in this study could potentially explain why some items are culturally biased and why Malaysians score higher on these items. The findings of this work imply that cutoff scores derived from one culture should not be generalised to another culture. Moreover, the findings are informative for future development of culturally neutral or appropriate screening and diagnostic tools for autism.
Keywords
The Autism Spectrum Quotient (AQ) is a self-report questionnaire developed in the United Kingdom to measure autistic traits in the general population (Baron-Cohen et al., 2001). An autism spectrum condition (ASC) is characterised by social difficulties and repetitive/restricted behaviour and interests (American Psychiatric Association, 2013). While the original AQ-50 has five subscales (Social Skills, Imagination, Communication, Attention Switching and Attention to Detail; 10 items per subscale) reflecting autistic traits, its factor structure has not been consistently confirmed, with various factor structures proposed across studies (Austin, 2005; English et al., 2020; Hurst et al., 2007; Kloosterman et al., 2011). However, an abridged version of the AQ, the AQ-28, shows a promising factor structure and reliability (Hoekstra et al., 2011). Yet, the cross-cultural validity of the AQ-28 is underexplored (but see Carruthers et al., 2018; Freeth et al., 2013), hindering cross-cultural comparisons. In light of this, this study aims to compare the factor structure of an abridged version of the AQ, the AQ-28, in Malaysia and the Netherlands and examine cross-cultural measurement invariance.
While the AQ is mostly used in research to quantify autistic traits and is not meant to replace standardardized in-depth diagnostic instruments, it could be especially useful as a brief screening tool in low- and middle-income countries due to its free availability in multiple languages. Many of these countries, including Malaysia, do not have access to diagnostic instruments such as the Autism Diagnostic Observation Schedule (ADOS; Lord et al., 2000), Autism Diagnostic Interview-Revised (ADI-R; Le Couteur et al., 2003) and Social Responsiveness Scale (SRS; Constantino et al., 2003) and lack trained professionals. The lack of valid screening and diagnostic instruments to detect and diagnose ASC is one of the key contributors to the cross-country differences in prevalence of ASC (Divan et al., 2021). Prevalence of ASC in South East Asia is 34/10000, and it is lower than the prevalence rate of 82.3/10000 in Europe (Zeidan et al., 2022). Various factors such as limited support systems, lack of awareness and knowledge, social stigma and accessibility to evidence-based interventions to facilitate early interventions also likely contribute to an underdetection of autism in low-resource countries (Olusanya et al., 2018). Hence, assessing the validity of the AQ-28 in Malaysia compared to the Netherlands, where it was originally studied, is a first step to improve the detection and diagnosis of ASC in Malaysia.
The originally proposed 5-factor structure of the AQ-50 is under debate, as it was not supported across various studies using principal components analysis (PCA) and confirmatory factor analysis (CFA; Austin, 2005; Hoekstra et al., 2008; Hurst et al., 2007; Kloosterman et al., 2011). Numerous alternative factor structures with a reduced number of items have been proposed (e.g. Austin, 2005; Hoekstra et al., 2008; Kloosterman et al., 2011; Lau et al., 2013; Russell-Smith et al., 2011). This clearly indicates that some of the original items could be dropped without losing explanatory power and this might even improve the consistency of the scale. In light of that, the AQ-28 was developed and validated in both a Dutch and a British sample (Hoekstra et al., 2011). The AQ-28 has a hierarchical structure similar to an earlier factor model proposed by Hoekstra and colleagues (2008) with four lower-order factors ‘Social Skills’, ‘Routine’, ‘Switching’ and ‘Imagination’ subsumed under a higher-order factor ‘Social Behaviour’ and another separate higher-order factor ‘Numbers/Patterns’. The AQ-28 is highly correlated with the AQ-50 (r = 0.93–0.95) and, similar to the AQ-50, males score higher than females on the AQ-28 (Hoekstra et al., 2011). The factor structure of the AQ-28 was replicated in autistic samples from the United Kingdom and the Netherlands (Grove et al., 2017, 2021; Kuenssberg et al., 2014). The AQ-28 appears to measure similar traits in both the general and autistic population (Murray et al., 2014), and in males and females in the autistic population (Grove et al., 2017). Differential item functioning (DIF) analysis on the AQ-50 suggested the AQ-28 may be more appropriate for comparison between autistic and non-autistic groups, given that eight items that perform differently in both groups were not included in the AQ-28 (Agelink van Rentergem et al., 2019). The findings overall suggest that AQ-28 is a reliable alternative to the AQ-50.
The cross-cultural validity of the AQ-28 is underexplored, even though the AQ -50 is used and has been studied in non-Western populations. For example, in a Taiwanese population, PCA supported a 5-factor structure similar to the original proposed structure with reduced items (Lau et al., 2013), and sex differences were replicated. This suggests that the AQ-50 may consistently capture autistic traits across different cultures. However, other studies found that some items of the AQ-50 may display cultural bias (Carruthers et al., 2018; Freeth et al., 2013). It is speculated that cognition and perception are shaped by cultures. Hence, there are likely differences in cognition and perception among the ASC population across cultures. In support of this, it was reported that autistic and non-autistic children in Singapore did not differ in performance in detecting embedded figures but autistic children performed better than non-autistic children in the United Kingdom (Koh & Milne, 2012). This suggests that noticing patterns, which is a subscale of the AQ, might be interpreted differently across cultures. People from different cultures might also respond differently to the AQ item assessing the ability to understand others’ emotions based on faces (item 36 in the AQ-50), because East Asians are more likely to focus on the complete social context than Americans when evaluating facial emotions (Masuda et al., 2008). Views and knowledge about ASC might also differ between cultures; Malaysian students reported lower levels of knowledge, contact and acceptance of ASC than British students (de Vries et al., 2020). Therefore, cultural differences in social norms and views on ASC may lead to differences in the interpretation and responses on the AQ between Malaysian and Dutch participants, which in turn, likely compromises the cross-cultural comparability of the AQ. So far, studies on cultural bias in the AQ either used the self-report AQ-50, the parent-report AQ-50 (parent-report version consists of the same items, but the child’s traits are reported by the parent), or the parent-report AQ-28 (Liu et al., 2022). To the best of our knowledge, no study to date has specifically investigated the factor structure of the self-report AQ-28 in a non-Western general population sample. Moreover, even though the factor structure of the AQ-28 has been consistently confirmed among autistic samples (Grove et al., 2017, 2021), less is known about its replicability in the general population. Therefore, this study addressed these issues using the AQ-28 in a Dutch and a Malaysian general population sample.
Apart from the factor structure, measurement invariance of the AQ-28 across cultures has not been confirmed. Meaningful cross-cultural comparisons necessitate measurement invariance (Boer et al., 2018), that is, true cross-cultural differences in a trait can only be revealed if the measure assesses the same trait in both cultures. For example, Malaysian students were found to score significantly higher than British students on the AQ-50 (Freeth et al., 2013). The authors suggest that the score differences might reflect cultural differences in the expression of autistic traits. Alternatively, the score differences could stem from measurement non-invariance, which was not tested. Therefore, this study further investigated whether previous cross-cultural score differences on the AQ-50 (Freeth et al., 2013) could be replicated with the AQ-28, and whether cross-cultural measurement non-invariance could explain these differences.
The main objective of this study was to examine the factor structure of the AQ-28 with CFA in Dutch and Malaysian general population samples. We hypothesised that the hierarchical structure of the AQ-28 would display a good fit in the Dutch sample since it was initially studied in the Netherlands. Given the dearth of studies examining the hierarchical structure of AQ-28 in a non-Western context, we formulated no specific hypothesis concerning the factor structure in the Malaysian sample. This study also aimed to test cross-cultural measurement invariance of the AQ-28 and compare the total score on the AQ-28 between Dutch and Malaysian adults. Given that several items of the AQ-50 showed differential discriminatory power across cultures (Carruthers et al., 2018), we hypothesised that the AQ-28 would show cross-culturally measurement non-invariance. Moreover, given that Malaysian students scored higher than British students on the AQ-50 (Freeth et al., 2013), we hypothesised that Malaysians from the general population would score higher on the AQ-28 than Dutch people from the general population. We additionally explored which items of the AQ-28 function differently in Malaysia and the Netherlands with DIF analysis.
Method
Participants
Malaysian sample
Ethical approval was obtained from the Science and Engineering Research Ethics Committee of the University of Nottingham Malaysia (Ethics Identification Number: CZJ160719). The AQ-28 data of 537 Malaysian participants, recruited through the university and social media, was part of a larger study on personality, autistic traits, and musical preference. Exclusion criteria for the analyses were: (1) taking less than 15 min to complete all questionnaires (N = 74), (2) taking the survey twice (N = 10), (3) being under the age of 18 (N = 1), (4) not being Malaysian (N = 9) and (5) filled in the Bahasa Malaysia version of the AQ-28 (N = 6; these were excluded because the number was too low to analyse separatey, and including them might confound the findings). After applying those filters, 437 (81%) responses were retained. The age of the Malaysian participants (328 females, 99 males, and 10 preferred not to say) ranged from 18 to 69 (M = 23.0, SD = 5.9). The participants were 264 (60.4%) Chinese Malaysians, 120 (27.4%) Malay, 30 (6.9%) Indian Malaysians and 23 (5.3%) of other ethnicities.
Dutch sample
The AQ-28 data of 831 Dutch non-autistic participants were collected by the Netherlands Autism Register (NAR), and the data collection was approved by the Ethics Committee of VU University Amsterdam (VCWE2020-041R1). The NAR collects data about autistic and non-autistic individuals. For the purpose of this study, an ASC diagnosis is an exclusion criterion and only data of the non-autistic sample was used. Participation is voluntary and participants were informed that their data are used for scientific research. We excluded participants under 18 years (N = 13), resulting in 818 responses included in the analyses. The age of the Dutch participants (581 females, 233 males and 4 indicated ‘other’) ranged from 18 to 80 (M = 37.4, SD = 15.1). Around 736 (90%) of the participants self-identified Dutch as their ethnicity, whereas Moroccan, Turkish, Surinamese, Antilleans/Arubans, and Indonesian made up 5.7% of the rest of the sample. The remaining 4.3% (N = 35) were of other ethnicities.
A Welch independent t-test revealed that the mean age of the Dutch sample was significantly higher than the mean age of the Malaysian sample, t(1172) = −24.04, p < 0.001.
Materials
The AQ-28 (Hoekstra et al., 2011) is an abridged version of the 50-item AQ (Baron-Cohen et al., 2001). The AQ-28 has two correlated higher-order factors that measure ‘Social Behaviour’ and ‘Numbers/Patterns’, with four lower-order factors ‘Social Skills’, ‘Routine’, ‘Switching’ and ‘Imagination’ subsumed under the ‘Social Behaviour’ factor (Hoekstra et al., 2011). The factors and their items can be found in the Supplementary Table 1. Each item of the AQ-28 is rated on a 4-point Likert-type scale (definitely agree, slightly agree, slightly disagree and definitely disagree). We adopted the scoring of 1–4 rather than using the binary scoring system, as it was shown to reflect a more reliable range (Murray et al., 2016). Fifteen items are reversed scored (i.e. disagree responses denote a higher score). For instance, ‘I prefer to do things with others rather than on my own’. A higher score indicates higher autistic traits.
Procedure
Malaysian participants were, for an overarching study, presented with musical excerpts and several questionnaires, including the AQ-28, upon consenting to participate in the online study. Participants could choose to answer the AQ-28 in Bahasa Malaysia or English before starting the online survey.
Dutch participants in this study completed the AQ-28 along with the Sensory Perception Quotient – Short online (Tavassoli et al., 2014).
Statistical analyses
CFA based on the polychoric correlations between the AQ-28 items and diagonally weighted least squares was done using the lavaan package (0.6–9; Rosseel, 2012) in R Studio (version 4.1.1). The fit of the models was assessed with χ2 and its associated p value. As χ2 is highly sensitive to sample size, the root mean square error of approximation (RMSEA), standardised root mean square residual (SRMR), Comparative Fit Index (CFI) and Tucker–Lewis Index (TLI) were used as well to assess the fit of the model because these are relatively independent of sample size (Schermelleh-Engel et al., 2003). A model is considered a ‘good’ fit by value of ⩾0.95 or fair fit if >0.90 for TLI and CFI, and a good fit by a value of ⩽0.06 or fair fit if <0.08 for RMSEA and SRMR (Hu & Bentler, 1999). Two models were tested with CFA within both the Malaysian and Dutch samples: (1) all items load onto one latent variable (i.e. autistic traits) and (b) item loadings correspond with the hierarchical model reported by Hoekstra et al. (2011).
The internal reliability of the total AQ-28 scale and subscales in both samples was assessed with ordinal alpha (Gadermann et al., 2012) computed with the psych package (2.1.9; Revelle, 2021) in R Studio.
A multi-group invariance analysis was also conducted using the lavaan package in R Studio to test whether the hierarchical model of AQ-28 differs between the Netherlands and Malaysia. In general, configural, metric (fixed loadings) and scalar (fixed intercepts) invariance have to be fulfilled to ensure meaningful comparisons of scores between cultures (Fischer & Karl, 2019). A change of <−0.010 in CFI, a change of >0.015 in RMSEA and a change of >0.030 in SRMR indicate that there is no metric measurement invariance, whereas a change of <−0.010 in CFI, a change of >0.015 in RMSEA and a change of >0.010 in SRMR indicate that there is no scalar measurement invariance (Chen, 2007). A partial invariance model was conducted whenever the change in fit indices exceeded the recommended cutoff, and the partial invariance was tested on invariant items (Putnick & Bornstein, 2016). This was done by first identifying parameters that had a significant impact on model fit as indicated by modification indices using the ccpsyc package in R Studio (Karl, 2021) and freeing the constraints of those identified parameters (Fischer & Karl, 2019). The constraints were freed iteratively from the most problematic parameter until the partial metric invariance model met the recommended cut-off changes.
Finally, we explored which AQ-28 items function differently in Malaysia and the Netherlands by DIF analysis. The DIF procedure for ordinal data conducted was based on the adjacent category logit regression model implemented within the difNLR package in R Studio (Hladká & Martinková, 2020). Bonferroni correction was applied to account for multiple comparisons.
Community involvement
Autistic community members were not involved in this study, but autistic community stakeholders such as the Dutch Association for Autism (NVA) are involved in the annual survey conducted by the NAR.
Results
CFA and internal reliability
The CFA showed that both Malaysian and Dutch data fitted poorly on the one-factor model (see Table 1). The hierarchical model in Malaysian data showed a fair fit despite the fact that TLI and CFI were below 0.90 because TLI and CFI are affected by model complexity (Cheung & Rensvold, 2002), and both RMSEA and SRMR were within the acceptable range. As predicted, the hierarchical model showed a good fit in the Dutch data (see Table 1). Notably, the Numbers/Patterns factor was negatively correlated (r = −0.20) with the Social Behaviour factor in the Malaysian data, but positively correlated (r = 0.32) with the Social Behaviour factor in the Dutch data.
Fit indices of one-factor and hierarchical model for Malaysian and Dutch data.
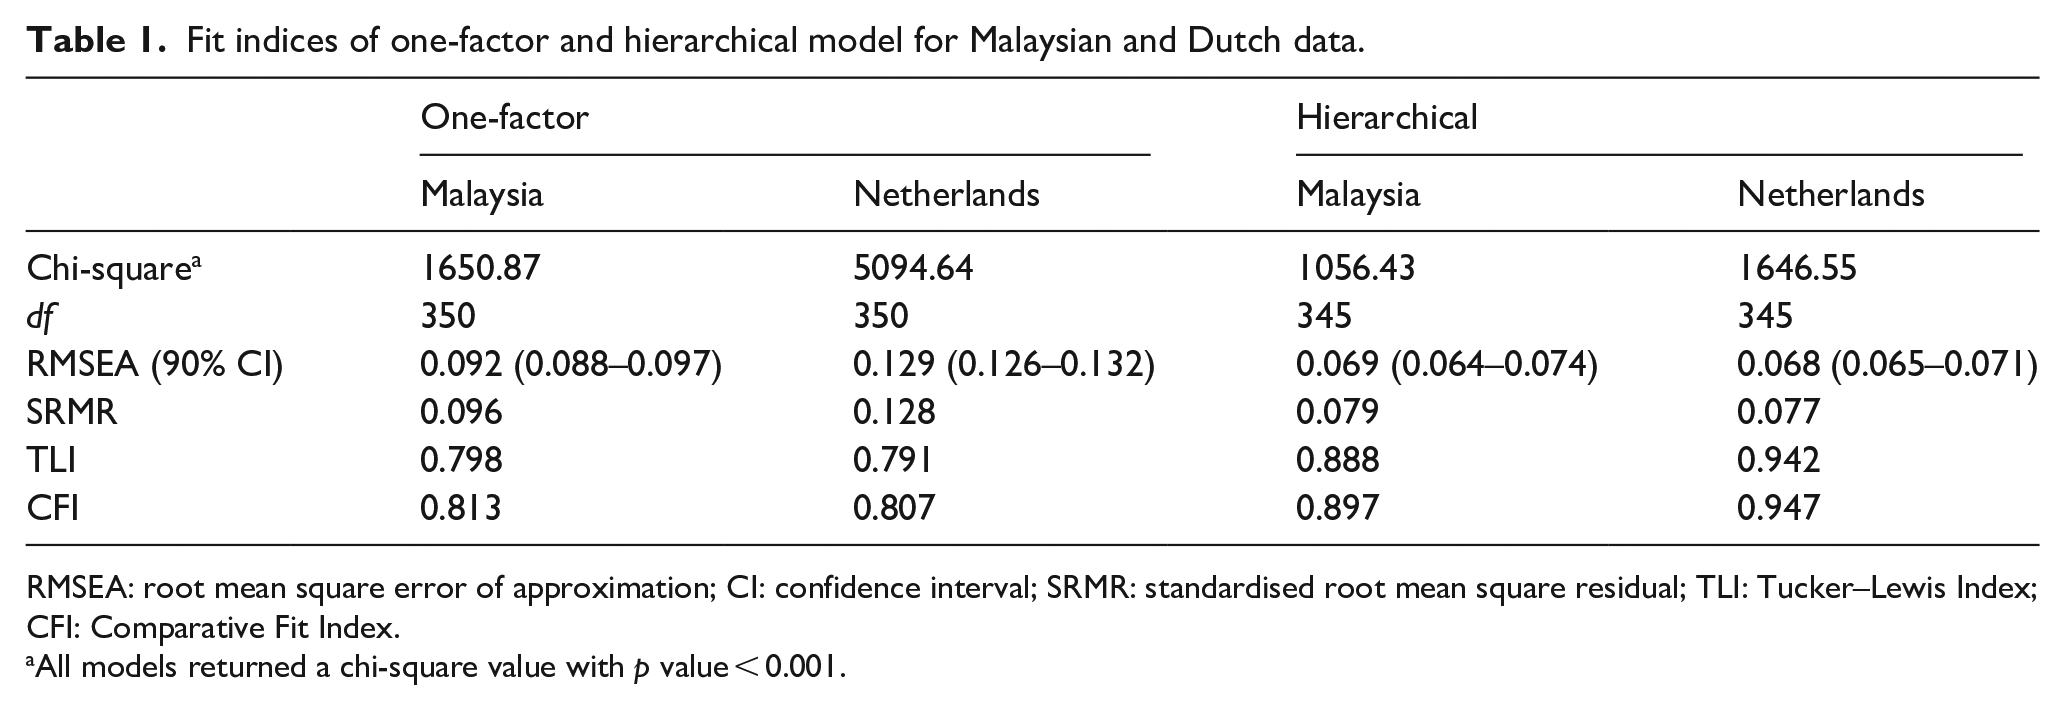
RMSEA: root mean square error of approximation; CI: confidence interval; SRMR: standardised root mean square residual; TLI: Tucker–Lewis Index; CFI: Comparative Fit Index.
All models returned a chi-square value with p value < 0.001.
The total AQ-28 scale showed good internal reliability for the Malaysian data (α = 0.75) and excellent internal reliability for the Dutch data (α = 0.89). The higher-order Social Behaviour factor and lower-order Social Skills factor showed good internal reliability in both the Malaysian and Dutch samples (α’s ranging from 0.81 to 0.88). The rest of the factors (i.e. Numbers/Patterns, Routine, Switching and Imagination) had poor internal reliability in the Malaysian sample (α’s ranging from 0.50 to 0.67), but good internal reliability in the Dutch sample (α’s ranging from 0.72 to 0.85). Some items from the Numbers/Patterns factor correlated negatively with the total scale (i.e. items 5, 7, and 16; see Table 3) in the Malaysian data (in line with the negative correlation between the factors Numbers/Patterns and Social Behaviour), but no negative correlations were detected in the Dutch data. The full list of item-total correlations can be found in Supplementary Table 2.
Cross-cultural measurement invariance and DIF
While the SRMR values exceeded the cutoff slightly in the metric and partial metric invariance model, the CFI and RMSEA values of all tested models were within the acceptable range, indicating an overall fair fit. As shown in Table 2, the metric invariance model (M2) showed a considerable drop in CFI that exceeds the recommended cutoff compared to the configural invariance model (M1), but the change in RMSEA and SRMR were within the recommended cutoff. Although we decided to tentatively accept M2, a partial metric invariance model (M3) was explored. M3 was constructed by letting the loadings of Social skills, Routine, Switching and Imagination factor freely load onto the higher-order Social Behaviour factor for Malaysian and Dutch data, as these parameters were identified as having the most impact on the model fit. M3 improved such that the change in CFI, RMSEA and SRMR compared to M1 were within the recommended cutoff (see Table 2). The scalar invariance model (M4) was constructed based on M3, and the change in CFI, RMSEA and SRMR were within the recommended cutoff (see Table 2). Although the loadings of four factors were unequal for Malaysian and Dutch samples (i.e. M3), the impact of unequal loadings on mean-comparing statistics is minimal (Steinmetz, 2013). Therefore, the findings overall support cross-cultural measurement invariance of the AQ-28, indicating that the total AQ-28 score can be meaningfully compared between Malaysia and the Netherlands.
Comparisons of invariance models as a function of country (Malaysia and the Netherlands).
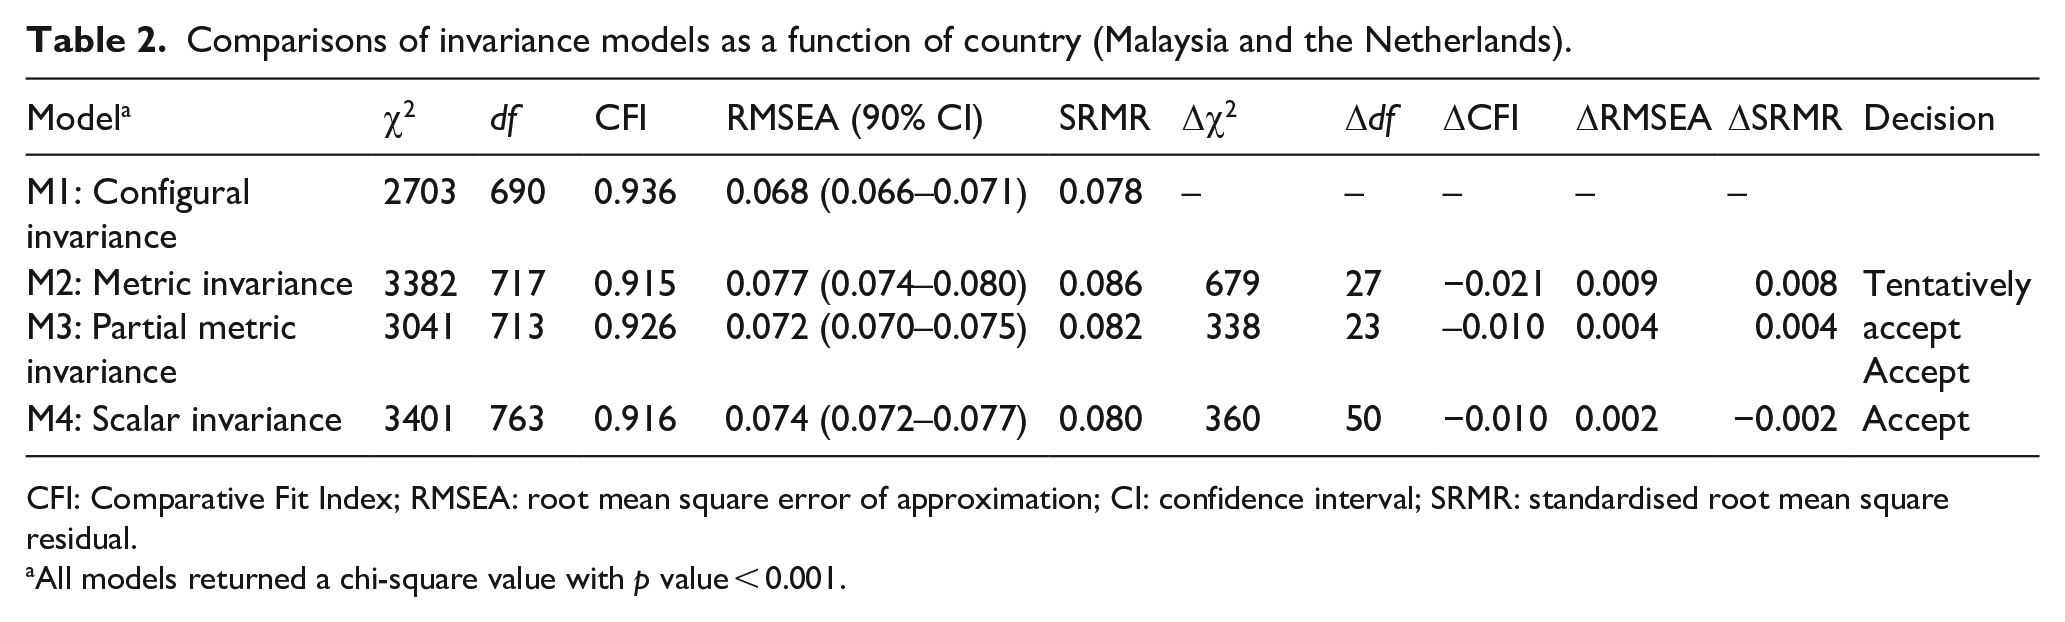
CFI: Comparative Fit Index; RMSEA: root mean square error of approximation; CI: confidence interval; SRMR: standardised root mean square residual.
All models returned a chi-square value with p value < 0.001.
The DIF analysis suggested that 11 items, including the items that were negatively correlated with the total scale in the Malaysian data, showed differential functioning in Malaysia and the Netherlands (see Table 3). The DIF indicates that these items potentially display cultural bias.
The chi-square and corrected item whole correlation of items that showed DIF.
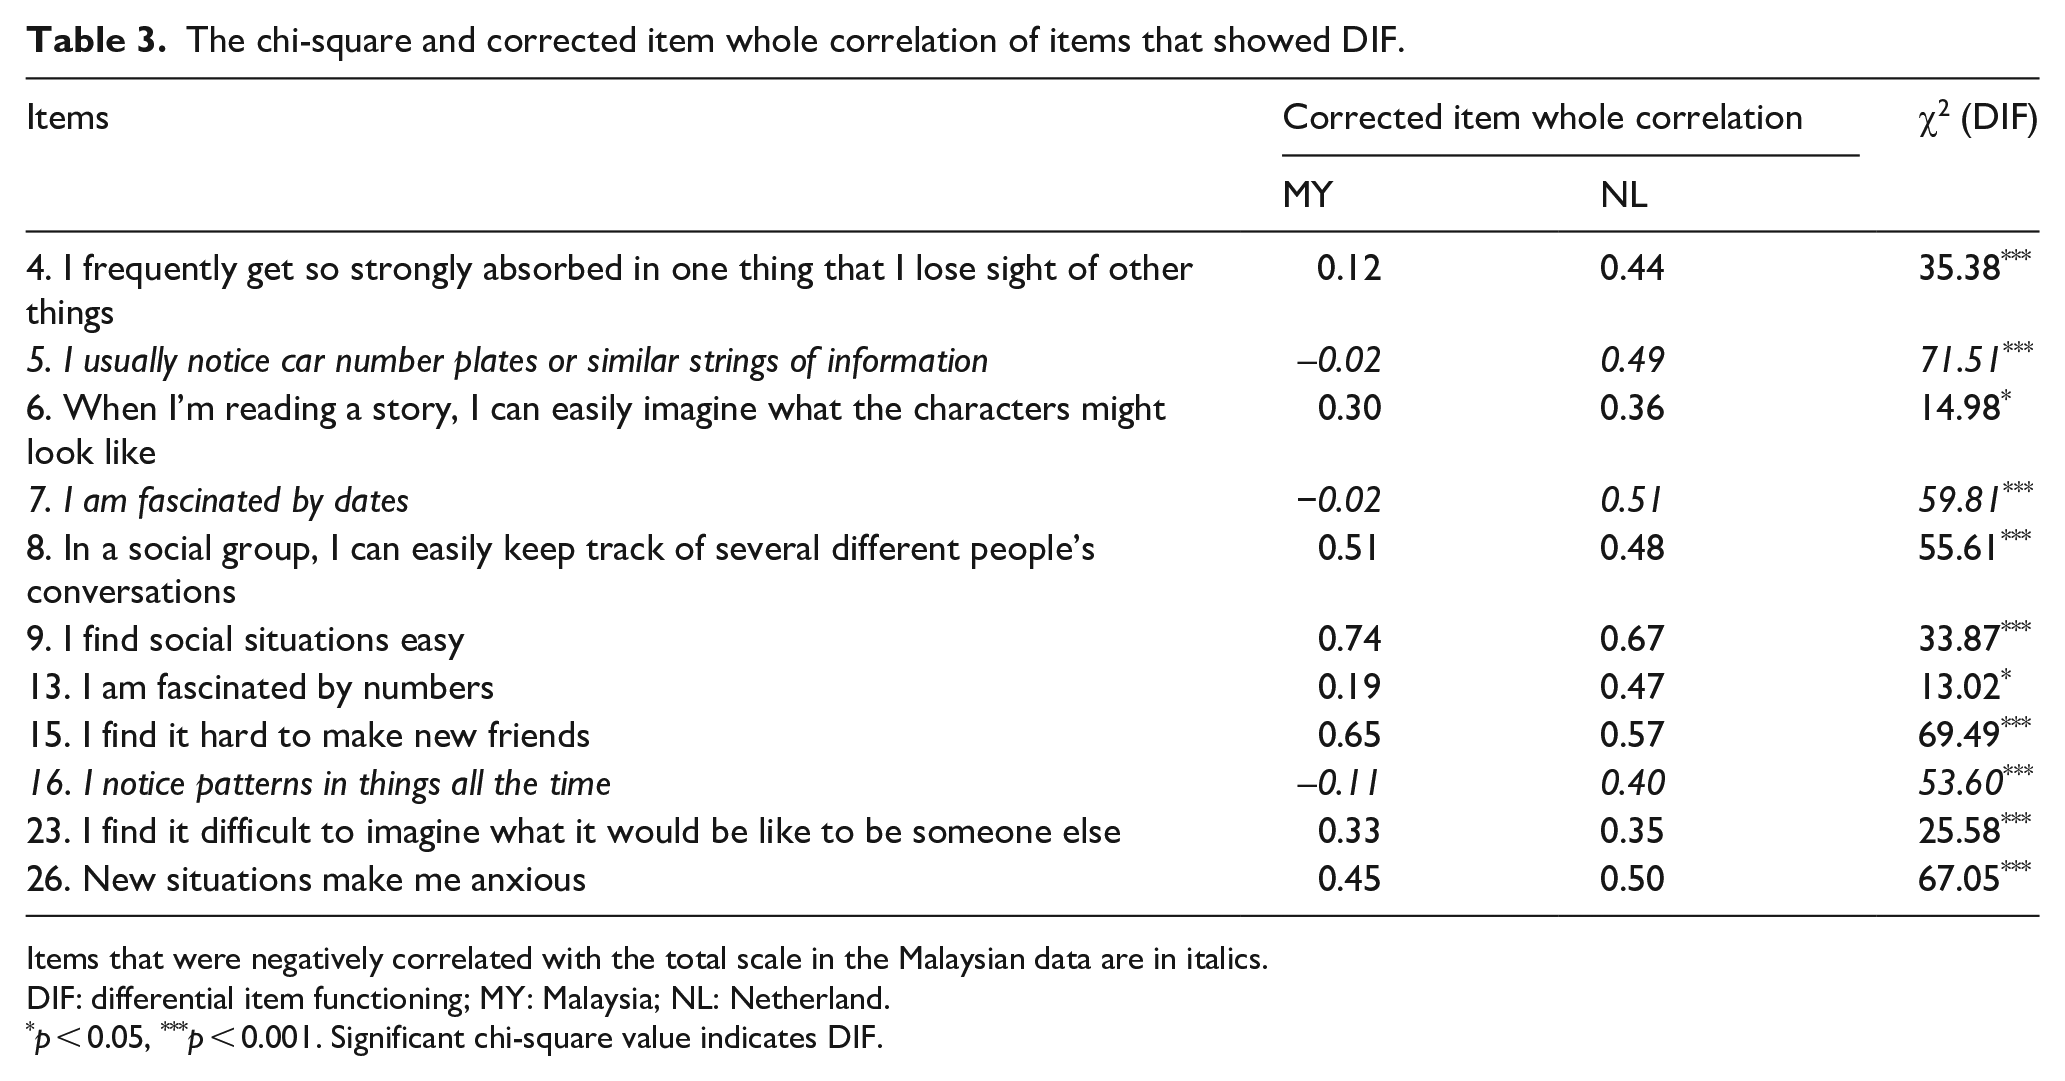
Items that were negatively correlated with the total scale in the Malaysian data are in italics.
DIF: differential item functioning; MY: Malaysia; NL: Netherland.
p < 0.05, ***p < 0.001. Significant chi-square value indicates DIF.
Total AQ-28 score comparison
AQ scores do not seem to vary across age groups (Lodi-Smith et al., 2021) but consistently differ between men and women among the general population (see Ruzich et al., 2015 for a systematic review). Moreover, evidence for measurement invariance on the AQ between men and women among autistic and non-autistic populations has been reported (English et al., 2020; Grove et al., 2017). Therefore, gender but not age was included as a covariate in the following analysis of covariance (ANCOVA). Those who did not identify themselves as men or women (10 Malaysian and 4 Dutch participants) were excluded from the following ANCOVA. Given that the scalar invariance model was accepted, we proceeded to compare the mean scores on the full AQ-28 scale between Malaysian and Dutch participants. A one-way between-subjects ANCOVA with gender (two levels) as a covariate revealed a significant main effect of country, F(1, 1238) = 900.49, p < 0.001, ηp2 = 0.42, with Malaysians (M = 68.63, SD = 8.33) scoring significantly higher than Dutch participants (M = 51.48, SD = 10.30) on the AQ-28.
The previously reported negative correlations between items from the Numbers/Patterns subscale and the total scale in the Malaysian data suggest that greater endorsement of these items is considered less rather than more ‘autistic’ in Malaysia, which may result in a higher AQ-28 score in a general population sample. Therefore, we repeated the ANCOVA on total AQ-28 score excluding the items from the Numbers/Patterns subscale. Again, the one-way between-subjects ANCOVA with gender as a covariate revealed a significant main effect of country, F(1, 1238) = 692.77, p < 0.001, ηp2 = 0.36, with Malaysians (M = 55.96, SD = 8.24) scoring significantly higher than Dutch participants (M = 42.48, SD = 8.78) on the AQ-28. AQ-28 scores after excluding Numbers/Patterns items were highly correlated with total AQ-28 scores in both countries (r > 0.90).
Discussion
As expected, the hierarchical structure of the AQ-28 displayed a good fit in a Dutch general population sample. Moreover, while no specific prediction was made for the Malaysian sample, the hierarchical structure of the AQ-28 displayed a fair fit as well. Against our hypothesis, cross-cultural measurement invariance of the AQ-28 was supported. However, exploratory analysis did identify 11 DIF items. The mean AQ-28 score of the Malaysian participants was significantly higher than that of the Dutch participants, confirming our hypothesis and extending previous findings on the AQ-50. The findings overall suggest that while the AQ-28 possesses a stable factor structure and measures the same latent traits in Malaysia and the Netherlands, some items, particularly from the Numbers/Patterns factor, potentially display cultural bias.
Previous research replicated the hierarchical AQ-28 structure among self-reporting British and Dutch autistic samples (Grove et al., 2017, 2021; Kuenssberg et al., 2014), and the current findings further confirm the hierarchical structure in self-reporting Malaysian and Dutch general population samples. The stable hierarchical structure of AQ-28 in the general population of Malaysia and the Netherlands suggests that autistic traits may be structurally but not conceptually comparable in both cultures. In contrast, no support was found for the hierarchical structure in China and the Netherlands on the parent-report AQ-28 (Liu et al., 2022), suggesting that the psychometric properties of the parent- and self-report AQ-28 might differ.
Although our results of measurement invariance suggest that scores on the AQ-28 can be compared meaningfully between the general populations of Malaysia and the Netherlands, the DIF analysis indicated that a high number of items (39%) functioned differently. Surprisingly, our DIF items do not align with the items identified by Carruthers et al. (2018) as showing potential cultural differences (Japan and India compared to the United Kingdom; items 19 and 24 in this study). Also, as Carruthers et al. (2018) showed cross-cultural differences in the predictive value of parent-report AQ-50 items of an ASC diagnosis, this suggests that self- and parent-report AQ might function differently. Thus, although our measurement invariance results suggest that the self-report AQ-28 can be used for cross-cultural comparisons, the DIF results contradict this, and measurement invariance results might not generalise to other versions (parent-report) of the AQ.
Some factors demonstrated poor internal reliability in Malaysia but better reliability in the Netherlands. Notably, the Numbers/Patterns factor negatively correlated with the Social Behaviour factor and some items from the Numbers/Patterns factor correlated negatively with the total scale in the Malaysian sample but positively in the Dutch sample. While the poor internal reliability suggests that Numbers/Patterns items may not be a good measure of autistic traits in Malaysia, the negative correlations also suggest that endorsement of Numbers/Patterns items might in fact indicate lower autistic traits in Malaysia. Moreover, all but one item (item 22) from the Numbers/Patterns factor were identified as showing DIF, further confirming that these items function differently in the Netherlands and Malaysia. This coincides with recent findings of negative correlations between the ‘attention to details’ subscale and other subscales of the AQ-50 in China, but not in the United Kingdom (Ward et al., 2021). Ward and colleagues (2021) suggested that cross-cultural differences underlie the negative correlations, and we concur with their notion. Given that a majority (60%) of our Malaysian participants are Chinese Malaysian, the negative correlations of the Numbers/Patterns factor and items with the Social Behaviour factor and total AQ score might be explained by the meaning of and emphasis on numbers in the Chinese culture. There are numerous superstitions involving numbers in the Chinese culture. For instance, number 8 is considered a lucky number and number 4 is considered an unlucky number. These superstitions have a profound influence on behaviour such that one would intentionally seek or avoid certain digits in everyday life, such as birth dates, price endings and car plates (Almond et al., 2015; Simmons & Schindler, 2003; Wong et al., 2019). Although there are also superstitious beliefs about numbers in the West (e.g. ‘13’), the effects of such superstitions on behaviour are likely milder than in the Chinese culture. Moreover, while autistic children performed significantly better in detecting embedded figures than non-autistic children in the United Kingdom, no such difference was found between autistic and non-autistic children in Singapore (Koh & Milne, 2012). Together these findings suggest that noticing patterns, numbers or details may not be a universal indicator of ASC across cultures. Therefore, a high score on the Numbers/Patternsscale might not reflect ‘autistic’ traits per se but instead socially appropriate behaviours or preferences in Malaysian and Chinese cultures. This in turn, might partly explain the significantly higher AQ-28 scores of Malaysians compared to Dutch participants. Yet, even after excluding the Numbers/Patterns items, Malaysians still scored higher on the AQ-28 than the Dutch participants.
The higher AQ-28 scores among Malaysians compared to Dutch adults is consistent with previous findings of higher AQ-50 scores of Malaysians compared to British adults (Freeth et al., 2013). With this study, we could rule out measurement non-invariance as a potential explanation. Differences in AQ-28 scores between Malaysian and Dutch adults may originate from true differences in subclinical autistic traits and/or cultural differences in the interpretation or reporting of autistic traits (de Leeuw et al., 2020). We tend to favour the latter explanation, as we identified 11 items that show DIF and possibly display cultural bias (Table 3). The AQ was developed based on Western social norms, but what is considered a norm in the West might not apply to other cultures. For instance, using a Western assessment tool for pretend play, the Child-Initiated Pretend Play Assessment, 75% of typically developing Malaysian children were identified as showing abnormal play style (Vetrayan et al., 2016). Furthermore, parents from collectivistic cultures, where social relatedness and collective goals are highly valued, are less likely to emphasise imagination as a socialisation goal than parents from individualistic cultures, where independence of self and personal goals are valued more (Mone et al., 2016). Cultural differences in play styles and emphasis on imagination might evoke different responses of Dutch and Malaysian participants on items concerning pretend play, imagination, and numbers, causing these items to show DIF, and possibly explaining the higher AQ scores among Malaysian participants.
The higher AQ scores among Malaysians do imply that the AQ cutoff scores should be adjusted to reflect these cross-cultural differences. In this study, the mean score of Malaysian participants is above the recommended cutoff of 65 or slightly below the strict cut-off of 70 (Hoekstra et al., 2011), suggesting that generalisation of cut-off scores from one culture to another is likely to result in false positives. Therefore, instead of generalising the cut-off score of the AQ-28 from one culture to another, the cut-off should be derived from the target culture, by studying autistic samples in addition to general population samples.
The language in which the AQ-28 was administered to Malaysian and Dutch participants might also explain the higher AQ-28 score of Malaysians and items that showed DIF. Dutch participants filled in the Dutch AQ-28, which is likely their native language, while Malaysian participants filled in the English AQ-28, which is likely their second language. Malaysian participants were able to choose to answer the AQ-28 in Bahasa Malaysia or English, and the majority of them chose English. Although Malaysians, especially a sample mainly recruited via a British university where fluency in English is a prerequisite and multilingual students are prevalent, generally have high proficiency in English (Education First, 2021), English proficiency might still influence the interpretation of AQ-28 items and thus contribute to some items showing DIF. In addition, Malaysian Chinese scored significantly higher on the English AQ-50 than on the Mandarin AQ-50 (Chee & de Vries, 2022), and similar patterns were observed in Chinese from China (Ward et al., 2021). This might have added to the differences in AQ-28 scores between Malaysian and Dutch participants in this study, but we conjecture that language is a relatively minor contributing factor, given that the AQ score differences between languages in previous studies were small (a three-point difference on the AQ-50; Chee & de Vries, 2022; Ward et al., 2021). Future research could compare the AQ-28 in the native language of participants to inspect whether the score differences remain and whether the same items would show DIF.
Limitations and implications
While we aimed to recruit a general population sample in Malaysia, most participants were students. Thus, replication of these findings in a general population sample as well as clinical samples is necessary.
Given that we did not inquire about an ASC diagnosis in the Malaysian sample, there is a possibility that the Malaysian sample contained autistic participants. This could potentially explain the elevated AQ-28 scores among Malaysian as compared to Dutch sample. However, among a recent survey of 2732 Malaysian university students, only 8 students reported an ASC diagnosis while another 68 suspected themselves to have an ASC (Low et al., 2021). Therefore, it is probable that our Malaysian sample contained a very low number of participants with an actual autism diagnosis, with minimal expected effects on our results. Furthermore, the elevated AQ scores among Asian participants as compared to Western participants are consistently observed across studies even when native language is used (Ward et al., 2021; Wheelwright et al., 2006). This suggests that genuine cross-cultural differences in the interpretation, report and/or expression of autistic traits are a more likely explanation for the score differences between our Malaysian and Dutch participants.
Our DIF analysis was exploratory in nature. While it is useful in offering preliminary insights into which items are likely to be culturally sensitive, reasons for DIF are not straightforward. Future research should consider conducting the DIF analyses with hypotheses grounded in a cultural framework that provides a basis to why some items might be interpreted differently in different cultures.
Conclusion
Our results demonstrated that the factor structure of the AQ-28 is stable in Malaysia and the Netherlands. With the evidence for cross-cultural measurement invariance, we corroborate and extend previous findings by showing that Malaysians scored significantly higher on the AQ-28 than Dutch adults from the general population. We also identified 11 items potentially showing DIF. These findings together suggest that the AQ-28 has some cultural biases. Therefore, in line with the recent call to incorporate cultural factors in understanding ASC (de Leeuw et al., 2020), future research should validate or develop culturally appropriate screening and diagnostic tools and cutoff scores. Nonetheless, the AQ-28 might still be a useful instrument in quantifying and comparing autistic traits cross-culturally, given the evidence for its factor structure and cross-cultural measurement invariance in Malaysia and the Netherlands. The potential differential functioning of some items, particularly those of the Numbers/Patterns scale, deserve further examination. The next step in improving the detection and diagnosis of ASC in Malaysia should involve scrutiny of the AQ-28 among both clinical and general populations in order to determine a meaningful cut-off.
Supplemental Material
sj-docx-1-aut-10.1177_13623613221147395 – Supplemental material for The factor structure and measurement invariance of the Autism Spectrum Quotient-28: A cross-cultural comparison between Malaysia and the Netherlands
Supplemental material, sj-docx-1-aut-10.1177_13623613221147395 for The factor structure and measurement invariance of the Autism Spectrum Quotient-28: A cross-cultural comparison between Malaysia and the Netherlands by Zhong Jian Chee, Anke M Scheeren and Marieke De Vries in Autism
Supplemental Material
sj-docx-2-aut-10.1177_13623613221147395 – Supplemental material for The factor structure and measurement invariance of the Autism Spectrum Quotient-28: A cross-cultural comparison between Malaysia and the Netherlands
Supplemental material, sj-docx-2-aut-10.1177_13623613221147395 for The factor structure and measurement invariance of the Autism Spectrum Quotient-28: A cross-cultural comparison between Malaysia and the Netherlands by Zhong Jian Chee, Anke M Scheeren and Marieke De Vries in Autism
Footnotes
Declaration of conflicting interests
The author(s) declared no potential conflicts of interest with respect to the research, authorship, and/or publication of this article.
Funding
The author(s) received no financial support for the research, authorship, and/or publication of this article.
Supplemental material
Supplemental material for this article is available online.
References
Supplementary Material
Please find the following supplemental material available below.
For Open Access articles published under a Creative Commons License, all supplemental material carries the same license as the article it is associated with.
For non-Open Access articles published, all supplemental material carries a non-exclusive license, and permission requests for re-use of supplemental material or any part of supplemental material shall be sent directly to the copyright owner as specified in the copyright notice associated with the article.