
Abstract
New Zealand has few estimates of the prevalence of autism spectrum disorder and no national registry. The use of administrative data sources is expanding and could be useful in autism spectrum disorder research. However, the extent to which autism spectrum disorder can be captured in these data sources is unknown. In this study, we utilised three linked administrative health data sources from the Integrated Data Infrastructure to identify cases of autism spectrum disorder among New Zealand children and young people. We then investigated the extent to which a range of mental health, neurodevelopmental and related problems co-occur with autism spectrum disorder. In total, 9555 unique individuals aged 0–24 with autism spectrum disorder were identified. The identification rate for 8-year-olds was 1 in 102. Co-occurring mental health or related problems were noted in 68% of the autism spectrum disorder group. The most common co-occurring conditions were intellectual disability, disruptive behaviours and emotional problems. Although data from the Integrated Data Infrastructure may currently undercount cases of autism spectrum disorder, they could be useful for monitoring service and treatment-related trends, types of co-occurring conditions and for examining social outcomes. With further refinement, the Integrated Data Infrastructure could prove valuable for informing the national incidence and prevalence of autism spectrum disorder and the long-term effectiveness of clinical guidelines and interventions for this group.
Lay abstract
New Zealand has few estimates of the prevalence autism spectrum disorder and no national registry or data set to identify and track cases. This hinders the ability to make informed, evidence-based decisions relating to autism spectrum disorder. In this study, we utilised linked health and non-health data to develop a method for identifying cases of autism spectrum disorder among children and young people in New Zealand. In addition, we examined rates of co-occurring mental health, neurodevelopmental and related conditions among this cohort and compared these to the general population. The method identified almost 10,000 children and young people with autism spectrum disorder in New Zealand. Co-occurring mental health or related problems were found in over 68% of this group (nearly seven times higher than the general population), and around half were identified with multiple co-occurring conditions. The most frequently identified conditions were intellectual disability, disruptive behaviours and emotional problems. We have developed a useful method for monitoring service and treatment-related trends, number and types of co-occurring conditions and examining social outcomes among individuals with autism spectrum disorder. While the method may underestimate the prevalence of autism spectrum disorder in New Zealand, it provides a significant step towards establishing a more comprehensive evidence base to inform autism spectrum disorder–related policy.
Keywords
Background
There is growing interest in autism spectrum disorder (ASD) research in Aotearoa/New Zealand, but a significant void in quantitative data (Ministries of Health and Education, 2016). Takiwātanga is a recently developed Te Reo Māori term used to describe ASD in New Zealand. 1 It derives from ‘tōku/tōna anō takiwā’ meaning ‘in my/his or her own time and space’. While increasingly associated with strengths such as visual thinking, logic and memory (AltogetherAutism, 2019; Meilleur et al., 2015), ASD/Takiwātanga can also have a variable effect on adaptive functioning (American Psychiatric Association, 2013a). It may be associated with intellectual disability, which affects 31% of individuals; mental health disorders, which affect 70% of individuals; and other medical conditions such as epilepsy, constipation and sleep problems (American Psychiatric Association, 2013a; Baio et al., 2018; Simonoff et al., 2008). The aetiology of ASD is understood to be multi-factorial and to involve a combination of genetic and environmental factors (Amaral, 2017; Kim & Leventhal, 2015; Trottier et al., 1999).
International estimates suggest that the prevalence of ASD is on the rise, partly due to improved identification, and partly due to changing definitions that now include autistic disorder and the broader spectrum of neurodevelopmental conditions such as Asperger’s disorder and pervasive developmental disorder. Environmental causes and genetic/environmental interactions have also been postulated to play a lesser role (Amaral, 2017). Recent estimates from the United States suggest 16.8 per 1000 children (or 1 in 59) have ASD (Baio et al., 2018). In New Zealand, there is very limited data on the incidence, prevalence, age of diagnosis and management of ASD (Eggleston et al., 2019; Thabrew & Eggleston, 2018). Ministry of Health (MoH) publications still base ASD prevalence numbers on older United Kingdom research from 2006, suggesting ASD affects only 1% of the New Zealand population (Ministries of Health and Education, 2016) but warn that these figures should be regarded as conservative (New Zealand Guidelines Group, 2010). An estimate from the most recent New Zealand Health Survey (NZHS), during which families and whānau self-reported having received an ASD diagnosis for their child, suggests that in children aged 2–14 years, the point prevalence may be as high as 1.6% (MoH, 2019a).
In New Zealand, ASD Guidelines (Ministries of Health and Education, 2016) recommend that an ASD diagnosis is made by a multidisciplinary team. This team comprises two or more of the following professionals with expertise in ASD and related conditions: a paediatrician, psychiatrist, psychologist, speech-language therapist and/or occupational therapist. The diagnosis for younger children is usually facilitated by paediatric child development teams, and for adolescents via specialist child and adolescent mental health services within district health boards (DHBs) (Thabrew & Eggleston, 2018). Referrals can come from many sources, including schools. The service is free and available to those under 19 years of age, but there can be a wait of several months and some parents opt instead for a diagnosis through a private psychiatrist, psychologist or paediatrician. Children do not need to be identified with a diagnostic label within schools to receive needs-based academic support.
There are a number of touch points in the New Zealand health system to facilitate early identification of ASD. Well Child Providers (including Plunket nurses) proactively monitor developmental milestones in the first few years of life. The B4 School Check (B4SC), a nationwide health screening programme for 4-year-old children, also provides an opportunity to identify behavioural and developmental issues prior to children starting school (Ministry of Health, 2015). Healthcare providers, such as general practitioners, are trained to opportunistically elicit concerns regarding developmental milestones when children present for other reasons. However, despite these measures, there are significant delays in diagnosis and regional disparities in the way ASD assessments are carried out and post-diagnostic support is offered (Ministries of Health and Education, 2016; Thabrew & Eggleston, 2018). 2
Internationally, the use of individual and linked administrative data for research into ASD is growing (Bachmann et al., 2018; Coo et al., 2017; Cummings et al., 2016; Dodds et al., 2009; Lin et al., 2013; Maenner et al., 2016; Nayfack et al., 2014; Schlenz et al., 2015; Vohra et al., 2017; Weiss et al., 2018). Utilising administrative data for health research has several advantages including the availability of large representative samples or coverage of entire populations, the ability to track problems and outcomes via regular collection of up-to-date data, long observation periods and low cost. Disadvantages include variability of data quality, limited clinical detail and potential public concern about administrative data being used for research purposes (Mazzali & Duca, 2015).
In New Zealand, although separate administrative data sets have sporadically been used to report rates of ASD (MoH, 2017a; Simpson et al., 2018), and combined case identification methods for mental health and related problems have been developed using the recently established Integrated Data Infrastructure (IDI) (Bowden et al., 2020; Social Investment Agency, 2019), the IDI has never been used for ASD research. This article explores the use of the IDI as a potential source of ongoing information. Key aims of the study were to explore (1) how the IDI could be used for identification of children and young people aged 0–24 years with ASD, (2) how the IDI could be used to understand the types and relative rates of ASD-related co-occurring conditions in this group and (3) ethnic and socioeconomic-related differences in diagnosed ASD via the IDI. This study does not aim to estimate ASD prevalence in New Zealand, given that currently available administrative data will not capture all cases of ASD.
Methods
IDI
The IDI is a large anonymised research database managed by Statistics New Zealand, containing a wide range of administrative and survey data about people and households, linked at an individual level 3 (see Figure 1) (Milne et al., 2019; Statistics New Zealand, 2017b). This includes administrative data from government departments such as health and education, non-government sectors such as the Auckland City Mission and survey data including the New Zealand census.
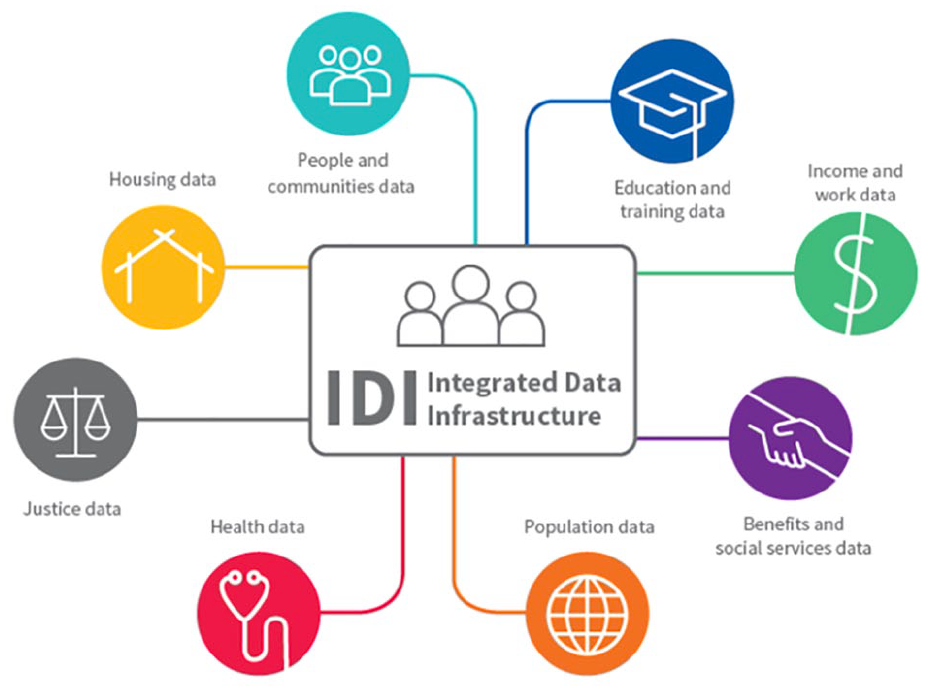
The Integrated Data Infrastructure.
Data in the IDI are held in a secure environment and can be accessed by approved researchers only for projects that are in the public interest. Records are linked probabilistically by Statistics New Zealand, usually using name, date of birth and sex. 4 The IDI enables the use of cross-sectoral government data for research to improve outcomes for New Zealanders, including but not limited to policy and interventions research, and analysis of life outcomes of population cohorts over time. Few countries have this capability (Atkinson & Blakely, 2017; Milne et al., 2019).
Data privacy
Statistics New Zealand’s (2017a) ‘five safes’ framework is used to ensure data privacy: only approved researchers can use the IDI for projects that have a statistical or research purpose and are for the public good. All data are de-identified and only accessible via a secure connection from approved datalabs. Data and results must be aggregated and anonymised according to Statistics New Zealand (2017c) protocols, and all results are checked for confidentiality by Statistics New Zealand prior to their release from the secure environment.
Legal requirements to protect IDI data include the Statistics Act 1975, Privacy Act 1993 and the Tax Administration Act 1994 (Statistics New Zealand, 2017a). In addition to legal requirements, a number of Statistics New Zealand (2017c) policies, protocols and guidelines exist. Regular privacy impact assessments for the IDI also provide a systematic evaluation of the benefits and risks associated with integrating data from a number of sources (Statistics New Zealand, 2017d).
Data
Three health data sets housed in the IDI were used in this study for ASD case identification and were accessed from the March 2019 refresh of the IDI. Two additional data sets were used to identify co-occurring conditions. These data sets are each described below. Bowden et al. (2020) provide a more detailed discussion, in particular around their strengths and weaknesses for case identification (Bowden et al., 2020).
Identifying ASD
Programme for the Integration of Mental Health Data
Programme for the Integration of Mental Health Data (PRIMHD) is a national collection of all publicly funded specialist mental health service use contacts including DHB and non-governmental organisation (NGO) contacts. Diagnosis data are collected from DHBs that provide specialist mental health services including youth mental health services and public inpatient and community-based services (Statistics New Zealand, 2015b). Health professionals who contribute to these data include psychiatrists, psychologists, social workers and developmental paediatricians.
Individuals were classified as having ASD if they had a primary, secondary or provisional diagnosis code for: Diagnostic and Statistical Manual of Mental Disorders (4th ed.; DSM-IV) 299.00 (autistic disorder), 299.10 (childhood disintegrative disorder), 299.80 (Asperger’s disorder/pervasive development disorder NOS); ICD-10-AM F84.0 (autistic disorder), F84.1 (atypical autism), F84.3 (other childhood disintegrative disorder), F84.5 (Asperger’s syndrome), F84.8 (other pervasive developmental disorders) and F84.9 (pervasive developmental disorder, unspecified). The set of codes above was established from the literature (American Psychiatric Association, 2013b) in combination with local clinical consultation.
The National Minimum Dataset
National Minimum Dataset (NMDS) is a national collection of publicly funded New Zealand hospital discharges, including day patients (stays of 3 h or more but not overnight) and emergency department visits of greater than 3 h. Primary and secondary diagnosis codes (ICD-10-AM) are recorded for every hospital event (Statistics New Zealand, 2015c).
Individuals were identified with ASD if they had a hospital discharge containing a primary or secondary diagnosis for ASD using the ICD-10-AM codes noted above.
Socrates
Socrates is the national database of the MoH’s Disability Support Services (DSS) clients and service providers. When individuals apply for a needs assessment to access support services, they are assessed by a Needs Assessment Service Coordination (NASC) agency and have their data recorded in Socrates. A range of disabilities can be recorded for an individual, including ASD. The diagnosis of ASD is provided to the NASC upon referral, typically from a developmental paediatrician, child and adolescent psychiatrist, general practitioner or psychologist.
There have been a number of changes over time regarding ways that NASCs have assessed and funded people with ASD. For example, despite the inclusion of Asperger’s disorder in DSM-IV from 1994, anecdotally Asperger’s was rarely funded. For the next 20 years, funding support was difficult to access. Some NASCs were flexible and stretched their funding. But for others eligibility was rigid, and some NASCs required IQ tests to be performed by specific psychologists and declined funding to individuals with an IQ of one or two points above the threshold of 70. From 2 April 2014, as a result of years of advocacy work by families, clinicians and others, the MoH decreed that access to DSS no longer required a dual diagnosis of intellectual disability, and ASD alone was an approved diagnosis for support (MoH, 2014, 2018)
Three assigned diagnosis codes, 1211 (ASD), 1206 (Asperger’s syndrome) and 1207 (Retired – Other ASD), 5 were used for case identification from Socrates.
Identifying co-occurring conditions
Pharmaceutical collection
The pharmaceutical collection contains information about government-subsidised medications dispensed by community pharmacies throughout New Zealand (Statistics New Zealand, 2015a). The main advantage of using pharmaceutical data for case identifications is that they include information about both specialist and general practitioner prescribing. Therefore, they provide some insights into care at the primary level. On the other hand, diagnoses must be inferred from medications dispensed and therefore there is greater potential for false positives compared to diagnoses obtained from PRIMHD and NMDS.
Mortality collection
The mortality collection was used to identify cases of fatal self-harm. The mortality collection contains information about the underlying causes of all registered deaths in New Zealand (MoH, 2017c). These data are considered robust and of high quality.
Co-occurring mental health and related problems, and intellectual disability
Co-occurring mental health and related problems were identified using an existing case identification method for New Zealand children and young people utilising the IDI (Bowden et al., 2020). This method draws on data from five sources (NMDS, PRIMHD, Socrates, the pharmaceutical collection and the mortality collection) and permits the identification of 13 different mental health and related problem groups: anxiety, depression, emotional problems, 6 bipolar disorder, substance problems, disruptive behaviours (attention-deficit hyperactivity disorder (ADHD), conduct disorders and oppositional defiance disorders (ODD)), eating disorders, sleep problems, psychosis, personality disorders, self-harm, mental health not defined 7 and other mental health problems. 8
For this study, the method was extended to include intellectual disability. Cases of intellectual disability were identified using: ICD-10-AM codes, F70-F79 in NMDS and PRIMHD; DSM-IV codes, 317* 319*, 3180, 3181, 3182, and team type code, 12 (Intellectual Disability Dual Diagnosis Team) in PRIMHD; and assigned diagnosis codes, 1208 (intellectual disability, type not specified), 1209 (learning disability, type not specified), 1210 (developmental delay, type not specified) and 1299 (other intellectual, learning or developmental disorder) in Socrates.
Data preparation
Data preparation was carried out in SAS 7.1 within the IDI environment. There were two steps. First, cases of ASD were identified over the 6-year period from 2010/2011 to 2015/2016 for all individuals in the New Zealand child and young person population (0–24). This time period was chosen because it overlapped with the most up-to-date and available data required for the mental health case identification method. A dichotomous ASD indicator flagged individuals with at least one ASD code in any of the three data sources. The modified mental health case identification method was then applied over the 6-year period to add details of co-occurring mental health, neurodevelopmental and related conditions. The resulting data were analysed using StataMP15. All counts were randomly rounded to base 3 adhering to Statistics New Zealand confidentiality requirements.
Establishing the New Zealand child and young person (0–24) population
The New Zealand child and young person population (0–24) was calculated using existing methods for estimating a resident New Zealand population (i.e. a population of people currently living in New Zealand) from the IDI (Gibb et al., 2016; Zhao et al., 2017). Individuals were included in the population if they had used key services in New Zealand over the preceding 2 years. Individuals who had died or moved overseas were excluded. Case identifications were restricted to people from within this population.
Analysis
Demographic variables
The number of children and young people identified with ASD across the 6-year period is presented overall, by gender, age, ethnic group, socioeconomic status and urban/rural profile of residence. Five age categories were employed, each in 5-year groups: 0–4, 5–9, 10–14, 15–19, 20–24. The 0–24 age range was chosen based on the World Health Organization definition of youth. The age groupings were chosen to be consistent with previous IDI-based case identification studies (Bowden et al., 2020) and broadly reflect the way provision of secondary health services is organised. Age was measured at the end of the fiscal year. Six ethnic groups were used and are defined via the total concept approach, meaning that an individual can identify with more than one ethnic group. These were: New Zealand European (NZE); Māori; Pasifika; Asian; Middle Eastern, Latin American and African (MELAA); and Other.
Socioeconomic deprivation was measured using the New Zealand Deprivation Index (NZDep) 2013 (Atkinson et al., 2014). NZDep is an area-based measure that assigns a deprivation score based on the meshblock (i.e. neighbourhood) in which an individual was living. Scores were collapsed into quintiles with quintile 1 representing the least deprivation and 5 the greatest. The most recently registered meshblock of residence before the end of the fiscal year was used. If an individual did not have any registrations prior to the end of the fiscal year, the first update in the 12 months after the end of the fiscal year was used. Meshblock of residence was also used to determine the urban/rural profile of individuals. The Statistics New Zealand (2016) urban/rural classification has five categories: (1) Main urban (population of at least 30,000), (2) secondary urban (population 10,000–29,999), (3) minor urban (population 1000–9999), (4) rural centre (population 300–999) and (5) other rural (population <300). These were collapsed into two groups to form a binary indicator: urban (main urban, secondary urban and minor urban area) and rural (rural centre and other rural).
Calculating identification rates of ASD and co-occurring conditions
Identification rates for ASD were calculated for the most recent fiscal year (2015/2016) and restricted to the corresponding estimated resident children and young person (0–24) population in New Zealand for that time period. Because ASD is a chronic condition, an individual was deemed to have ASD, and therefore included in the numerator, if at least one case identification was made at any stage during the 6-year study period (2010/2011–2015/2016). Rates were calculated overall and by gender for each age category, ethnic group, deprivation level and urban/rural profile. Rates of co-occurring conditions were calculated in the same way for both ASD and non-ASD populations. 9 In line with the Bowden et al. (2020) mental health case identification method, some conditions had age restrictions imposed to ensure clinical relevance and improved accuracy (Bowden et al., 2020). For example, personality disorders were restricted to those aged 18 and over, and substance problems to those aged 10 and over.
Standardisation and comparison of rates of co-occurring conditions
In order to compare like with like, particularly given the different demographic compositions of the ASD and non-ASD groups, rates of co-occurring conditions and rates of the cumulative number of co-occurring conditions were standardised to adjust for differences in demographic variables available in the study (sex, age, ethnicity, deprivation and urban/rural). Marginal predictions from logistic regressions of the binary indicator of co-occurring condition on a covariate binary indicator for ASD and demographic variables were used. Adjusted rates of co-occurring conditions for both the ASD and non-ASD groups were generated as the average of the resulting predicted probabilities. Differences between adjusted rates were tested using Wald Z-tests, under a null hypothesis that ASD has no influence beyond random variation, H0: ASD = 0 (i.e. a diagnosis of ASD was not identified in the data). A similar process was used to estimate rates of cumulative conditions standardised for all measured demographics. A multinomial logistic regression was employed to calculate adjusted rates as the average predicted probabilities at each incremental level of cumulative conditions. A chi-square statistic was used to test any associations with ASD, H0: ASD = 0, at each outcome level.
Changes over time in Socrates data
To understand the potential impact of changes made to the needs assessment process, the rate of intellectual disability was calculated separately for the ASD group who were identified using only Socrates data prior to 2 April 2014.
Results
In total, 9555 unique individuals aged 0–24 were identified with ASD (see Table 1). Males were identified at nearly four times the rate of females. The ratio of males to females was greatest among the younger age groups, Asian and Pasifika populations and, to some extent, more deprived socioeconomic groups. Across age categories, the largest number of cases of ASD was identified in the 5–9 age group. Over three-quarters of the individuals identified as NZE (compared to 66% of the IDI-based youth estimated resident population who identify as NZE), 21% as Māori (compared to 25%), 12% as Asian (compared to 16%) and only 9% as Pasifika (compared to 13%). Cases of ASD increased slightly as deprivation increased, from 18% of total cases for the least deprived to 21% for the most deprived, matching the NZDep distribution of New Zealand’s youth population. Almost 90% of identified cases resided in urban areas.
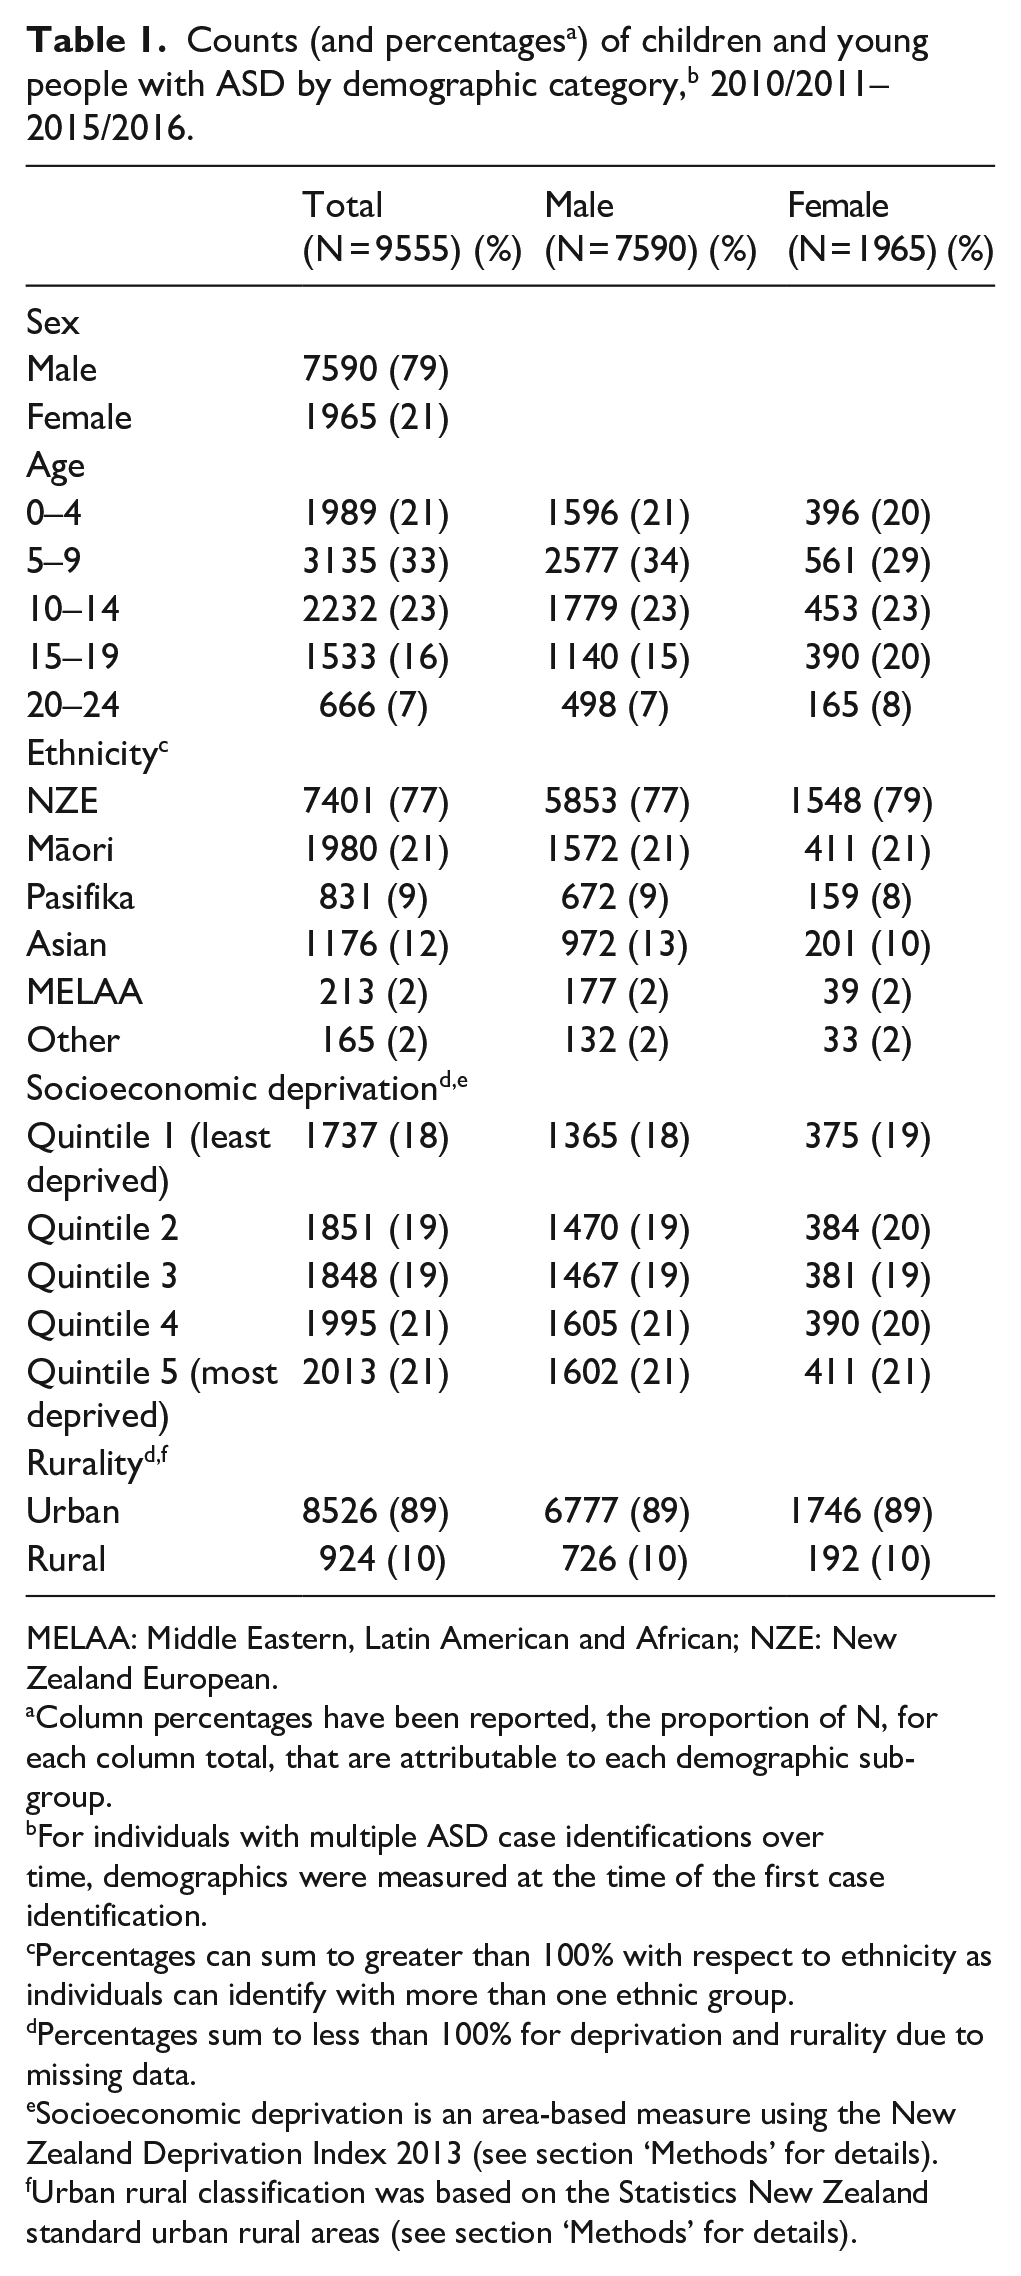
MELAA: Middle Eastern, Latin American and African; NZE: New Zealand European.
Column percentages have been reported, the proportion of N, for each column total, that are attributable to each demographic sub-group.
For individuals with multiple ASD case identifications over time, demographics were measured at the time of the first case identification.
Percentages can sum to greater than 100% with respect to ethnicity as individuals can identify with more than one ethnic group.
Percentages sum to less than 100% for deprivation and rurality due to missing data.
Socioeconomic deprivation is an area-based measure using the New Zealand Deprivation Index 2013 (see section ‘Methods’ for details).
Urban rural classification was based on the Statistics New Zealand standard urban rural areas (see section ‘Methods’ for details).
Table 2 shows the data sets from which ASD diagnoses were sourced. Individuals can have a diagnosis in more than one data set, therefore, the row percentages sum to more than 100%. Approximately three-quarters of ASD cases were identified via needs assessments (Socrates). One-quarter of individuals identified with ASD were captured in mental health settings (PRIHMD) and just under a quarter in hospital settings (NMDS). There was variation in the distribution of data source by age, ethnicity and to a lesser extent deprivation. In particular, the percentages of individuals identified with ASD through Socrates decreased markedly by age, from 97% for the youngest age group to 53% for the oldest. Conversely, the percentage of individuals identified increased with age with respect to both NMDS and PRIMHD. People identifying as Pasifika or Asian, and to a lesser extent Māori, were less likely to be identified in PRIMHD relative to other ethnic groups. Those in the most deprived socioeconomic groups were more likely to be identified in NMDS and Socrates, and less likely to be identified in PRIMHD.
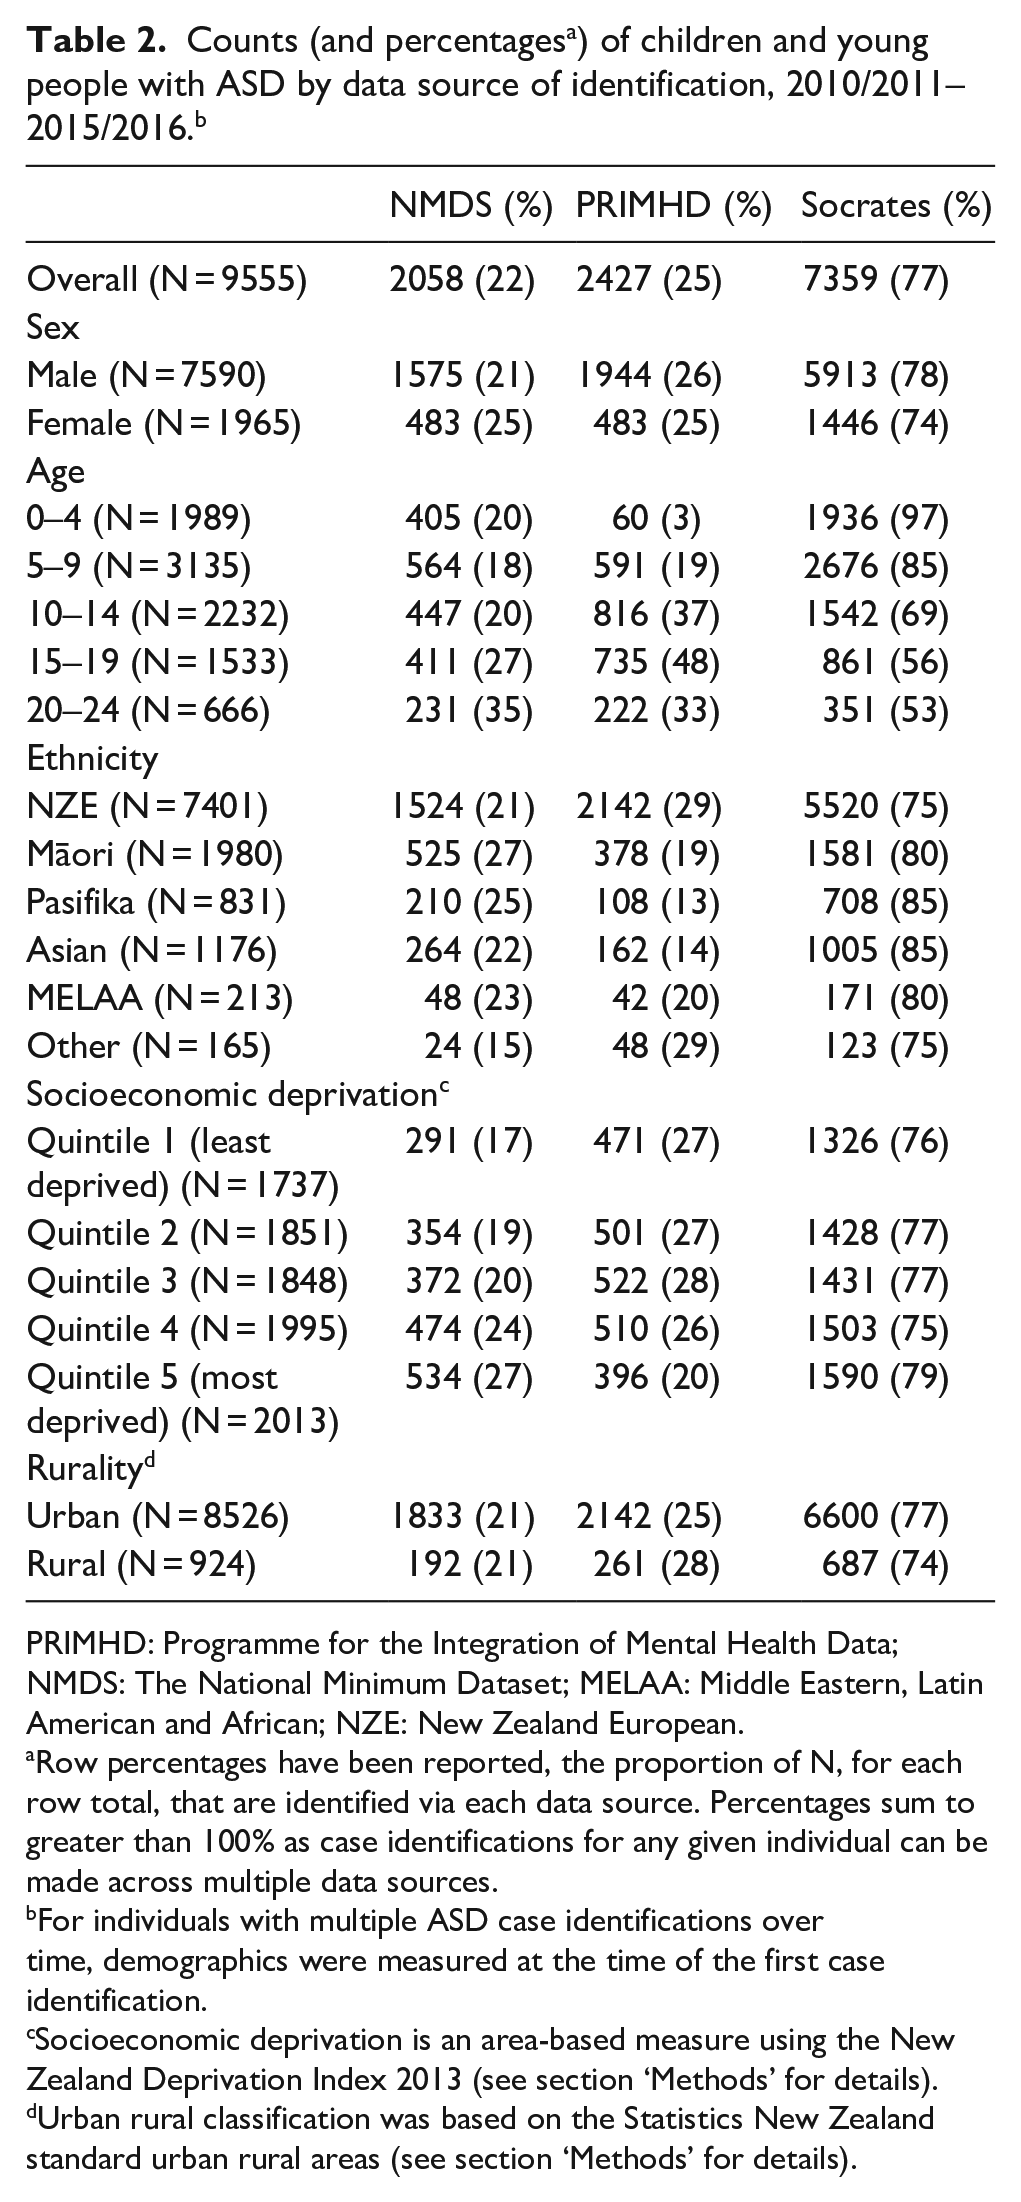
PRIMHD: Programme for the Integration of Mental Health Data; NMDS: The National Minimum Dataset; MELAA: Middle Eastern, Latin American and African; NZE: New Zealand European.
Row percentages have been reported, the proportion of N, for each row total, that are identified via each data source. Percentages sum to greater than 100% as case identifications for any given individual can be made across multiple data sources.
For individuals with multiple ASD case identifications over time, demographics were measured at the time of the first case identification.
Socioeconomic deprivation is an area-based measure using the New Zealand Deprivation Index 2013 (see section ‘Methods’ for details).
Urban rural classification was based on the Statistics New Zealand standard urban rural areas (see section ‘Methods’ for details).
Overall, approximately 57 per 10,000 children and young people in New Zealand had received an ASD diagnosis, as captured across the three data sets used by the end of the 2015/2016 fiscal year 10 (see Table 3). The male identification rate was 88 per 10,000 and the female rate was 24 per 10,000. Identification rates were highest among the ‘other’ ethnic group, followed by NZE, and lowest among Pasifika. Although rates of ASD did not substantively differ between deprivation categories, they were higher among people living in urban compared to rural areas. When restricted to 8-year-olds, so as to be comparable with the Centers for Disease Control and Prevention (CDC) prevalence estimate of 1 in 59, the identification rate for ASD was 98 per 10,000 (or 1 in 102). See Figure 2 in the Appendix 1 for identification rates by age.
Identification rates of children and young people with ASD, 2015/2016 (per 10,000).
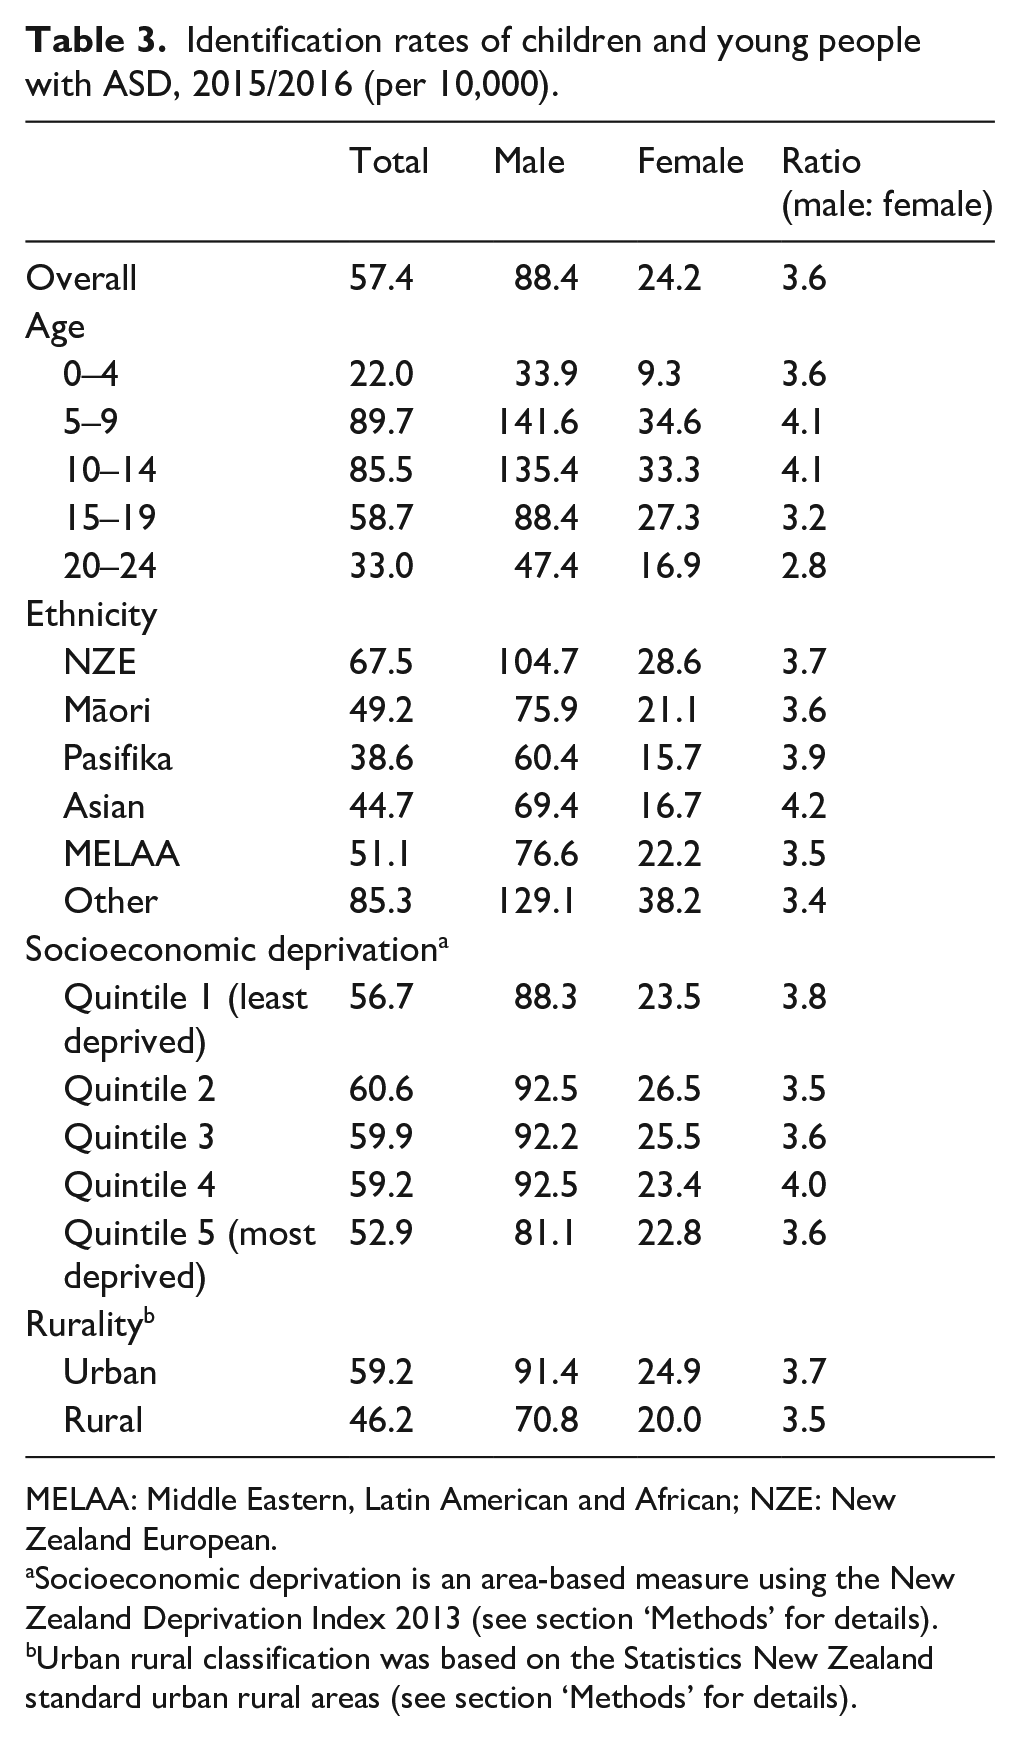
MELAA: Middle Eastern, Latin American and African; NZE: New Zealand European.
Socioeconomic deprivation is an area-based measure using the New Zealand Deprivation Index 2013 (see section ‘Methods’ for details).
Urban rural classification was based on the Statistics New Zealand standard urban rural areas (see section ‘Methods’ for details).
Table 4 presents the observed percentage of the ASD and non-ASD groups identified with different co-occurring conditions, as well as the adjusted ratio (ASD: non-ASD). The ratio has been adjusted for demographic variables to enable better comparison between the ASD and non-ASD groups (see ‘Methods’ for details). Almost 70% of the 2015/2016 ASD children and young person population had at least one co-occurring condition, six times that of the general (non-ASD) population. The most common co-occurring conditions in the ASD group were intellectual disability (30%; 62 times more likely than in the general population), disruptive behaviours (30%; 14 times more likely), mental health not defined (29%; seven times more likely) and any emotional disorder, which included mixed anxiety and depression (28%; six times more likely). Compared to the general population, other co-occurring conditions identified at high rates were ODD (18 times more likely), psychosis (16 times more likely), ADHD (14 times more likely) and anxiety (10 times more likely). Within the ASD group, 23% had one, 15% had two and 9% had five or more co-occurring conditions (see Table 4). These proportions all exceeded those in the non-ASD group and adjusted ratios between the two groups increased with the number of co-occurring conditions.
Co-occurring conditions among children and young people with and without ASD, and adjusted ratios, 2015/2016.
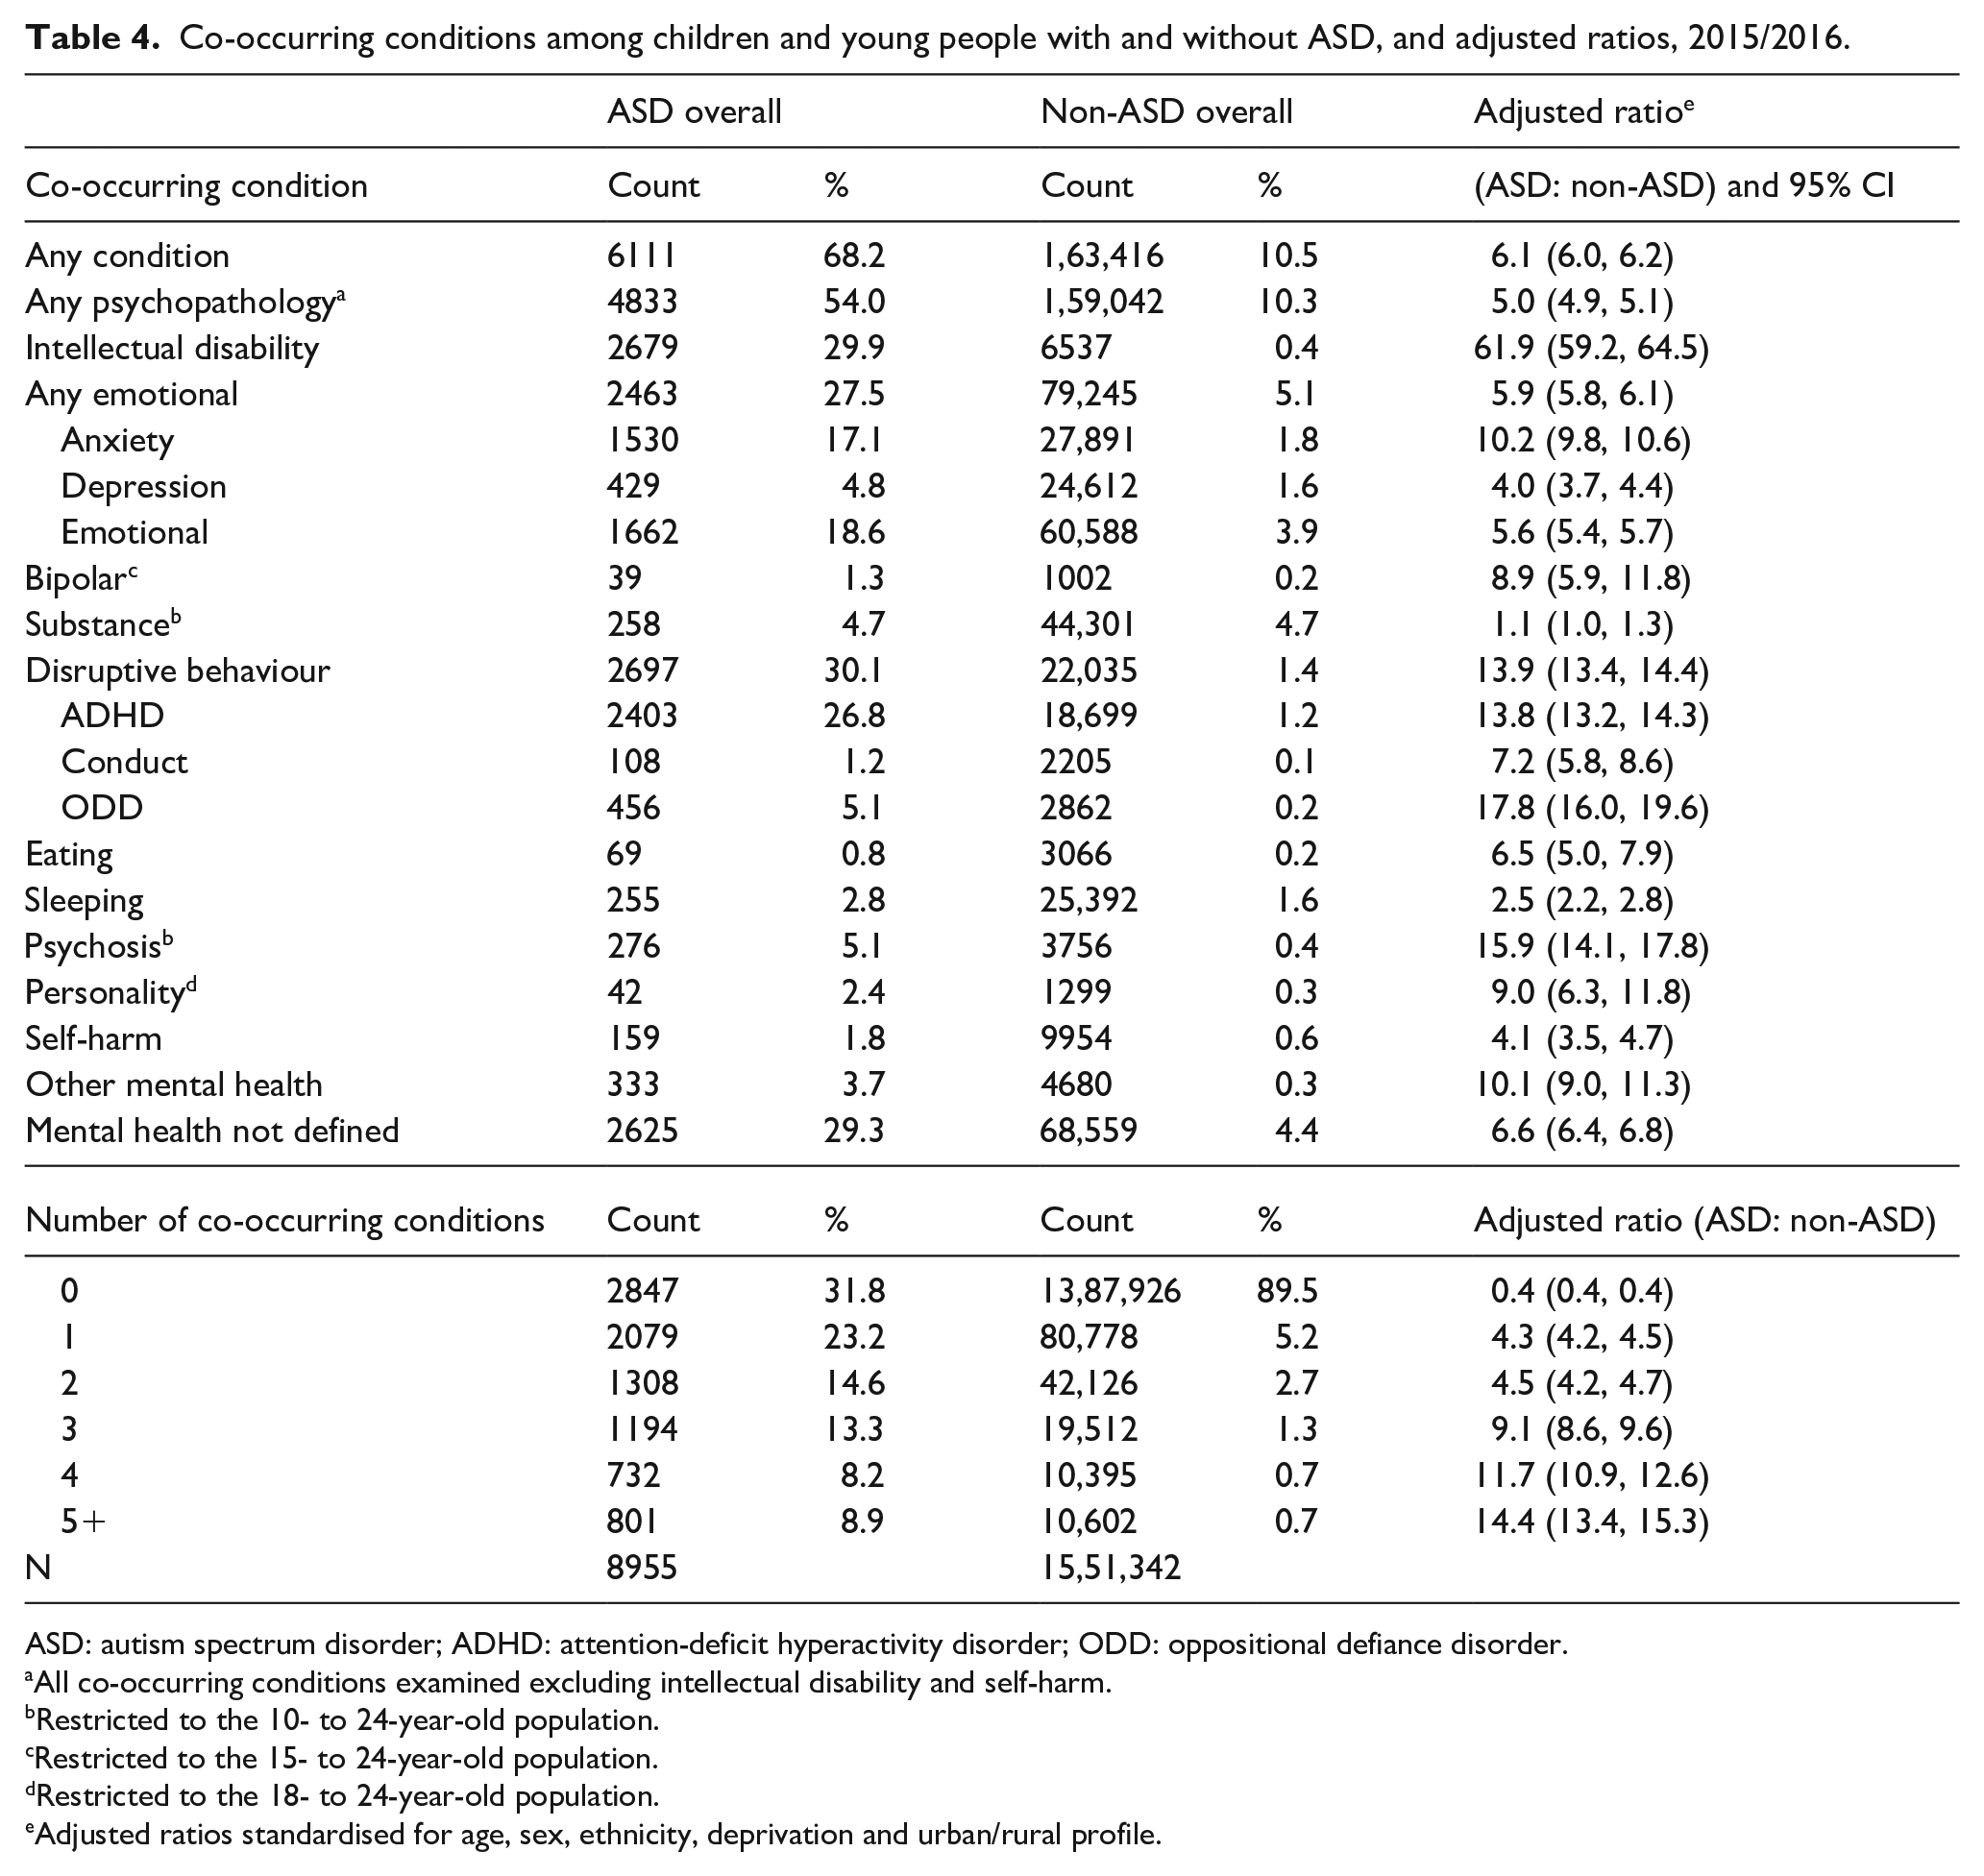
ASD: autism spectrum disorder; ADHD: attention-deficit hyperactivity disorder; ODD: oppositional defiance disorder.
All co-occurring conditions examined excluding intellectual disability and self-harm.
Restricted to the 10- to 24-year-old population.
Restricted to the 15- to 24-year-old population.
Restricted to the 18- to 24-year-old population.
Adjusted ratios standardised for age, sex, ethnicity, deprivation and urban/rural profile.
Changes over time in Socrates data
For case identifications made using only Socrates data prior to 2 April 2014 (examined due to changes in eligibility criteria for disability support), the rate of intellectual disability was 36%, compared to 28% for all other sources of case identifications. These differences were similar for both males and females.
Discussion
Key findings
Using a novel case identification method based on three linked IDI health data sets between 2010/2011 and 2015/2016, we identified 9555 children and young people aged 0–24 years with ASD. Analysis of 2015/2016 data yielded an ASD identification rate of 57 per 10,000 children and young people (1 in 174 individuals) and 98 per 10,000 eight-year-olds (1 in 102 individuals). ASD was more common in males than females and in individuals of NZE ethnicity than in Māori and Pasifika populations. Although there did not appear to be any substantive deprivation-related difference in the identification rates of ASD, there was a notably greater rate among those residing in urban compared with rural areas. Individuals with ASD had considerably higher rates of most co-occurring mental health and related conditions, particularly intellectual disability, disruptive behaviour disorders and emotional disorders, compared to the general population.
Over three-quarters of cases of ASD were identified via the Socrates database. This is unsurprising given that most new diagnoses of ASD are made in paediatric settings that available linked data cannot capture (Thabrew & Eggleston, 2018). Given that individuals captured via Socrates were being assessed for government-funded disability support, it is highly likely that the current method is skewed towards the identification of those with more severe ASD and additional comorbidities, rather than individuals with less complex needs.
Comparing our rate of ASD with that from the recent CDC study, which found ASD in 1 in 59 eight-year-olds (Baio et al., 2018), it is possible and understandable that the IDI-based case identification method undercounts cases of ASD among comparable ages by roughly 40%. The undercount appears to increase with age. This is most likely because the data do not enable us to look back far enough to the time of diagnosis for the older cohorts, and because ASD did not become an approved diagnosis for disability support until 2014.
Despite knowing that we may not be capturing all cases of ASD using this method, it is reassuring that relative rates across gender and ethnic groups are consistent with both international and national estimates. Our estimated male to female ratio of 3.6:1 lies between widely cited 4:1 estimates (American Psychiatric Association, 2013a; Baio et al., 2018) and the 3:1 estimate of Loomes et al (2017) that they determine to be the ‘true’ ratio in a recent meta-analysis (Loomes et al., 2017). Patterns across ethnic groups are consistent with those seen in previous New Zealand studies (Eggleston et al., 2019; Virues-Ortega et al., 2017) and the results of the NZHS (MoH, 2019a). They also reflect previous US studies in which rates for minority ethnic groups (Hispanic and African American) were lower than European-American rates (Baio et al., 2018; Kogan et al., 2008).
The approach used to identify co-occurring mental health and related problems was based on an existing method (Bowden et al., 2020). A major limitation is that it does not detect all co-occurring diagnoses as it considers only certain parts of the health system. In particular, diagnoses received in primary care or private care may not be detected as data from these sectors are not included in the IDI. Therefore, it is considered conservative for rates of co-occurring conditions. However, for the ASD population identified in this article, we believe it is more likely to be indicative of true rates of mental health problems. The health of young people with ASD is heavily scrutinised and they are typically in frequent contact with the health system. In fact, the ASD case identification method requires that individuals identified with ASD must have had contact with the health system and their details captured in administrative data. Furthermore, at each of these points of contact, multiple diagnoses can, and typically will, be recorded. Therefore, although symptoms of ASD can often overlap with those of mental health conditions, they should be more likely to be identified among those with ASD compared to the general population.
Rates of specific co-occurring conditions are consistent with, although often at the lower end of, epidemiological literature (Leyfer et al., 2006; Mattila et al., 2010; Salazar et al., 2015; Simonoff et al., 2008; Van Steensel et al., 2013; Virues-Ortega et al., 2017). Our estimated rate of co-occurring intellectual disability (30%) is in line with the recent CDC estimate of 31% and comfortably in the range of estimates in the wider literature of 16.7% to 84% (Postorino et al., 2016). Rates of ADHD, ODD and conduct disorder are all consistent with, but marginally below, other studies (Leyfer et al., 2006; Mattila et al., 2010; Salazar et al., 2015; Simonoff et al., 2008). One notable exception is the rate of anxiety, which is substantively lower than in previous studies (Salazar et al., 2015; Simonoff et al., 2008; Van Steensel et al., 2011). This may be due to under-reporting of anxiety as it is perceived by some clinicians to be part of ASD, anxiety being subsumed into the category of ‘emotional problems’, or to the lack of data from primary care where most children with anxiety are treated. More generally, under-identification of co-occurring conditions may still be an issue among the ASD population. Despite children and young people with ASD being in contact with health services, it is likely that not all conditions will be captured in the data. This might explain why our estimates are at the lower end of epidemiological literature. Rates of single (68%) and multiple (45%) co-occurring mental health and related conditions are also similar to international estimates (Mattila et al., 2010; Simonoff et al., 2008; Van Steensel et al., 2013).
Despite the limitations of the case identification method, we feel it is useful to compare rates of co-occurring conditions among those with ASD to the general population. The large difference in rates of co-occurring conditions between ASD and non-ASD groups highlights the former as a group with high and complex health needs. Overall, the ASD group was six times more likely to be identified with any condition compared to the non-ASD group. Specific conditions identified at significantly higher rates included intellectual disability, disruptive behaviours, psychosis and anxiety.
The low relative rates of ASD identified in Māori, and Pasifika children and young people are consistent with previous New Zealand studies (Eggleston et al., 2019; Simpson et al., 2018). However, according to Elsabbagh and colleagues (2012), these are unlikely to reflect true ethnically based differences in prevalence. These differences are too large to be explained by the quality of ethnicity data capture. For Māori, access to the scope of ASD services available (including diagnosis) is desired; however, it is important that these services are culturally safe and able to respond to Māori direction (Bevan-Brown, 2004; Bevan-Brown et al., 2015; Durie, 2001). A history of institutional racism against Māori in many sectors, including the health sector, has led to disparities and inequalities in many areas of health (Harris et al., 2006). Inequitable access to services (Reid & Robson, 2000) and lack of cultural competency of care (Durie, 2001) likely affect receiving a diagnosis including ASD being misdiagnosed among Māori as behavioural problems, or overlooked completely (Bevan-Brown, 2004; Bevan-Brown et al., 2015).
Many of the institutional experiences of Māori were also visited upon those from other Pacific nations (Pasifika). However, traditionally, Pasifika would use a family or community-based model of care for their children, in keeping with conventions adopted from their cultural homes. Thus, the initial responsibility for childcare would be within the confines of family or community before seeking professional help, especially if that outside help was foreign to the cultural values of a Pacific community. There is some evidence that these trends are changing over time, as subsequent generations of Pacific migrant adopt health attitudes and practices in line with those of other New Zealanders (Kokaua et al., 2009; MoH, 2017b). Further research is required to determine and explain patterns of ASD and related issues in Māori and Pacific communities in New Zealand, especially as international evidence suggests it is possible to close gaps between ethnic communities (Baio et al., 2018).
Our finding that socioeconomic status was not related to rates of ASD is similar to that of some studies (Hrdlicka et al., 2016; Kelly et al., 2019; Larsson et al., 2005), but different from that of others (Durkin et al., 2010; Fountain et al., 2011; Li et al., 2014; Rai et al., 2012; Thomas et al., 2012). It has been postulated that systematic barriers facing socioeconomically disadvantaged people can make the health care system inaccessible to population pockets and therefore may affect receiving an ASD diagnosis (Kelly et al., 2019; Pickard & Ingersoll, 2016).
Lower rates of identified ASD among rural communities compared to urban areas are consistent with existing literature (Antezana et al., 2017). Geographic distance to healthcare providers, reduced ASD awareness, including within schools and healthcare providers, and potentially cultural characteristics such as lower levels of education and socioeconomic status, are all postulated to contribute to the diminished identification of ASD in rural areas.
Case identifications of ASD made using only Socrates data prior to 2 April 2014 showed higher rates of intellectual disability, in the order of 30%. This illustrates a broader issue that administrative data capture is subject to change over time. It is important that researchers are aware of such changes and potential implications and tailor the method to suit their research needs.
Policy implications
The case identification method was developed to enable quantitative research that we believe will have significant policy impacts for the ASD community in New Zealand. By identifying individuals with ASD in the IDI, and linking to current and future data sets, we can examine how life trajectories of young people with ASD differ from the neuro-typical population. Perhaps of greater value will be the examination of differences in life trajectories from within the ASD population, and the exploration of the ways that different experiences and backgrounds might result in different outcomes. This will be particularly useful for education and transition from school policies and will have implications for employment, independent living, justice system interactions, mental health and aged care support.
While the focus of the method was primarily to enable future IDI-based ASD research in New Zealand, the data presented in this article have policy implications of their own. The ethnic distribution of identified cases of ASD provides, for the first time, a quantifiable evidence base at the population level to substantiate previous concerns of inequitable access to diagnosis and supports (Ministries of Health and Education, 2016). Furthermore, the rates of co-occurring conditions demonstrate the complexity of ASD cases in New Zealand that will assist with policy and planning in health, education, income support and justice. Finally, while the intent of the method was not to determine prevalence, we believe that, over time, estimates of prevalence using this approach will become more accurate, particularly among younger age groups as more children come to the attention of health sectors collecting administrative data, most notably, disability support. This will be useful in policy and planning, especially in education where there is a lack of information about the number of young people who need support.
Limitations and strengths
At present, this method cannot be formally validated using currently available data within the IDI. A formal validation would help us quantify the level of undercount as well as understand the accuracy of ASD diagnoses the case identification method draws on. As discussed, based on existing international prevalence estimates, the method likely undercounts cases by approximately 40% among younger age groups, and this undercount increases with age. The absence of formal validation means we cannot comment with confidence on the rate of false positives among our ASD case identifications. ASD diagnoses are often complex and have overlapping features with other neurodevelopmental conditions making false positives a concern. Previous US-based studies on the validity of ASD diagnoses in administrative (insurance claims) data have reported positive predicted values (PPVs) high enough to suggest these are valid means to identify true ASD cases (74% by Burke et al., 2014; 81% by Coleman et al., 2015). Anecdotally, clinicians in New Zealand are typically very cautious when assigning an ASD diagnosis, often preferring an initial diagnosis of ‘Global Developmental Delay’ even when ASD is suspected. Furthermore, the NASC system, from which over three-quarters of our case identifications are derived, requires an official ASD diagnosis before support is provided. With this in mind, we expect that our method would have a PPV similar to these previous studies. Until validity can be demonstrated, researchers should be aware of and make explicit this limitation.
A further limitation is that the method employed for identifying rates of co-occurring conditions has not been formally validated (Bowden et al., 2020). Therefore, at the present time, there is no way to ascertain how accurate those rates may be. See Bowden et al. (2020) for a more detailed discussion around validation and further limitations of the mental health case identification method.
Other limitations include the use of administrative data for health analysis (a purpose for which it was not originally intended), restriction of data to three data sets within the IDI and the absence of both primary care and paediatric data. Furthermore, there exists a degree of bias in the complexity of identified cases due to the data source and the time periods that identifications originate from. These limitations notwithstanding, the case identification method enables research into ASD that supersedes existing approaches based on single data sources. Although the study period encompasses the switch from DSM-IV to Diagnostic and Statistical Manual of Mental Disorders (5th ed.; DSM-5), due to a lag time of 2–3 years for DSM updates to be incorporated into public health services, this is unlikely to affect identification rates.
Key strengths of the study are the examination of whole population health data so that it was possible to identify a national population of children and young people with ASD. This enabled analysis of differences between subgroups of gender, ethnicity and socioeconomic status and exploration of co-occurring conditions. We were also able to compare the identified ASD population with the non-ASD population.
Ethical issues
While it is legal to use administrative data in New Zealand for research purposes, issues of ethics and social licence have been raised, especially given that IDI now links these data sets at the individual level. As discussed in Bowden et al. (2019), more detailed review of these issues is critical, and particularly relevant to comparisons across ethnic groups, which could have the effect of disadvantaging Māori and Pasifika (Bowden et al., 2019; Durie, 2006).
Further research and potential uses
Further research is needed to formally validate the ASD case identification method described in this article. This could be possible by using the NZHS (MoH, 2019b), which contains ASD information and is scheduled to be added to the IDI. As the content of the IDI expands over time (and especially if primary healthcare data are added), the accuracy of the current method is likely to be improved. In line with previous findings from validation studies of ASD case identification methods, one possibility may be to explore the value of requiring two or more instances of ASD diagnosis information in the data to constitute a case identification (Burke et al., 2014; Coleman et al., 2015). The development and addition of a national ASD registry may also have value. Once the validity of the case identification method has been sufficiently demonstrated, it can be used with more confidence to track the health of children and young people with ASD. This will allow better understanding of pathways to risk and resilience, evaluation of the long-term impact of health and non-health interventions and reduction of existing health disparities.
Conclusion
This study provides preliminary evidence that linked data sets within the IDI can be used to identify cases of ASD and related co-occurring conditions among New Zealand children and young people. While it is important to bear in mind its limitations, the study demonstrates that the IDI has the potential to be a valuable source of information regarding well-being of children and young people with ASD.
Footnotes
Appendix 1
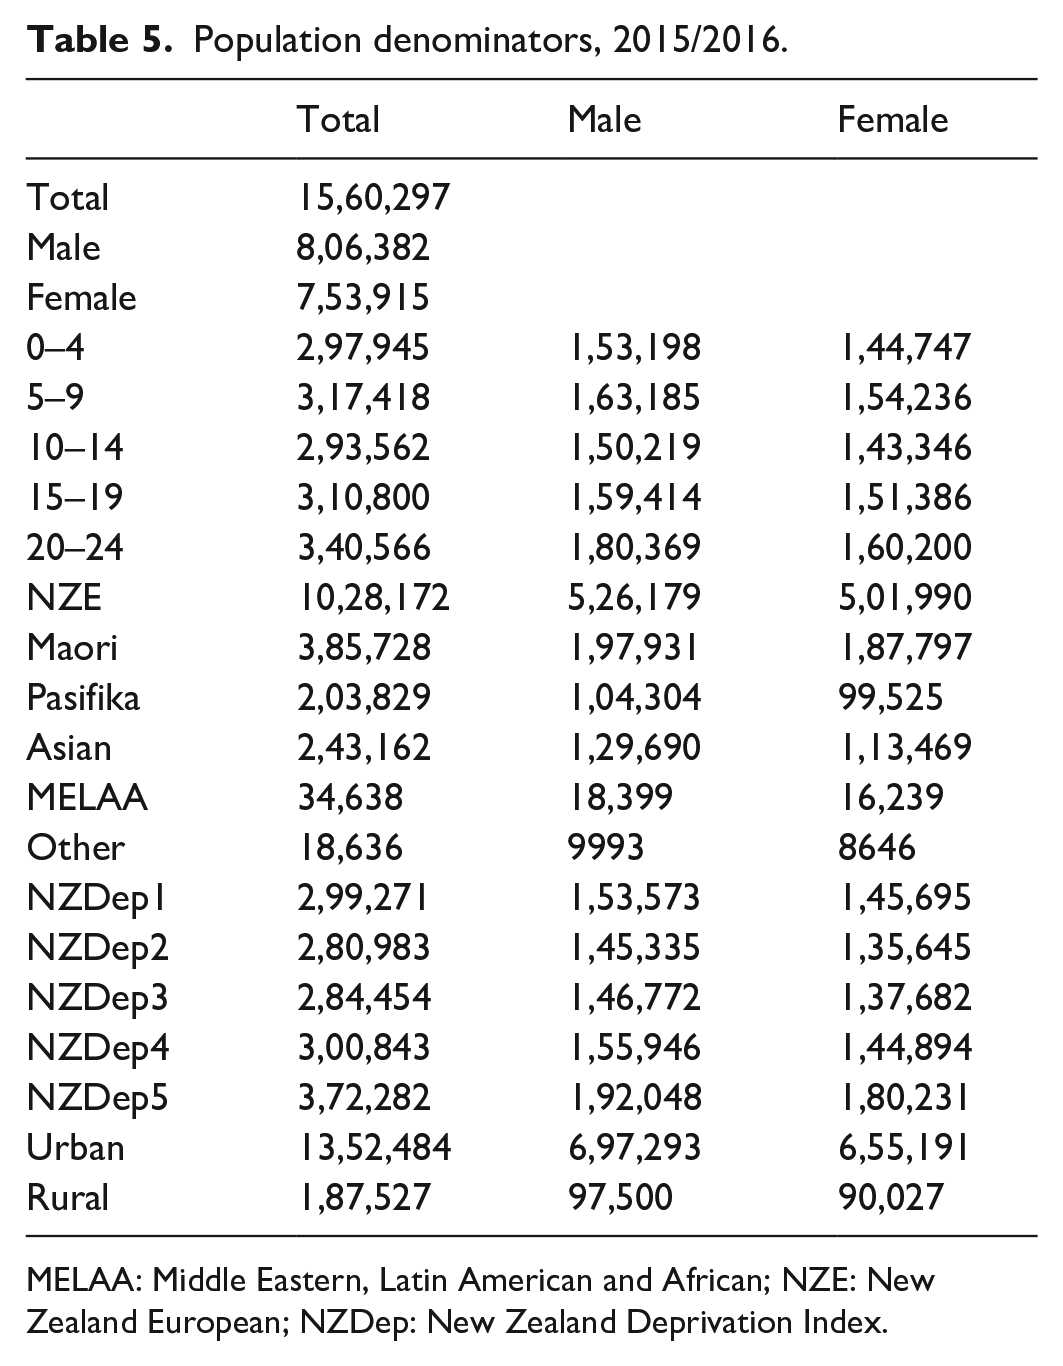
Population denominators, 2015/2016.
| Total | Male | Female | |
|---|---|---|---|
| Total | 15,60,297 | ||
| Male | 8,06,382 | ||
| Female | 7,53,915 | ||
| 0–4 | 2,97,945 | 1,53,198 | 1,44,747 |
| 5–9 | 3,17,418 | 1,63,185 | 1,54,236 |
| 10–14 | 2,93,562 | 1,50,219 | 1,43,346 |
| 15–19 | 3,10,800 | 1,59,414 | 1,51,386 |
| 20–24 | 3,40,566 | 1,80,369 | 1,60,200 |
| NZE | 10,28,172 | 5,26,179 | 5,01,990 |
| Maori | 3,85,728 | 1,97,931 | 1,87,797 |
| Pasifika | 2,03,829 | 1,04,304 | 99,525 |
| Asian | 2,43,162 | 1,29,690 | 1,13,469 |
| MELAA | 34,638 | 18,399 | 16,239 |
| Other | 18,636 | 9993 | 8646 |
| NZDep1 | 2,99,271 | 1,53,573 | 1,45,695 |
| NZDep2 | 2,80,983 | 1,45,335 | 1,35,645 |
| NZDep3 | 2,84,454 | 1,46,772 | 1,37,682 |
| NZDep4 | 3,00,843 | 1,55,946 | 1,44,894 |
| NZDep5 | 3,72,282 | 1,92,048 | 1,80,231 |
| Urban | 13,52,484 | 6,97,293 | 6,55,191 |
| Rural | 1,87,527 | 97,500 | 90,027 |
MELAA: Middle Eastern, Latin American and African; NZE: New Zealand European; NZDep: New Zealand Deprivation Index.
Acknowledgements
This research was part of A Better Start National Science Challenge, funded by the New Zealand Ministry of Business, Innovation and Employment (MBIE). We would like to thank Dr Rose Richards for her contributions.
Disclaimer
The results in this article are not official statistics. They have been created for research purposes from the Integrated Data Infrastructure (IDI), managed by Statistics New Zealand. The opinions, findings, recommendations and conclusions expressed in this article are those of the author(s), not Statistics New Zealand. Access to the anonymised data used in this study was provided by Statistics New Zealand under the security and confidentiality provisions of the Statistics Act 1975. Only people authorised by the Statistics Act 1975 are allowed to see data about a particular person, household, business or organisation, and the results in this article have been confidentialised to protect these groups from identification and to keep their data safe. Careful consideration has been given to the privacy, security and confidentiality issues associated with using administrative and survey data in the IDI. Further detail can be found in the Privacy impact assessment for the Integrated Data Infrastructure available from ![]() .
.
Ethical approval
The University of Otago Human Research Ethics Committee reviewed the study for ethics consideration. The study was reviewed as a ‘Minimal Risk Health Research – Audit and Audit related studies’ proposal and was approved.
Funding
The author(s) declared the following potential conflicts of interest with respect to the research, authorship, and/or publication of this article: This research was part of A Better Start National Science Challenge, funded by the New Zealand Ministry of Business, Innovation and Employment (MBIE); tranche 1 project, UOAX1511, and tranche 2 project, UOAX1901.