
Abstract
Transitioning to university can be anxiety-provoking for all students. The relationship between social anxiety, autistic traits and students’ social network structure, and perceived support is poorly understood. This study used a group-matched design where autistic students (n = 28) and typically developing students (n = 28) were matched on sex, age (17–19 years), ethnicity, pre-university academic performance and degree subject at university. Autistic students reported greater transition to university worries, and a smaller social network size compared to typically developing students, though perceived similar levels of support from their social networks. Autistic and typically developing students showed differential patterns of association with both autistic traits and social anxiety. Broader clinical and practical implications of findings are discussed.
Transitioning to university can be a challenging time for all students, as they face increased academic demands, the need to develop relationships in a more complex social scene, and learning to live independently away from home (Compas et al., 1986; Fisher & Hood, 1987; Lei et al., 2018). The retention rate, academic achievement and graduation prospects following university for many autistic 1 students can be especially poor when compared to their TD peers, as well as students with other forms of disability (Gobbo & Shmulsky, 2013; Lucas & James, 2018; Sanford et al., 2011). Transitioning to university can also have a negative impact on autistic students’ mental well-being (Jackson, Hart, Brown, & Volkmar, 2018; Jackson, Hart, & Volkmar, 2018), with many experiencing symptoms of anxiety (71%), depression (47%), feelings of loneliness (53%) (Gelbar et al., 2014), as well as greater worries associated with the social, academic and daily living aspects of university life (Lambe et al., 2018; Lei et al., 2018).
However, previous studies focusing on autistic students transitioning to university often did not include a well-matched TD control group. It is difficult to conclude to what extent the challenges reported by autistic students are uniquely and specifically related to their levels of autism, rather than other factors. For example, students studying different degree subjects might experience different academic pressures, and their ability to cope may be related to their academic ability prior to entering higher education, regardless of whether or not they have an autism diagnosis. Similarly, autistic and TD students who experience high levels of social anxiety might find it especially challenging to make new social network connections and navigate social resources at university, suggesting there may be other common underlying factors that might contribute towards one’s perception of university experience beyond having an autism diagnosis. Understanding the similarities and differences in the relationship between autistic traits, social anxiety and students’ worries and their social networks among autistic and TD students might thus help stakeholders to better understand the unique vulnerabilities present in each group and to better tailor transition to university support addressing students’ needs.
Social network and perceived social support at university
Social support from family and friends can buffer against some of the stresses associated with the transition and social adaptation to university life and lead to better well-being (Hirsch & Barton, 2011; Verger et al., 2009). An efficient way to capture one’s access to support from people is via social network analysis (Scott, 2017). Social network analysis examines both the structural and functional components of one’s social network. Social network structure (SNS) includes a range of quantifiable metrics such as size (how many people an individual is in contact with and consider close to them), density (to what extent do different network members know and are in contact with each other), and network composition (relative percentage of family, friends and other network members). In contrast, the functional component of social networks measures an individual’s ability to access different types of tangible, informational, practical, as well as personal emotional support from different network members, and the perceived availability of support available to them (i.e. perceived social support (PSS)) (S. Cohen & Wills, 1985; Roohafza et al., 2014).
For TD students transitioning to first year of university, previous studies have found that higher levels of PSS from parents, professors and academic staff, and peers are associated with both better university transition outcomes and mental health (Azmitia et al., 2013; Friedlander et al., 2007; Swenson et al., 2008). The types of support provided by family and friends was also reported to change over time, as family members provided more informational and emotional support to students and peers provided more tangible, practical and social support (Azmitia et al., 2013; Friedlander et al., 2007). TD students also reported an increase in the number of same-aged peers within their social network who provided greater support compared to family members, and professors/lecturers during transition (Hays & Oxley, 1986).
There has been little research into the nature and impact of changes in SNS and PSS among autistic students during transition to university. Although many autistic students recognise the importance and necessity of establishing social relationships at university, particularly for academic studies such as in the context of working on group projects (Van Hees et al., 2015), over 75% of autistic students struggle to adapt to the new social environment (Jackson, Hart, Brown, & Volkmar, 2018). Although TD students begin to rely on their peers for greater functional support over the course of development (Lee & Goldstein, 2016), autistic students are often less likely to seek support from others, especially same-aged peers, and also report perceiving lower levels of social support overall (Lasgaard et al., 2010). Many autistic students often continue to perceive their parents as the main source of support at university, ranging from providing social and emotional guidance, to advocating for academic support and helping with many daily living tasks (Elias et al., 2019; Fleischer, 2012; Mitchell & Beresford, 2014). A small recent case study involving 10 autistic students in higher education also found that autistic students rated their professors to provide greater instrumental support compared to their family and friends and were perceived to be important in supporting their academic success at university (LeGary, 2017). However, to date, there lacks any direct comparisons between a well-matched group of TD and autistic students to help identify similarities and differences in both their SNS and PSS during transition to university.
Social anxiety at university
Despite clear delineation of Autism Spectrum Disorder (ASD) as being characterised by having social communication difficulties and a restricted and repetitive pattern of interests, activities and behaviours (American Psychiatric Association, 2013), autism is a highly heterogeneous condition. Recent systematic reviews and meta-analyses have found that among autistic adults, the prevalence for current and lifetime co-occurrence of anxiety ranges between 27% and 42% (Hollocks et al., 2019), and social anxiety disorder is one of the most frequently reported anxiety disorders in this population (Lugo-Marín et al., 2019). One study (White et al., 2012) found that both social anxiety and autism symptom severity have some construct overlap, and both can manifest as avoidance of social situations and social withdrawal; however, the underlying mechanisms are distinct. Social anxiety is distinguished by social evaluative concerns and interaction-based anxiety, whereas social cognition in autism is characterised by differences in respect of making inferences about the mental states of others, particularly in dynamic and complex social interactions. Therefore, the high rates of co-occurring social anxiety among autistic students might place additional stress on students’ ability to adapt to the social environment at university. Poor social adaptation can also have a negative impact on students’ academic studies and daily living experience at university, as autistic students often find group tasks very distressing and difficult to navigate, therefore adding further distress to their academic studies (LeGary, 2017).
Similarly, research has shown that the prevalence rate of social anxiety in TD university students (19%–23%) (Beidel et al., 1989; Strahan, 2003; Strahan & Conger, 1998) is also higher than that found in the general adolescent population (5%–15%) (Ollendick & Hirshfeld-Becker, 2002), thus suggesting that high rates of social anxiety might be commonly seen in both TD and autistic students at university. Higher rates of social anxiety in TD students has also been associated with poorer academic adjustment, and some researchers have suggested one underlying mechanism may be failure to seek support when students experience high levels of social anxiety at university (Arjanggi & Kusumaningsih, 2016; Brook & Willoughby, 2015; Zukerman et al., 2019). Therefore, beyond the need to directly compare and contrast between perceived worries associated with transitioning to university, SNS and PSS among both autistic and TD students, there is a need to consider to what extent these differences may be associated with symptoms of social anxiety, beyond that of an autism diagnosis.
The current study
This study used a group-matched control design, matching TD and autistic students on a range of demographic variables that include measures of their pre-university academic performance, as well as chosen degree subject, to enable a more direct comparison to be drawn between TD and autistic students who have the same academic ability and facing similar levels of academic and social demands as they transition to university life. This study had three objectives:
Investigate any differences between TD and autistic students in the types of worries and perceived distress when faced with different aspects of university life, such as academic, daily living and socialisation challenges.
Investigate any differences in SNS and PSS between TD and autistic students during their transition to university.
Investigate similarities and differences in how levels of autistic traits and social anxiety may account for any differences between TD and autistic students in SNS, PSS and worries about university (as identified in objectives 1 and 2).
Methodology
Participants
All participants in this study were first-year university students recruited for a larger longitudinal study investigating changes in SNS and PSS and university transition outcomes. See Table 1 for student demographic information. Recruitment channels included advertisements on campus, social media and during induction lectures during the first week of starting university. All students were aged between 17 and 19 years and completed all measures online via Qualtrics during the first 2 weeks of starting first semester of first year at university. Students were entered into a prize draw of two £50 Amazon gift card upon completing the questionnaire session. The online measures asked students to disclose if they had an autism diagnosis from a clinical professional, or any other developmental condition, physical or mental health conditions. For autistic students, all 28 autistic students confirmed an autism diagnosis made by a clinical professional (i.e. not self-diagnosed) prior to joining the study. Students confirmed the disclosure of their autism diagnosis with the university disability team, through whom students access a range of support on campus, by showing official diagnostic letters from clinical professionals. The mean score on the Autism Quotient-28 (AQ-28) for the autistic students was 83.07, and with an exception of two students who scored 59 and 64, all students’ scores met the suggested clinical cut-off score of 65 (Hoekstra et al., 2011). Six autistic students (21%) also reported having at least one other co-occurring condition. Autism diagnostic information and co-occurring conditions are reported in Table 1.
Student demographic information.
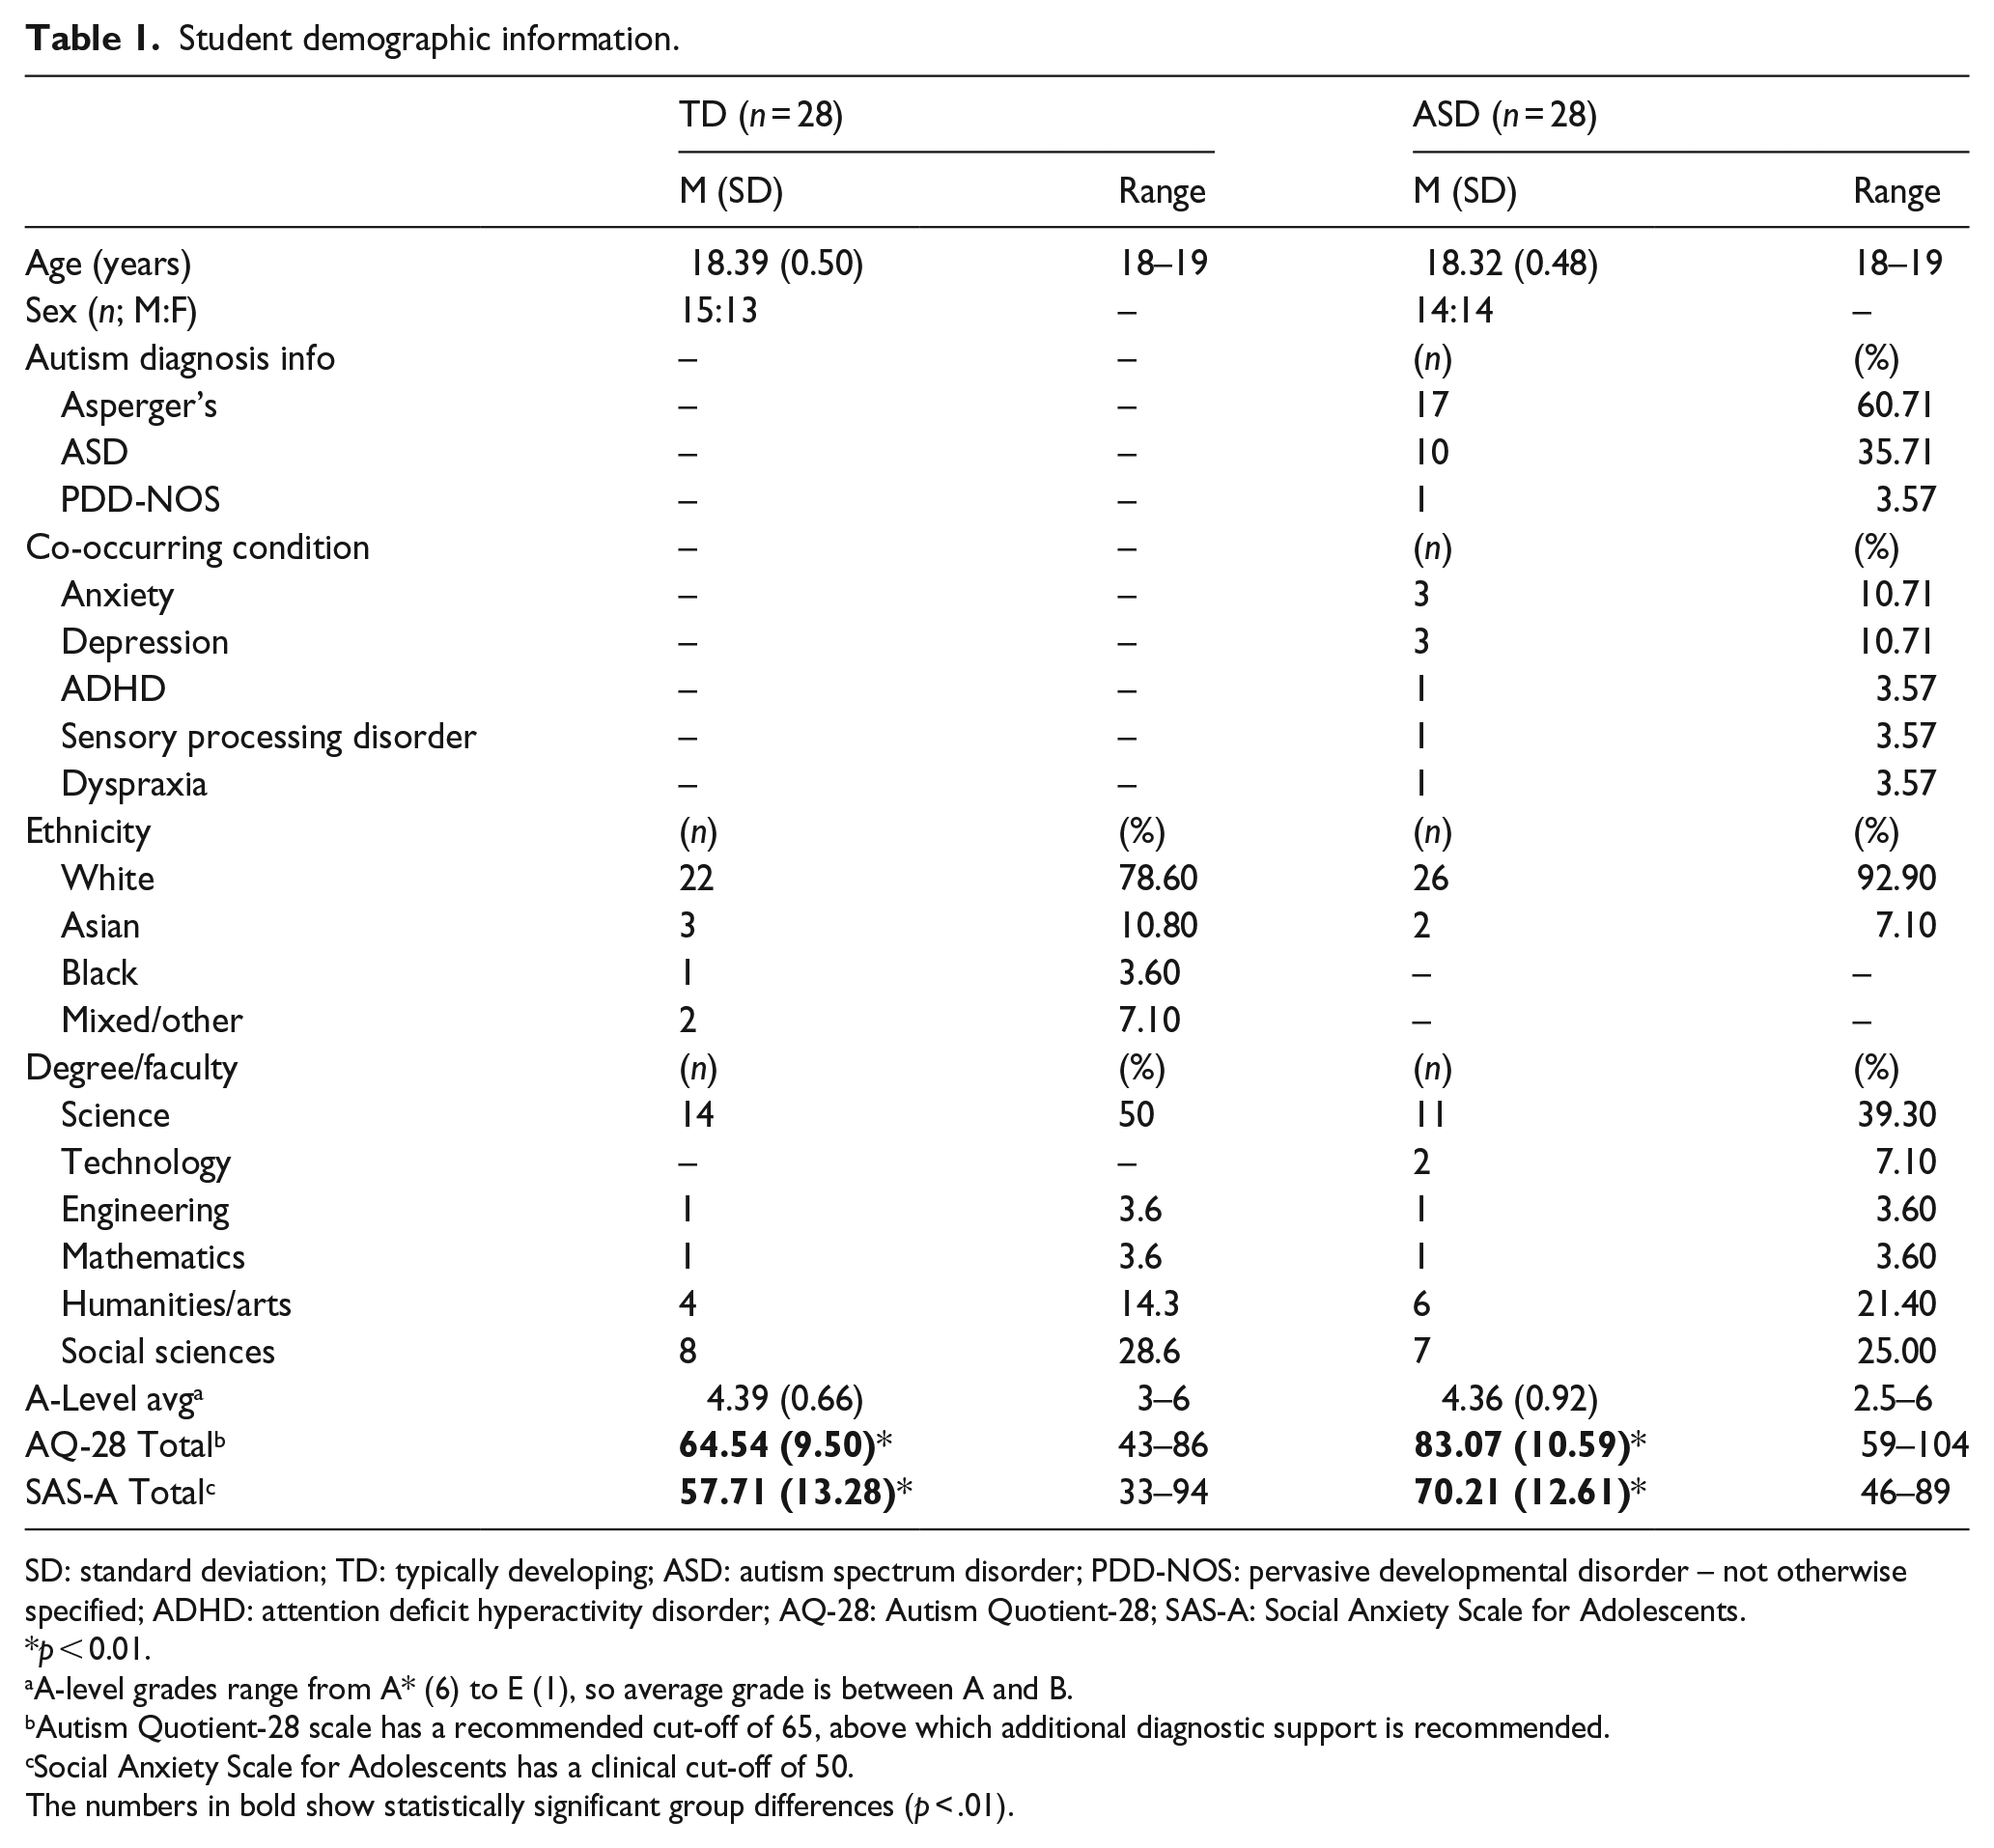
SD: standard deviation; TD: typically developing; ASD: autism spectrum disorder; PDD-NOS: pervasive developmental disorder – not otherwise specified; ADHD: attention deficit hyperactivity disorder; AQ-28: Autism Quotient-28; SAS-A: Social Anxiety Scale for Adolescents.
p < 0.01.
A-level grades range from A* (6) to E (1), so average grade is between A and B.
Autism Quotient-28 scale has a recommended cut-off of 65, above which additional diagnostic support is recommended.
Social Anxiety Scale for Adolescents has a clinical cut-off of 50.
The numbers in bold show statistically significant group differences (p < .01).
For TD students, all students included in the TD group did not report any current or former diagnosis of mental, physical or developmental medical conditions. For each autistic student, a TD student who was best matched on age, sex, ethnicity, pre-university academic achievements (average A-level grade) and degree of study at university was selected as a direct comparison. For TD students, the mean AQ-28 score was 64.54, which is somewhat higher than the previously reported control samples of 56–59.73 (Hoekstra et al., 2011). The current sample had more TD students who studied science, engineering and mathematics (57.2%), and their higher AQ-28 scores are concordant with previous findings showing that higher AQ scores are found in those who pursue a career and studies in STEM subjects (Ruzich et al., 2015). Overall, 28 autistic and 28 TD students were included in this study.
Ethical approval
The study was approved by the University’s departmental ethics committee and is in line with the Declaration of Helsinki as revised in 2000. All participants provided written informed consent prior to participating in the research study.
Measures
Demographics
All participants completed a basic demographic questionnaire, which enquired the students’ age, biological sex, ethnicity, pre-university qualification (A-level 2 or equivalent) and degree subject studied at university.
Transition to university questionnaire
Transition to university questionnaire (TUQ) is a 26-item self-report questionnaire that focuses on a range of concerns and worries that students face when transitioning to university (Lambe et al., 2018). Each statement is rated on a 5-point Likert-type scale, with students rating whether they ‘strongly agree (5)’ to ‘strongly disagree (1)’ with the statement. Worries that received a score of >3 (neither agree nor disagree) are considered to be endorsed by the student as a concern associated with transitioning to university. Both total and subscale scores of the TUQ (Lei et al., 2018) are assessed in this study, with higher scores indicating greater level of worries associated with transitioning to university. See Supplementary Material for more details on measure development.
Social Network and Perceived Social Support
The social network and perceived social support (SNaPSS) is a novel online tool that measures students’ SNS (network size, density and composition), as well as perceived distress frequency, and PSS from their network members across a range of academic, daily living and socialisation areas (Lei et al., 2019). Each area contains a list of five items that are derived from literature describing the types of challenges that autistic students face when transitioning to university (Adreon & Durocher, 2007; Anderson et al., 2017). Detailed description of the SNaPSS development and validation can be found Lei et al.’s (2019) work and in the Supplementary Material.
AQ-28
The AQ-28 is an abridged version of the full self-report measure autism quotient (50 items) (Hoekstra et al., 2011). The AQ-28 contains 28 statements that refer to various social and behaviours associated with autistic traits. Each statement is rated on a 4-point Likert-type scale from 1 (Definitely Agree) to 4 (Definitely Disagree). The AQ-28 is scored between 28 and 72, and a cut-off score of 65 is the threshold, above which further assistance with seeking ASD diagnosis is recommended. The cut-off score has good sensitivity (0.97) and specificity (0.82). The AQ-28 also has good internal consistence (Cronbach’s alpha = 0.77–0.86). The AQ-28 is used in this study to provide a comparable measure of level of autistic traits/autism symptom severity across both TD and autistic students.
Social Anxiety Scale for Adolescents
The Social Anxiety Scale for Adolescents (SAS-A) is a 22 item (18 items plus 4 filler items) self-report measure of symptoms of social anxiety among adolescents (La Greca et al., 2015). The SAS-A is broken down into three subscales that assess fear of negative evaluation (8 items), social avoidance and distress in social situations (6 items), and generalised social avoidance and distress (4 items), and is scored between 18 and 90. SAS-A has good internal consistency (Cronbach’s alpha = 0.77–0.92), good concurrent validity with other social phobia measures, good discriminant validity and good test–retest reliability. A score at or above 50 is used for identifying clinically significant levels of social anxiety in both male and female adolescents.
Data analyses
All analyses were conducted using SPSS, version 25 (IBM Corp, 2016), and SNS analyses are conducted using Gephi 2 (Bastian et al., 2009). Where appropriate, Bonferroni was used to correct for multiple comparisons, and post hoc power calculations were conducted using G*Power. We conducted data analyses in six steps to examine the following differences between TD and autistic students:
Independent samples T-test tested for differences in age, pre-university qualifications, SAS-A and AQ-28 total scores, and chi-square test examined differences in sex, ethnicity and subject degree studied. We expected there to be no significant group differences on demographic factors due to careful group matching, except that autistic students will have a higher level of autistic traits on AQ-28.
Independent samples T-tests tested for differences in worries associated with TUQ.
A 2 (diagnostic group) × 3 (area) mixed factorial ANOVA tested for differences in perceived distress frequency across academic, daily living and socialisation areas (SNaPSS).
For SNS (SNaPSS): independent samples T-tests first tested for differences in both network size and density. Next, a 2 (diagnostic group) × 3 (network member category) mixed factorial ANOVA assessed differences in network composition (i.e. relative percentages of family, friends and other network members).
For PSS (SNaPSS): two separate 2 (diagnostic group) × 3 (network member category) mixed factorial ANOVAs assessed for differences in both perceived frequency and quality of overall support provided by family, friends and other network members.
Exploratory Pearson’s correlations evaluated the extent to which level of autistic traits and/or social anxiety may be associated with differences observed in TUQ, perceived frequency of distress, SNS or PSS. Only factors that showed statistically significant difference between TD and autistic students from Steps 2–5 were included in Step 6.
Given the relatively small sample size, we also calculated effect sizes in addition to statistical significance for tests performed, which helped inform the interpretation of results. Effect sizes were interpreted based on J. Cohen (1988) and noted below. For Cohen’s d, the values of 0.2, 0.5 and 0.8 are interpreted as small, medium and large sizes effectively. For Cohen’s f, the values of 0.1, 0.25 and 0.4 are interpreted as small, medium and large effect sizes, respectively. For chi-squared tests, either ϕ or Cramer’s V are calculated for effect size and interpreted below.
Results
Participant demographics
Participant demographics are shown in Table 1. Consistent with our hypothesis, no significant differences were found in age (t(54) = 0.55, p = 0.585, Cohen’s d = 0.14), sex (χ2 (1) = 0.07, p = 0.789, ϕ = 0.04 (medium)), pre-university qualifications (average A-level results) (t(54) = 0.16, p = 0.87, Cohen’s d = 0.04), ethnicity (χ2 (8) = 8.35, p = 0.40, Cramer’s V = 0.39 (medium)), nor degree pursued at university (χ2 (6) = 4.43, p = 0.619, Cramer’s V = 0.28 (medium)) were found across TD and autistic students, showing that the two samples were carefully matched across all demographic variables. Compared to autistic students, TD students had both lower levels of autistic traits (t(54) = –6.90, p < 0.001, Cohen’s d = 1.84), and lower levels of social anxiety (t(54) = –3.61, p < 0.001, Cohen’s d = 0.97).
Transition to University Worries
Differences in transition to university worries (as measured by Transition to University Questionnaire; TUQ) scores are shown in Table 2. Compared with TD students, autistic students endorsed both greater number of worries associated with transitioning to university, as well as higher total worry score (p < 0.001). When examining the individual subscale scores of the TUQ, autistic students reported greater worries regarding social aspects of university life when compared to TD students, including both the micro and macro social world, as well as leaving home (p < 0.01). Effect sizes as shown by Cohen’s d are medium to large.
Students’ worries associated with transitioning to university.
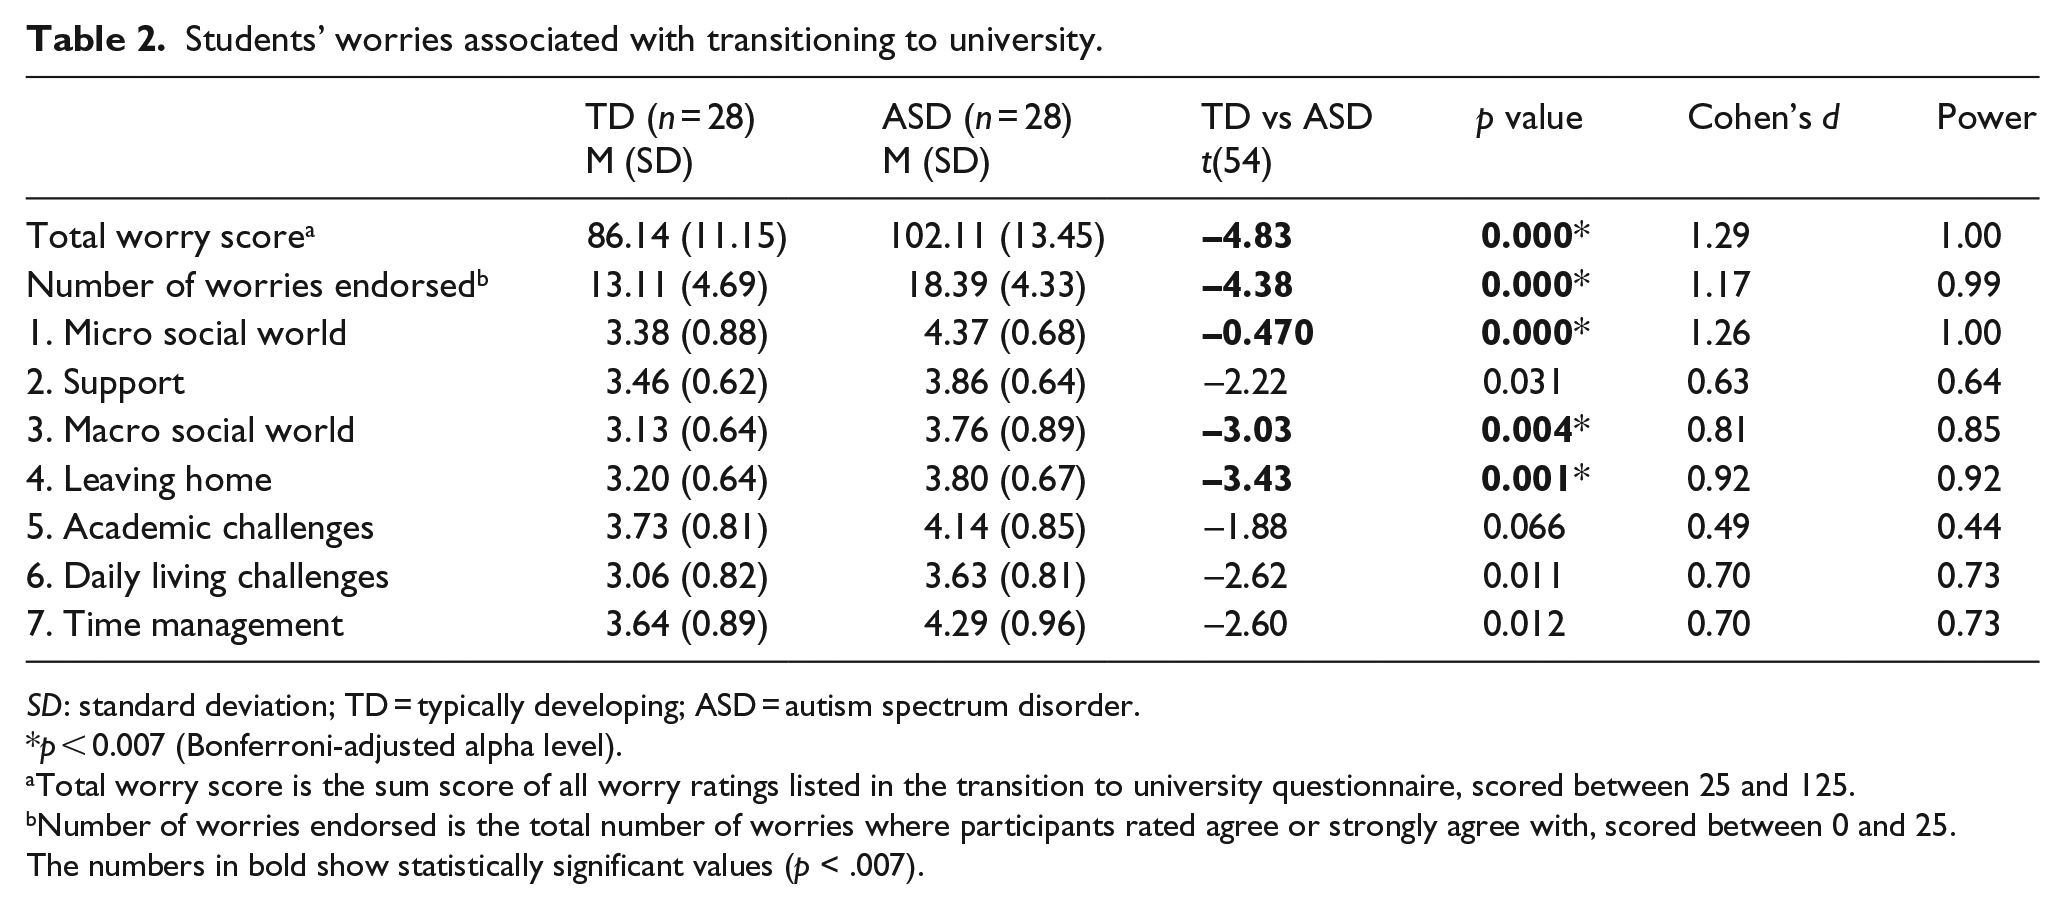
SD: standard deviation; TD = typically developing; ASD = autism spectrum disorder.
p < 0.007 (Bonferroni-adjusted alpha level).
Total worry score is the sum score of all worry ratings listed in the transition to university questionnaire, scored between 25 and 125.
Number of worries endorsed is the total number of worries where participants rated agree or strongly agree with, scored between 0 and 25.
The numbers in bold show statistically significant values (p < .007).
Perceived frequency of distress
The mean, standard deviation and range of scores on perceived frequency of distress across academic, daily living and socialisation areas as rated by both TD and autistic students are shown in Table 3. A main effect of diagnostic group was observed (F(1, 54) = 12.74, partial eta squared = 0.19, p = 0.001, power = 0.95, Cohen’s f = 0.48). Post hoc pairwise comparison analysis found that autistic students perceived higher frequency of distress overall than TD students (p = 0.001; 95% confidence interval (CI; 1.61, 5.75), Cohen’s d = 0.95). No main effect was observed for area of distress (F(2, 108) = 1.10, partial eta squared = 0.02, p = 0.337, power = 0.95, Cohen’s f = 0.53), nor area × group (F(2, 108) = 0.15, partial eta squared = 0.03, p = 0.861, power = 0.95, Cohen’s f = 18).
Students’ perceived distress frequency across academic, daily living and socialisation areas and social network structure.
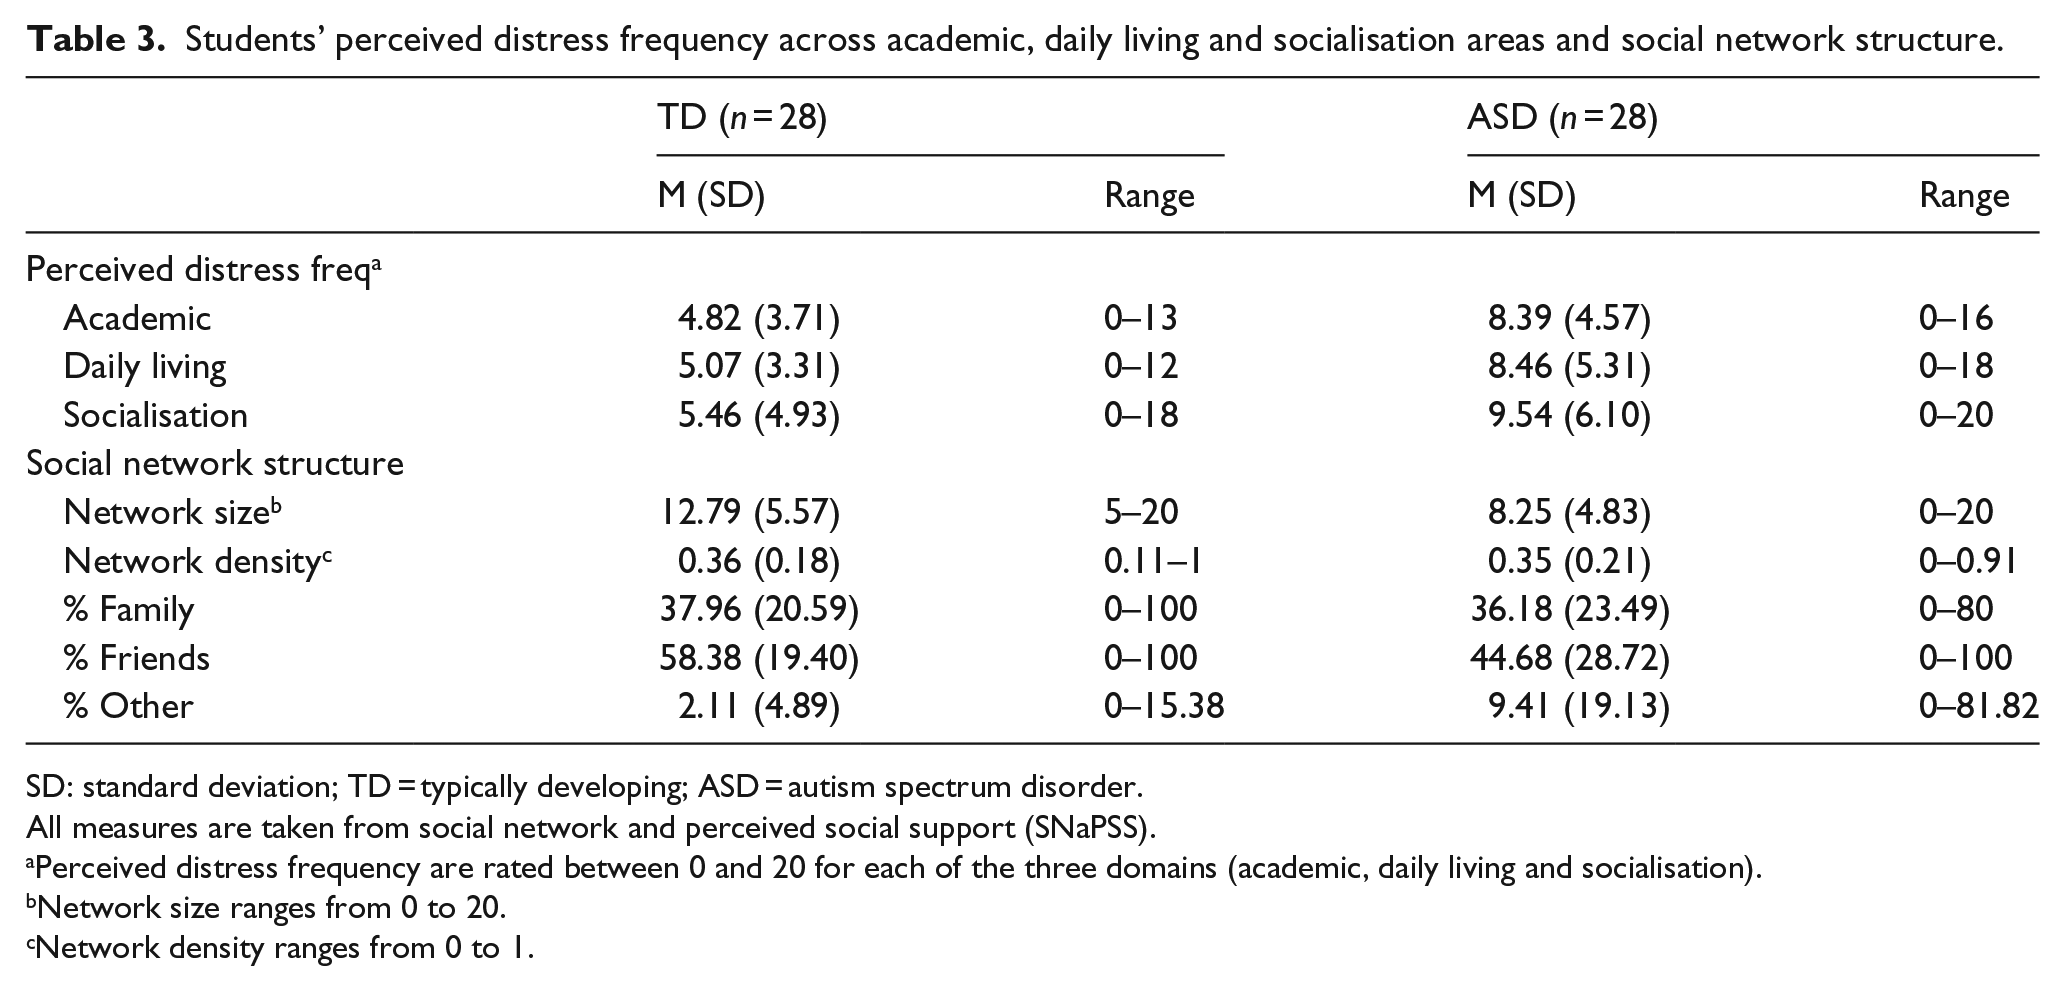
SD: standard deviation; TD = typically developing; ASD = autism spectrum disorder.
All measures are taken from social network and perceived social support (SNaPSS).
Perceived distress frequency are rated between 0 and 20 for each of the three domains (academic, daily living and socialisation).
Network size ranges from 0 to 20.
Network density ranges from 0 to 1.
SNS
TD and autistic students reported a wide range of SNS, and some examples are shown in Table 3 and Figure 1. Compared to autistic students, TD students had a significantly bigger social network size (t(54) = 3.26, 95% CI (1.74, 7.33), p = 0.002, Cohen’s d = 0.87), though no differences in social network density were found (t(54) = 0.31, 95% CI (1.74, 7.33), p = 0.755, Cohen’s d = 0.05). For network composition, a main effect of network member type was found (F(2, 108) = 52.55, partial eta squared = 0.49, p < 0.001, power = 0.96, Cohen’s f = 0.98). Post hoc pairwise comparisons found that across both TD and autistic students, social networks consisted of a greater percentage of friends than both family members (p = 0.03, 95% CI (1.08, 27.83), Cohen’s d = 0.62), and other network members (p < 0.001, 95% CI (35.00, 56.54), Cohen’s d = 2.29). ‘Other’ network members include teacher/lecturer, tutor, support worker or any other members the student considers to be close to and have been in contact with over the past 3 months but are not a family member or personal friend. Social networks also consisted of a greater percentage of family members than other network members (p = 0.03, 95% CI (22.01, 40.62), Cohen’s d = 1.69). In contrast, no main effect of diagnostic group was found (F(1, 54) = 2.67, partial eta squared = 0.05, p = .108, power = 0.95, Cohen’s f = 0.23), nor network member × diagnostic group (F(2, 108) = 2.66, partial eta squared = 0.05, p = 0.074, power = 0.95, Cohen’s f = 0.23).
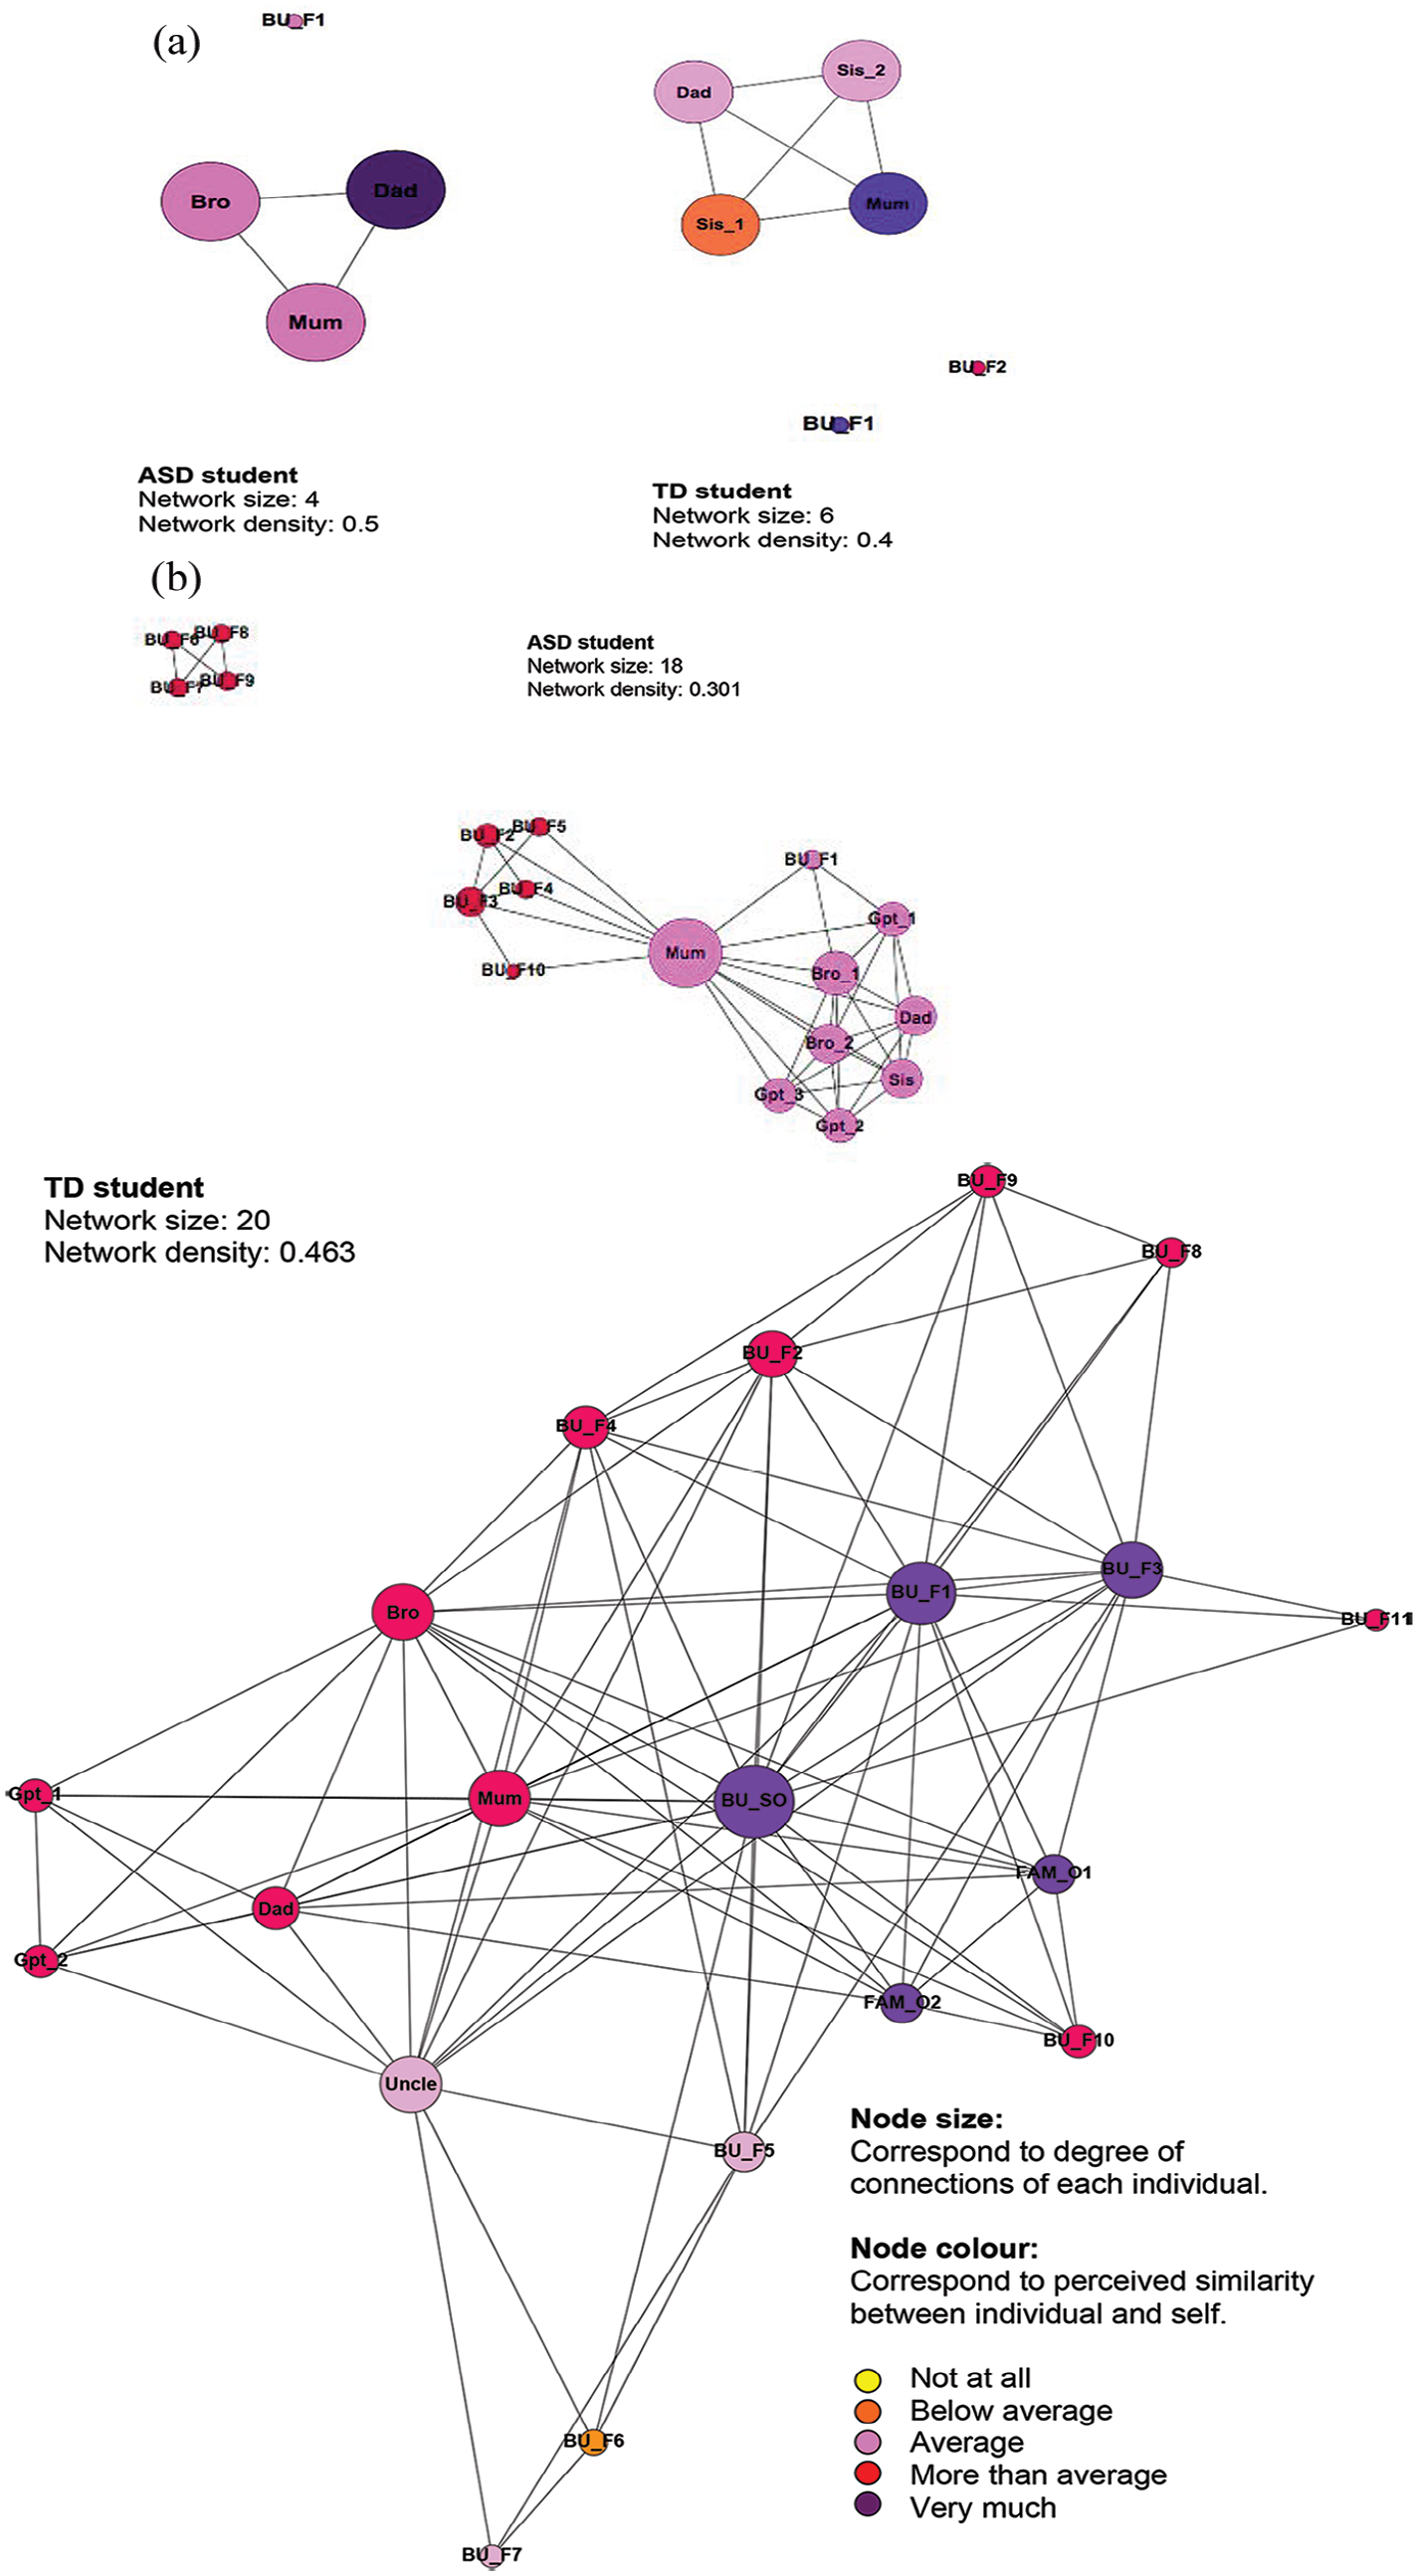
Sample of small and large social networks from TD and ASD students captured by social network and perceived social support (SNaPSS): (a) small social networks and (b) large social networks.
PSS
Measures of PSS are shown in Table 4. For overall levels of support frequency, a main effect of network member was found (F(2, 108) = 33.96, partial eta squared = 0.39, p < 0.001, power = 0.95, Cohen’s f = 0.80). Post hoc pairwise comparisons found that across both TD and autistic students, family members were perceived to have provided more frequent overall support than both friends (p = 0.009, 95% CI (0.40, 3.60), Cohen’s d = 0.56), and other network members (p < 0.001, 95% CI (3.18, 5.99), Cohen’s d = 1.53). Friends were also perceived to have provided more frequent support than other network members (p < 0.001, 95% CI (1.50, 3.66), Cohen’s d = 1.02). No main effect of diagnostic group was found (F(1,54) = 0.34, partial eta squared = 0.01, p = 0.564, power = 0.95, Cohen’s f = 0.10), nor network member × diagnostic group (F(2, 108) = 0.27, partial eta squared = 0.01, p = 0.763, power = 0.95, Cohen’s f = 0.61).
Students’ perceived social support from family, friends and other network members across academic, daily living and socialisation areas.
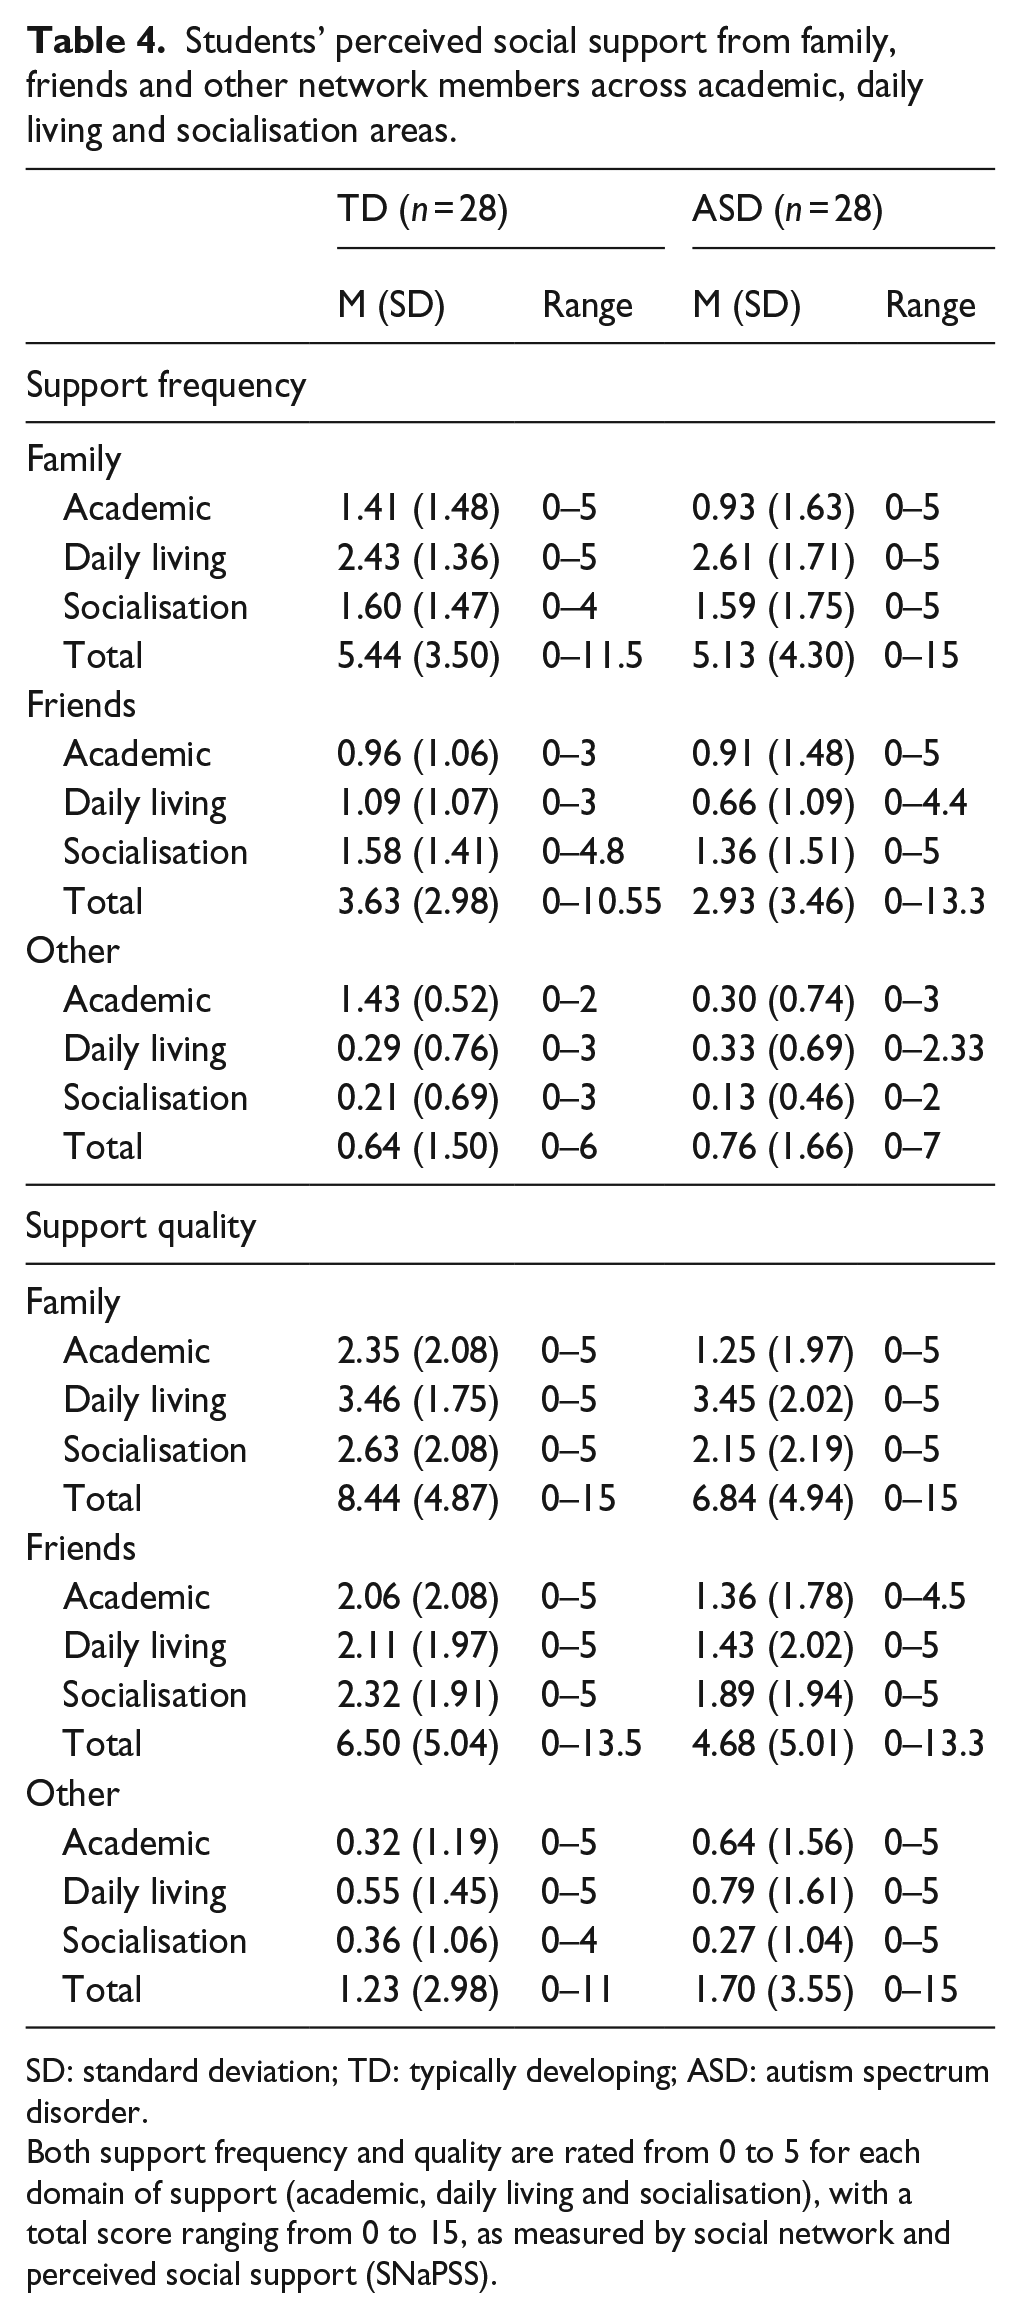
SD: standard deviation; TD: typically developing; ASD: autism spectrum disorder.
Both support frequency and quality are rated from 0 to 5 for each domain of support (academic, daily living and socialisation), with a total score ranging from 0 to 15, as measured by social network and perceived social support (SNaPSS).
For overall levels of support quality, a main effect of network member was found (F(2, 108) = 33.49, partial eta squared = 0.38, p < 0.001, power = 0.95, Cohen’s f = 0.78). Post hoc pairwise comparisons found that across both TD and autistic students, both family members (p < 0.001, 95% CI (4.31, 8.04), Cohen’s d = 1.48) and friends (p < 0.001, 95% CI (2.37, 5.87), Cohen’s d = 0.97) were perceived to have provided better quality support than other network members. No main effect of diagnostic group was found (F(1,54) = 1.51, partial eta squared = 0.03, p = 0.224, power = 0.95, Cohen’s f = 0.18), nor network member × diagnostic group (F(2, 108) = 1.34, partial eta squared = 0.02, p = 0.265, power = 0.95, Cohen’s f = 0.14).
Autistic traits and social anxiety
Given that significant differences in worries associated with social aspects of university, perceived distress frequency and also social network size emerged between TD and autistic students, we conducted exploratory Pearson’s correlations to assess the association between these identified factors and levels of autistic traits and social anxiety (Table 5). For both TD and autistic students, worries associated with transitioning to university showed a strong positive correlation with level of social anxiety (r = 0.48–0.65, p < 0.01). In contrast, worries associated with university were only positively associated with higher levels of autistic traits reported in autistic students (r = 0.48–0.67, p < 0.01), but not in TD students. However, worries associated with leaving home were not significantly associated with either level of autistic traits or social anxiety for both TD and autistic students.
Association (Pearson’s r) between level of autistic traits, social anxiety and group differences.
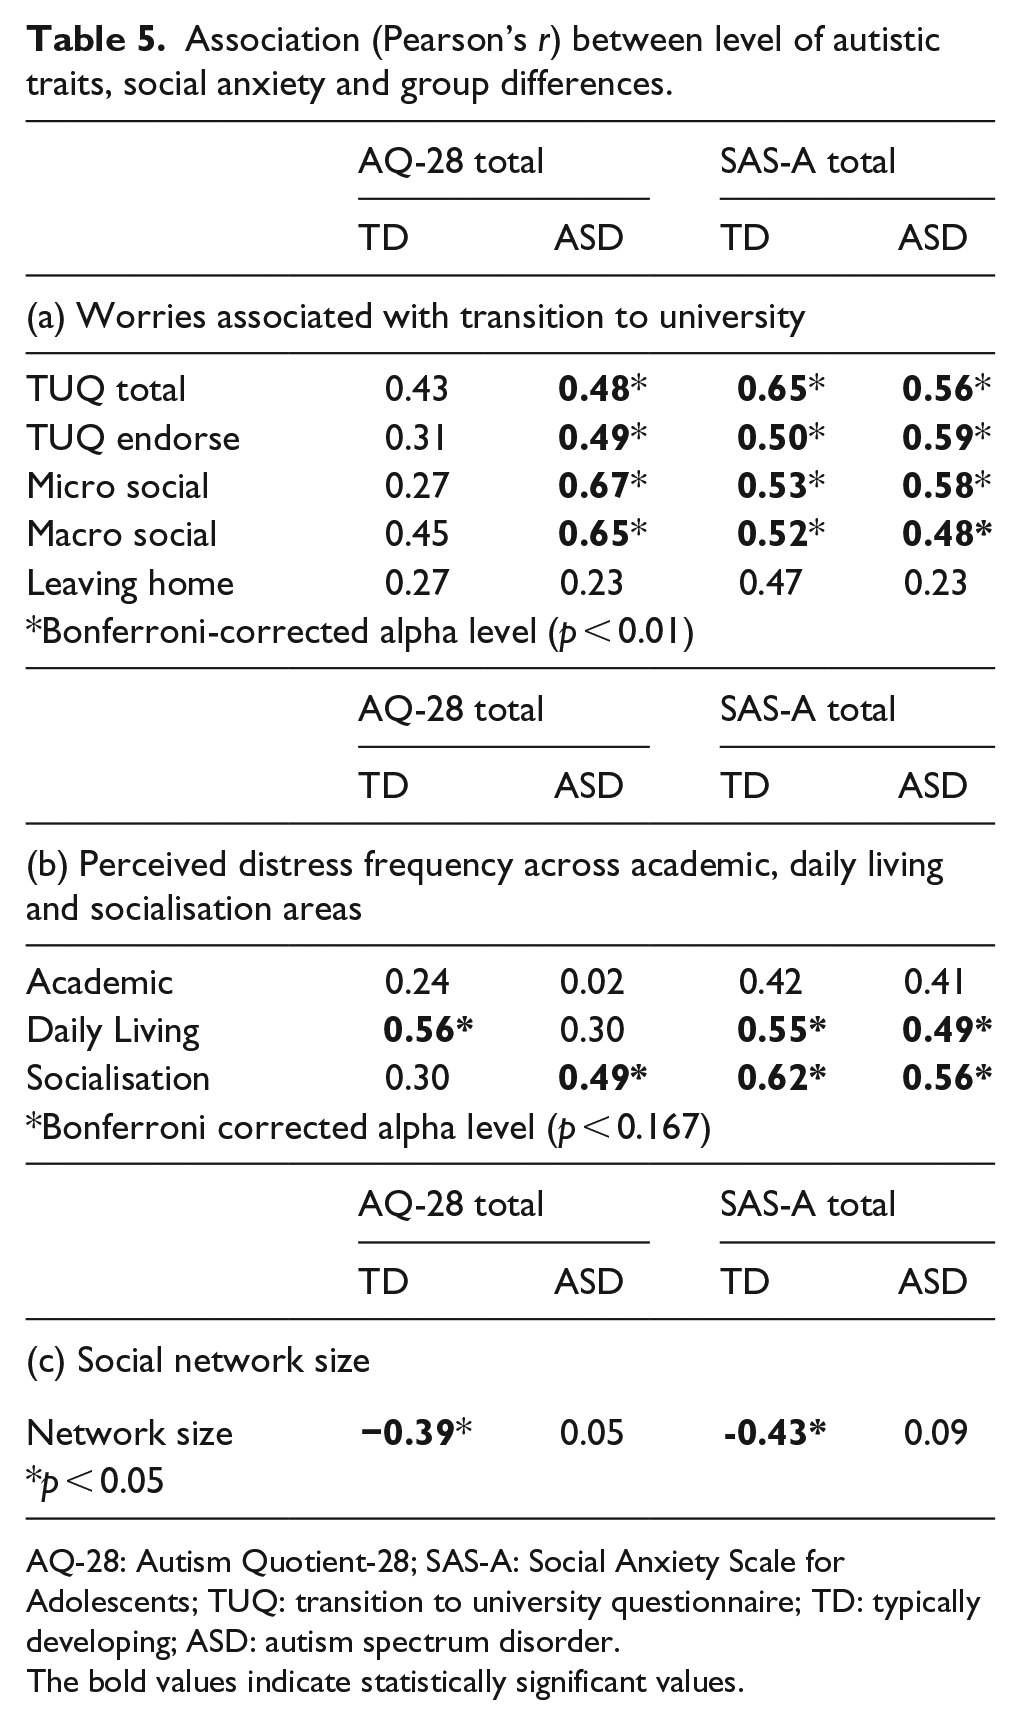
AQ-28: Autism Quotient-28; SAS-A: Social Anxiety Scale for Adolescents; TUQ: transition to university questionnaire; TD: typically developing; ASD: autism spectrum disorder.
The bold values indicate statistically significant values.
A positive correlation between level of social anxiety and perceived frequency of distress across both daily living and socialisation areas were observed for both TD and autistic students (r = 0.49–0.62, p < 0.017). In contrast, level of autistic traits was only positively associated with perceived frequency of distress in daily living for TD students (r = 0.56, p < 0.017), and in socialisation for autistic students (r = 0.49, p < 0.017). Perceived frequency of distress in academic areas was not associated with either level of autistic traits or social anxiety in either student group.
Finally, both higher levels of autistic traits and social anxiety was associated with a smaller social network size in TD students (r = –0.39, –0.43 respectively, p < 0.05), though neither factors affected social network size in autistic students. All Pearson’s correlation coefficients have medium (r > 0.30) to large (r > 0.50) effect size.
Discussion
This is the first study investigating students’ worries associated with transitioning to university, as well as students’ SNS and PSS, using a carefully controlled group-matched design. We found that compared to TD students, group-matched autistic students displayed higher levels of social anxiety, were more worried about social aspects of university life, and also reported greater distress frequency across the range of academic, daily living and socialisation areas, which is consistent with prior findings of challenges reported by autistic students at university (Adreon & Durocher, 2007; Gelbar et al., 2014). It is important to note that although the current samples of TD and autistic students were group matched, with two of the selection criteria being more focused on both academic ability (pre-university qualification achievement) and new academic demands (degree subject studied at university), autistic students still perceived more frequent academic distress compared to their TD peers. This highlights that the need for additional support for autistic students may be independent of students’ academic abilities at university, and autistic students may be more vulnerable to stressors associated with university life overall when compared to TD students.
The change in structure of academic studies from school to university may be challenging for autistic students to navigate, given that more autonomous study requires greater organisational and planning on behalf of the students but also require more social skills (such as working in group projects), both of which are areas that autistic students often find challenging. Therefore, despite having the academic ability to succeed in one’s course at university, the additional organisational and social demands intertwined into one’s academic studies might hinder autistic students to perform to the best of their academic abilities, resulting in greater distress. It is also important to highlight that the current measures were taken close to the start of university, where both student groups may have faced similar levels of academic demands or lack thereof. Hence, the significant differences in students’ perception of academic distress highlights how autistic students might have greater anticipatory worry and distress compared to TD students regarding academic studies. Our findings suggest that stakeholders providing academic support need to accommodate for individual variances in skills associated with academic studies at university (such as supporting students’ organisation and planning skills, and facilitating students’ group work discussions), rather than varying the level of academic support provided solely based on students’ pre-university academic performance.
Addressing the second research aim in assessing differences in social networks, autistic students reported having a smaller social network size compared to TD students, though both student groups perceived a similar level of support. TD and autistic students reported similar levels of social network density, which suggests that the potential flow of social capital within their social networks are similar. However, during times of transition such as going to university, networks that are both relatively lower in density and larger in size might be more protective, so an individual losing access to one portion of their social network (such as moving away from family life and friends from home) would not disable their ability to access social resources from other network clusters (Scott, 2017). Having a larger network also provides greater access to newer sources of information that might help the individual quickly adapt to their new environment. Therefore, despite both groups having similar network density and PSS at the start of university, the smaller network size for autistic students might increase their vulnerability to the changes in social dynamics during transition to university over time. Stakeholders and future studies can use a longitudinal approach to better monitor changes in autistic students’ SNS over time, to better examine whether smaller network size might have any negative impact on students’ transition outcomes across the first year of university.
In this study, both student groups reported similar levels of perceived quantity and quality of support and found family and friends to have provided greater support, despite autistic students listing more ‘other’ network members than TD students. This finding is interesting to consider in light of previous literature, which suggested that autistic students might rely more on support from family members than friends (Elias et al., 2019; Mitchell & Beresford, 2014) and perceived their professors and other academic staff to be best at providing support related to their academic studies (LeGary, 2017). One potential explanation accounting for the differences observed is based on methodological differences between this study and previous studies. Whereas in this study, each student was asked to recall individual social network members who the students are in direct contact with, and then rate the types of specific support provided by each network member, previous studies used a more collectivist approach and asked students to report the levels of PSS from family, friends and professors as a whole, across broader domains of support rather than individual areas (LeGary, 2017). This difference in self-report method may have resulted in differences in reporter bias when recalling who provided what kinds of support from students’ social networks, with this study method giving specific probes to recall support from each network member in a systematic way over a clearly defined time period. It has been shown that autistic adults are better at recalling self-referenced episodic memories using cued recall rather than free recall (Hare et al., 2007), thus suggesting that more guided and structured prompts provided by the SNaPSS may be more helpful in increasing reporting accuracy in autistic students compared to previous studies, though this requires further investigation.
Finally, our third research aim explored how levels of social anxiety and autistic traits may be associated with differences identified in perceived distress and transition worries, as well as in SNS and PSS. We found that greater worries about social life at university was associated with having higher levels of social anxiety in both TD and autistic students, though for autistic students, those who experienced greater levels of autistic traits also reported more social worries. Therefore, whereas social anxiety might bring some common challenges to both TD and autistic students transitioning to university, social impairments specifically related to autism might make social life at university even more daunting for autistic students to navigate. The distinct patterns of association between autistic traits and social anxiety and worries about university further suggests that the two constructs are qualitatively distinct from each other (White et al., 2012), and both have differential impact on students’ early perceptions of university life, and may affect autistic and TD students differently.
It is important to note that neither autistic traits nor social anxiety were related to perceived academic distress frequency in both TD and autistic students. Given that this study specifically examined anticipatory worries during transition into university, the actual academic stressors may not have fully started (e.g. course deadlines and exam preparation), and students’ perceived distress and worries reflect their expectations of academic life at university. It may be that autistic traits and social anxiety have a greater impact on the overall academic ability between TD and autistic students, and the impact of these factors on academic performance is more pronounced when students face different levels of academic demands later in the academic year. Given that both levels of pre-university academic ability and new academic demands dictated by subject of study at start of university were controlled for in this study, much of the variance associated with autistic trait and social anxiety may already be controlled for during transition into university, and the difference in perceived distress frequency in academic studies may thus be accounted for by other unmeasured factors (such as one’s overall well-being, mental health, and/or physical health).
Furthermore, whereas higher level of social anxiety was significantly related to more frequent distress in both daily living and socialisation areas in both student groups, higher levels of autistic traits was only associated with more daily living distress in TD students, and more socialisation distress in autistic students. This highlights that having higher levels of autistic traits is a complex phenomenon that may affect not only social competency which can influence one’s ability to socialise with others but also other skills such as planning, organisation and flexibility that are necessary for some daily living skills. Therefore, it may be that the non-social aspects of autistic traits (such as increased behavioural rigidity) might present more challenges for TD students, whereas the poorer social communication skills associated with autistic traits may have a more negative impact on autistic students’ social relationships. It should be noted that due to the small sample size, this study did not break down autistic traits nor social anxiety into subscales or dimensions. Future research might seek to refine our understanding by using larger samples to understand how different subdomains of autism traits impact on student function might be associated with distress, SNS and PSS.
This study also found that whereas a smaller social network size reported by TD students was associated with higher levels of autistic traits and social anxiety, neither was associated with social network size among autistic students. One potential explanation may be due to ceiling effect observed in this study, with levels of autistic traits and social anxiety having a more significant impact on one’s overall number of social relationships in the non-clinical sub threshold population (i.e. TD students), where a larger range of symptom severity on both measures can account for a greater proportion of the variance associated with social network size. In contrast, for autistic students who mostly scored above clinical cut-off on both measures of autistic traits and social anxiety, the impact of both factors on one’s social network size may be at ceiling level, and therefore variations in social network size might be more likely accounted for by some other unmeasured factors such as personality traits. Future studies can use a larger sample of both TD and autistic students with multiple measures of autistic traits, social anxiety, as well as other factors that can influence one’s social relationships such as measures of personality traits and self-esteem, to gain a better understanding of potential factors that might underlie differences in social network size observed in the TD and autistic student groups.
Limitations and future directions
Although the inclusion of a well-matched TD student control group through the use of group-matched design is a major strength of this study, there are several limitations to be considered. The current sample size in both TD and autistic students is relatively small, and this study’s roughly balanced 1:1 male to female sex ratio is different to the 4:1 male to female ratio typically found in autism (Fombonne, 2009). Sex differences in students’ SNS and PSS have been explored in one previous study (Hays & Oxley, 1986) among TD college students in the United States. The authors found that female TD students more frequently interacted with their network members and exchanged informational and emotional support. The sex differences in functional use of students’ SNS to access PSS might highlight either that females perceive university life to be more stressful than their male counterparts or are better at disclosing and seeking support when in need. Alternatively, male students may not be able to provide a high quality of social support compared to female students. Sex differences in functional use of social networks are yet to be explored in autistic university students. Although the main focus of this study was to explore students’ perception of university experience when comparing between TD and autistic students, rather than exploring the impact of sex differences, future studies should seek to replicate this study using both a larger sample of more diverse students to compare sex differences. In addition, future studies should seek to replicate a sex ratio more representative of autistic students enrolled in higher education, to improve generalisability of current findings.
Due to the cross-sectional design of this study, it is unclear how students’ worries, SNS and PSS might change over the academic year, and whether such changes may be influenced by one’s level of social competency (e.g. autistic traits and social anxiety). Future studies should seek to adopt a longitudinal design with multiple data collection points throughout the first academic year to fully compare and contrast autistic students’ ability to settle into university life when compared against their group-matched TD peers. Long-term follow-up information can help stakeholders to reflect retrospectively on what interventions or support services would be beneficial for both autistic and TD students at the beginning of the academic year, and tailor support towards individual needs to improve transition outcomes for both TD and autistic students.
Conclusion and practical implications
In summary, this is the first study to use a group-matched design to compare and contrast autistic and TD students’ worries associated with transitioning to university, as well as differences in students’ SNS and PSS. Despite similar pre-university academic performance compared to TD peers, autistic students expressed greater anticipatory distress and worry regarding the academic demands of university. Therefore, stakeholders planning academic adjustments should look beyond students’ prior academic performance and take into consideration broader social and other skills that may negatively impact on students’ academic performance at university. Both groups perceived similar levels of support from their social network at start of university, though autistic students had a smaller social network size compared to their TD peers, which might place them at a disadvantage of accessing new sources of information and adapting to changes in their social environment during transition to university. Stakeholders may consider how to improve accessibility to key information for autistic students during transition to university, to ensure they have similar available resources despite having a smaller social network size. Finally, social anxiety and autistic traits differed in impact on students’ perceived academic, social and daily living stresses across the two groups. Higher social anxiety in both groups was consistently related to greater perceived distress in daily living and socialisation domains. Stakeholders should therefore consider delivering interventions to educate students on ways of effectively managing and coping with social anxiety early on during university transition, to ease students’ transition experience and improve quality of life.
Supplemental Material
AUT894830_Supplemental_material – Supplemental material for Differences in anxieties and social networks in a group-matched sample of autistic and typically developing students transitioning to university
Supplemental material, AUT894830_Supplemental_material for Differences in anxieties and social networks in a group-matched sample of autistic and typically developing students transitioning to university by Jiedi Lei, Chris Ashwin, Mark Brosnan and Ailsa Russell in Autism
Footnotes
Acknowledgements
The authors thank all the students for their participation in the study, without whom, none of this would have been possible.
Declaration of conflicting interests
The author(s) declared no potential conflicts of interest with respect to the research, authorship and/or publication of this article.
Ethical approval
The study was approved by the University’s departmental ethics committee and is in line with the Declaration of Helsinki as revised in 2000. All participants provided written informed consent prior to participating in the research study.
Funding
The author(s) disclosed receipt of the following financial support for the research, authorship and/or publication of this article: Funding for this study came from a PhD studentship awarded to the first author through Widening Participation at University of Bath, funded by Office for Fair Access.
Supplemental material
Supplemental material for this article is available online.
Notes
References
Supplementary Material
Please find the following supplemental material available below.
For Open Access articles published under a Creative Commons License, all supplemental material carries the same license as the article it is associated with.
For non-Open Access articles published, all supplemental material carries a non-exclusive license, and permission requests for re-use of supplemental material or any part of supplemental material shall be sent directly to the copyright owner as specified in the copyright notice associated with the article.