
Abstract
Autism spectrum disorders are associated with a substantial economic burden; although little is known about the relationship between state and family out-of-pocket expenditure. The objective of this study is to estimate the societal cost of childhood autism spectrum disorders and explain the variation in costs between state and family out-of-pocket expenditure. A bottom-up prevalence based cost-of-illness methodology was implemented using data from a combination of multiple convenience samples in Ireland of 195 parents of 222 children aged between 2 and 18 years of age with a clinically diagnosed autism spectrum disorder collected in 2014/2015. The findings show the average annual cost per child for families amounted to €28,464.89 related to private autism spectrum disorder services, lost income and informal care. By comparison, annual state expenditure per child on autism spectrum disorder–related health, social and educational resources was €14,192. Regression analyses indicate that autism spectrum disorder severity is significantly associated with higher out of pocket expenditures but not state health expenditures. The results suggest that parents are central to meeting the needs of young people with autism spectrum disorders in Ireland. Policy implications of these findings suggest that significant investment and commitment is needed to address the needs of individuals living with autism spectrum disorders and their families.
Introduction
Autism spectrum disorders (ASDs) present a variety of complex challenges for individuals with the condition and their families. While there is a paucity of research examining the economic burden of ASDs, attempts to estimate the societal burden have been made. Beuscher et al. (2014), for example, estimate the annual cost of childhood ASD in the United Kingdom at £3.4 billion and in the United States at US$66 billion. Among adults these authors estimate the annual cost at £31 billion and US$196 billion, respectively. Using disability-adjusted life years (DALYs), Baxter et al. (2015) estimated the global burden at 7.7 million DALYs among an estimated 52 million individuals with the condition. Knapp et al. (2009) examining the distribution of the burden in the United Kingdom found that 95% of total expenditure on childhood ASD related to state-provided services with just 5% of expenditure resulting from family expenses (out-of-pocket payments made for services and parental lost employment costs). Notably, Knapp et al. did not examine informal care costs arising from the care of those with ASDs. While these studies point to a significant economic burden related to ASDs, differences in their scope and methodologies make it difficult to draw meaningful comparisons between them. These factors also limit their usefulness when examining the distribution of costs when the latter is defined more broadly and are mute with regard to the relationship between ASD severity and associated costs. This study examined the relationship between the cost of caring for children with an ASD in Ireland, how costs are distributed between the state and family and how costs change with ASD severity. The data are based on a combination of multiple convenience samples of 195 parents of 222 children with an ASD conducted in 2014/2015. While the paper’s conclusions are of the most immediate relevance to Ireland, they provide valuable insights into relationships between ASD and its economic effects which may be of significance internationally.
Methods
The survey instrument
A survey instrument for self-completion was developed in stages. Firstly, items for inclusion were identified based on those reported in the existing literature (Beuscher et al., 2014; Ganz, 2007; Järbrink et al., 2003; Järbrink, 2007; Knapp et al., 2009; Lavelle et al., 2014). Secondly, a series of group interviews with parents, advocates and professionals working with families affected by ASD (N = 17) from across Ireland were held to explore aspects of disease burden. These allowed stakeholders to identify aspects of their lives/work they perceived as having been affected by ASD. Thirdly, a pilot postal survey designed for self-completion was developed and circulated to parents/guardians (N = 31) who attended a free Autism exhibition event and through a media recruitment campaign. The pilot was conducted between November 2014 and February 2015. In addition to socio-demographic details of the family, the pilot postal survey covered: the child’s health and their utilization of health, social and educational supports, family out-of-pocket expenditures, family use of health services, parental employment, time spent caring for the child, and free text opportunities for parents/guardians to record further information about their experiences of caring for a child with an ASD as they perceived them. Following a review of responses, a final postal survey was developed for distribution in 2015.
The sample
No register of persons with ASD exists in Ireland. Consequently, four different recruitment methods were used based on convenience sampling in an effort to make the sample as representative as possible – (1) 1000 postal surveys randomly distributed to parents listed on autism organization databases, 1 (2) national social media campaign in which parents were invited to request a survey, (3) national social media campaign where parents could access the survey online and (4) parents attending a free autism expo had an opportunity to take and complete a survey.
Boilson et al. (2016) estimated a prevalence of ASD of 1%. Using this and Census data (2011) provided by the Health and Wellbeing Division, Health Service Executive (HSE), the first author calculated the estimated prevalence rate of ASDs for each county/local health organization (LHO) within the nine Community Health Organizations (CHOs) that provide statutory support nationally to individuals with ASDs. The first author worked with three national ASD charities who had database lists of parent members to randomly select a predetermined number of parents per county based on the ASD prevalence calculated. It was considered appropriate to contact 1000 families by post with the survey. The justification for this figure is as follows: approximately 1.25 million persons were aged under 18 in 2016 (Central Statistics Office Ireland (CSO), 2017a) and assuming Boilson et al.’s (2016) estimate of a 1% prevalence of ASDs is accurate, a sample of 1000 would constitute approximately 8% of persons with ASD. As households rather than individuals would be contacted and children tend to live in multiple occupancy households, the percentage of households contacted in which a child with ASD resided would be somewhat higher.
Three national autism charities (Autism Ireland, formerly known as Irish Autism Action; The Shine Centre; Dóchas) agreed to distribute the survey to families with whom they were in contact by LHOs, the number of surveys to be distributed was based on an estimate of the number of families containing a child with autism in that LHO assuming a 1% prevalence. A freepost return envelope addressed to the first author was provided to all research participants. Follow-up reminders were sent to all potential research participants. In order to reduce any possible selection bias from sampling parents only affiliated with autism organizations, additional measures were implemented. The survey was broadly advertised on social media, radio, newspapers and local radio, requesting parents to complete the survey, which was also available to download online. Every pre-school, primary school and secondary school in Ireland listed as having an ASD class was provided with a flyer requesting parents to participate in the study. While every effort was made to reduce sampling bias, we do acknowledge the limitations associated with convenience sampling, and that social media may not be used equally by different groups in society. Furthermore, just focusing on contacting ASD units may have resulted in those with mild ASD, who are more likely to attend mainstream education, being underrepresented. Ethical approval for this study was granted by the National University of Ireland, Galway Research Ethics Committee (Ref: 14/MAY/02). The study was performed in accordance with the ethical standards laid down in the 1964 Declaration of Helsinki and its later amendments. Parents/guardians of children with an ASD provided written consent prior to their inclusion in the study.
Estimation of costs
A bottom-up prevalence based cost-of-illness methodology adopting a societal perspective was used in this study. A 12-month retrospective time period was used to estimate all costs, using the information gathered from parents who completed the survey. In keeping with Järbrink and Knapp (2001), direct state costs included – health service utilization, 2 medication costs and educational resources related to ASDs. Resources consumed were multiplied by their respective unit cost and summed to provide an estimate of individual aggregate costs. These were used to generate an average for all children; a detailed breakdown of resources and costs are provided in the supplemental section. Where possible, Irish unit costs were applied using HSE (2015) Primary Care Reimbursement Service data, MIMS Ireland (2014) and the Special Education Section in the Department of Education and Skills (Mulkerrins J, 23 August 2017, personal communication). In instances where Irish unit costs could not be sourced, Personal Social Services Research Unit (PSSRU) unit costs (Curtis and Burns, 2015) were applied after adjusting for purchasing power parity (PPP). Where possible, unit costs for service utilization reflected long-run social marginal opportunity costs including overhead costs (Beecham and Knapp, 1999). Assumptions regarding the duration of consultations are provided with state health expenditure costs. Medication costs were estimated based on dosage and duration. In Ireland, the out-of-pocket cost of prescribed medicines differs between those with a Medical Card – access to which is means tested – and those without a medical card. While those with a medical card receive all prescribed medicines free at point of use, (subject to a small prescription charge) nonmedical card holder medication costs are covered by the state once they exceed the €144 per month threshold operated by the Drug Payment Scheme (HSE, 2015). The distinction effects the distribution not the level of costs. Parental out-of-pocket expenditure costs incurred as a direct result of their child having an ASD were included under specified headings. Loss of parental earnings were based on the reported estimated loss in take home pay for the last year incurred only by parents in employment who had to take time off work or reduce hours due to their child’s/children’s ASD. It did not include the loss of income for full-time carers who had to give up paid employment to care for their child’s special needs, in order to avoid double counting. Informal care costs were calculated only for parents who gave up employment because of their child’s condition using a human capital approach based on the industrial wage per hour (CSO, 2017b). Measuring the informal care costs of children with an ASD presented many challenges. Based on the information provided in Supplementary Table S11 regarding caregiver activities and findings of Järbrink et al. (2003) where parents reported spending an extra 40 h per week caring for child with ASD, we chose to calculate based on 8 h per day. Total costs were calculated in euros (€) and are presented as mean cost per child with an ASD.
Regression analysis of the predictors of costs
Generalized linear models (GLMs) were employed to examine the predictors – (1) total ASD-related out-of-pocket expenditure per child, and (2) total state expenditure on child health services and medication. Total ASD-related out-of-pocket expenditure per child was based on the following survey question: Please provide the amount of extra costs you incurred as a direct result of your child/children having an ASD. The following subheadings of costs were presented – living costs, care and assistance, special activities, educational costs, medical costs, travel costs, training/support costs, autism assistance dog and other. Total out-of-pocket expenditure per household was divided by the number of children aged 2–18 years who had an ASD. Total state expenditure on child health services and medication were based on the following questions: Please specify the services and interventions used by your child with an ASD in the past 12 months. Who paid for the service(s), for example, Health Service Executive (HSE), voluntary organization, health insurance, paid for it yourself (a list of ASD-related service providers was included in the question) and Please specify what medications or supplements your child with an ASD is currently taking – medication, strength, number of times per day, how long is the child on this medication. Both dependent variables had a skewed distribution and zero mass problem. 3 A GLM model with a log-link and gamma distribution family was explored to address these issues (Mullahy, 1998). A modified Park test confirmed a gamma distribution family was appropriate (Manning and Mullahy, 2001). Following Manning et al. (2005), three tests were used to identify the appropriate link – Pregibon’s linktest, modified Hosmer–Lemeshow test and Pearson’s correlation test. Each of the three tests for each link type indicated a log link provided the best fit. Robust standard errors were applied to the GLM models to address heteroscedasticity issues (Manning and Mullahy, 2001). It is important to note that both dependent variables used the same unit of analysis, that is, cost per child. The use of state-funded services by children with a disability in Ireland is not means tested. However, this does not prevent a variety of services that are not funded by the state being acquired by parents on behalf of their children.
ASD severity was measured on a three point scale – mild, moderate and severe, based on the Diagnostic and Statistical Manual of Mental Disorders (DSM-5) criteria in relation to how severely a child’s social communication and restricted, repetitive behaviours are affected (American Psychiatric Association, 2013). The same independent variables were controlled for in both models to examine their impact on costs. The independent variables selected were whether: the child has an intellectual disability or not, whether the child is male or not, if the child has a medical card or not as it is means tested and whether the child lives in a rural area or not were included. In addition, a variable for whether the mother had a third level education or higher or not and equivalised household income based on national weights (CSO, 2014) were included. In order to address the complex needs of children with an ASD, it was necessary to address the issue of comorbidities. A comorbidity count that represented the number of comorbidities present per child was used. Mannion and Leader’s (2013) literature review on comorbidity in ASD guided the inclusion criteria for comorbidities included in the list. The selection of explanatory variables was guided by economic theory; covariates were selected based on drivers of demand for services either as indicators of need or as indicators of ability to pay for services. Further information on the number and list of all comorbidities is addressed in the supplemental section. Statistical analyses were completed using STATA 14 (StataCorp, 2015). Results are presented as average marginal effects with a 5% statistical level threshold. Statistical analyses were completed using STATA 14.
Results
Child and adolescent sample
Data relating to 222 children from 195 families aged between 2 and 18 years of age diagnosed by a clinician in accordance with DSM criteria as having an ASD were obtained from the survey. Table 1 presents the descriptive statistics of the sample. Changes made in the classification of autism under DSM-5 criteria (American Psychiatric Association, 2013), which moved from separate entities of diagnosis to creating an ASD severity level, meant that some individuals who were diagnosed under DSM-4 criteria had not received an updated diagnosis of which severity level their condition falls under – severe, moderate or mild. This is reflected in the sample results, as there are discrepancies in the percentage of children who received a diagnosis under separate entities, for example Autism or Asperger’s disorder, in contrast to those diagnosed on the spectrum under a severity level ranking. The age of two children was not provided in the survey responses; however, both were included in the study as they were attending school. 74.77% of the children in the sample were found to be verbal, while 20.72% were not and 4.50% did not answer that question. Over half the sample (53.15%) had an intellectual disability; 67% of the children were identified as having a comorbidity, while almost half the sample had a medical card (46.30%).
Descriptive statistics of the child and adolescent sample (n = 222).
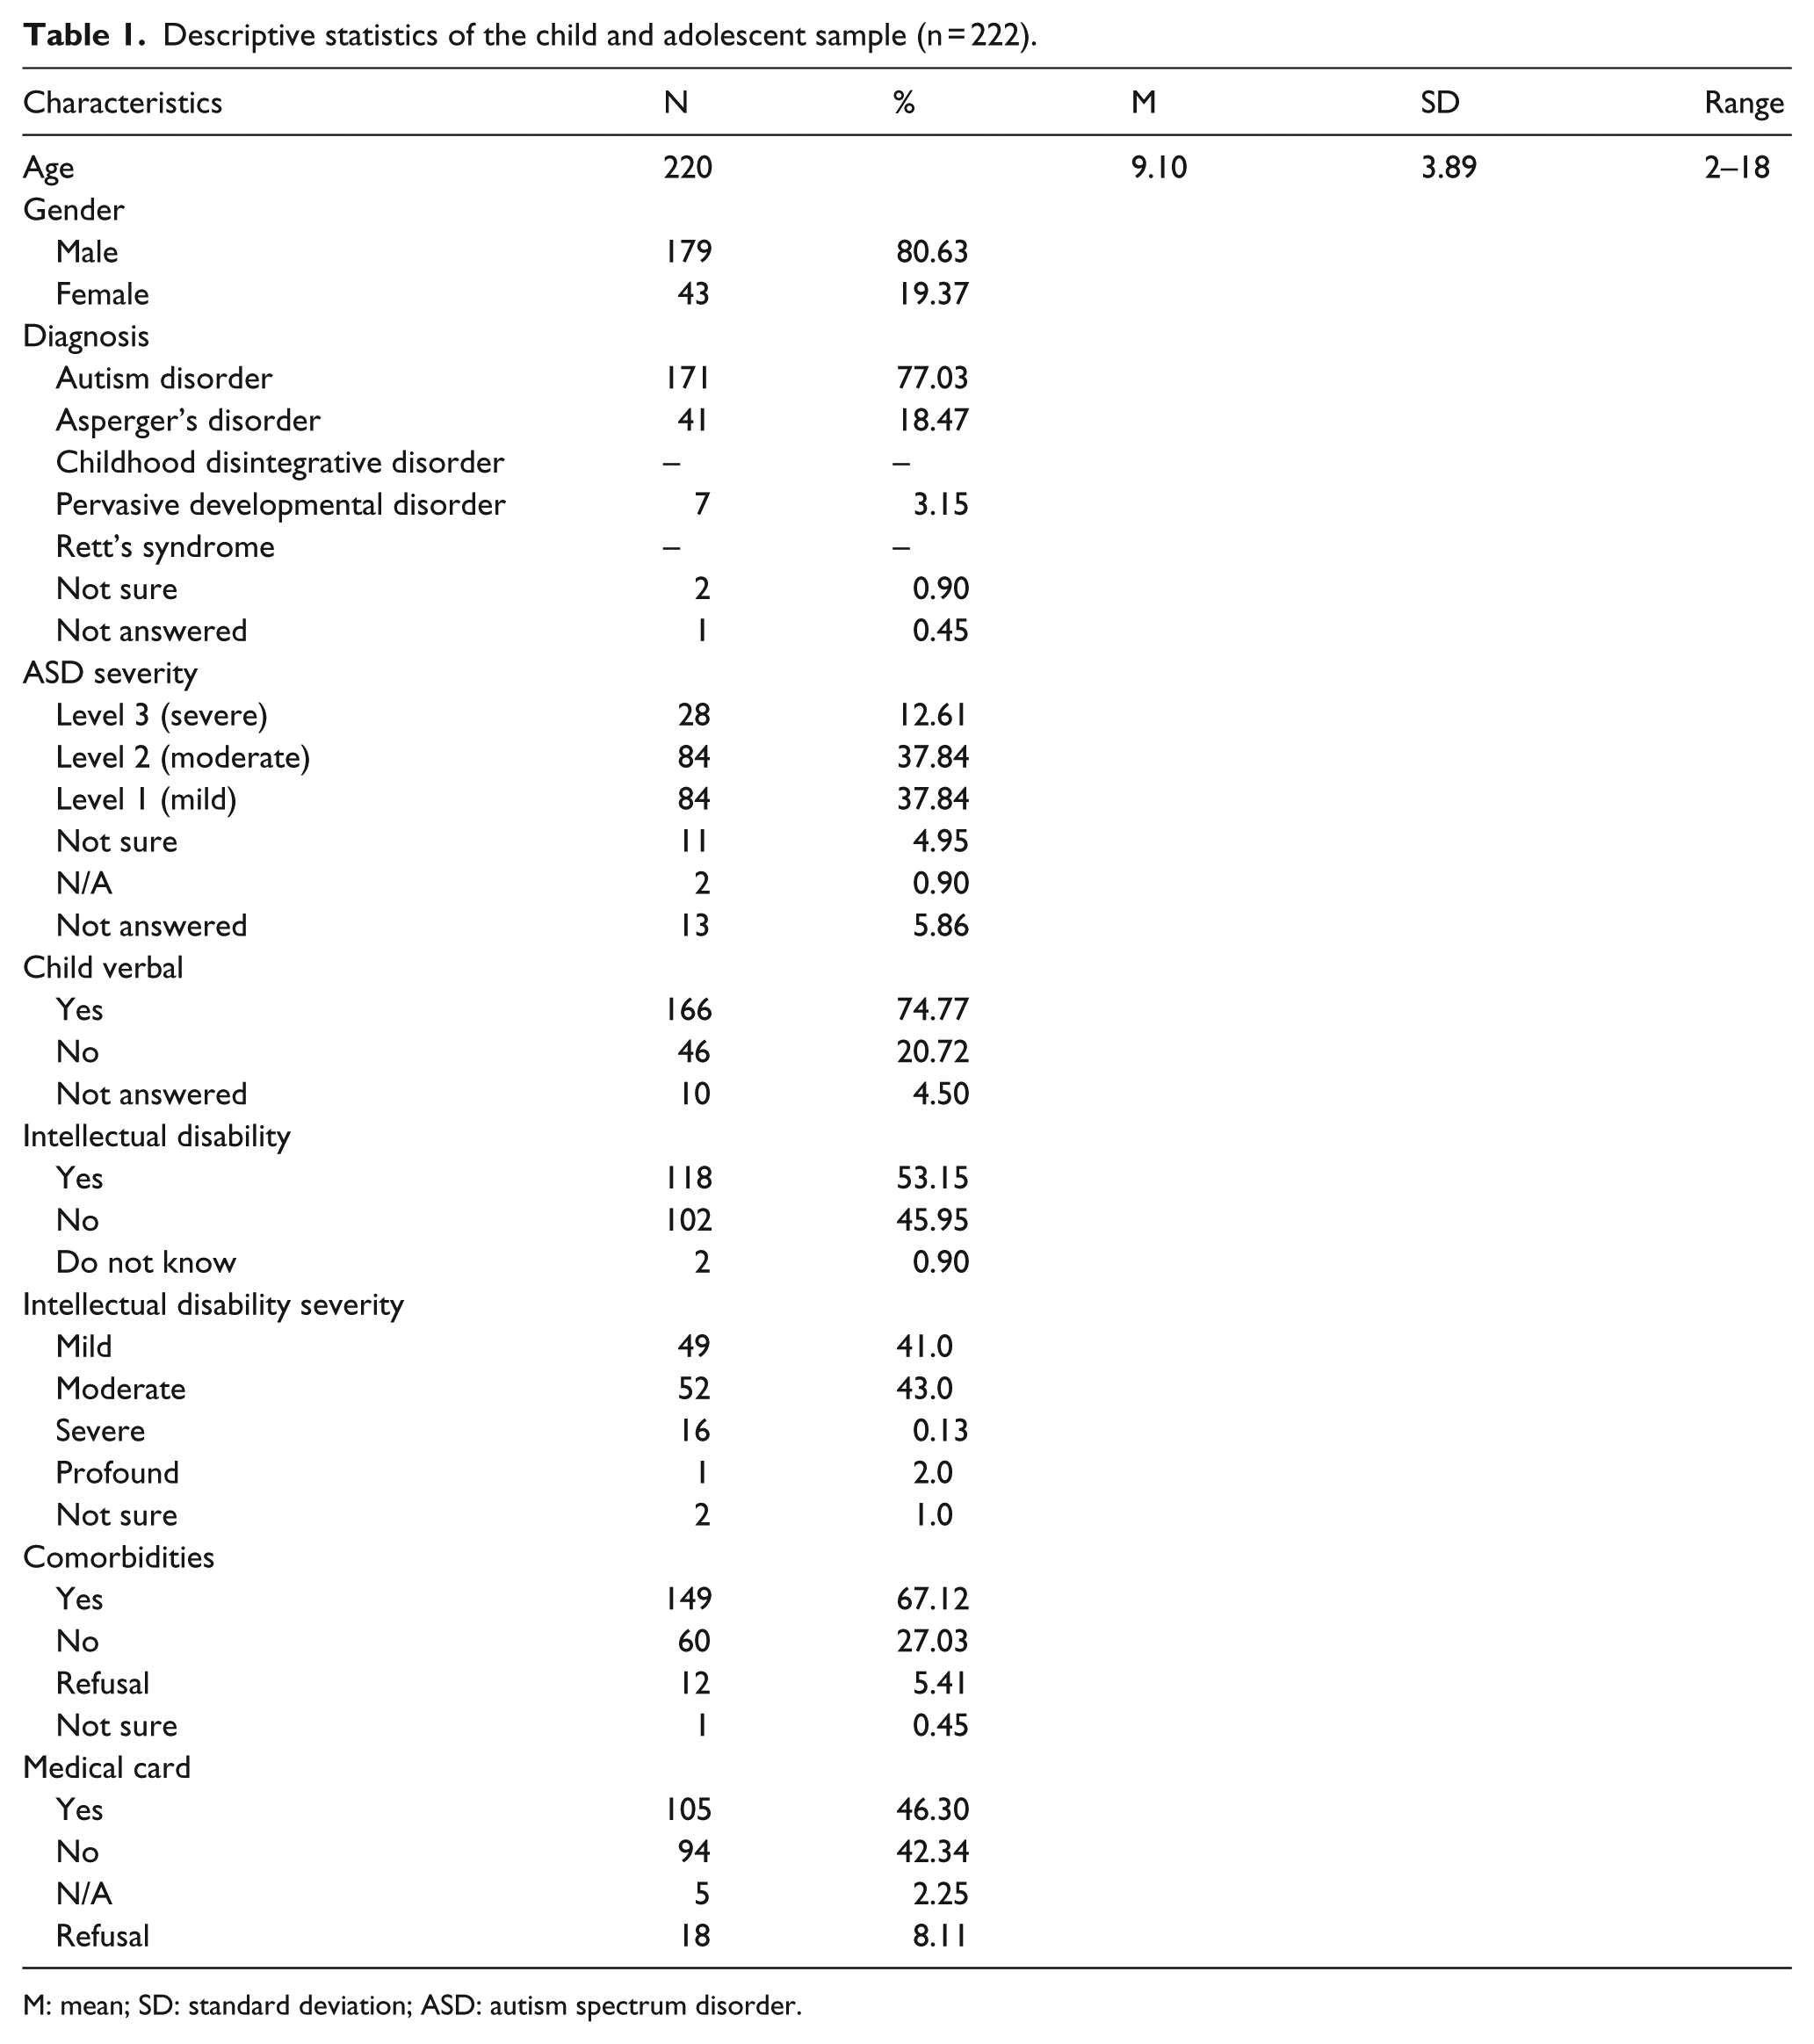
M: mean; SD: standard deviation; ASD: autism spectrum disorder.
Out-of-pocket expenditure
Table 2 provides a detailed breakdown of the extra costs incurred by families (N = 195) in the previous 12 months as a direct result of having a child or children with an ASD. The mean cost of total out-of-pocket expenditure amounted to €9489.60 per family. 4 The median cost was lower at €6560 per family reflecting the distribution of costs between families ranging from €0 to €56,160 per family. Living costs (which included items such as special diet, replacing/repairing damage) accounted for 29% of total out-of-pocket expenditure with a mean cost of €2795.67. Home adaptations with a mean cost per family of €1930 (range €0–117,500) were excluded from the analysis as these represented capital expenditure rather than annualized equivalent expenditure. Interestingly, mean respite care costs were considerably lower than nearly all other types of expenditure, amounting to €82 on average. Telephone costs were included because of the increased isolation experienced by carers but as with other items are identified separately so they can be deducted as desired. Medical costs amounted to 19% of the mean total out-of-pocket expenditure with a mean cost of €1836. Out-of-pocket expenses for private therapeutic interventions and assessment were the highest category of medical costs incurred resulting in a mean cost of €948 with considerable variations in cost ranging from €0 to €14,400.
Out-of-pocket expenditure reported per family for the past 12 months due to having a child or children with an autism spectrum disorder, N = 195.
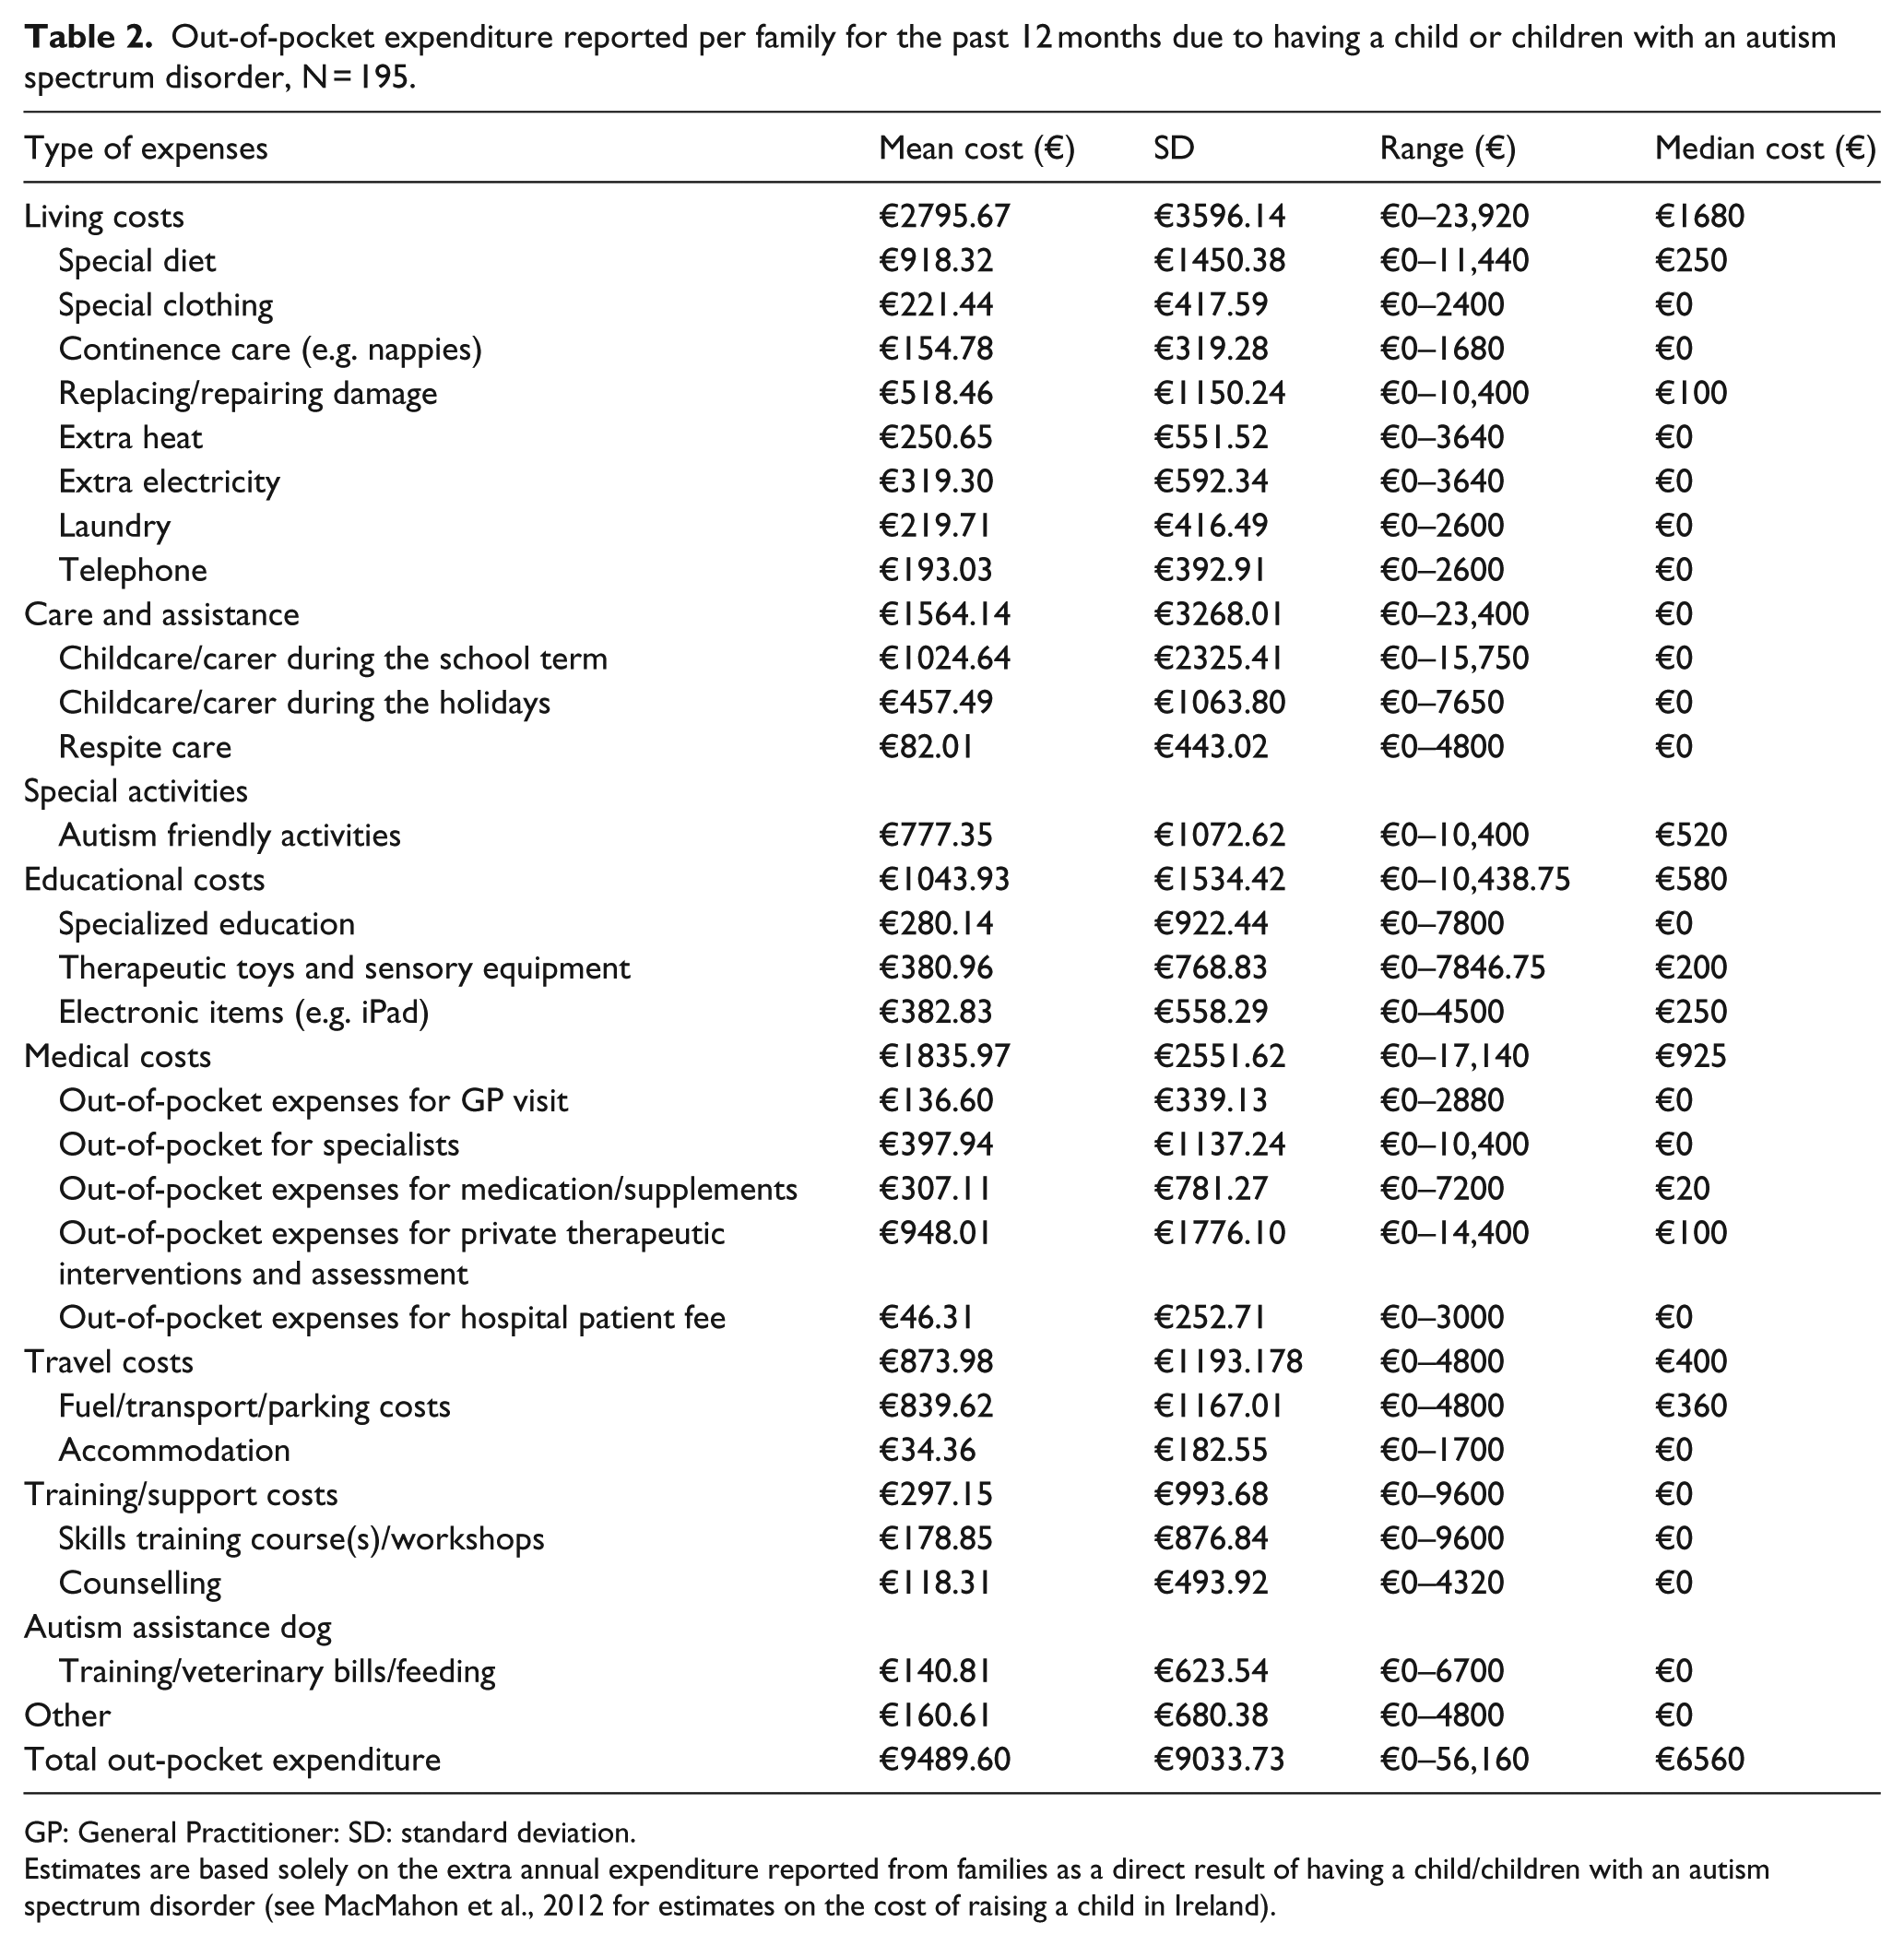
GP: General Practitioner: SD: standard deviation.
Estimates are based solely on the extra annual expenditure reported from families as a direct result of having a child/children with an autism spectrum disorder (see MacMahon et al., 2012 for estimates on the cost of raising a child in Ireland).
Health service utilization
Details regarding use of state-provided health services related to ASDs in the previous 12 months are outlined in Table 3. Referenced sources are provided for the unit costs (which are adjusted for PPP) and duration of each consultation. Highest rates of service utilization as a percentage of the sample were identified as dentists (45.95%), General Practitioner (GPs) (42.79%), speech and language therapists (35.59%) and occupational therapists (33.78%). However, considerable variations existed in the mean number of contacts within the sub-sample using the services. Furthermore, it is important to take into consideration the extensive range of contacts per resource, for example, GP visits ranged from 1 to 50, for the 95 children who availed of this service. From an ASD service intervention perspective, there was a notably low number of children having access to interventions such as applied behavioural analysis (ABA) (3.69% of the sample), social skills training/group (5.41%), development clinic (0.45%).
Utilization of state-provided public health services used in the past 12 months.
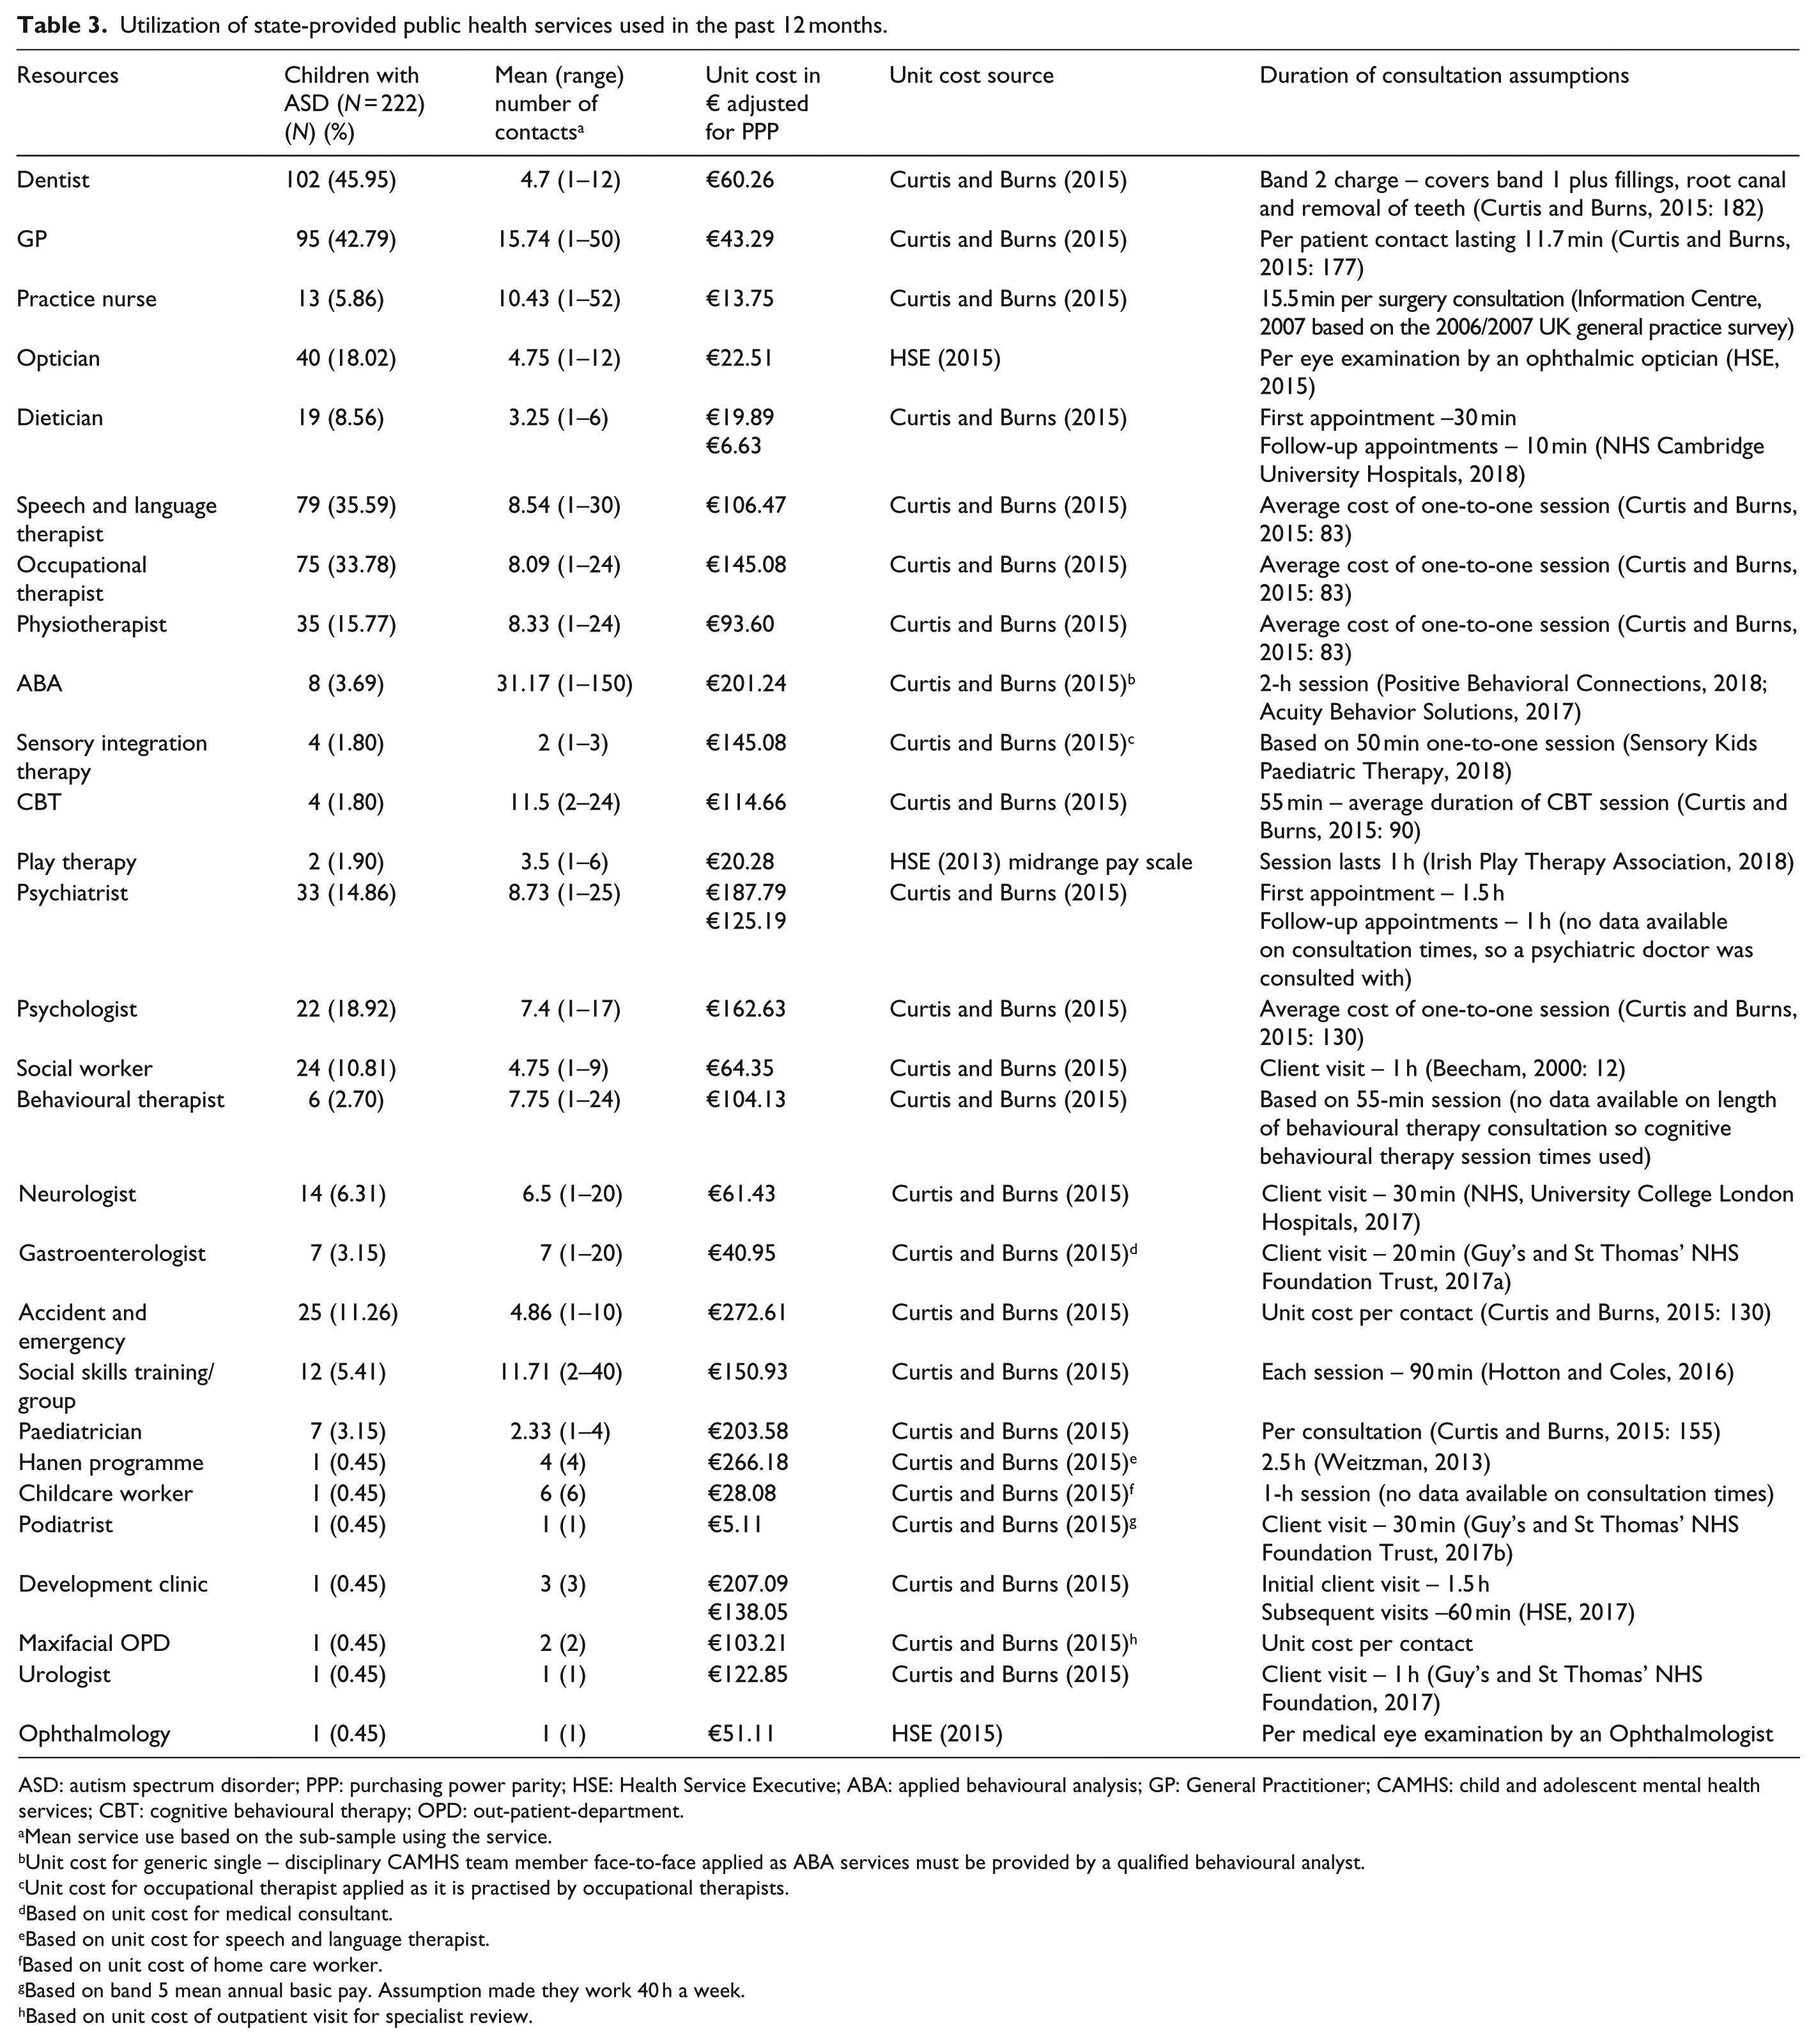
ASD: autism spectrum disorder; PPP: purchasing power parity; HSE: Health Service Executive; ABA: applied behavioural analysis; GP: General Practitioner; CAMHS: child and adolescent mental health services; CBT: cognitive behavioural therapy; OPD: out-patient-department.
Mean service use based on the sub-sample using the service.
Unit cost for generic single – disciplinary CAMHS team member face-to-face applied as ABA services must be provided by a qualified behavioural analyst.
Unit cost for occupational therapist applied as it is practised by occupational therapists.
Based on unit cost for medical consultant.
Based on unit cost for speech and language therapist.
Based on unit cost of home care worker.
Based on band 5 mean annual basic pay. Assumption made they work 40 h a week.
Based on unit cost of outpatient visit for specialist review.
Societal cost of childhood ASD
The average annual societal costs of childhood and adolescent ASD for the sample are provided in Table 4. Overall, parental costs accounted for 67% of societal costs. State expenditure on ASD health services amounted to €1301 per child; with costs varying from €0 to €30,828. Interestingly, state expenditure on ASD educational services was €12,837 per child. As can be seen in Supplementary Table S8, expenditure on special needs assistants consumed most of this expenditure, as opposed to specific learning interventions. Average combined state expenditure across health, medications and education was €14,192 per child. With regard to direct costs incurred by families in terms of out-of-pocket expenditure, the average cost per child was €8184.79 (€9489.60 per family) with costs varying from €0 to €56,160. Costs for mothers and fathers, still in paid employment, who had to take time off in the previous 12 months related to lost earnings were €1150.63 and €780.47 per child, respectively. Table 4 and Supplementary Table S12 present informal care costs based on all parents who were full-time carers. The average cost per child in the sample for mothers who were full-time carers was €16,723.20, while it was €1625.77 per child for fathers who are full-time carers.
Societal cost of childhood and adolescent autism spectrum disorders.
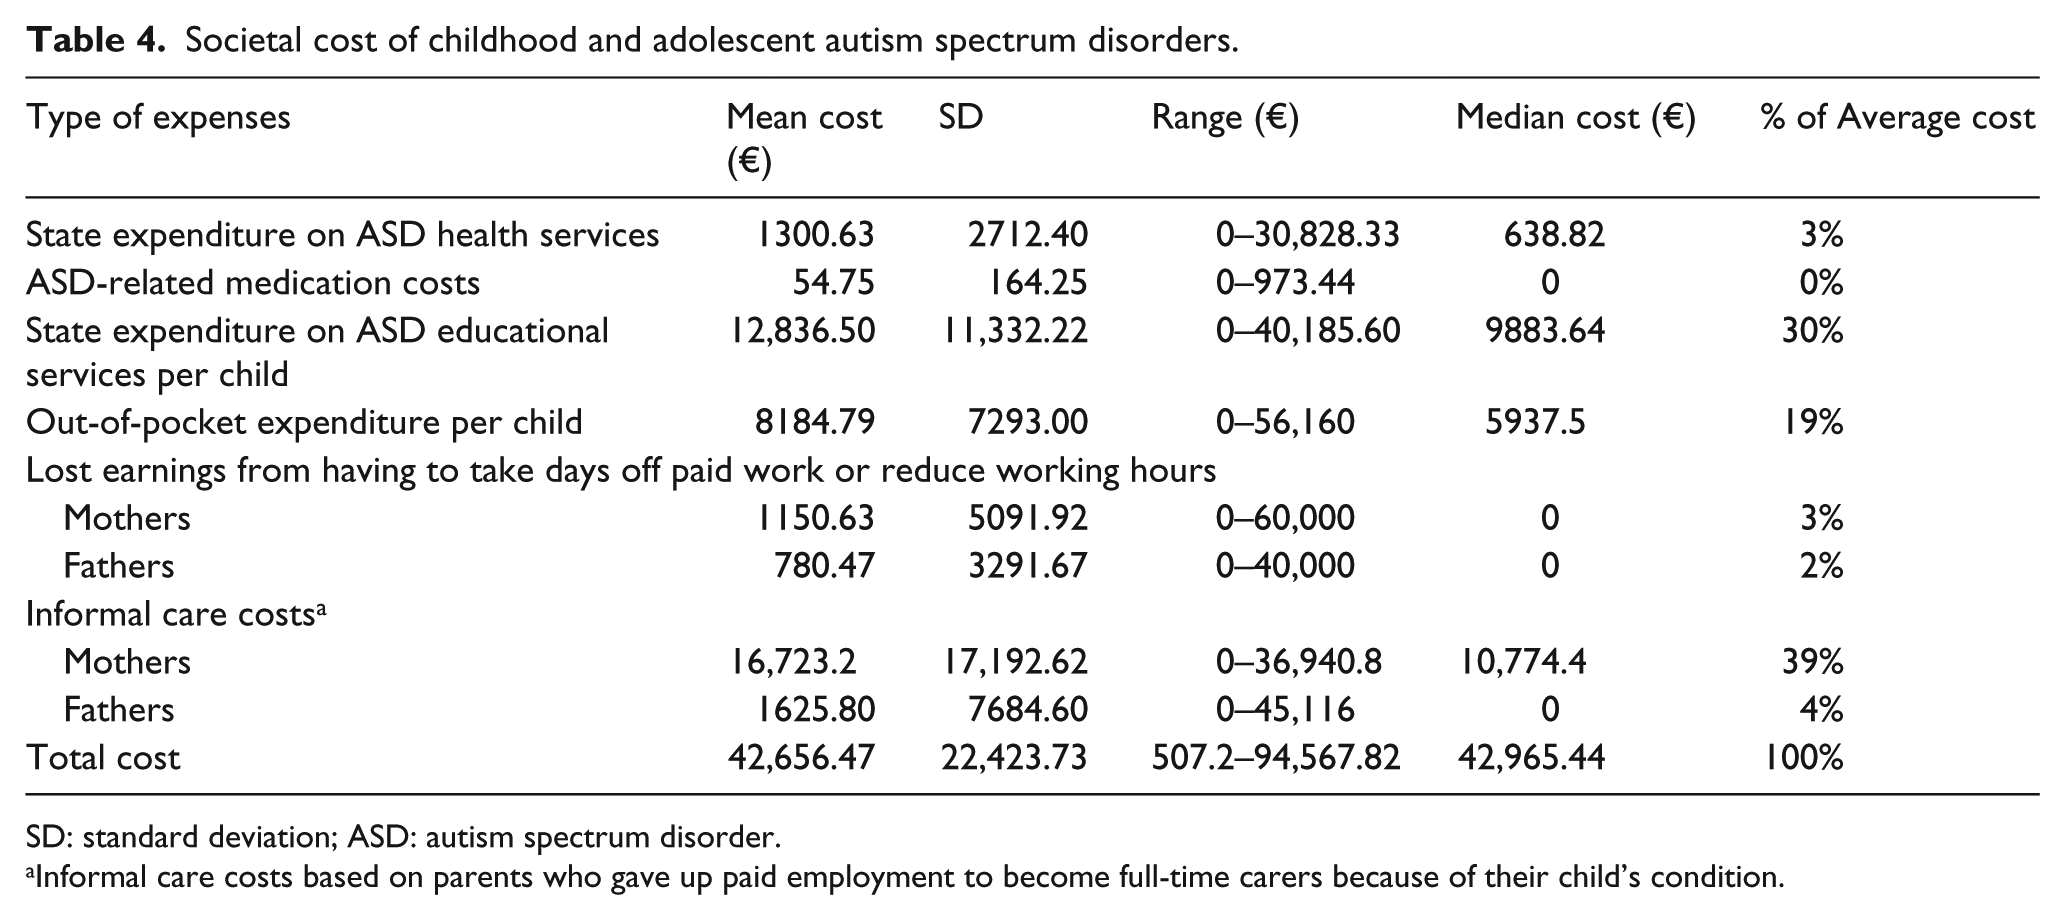
SD: standard deviation; ASD: autism spectrum disorder.
Informal care costs based on parents who gave up paid employment to become full-time carers because of their child’s condition.
Predictors of expenditure
Model 1 in Table 5 shows the association between the predictors of ASD-related out-of-pocket expenditure per child and the various covariates shown. Families that had a child whose ASD severity was classified as level 2 moderate under DMS-5 criteria were found to have €3100.48 more out-of-pocket expenditure in comparison to families who had a child with level 1 mild ASD. This finding was statistically significant at a 5% level. Families who had a child whose ASD severity was classified as level 3 severe incurred €4396.64 more expenditure than families caring for a child with level 1 mild ASD, holding all else equal. Notably, equivalised disposable household income was not a driver of family out-of-pocket expenditure per child. Model 2 in Table 5 indicates that ASD severity was not a predictor of state public health expenditure, as neither of the variables are statistically significant at a 5% threshold. The only variables that appeared to be statistically significant in both models was the comorbidity count variable. Sensitivity analysis showed that when a binary comorbidity independent variable was used in both models instead of the comorbidity count score used in the results presented, the level 2 moderate variable in Model 1 for the out-of-pocket expenditure variable was statistically significant at a 1% level. In addition, the binary comorbidity variable in Model 2 was statistically significant at a 5% level. Interestingly, children living in rural areas had €724 greater state health expenditure than those living in urban or suburban areas. Supplementary Table S16 provides sensitivity analysis in relation to outlier costs.
Average marginal effects of GLM out-of-pocket expenditure per child and state health expenditure.
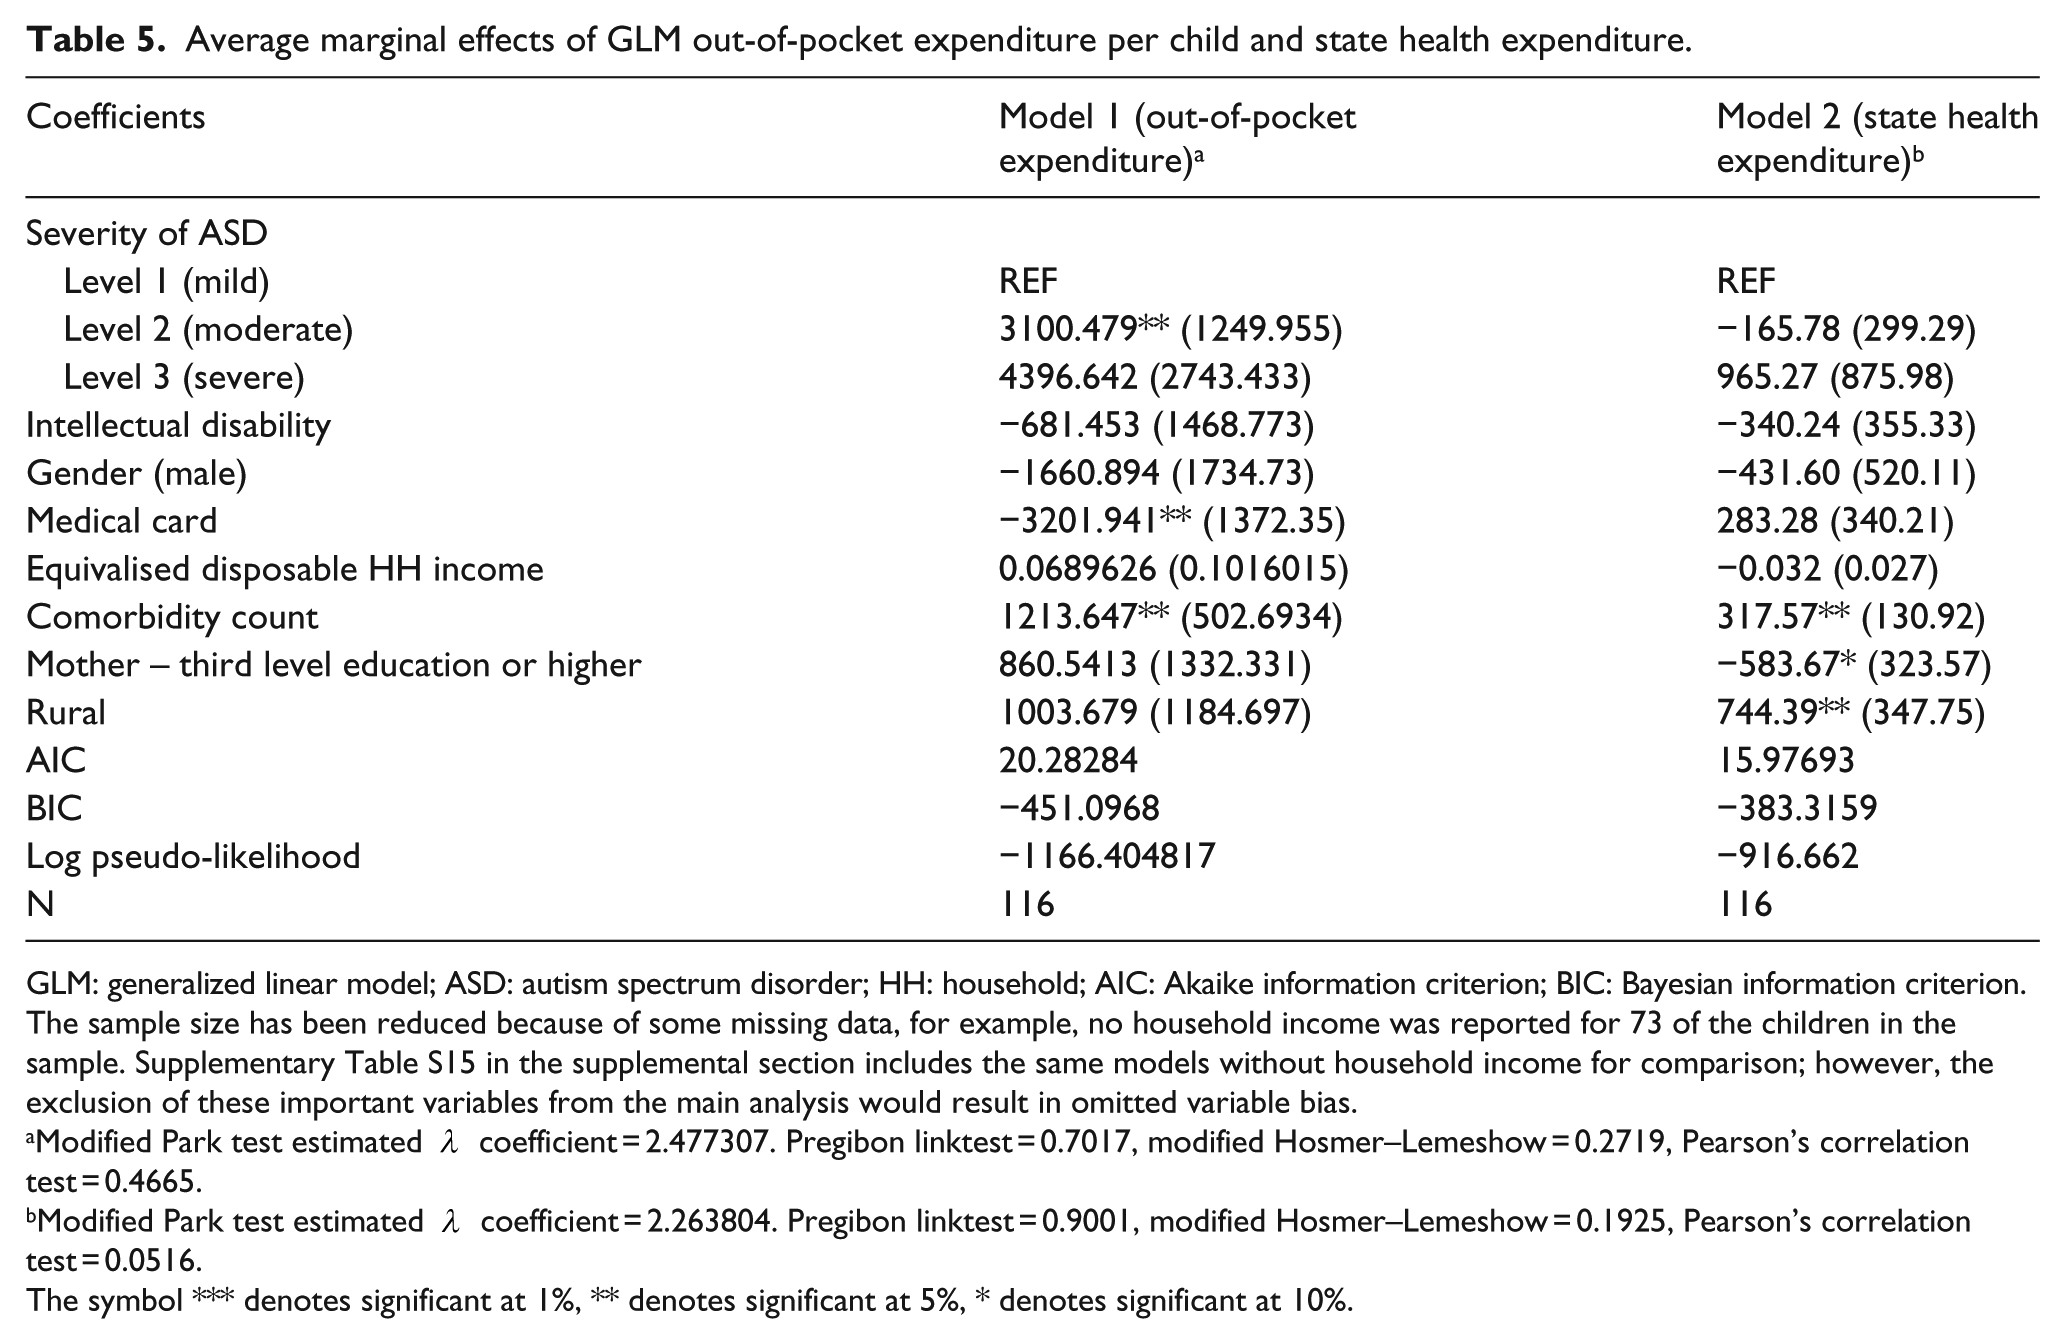
GLM: generalized linear model; ASD: autism spectrum disorder; HH: household; AIC: Akaike information criterion; BIC: Bayesian information criterion.
The sample size has been reduced because of some missing data, for example, no household income was reported for 73 of the children in the sample. Supplementary Table S15 in the supplemental section includes the same models without household income for comparison; however, the exclusion of these important variables from the main analysis would result in omitted variable bias.
Modified Park test estimated
Modified Park test estimated
The symbol *** denotes significant at 1%, ** denotes significant at 5%, * denotes significant at 10%.
Discussion
The key findings have shown that there is a significant economic burden associated with ASD among children and adolescents in Ireland, and that a considerable proportion of this is borne directly by parents rather than the state. A detailed description of the breakdown of out-of-pocket costs shows that caregivers address many aspects of care ranging from everyday additional costs such as paying for private therapeutic interventions and assessments to planning for long-term care through spending on home adaptations. While the state spends a considerable amount of its ASD-related expenditure on educational costs, most of these costs relate to special needs assistants. Although special needs assistants are unquestionably a very necessary support with regard to helping children with particular tasks and inclusion, the lack of investment in mandatory ASD training for all teachers teaching children with an ASD is perhaps indicative of a focus on managing behaviours rather than a commitment to addressing the needs of a child. The fact that condition severity is significantly associated with higher out of pocket expenditures but not state level expenditures is also potentially instructive. It suggests that the state may provide a basic level of service for all those with ASD but do not appear to increase service provision as ASD severity increases. By contrast parents do increase expenditure in a manner consistent with intuition, these facts combining to suggest that both in terms of overall provision and in terms as needs increase, parents are central to meeting the needs of young people with ASD in Ireland. That income is not a significant predictor of expenditures is perhaps surprising. The finding suggests that despite the fact that families with higher incomes may be better placed to incur additional expense in meeting the needs of their children, those on higher incomes are not spending significantly more than those on lower incomes. This may reflect the possibility that the bulk of care is delivered by a primary caregiver reducing the potential to substitute purchased services for those provided directly by the parent. Clearly though, it is an area that warrants further investigation.
While it is not possible to make direct comparisons with other countries due to variations in healthcare systems and methodologies, it is nevertheless worth making a brief comparison in terms of the distribution and drivers of costs. Previous studies found that families incurred considerably lower out-of-pocket expenditure in comparison to our findings. For example, Barrett et al. (2012) found that average out-of-pocket expenditure for families with an ASD child in the United Kingdom aged between 2 and 4 years over a period of 6 months, amounted to £227 with costs ranging from £0 to £3350 over that time period. These expenditures included a broad range of costs including home adaptations, overseas travel for health services and assessment, special equipment and diets. A Swedish study conducted by Järbrink (2007) measured the societal cost of childhood ASDs. With regard to relatives’ out-of-pocket expenditure, the average annual cost was €1165 per child per year. In Israel, Raz et al. (2013) reported average out-of-pocket expenditures of US$8288 (€6968.96) ranging from US$0 to US$89,754 (€0–75,442.72). Amendah et al.’s (2011) review of previous ASD cost studies highlights two timely issues. First, the paucity of out-of-pocket estimates for the United States with the exception of Birenbaum et al. (1990) where the mean annual expenditures in 2003 per child was US$362. Second, estimates on the high cost of nonmedical expenditures in the United States for ASD early intervention behavioural therapies which can vary in mean cost per child from US$40,000 to US$60,000 per annum (Chasson et al., 2007). This is of particular relevance to Ireland, given that most of these early interventions are funded by families as out-of-pocket expenditure. A more recent study conducted by Beuscher et al. (2014) pooled out-of-pocket expenditure estimates from previous studies. A strength of this study is that it provides a unique comparison between ASD age specific costs for the United Kingdom and the United States aggregated by whether the individual with an ASD also has an intellectual disability. The authors found that direct nonmedical costs related to special education and early intervention along with parental productivity losses accounted for most of the total costs in both countries. Interestingly, annual costs increased with age in the United Kingdom, while costs in the United States were considerably higher in early childhood than for older children. The most recent published estimates on the economic cost of autism across the lifespan are contained in a Scottish report (MacKay et al., 2017). Estimates showed that the annual cost of ASD in Scotland was almost £2.3 billion, while 93% of the costs were accounted for by adults and 7% by children. In terms of annual service costs for children, the report showed the annual cost was £13,360 for children with Asperger’s/HFA and £26,321 for children with autism. It is worth noting that educational costs accounted for three quarters of the total cost. A limitation of the study is that no estimates of out-of-pocket expenditure are provided.
In the United Kingdom, Barrett et al. (2015) established the average total cost of health, respite and educational services for four groups of adolescents over a 6-month period. Interestingly, the average total service cost for adolescents with an autistic disorder was £11,029 in comparison to the cost for the three other groups – individuals who have other special educational needs (£9268), those with other ASDs (£8968) and typically developing adolescents (£2954). By contrast annual out-of-pocket expenditures in Ireland were €8184.79 per child, state expenditures approximately €14,192 of which approximately €12,837 was education related. With regard to significant predictors of costs, Lavelle et al. (2014) used GLM models on US data along with the inclusion of a control group. Having a child with an ASD was found to be a significant predictor of state-provided healthcare and non-healthcare costs. Nonetheless, higher out-of-pocket costs or additional time spent caregiving was not significantly associated with having a child with an ASD. In contrast to this article, these models did not explore ASD severity levels as a predictor of costs.
It is important to note that a number of limitations apply to this study. The study would have benefitted from the inclusion of a control group of children with another medical condition or typically developing children. The selection of a control group, however, is by no means straightforward. Thus, determining who constitutes an appropriate comparator would inevitably involve not only additional time and expense beyond that available to the research team but more fundamentally entail judgements on who constitutes a suitable comparator in terms of age, health/functioning and location that are by no means straightforward. Parents were asked to complete a detailed survey as part of this study which required recall of costs and services utilization in the previous 12 months which may be subject to recall bias or error. A self-completion survey was mandatory as no ASD service utilization data was available (HSE, 2012). Furthermore, the study may have underestimated the cost in its calculations, as it was not possible to estimate state transport costs for children travelling to school as information on the distance travelled was not available. Similar to Järbrink and Knapp (2001), family out-of-pocket expenditure, lost earnings and informal care costs were based exclusively on ASDs. State expenditure costs are based on ASD specified services and are assumed to be related to ASDs. Nights in hospital were not calculated as it was not possible to distinguish whether they were ASD related or not. Despite the substantial costs established in this study, it tells only part of the story. The issue of unmet service needs and caregivers’ preference for better services over increased payments is currently being explored by the authors in a separate piece of research.
As noted previously, there are limitations associated with using convenience sampling. However, as illustrated in the supplemental tables stratified by recruitment method, there was no substantial difference between the groups apart from the incidence of comorbidities.
The implications of the overall findings from this study raise a number of issues for policymakers and future research. For instance, this article has shown the extent of burden which falls upon families. Despite this, caregiver implemented interventions are being promoted (Green et al., 2017; Pickles et al., 2016). The real challenge lies in conducting further research that establishes ways of taking into consideration the complex and substantial burden placed upon families, while trying to implement effective interventions and supports to reduce costs and improve outcomes.
This paper has made three distinct contributions to the literature. It is the first national study to have established the economic burden of childhood ASDs in Ireland. Second, it has provided the most robust set of estimates using the most comprehensive dataset to date on the economic burden of childhood ASDs. Third, it is the first study to give insight into the relationship between ASD severity and other predictors of state-provided health services and families out-of-pocket expenditure.
Supplemental Material
AUT801586_Lay_Abstract – Supplemental material for The economic costs and its predictors for childhood autism spectrum disorders in Ireland: How is the burden distributed?
Supplemental material, AUT801586_Lay_Abstract for The economic costs and its predictors for childhood autism spectrum disorders in Ireland: How is the burden distributed? by Aine Roddy and Ciaran O’Neill in Autism
Supplemental Material
AUT801586_Supplementary_material_Section_1 – Supplemental material for The economic costs and its predictors for childhood autism spectrum disorders in Ireland: How is the burden distributed?
Supplemental material, AUT801586_Supplementary_material_Section_1 for The economic costs and its predictors for childhood autism spectrum disorders in Ireland: How is the burden distributed? by Aine Roddy and Ciaran O’Neill in Autism
Supplemental Material
AUT801586_Supplementary_material_Section_2 – Supplemental material for The economic costs and its predictors for childhood autism spectrum disorders in Ireland: How is the burden distributed?
Supplemental material, AUT801586_Supplementary_material_Section_2 for The economic costs and its predictors for childhood autism spectrum disorders in Ireland: How is the burden distributed? by Aine Roddy and Ciaran O’Neill in Autism
Footnotes
Acknowledgements
The authors are extremely grateful to the two anonymous reviewers for their detailed comments and support. They also wish to sincerely thank all the parents who participated in the study.
Funding
The author(s) disclosed receipt of the following financial support for the research, authorship and/or publication of this article: The study was funded by the Irish Research Council, while survey costs were covered by Autism Ireland, formerly known as Irish Autism Action.
Declaration of conflicting interests
The author(s) declared no potential conflicts of interest with respect to the research, authorship, and/or publication of this article.
Notes
References
Supplementary Material
Please find the following supplemental material available below.
For Open Access articles published under a Creative Commons License, all supplemental material carries the same license as the article it is associated with.
For non-Open Access articles published, all supplemental material carries a non-exclusive license, and permission requests for re-use of supplemental material or any part of supplemental material shall be sent directly to the copyright owner as specified in the copyright notice associated with the article.