
Abstract
The recent Diagnostic and Statistical Manual of Mental Disorders–Fifth Edition (DSM-5) reformulation of autism spectrum disorder has received empirical support from North American and UK samples. Autism spectrum disorder is an increasingly global diagnosis, and research is needed to discover how well it generalises beyond North America and the United Kingdom. We tested the applicability of the DSM-5 model to a sample of Finnish young people with autism spectrum disorder (n = 130) or the broader autism phenotype (n = 110). Confirmatory factor analysis tested the DSM-5 model in Finland and compared the fit of this model between Finnish and UK participants (autism spectrum disorder, n = 488; broader autism phenotype, n = 220). In both countries, autistic symptoms were measured using the Developmental, Diagnostic and Dimensional Interview. Replicating findings from English-speaking samples, the DSM-5 model fitted well in Finnish autism spectrum disorder participants, outperforming a Diagnostic and Statistical Manual of Mental Disorders–Fourth Edition (DSM-IV) model. The DSM-5 model fitted equally well in Finnish and UK autism spectrum disorder samples. Among broader autism phenotype participants, this model fitted well in the United Kingdom but poorly in Finland, suggesting that cross-cultural variability may be greatest for milder autistic characteristics. We encourage researchers with data from other cultures to emulate our methodological approach, to map any cultural variability in the manifestation of autism spectrum disorder and the broader autism phenotype. This would be especially valuable given the ongoing revision of the International Classification of Diseases–11th Edition, the most global of the diagnostic manuals.
There are no diagnostic biomarkers for autism spectrum disorder (ASD) because its constituent disease process is obscure. Therefore, by necessity, ASD is currently conceptualised as a behavioural syndrome, whereby a cluster of observable characteristics is posited as the manifestation of the latent ASD disease entity. As such, diagnostic criteria for ASD represent a working hypothesis that a specific collection of signs and symptoms signifies the presence of ASD. Like all hypotheses, these diagnostic criteria need to be tested against data and modified accordingly.
With the recent publication of the Diagnostic and Statistical Manual of Mental Disorders–Fifth Edition (DSM-5), there has been a reformulation of the ASD syndrome, in terms of both its structure and content (American Psychiatric Association (APA), 2013). The third and fourth editions of the DSM proposed that ASD manifests as a triad of symptoms (APA, 1980; APA, 1994), whereas DSM-5 hypothesises an autism dyad, comprising social communication difficulties and repetitive, stereotyped behaviour (RSB). Abnormalities of sensory perception, previously designated a peripheral feature of ASD, are considered a core feature in DSM-5, classified as a type of RSB. Repetitive use of language, assigned by Diagnostic and Statistical Manual of Mental Disorders–Fourth Edition (DSM-IV) as a type of communication impairment, is listed as a form of RSB in DSM-5.
These ideas about the ASD syndrome were initially published online by the American Psychiatric Association as draft diagnostic criteria, to encourage their evaluation by independent research groups prior to the publication of DSM-5. In general, this has provided support for the new, DSM-5 conceptualisation of ASD. Several studies using confirmatory factor analysis (CFA) have found a dyadic model, with social communication and RSB domains superior to the triadic Diagnostic and Statistical Manual of Mental Disorders–Fourth Edition, Text Revision (DSM-IV-TR) model (e.g. Frazier et al., 2012; Mandy et al., 2012a; Snow et al., 2009). Furthermore, there is evidence for the value of including sensory abnormalities (SAs) as a core feature of ASD, in the RSB symptom cluster. SAs are widespread in ASD and less common in other neurodevelopmental disorders (Ben-Sasson et al., 2009), and they load onto the RSB dimension in factor analytic studies (Gotham et al., 2007; Mandy et al., 2012a). CFA studies have also supported the DSM-5 notion that repetitive language is better understood as a form of RSB, rather than as a symptom of impaired social communication (Gotham et al., 2007). While there is ongoing controversy about whether DSM-5 has chosen the correct threshold for diagnosis (e.g. Mandy, 2013), evidence is mounting that the proposed DSM-5 reformulation of the structure and content of the ASD syndrome possesses greater validity than its DSM-IV-TR predecessor. However, it should be noted that such evidence comes almost exclusively from English-speaking, and mostly North American, samples.
The manifestations of ASD vary, depending on the characteristics and circumstances of the individual who has the disorder. For example, there are distinct male and female phenotypes (Mandy et al., 2012b), and ASD presents differently depending on the age (Charman et al., 2005) and intellectual ability (Ingram et al., 2008) of the individual. In this study, we seek to engage with the question of whether ASD manifests differently in distinct cultural and linguistic contexts. The symptoms of ASD are fundamentally social, engendered by a failure to fulfil conventional standards for social behaviour. What constitutes acceptable and effective social behaviour is different in different cultural contexts. For example, Norbury and Sparks (2013) highlight cultural variations in the implicit rules that govern the pragmatics of language, writing, Discourse rules, such as turn taking, interrupting, appropriate topic choices, use of eye contact, and other nonverbal choices for maintaining interaction, use of humour, and the ability to question or challenge communication partners, are largely determined by cultural rules. (p. 48)
Social conventions and expectations differ according to culture, with even geographically proximate cultures showing important differences in the way social life is understood and conducted (e.g. Argyle et al., 1986). It is reasonable to hypothesise that the manifestations of ASD may vary according to the sociocultural context in which the disorder presents.
Since autism was first described by a German-trained psychiatrist working in America (Kanner, 1943), ASD has become a global diagnosis. At the time of writing, there are published studies assessing ASD prevalence from all continents except Antarctica, and extensive efforts are underway to translate gold-standard English-language ASD assessments into dozens of languages (Norbury and Sparks, 2013). The drive for large samples, notably in molecular genetics research, has encouraged the combination of data collected in different countries and languages (e.g. Curran et al., 2011). The question of whether ASD presents differently in different cultures has never been more pressing or more amenable to empirical investigation.
There is a nascent literature on ASD and culture, much of which describes studies using the Autism Quotient (AQ; Baron-Cohen et al., 2001) to measure autistic traits in non-clinical samples. This influential and well-validated self-report measure of autistic traits has been translated from English into several languages, and there are published evaluations of versions in Japanese (Wakabayashi et al., 2006), Mandarin Chinese (Lau et al., 2013), French (Sonié et al., 2013), Italian (Ruta et al., 2012) and Dutch (Hoekstra et al., 2008). In addition, the AQ has been administered to English-speaking students from Malaysia and India (Freeth et al., 2013). These studies have tended to replicate findings from UK AQ investigations that males score higher than females (Freeth et al., 2013; Hoekstra et al., 2008; Lau et al., 2013; Ruta et al., 2012; Wakabayashi et al., 2006), and that among students, scientists show more autistic traits than social scientists and arts students (Freeth et al., 2013; Hoekstra et al., 2008; Wakabayashi et al., 2006). In addition, parents of people with ASD score higher on the AQ than control parents in Italy (Ruta et al., 2012) and Taiwan (Lau et al., 2013). Broadly, such findings support the idea that the ASD construct, at least as measured dimensionally by the AQ, has some validity in a range of cultures.
Nevertheless, the international AQ literature has also suggested that there may be some cultural divergence in the presentation of ASD. Wakabayashi et al. (2006) noticed that their Japanese population of students tended to score higher on the AQ than students in the UK normative sample (Baron-Cohen et al., 2001). Similarly, English-speaking students in Malaysia and India attained higher AQ scores than UK students (Freeth et al., 2013). Such findings are compatible with the idea that some behaviours measured by the AQ that are symptomatic of autistic traits in the United Kingdom signify something different in Japan, India and Malaysia. Nevertheless, it is also possible that confounding, non-cultural variables could explain group contrasts in AQ scores. For example, in the study by Freeth et al. (2013), compared to the UK control group, the samples from India and Malaysia had a much higher proportion of scientists, which may account for their higher AQ scores. Furthermore, it is not clear whether cross-cultural findings from the AQ literature, which mainly focuses on non-clinical participants, generalise to people who actually have ASD.
There are studies that have examined cultural differences among people with a clinical ASD diagnosis, but these are difficult to interpret due to non-cultural confounding variables. Matson et al. (2011) identified more severe autistic symptoms in children with ASD from the United Kingdom and United States, compared to those from Israel and South Korea. However, the different national groups in this study were mismatched on age to a large degree. In addition, although IQ was not measured, it is likely that any cultural comparisons in this study were seriously confounded by ability level. The children in the UK sample, which had most severe symptoms, were recruited from a school specialising in intellectual disability, whereas the other samples were drawn from across the full range of the autism spectrum. The finding that UK children with ASD have especially severe challenging behaviour (Chung et al., 2012) is similarly hard to interpret, as it was derived from an expanded version of the sample that Matson et al. (2011) used.
Avoiding such confounds when comparing clinical samples from different countries presents a formidable challenge. Even groups carefully matched on age and gender may be subtly confounded, as different countries are likely to have distinct referral practices. For example, compared to the United Kingdom and United States, in countries with a short history of recognising ASD, clinics are less likely to encounter more subtle, high-functioning cases (Kim et al., 2011). Thus, national differences in mean scores on ASD symptom measures are difficult to interpret: it is not clear to what extent they reflect cultural differences in ASD symptoms, as opposed to the operation of distinct sampling biases in different countries.
An alternative approach to studying cultural variability in ASD symptoms is to test for differences in the structure, rather than the level, of autistic traits in different countries. Such an approach, using CFA to compare model fit in data from different countries, has been used effectively to test for cultural differences in symptoms of other mental disorders, such as depression (e.g. Byrne and Baron, 1994) and psychosis (Kwapil et al., 2012). This methodology has the advantage of being less vulnerable to the sorts of confound described above, as it does not rely on comparison of the severity of ASD symptomatology in different samples. We are not aware of any studies formally comparing the factor structure of ASD traits in different countries. There are several articles describing independent factor and principal components analyses of the AQ administered to non-autistic participants in Taiwan (Lau et al., 2013), India, Malaysia (Freeth et al., 2013) and the Netherlands (Hoekstra et al., 2008). When compared with each other, and with equivalent analyses of UK data, these have yielded similar, but not identical, factor solutions, raising the possibility that the structure of autistic symptoms varies according to the cultural and linguistic context in which they present. Nevertheless, without inclusion of participants with ASD and formal statistical comparison of factor structures, no firm conclusions can currently be drawn.
In summary, a nascent literature raises the possibility that ASD varies in its presentation in different cultures, without offering confirmation of this. To date, studies have mostly relied on non-clinical samples, without directly testing whether findings from the general population apply to people with ASD. Furthermore, the inevitable methodological and practical challenges of doing cross-cultural research have resulted in designs that have not matched groups on key variables, making any observed differences in ASD trait severity hard to interpret. We propose an approach that is less vulnerable to the influence of such confounds, involving the use of CFA to compare formally the fit of autistic symptom models in data collected using the same measurement instrument in different cultures. Specifically, we aim to extend recent work on a UK clinic sample (Mandy et al., 2012a) to see whether the DSM-5 model fits well in a Finnish ASD sample and whether there are significant discrepancies in model fit between the United Kingdom and Finland. We also investigated the DSM-5 model’s cross-cultural stability across the spectrum of symptom severity by checking its fit in Finnish participants with subclinical autistic traits characteristic of the broader autism phenotype (BAP).
Methods
Participants
The total sample comprised 948 young people, of whom 708 were from the United Kingdom and 240 from Finland. Sample characteristics are presented in Table 1. The UK participants have already been described in a previous factor analytic study (Mandy et al., 2012a). They were consecutive referrals to a specialist clinic for the assessment of ASD. All were verbally fluent and in mainstream education at the time of assessment, as these are referral criteria for this service. The 240 participants from Finland were clinical referrals assessed at a neuropsychiatric unit based in the department of child psychiatry of a university hospital. This is a specialist clinic for people with potential juvenile neuropsychiatric disorders, including ASD. In both the UK and Finnish samples, data were collected by a psychiatrist and/or clinical psychologist as part of a clinical assessment. ASD diagnoses were assigned based on parent-report information collected using the Developmental, Diagnostic and Dimensional Interview (3Di; Skuse et al., 2004), supplemented by direct observation in clinic and reports from the young person’s school. In this study, in line with DSM-5, we do not distinguish between subtypes of ASD. As such, we have grouped all participants receiving a diagnosis of autistic disorder, Asperger’s disorder or pervasive developmental disorder–not otherwise specified as having ASD.
Characteristics of the UK and Finnish samples.
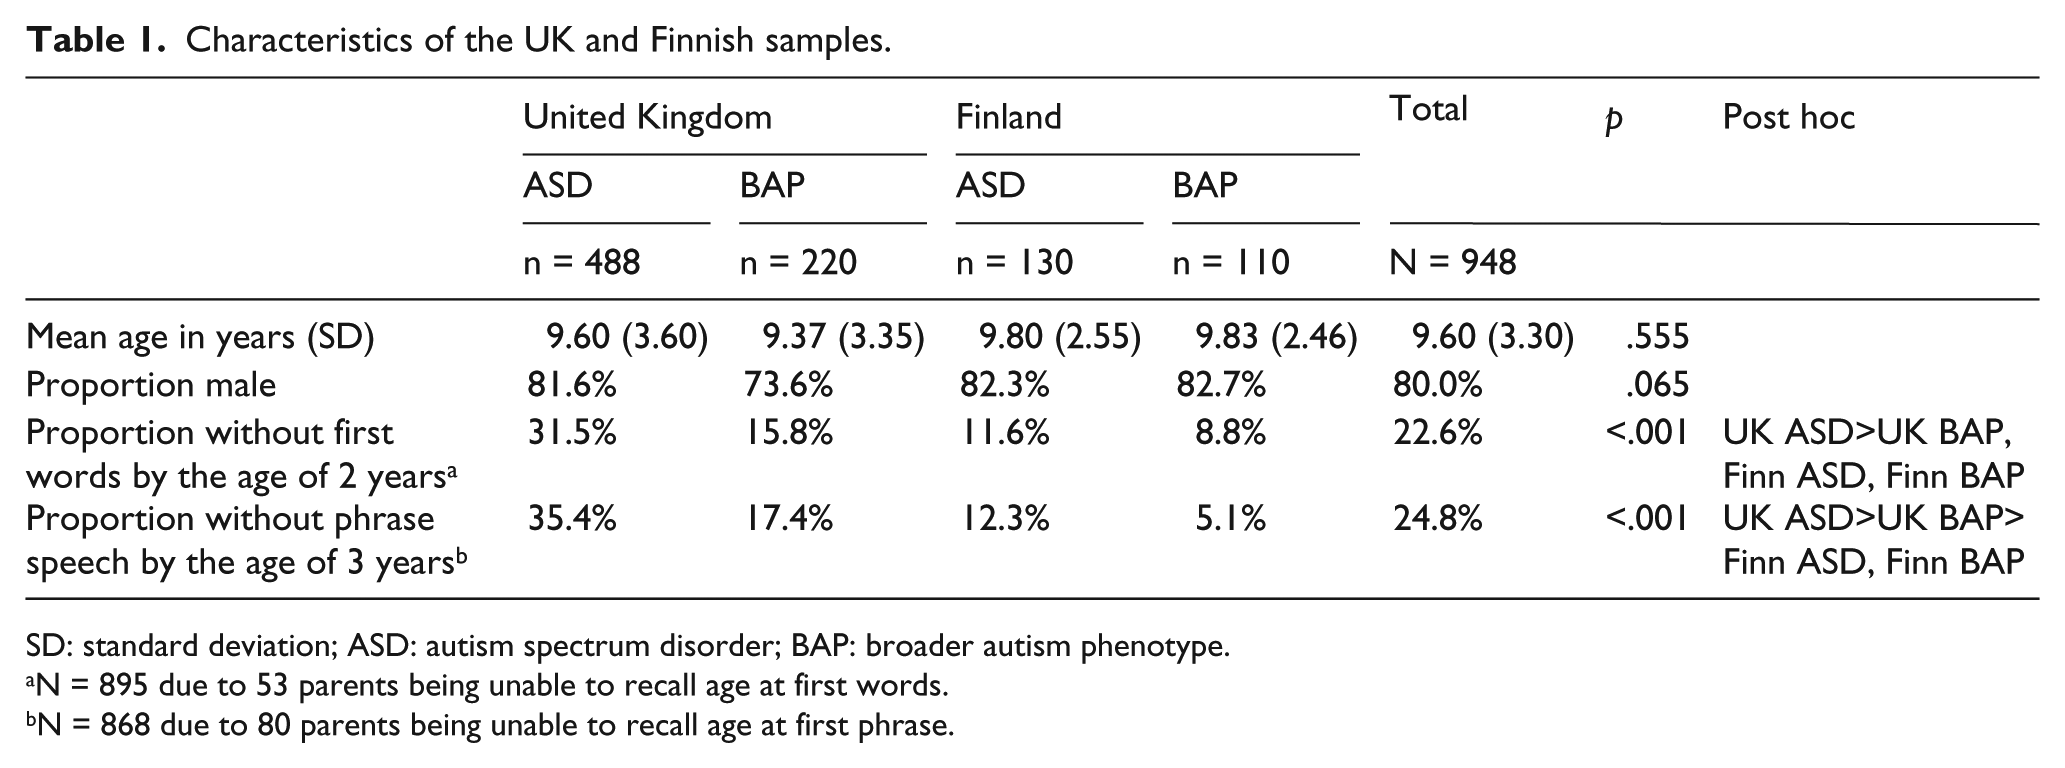
SD: standard deviation; ASD: autism spectrum disorder; BAP: broader autism phenotype.
N = 895 due to 53 parents being unable to recall age at first words.
N = 868 due to 80 parents being unable to recall age at first phrase.
To investigate cultural variability in autistic symptoms across the spectrum of severity, we included in our analyses individuals with elevated but subclinical autistic traits characteristic of the BAP. There is no standardised, universal definition of the BAP, with no agreed cut-point to distinguish it from typical development. To promote the replicability and generalisability of our findings, we based our BAP inclusion criteria on the ‘broader spectrum’ category defined by the Autism Genetic Resource Exchange (AGRE). These have the advantage of being systematic, explicit and widely used. The 3Di outputs scores equivalent to those provided by the algorithm of the Autism Diagnostic Interview–Revised (ADI-R). This enabled us to implement the AGRE ‘broader spectrum’ category, as this is defined in terms of ADI-R scores. In effect, this meant that any individual who did not reach threshold for having ASD, and who scored above 3 on the 3Di social scale, above 2 on the 3Di communication scale and above 1 on the 3Di RSB scale was considered to meet criteria for the BAP.
Ages in the overall sample ranged between 2.39 and 21.14 years. Two-thirds (65.2%; n = 618) of participants had an ASD, with the remainder (n = 330) fulfilling criteria for the BAP. As is shown in Table 1, the Finnish and UK samples did not differ in terms of their age, with all group differences being small (Cohen’s d between .06 and .15) and non-significant. The groups did not differ significantly on gender composition. However, the UK sample had higher rates of reported language delay.
This study was conducted after ethical review by the Research and Development departments of the two hospitals from which participants were recruited.
Measures
The 3Di was used to measure symptoms of ASD in both the UK and Finnish samples (Skuse, et al., 2004). This computerised, structured, parent-report interview has an ASD algorithm which combines data from 120 items concerning current and past behaviour. This algorithm is hierarchical. Clusters of items are summed and averaged to generate 12 subscale scores (median number of items per subscale = 8.5, range = 2–22), which correspond to the 12 diagnostic criteria for autistic disorders listed in DSM-IV. These are then summed to yield three domain scores, each of which corresponds to one of the elements of the DSM-IV autistic triad. The Reciprocal Social Interaction domain score is the sum of subscales measuring nonverbal interaction (S1), peer relationships (S2), sharing (S3) and socio-emotional reciprocity (S4). The Communication domain score is summed from subscales measuring nonverbal communication (C1), conversational abilities (C2), stereotyped and repetitive language (C3) and play and imagination (C4). The RSB domain score is calculated by adding subscales measuring unusual preoccupations (R1), routines and rituals (R2), repetitive and stereotyped motor behaviour (R3) and persistent preoccupation with parts of objects (R4). These 12 subscale scores are manifest variables in the CFAs reported in this article. In addition, to account for the full breadth of DSM-5 diagnostic criteria, we included in our analyses the 3Di SAs subscale, calculated from five 3Di items measuring hypo- and hypersensitivity to sounds and textures (Mandy et al., 2011).
The original, UK version of 3Di has strong psychometric properties. Test–retest and interrater reliability is good, with all intraclass correlation coefficients exceeding .86 (Skuse et al., 2004). The 3Di shows high levels of agreement with the ADI-R in terms of whether an individual crosses clinical threshold for reciprocal social interaction (86% agreement), Communication (100%) and RSB (76%). Further evidence of criterion validity is provided by the high level of agreement between the 3Di algorithm and clinician diagnosis of ASD (positive predictive power of 3Di = .93; negative predictive power = .91).
The Finnish version of the 3Di is a direct translation of the English 3Di. Each item was translated by an experienced Finnish psychiatrist (K.P.) fluent in English, in regular consultation with the 3Di’s progenitor (D.S.). To test the translated version, it was independently back-translated and checked against the English 3Di by DS. The Finnish version was piloted for a year, before being programmed to enable the same computerised delivery and scoring as the UK version. All subscales and domain scores in the Finnish version are calculated using the same rules as the original, English-language 3Di.
Analysis
Factor analysis is a statistical technique which uses patterns of covariance between a set of observed variables to make inferences about the presence of a smaller number of underlying constructs or ‘factors’. In CFA, relationships between underlying factors and observed variables are specified a priori, and the resultant models are tested to see how well they fit specific data. CFA also enables formal examination of whether a model fits similarly in two or more different data sets. This is called testing for factorial ‘invariance’ or ‘equivalence’. In this study, CFA was conducted using AMOS 19.
In the first part of our investigation, we tested three models against our 3Di data from young Finnish people with ASD:
The one-factor model, in which all 12 subscales from the 3Di ASD algorithm were hypothesised to load onto a single underlying ASD factor.
The DSM-IV model, which posited a triad of underlying factors characterised by impairments in reciprocal social interaction (S1, S2, S3, S4), communication (C1, C2, C3, C4) and RSB (R1, R2, R3, R4).
The DSM-5 model with two hypothesised factors of social communication impairment (S1, S2, S3, S4, C1, C2) and RSB (R1, R2, R3, R4, C3, SA). This model is depicted in Figure 1. Note that this model does not include subscale C4 (impaired play and imagination) as this DSM-IV criterion has been removed from DSM-5. Also reflecting DSM-5 diagnostic criteria, in this model, the SAs and C3 (stereotyped and repetitive language) 3Di subscales are specified as loading onto the RSB factor.
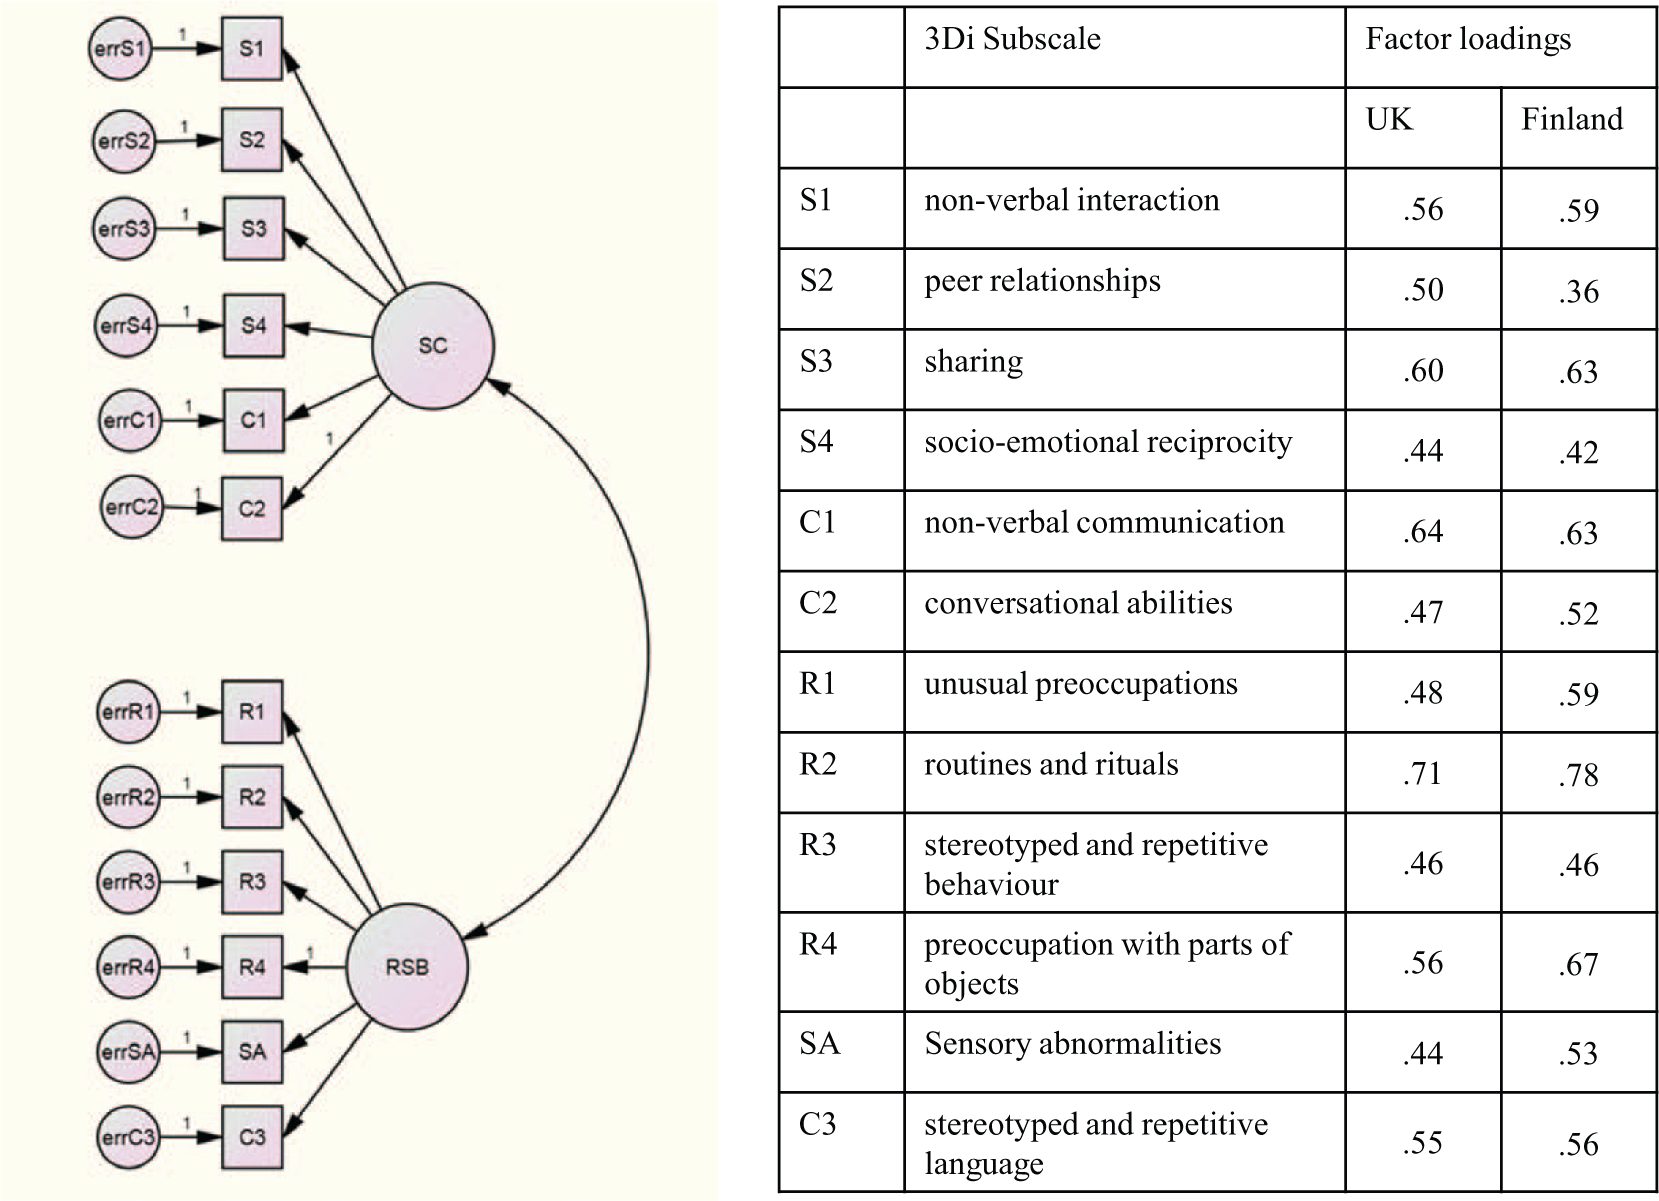
The DSM-5 model in the UK and Finnish autism spectrum disorder samples.
There is no single indicator of model fit in CFA, so we used diverse indices of fit to evaluate our models, selected according to recommendations in the CFA literature (see Byrne, 2010). These were the standardised root mean residual (SRMR), the comparative fit index (CFI), the root mean square error of approximation (RMSEA) and the consistent version of Akaike’s information criterion (CAIC). The SRMR is the average of the standardised residuals derived from comparing the correlation matrix of the hypothesised model with the correlation matrix of the data. In a well-fitting model, the SRMR will be small, with values less than .08 indicating acceptable model fit, and values below .05 showing good fit. The CFI compares the proposed model to the interdependence model, in which all parameters are assumed to be zero. A CFI above .90 is indicative of adequate fit, with values above .95 showing good fit. The RMSEA is concerned with how well the hypothesised model would fit the population covariance matrix. By convention, RMSEA values below .05 indicate good fit, while those below .08 show adequate fit. A RMSEA between .08 and .10 signifies mediocre model fit. The CAIC estimates generalisability of parameter estimates to future samples. It takes into account the number of parameters as well as goodness-of-fit, with smaller values reflecting better fitting, more parsimonious models.
In addition to these indicators of overall model fit, CFA provides measures of how well individual variables fit within a model. Modification indices (MIs) are provided for each fixed parameter within a model, expressing how much the model would be improved (in terms of χ2 reduction) if that parameter were to be freely estimated. Egregiously high MIs can reflect the presence of misspecified items within a model. In addition to MIs, standardised residuals are provided for each zero-order relationship between observed variables in the model. These express the extent to which the model tends to over- or under-estimate specific zero-order relationships. Values outside the range −2.58 to +2.58 are considered to be excessive and can indicate the presence of misspecified variables.
In this study, we were particularly interested to test in our Finnish data the validity of specific changes proposed by DSM-5, namely, the transfer of repetitive and stereotyped language from the communication to the RSB factor, and the addition of SA as an indicator of RSB. Therefore, we inspected MIs and standardised residuals for the Finnish DSM-5 model, to test whether subscales measuring repetitive and stereotyped language and SAs were well specified within the model.
After we had tested the DSM-5 model in our Finnish ASD data, we proceeded to formally compare its fit in our UK and Finnish ASD samples. This involved running a series of evermore constrained models simultaneously in the UK and Finnish data, to conduct an increasingly rigorous and in-depth test of the DSM-5 model’s factorial invariance. First, we ran a ‘free model’, which can also be described as a ‘configural model’. This involved estimating the DSM-5 model (as depicted in Figure 1 and described above) in both groups simultaneously without placing equality constrains on any of its parameters. This was a test of ‘configural invariance’: whether the same items loaded onto the same two factors in each group. In addition, the configural model served as a baseline for comparison with subsequent more constrained models. Next, we ran a ‘measurement model’ by constraining all factor loadings to be equal in both groups. If this model had a significantly worse fit than the ‘configural model’, it would indicate that all factor loadings were not equivalent in the UK and Finnish samples. In line with standard practice in CFA, a reduction in the CFI of >.01, compared to the configural model, was taken to indicate significantly worse fit (Cheung and Rensvold, 2002). Finally, we created the ‘structural model’ by adding a further constraint to the measurement model, specifying that the relationship between the social communication and RSB factors be equal in both the Finnish and UK ASD samples. If this constraint caused worse model fit (as indicated by decline in CFI > .01), it would show a lack of structural invariance, meaning that the two factors had different correlations in our Finnish and UK data.
We were also interested to see how well our models fit in the Finnish BAP data, and whether there were differences in the fit of the DSM-5 model for Finnish and UK participants with the BAP. Thus, we fitted the one-factor, DSM-IV and DSM-5 models in the Finnish BAP sample with the intention of comparing the fit of the DSM-5 model in the UK and Finnish BAP samples.
Results
Testing one-factor, DSM-IV and DSM-5 models in the Finnish ASD group
Table 2 shows indices of fit for each ASD symptom model tested against the data from Finnish participants with ASD. The one-factor model tested whether all 12 DSM-IV core autistic symptoms are well conceptualised as manifestations of a single underlying dimension. This model performed poorly, with each index suggesting inadequate fit. The DSM-IV model tested the hypothesis that autistic symptoms fall into three distinct social, communication and RSB clusters. None of its fit indices fell within the acceptable range. In contrast, the DSM-5 model scored in the acceptable range for all indices of fit and had the lowest CAIC. In comparison to the other models, it attained the best score on each index of fit.
Fit indices for confirmatory factor analysis models tested against the Finnish autism spectrum disorder sample (n = 130).
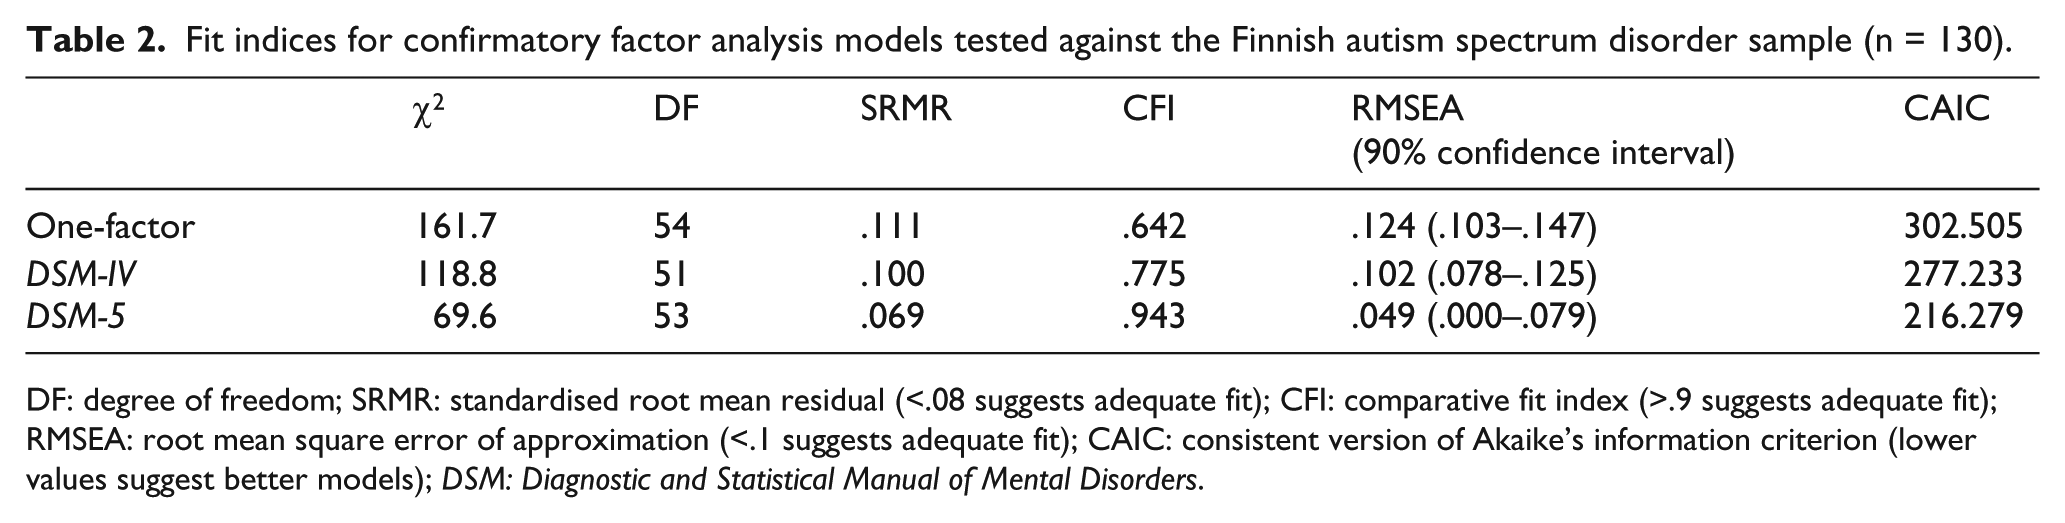
DF: degree of freedom; SRMR: standardised root mean residual (<.08 suggests adequate fit); CFI: comparative fit index (>.9 suggests adequate fit); RMSEA: root mean square error of approximation (<.1 suggests adequate fit); CAIC: consistent version of Akaike’s information criterion (lower values suggest better models); DSM: Diagnostic and Statistical Manual of Mental Disorders.
We inspected MIs and standardised residuals for the DSM-5 model in the Finnish ASD group, to gain a more detailed understanding of how specific modifications to diagnostic criteria influenced the model. There were no egregious MIs or elevated standardised residuals for the item measuring stereotyped and repetitive use of language (C3), suggesting that it loads onto the RSB factor in this model. SAs also appear to load comfortably onto this factor, as there were no problematic MIs or standardised residuals for that subscale.
Assessing the invariance of the DSM-5 model in UK and Finnish ASD groups
When we ran the DSM-5 model in the UK ASD sample, we attained the following estimates of fit: χ2 = 137.5 (degrees of freedom (DF) = 53), SRMR = .057, CFI = .910, RMSEA = .057 (90% confidence interval = .046–.069) and CAIC = 317.3. These indicate that the model fitted adequately in the UK sample.
To test whether the model fitted differently in our two samples, we tested an increasingly constrained series of models across our UK and Finnish data. First, we ran a free model (also known as a ‘configural model’), in which all factor loadings and factor covariances were allowed to differ between groups. This served as a baseline for subsequent more stringent tests of invariance and provided a test of whether the basic structure of the DSM-5 model was equivalent in UK and Finnish samples (i.e. ‘configural invariance’). The free model showed adequate fit (CFI = .917, RMSEA = .039) suggesting configural invariance of the DSM-5 model in our UK and Finnish ASD samples.
Next, we constrained all factor loadings as equal across groups, creating the ‘measurement model’. This did not result in a significantly worse fit than the free model (ΔCFI = .002), showing equivalence of factor loadings in the UK and Finnish ASD data. Figure 1 shows the DSM-5 model, including its factor loadings for the UK and Finnish ASD samples. Finally, we created the ‘structural model’ by adding one additional constraint, specifying that the covariance between the social communication and RSB factors be equal in the Finnish and UK samples. Once again, this did not result in a model that fitted the data significantly worse than the free model (ΔCFI = .003). This shows that the covariance of the two factors in the dyadic DSM-5 model was equivalent in the UK and Finnish ASD samples. In the UK sample, the correlation between the social communication and RSB factors was .43, and in the Finnish sample it was .44.
Model fit in the Finnish and UK BAP samples
As is shown in Table 3, none of the three a priori models fitted well in the Finnish BAP sample. On each index of fit, the one-factor model performed the worst. For the DSM-IV model, there was inadequate fit according to the CFI and SRMR and adequate fit according to the RMSEA. Indices of fit for the DSM-5 model showed a similar pattern, with a marginally inadequate SRMR, an adequate RMSEA and a low CFI. In contrast, in the UK BAP sample the DSM-5 model had adequate fit: χ2 = 80.5 (DF = 53), SRMR = .055, CFI = .937, RMSEA = .049 (90% confidence interval = .025–.069) and CAIC = 240.3.
Fit indices for confirmatory factor analysis models tested against the Finnish broader autism phenotype sample (n = 110).
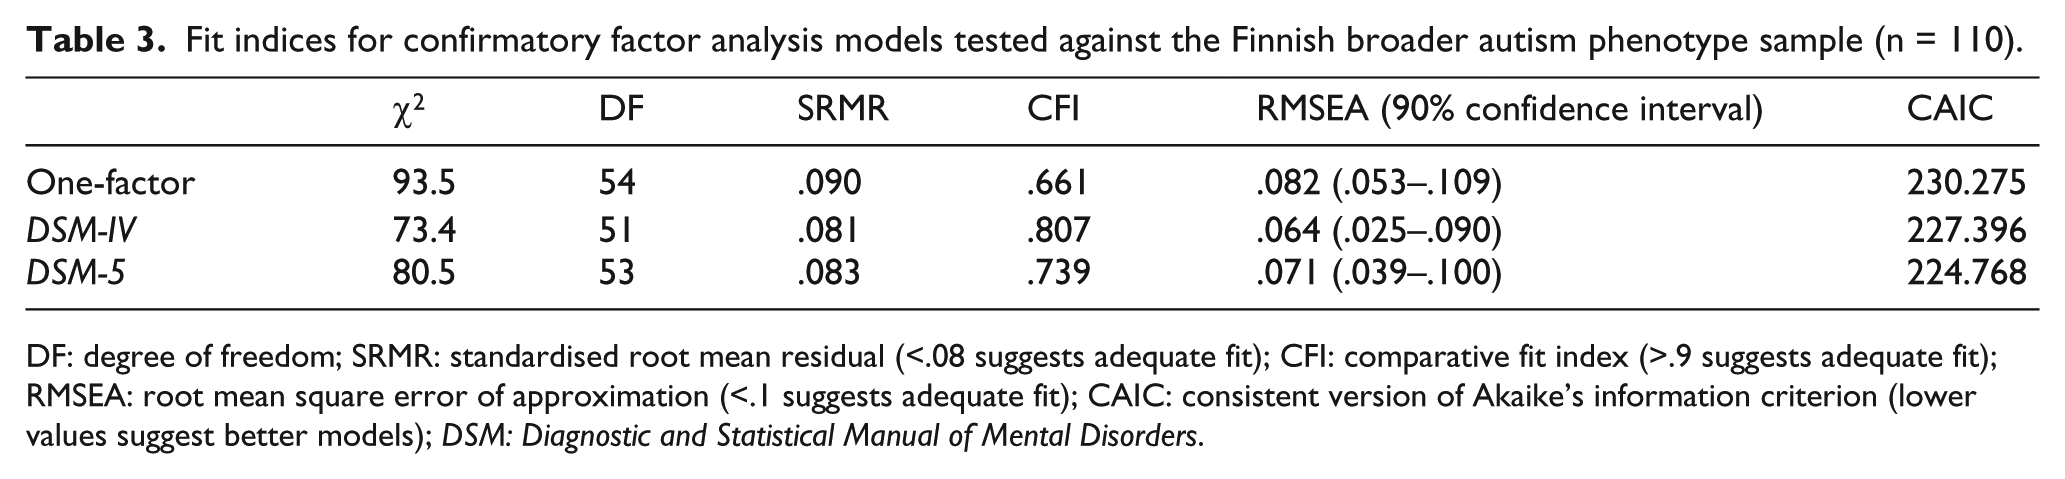
DF: degree of freedom; SRMR: standardised root mean residual (<.08 suggests adequate fit); CFI: comparative fit index (>.9 suggests adequate fit); RMSEA: root mean square error of approximation (<.1 suggests adequate fit); CAIC: consistent version of Akaike’s information criterion (lower values suggest better models); DSM: Diagnostic and Statistical Manual of Mental Disorders.
Because the DSM-5 model did not fit adequately in the Finnish BAP sample, we could not formally test its invariance compared to Finnish ASD and UK BAP samples. Instead, we sought to understand why the DSM-5 model fitted poorly in the Finnish BAP data. Inspection of MIs and standardised residuals did not reveal major model misspecifications. Four-factor loadings (S4, C2, R3, C3) were below .3, suggesting that these were not good indicators of underlying autistic trait dimensions in the Finnish BAP population. It is notable that for each model fitted against the Finnish BAP data, the RMSEA and SRMR were either adequate or marginally inadequate, whereas the CFI was always grossly below the threshold for acceptable model fit. Low CFIs indicate insufficient difference between the hypothesised model and the independence model, in which all variables in the model are uncorrelated. Therefore, the low CFIs attained from models fitted in the Finnish BAP sample may be indicative of low correlations among study variables. We explored this possibility by calculating correlation coefficients between the manifest variables of the DSM-5 model in both the Finnish ASD and BAP samples. For the correlations among the 6 social communication items of the DSM-5 model, coefficients in the ASD sample were mostly (14 out of 15 comparisons) larger than the equivalent coefficient in the BAP sample, often significantly so (7 out of 14, according to one-tailed Fisher’s z-test). A similar tendency for lower correlations in the Finnish BAP sample was observed for the 6 RSB items: in 13 out of 15 comparisons, BAP coefficients were lower than the equivalent in the ASD sample, and 7 of these differences were significant.
Discussion
We investigated whether the new DSM-5 description of ASD, which has received support in the UK and North America, generalises to Finnish young people with ASD. To this end, we used CFA to test the fit of the DSM-5 model in a Finnish ASD sample. Then, we directly compared the fit of the DSM-5 model between young people with ASD in the United Kingdom and Finland. We also tested the DSM-5 model in Finnish participants with sub-threshold autistic traits characteristic of the BAP. To our knowledge, this is the first investigation to compare formally the structure of autistic symptoms as measured in different cultural and linguistic contexts. Another original facet of this study is the consideration of cross-cultural stability of autistic symptoms both in people with ASD and in those with the BAP.
Our findings offer strong support for the value of the DSM-5 dyadic model for describing core symptomatology of Finnish young people with ASD. Our CFA model based on DSM-5 diagnostic criteria performed well when tested against the Finnish ASD data, with all indices of fit falling in at least the adequate range. In contrast, three-factor (DSM-IV) and one-factor models were not supported by the data. These findings accord with reports of CFA in English-speaking clinical samples, which have shown that ASD is better conceptualised as a dyad, than as a single factor or triad, and that this dyad is constituted of distinct but related social communication and RSB factors (Frazier et al., 2012; Gotham et al., 2007; Mandy and Skuse, 2008; Snow et al., 2009).
DSM-5 has instituted changes not just to the broad structure of autistic symptoms, but also to their content. In particular, the RSB domain has been expanded to include repetitive and stereotyped language and SAs. We tested these changes in our Finnish ASD sample and found evidence for their validity. In our DSM-5 model, the subscales measuring repetitive and stereotyped language and SAs had substantial loadings onto the RSB factor (.56 and .53, respectively). Furthermore, inspection of standardised residuals and MIs for these items showed that they were well specified within the DSM-5 model. This fits with previous findings in English-speaking samples of people with ASD, showing that repetitive language and sensory items of the 3Di and ADI-R load onto the RSB factor in dyadic models of autistic symptoms (Gotham et al., 2007; Mandy et al., 2012a).
When we formally tested the invariance of the DSM-5 model in UK and Finnish ASD samples, we found further evidence for its applicability beyond UK and North America. Initially we tested for configural invariance and observed that in both the Finnish and UK ASD samples, the basic DSM-5 structure was equally applicable: the same items loaded onto the same factors in both countries. Next, we looked at metric invariance, which concerned whether factor loadings were similar across groups. This tells us whether specific symptoms are better or worse indicators of ASD in Finnish versus UK participants. We found evidence for metric invariance, which means that factor loadings in the DSM-5 model were equivalent in both groups. Finally, we assessed structural invariance, by testing whether the strength of the association between the two factors of the autism dyad was similar in the UK and Finnish data. This was indeed the case, with almost identical correlations between social communication and RSB factors in the United Kingdom (.43) and Finland (.44).
The extension of our analyses to young people with subclinical autistic traits revealed a different pattern of findings. The DSM-5 model did not fit well in the Finnish BAP sample, with several social communication (‘social reciprocity’ and ‘conversational abilities’) and RSB (‘stereotyped and repetitive behaviour’, ‘stereotyped and repetitive language’) subscales showing only weak (>.3) factor loadings. In contrast, the two-factor DSM-5 model showed good fit for our UK BAP participants, in line with findings from a comparable North American sample (Frazier et al., 2012). One interpretation is that that we have observed cultural differences in subclinical autistic traits, with the BAP manifesting differently in Finland compared to the United Kingdom and North America. Given the lack of cross-cultural differences found in our ASD participants, this suggests the following hypothesis for future investigation: specific cultural influences may have a greater effect on the expression of mild, compared to severe, autistic traits. To date, most studies of cultural differences in autistic symptoms have relied on general population samples (e.g. Freeth et al., 2013; Hoekstra et al., 2008; Wakabayashi et al., 2006). Our observations call into question the generalisability of their findings to people with ASD and suggest the need for future research in this area to include both clinical and general population participants.
The analyses we report are relevant to debates about the coherence of the ASD syndrome. First, our findings, and those of others (e.g. Frazier et al., 2012), suggest that among people with ASD, core symptoms cluster into two coherent symptom domains. Second, we found that these symptom domains are only moderately related: in both UK and Finnish samples, they did not cohere tightly into a single autistic symptom cluster. This fits with behaviour genetic findings of a phenomenologically and aetiologically fractionable autism syndrome (Happé et al., 2006) and with the observation that some people have one part of the ASD dyad, but not the other (Mandy et al., 2011; Pooni et al., 2012). Third, we found that the ASD syndrome, as currently defined, lacks coherence in Finnish young people with sub-threshold autistic traits: the poor model fit we observed in this group reflected a lack of association between symptoms of ASD. This raises a note of caution that findings about the coherence of ASD from general population samples, especially if they include non-English speakers, are not necessarily generalisable to people with clinically severe autistic difficulties.
Our study should be considered in the light of the following limitations. First, our data came from clinics specialising in the assessment of children in mainstream education and with fluent language. Thus, although we do not have IQ data for Finnish and UK participants, it is likely that our findings pertain to the higher functioning part of the autistic spectrum and may not generalise to individuals with intellectual disability and/or profound speech and language difficulties. Second, a related issue is that there were higher rates of reported language delay in the UK sample, and this may be a relevant confound. This may reflect the fact that the UK clinic specialises in ASD assessment, whereas the Finnish service accepts referrals for assessment of any suspected neurodevelopmental disorder. Any such confound would be more likely to exaggerate, rather than diminish, group differences, so the finding of similarities between Finnish and UK ASD participants is unlikely to be a resultant artefact. We argue that sample differences are unlikely to explain the discrepancies between UK and Finnish BAP participants, as in both countries participants had to meet formal BAP criteria to be included in the study. Third, in order to yield stable, interpretable models, we used subscales, rather than individual items as manifest variables in our analyses. It is possible that an item-by-item analysis might uncover subtle differences in individual autistic behaviours that were not detected by our molar approach. Furthermore, our test of model invariance in ASD was only powered to detect substantial differences in the configuration, measurement and structure of autistic traits (Meade et al., 2008), and so could have missed small differences. Future research in this area should make use of larger samples, allowing for more powerful CFA using a greater number of manifest variables. It should also use non-CFA techniques, such as logistic regression, to test focused a priori hypotheses about potential areas of cultural difference.
While our analyses address the validity of applying DSM-5’s model of ASD in Finland, they do not of course speak directly to the question of possible differences in other cultures. As described in the introduction to this article, large data sets exist for the AQ administered in Japan, Taiwan, India, Malaysia, France, the Netherlands and Italy. Other well-validated assessment tools such as the Social Communication Disorders Checklist (Bölte et al., 2011), The Social Reciprocity Scale (e.g. Bölte, 2012), the ADI-R (e.g. De Bildt et al., 2013) and the Autism Diagnostic Observation Schedule (e.g. Kim et al., 2011) have all been administered in a range of cultural contexts. The 3Di has been validated in Thailand (Chuthapisith et al., 2012). We would encourage researchers from across the world to pool such data in order to conduct the sorts of analyses described in this article. Such a process would be especially useful at the current time, given the ongoing revision of the International Classification of Diseases (ICD), which has been translated into 43 languages and is the diagnostic manual with the greatest global reach (World Health Organization (WHO), 2013). The WHO is asking researchers, clinicians and service users to participate in developing the 11th edition of the ICD, and the mapping of any cultural variability in the presentation of ASD would make a valuable contribution.
Footnotes
Declaration of conflicting interests
Dr Skuse is a stockholder in IxDx Ltd, which owns exclusive rights to the interview software and to the dissemination of 3Di technology and intellectual property. Drs Mandy, Charman and Puura report no relevant financial interests or potential conflicts of interest.
Funding
This research received no specific grant from any funding agency in the public, commercial, or not-for-profit sectors.