
Abstract
The hot cracking susceptibility of a new superalloy G27 was investigated by Varestraint weldability testing. The influence of pre-weld solution annealing conditions recommended by the alloy manufacturer to obtain different grain sizes (1010 °C/1 h, 1066 °C/0.5 h, and 1110 °C/1 h) for specific applications was studied. The fusion zone solidification cracking was independent of pre-weld solution annealing, and they are associated with the γ/Laves eutectic constituents. The solution-annealed material at 1010 °C/1 h showed the lowest extent of liquation cracking, while the 1110 °C/1 h condition was the most susceptible. The increased level of liquation cracking was primarily attributed to an increased grain size of pre-weld solution-annealed material. The heat-affected zone liquation cracking was identified to be caused by constitutional liquation of NbC and supersolidus melting.
Keywords
Introduction
G27 is a γ'-hardening Ni-based superalloy that was newly developed to obtain similar high-temperature mechanical properties of the widely used Waspaloy, 1 which is intended for aerospace applications used in the hot sections of aircraft engines. In the production of aircraft engines, fabrication through welding is commonly used instead of casting a single large part since it offers many benefits, such as a reduction in the total weight of the component and enhanced design flexibility. 2 Welding plays a critical role in this fabrication method, introducing significant challenges, particularly with respect to weld cracking. This concern is especially acute when welding new superalloys like G27 in the manufacture of aircraft engines, where hot cracking is a prevalent issue.
In fabrication, Ni-based superalloys are typically preferred to be welded in solution-annealed conditions to minimise the risk of hot cracking. 2 The G27 inventors have developed solution annealing conditions followed by aging steps to meet the desired mechanical properties of the material, where various solution annealing schemes were intentionally designed to achieve different grain sizes of the alloy. Solution annealing of G27 up to a temperature of 1010 °C preserves the fine grain structure for optimised fatigue properties of the alloy, whereas solution annealing at temperatures above 1010 °C up to 1135 °C induces grain growth in the material for superior creep performance, as reported by Heck and Kernion. 3 However, the developed solution annealing as part of the full heat treatment scheme for optimising the desired mechanical properties of G27 might not necessarily positively affect the alloy's weldability characteristics, especially the material's resistance towards hot cracking during welding. Moreover, as G27 is a new superalloy, the susceptibility to hot cracking of the pre-weld solution-annealed alloy within these temperature ranges remains underexplored. In this study, the hot cracking susceptibility of G27 subjected to solution annealing conditions to obtain different grain sizes for specific applications as recommended by the inventors 3 is investigated by Varestraint weldability testing.
Material and methods
Material and solution annealing
Varestraint test plates with 60 × 150 mm dimensions were manufactured by water jet cutting of 4 mm thick as-received plates acquired after hot-rolling. The alloy's nominal composition consisted of 1.90Al–1.88Ti–3.70Nb–4.02Mo–15.11Cr–15.00Fe–0.18Co–0.1V–0.06Si–0.03Zr–0.028C–0.007P–0.006N–0.005B–0.001S in wt-%. The test method to determine the alloy's composition is shown in the supplementary material (Supplemental Table S1). The as-received base material microstructure consists of a heavily deformed γ matrix and Nb-rich MC carbide, as shown in Figure 1(a). In addition, nm-sized γ′ precipitates are present in the material (Figure 1(b)). The as-received material's hardness was 502 ± 6 HV and the mean grain size was 4 μm, where the grain structure shown in the electron backscatter diffraction (EBSD) inverse pole figure (IPF) map in Figure 1(c). The EBSD kernel average misorientation (KAM) map (Figure 1(d)) confirmed the deformed grain structure in the as-received state, which shows local misorientation in the green and red regions. Solution annealing heat treatments were then carried out on the test plates at 1010 °C/1 h, 1066 °C/0.5 h, and 1110 °C/1 h using an industrial furnace in a vacuum with N2 forced convection cooling to minimise γ′ precipitation during cooling with ∼30 °C/min cooling rate. The solution annealing temperatures and holding times are within the range recommended by the alloy manufacturer 3 and were carefully selected to obtain different grain sizes to study grain size's effect on the hot cracking susceptibility.
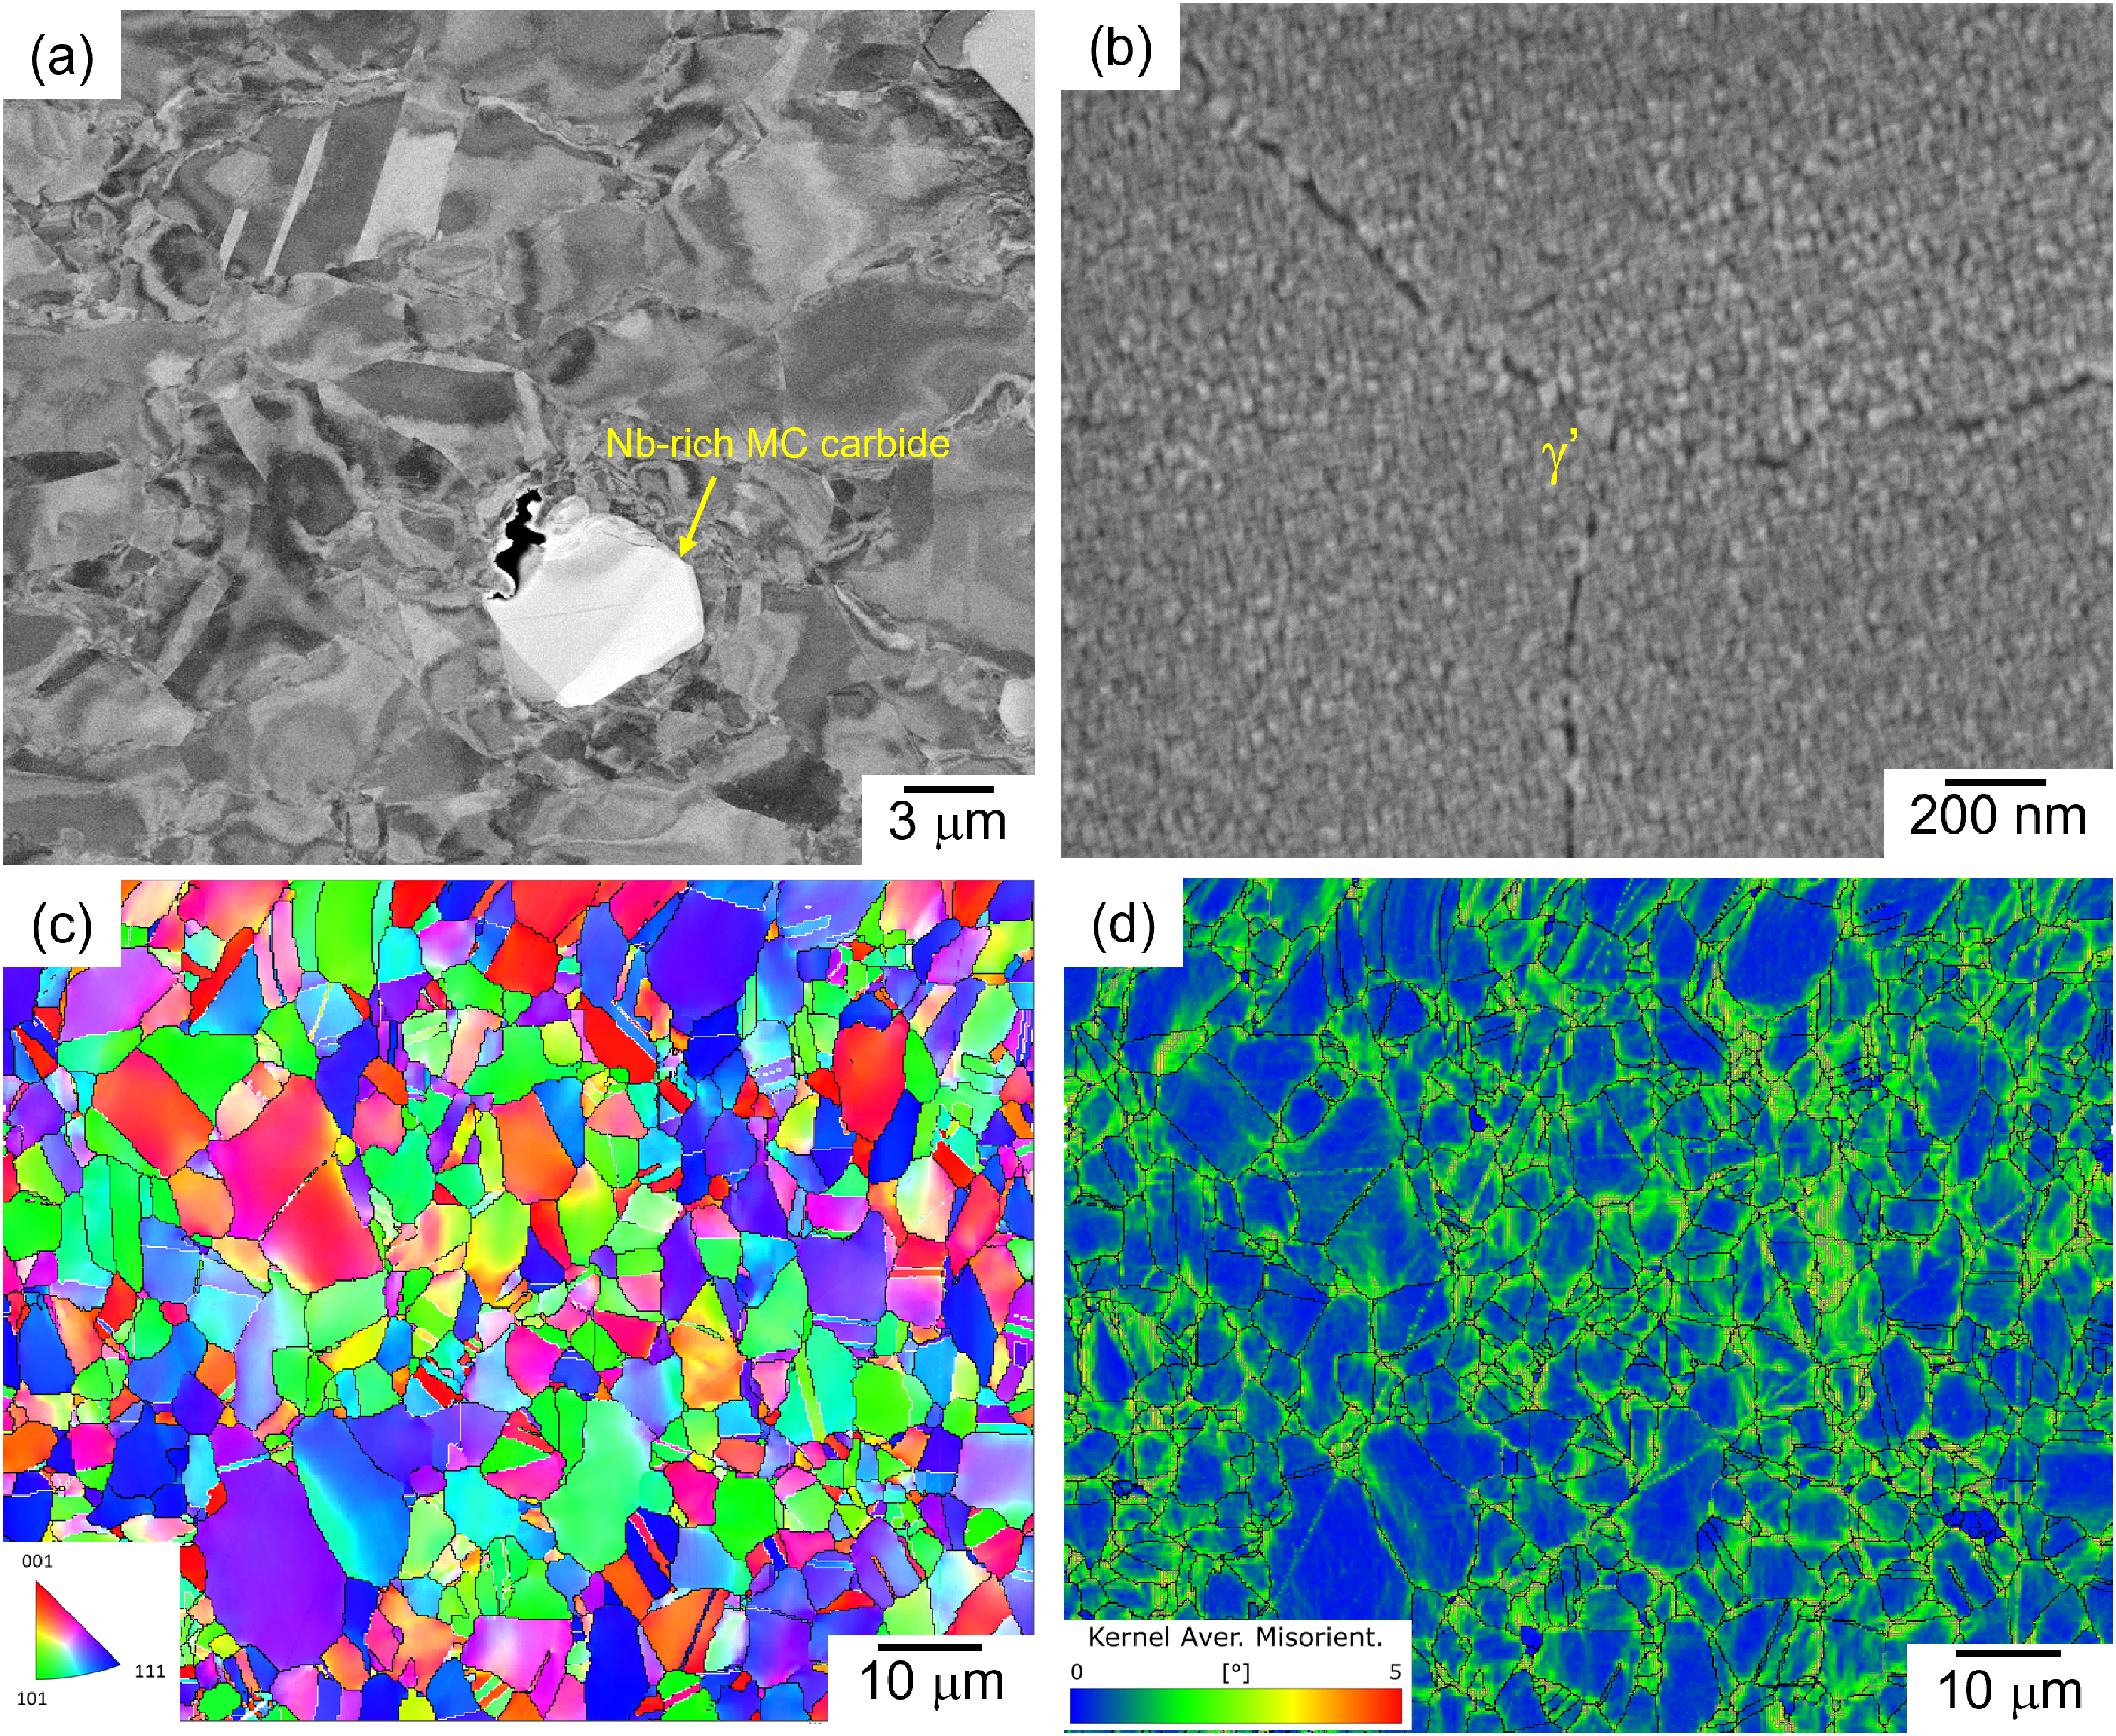
(a) SEM BSE micrograph of as-received G27; (b) SEM in-lens image that shows nano-sized γ′ in the as-received base material; (c) and (d) EBSD IPF and KAM maps of the as-received G27, respectively.
Varestraint testing
The longitudinal Varestraint tests were performed using the autogenous TIG welding process with 2 mm arc length, 70 A welding current, 1 mm/s travel speed, a 99.99% purity argon gas protection with 15 L/min flow rate, and 10 mm/s stroke rate. These parameters were obtained from the extensive design of the experiment study by Andersson et al.
4
to minimise the total crack length (TCL) standard deviation during the Varestraint testing. The die mandrel radii used during the Varestraint tests were 20, 40, 60, 100, and 200 mm, resulting in augmented strains between 10% and 1% with three repetitions at each augmented strain level. The augmented strains (ε) were calculated using the following equation:

TCL measurement was carried out by following the centerline of the open cracks using a Zeiss Axio Imager M2m optical microscope (OM) by stitching the OM images in an area of the tested plates where cracks were found. Before stitching using the OM, manual polishing using 3 µm diamond suspension was carried out because cracks were not clearly observable caused by the presence of oxide layers that formed after welding, then electrolytically etched using 10% oxalic acid at 2.2 V for 1–2 s. Figure 2 shows an example of the stitched OM micrograph showing the cracks after the Varestraint testing.
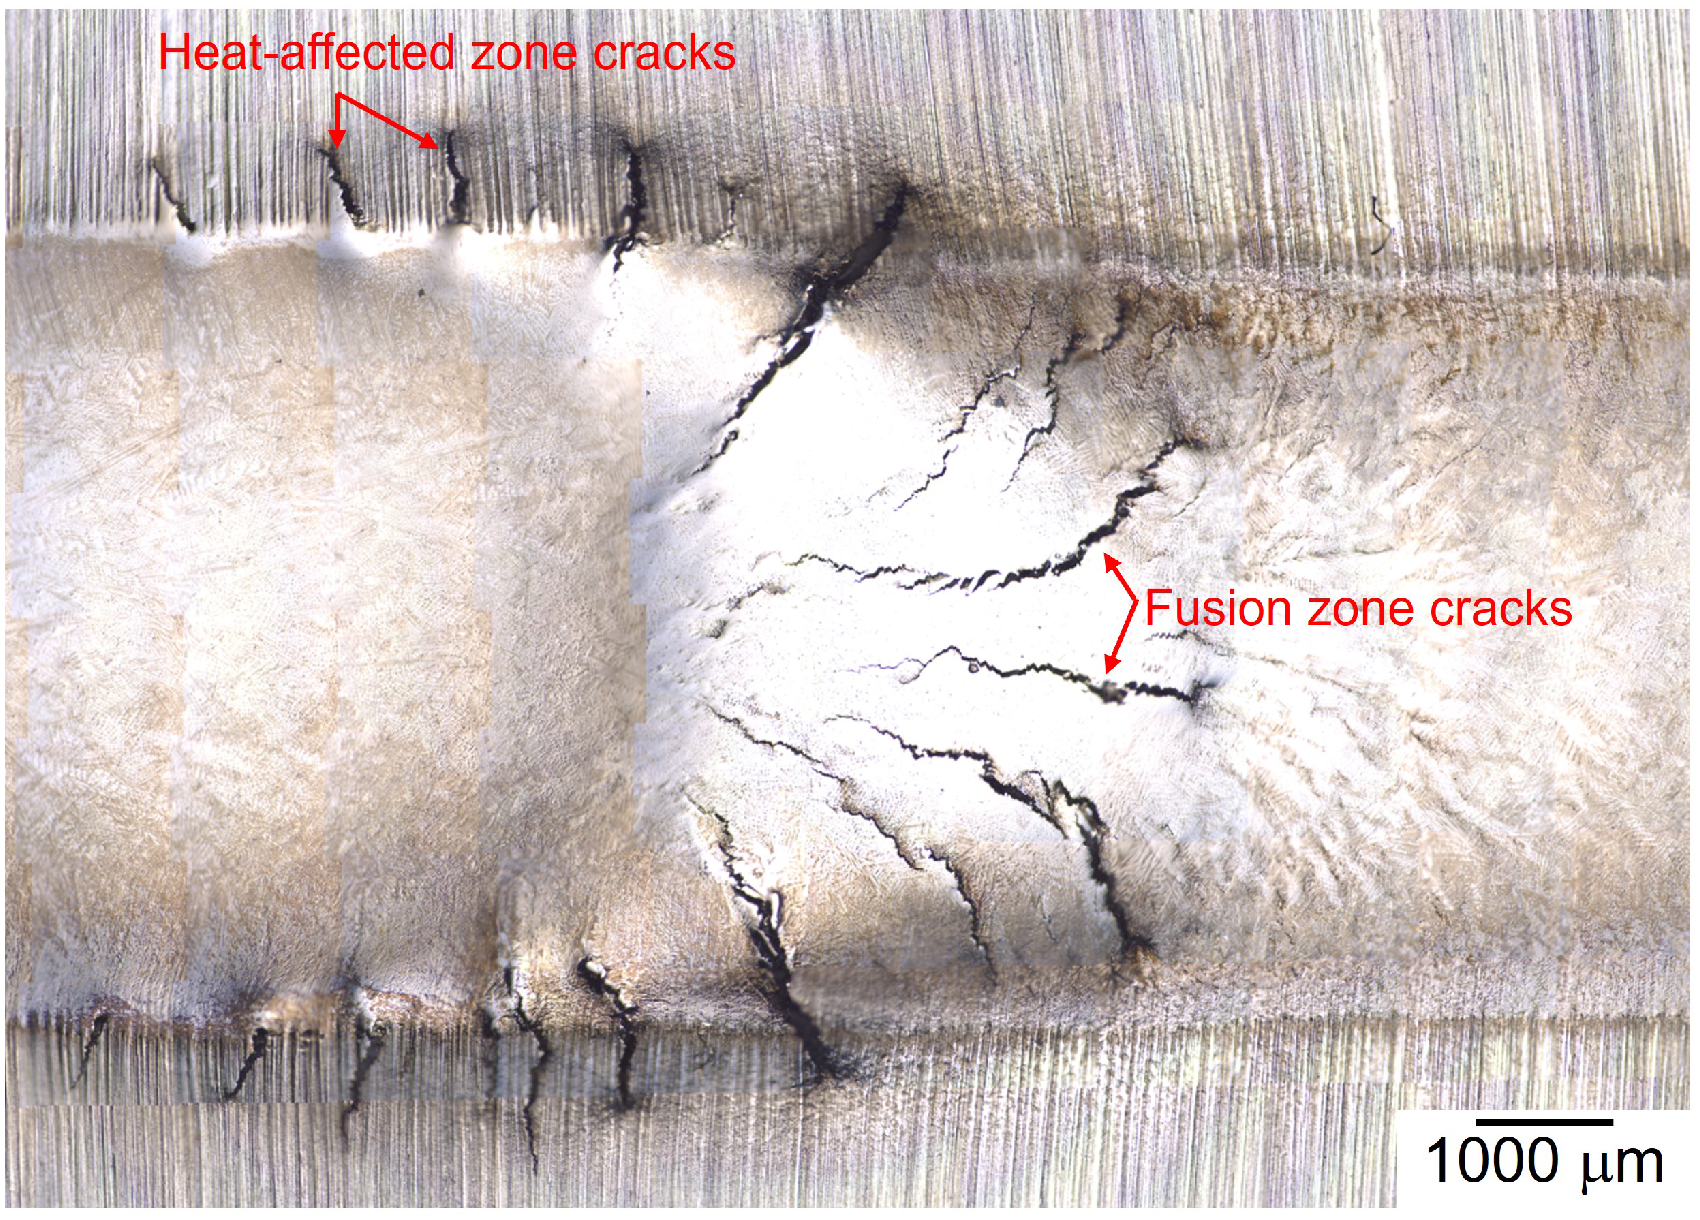
An example of the stitched OM micrograph of Varestraint tested G27 plate at 3.33% augmented strain that was used to measure the TCL.
Grain size measurement
Using OM images, the samples’ grain size was measured through the Abrams three-circle method as stipulated in the ASTM E112 standard. The grain size of some samples was also measured by EBSD analysis.
Microstructural characterisation
The plates’ top surfaces (Figure 2) were cut out and mounted in bakelites and then subjected to multistep grinding, followed by mechanical polishing with 3 μm diamond suspension and colloidal silica. The mounted samples were then electrolytically etched using a 10% oxalic acid solution at 2.2 V for 1–2 s. Scanning electron microscopy (SEM) analyses were conducted using a Zeiss Gemini field emission scanning electron microscope equipped with Symmetry S2 EBSD and Oxford energy dispersive spectroscopy (EDS) detectors. Transmission electron microscopy (TEM) analyses were conducted using the FEI Talos F200X scanning transmission electron microscope. TEM samples were prepared through twin-jet electropolishing at −30 °C and 16 V of discs with a diameter of 3 mm in an 8% perchloric acid solution.
Hardness testing
Vickers hardness tests were carried out on the pre-weld solution-annealed samples on five random indentation points utilising a 0.5 kgf force (HV0.5) with 15 s hold time.
Results
Pre-weld solution annealed base material microstructures
Figure 3(a) shows the low magnification OM micrographs of pre-weld solution annealed base materials microstructures. The mean grain sizes of the pre-weld solution annealed materials are 5, 65, and 200 μm for 1010 °C/1 h, 1066 °C/0.5 h, and 1110 °C/1 h, respectively. The mean grain size of 1010 °C/1 h was measured by EBSD analysis since the grain size was too fine to be measured by OM, which the IPF map is shown in Figure 3(b). It can also be seen that, at 1010 °C/1 h (Figure 3(c)), a high amount of plate-like precipitates were formed throughout the microstructure. These precipitates are identified as the HCP η phase, where the STEM high-angle annular dark-field micrograph (HAADF) of the η phase together with the selected area diffraction pattern (SADP) with a [2
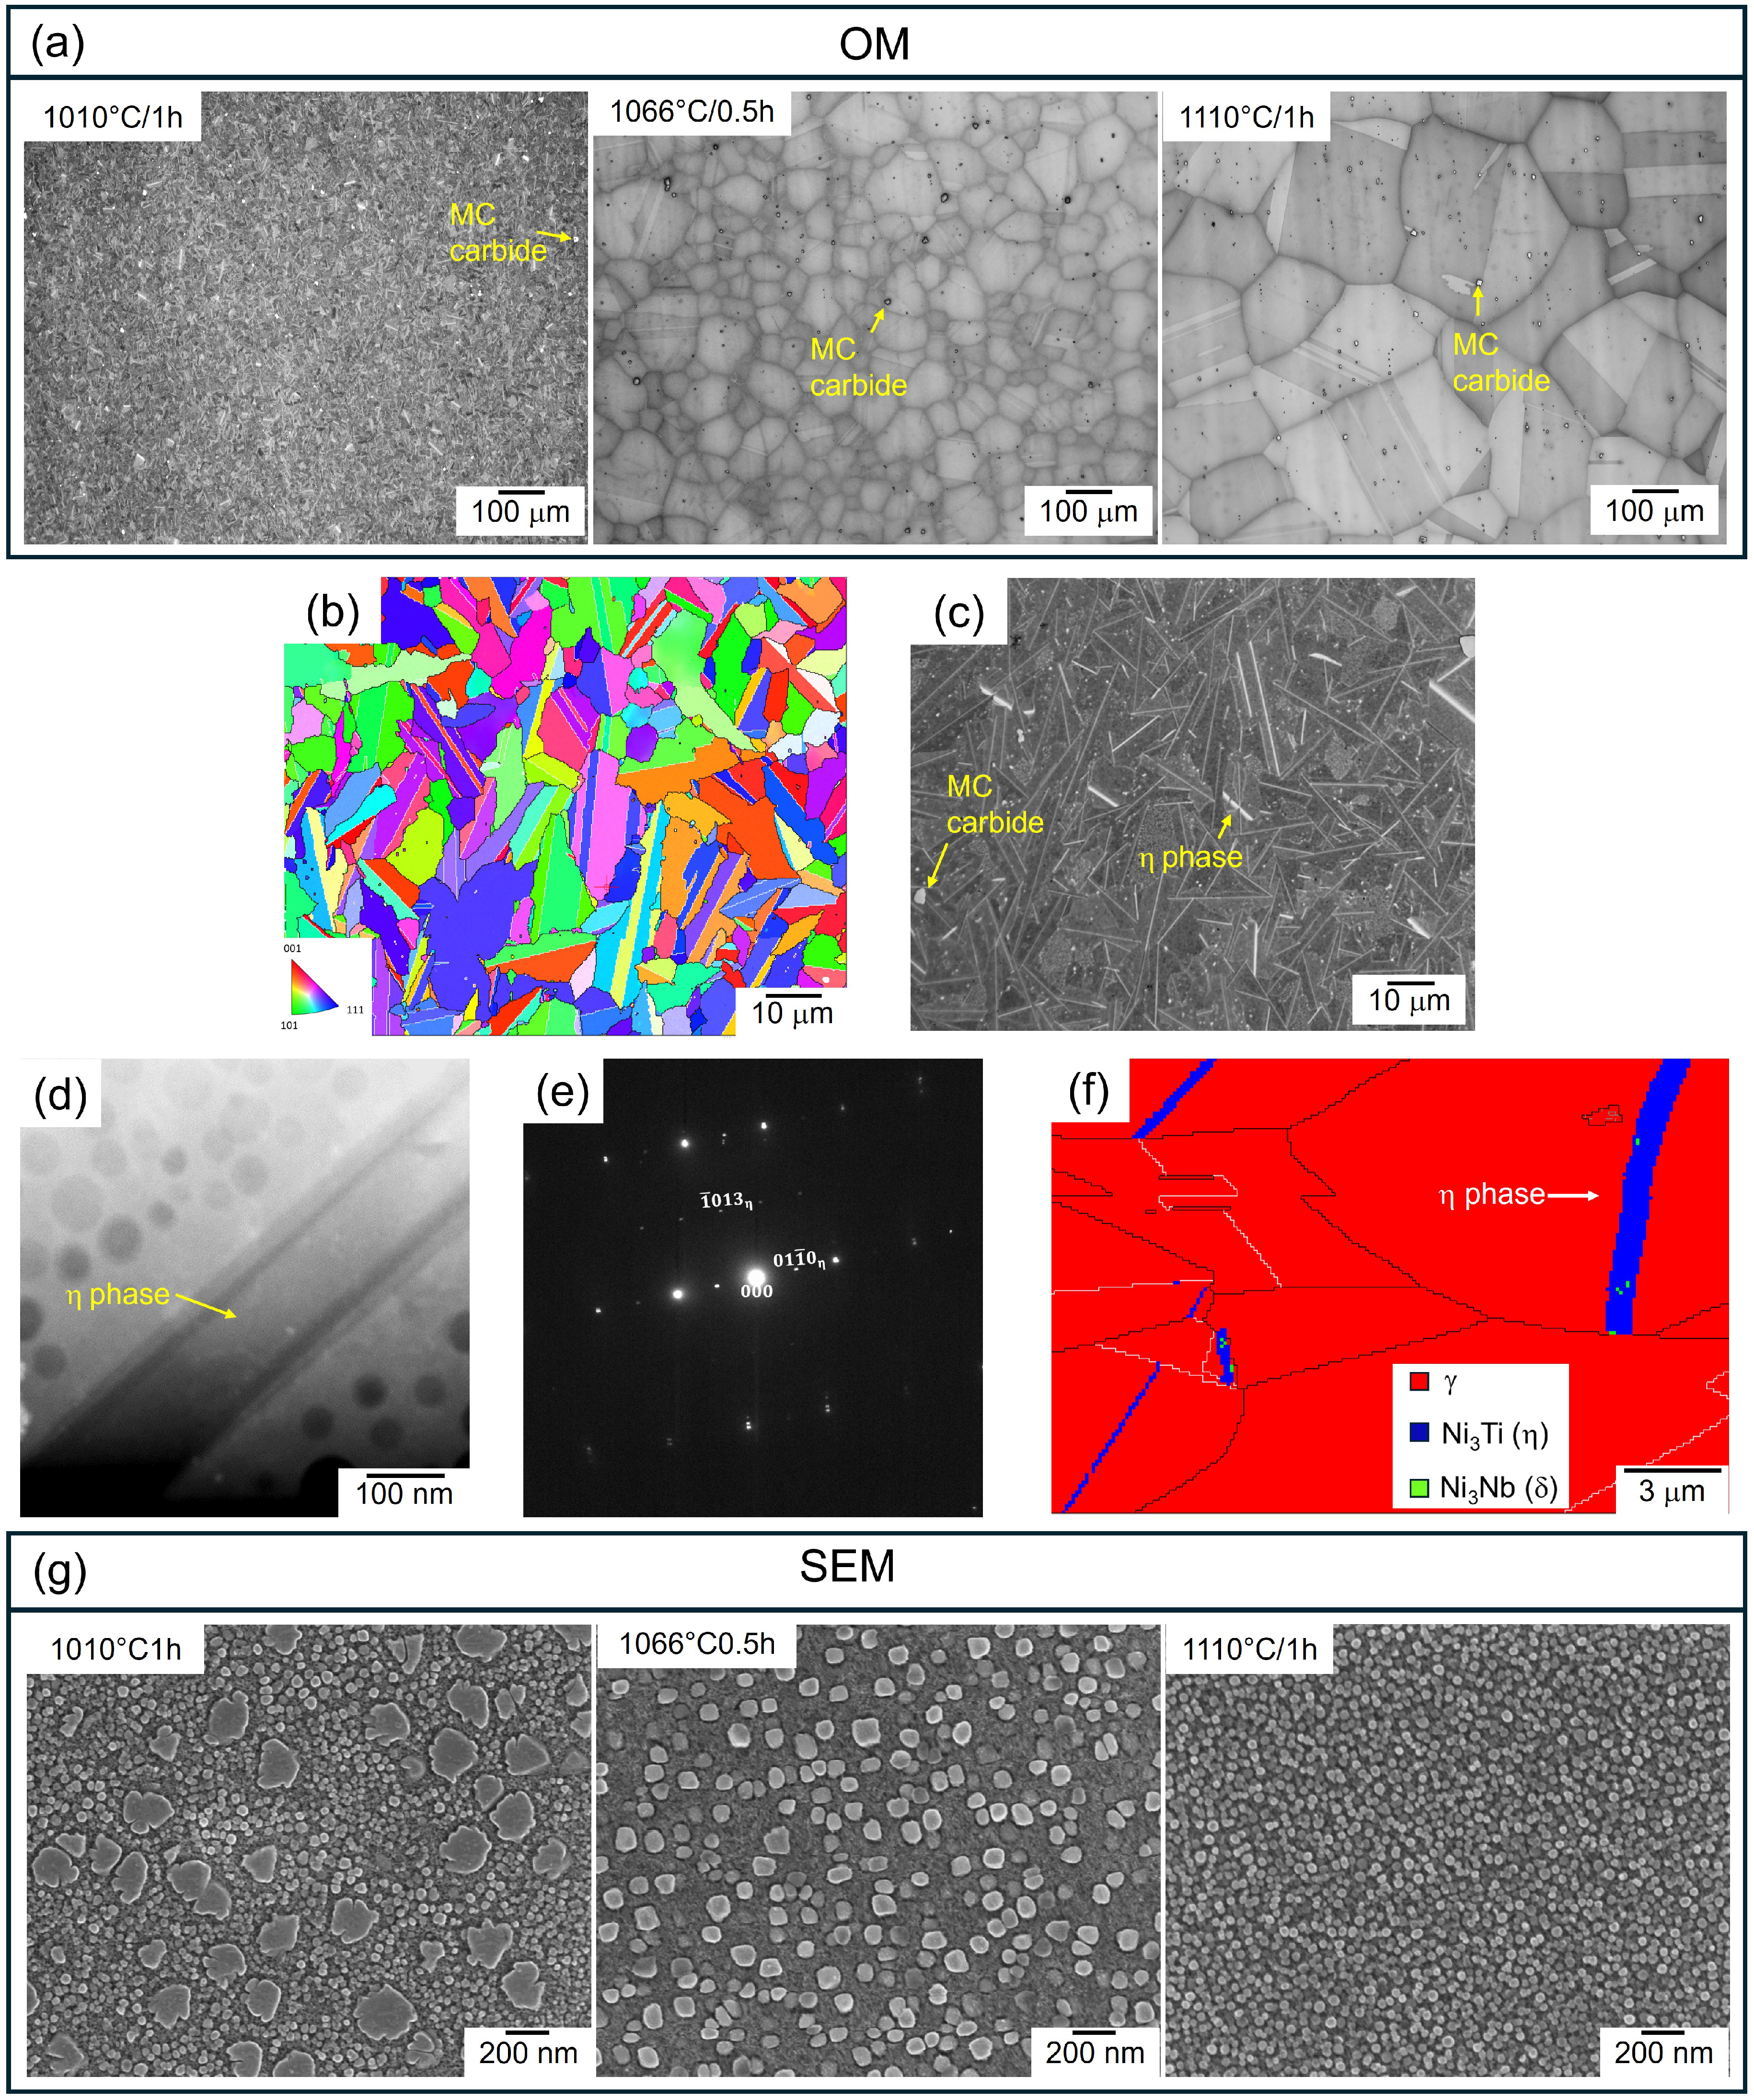
(a) Low magnification OM micrographs showing the pre-weld solution annealed base materials microstructures; (b) EBSD IPF map of the base material that was solution-annealed at 1010 °C/1 h; (c) high magnification OM image showing a high amount of η phase at 1010 °C/1 h; (d), (e) STEM-HAADF micrograph showing η phase and the corresponding SADP with the zone axis of [2
Figure 3(g) shows SEM in-lens images of all pre-weld solution annealed base materials microstructures that show the γ′ distribution. It is shown that the solution-annealed sample at 1010 °C/1 h exhibited a bimodal distribution of γ′, suggesting that the coarse γ′ formed from the pre-existing γ′ in the as-received material that got coarsened due to the solution annealing approaching the γ′ solvus temperature, which is in the range of 1010 °C–1020 °C as reported by Ariaseta et al. 1 and the fine ones were the secondary γ′ that formed during cooling from 1010 °C. Samples solution-annealed at 1066 °C/0.5 h and 1110 °C/1 h show unimodal γ′ distribution, indicating the γ′ were completely solutionised during solution annealing and reprecipitated during cooling. The hardness of the pre-weld solution-annealed base materials were 407 ± 7, 366 ± 9, and 399 ± 13 HV for 1010 °C/1 h, 1066 °C/0.5 h, and 1110 °C/1 h conditions, respectively.
Cracking response in Varestraint-tested plates
Figure 4 shows the plot of average TCL against augmented strain for the fusion zone and HAZ cracking of G27 subjected to pre-weld solution annealing at 1010 °C/1 h, 1066 °C/0.5 h, and 1110 °C/1 h. Generally, the plot shows the typical Varestraint testing curve in which the average TCL increases with the increasing strain until it reaches the saturation level, which was arguably at around 4% augmented strain. From the average TCL data, TCL ranking has no distinct trend among the three solution annealing at different augmented strain levels for the fusion zone cracking. Unlike the fusion zone solidification cracking data, the cracking response in the HAZ rather shows an apparent trend in the TCL ranking, where the sample subjected to the solution annealing at 1010 °C/1 h showed the highest resistance towards HAZ cracking, whereas 1110 °C/1 h was the most susceptible condition to cracking at all strain levels.
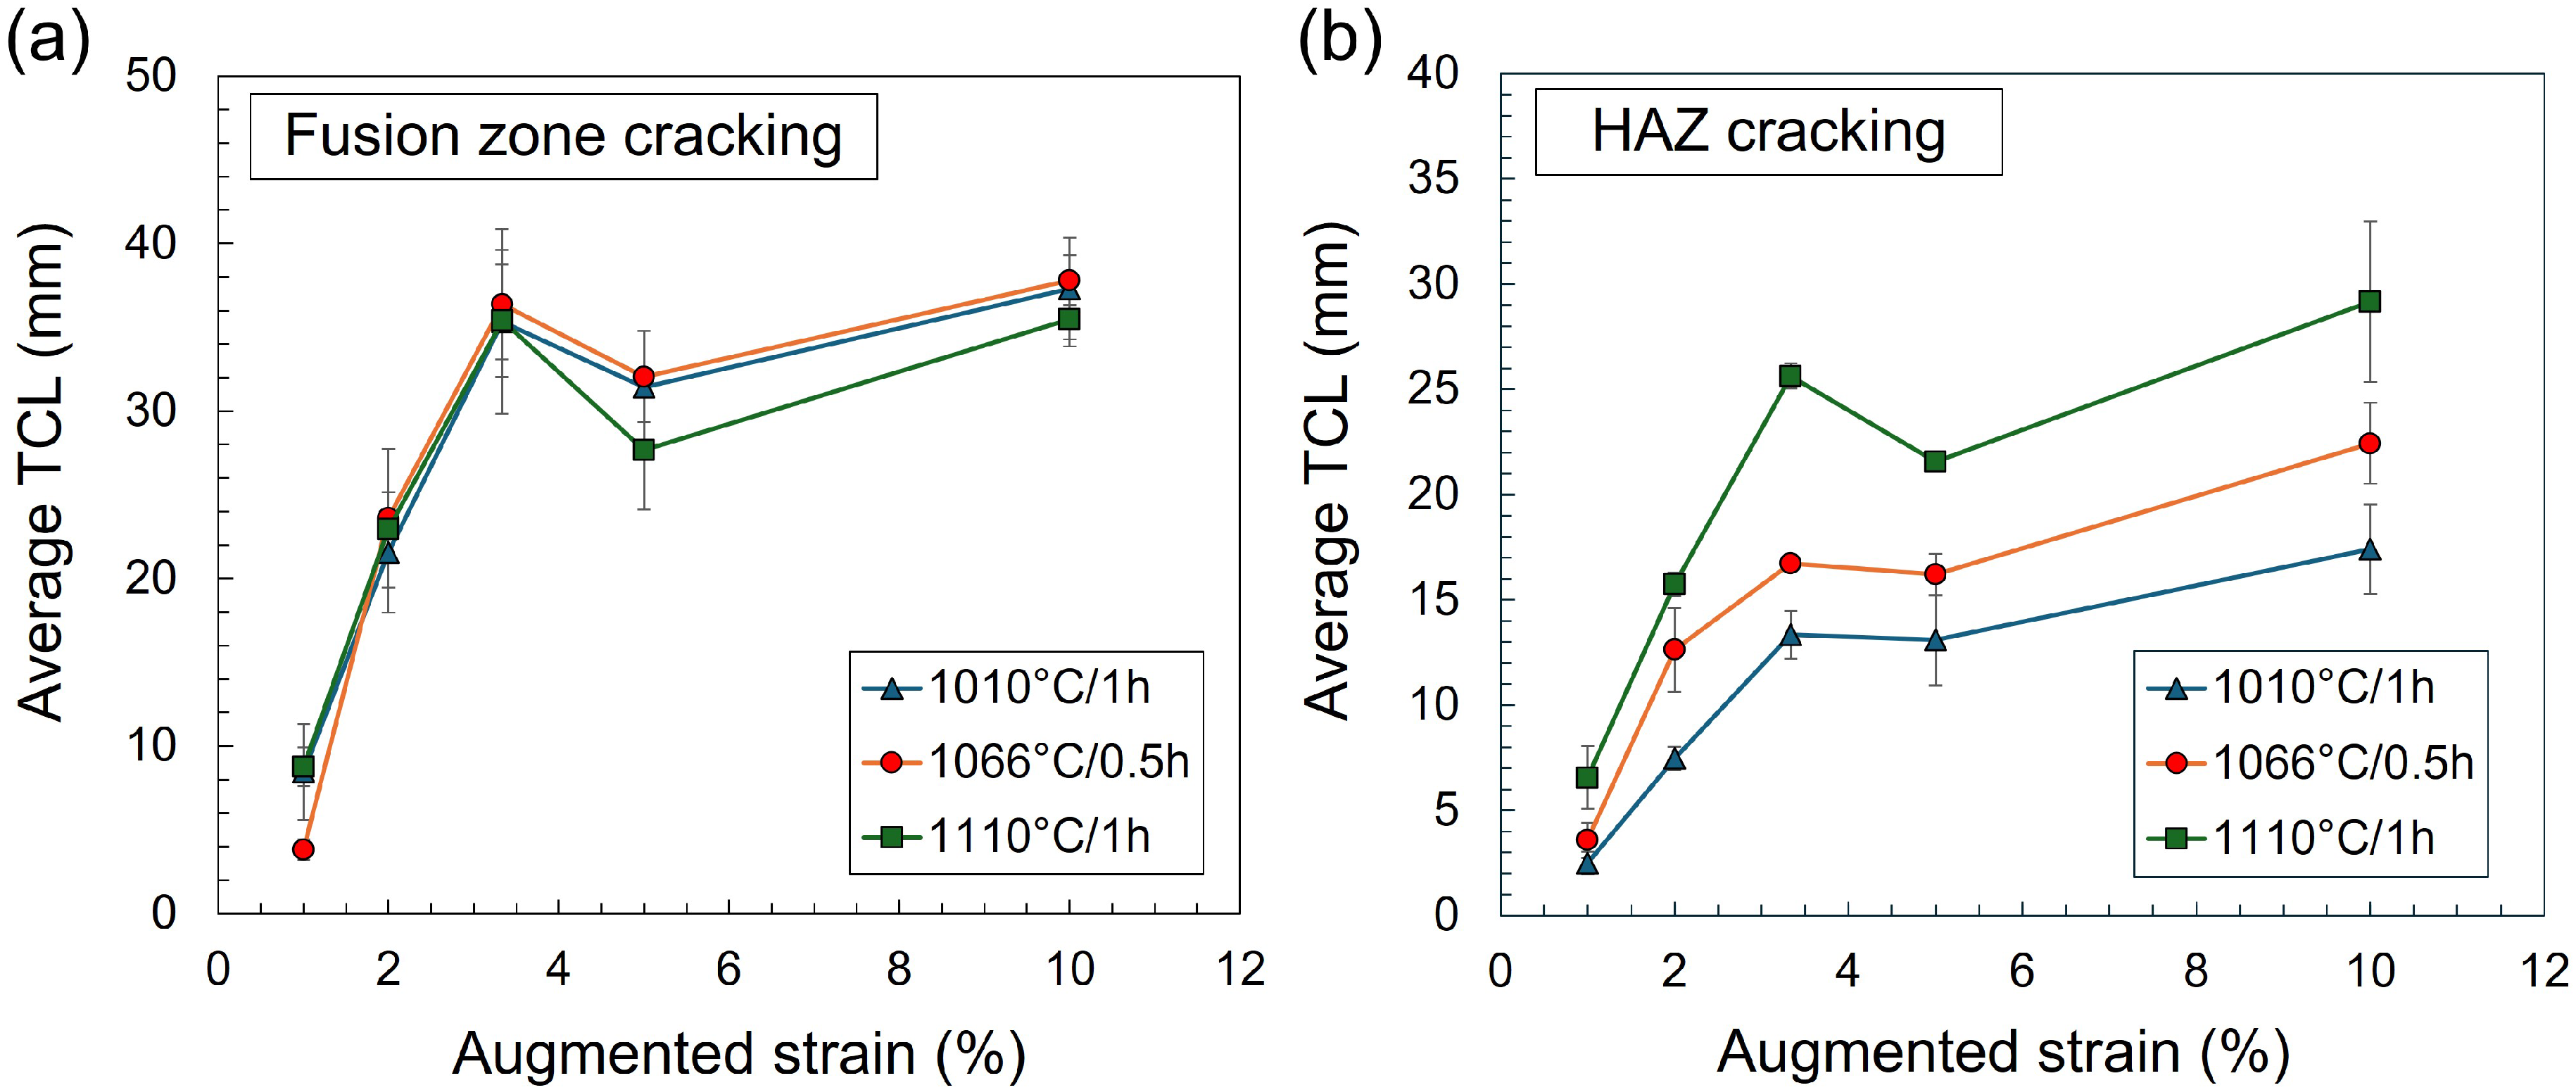
Average TCL versus augmented strain plot with the error bars representing the standard deviations for the (a) fusion zone and (b) HAZ cracking of pre-weld solution annealed materials.
Characteristics of cracking in the fusion zone and HAZ
Figure 5 shows the characteristics of fusion zone cracks in G27. It is noteworthy that all solution-annealed samples share identical features. The fusion zone cracks are found to propagate along the solidification grain boundaries, as shown in Figure 5(a). Solidified eutectic constituents are found surrounding the fusion zone cracks, and some cracks, as shown in Figure 5(b), were partially healed by backfilling. Based on their typical characteristics, the fusion zone cracks in G27 are solidification cracks. SEM-EDS analysis (Figure 5(c)) on the constituents reveals that they are rich in Nb, Mo, Ti, and, to some extent, Ni, Cr, and Fe. Their elemental enrichment and eutectic-like morphology suggest that they are γ/Laves eutectic constituents. The present authors have also positively identified γ/Laves eutectics as one of the main solidification products apart from Nb-rich MC carbides in the fusion zone of as-welded G27 through analytical (S)TEM analysis in the previous work. 1 EBSD phase maps shown in Figure 5(d) further confirm that the constituents surrounding the solidification cracks are γ/Laves eutectics.
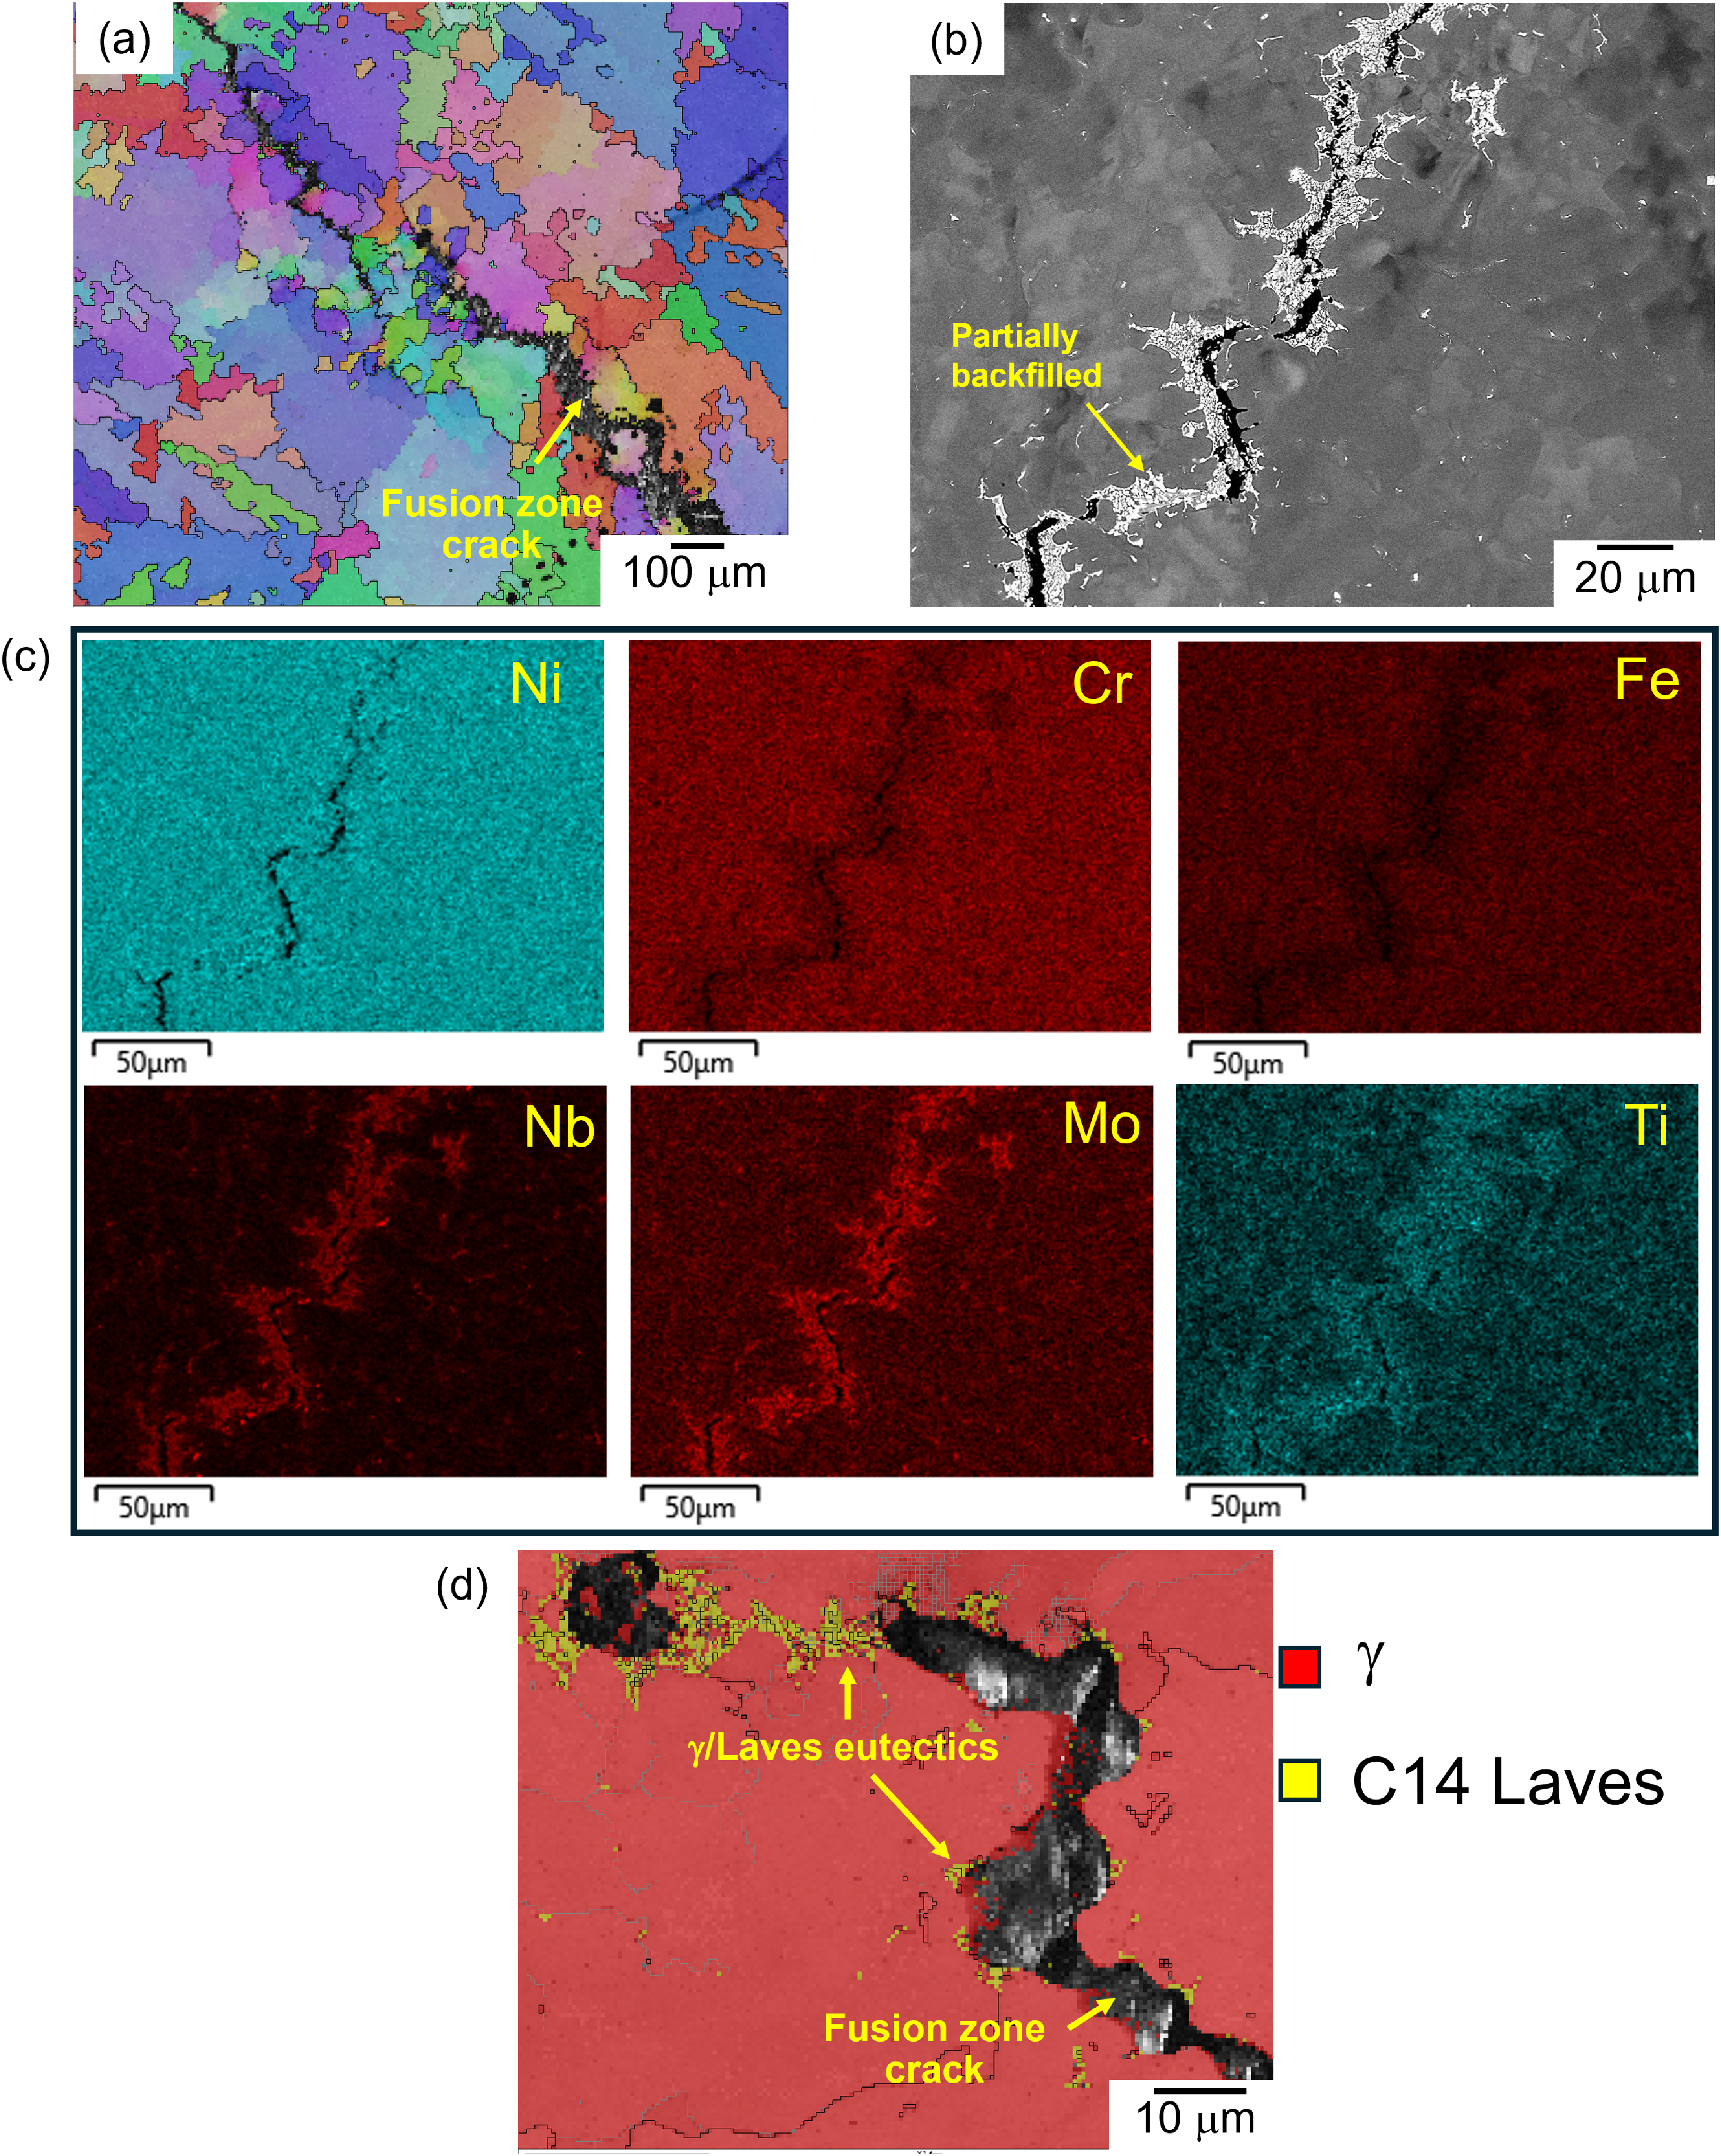
(a) EBSD IPF map that shows the fusion zone cracks propagate along the solidification grain boundaries; (b) SEM BSE image of a fusion zone crack that shows eutectic constituents surrounding the crack; (c) SEM-EDS mapping on a region in (b); (d) EBSD phase map that shows the fusion zone cracking is associated with the γ/Laves eutectics.
Figure 6(a) and (b) shows the characteristics of the HAZ cracks in the pre-weld solution-annealed samples at 1010 °C/1 h, 1066 °C/0.5 h, and 1110 °C/1 h. In the solution-annealed sample at 1010 °C/1 h, η phase particles dissolved in the HAZ, as shown in Figure 6(a). It can be seen in the OM micrographs shown in Figure 6(a) that the cracking is exclusively intergranular. It is also shown that some cracks were partially backfilled. The partially healed parts of the cracks due to backfilling were found to solidify into eutectic constituents. High-magnification SEM BSE images of the cracks (Figure 6(b)) show that the HAZ cracks in all pre-weld solution-annealed conditions are associated with the solidified eutectic constituents. The morphology and the elemental enrichment of the constituent, which is rich in Ni, Cr, Fe, Nb, and Mo, as shown in the EDS spectrum in Figure 6(c), are identical to those found in the fusion zone, suggesting that they are γ/Laves eutectics. The intergranular nature of the cracking and the presence of solidified γ/Laves constituents associated with the cracks suggest that the HAZ cracking in G27 occurs by liquation cracking.
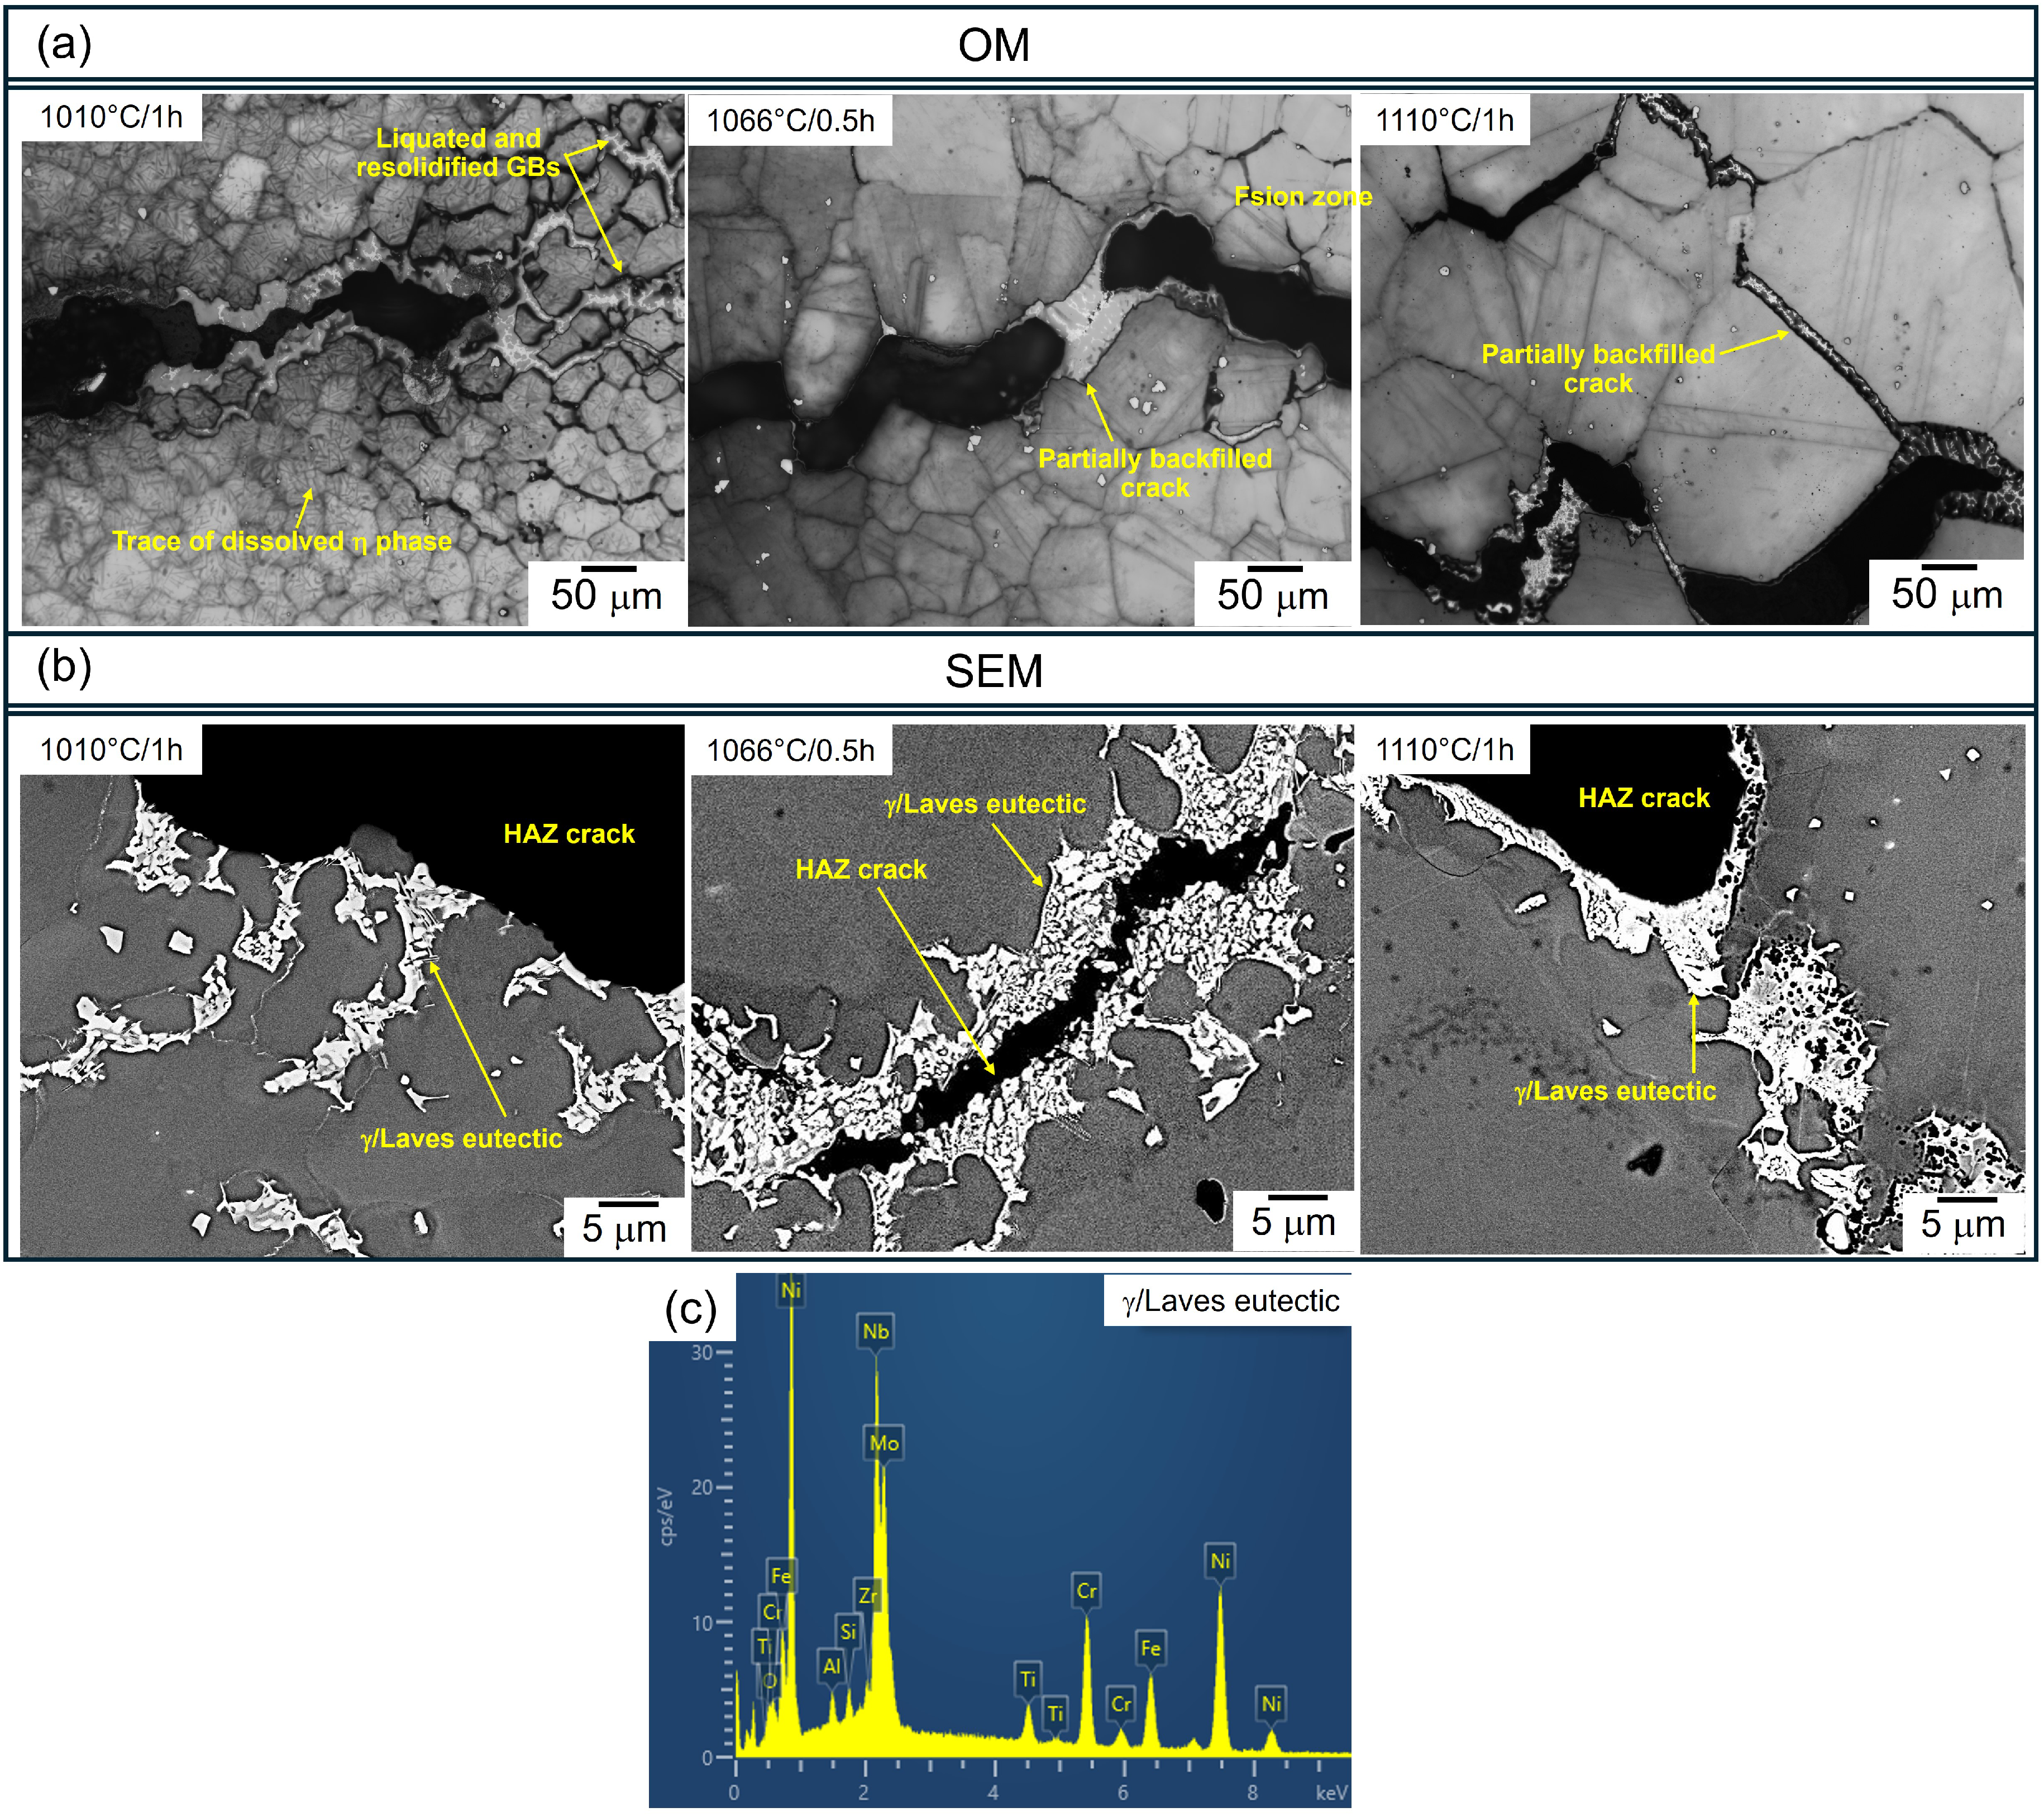
(a) OM micrographs that show intergranular HAZ cracks in G27 in all pre-weld solution-annealed conditions; (b) SEM micrographs that show γ/Laves eutectic constituents surrounding the cracks in G27 in all pre-weld solution-annealed conditions; (c) typical SEM-EDS spectrum of γ/Laves eutectic constituent.
In addition, NbC particles on the edge of the HAZ cracks were found to undergo constitutional liquation. Figure 7(a) shows an instance of constitutional liquation of NbC, where the irregular-shaped constituents are found as the solidified product on the edges of the liquating NbC particle. SEM-EDS elemental mapping (Figure 7(b)) shows that the irregular constituents are Nb and Mo-rich. They are also richer in Ni, Cr, and Fe compared to the NbC, suggesting that the constituents are Laves eutectics. Further confirmation by EBSD point analysis on the NbC and constituent was performed. The Kikuchi patterns of the NbC (Figure 7(c)) and constituents (Figure 7(d)) are positively indexed as the NbC and HCP Laves phase by the EBSD analysis software.
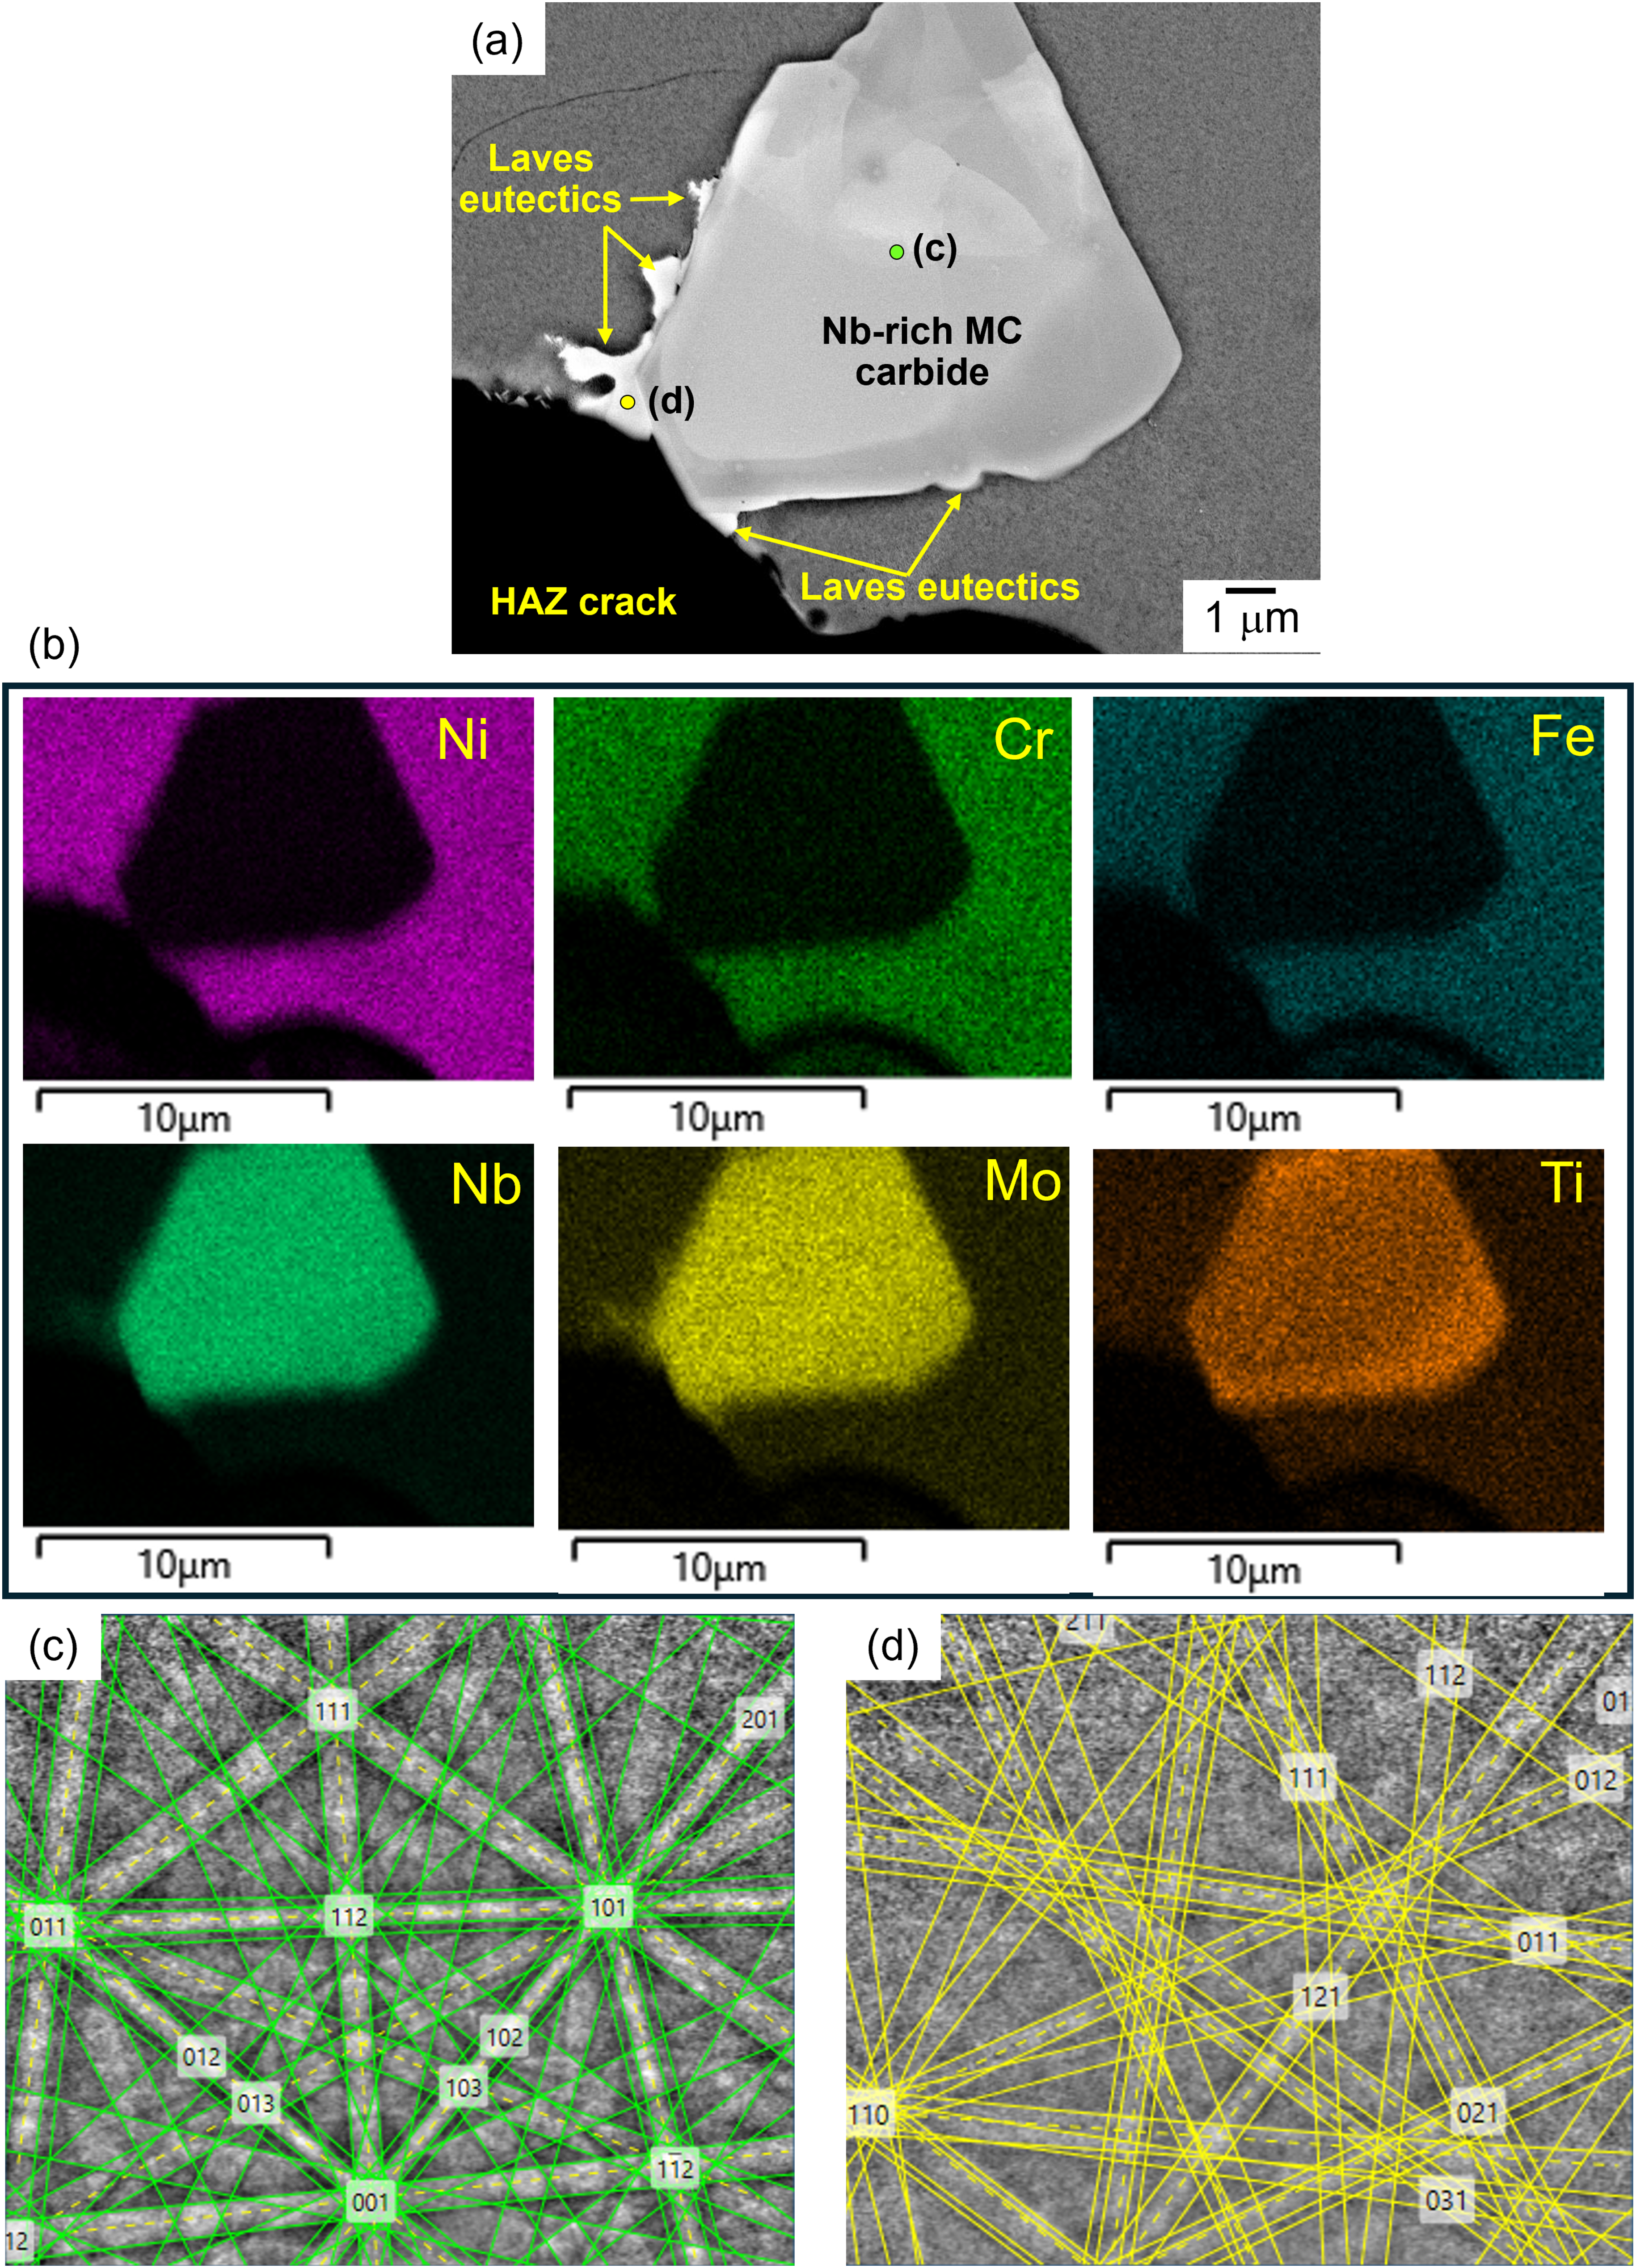
(a) SEM BSE image that shows an NbC particle on the edge of HAZ crack that underwent constitutional liquation; (b) SEM-EDS mapping of an area in (a); (c) and (d) Kikuchi patterns obtained by EBSD point analysis on NbC particle and γ/Laves eutectic constituent, respectively as designated in points in (a).
Discussion
Fusion zone solidification cracking
As quantitatively shown in Figure 4, the difference in the fusion zone TCL between different pre-weld solution annealing conditions was insignificant, given that there was substantial overlap in error bars of the average TCL of the three solution annealing conditions that represent the uncertainty of the data, indicating that their TCL values are comparable. This suggests that, in contrast to the HAZ cracking that shows a strong trend in the change in TCL as a function of the pre-weld base material's grain size without overlap in the error bars, the solidification cracking is essentially independent of the pre-weld solution annealing condition that produced different pre-weld base material's grain size. Thus, there was no clear correlation between the pre-weld base material's grain size and the solidification cracking. The reason why solidification cracking was not affected by the pre-weld base material's grain size could be related to the fact that the base material melts entirely during the welding, eliminating the pre-weld base material's grain size history. In addition, since the chemical composition of all base material conditions, irrespective of the pre-weld solution annealing, are still the same, the solidification temperature range (STR), which is the alloy's inherent property and is generally known to affect solidification cracking susceptibility, is identical for all pre-weld material conditions. No difference in the STR could further explain the insignificant difference in TCL in the fusion zone of all solution-annealed conditions.
It has been shown that fusion zone solidification cracking in G27 was found predominantly along solidification grain boundaries and associated with the solidified γ/Laves eutectic constituent surrounding the cracks. G27, notably, as a Nb-bearing Ni-based superalloy that contains Nb and C within the concentration range reported by DuPont et al., 5 the non-equilibrium solidification pathway is expected to follow the reaction of L → γ + MC followed by L → γ + Laves. The transformation sequence also aligns with the Scheil solidification simulation by Ariaseta et al. 1 using the nominal composition of G27 due to the Mo, Ti, and Nb segregation to the solidifying liquid, as these elements have equilibrium partition coefficients much less than unity as determined using SEM-EDS by Ariaseta et al. 1 The reaction of L → γ + Laves is generally known to expand the effective solidification temperature of Nb-bearing superalloys since the Laves phase is typically formed at a relatively low temperature. 6 The partitioning of Mo, Ti, and Nb to the liquid during solidification in G27 leads to the intergranular residual liquid that forms γ/Laves eutectics with a relatively low freezing temperature, which causes decohesion of the solidification grain boundaries to form solidification cracks when the critical strain is exceeded.
HAZ liquation cracking
Liquation cracking mechanisms
The HAZ cracking in G27 has been recognised as liquation cracking. On the edges of some HAZ cracks, it has been revealed that NbC particles that underwent constitutional liquation were observed. This suggests that one of the primary causes of intergranular liquation that led to the HAZ liquation cracking in G27 is the constitutional liquation of NbC. In Nb-bearing superalloys, constitutional liquation of NbC particles typically occurs and often makes the materials suffer from intergranular HAZ cracking, for example, in Alloy 718, as reported by Andersson et al. 7 The liquation of NbC occurs due to a partial dissolution of the NbC particle at the grain boundary under rapid heating conditions during the welding thermal cycle, leading to the concentration gradient at the interface of the particle in equilibrium with the matrix. When the eutectic temperature of the system is reached, the liquid begins to form at the interface, and the amount of liquid due to the liquation reaction becomes more significant as the HAZ region is heated beyond the eutectic temperature. Then, the liquid wets and penetrates the grain boundary, eventually leading to the decohesion of the liquid/solid interface when a critical strain is exceeded.
Apart from the constitutional liquation of NbC, another intergranular liquation mechanism that led to HAZ cracking appears to also come into play. As shown in Figure 6(b), a fair amount of γ/Laves eutectic constituents was observed surrounding some HAZ cracks without the discernible presence of NbC. It appears that grain boundary liquation that led to the formation of these cracks was likely to occur via supersolidus melting. It is also reported in K-TIG welded G27 by Ariaseta et al. 8 that in the HAZ that experiences supersolidus melting, γ/Laves eutectics are present at the grain boundaries that were liquated and resolidified. This observation suggests that the resolidification process of the liquid formed due to supersolidus melting in the HAZ appears to exhibit a solidification pattern similar to that observed in the fusion zone.
Effect of grain size on liquation cracking
The liquation cracking susceptibility is often influenced by grain size. Generally, coarse-grain material has a higher propensity to liquation cracking than fine-grained material. There are several explanations for how grain size affects liquation cracking susceptibility. As per Thompson et al., 9 a coarse grain structure leads to a thicker intergranular liquid layer, assuming the same liquid volume produced in both cases and a longer interface sliding length. The thicker liquid layer could prolong the temperature range and duration within which the liquid wets the grain boundary during non-equilibrium solidification, reducing the resistance toward the liquation cracking. In addition, thicker grain boundary liquid would also lead to lower stress needed to cause decohesion of the solid/liquid interface, as reported by Miller and Chadwick. 10 Moreover, a longer interface sliding length would increase stress concentration and strain on the grain boundary triple point, increasing liquation cracking susceptibility.
Base material hardness may also influence liquation cracking susceptibility in superalloy. Egbewende et al. 11 reported that in Inconel 738 superalloy, the pre-weld heat treatment that produces the least intergranular liquation and highest base material hardness exhibited the largest TCL compared to other heat treatments with the same grain size, suggesting hardness increased the liquation cracking susceptibility. The higher base material hardness can enhance the intrinsic restraint in the HAZ and diminish the material's capacity to alleviate stresses created during welding, causing a substantial stress accumulation on the liquated HAZ grain boundaries, leading to cracking.11,12
Figure 8(a) compares the mean grain size and hardness of pre-weld solution annealed base materials in all conditions. The larger TCL in 1066 °C/0.5 h than in 1010 °C/1 h conditions despite having a softer base material in the former suggests that the effect of grain size was more important than hardness on the liquation cracking. The influence of grain size on the liquation cracking becomes more evident by comparing 1010 °C/1 h and 1110 °C/1 h conditions, respectively, as their base material hardness is comparable. Although 1110 °C/1 h exhibited higher hardness than 1066 °C/0.5 h, upon also considering the standard deviations, the hardness difference between the two conditions was arguably insubstantial. Hence, the larger TCL in 1110 °C/1 h than in 1066 °C/0.5 h solution-annealed materials can also reasonably be mainly attributed to larger grain size in 1110 °C/1 h condition.
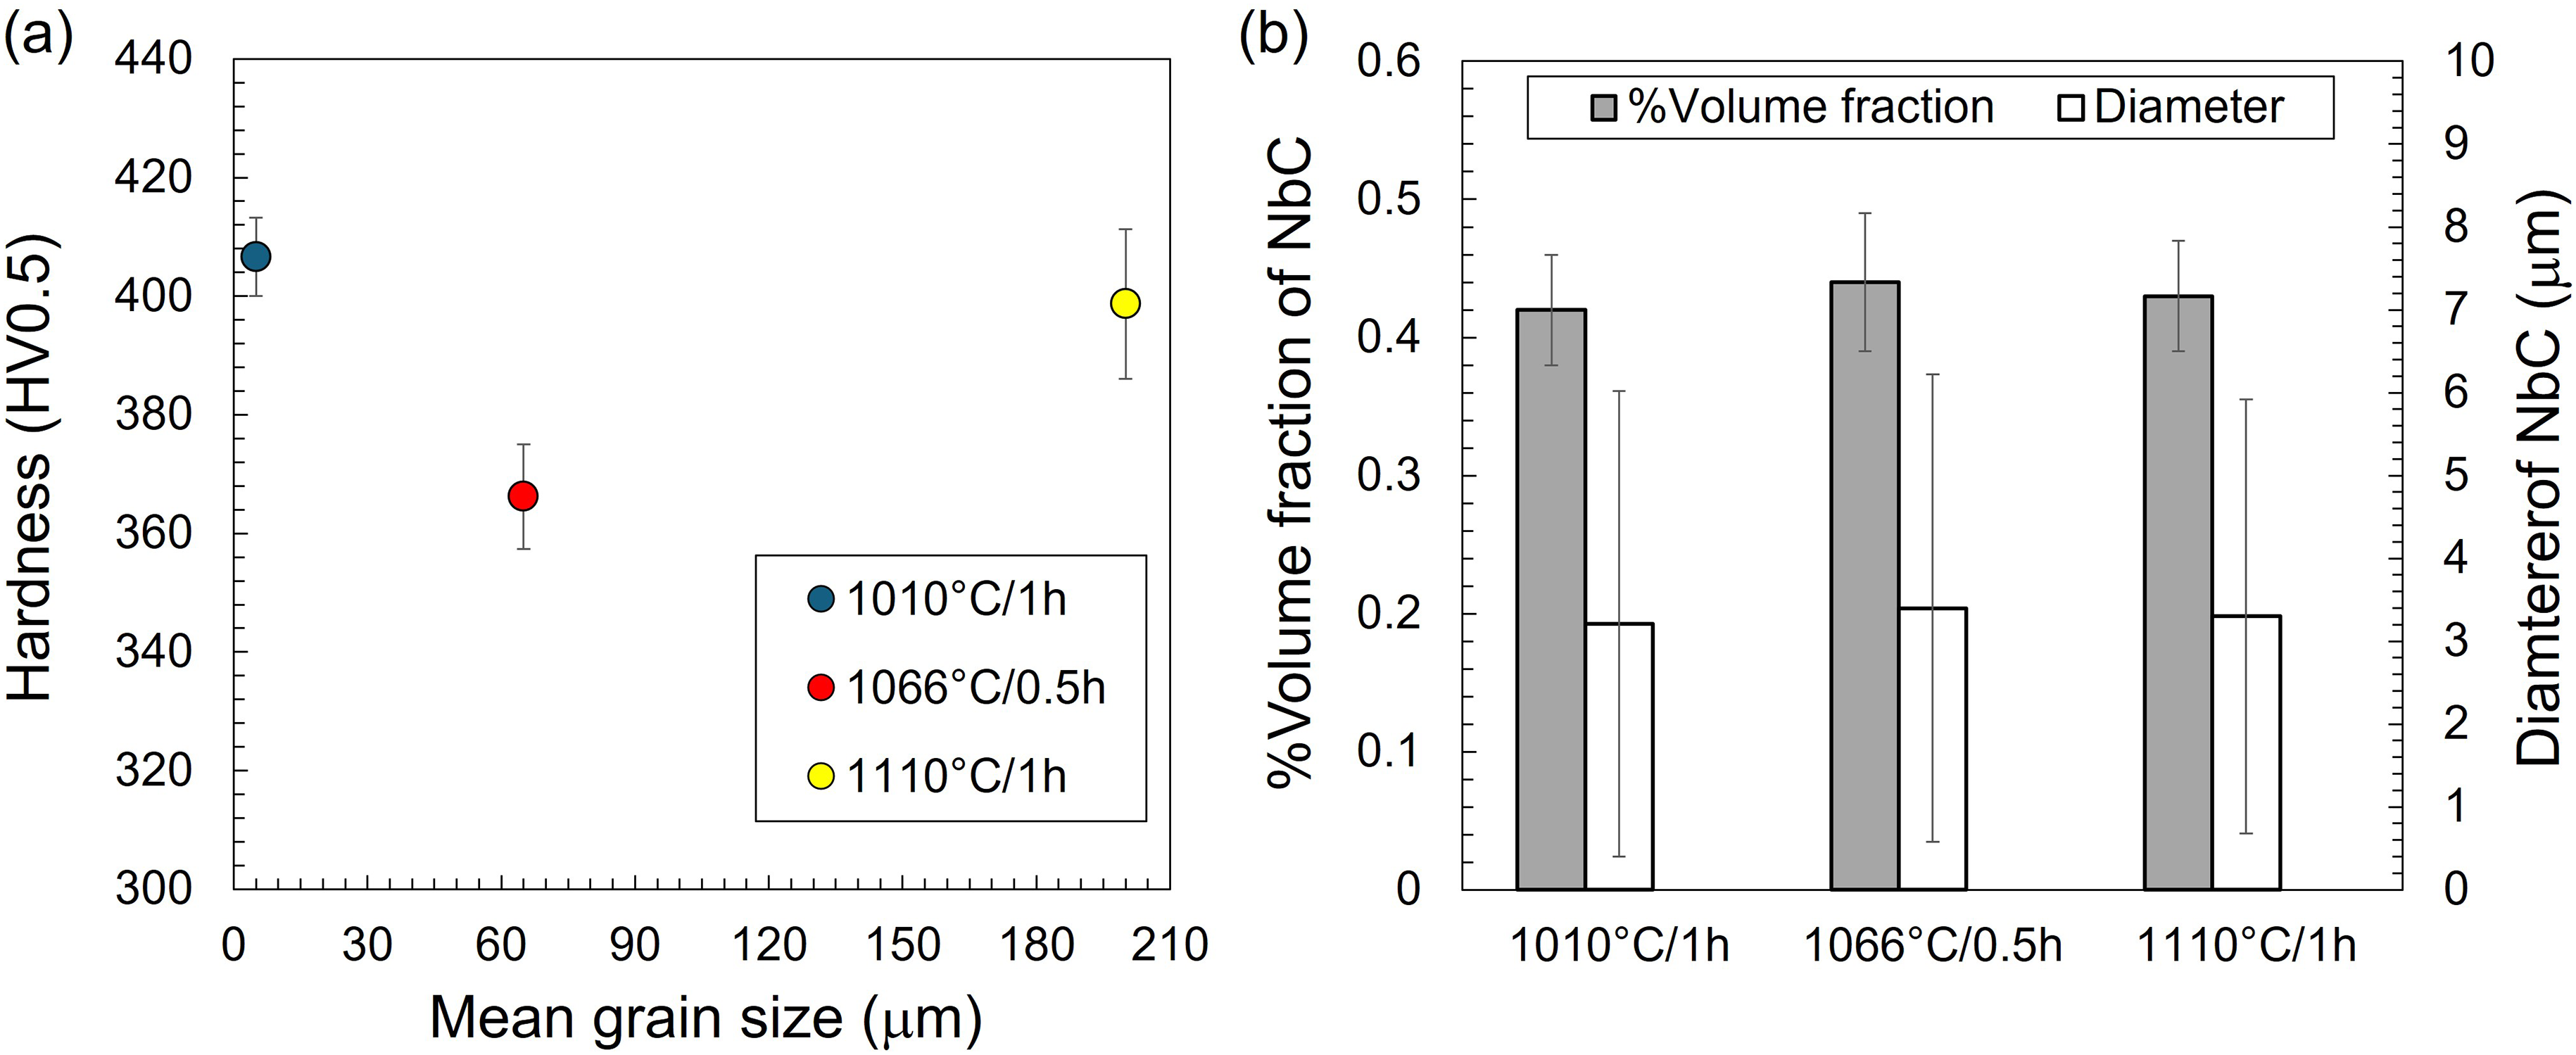
Comparison of (a) mean grain size and hardness and (b) %volume fraction and diameter of NbC in the base materials of all pre-weld solution-annealed conditions.
To further confirm the effect of grain size on the liquation cracking susceptibility, the extent of intergranular liquation through supersolidus melting and constitutional liquation of NbC is analysed in all pre-weld solution-annealed conditions since the extent of intergranular liquation also affects the cracking susceptibility. Supersolidus melting is more connected to the chemical composition of the alloy since the liquation occurs upon heating the materials above the equilibrium solidus temperature; thus, the amount of liquid formed due to liquation through the supersolidus melting is reasonably similar in all solution-annealed conditions. Meanwhile, the extent of intergranular liquation due to the liquation of NbC is generally influenced by the volume fraction and size of the NbC, where larger NbC particles with higher volume fraction can result in more intergranular liquation. Figure 8(b) shows the volume fraction and diameter of NbC particles in the base materials of all pre-weld solution annealing conditions. The volume fraction of NbC particles was estimated by its area fraction, which was measured together with the diameter using ImageJ based on 15 OM images for each solution annealing condition. It is shown that the volume fraction and diameter of NbC do not change with increasing solution annealing temperatures. This suggests that the extent of intergranular liquation through both liquation mechanisms is expected to be comparable in all solution-annealed conditions, confirming that the deterioration of the liquation cracking resistance at higher solution-annealing temperatures is primarily due to a significant grain coarsening.
The importance of grain size, as shown in the lowest TCL in the pre-weld solution-annealed material at 1010 °C/1 h that has the smallest grain size, shows the critical role of the η phase, which appears to play a crucial role in minimising the liquation cracking susceptibility by preserving the fine-grain structure of the base material through grain boundary pinning during pre-weld solution annealing at 1010 °C/1 h. At higher solution annealing temperatures, that is, 1066 °C/1 h and 1110 °C/1 h, the absence of η phase results in substantial grain coarsening in the base material, ultimately increasing the liquation cracking susceptibility at 1066 °C/0.5 h and 1110 °C/1 h conditions with respect to 1010 °C/1 h. Plate-like precipitates such as η or δ phase are known to be beneficial in controlling the grain size of commercial superalloys by pinning the grain boundary, such as ATI 718Plus by η phase and Alloy 718 by δ phase. However, note that only a meager η phase formation was observed during solution annealing at 1010 °C/1 h in the previous work of the present authors. 1 In addition, it is also interesting to note that the η phase in G27 is thermodynamically unstable at any temperature based on the calculated phase diagram 1 by Thermo-Calc. The significant η phase formation observed in this study is yet to be understood and will be studied in future work.
Although a strong correlation between the pre-weld base material's grain size and the liquation cracking in G27 was observed, it is worth noting that it is not the base material's grain size intrinsically that is substantial but rather the HAZ's grain size across the liquation temperature range. However, since grain coarsening could be rapid and occurs in a short time interval in the HAZ, the base material's grain size could still be utilised as a rough guideline for evaluating the influence of grain size on the liquation cracking propensity. As shown in Figure 6(a), although grain coarsening to some extent occurred due to the η phase dissolution within the HAZ of 1010 °C/1 h solution-annealed material, the HAZ's grain size was still the finest, about two to three times finer than 1066 °C/0.5 h and six to seven times finer than 1110 °C/1 h, which explains its highest resistance to cracking.
Conclusions
In this article, the effect of pre-weld solution annealing at 1010 °C/1 h, 1066 °C/0.5 h, and 1110 °C/1 h on the hot cracking susceptibility of G27 superalloy was studied. The conclusions of this study are summarised as follows:
Fusion zone solidification cracking in G27 was independent of pre-weld solution annealing, and the solidification cracks are predominantly found on the solidification grain boundaries and are associated with the γ/Laves eutectic constituents. The material that was pre-weld solution-annealed at 1010 °C/1 h showed the lowest extent of HAZ liquation cracking, whereas the material that was solution-annealed at 1110 °C/1 h was the most susceptible one. The increased level of HAZ liquation cracking was primarily attributed to the increase in the grain size of the pre-weld solution-annealed material. The η phase appears to play a crucial role in minimising the susceptibility of the material towards liquation cracking by preserving the fine-grain structure through grain boundary pinning during pre-weld solution annealing at 1010 °C/1 h, while solution annealing at 1066 °C/0.5 h and 1110 °C/1 h results in substantial grain growth in the base material since η phase does not form in the microstructure during the solution annealing, which ultimately increased the liquation cracking susceptibility. Intergranular liquation that leads to the liquation cracking appears to be caused by constitutional liquation of NbC and supersolidus melting.
Supplemental Material
sj-docx-1-stw-10.1177_13621718241285301 - Supplemental material for Weldability of new Ni-based superalloy G27: Effect of pre-weld solution annealing on the hot cracking susceptibility
Supplemental material, sj-docx-1-stw-10.1177_13621718241285301 for Weldability of new Ni-based superalloy G27: Effect of pre-weld solution annealing on the hot cracking susceptibility by Achmad Ariaseta, Joel Andersson and Olanrewaju Ojo in Science and Technology of Welding and Joining
Footnotes
Acknowledgements
This work was funded by VINNOVA within the FEAST project (registration number: 2019-02787). We sincerely thank GKN Aerospace Sweden AB for their support and Carpenter Technology for providing the samples. We also thank Mr Kjell Hurtig for his help with the Varestraint tests and Dr Abdul Khaliq Khan for his help with TEM analyses.
Data availability
All data corroborating the findings of this research are incorporated within the manuscript.
Declaration of conflicting interests
The author(s) declared no potential conflicts of interest with respect to the research, authorship, and/or publication of this article.
Funding
The authors disclosed receipt of the following financial support for the research, authorship, and/or publication of this article: This work was supported by the VINNOVA (grant number 2019-02787).
Supplemental material
Supplemental material for this article is available online.
References
Supplementary Material
Please find the following supplemental material available below.
For Open Access articles published under a Creative Commons License, all supplemental material carries the same license as the article it is associated with.
For non-Open Access articles published, all supplemental material carries a non-exclusive license, and permission requests for re-use of supplemental material or any part of supplemental material shall be sent directly to the copyright owner as specified in the copyright notice associated with the article.