
Abstract
This study investigated the effect of nanograin formation on joint strength through sliding friction during ultrasonic welding (USW). The nanograined austenite phase would induce the surface strengthening effect, potentially impeding the bonding process. A bonding strength exceeded 2000 N within a short welding duration of 2.5 s. Interestingly, the strength was attributed to ultrafine-grained interfacial microstructure resulting from the plastic flow during processing. This unique nanograined microstructure formed from dynamic recrystallisation unexpectedly facilitated the bond formation rather than hindering the bonding process. This study gained insights into the critical interfacial microstructure required for the USW of metals and alloys with high melting temperatures.
Highlights of this research
◼ Fine-grained austenite formed from sliding typically poses a challenge to bond formation in ultrasonic welding (USW)
◼ This work investigated their effect on bond development and interfacial strength
◼ After USW, nanograins (<100 nm) were produced at the interface owing to dynamic recrystallisation
◼ Nanograins with plastic flow facilitate bonding development rather than hindering it
◼ Plastic flow and nanograins contribute to an increase in joint strength
Introduction
Ultrasonic welding (USW) is an energy-saving joining technique since heat is generated from the sliding friction between metals to be welded at the bonding interface under nominal load and high-frequency oscillation. 1 Besides, USW has advantages such as short welding time, ready availability under any atmospheric condition, and low bonding temperature. 2 Particularly, low bonding temperature can prevent issues that occur with high temperatures, such as grain coarsening 3 or the formation of deleterious secondary phases, 4 which contributes to a decrease in mechanical strength or the corrosion resistance of joints,5,6 particularly in the welding of stainless steels (SS). 7
USW is widely adopted in joining soft metals, such as Al,8–15 Mg,16–18 or Cu19–21 alloys, and soft/hard metal combinations (e.g. steel/Al 22 ), by inducing localised severe plastic deformation (SPD), 23 recrystallisation24–26 or intermetallic phase formation. 27 For harder metal bonding, existing studies have shown that the induction of SPD or phase transformation is effective for joining steel/Ni 28 or steel/Ti. 29 Particularly, these bonding mechanisms originate from the sliding friction between metals, followed by the generation of frictional heat and deformation. Meanwhile, previous tribological studies (e.g. pin-on-disc tests)30,31 have reported that continuous sliding friction on the surface of austenitic SS contributes to localised plastic deformation, resulting in the formation of nanograins near the surface.
These nanograins strengthen the surface and improve the wear properties of SS due to a strain-hardening effect, resulting in a higher resistance to further plastic deformation at the sliding surface. 32 However, the formation of nanograins during sliding friction may also impede the bonding development of USW, potentially reducing the weldability. Nevertheless, the current understanding of the nanograin effect on bonding development is still limited. Therefore, this study aims to investigate the feasibility of using high-power USW equipment to weld austenitic SS having higher hardness and melting points by inducing concentrated sliding friction between metals and to assess the influence of nanograin formation on the evolution of bonding strength.
Experimental methods
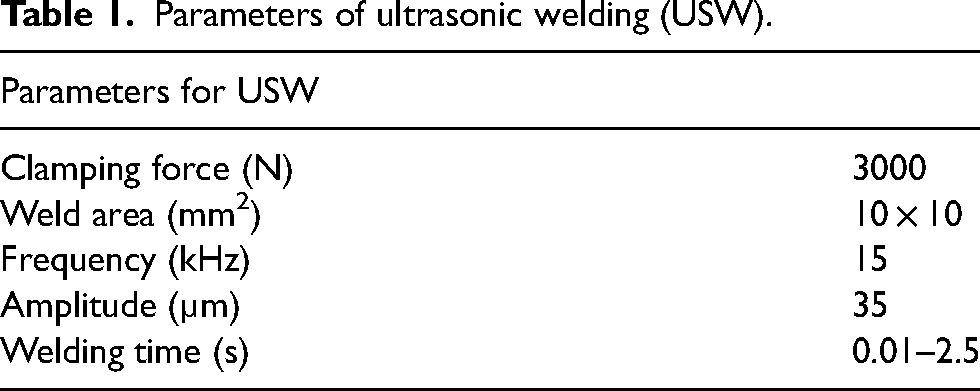
In this study, 316L low-carbon SS sheets (Fe–17.2Cr–10.6Ni–0.02C, in wt-%) were employed in a dimension of 20 × 10 × 0.5 mm. Subsequently, the sheets were subjected to solution treatment (1100 °C for 1 h, followed by water-quenching) to obtain a single face-centred cubic (FCC) phase. Before the USW, the bonding surfaces were mechanically ground and polished by diamond suspensions with a surface Vickers hardness of 155 HV. Next, the USW was performed by a high-power ultrasonic welder (8 kW of maximum output, SG-1580, Telsonic Inc.). The parameters of USW are listed in Table 1. In USW, an average output of 3.5 kW was achieved at this clamping force (3000 N) and the oscillation amplitude (35 µm). Note that the maximum output depends on the combination of clamping force and oscillation amplitude. To measure the thermal history during USW, K-type thermocouples were placed between the workpieces (at the edge of the weld area). After USW, a lap-shear test was performed on the welded specimens by using a universal tester (TPP-2000, Pingtai Co.) at a crosshead speed of 5 × 10⁻³ mm s−1. Specifically, bonding strength (i.e. lap-shear load) was averaged from five specimens for each welding condition. For microstructural observation, scanning electron microscopy (SEM; SU-5000, Hitachi), electron backscattered diffraction (EBSD; Oxford Instrument), and transmission Kikuchi diffraction (TKD; Oxford Instrument) were used for microstructure characterisation. Further, dual-beam focused ion beam (FIB) equipment (Helios G3CX, FEI) and transmission electron microscopy (TEM; Tecnai F20, FEI) were utilised for characterisations in nanoscales.
Parameters of ultrasonic welding (USW).
Results and discussions
Figure 1(a) shows the lap-shear load (i.e. the term ‘bonding strength’ used in this study) plotted against welding time. It is evident that the bonding strength of the 316L joints is revealed after 0.05 s welding time and reached about 750 N (7.5 MPa of lap-shear strength). Bonding strength then evolved rapidly to over 1000 N (10 MPa of lap-shear strength) after 0.1 s welding time, and gradually saturated to over 1500 N (15 MPa of lap-shear strength) when the welding time is >0.5 s. After 2.0 s of welding, bonding strength gradually reached 2050 N (20.5 MPa of lap-shear strength). The joints fractured at the interface after the lap-shear test (i.e. interfacial fracture as shown in the bottom inset in Figure 1(a)). After 2.5 s of welding, the fracture occurred at the weld area edge rather than the bonding interface. This fracture was represented as a base metal fracture (see the top inset in Figure 1(a)). Figure 1(b) shows a comparison of bonding strengths (i.e. lap-shear load values) plotted against the Vickers hardness of metals under USW. It is observed that high bonding strength was revealed at soft metal combinations having lower or medium melting points, including Al/Al,8–15 Mg/Mg,16–18 or Cu/Cu,19–21 while bonding strength decreased with an increase in hardness in steel/steel33–35 and NiTi/NiTi36,37 combinations having high melting points. Conversely, our results showed a notable increase in bonding strength at SS, indicating the feasibility of joint production between hard metals with substantial strength by using high-power USW.
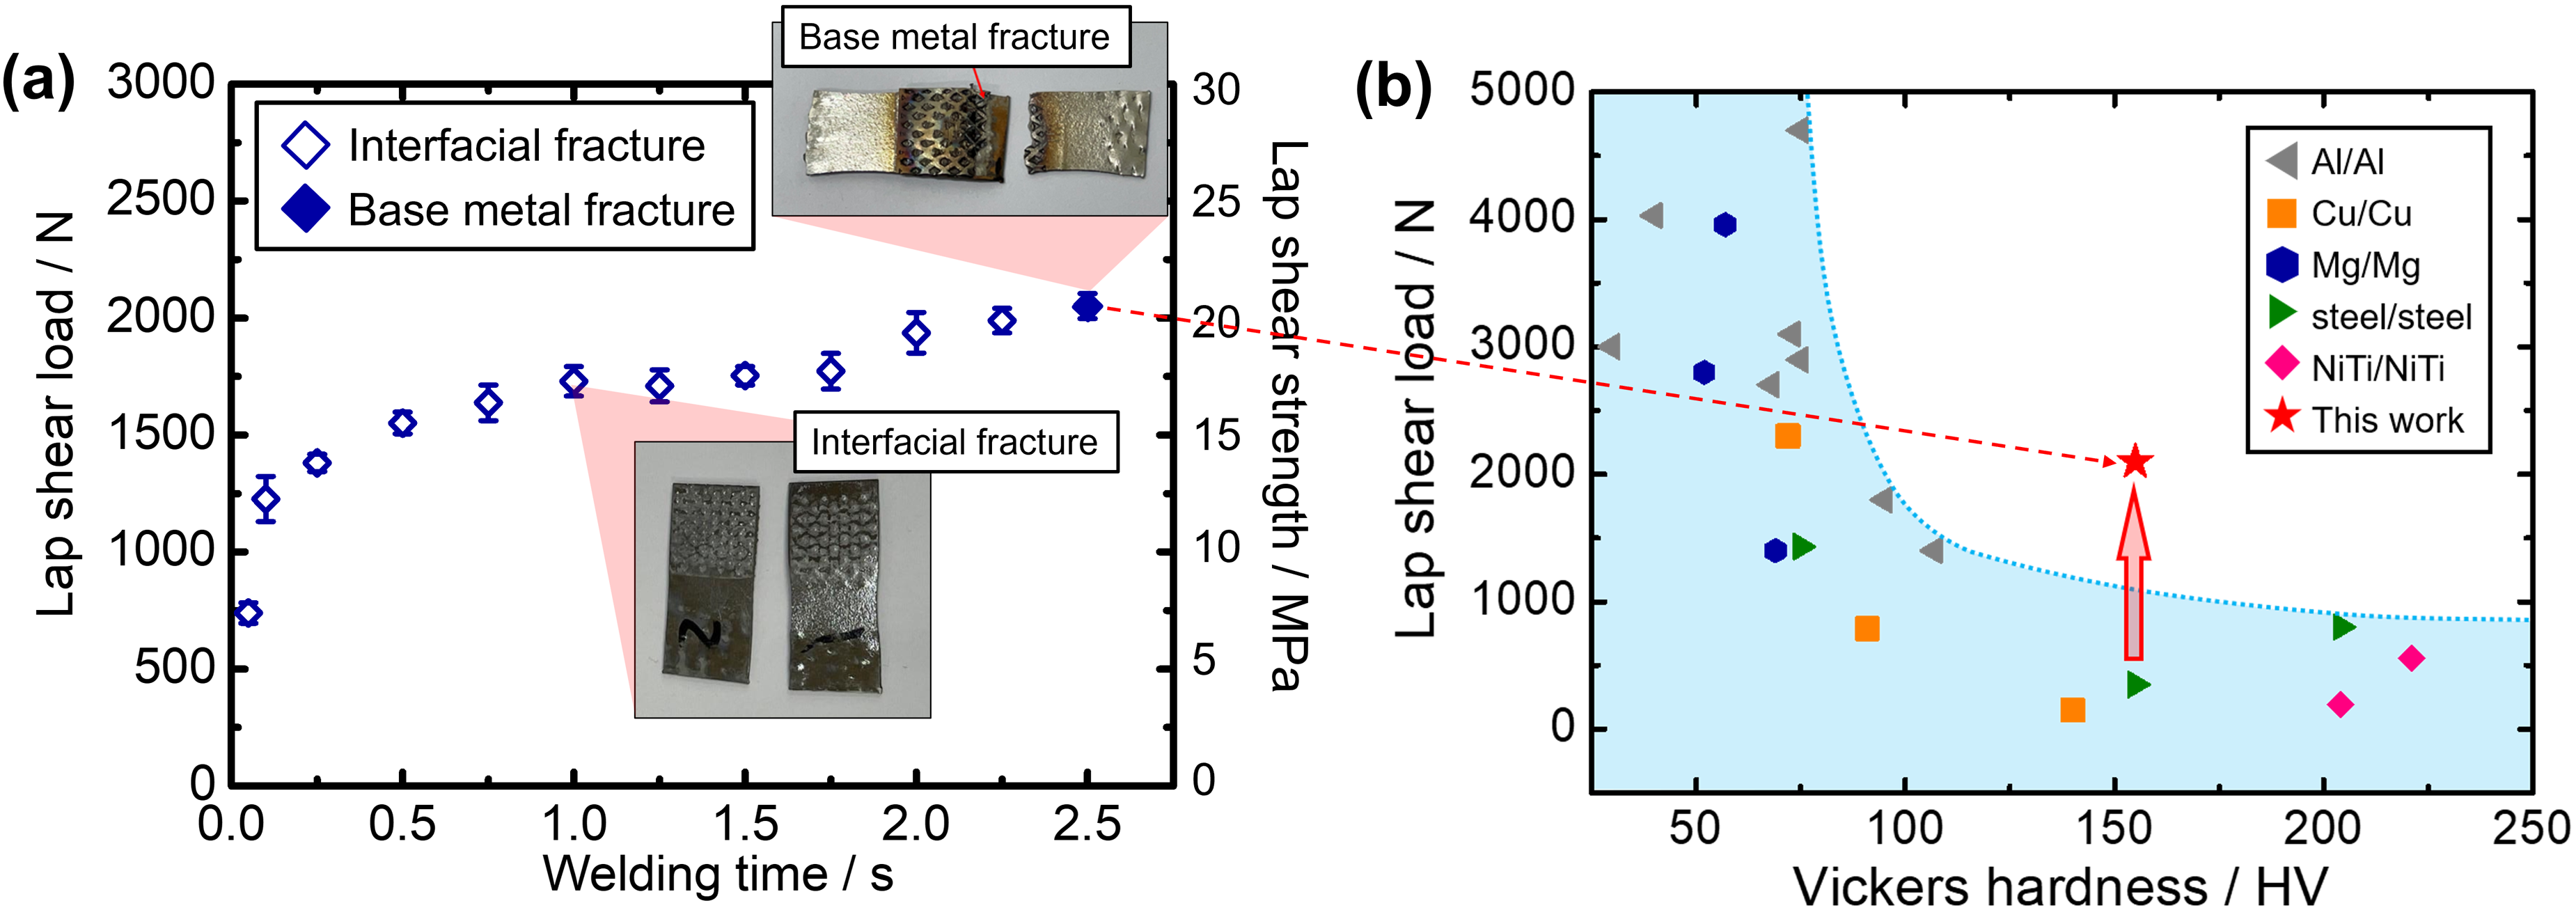
(a) Strength evolution plotted against the welding time, where inset figures indicate the formation of interfacial fracture and base metal fracture. (b) Comparison of bonding strength as a function of Vickers hardness at room temperature with different similar metal combinations.
It is well understood that the thickness of base metals has a great influence on the weldability of USW due to the efficiency of vibration energy transmission from the horn to the interface. Once the thickness of base metal in contact with the horn increases, joint fabrication becomes more difficult due to the dissipation of energy from heat sinking or elastic deformation. 38 Another concern for joining thicker metals is the potential for slippage when knurled surfaces of horn or anvil have smaller teeth. Other works also report this slippage due to the geometry of knurled surfaces of tools on joint production.39,40 However, overly large teeth on knurled surfaces could cause penetration of the base metals, subsequently weakening joint strength.
Figure 2 depicts the microstructure-time evolution of the 316L/316L bonding interface using SEM and EBSD. In the SEM image of Figure 2(a), a straight gap was presented at the interface, along with the plastic flow in its vicinity. Specifically, the black section in the inverse pole figure (IPF) map of Figure 2(a) suggested inadequate bonding or SPD occurrence. Furthermore, the upper vicinity of the interface revealed a significant formation of a deformation twin structure (see the red arrow). This structure is found in the SPD process at a high strain rate (∼103 s−1 41 ) and relatively low temperature.42–44 Since USW features rapid and localised deformation (strain rate of ∼103 s−1 45 ), it is considered that at the early stage of USW, the 316L sheets underwent localised SPD to produce deformation twins at a low temperature. Meanwhile, in the kernel average misorientation (KAM) map of Figure 2(a), residual stress concentrated at the vicinity of the upper metal, supporting the occurrence of SPD.
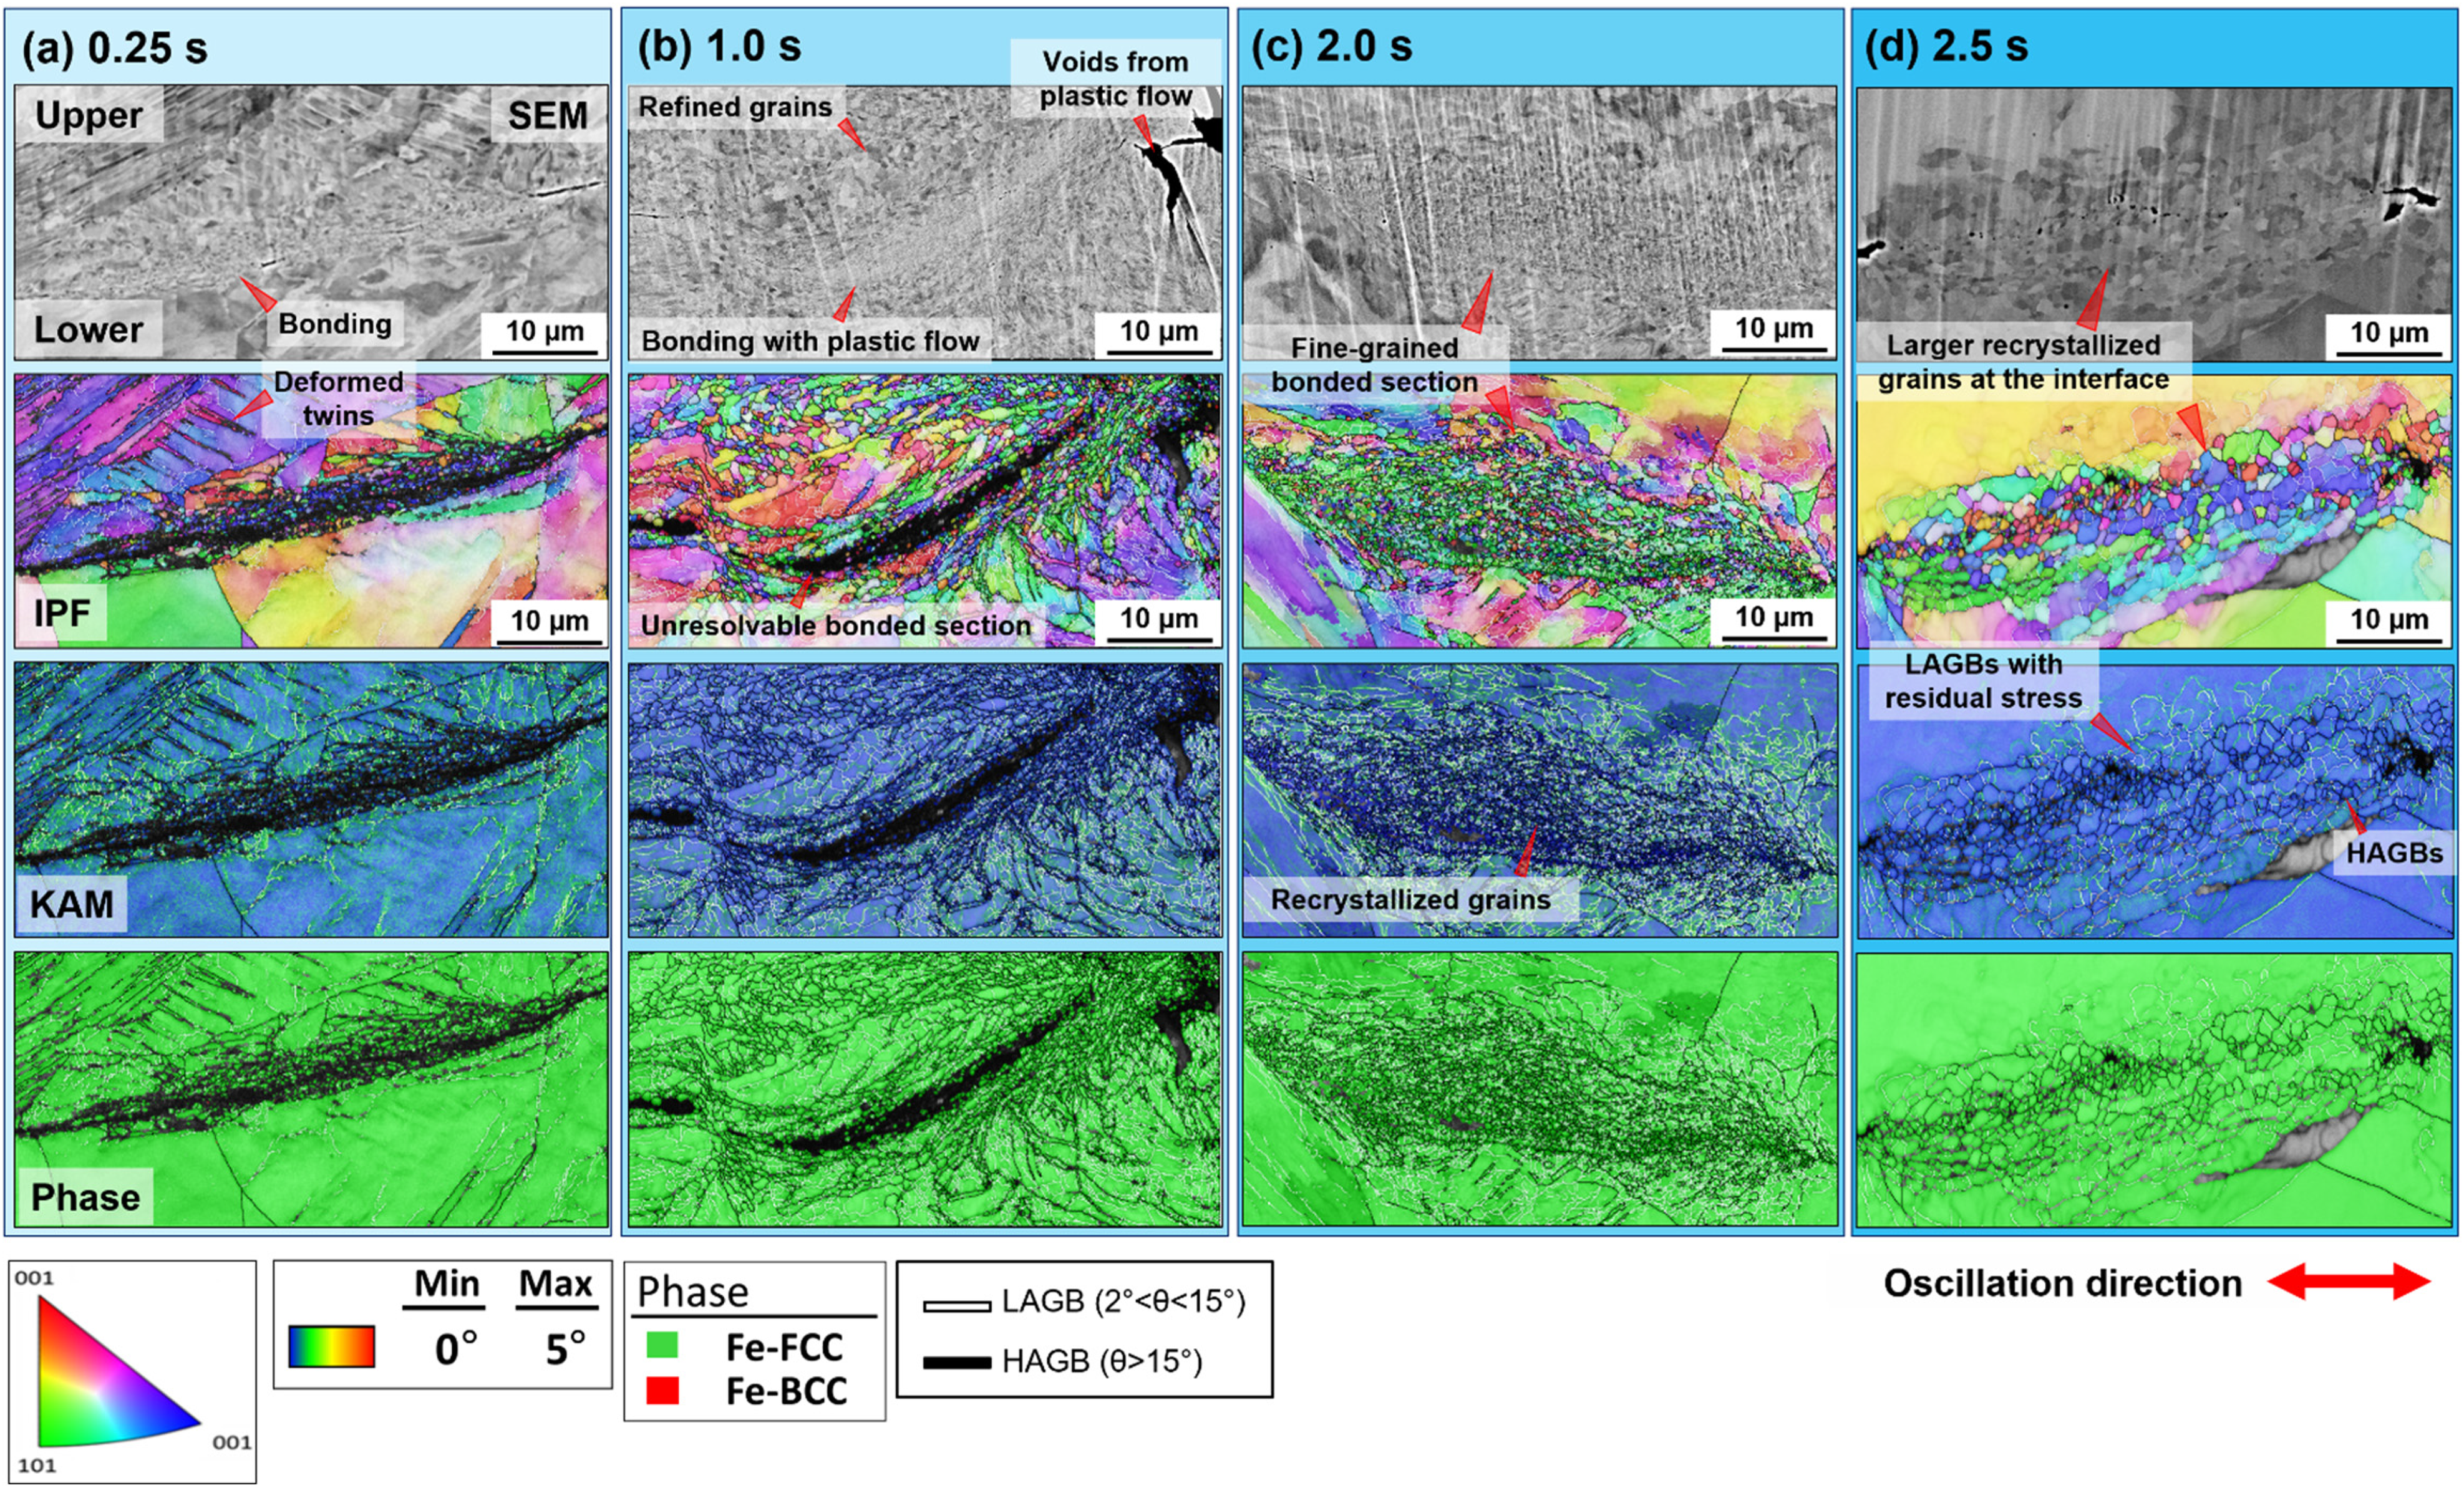
SEM micrographs and corresponding EBSD maps of bonding interface after (a) 0.25 s (b) 1.0 s (c) 2.0 s (d) 2.5 s of welding time.
As welding time increased to 1.0 s, the plastic flow became more significant, causing a wavy-like interface with voids from the plastic flow (see the right arrow in Figure 2(b)), where the white section in the centre indicated bonding without defects. In the IPF and KAM maps of Figure 2(b), it is seen that a dense formation of high-angle grain boundaries (HAGBs) at the vicinity of the bonded section, with a grain size less than a few microns, suggested grain refinement by plastic flow (see the red arrows). The KAM map in Figure 2(b) revealed a distribution of localised strain at the interface. Furthermore, compared with the SEM micrograph having a bonded section without significant gaps or voids, it is evident that the interface was lacking EBSD resolution in the IPF map in Figure 2(b) (see the red arrow) and is considered over the detection limit of EBSD.
When the welding time increased to 2.0 s, the defects near the bonding interface gradually disappeared (Figure 2(c)), leading to an integrated bonding formation. Moreover, the IPF and KAM maps in Figure 2(c) revealed that the interfacial microstructure was resolved and exhibited a significant grain refinement near the interface. The average grain size in this bonded section was 0.46 ± 0.09 μm, which was measured by the intersect method. These smaller grains showed a distribution without significant residual stress, suggesting the occurrence of recrystallisation.
After 2.5 s of welding, those refined grains at the interface were seemingly grown to be larger (the SEM image and IPF map in Figure 2(d)) compared with that in Figure 2(c). Precisely, the grain size in the bonded section was increased to 1.09 ± 0.27 μm, suggesting the occurrence of grain growth without significant residual stress (the KAM map in Figure 2(d)). A longer welding time could promote bonding formation through mechanical (localised SPD) and thermal (elevated temperature) driving forces. These aspects are to be discussed with the measurement of interfacial temperature. Additionally, the phase maps in Figure 2(a) to (d) show that the interface microstructure during the USW mainly comprised austenite (FCC) rather than the formation of other phases. Similar microstructures were also reported in the friction stir welding (FSW) of 316 SS. 46 Particularly, large single grains of austenite after strain application from FSW are subjected to grain refinement and recrystallisation without significant martensite phase transformation.
Figure 3 illustrates the microstructural characterisation from the specimen after 0.5 s of welding by using TEM and TKD analysis, which possesses an ultrafine-grained microstructure that cannot be characterised by SEM and EBSD as well. The foil specimen was prepared via the FIB technique. In the FIB image of Figure 3(a), it is observed that the ultrafine-grained bonding at the interface is without any visible defects such as voids or gaps. The IPF map from TKD in Figure 3(b) clearly exhibits a gradient distribution of interfacial microstructure. Equiaxed grains with a size of about 100 nm are close to the interface (black band indicated by the arrow). As distance increased from the interface, it is seen that grain size increased correspondingly, accompanied by a significant formation of low-angle grain boundaries (LAGBs). A similar grain refinement has been reported in other solid-state bonding processes, where bonding development was attributed to dynamic recrystallisation (DRX). 47 DRX has been identified as the primary driving force of bonding formation between FCC metals (e.g. Cu, 48 Al, 24 and CoCrFeMnNi alloys 25 ) in the USW process.
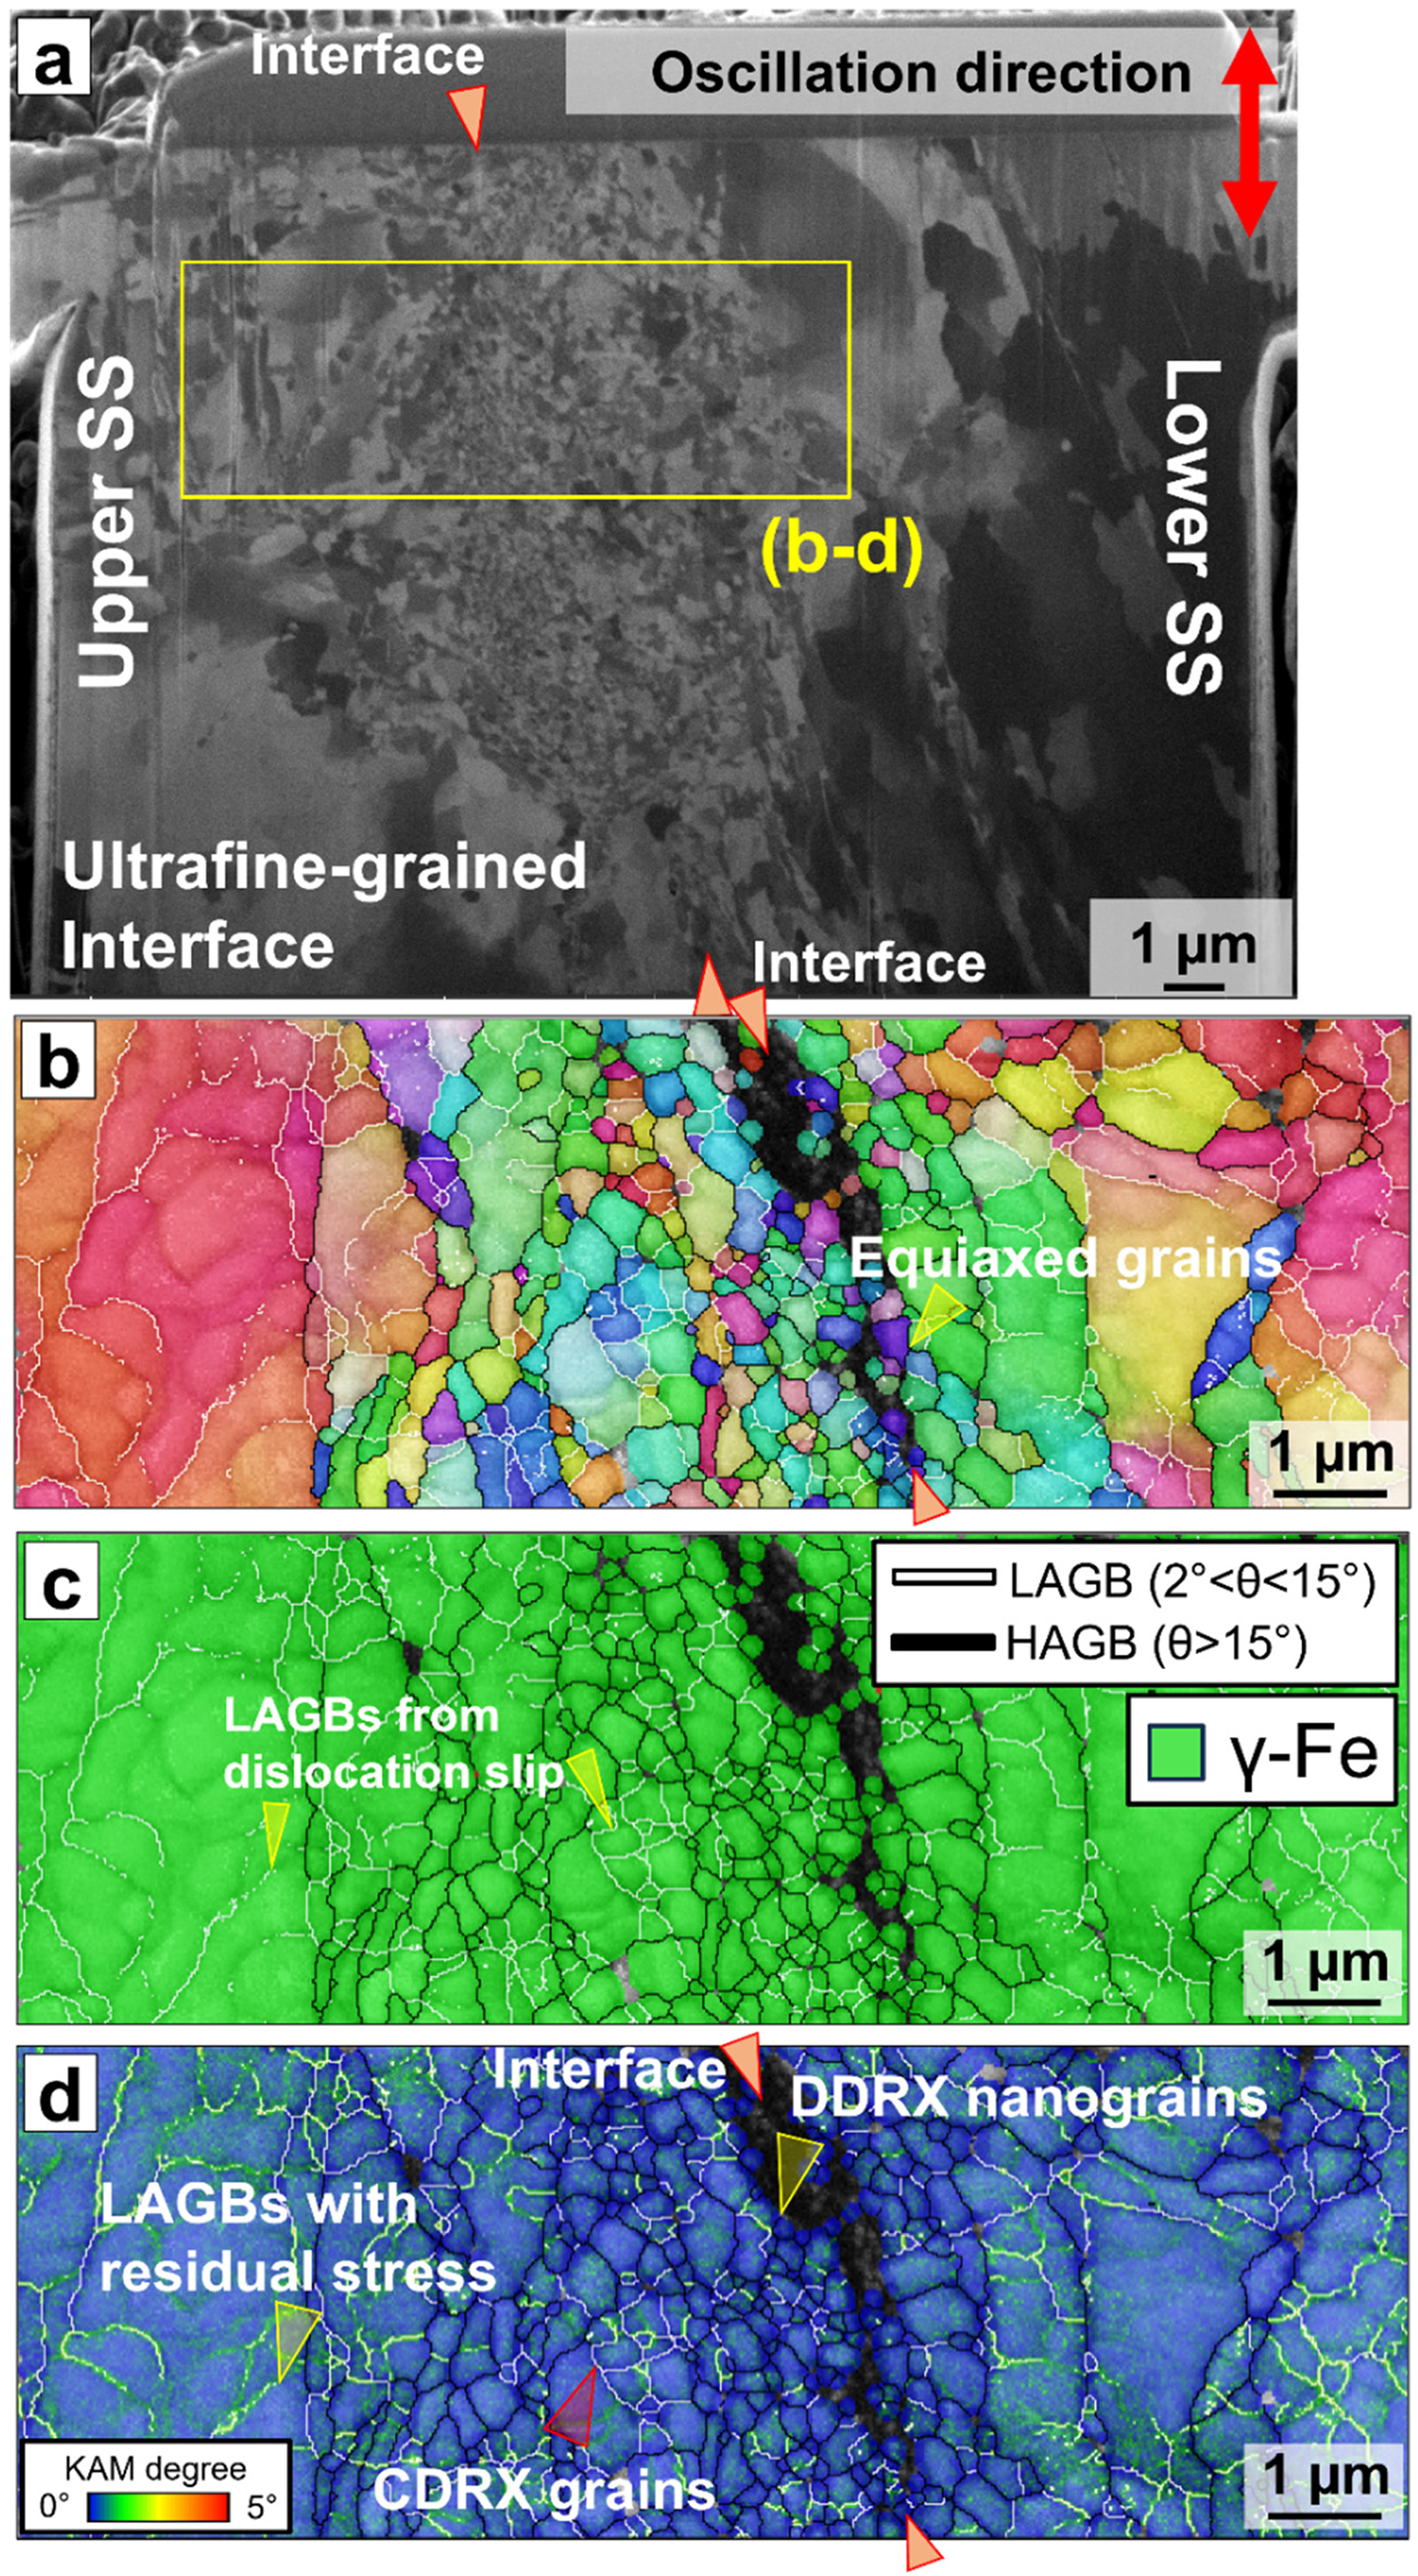
(a) FIB micrograph showing the bonding interface, where the yellow rectangle indicates the region under the analysis of TKD, including (b) inverse pole figure; (c) phase; and (d) KAM maps from TKD.
Furthermore, the phase map in Figure 3(c) illustrates a uniform FCC phase distribution without the significant formation of a second phase. Meanwhile, the KAM map in Figures 2(d) and 3(d) shows a local strain concentrated at those LAGBs but is relatively lower in those nanograins with HAGBs near the interface, suggesting a strain accumulation at a distance away from the interface and DRX at those nanograins. 25 This gradient microstructure has been observed in the USW of CoCrFeMnNi high entropy alloys, having a significant contribution to strength evolution. 25
The formation of ultrafine grains with HAGBs resulted from the intense frictional heat and SPD generated at the interface, leading to discontinuous dynamic recrystallisation (DDRX). 49 Additionally, LAGB formation at a distance from the interface owes to dislocation cells produced from strain accumulation during USW. As dislocation cells gradually rotated under plastic strain application, a larger degree of misorientation evolved with more LAGBs, resulting in the splitting of larger grains into smaller grains. The above process is known as continuous dynamic recrystallisation (CDRX). 50 However, although the FIB image in Figure 3(a) confirmed the bonding formation, it cannot be resolved using TKD. This may be because the nanograin sizes are smaller than the specimen thickness (about 100–150 nm) and may result in the overlapping of grains, contributing to interface characterisation difficulty.
USW induces sliding friction between austenitic grains with high-frequency oscillation. Shear deformation was induced via this process, thereby shearing the grains near the interface by dislocation slip, followed by the formation of LAGBs (as shown in Figure 3(c)) and a large number of dislocation cells, 25 leading to the formation of elongated grains. These LAGBs were subsequently evolved to form nanograins positioned 1–2 um away from the interface via CDRX, where residual stress in LAGBs implied the rotation of dislocation cells under sliding of USW (Figure 3(d)). Meanwhile, the highest degree of SPD and temperature rise at the interface provided a considerable driving force for nucleation of new equiaxed grains. However, the temperature limited the growth at an early stage (0.5 s of weld duration), and the DDRX is considered predominant for the formation of these equiaxed nanograins with a size <200 nm (indicated by arrows in Figure 3(d)) due to intense plastic strain at elevated temperature.
To enable TEM characterisation at the interface, the specimen thickness was further reduced after TKD. As shown in Figure 4(a), the microstructure at the centre of the interface consisted of equiaxed nanograins <100 nm (see the yellow arrows). The yellow arrow indicates the nanograined region under the selected area diffraction (SAD). SAD rings (Figure 4(b)) are indexed {111}, {200}, {220}, and {311} planes of γ-Fe phase, suggesting the formation of a polycrystalline microstructure comprised FCC austenite. Compared with a previous report,
51
the high-resolution TEM image at the
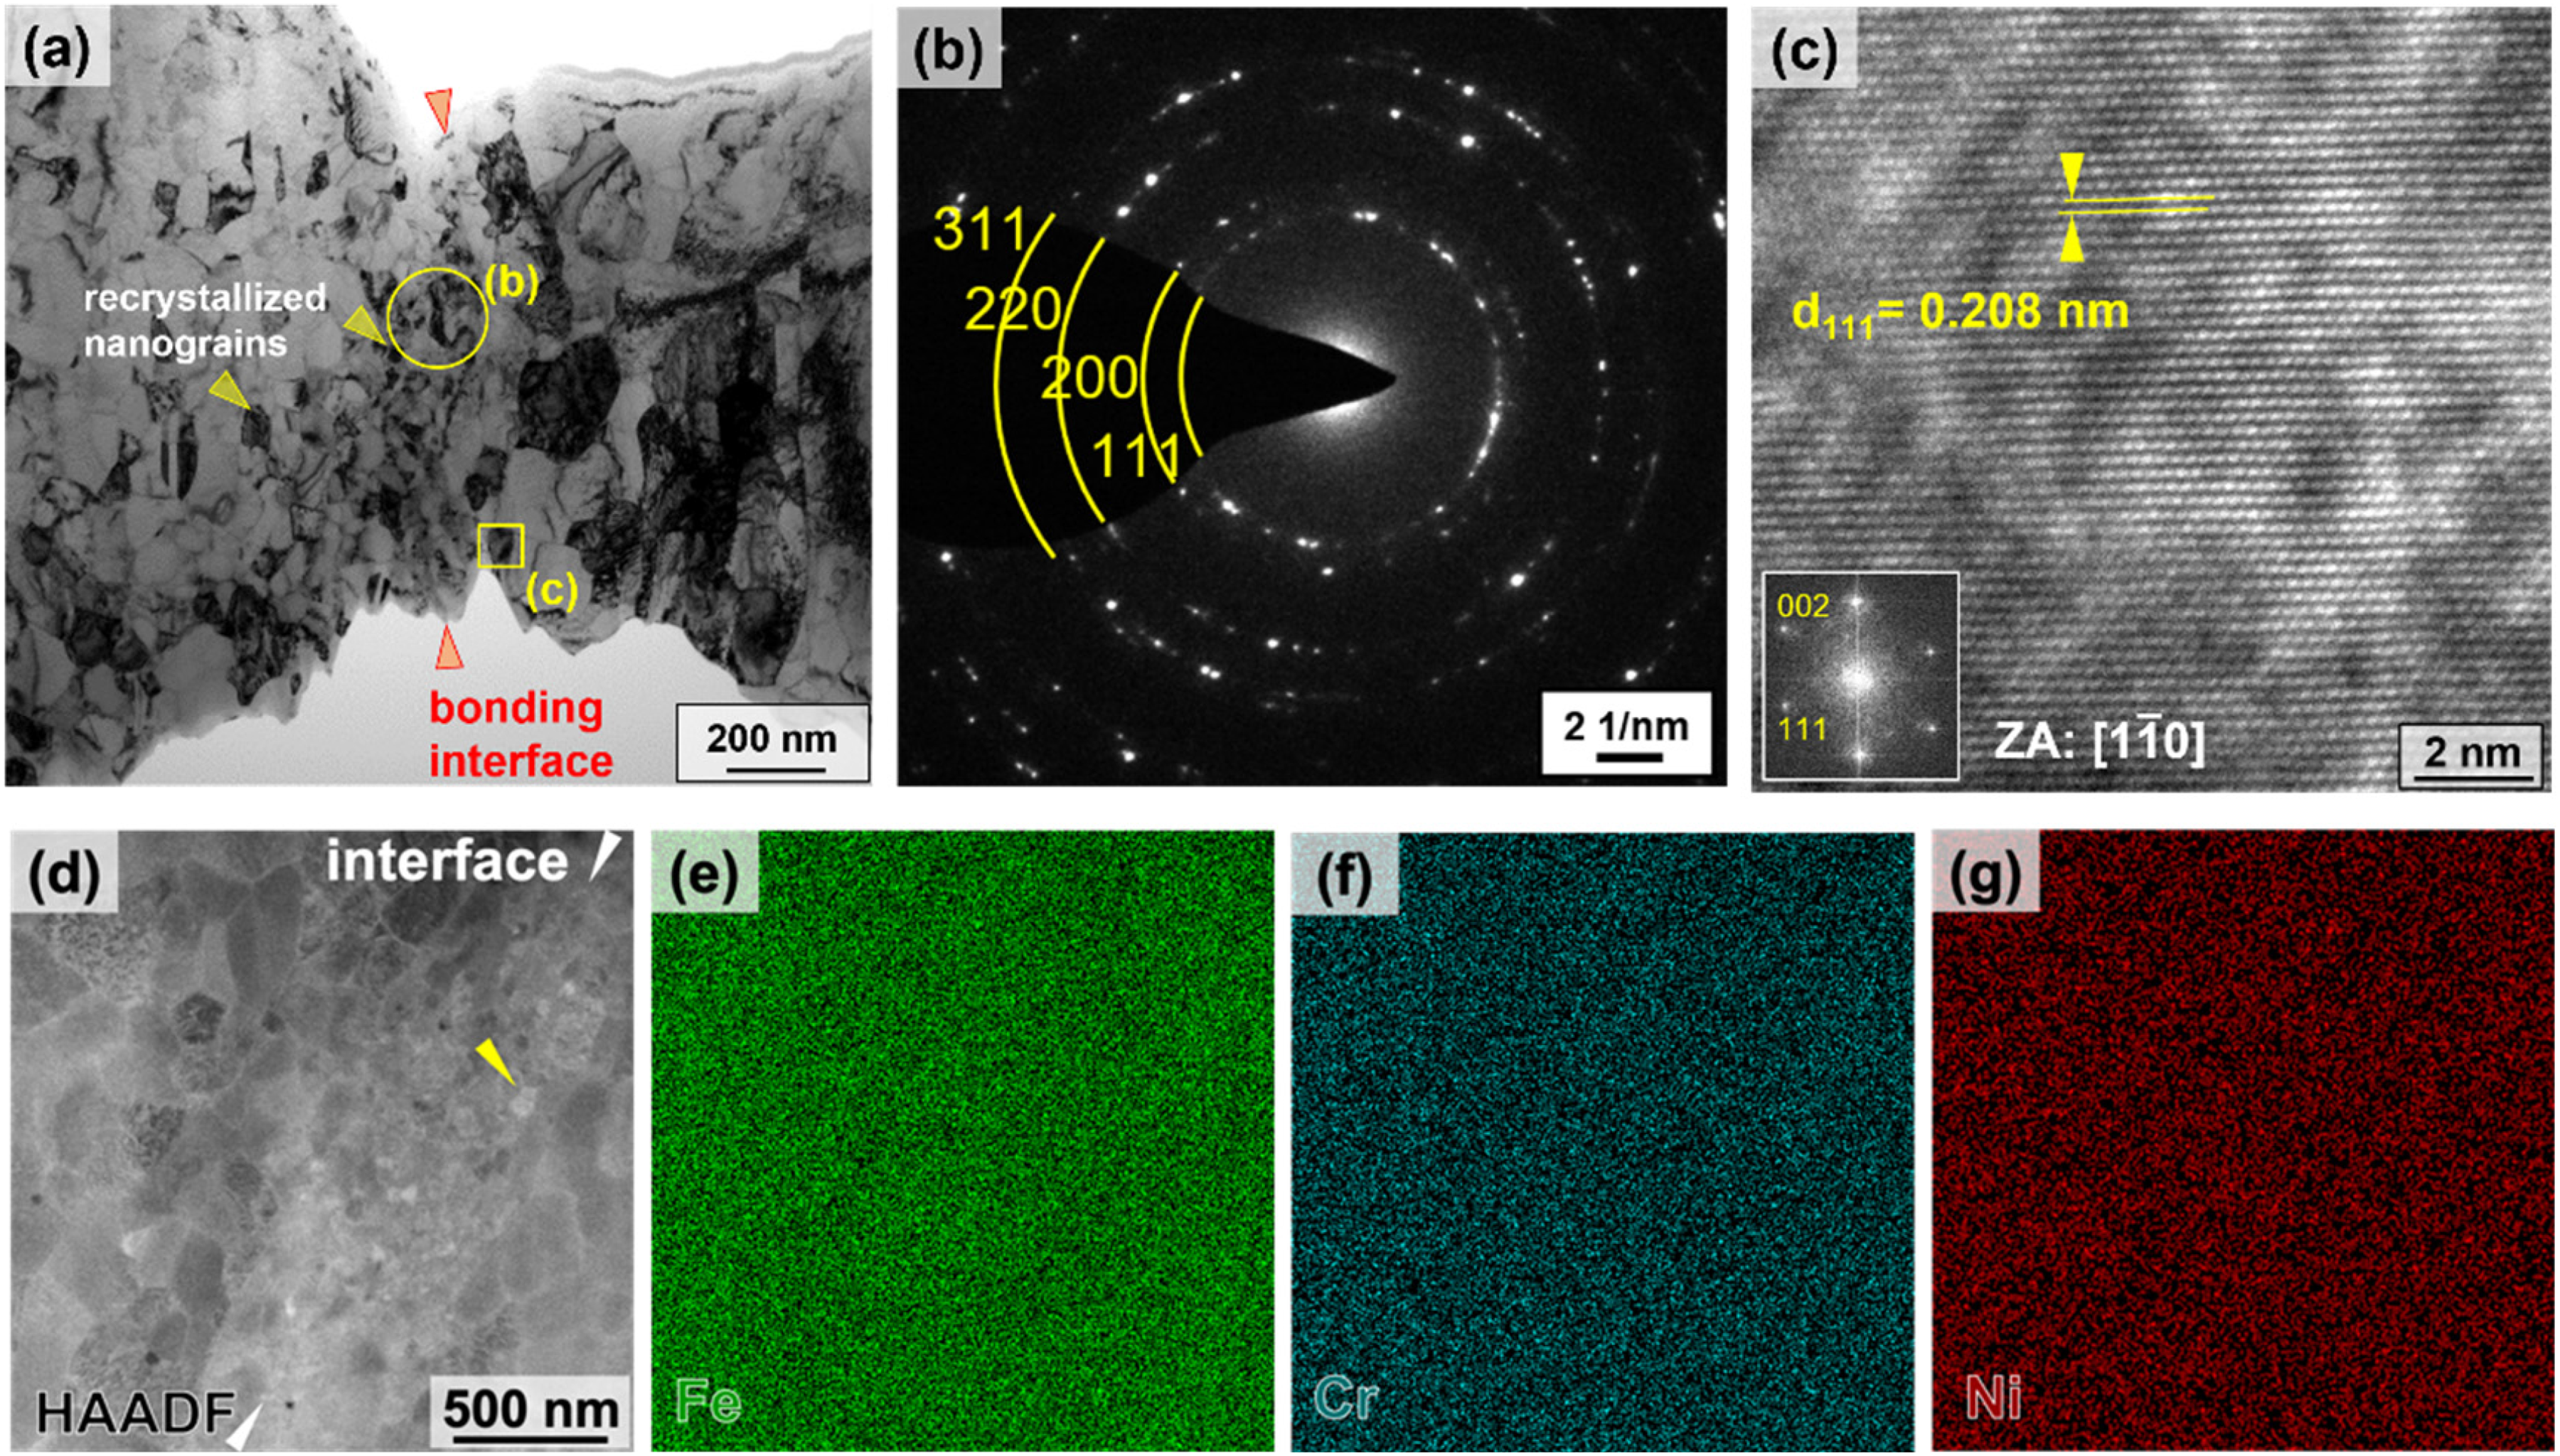
(a) Magnified BF-TEM image at the bonding interface (b) SAD rings and (c) high-resolution TEM micrograph at a recrystallised nanograin, and (d) HAADF-STEM image and corresponding EDS mapping images of (e) Fe (f) Cr (g) Ni.
Figure 4(d) shows high-angle annular dark field (HAADF) scanning TEM image along with corresponding energy dispersive spectrum (EDS) elemental mapping images. It is seen that grains possessed at the interface with a size <200 nm, exhibit a diffraction contrast (see the yellow arrow). EDS mapping images from Figure 4(e) to (g) reveal that no significant elemental segregation was found in these nanograins. The absence of elemental segregation suggests that the formation of a secondary phase, such as the sigma phase that could be detrimental to the mechanical performance, is unlikely to occur during USW. Also, it is noted that sigma phase formation typically occurs at medium temperatures (500 °C to 950 °C) and a longer period (exceeding 30 min). 5 This implies that bonding development during USW might be facilitated by a rapidly increased temperature over a short duration, contributing to the absence of a detrimental secondary phase at the interface.
Figure 5 illustrates the fractured surfaces of 316L sheets after lap-shear tests. These specimens feature the interfacial fracture when the welding time is no longer than 2.0 s. From Figure 5(a), contact areas (indicated by the arrow) with a relatively bright contrast are distributed near the interface. These contact areas were produced from the contact and sliding between SS to undergo bonding development. As welding time increased to more than 1.0 s, the extensive formation of contact areas was revealed (Figure 5(b) and (c)). After 2.0 s of welding (Figure 5(d)), plastic deformation in the bonding areas fractured surface suggested the joint strength increment.
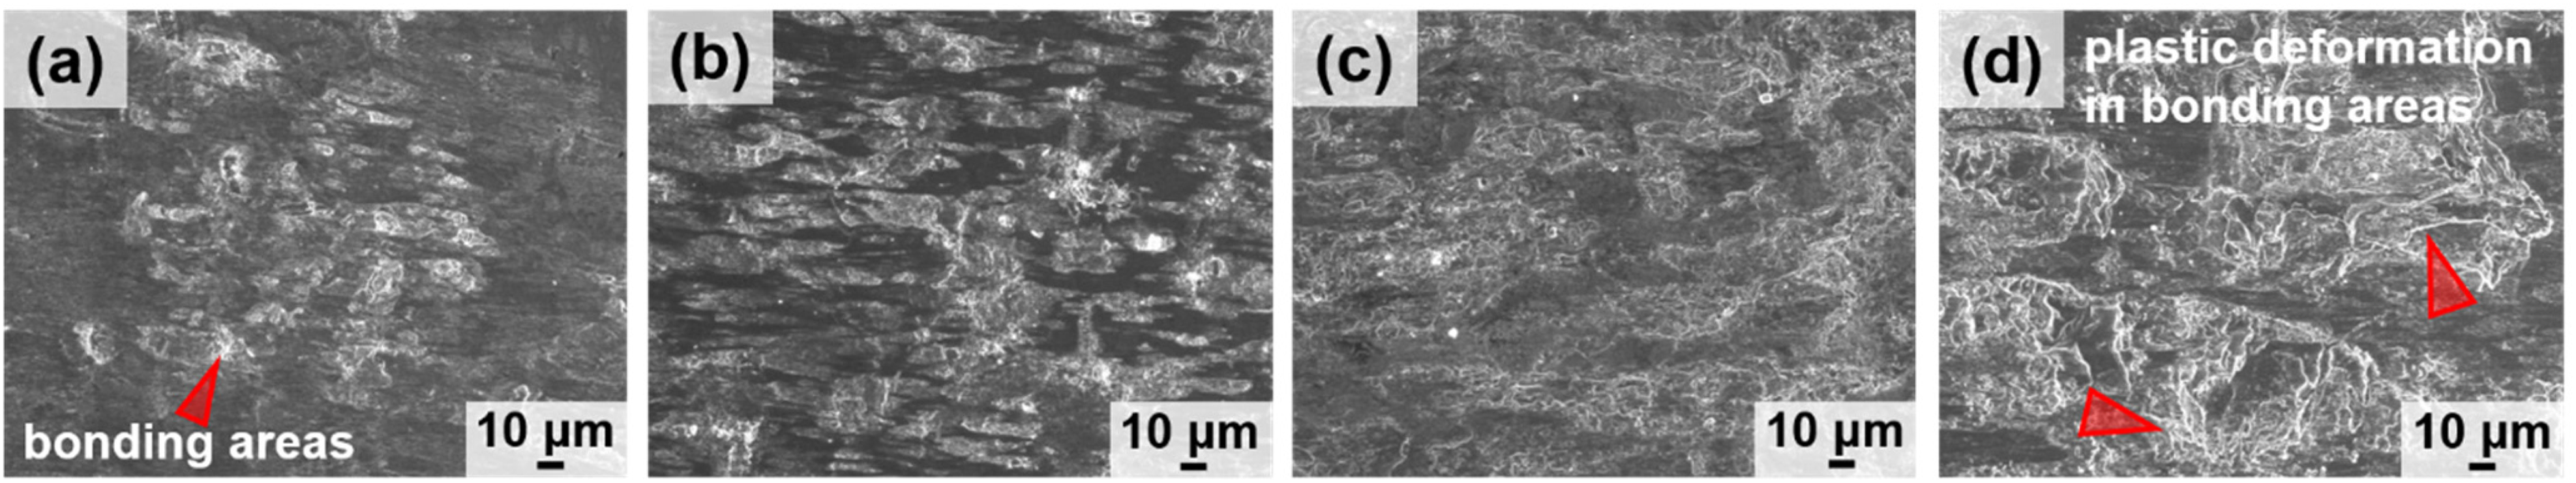
Fractured surfaces for specimens after (a) 0.25 s (b) 0.5 s (c) 1.5 s (d) 2.0 s welding under 3000 N of clamping force.
In addition to the fixed clamping force (3000 N), time-dependence strength evolution was also conducted at a lower clamping force (1500 N; see Figure S1 in Supplementary Materials). It shows that a lower clamping force also caused a slower strength evolution, which can be attributed to a lower fraction of contact formation near the interface (comparing Figure 5 with Supplemental Figure S2). Bond development originates from the formation of contact areas. The interfacial microstructure and welding temperature evolved within contact areas. That is, a more rapid temperature increase is revealed while more contact areas are formed. Once the fraction of contact areas decreased, bond development was limited at those contact areas, thereby inhibiting the strength increment and subsequent temperature increase. 52
Figure 6 shows the strength–temperature relationship of joints, where temperature values were averaged from measuring three specimens with a welding time of 2.5 s. It is seen that the temperature after 0.25 s of welding was above 300 °C and increased steadily (450 °C after 0.5 s and 600 °C after 1.0 s of welding). Regarding the effects of SPD and medium temperature on microstructure and mechanical properties, it is reported that the grain refinement and corresponding strength increment can be obtained from cold rolling and subsequent annealing (600 °C/30 min). 53 Additionally, annealing at a medium temperature (600 °C/1 h) promotes grain nucleation and suppresses grain growth, leading to an ultrafine-grained interface with high strength. 54
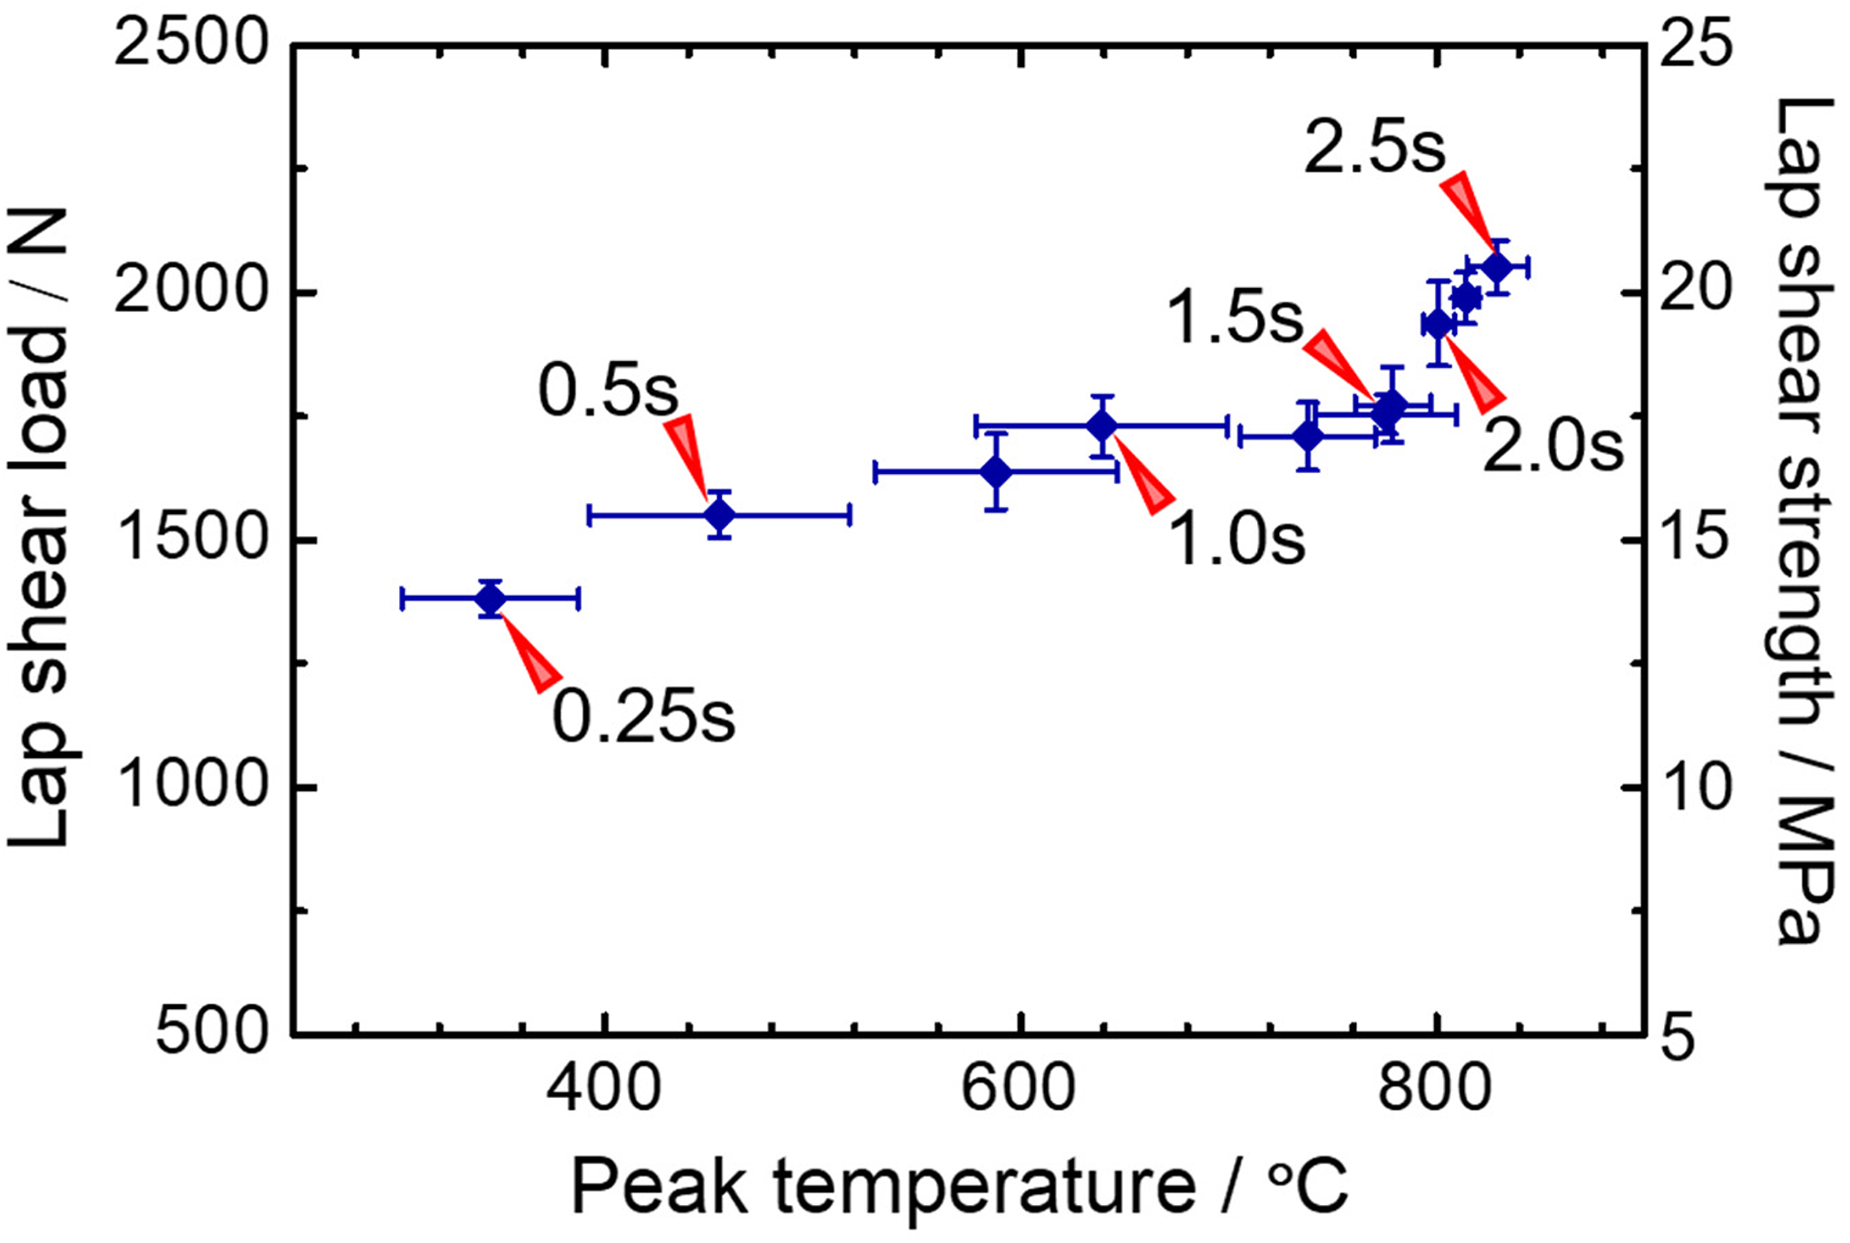
Strength–temperature evolution of 316L/316L joints.
Furthermore, when the temperature reached 750 °C, strength was further evolved. After 2.5 s of welding, the interfacial temperature peaked at 830 °C, accompanied by improved strength. This peak temperature and microstructure (Figure 2) suggested a significant recrystallisation at the interface, similar to the reports in FSW of SS. 55 Additionally, no significant harmful phases (e.g. σ phase or δ-ferrite) were found in interface characterisation. These phases are known to form due to decomposition when austenitic SS is maintained at a medium temperature and a long duration (500 °C to 950 °C/30 min).56–58 Considering the peak temperature and short period of USW, the formation of these harmful phases can be prevented under USW.
As for welding metals having larger thermal conductivity such as aluminium (about 180 W (m·K)−1), the peak temperature could be different with the change of specimen size. 59 Comparatively, SS possesses a far smaller thermal conductivity (about 15 W (m·K)−1). In view of the short thermal cycle of USW (a few seconds), it is considered that the effect of specimen size on peak temperature change could be less significant due to rapid heat input and slower heat dissipation. In general, if USW is applied on welding larger or thicker metals, a higher output or different tool geometry is of importance to effectively transfer the welding energy to the bonding interface.
Figure 7 schematically illustrates the bonding development during USW. At the onset, sliding and plastic flow between 316L sheets led to localised SPD and interlocking to evolve bonding strength (Figure 7(a)) at a lower fraction. The localised SPD behaviour further facilitated the formation of an ultrafine-grained interface (Figure 7(b)). Under intense heat and deformation at the interface, nanograins were nucleated owing to DDRX, contributing to the rapid increase of bonding strength. Meanwhile, grains with LAGBs at a distance away from the interface were produced under CDRX (Figure 7(c)) by an accumulation of dislocations and rotation of dislocation walls. Subsequently, recrystallised grains gradually grew with the disappearance of defects, resulting in an increased bonding strength (Figure 7(d)).
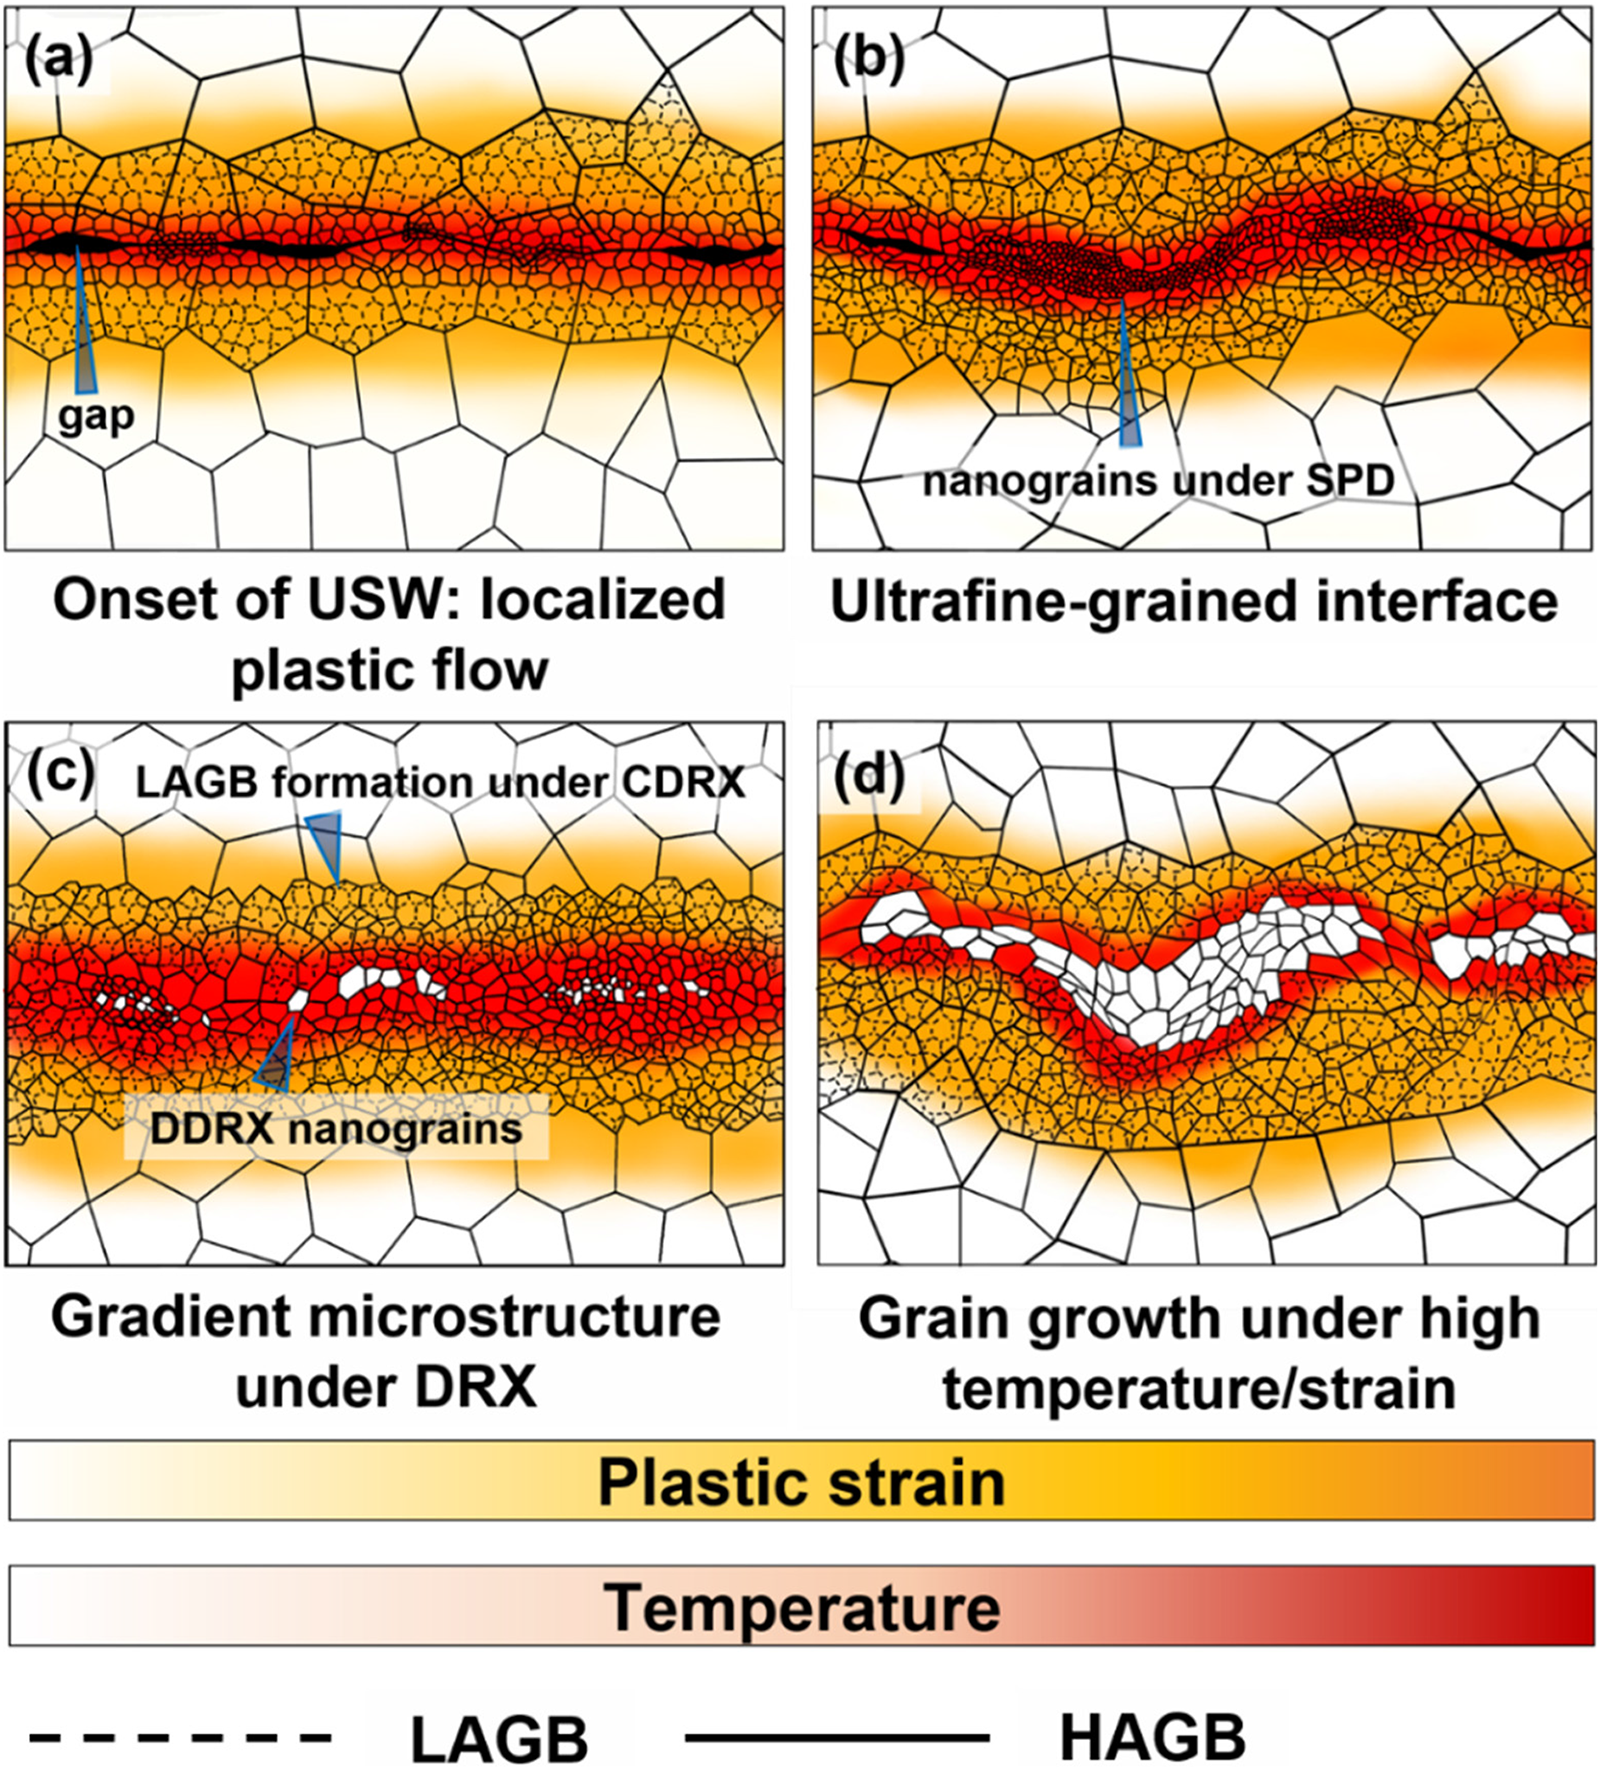
Schematic diagrams illustrating bonding development of 316L/316L interface under the application of ultrasonic welding (USW).
Conclusion
In summary, this study demonstrated the feasibility of producing high-strength joints between hard-to-weld austenitic 316L SS using USW. Bonding was featured by an ultrafine-grained interface with a grain size <100 nm at the bonding interface, where nanograin formation contributes significantly to the bonding strength. This microstructure formation could be attributed to the DRX process driven by mechanical (SPD) and thermal aspects (frictional heat) during USW. The bonding strength was further increased by grain growth induction under longer welding duration and higher temperatures (a peak temperature of 830 °C after 2.5 s welding). Through the concentrated plastic strain and frictional heat induced by USW, a strong bond without the formation of defects and harmful phases may be achieved. In short, this study gained insights into the bonding mechanisms of the USW process and highlighted its potential to produce high-strength joints between metals with high melting temperatures.
Supplemental Material
sj-docx-1-stw-10.1177_13621718231212635 - Supplemental material for Impact of austenite nanograins induced by sliding friction on interfacial strength during ultrasonic welding
Supplemental material, sj-docx-1-stw-10.1177_13621718231212635 for Impact of austenite nanograins induced by sliding friction on interfacial strength during ultrasonic welding by Hue-En Chu, Yi-Hsuan Sun, Tai-Cheng Chen, Hung-Wei Yen and Jhe-Yu Lin in Science and Technology of Welding and Joining
Footnotes
Acknowledgements
The authors thank for the technical support of JSM-7800F Prime and Hitachi IM4000plus from the Instrumentation Center, National Taiwan University. The authors also gratefully acknowledge the use of FIB (EM025200) and TEM (EM000800) of NSTC 112-2740-M-006-001 belonging to the Core Facility Center of National Cheng Kung University.
Author contributions
Hue-En Chu: original draft of manuscript, investigation, and methodology. Yi-Hsuan Sun: result validation, investigation, and visualisation. Tai-Cheng Chen: investigation, result validation, and formal analysis. Hung-Wei Yen: editing & reviewing manuscript and project administration. Jhe-Yu Lin: editing & reviewing manuscript, project administration, and funding acquisition
Declaration of conflicting interests
The authors declared no potential conflicts of interest with respect to the research, authorship, and/or publication of this article.
Funding
The authors disclosed receipt of the following financial support for the research, authorship, and/or publication of this article: The authors deeply appreciate the financial support from the National Science and Technology Council (Grant Nos. NSTC 110-2222-E-027-004-MY2 and NSTC 109-2628-E-002-009-MY3), Taiwan.
Supplemental material
Supplemental material for this article is available online.
References
Supplementary Material
Please find the following supplemental material available below.
For Open Access articles published under a Creative Commons License, all supplemental material carries the same license as the article it is associated with.
For non-Open Access articles published, all supplemental material carries a non-exclusive license, and permission requests for re-use of supplemental material or any part of supplemental material shall be sent directly to the copyright owner as specified in the copyright notice associated with the article.