
Abstract
Second and foreign language (L2) learning boredom has triggered a spate of studies in recent years. Researchers have also developed instruments that tap into this emotion. However, such tools contain many items, may be culture-specific, or have a disputed factor structure. To address these shortcomings, we aimed to develop and validate a short version of the 23-item Boredom in Practical English Classes-Revised (BPELC-R) Scale. A dataset from 1,254 students in degree programs in English from different countries (i.e., Hungary, Iran, Iraq, Poland) was used. Data were split into two groups, and the first sample was used to develop the short-form measure, with principal component analysis (PCA) resulting in a unidimensional model. Through ant-optimization algorithms and traditional item analysis, 10 items were retained that constituted the Short-Form Foreign Language Classroom Boredom Scale (S-FLCBS). Based on data from the second sample, the tool was characterized by acceptable internal consistency reliability, as well as discriminant and convergent validity. The analysis also yielded evidence for measurement invariance with respect to age and gender, with limited invariance found for country.
Keywords
I Introduction
Boredom was first investigated empirically in educational psychology, where it was identified as one of the most frequently and most intensely experienced academic emotions affecting students at different educational levels in relation to a wide variety of school subjects (Pekrun et al., 2014; Tulis & Fulmer, 2013; Tze et al., 2014). This emotion is viewed as an extremely complex phenomenon not only because it has a variety of antecedents (Daschmann et al., 2014), manifests itself in different ways (Goetz et al., 2014), is exhibited with varying levels of intensity, and interacts with other variables (Ally, 2008), but also because it consists of multiple interrelated components, encompassing affective, cognitive, expressive, motivational, and physiological factors (Nett et al., 2010; Pekrun, 2006; Scherer & Moors, 2019). It has also been described as a “silent” emotion whose detrimental effects can be easily overlooked or even ignored (Fahlman, 2009), and which can be erroneously equated with laziness, anxiety, or depression (Macklem, 2015). Irrespective of how exactly boredom is conceptualized and what theoretical lens is employed to account for its pervasive occurrence (see Pawlak, Zawodniak, & Kruk, 2020a; Pawlak, Kruk, & Zawodniak, 2024), there is a consensus that, due to its close affinity to disengagement, dissatisfaction, inattention, and lack of interest (Fahlman, 2009), its impact on learning processes and their outcomes is mostly negative, an assumption that has been confirmed empirically (e.g., Camacho-Morles et al., 2021; Pekrun et al., 2016; Tze et al., 2016).
In view of the potential of boredom to illuminate the causes of success and failure in any endeavor that human beings might undertake, it is not surprising that the construct has attracted the interest of researchers investigating second and foreign language (L2) learning and teaching. Also in this context, an agreed-upon definition of boredom is hard to come by, and the emotion has been characterized, for example, as “a state of disengagement caused by lack of interest and involvement” (Kruk et al., 2021, p. 21) or as “a negative emotion with extremely low degree of activation/arousal that arises from ongoing activities” (Li et al., 2023, p. 235). While boredom was introduced into second language acquisition (SLA) research by Chapman (2013), it was not until several years later that this negative emotion became the focus of more intensive empirical scrutiny spearheaded in the Polish educational context (e.g., Kruk, 2016; Kruk & Zawodniak, 2017, 2018; Pawlak et al., 2020a, 2020, Pawlak, Kruk, Zawodniak, et al., 2020, Pawlak, Kruk, & Zawodniak, 2022). Initially, such research predominantly focused on the causes and manifestations of this negative emotion as experienced by L2 learners as well as, much less frequently, the coping strategies that can be drawn on to prevent or combat it (e.g., Derakhshan et al., 2021, 2022; Nakamura et al., 2021; Pawlak, Derakhshan, et al., 2022). Some of the early studies employed mixed methods to trace changes in the intensity of boredom in single English classes and sequences of such classes, also seeking to uncover the factors that accounted for such fluctuations (e.g., Pawlak, Zawodniak, & Kruk et al., 2020a, Pawlak, Kruk, & Zawodniak, 2022). Another crucial step in the study of boredom involved attempts to reveal the antecedents of this emotion, uncover its factor structure, and develop related measurement tools (e.g., W. Chen et al., 2024; Li et al., 2023; Pawlak, Zawodniak, et al., 2020, Pawlak, Kruk, Zawodniak, & Pasikowski, 2022). The availability of such scales, in turn, has provided an impetus for a flurry of empirical investigations seeking to determine the links between boredom experienced in L2 classroom settings, other emotions, in particular anxiety and enjoyment, as well as an array of individual difference (ID) factors (e.g., mindsets, willingness to communicate, L2 grit, L2 self, engagement) and target language (TL) attainment (e.g., Dewaele & Li, 2021; Dewaele, Botes, & Greiff, 2023; Fathi et al., 2023; Kruk, Pawlak, Taherian, et al., 2023; Lan et al., 2023; Li et al., 2025; Li & Wei, 2023; Pawlak, Kruk, & Zawodniak, et al., 2022; Solhi et al., 2025; Taherian et al., 2024; Zhang et al., 2024; Zhao et al., 2023).
This proliferation of studies testing various complex models in which boredom is included alongside a growing number of variables or L2 learning outcomes inevitably puts in the spotlight vital issues related to the accurate measurement of this negative emotion for the simple reason that the integrity of such models hinges upon the nature and quality of the research instruments used. One such issue is related to the fact that different tools have been developed to tap into boredom in different cultural and educational milieus, reflecting diverse underlying factor structures and thus generating results that are difficult to compare across studies. Another problem pertains to the fact that the two scales that have been drawn upon in the bulk of empirical investigations of boredom—that is, those proposed by Pawlak, Kruk, Zawodniak et al. (2020) and Li et al. (2023), are relatively long, comprising 23 and 32 items, respectively. Considering the fact that such scales are typically employed together with measures of other constructs, such as different ID factors, participants are often expected to complete lengthy questionnaires, which is bound to negatively affect completion rates, increase costs of data collection, make the process of administration a daunting challenge, and ultimately pose considerable threats to reliability and validity (see Dörnyei & Dewaele, 2022; Galesic & Bosnjak, 2009; Heene et al., 2014; Rolstad et al., 2011; Schoeni et al., 2013). Thus, it is fully warranted to develop and validate short forms of existing boredom scales, as has been done for enjoyment (Botes et al., 2021) and anxiety (Botes et al., 2022). In line with this reasoning, Li et al. (2024) have recently developed the short form of Li et al.’s (2023) instrument in the Chinese context. However, this instrument is intended for a very specific cultural and educational setting. With this in mind, the study reported in this paper sought to develop and validate a short version of the Boredom in Practical English Classes-Revised Scale (BPELC-R; Pawlak, Kruk, Zawodniak, et al., 2020). This was the very first instrument proposed to specifically tap into L2 boredom and, while it was created to collect data from English majors in Poland, it has since been employed in other settings (e.g., Hungary, Iran, Turkey) and has the potential to provide insights into this negative emotion in various contexts and at different educational levels.
II Measurement of L2 boredom
Since boredom is a relative newcomer to the field of SLA, it should not come as a surprise that different approaches to its measurement have been adopted. Some empirical investigations (e.g., Csizér et al., 2024; Li, 2021) have opted for a domain-general approach to boredom, relying in particular on the relevant subscale of the Achievement Emotions Questionnaire (AEQ; Pekrun et al., 2011). However, in line with recent trends in SLA research where ID factors such as grit are considered in a domain-specific manner at different levels of granularity (e.g., Pawlak, Fathi, & Kruk, et al., 2024; Teimouri et al., 2022), most scholars have chosen to view boredom in L2 learning as a construct that is distinct from boredom that might be experienced by individuals in other educational settings or walks of life. The early data-collection instruments embracing this view comprised modifications of the 28-item Boredom Proneness Scale (BPS) developed by Farmer and Sundberg (1986) in the field of educational psychology. They include Chapman’s (2013) German Class Boredom Proneness Scale (GCBPS) and Kruk’s (2016) English Classroom Boredom Proneness Scale (ECBPS). The changes involved relatively minor transformations of the original BPS items so that they reflected the context of learning German (GCBPS) and learning English (ECBPS), respectively. A slightly modified version of the ECBPS was subsequently employed in the studies carried out by Kruk and Zawodniak (2017) as well as Pawlak, Zawodniak, and Kruk (2020b). In both cases, the modifications were mostly aimed at further adjusting the items to the context of learning English. While in the former study, the 28-item Boredom in Practical English Language Classes Questionnaire (BPELCQ) was used to uncover the relationship between boredom experienced in practical English classes and general boredom susceptibility, tapped into by means of the BPS, among Polish students majoring in English (N = 174), in the latter the 27-item Boredom in Practical English Language Classes (BPELC) questionnaire was employed to explore differences in the levels of boredom experienced in learning English by 2nd- and 3rd-year Polish students majoring in English (N = 111). It should be noted that internal consistency reliability measured with Cronbach’s alpha was only reported for the ECBPS (α = .76) and its iterations, that is, the BPELCQ (α = .81) and the BPELC (α = .91). Moreover, these tools provided a general picture of boredom, with no attempt being made to delve into the underlying structure of this construct.
In order to shed more light on the antecedents of boredom, Pawlak, Zawodniak, and Kruk (2020b) administered the 27-item BPELCQ (Kruk & Zawodniak, 2017) to 107 Polish university students majoring in English. Following initial analyses and the removal of four items, the data underwent exploratory factor analysis (EFA), which allowed the identification of two factors underlying the occurrence of boredom during practical classes in degree programs in English: (F1) disengagement, monotony, and receptiveness (e.g., “It would be very hard for me to find an exciting task in language classes”), and (F2) lack of satisfaction and challenge (e.g., “I feel that I am working below my abilities most of the time in my language classes”). The resulting instrument was the BPELC-R scale, characterized by high levels of internal consistency, as indicated by the Cronbach’s alpha values: .91 for the entire instrument, .89 for F1, and .89 for F2.
The BPELC-R scale (Pawlak, Kruk, Zawodniak, et al., 2020) has since been successfully employed in other English as a foreign language (EFL) contexts: in Iran (e.g., Kruk et al., 2022) and Turkey (e.g., Coşkun & Yüksel, 2021), with data gathered from 412 and 680 EFL learners, respectively. The Persian version of the scale retained its two-factor structure and revealed a high level of reliability, measured with Cronbach’s alpha and McDonald’s omega, both for the entire tool (α = .87, ω = .88) and its two factors (F1: α = .88, ω = .89; F2: α = .87, ω = .88). In the Turkish context, the BPELC-R scale also retained its two-factor structure, but two items were eliminated, with the resulting instrument, the Boredom in English Language Classes Scale, encompassing 21 items. The Cronbach alpha values were .76, .79, and .74 for the whole scale, F1 and F2, respectively (Coşkun & Yüksel, 2021). Importantly, Kruk, Pawlak, Elahi Shirvan, et al. (2023) revisited the construct validity of BPELC-R through exploratory structural equation modeling (ESEM) using data from 549 Polish students majoring in English. Compared to confirmatory factor analysis (CFA), which failed to provide acceptable fit indices and discriminant validity, ESEM (specifically, bifactor ESEM) offered a better assessment and representation of the construct validity of the BPELC-R scale. Overall, Pawlak, Kruk, Zawodniak, et al.’s (2020) study made an important contribution to our understanding of L2 boredom. This is evident in the fact that several recent studies have employed the BPELC-R scale to examine this negative emotion, often in connection with other variables, in particular ID factors (e.g., Fathi et al., 2023; Kruk et al., 2023; Pawlak, Kruk, Csizér, & Zawodniak, 2024; Pawlak, Zarrinabadi, & Kruk, 2024; Taherian et al., 2024).
An effort to uncover the factorial structure of boredom and to create an instrument to tap into this construct has also been made in the Chinese context. Specifically, using questionnaire and interview data obtained from Chinese undergraduate students, non-English majors, and their teachers, Li et al. (2023) developed the 32-item Foreign Language Learning Boredom Scale (FLLBS), successfully validating the instrument by means of EFA and CFA. Seven factors were identified: (a) foreign language class boredom, (b) underchallenging task boredom, (c) PowerPoint presentation boredom, (d) homework boredom, (e) teacher-dislike boredom, (f) general learning trait boredom, and (g) overchallenging or meaningless task boredom. Li et al. (2023) reported high internal consistency reliability measured with Cronbach’s alpha: .95 for the entire scale, and .94, .91, .85, .90, .84, .90, and .77 for the seven factors, respectively. As is the case with the BPELC-R scale (Pawlak, Kruk, Zawodniak, et al., 2020), the FLLBS has greatly contributed to unraveling the role of boredom in L2 learning. This is because this tool as a whole or some of its subscales have been used in a number of studies focusing on emotions as well as other constructs (e.g., Botes et al., 2024; Dewaele, Botes, & Greiff, 2023; Lan et al., 2023; Li & Wei, 2023; Zhao & Wang, 2025). What is particularly relevant to the focus of the present paper, Li et al. (2024) used data aggregated from previous studies involving secondary school students, non-English majors, as well as expert opinions to develop and validate a short form of the FLLBS. EFA drawing on data from 320 and CFA using data from 3,341 participants offered a basis for the short form of the FLLBS (FLLBS-SF), which comprised 11 items and encompassed three factors: (a) foreign language activity boredom, (b) foreign language classroom boredom, and (c) general learning boredom.
Yet another attempt to develop a tool for tapping into L2 boredom was recently made by Mousavian Rad et al. (2024). Using data from a sample of university students, 139 for EFA and 991 for CFA, they developed and validated the 47-item Precursors of Students’ Boredom in EFL Classes (PSBEC) Scale. They identified 11 factors underlying L2 boredom: (a) teaching practices, (b) excessive class control, (c) inattentive behavior, (d) overchallenge, (e) underchallenge, (f) intrinsic values, (g) extrinsic values, (h) negative affective factors, (i) boredom proneness, (j) classroom-related factors, and (k) curriculum design. The PSBEC scale also demonstrated good convergent validity when measures of foreign language enjoyment and perceived teacher enthusiasm were taken into account, as well as predictive validity when participants’ academic achievement was considered. While the scale might represent another important step forward in disentangling the highly intricate construct of boredom, it has yet to be used more broadly.
Worth mentioning at this juncture is also the pioneering study conducted by Pawlak, Kruk, Zawodniak, and Pasikowski (2022), who investigated boredom experienced by L2 learners outside of educational settings and developed the 21-item Boredom in Learning English Outside of School (BLEOS) questionnaire. EFA, based on the data gathered from 107 Polish students majoring in English, resulted in the identification of three factors underlying after-class boredom: (F1) unwillingness to learn English and inability to find (interesting) tasks; (F2) lack of creativity, focus, and involvement; and (F3) altered perception of time, underused language abilities, and monotony. According to the researchers, these factors reflect the complex nature of boredom in out-of-class situations which, on the one hand, can be triggered by tasks and activities that are closely linked to what transpires in the classroom (e.g., homework, exam preparation) and, on the other hand, can also be induced when learners decide to take steps to improve their mastery of the TL on their own initiative, drawing on the multiple affordances available to them outside the classroom. Pawlak, Kruk, Zawodniak, et al. (2022) reported satisfactory internal consistency reliability for the BLEOS, as indicated by Cronbach’s alpha values of .90 for the entire scale, and .88, .77, and .74 for F1, F2, and F3, respectively. It should be noted that Pawlak, Solhi, et al. (2024) revisited the construct validity of BLEOS by means of ESEM drawing on data from 433 Polish students majoring in English. The study offered evidence for the effectiveness of the bifactor ESEM framework in view of the fact that the model provided strong support for the factorial structure of the BLEOS scale.
III Rationale for the current study and research questions
In view of the proliferation of instruments tapping into ID factors in the field of SLA research and the fact that several tools already exist for measuring L2 boredom, it is warranted to ask why yet another scale needs to be developed for this purpose. One reason for the development of a short version of the 23-item BPELC-R is quite obvious, has been highlighted by researchers who have sought to tackle a similar endeavor (e.g., Botes et al., 2021, 2022; Li et al., 2024), and has also been mentioned in the Introduction to this paper. Specifically, when shorter scales are used, the likelihood of participants actually completing the questionnaire increases, responses are less likely to be haphazard, logistical issues are diminished, and the obtained data have higher reliability and validity (Clark & Watson, 1995; Dörnyei & Dewaele, 2022; Galesic & Bosnjak, 2009; Heene et al., 2014; Rolstad et al., 2011; Schoeni et al., 2013). Thus, it is justified to make an effort to use sound statistical procedures to reduce the number of items included in the BPELC-R scale so that it can be confidently employed in studies where several scales are utilized to tap the variables under investigation.
More importantly perhaps, a question arises why another short form of a boredom scale is needed if one such instrument has been developed and validated by Li et al. (2024). In our view, there are at least four reasons why this undertaking is worthwhile and can in fact be considered necessary. First, the FLLBS-SF was developed based on data from Chinese learners of English and, considering cultural and contextual differences, its utility in other parts of the world such as Europe has yet to be demonstrated. Second, although impressive in size, the dataset in Li et al.’s (2024) study consisted of data from participants who were secondary school learners and university students majoring in subjects other than English. There are grounds to assume that university students majoring in English (but in other foreign languages as well) constitute a distinctive population, not least because they have made a deliberate choice to attain high levels of proficiency in the TL, with important consequences for their motivation, engagement, persistence, and also the emotions they might experience. Third, one of the subfactors of the FLLBS-SF reflecting foreign language activities (micro level) conflates to some extent boredom that learners experience inside and outside of the classroom. Drawing on previous research (e.g., Pawlak, Derakshan, et al., 2022), it is reasonable to assume that while some of the mechanisms underlying this negative emotion are similar in different contexts, after-class boredom is distinct in many ways from in-class boredom, with the effect that a dedicated tool is needed to adequately capture it. Fourth, another subfactor of the FLLBS-SF is believed to encompass general learning boredom (macro level), being akin to some degree to general boredom proneness (Farmer & Sundberg, 1986). Previous research shows, however, that even though the general tendency to succumb to this aversive emotion is positively related to boredom learners experience in L2 classes, the two constructs cannot be equated (e.g., Pawlak, Kruk, Zawodniak, et al., 2020, Pawlak, Kruk, et al., 2022). On the whole, in relation to the last two points, the validation study reported in this paper is based on the assumption that the instruments developed to tap into boredom (but also many other ID factors, including emotions) should be domain-specific (see Li & Yang, 2024; Pawlak, Fathi, & Kruk, 2024).
Based on the rationale presented above, the study aimed to develop a reduced version of the BPELC-R, referred to here as the Short-Form Foreign Language Classroom Boredom Scale (S-FLCBS), to examine its psychometric properties and determine its measurement invariance for different groups. Specifically, the following research questions (RQs) were formulated:
RQ1: What is the factor structure of the S-FLCBS?
RQ2: What are the psychometric properties of the S-FLCBS in terms of measurement model fit, scale reliability, and convergent and discriminant validity evidence?
RQ3: Is the S-FLCBS measurement invariant in relation to gender, age group, and country?
IV Method
1 Participants
The sample consisted of N = 1,254 participants recruited from Poland (n = 550), Iran (n = 241), Hungary (n = 342), and Iraq (n = 121). All of them were enrolled in degree programs in English in the four countries, which aimed to develop a mastery level of the TL to be used successfully in a variety of professional contexts. While there were some inevitable differences in how the programs were structured or the exact requirements needed for successful completion, all of them included an intensive English course typically divided into different modules (e.g., grammar, speaking, writing) as well as a number of content courses that were also taught in English (e.g., linguistics, literature, electives). Participants were recruited through snowball sampling using the authors’ professional contacts, with an aggregate dataset from previous empirical investigations. The sample was predominantly female (n = 903) as is a consistent trend in foreign language learning classes (Chaffee et al., 2020), with n = 349 male participants and n = 2 not providing gender. The average age of participants was 22.23 years (SD = 4.84), with a mean of 11.21 years (SD = 4.23) spent learning English. Their English proficiency oscillated between the B2 and C1 levels according to the Common European Framework of Reference for Languages (Council of Europe, 2001), with the students themselves rating it as intermediate and high, respectively.
2 Instruments
The data employed for the purpose of this study were collected by means of several scales probing into the variables under investigation. All assessments were self-report scales, and all items were measured on a 5-point Likert scale (1 = strongly disagree, 5 = strongly agree). Beyond the BPELC-R, additional self-report measures were included to assess convergent and divergent validity. Basic demographic information was also gathered (e.g., age, sex, nationality). The scales are described below, and the rationale for their inclusion is provided whenever deemed necessary.
1. BPELC-R (α = .890, ω = .896). The original 23-item scale examines boredom in the EFL classroom as a two-dimensional construct (Pawlak, Kruk, Zawodniak, et al., 2020). The first dimension captures disengagement, monotony, and repetitiveness with 14 items (e.g., “I often do not feel like doing anything in English classes”; α = .876, ω = .880). The second dimension captures lack of satisfaction and challenge with nine items (e.g., “I am seldom excited about my English classes”; α = .632, ω = .658). Five items out of the total of 23 were negatively worded (e.g., “I always feel entertained in my English language classes”).
2. L2 Grit Scale (α = .839, ω = .810). The two-factor, nine-item scale developed by Teimouri et al. (2022) was used to examine domain-specific grit within the context of language learning. The two factors were perseverance of effort (five items; e.g., “I am a diligent English language learner”; α = .877, ω = .879) and consistency of interest (four items; e.g., “I think I have lost interest in learning English”; α = .807, ω = .815). Previous research has established a negative relationship between L2 grit and L2 boredom (see Pawlak, Zarrinabadi, et al., 2024), and thus L2 grit was utilized to examine divergent validity.
3. Language Learning Curiosity Scale (α = .796, ω = .796). Curiosity in the EFL class was examined via the two-factor scale created by Mahmoodzadeh and Khajavy (2019). The two factors were language curiosity as a feeling of interest (four items; e.g., “I wonder how well I can speak English when meeting a native English speaker”; α = .703, ω = .752) and language curiosity as a feeling of deprivation (seven items; e.g., “When I have a language question in mind, I cannot rest without knowing the answer”; α = .704, ω = .706). Previous research has confirmed a negative relationship between curiosity and boredom in general education as well as within the context of L2 learning (see Eren & Coskun, 2016; Kruk & Zawodniak, 2018); thus, language learning curiosity was included as a divergent validity measure.
4. Language Learning Enjoyment Scale (α = .871, ω = .879). This unidimensional, eight-item scale was constructed with items extracted from the 21-item Foreign Language Enjoyment Scale (Dewaele & MacIntyre, 2014) and the Achievement Emotions Questionnaire (Pekrun et al., 2011). Previous research has confirmed a negative relationship between L2 boredom and foreign language enjoyment (FLE; see Dewaele, Botes, & Greiff et al., 2023; Li, 2022); therefore, FLE was utilized as a divergent validity measure.
5. Short-Form Foreign Language Anxiety Scale (α = .895, ω = .898). This unidimensional, eight-item measure was developed by MacIntyre (1992) as a short form of the 33-item scale developed by Horwitz et al. (1986). The scale was recently validated by Botes et al. (2022) and includes items such as “Even if I am well prepared for FL class, I feel anxious about it.” Previous research has confirmed a consistent positive association between L2 boredom and foreign language classroom anxiety (FLCA; see Dewaele et al., 2022, Dewaele, Botes, & Greiff, 2023), as such, the measure was used to examine convergent validity.
6. Motivated Behavior Scale (α = .882, ω = .884). This unidimensional, 10-item scale, developed by Taguchi et al. (2009), was utilized to capture motivation to learn EFL, with items such as “I am prepared to expend a lot of effort in learning English.” Previous research has found that more motivated language learners tend to experience less boredom in the L2 classroom (see Kruk, 2016b; Zhao et al., 2023). Therefore, the scale was included as a measure of divergent validity.
English was used in all the questions and scales in view of the high proficiency level of participants. Since the dataset comes from several previous studies, data collection procedures may have differed to some extent but composite questionnaires were administered online in all cases. In all of these investigations, students were requested to sign a consent form, were informed that they could withdraw from the study at any time, and were ensured that their data would only be employed for research purposes.
3 Data analysis
Data analyses followed seven sequential steps, following the criteria specified in Botes et al. (2021, 2022) and Marsh et al. (2005). A flowchart of the steps is provided in Figure 1. The validation steps undertaken in this study were guided by established procedures for short-scale construction and psychometric validation (e.g., Botes et al., 2021, 2022; Marsh et al., 2005).
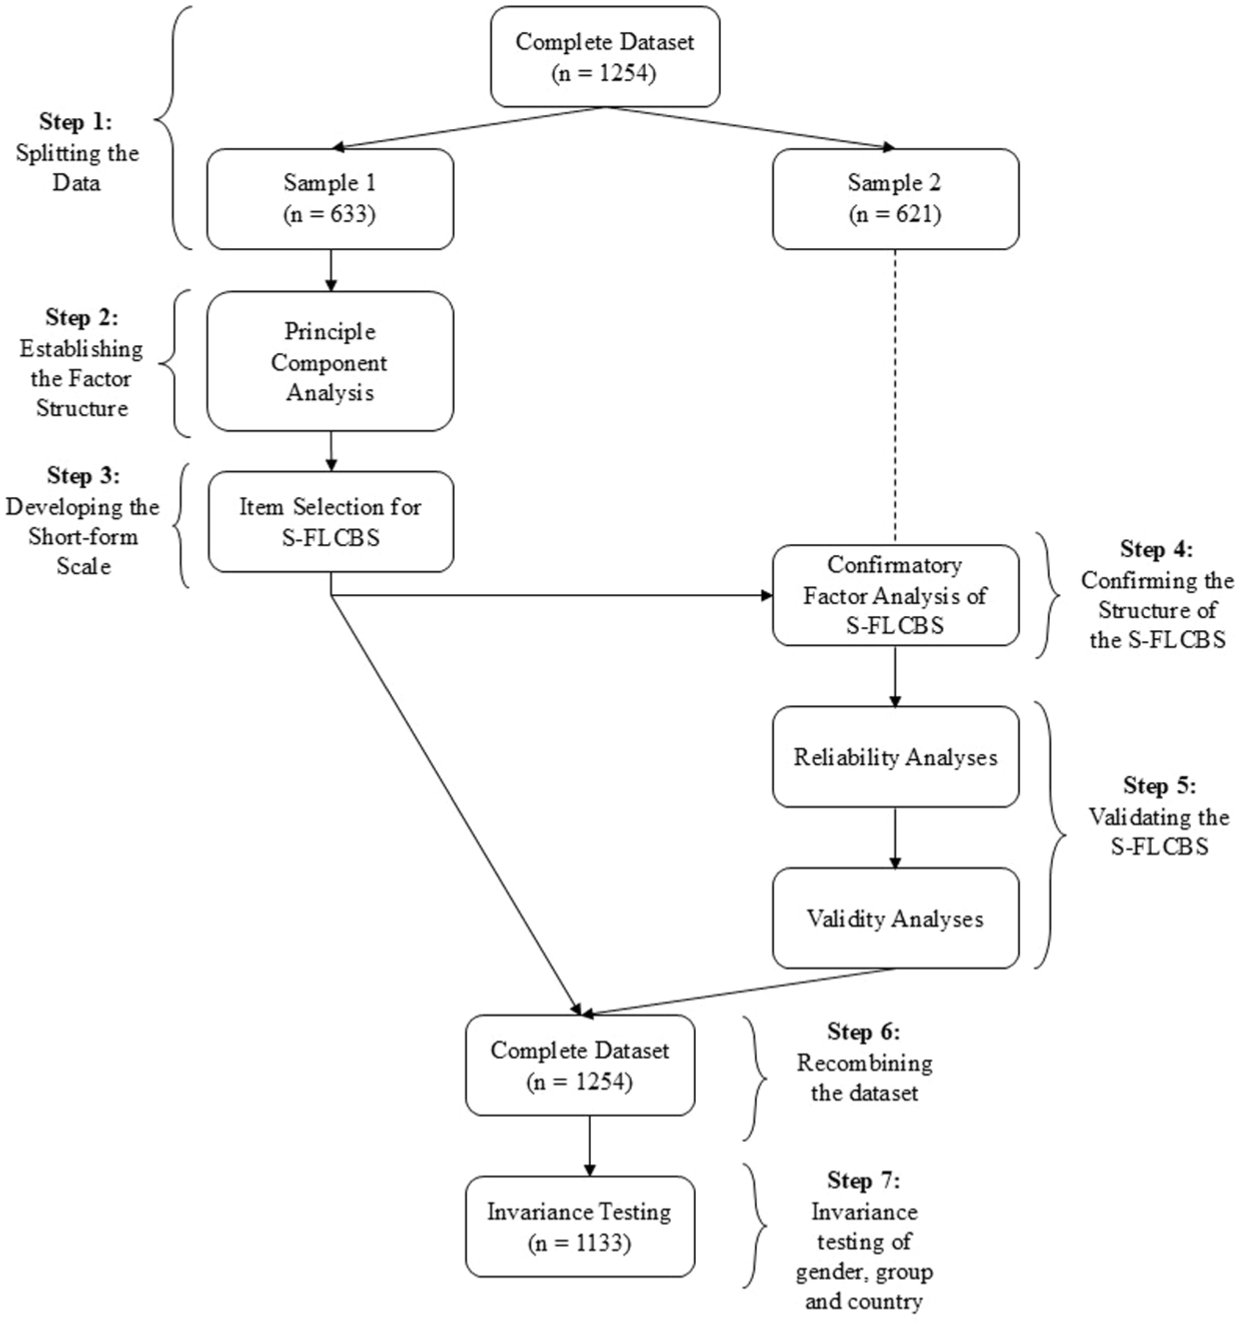
Research methods flowchart.
a Step 1: Splitting the dataset
The dataset was randomly split in two using SPSS Version 28.0.1.1. The first sample was utilized to explore the data and develop the S-FLCBS (PCA and item selection), whereas the second sample was used to confirm the structure, reliability, and validity of the scale, in line with best practice recommendations (see Hagtvet & Sipos, 2016; Marsh et al., 2005). The two datasets were compared using independent-samples t-tests to ensure that no statistically significant differences were present.
b Step 2: Exploring the factor structure
Using SPSS, a PCA was performed using oblique (promax) rotation. Factor selection was performed based on the Kaiser criterion (eigenvalue > 1) and a visual interpretation of the scree plot (Tabachnick & Fidell, 2001). PCA was selected to uncover the factor structure as the extraction method creates a simplified description of data that has been found to be particularly useful in the creation of short-form scales (McGuire et al., 2010). Oblique rotation was selected as underlying factors in the two-dimensional BPELC-R scale were assumed to correlate (Field, 2013). Factor loadings were interpreted as low (< .40), intermediate (.40 to .60), and high (> .60; see Kline, 2014).
c Step 3: Short-form item selection
Individual factors and items were considered on the basis of the PCA conducted in Step 2 using the first sample of the data. The strongest items were selected based on the interitem correlations, factor loadings, and general theory underlying the construct of foreign language boredom (Botes et al., 2021). The manually selected items were further validated by comparing and contrasting them with items chosen on a purely mathematical basis through an ant colony optimization (ACO) algorithm (Olaru et al., 2015). The ACO offers an alternative to the manual selection of items in the development of a scale’s short-form by employing “probabilities to create a set of items that cannot be improved upon in terms of pre-specified criteria” (Botes et al., 2021, p. 864). Thus, the algorithm has the ability to identify items that would lead to the shortest possible route to a close-fitting measurement model (Dörendahl & Greiff, 2020). The “shortform” R package with “MplusAutomation” was used to implement the ACO algorithm (Raborn & Leite, 2018). Furthermore, inconsistencies between the manually selected items and the ACO selected items were resolved by considering the theoretical rationale underlying L2 boredom, item statistics, and psychometric rationale of the S-FLCBS.
d Step 4: Confirming the structure of the short form
Using Sample 2 of the dataset, the structure and items of the measurement model of the S-FLCBS proposed in Step 3 were examined. The measurement model was tested via the “lavaan” package in RStudio (Rosseel, 2012), with maximum likelihood estimation and standard errors. Model fit was determined by the fit indices of the root mean square error of approximation (RMSEA; close fit < .05, reasonable fit < .08), the standardized root mean square residual (SRMR; close fit < .05, reasonable fit < .08), comparative fit index (CFI; close fit > .90, reasonable fit > .95), and Tucker–Lewis index (TLI; close fit > .90, reasonable fit > .95; see Kenny, 2020). Factor loadings, modification indices, and errors were further interpreted to determine fit.
e Step 5: Reliability and validity
Using Sample 2 of the dataset, reliability as well as convergent and divergent validity were examined. Reliability was measured through internal consistency via McDonald’s omega and Cronbach’s alpha. Convergent validity was examined based on positively correlating variables within the known nomological network of L2 boredom. Specifically, FLCA was utilized to confirm convergent validity (see Dewaele, Botes, & Grieff et al., 2023). Divergent validity was examined based on negatively correlating variables within the nomological network, namely, L2 grit (see Pawlak, Zarrinabadi, et al., 2024), language learning curiosity (see Kruk & Zawodniak, 2018), FLE (see Dewaele, Botes, & Meftah, et al., 2023), and motivated behavior (see Zhao et al., 2023). The thresholds suggested by Plonsky and Oswald (2014) were used to interpret the strength of the correlations.
f Step 6: Recombining the dataset
The dataset was recombined (Sample 1 + Sample 2) in order to have the necessary statistical power for invariance testing.
g Step 7: Invariance testing
Utilizing the full dataset, invariance testing was used to examine the generalizability of the newly developed S-FLCBS. Invariance was analyzed across genders, age groups, and countries using the “lavaan” package in RStudio (Rosseel, 2012). Measurement invariance examines the consistency of measures across groups and whether group membership affects the properties of a measure (Meredith, 1993). As such, if a scale is fully invariant, individuals from different groups (e.g., Polish and Iranian participants) who have the same standing on the construct (i.e., FLLB) will also have the same observed score (Millsap, 2011). Measurement invariance was tested using increasingly restrictive models across the different groups. Firstly, the factor structure across groups was examined through configural invariance testing, where all parameters were freely estimated across groups. Secondly, metric invariance was established by stipulating the factor loadings to be invariant across groups. The confirmation of metric invariance implies that participants across different groups respond to items in a similar way, with, for example, male and female participants not differing in their interpretation of an item (Botes et al., 2022). Lastly, scalar invariance was tested by specifying both factor loadings and item intercepts to be equal across groups. A scalar invariant measure implies that direct comparisons of latent means can be made across groups (Meredith, 1993). Invariance was established by comparing each more restrictive model with the previous less restrictive one based on differences in fit indices. Fit index differences were interpreted according to guidelines by Cheung and Rensvold (2002) and F.F. Chen (2007), where ∆CFI ⩽ −.010, ∆RMSEA ⩽ .015, ∆SRMR ⩽ .030 (for metric invariance), and ∆SRMR ⩽ .015 (for scalar invariance) indicate an invariant model.
V Results
1 Step 1: Splitting the dataset
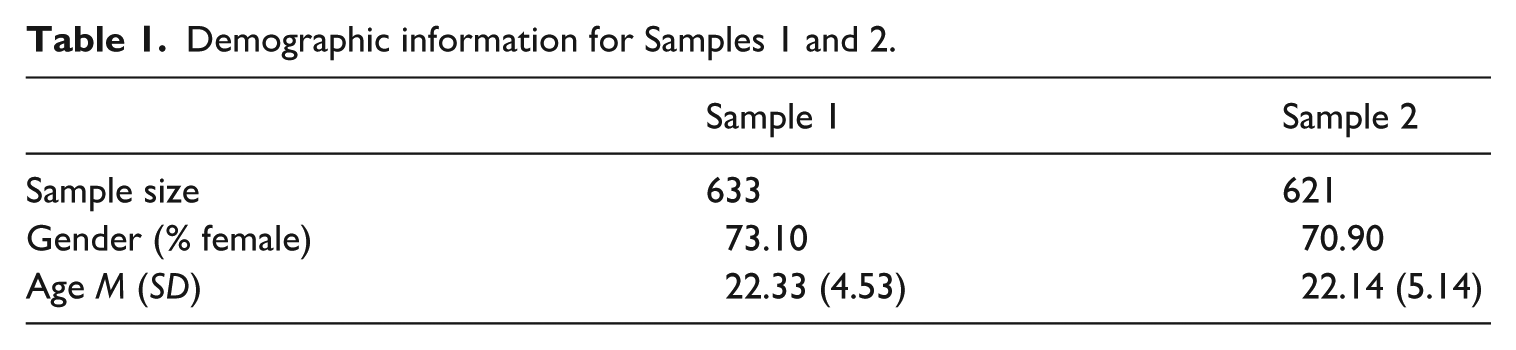
The dataset was randomly split into two samples. Demographic information of Sample 1 and Sample 2 can be found in Table 1. Descriptive statistics for all variables can be found in Table 2. Independent-samples t-tests confirmed that there were no statistically significant differences between Sample 1 and Sample 2.
Demographic information for Samples 1 and 2.
Descriptive statistics.
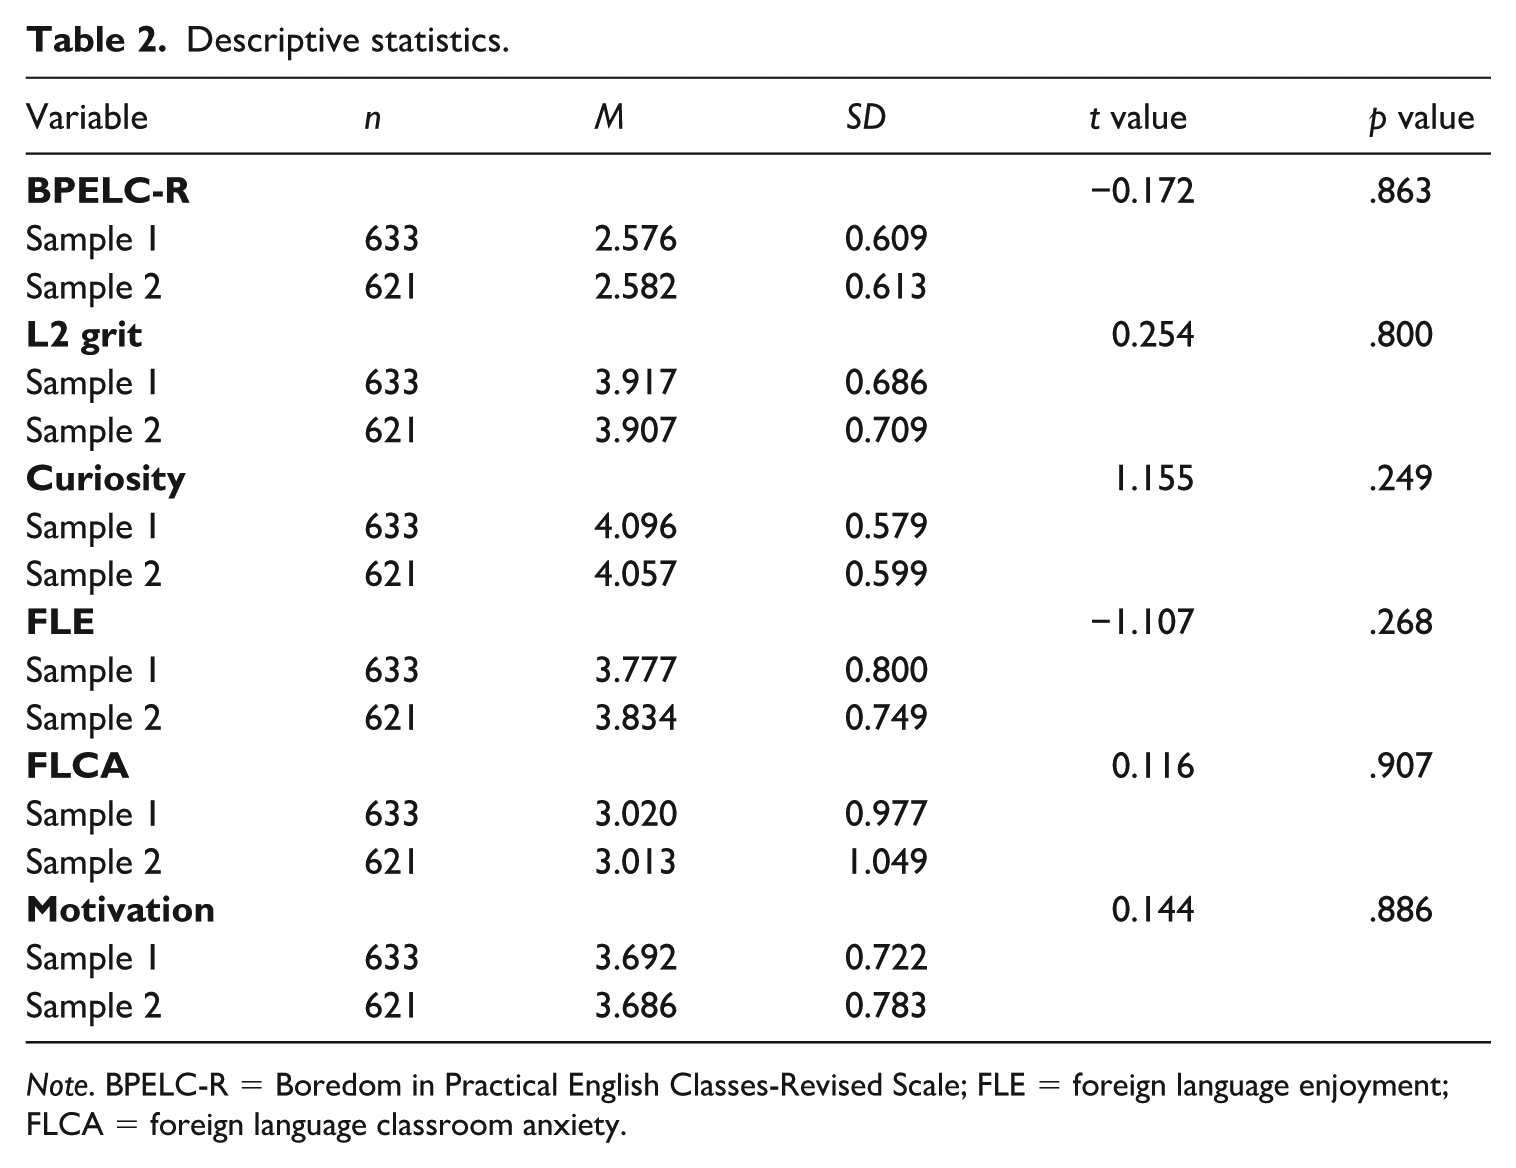
Note. BPELC-R = Boredom in Practical English Classes-Revised Scale; FLE = foreign language enjoyment; FLCA = foreign language classroom anxiety.
2 Step 2: Exploring the factor structure
With Sample 1, the full 23-item BPELC-R scale was examined via PCA. Four items were identified as problematic, namely, Item 7 (“I get a kick out of most things I do in a language class”), Item 9 (“I can usually find something interesting to do in my language classes”), Item 12 (“I would like to have more challenging things to do in my English classes”), and Item 23 (“In situations where I have to wait [e.g., for everyone to finish their task], I get very restless). All four items had nonsignificant or negative correlations with other items in the interitem correlation matrix. The items were removed in order to prevent weak items from unduly influencing the results, and a second PCA was conducted using the remaining 19 items.
Three factors emerged from the PCA (see Table 3). However, all items loaded significantly onto the first factor, with cross-loadings shown by the three reverse-scored items. As reverse-scored items are known to result in atypical responses that may create difficulties in uncovering factor structures (Carlson et al., 2011; Woods, 2006), these additional two factors were disregarded in favor of a unidimensional solution. In addition, the scree plot further suggested a single factor solution (see Figure 2), with the first factor (eigenvalue = 7.15, R2 = .38) showing a clear drop-off and “elbow” structure (Field, 2013).
Principal component analysis of the 19-item BPELC-R with a promax rotation.

Note. *Reverse-scored items. All loadings < .40 are omitted. BPELC-R = Boredom in Practical English Classes-Revised Scale.
1Acceptable loading: .40 to .60; 2high loading: > .60.
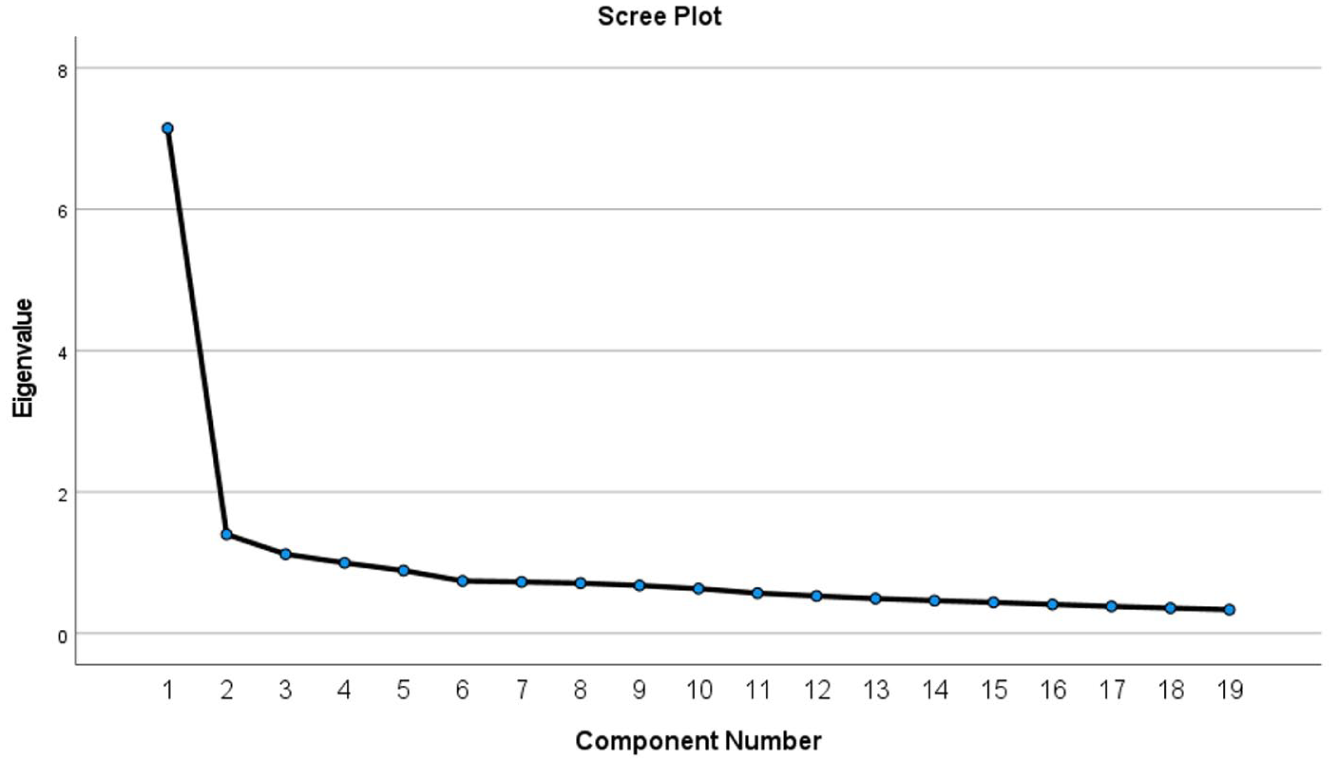
Scree plot.
A unidimensional solution was therefore selected as the factor structure underlying the 19-item BPELC-R. The S-FLCBS was thus constructed as a unidimensional scale as well. The two-factor structure of the original BPELC-R was therefore not supported in the short version of the scale.
3 Step 3: Development of the S-FLCBS
Based on the results of Step 2 with Sample 1, specifically regarding interitem correlations and factor loadings, 10 items were manually selected for the S-FLCBS (see Table 4). All items had moderate to high interitem correlations. 1
10-item S-FLCBS scale.
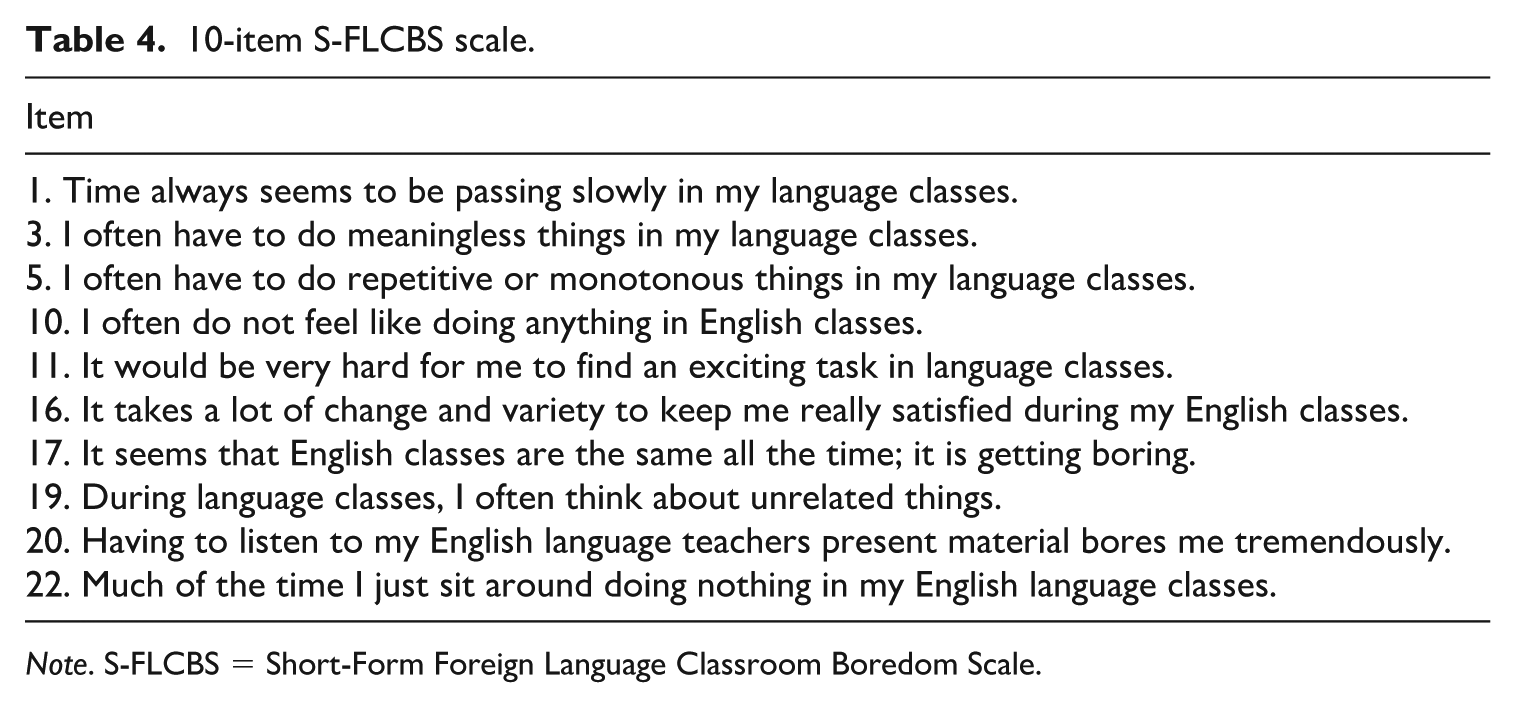
Note. S-FLCBS = Short-Form Foreign Language Classroom Boredom Scale.
Subsequently, the manually selected items were compared to the items selected by the ACO algorithm. The algorithm was set to select 10 items in order to create the best-fitting unidimensional measure of L2 boredom on a purely mathematical basis. The ACO algorithm selected the exact same items as those that were manually selected, with one exception. The algorithm selected Item 6 (“It takes more stimulation to get me going in English classes than most students from my group”) as opposed to the manually selected Item 17 (“It seems that English classes are the same all the time, it is getting boring”). The decision to remove Item 6 and add Item 17 instead was based on theoretical reasoning. First, Item 6 implies a social comparison (“than most students from my group”), which makes responses to this item dependent on the individual classroom context, and therefore should be avoided when aiming for an invariant measure. Item 17 was included because the wording explicitly refers to the construct of interest (“it is getting boring”), which provides the scale with a salient anchor since this item does not rely on second-order operationalization of L2 boredom by addressing the construct of interest directly.
4 Step 4: Confirming the structure of the short form
Using Sample 2, CFA of the measurement model of the proposed S-FLCBS was conducted (see Figure 3). The overall fit statistics indicated close to reasonable fit, χ2(35) = 133.420, p < .001, with CFI (.960) and SRMR (.034) both indicating close fit, whereas RMSEA (.067) and TLI (0.936) indicated reasonable fit (Kenny, 2020). All item loadings were satisfactory. As such, the measurement model proposed in the previous steps using Sample 1 was confirmed in Sample 2.
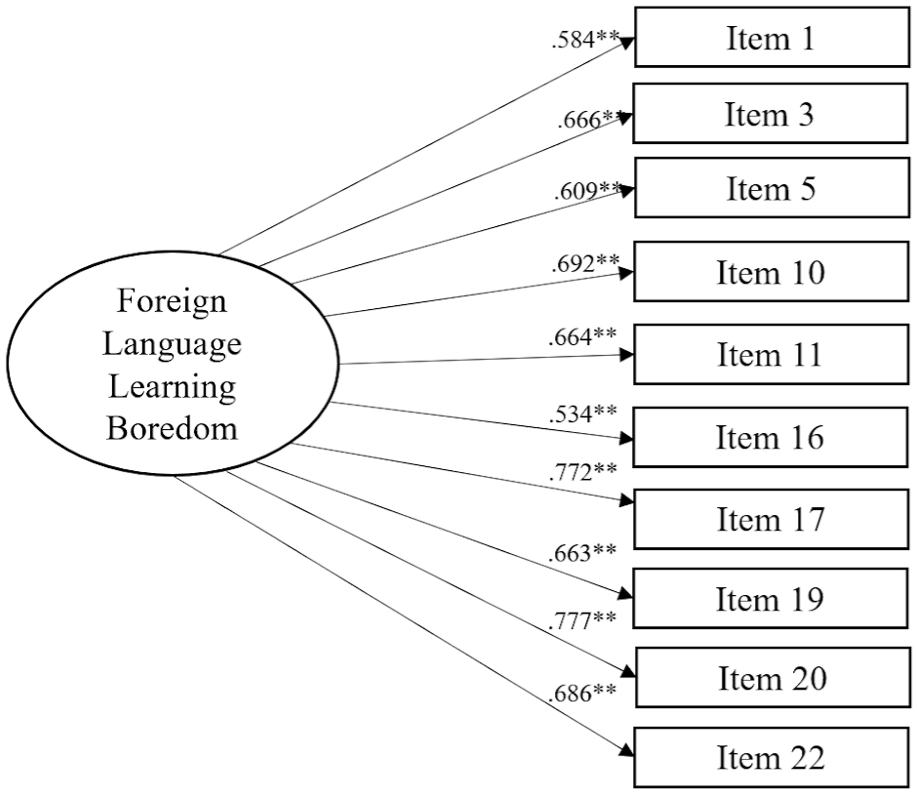
Measurement model.
5 Step 5: Reliability and validity
The internal consistency of the S-FLCBS was found to be acceptable (α = .888; ω = .890). Convergent and divergent validity was confirmed via bivariate correlations with L2 Grit, Language Learning Curiosity, FLE, FLCA, and motivated behaviour (see Table 5). The bivariate correlations between the S-FLCBS and the original 23-item BPELC-R were also examined. Convergent validity was confirmed via the statistically significant relationships between the S-FLCBS and FLCA, as well as the long-form BPELC-R. FLLB, as measured through the newly developed short-form, was positively related to FLCA (r = .211; p < .001 ), as well as very highly positively correlated to the long-form BPELC-R (r = .954; p <.001 ). In turn, divergent validity was confirmed via the statistically significant negative correlations between the S-FLCBS and L2 Grit, Language Learning Curiosity, FLE, and Motivated Behaviour (-.503 ≤ r ≤ -.222; p < .001; see Table 5). We are therefore confident that the S-FLCBS would be an accurate measure of FLLB on the basis of its model fit, reliability, and relationships to other constructs within the known nomological network.
Correlation matrix.
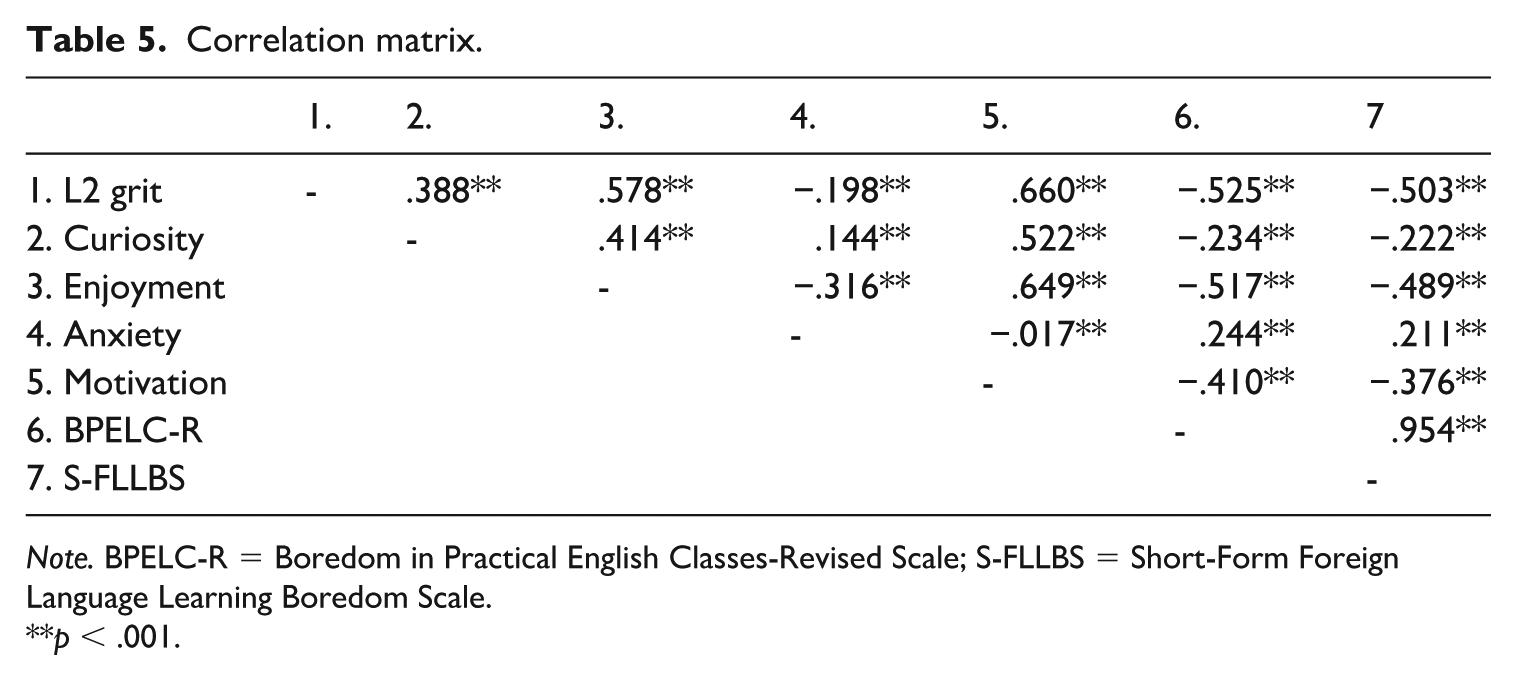
Note. BPELC-R = Boredom in Practical English Classes-Revised Scale; S-FLCBS = Short-Form Foreign Language Learning Boredom Scale.
p < .001.
6 Steps 6 and 7: Recombining the dataset and invariance testing
Multigroup CFA models were used to test invariance across genders, age groups, and countries (see Table 6). Firstly, the S-FLCBS was found to be fully invariant across genders, meeting all necessary cutoffs (i.e., ∆CFI ⩽ −.010, ∆RMSEA ⩽ −.015, ∆SRMR ⩽ −.030). Therefore, male (n = 349) and female (n = 903) participants understood and completed the S-FLCBS in similar ways. Secondly, the S-FLCBS was also found to be fully invariant across the three constructed age groups: teenagers (< 20 years old; n = 285), young adults (20 < x ⩽ 24 years old; n = 834), and adults (⩾ 25 years old; n = 158). Therefore, participants from the three age groups showed invariant factor structures, factor loadings, and item intercepts. Lastly, invariance was examined across participants from three countries: Poland (n = 550), Hungary (n = 342), and Iran (n = 241). 2 Configural invariance (equal factor structures) and metric invariance (equal factor loadings) were supported; however, scalar invariance (equal item intercepts) failed the cutoff guidelines by Cheung and Rensvold (2002) and F.F. Chen (2007; see Table 6). As such, the S-FLCBS meets the requirements for weak measurement invariance (up to metric invariance) but does not show evidence of strong measurement invariance across nationality groups (Meredith, 1993). We therefore conclude that gender and age comparisons can reliably be made with the S-FLCBS; however, cross-country comparisons ought to be approached with caution.
Invariance testing results.
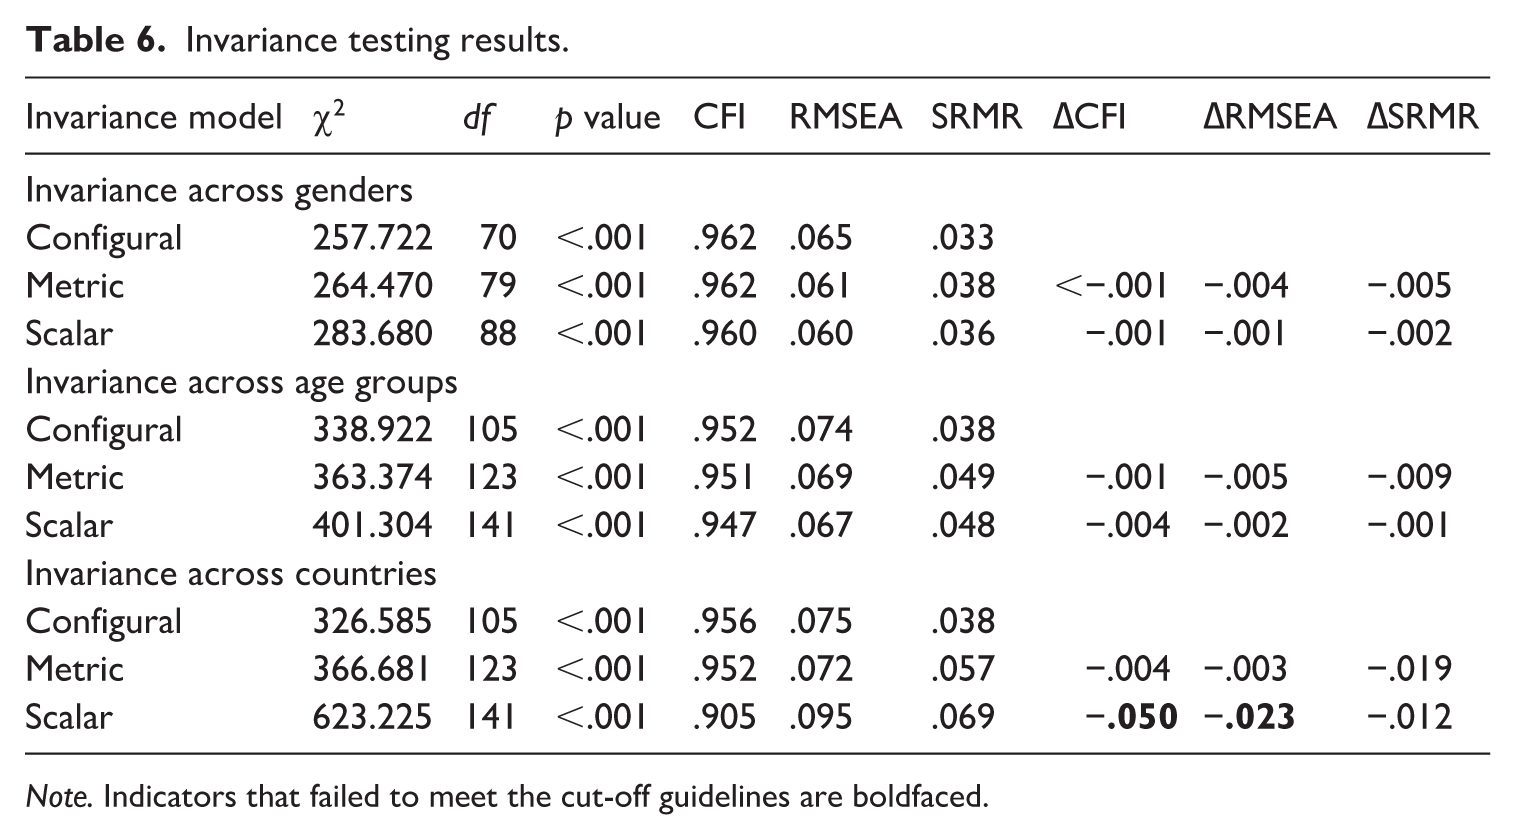
Note. Indicators that failed to meet the cut-off guidelines are boldfaced.
VI Discussion
The present investigation aimed to develop a short version of Pawlak et al.’s (2020) BPELC-R scale, examine the reliability and validity of the tool, and determine whether it is characterized by measurement invariance in terms of gender, age, and nationality. The analyses conducted allowed a considerable reduction in the number of statements included in the initial instrument, allowing the development of the S-FLBCS, comprising a total of 10 items. The psychometric properties of the tool are discussed below, taking as a point of reference the three RQs that guided the study.
When it comes to RQ1, PCA run on one part of the dataset (Sample 1) provided support for a single-factor solution. This structure of L2 boredom is also reflected in the 10-item S-FLCBS and was corroborated through CFA conducted with the other part of the dataset (Sample 2). Results of the PCA as well as the interitem correlation matrix were used to manually select 10 items for inclusion in the S-FLCBS. These manually selected items refer directly to boredom (e.g., Item 17: “It seems that English classes are the same all the time, it is getting boring”) as well as to the experience of being bored (e.g., Item 5: “I do not feel like doing anything in my English classes”). This manual selection of items was further corroborated with the ACO algorithm, with one exception. The ACO algorithm selected Item 6 (“It takes more stimulation to get me going in English classes than most of my group”), whereas we manually selected Item 17 (“It seems that English classes are the same all the time, it is getting boring”). This item was primarily selected on theoretical grounds as it directly referred to boredom and did not include a peer comparison caveat. In addition, it should be noted that none of the items selected were reverse-scored, as the use of reverse-scored items as attention checks is not possible in the S-FLCBS. Although we are confident that the 10 items selected for the S-FLCBS reflect the underlying theory regarding boredom in L2 learning, admittedly, the reduction in the number of items likely reduced the level of depth with which boredom is measured in comparison to the long form of the scale.
Beyond the items selected, the identification of a unidimensional solution to the FLLBS was somewhat unexpected. On the one hand, this is an admittedly surprising finding in view of the fact that previous studies have identified more than one factor underlying the construct under investigation. The most obvious case in point is the BPELC-R (Pawlak, Kruk, Zawodniak, et al., 2020), which constituted a point of departure for the present empirical investigation and which reflects a two-factor structure of boredom that was confirmed in a number of subsequent studies (e.g., Coşkun & Yüksel, 2021; Kruk et al., 2022, 2023). After-class boredom was also found to be multidimensional, as reflected in the BLEOS, which includes three factors (Pawlak, Kruk, Zawodniak, et al., 2022, Pawlak, Solhi, et al., 2024). Other researchers have identified even more factors underlying this negative emotion, as evident in the FLLBS developed by Li et al. (2023) in China, which includes seven subscales, or the PSBEC validated by Mousavian Rad et al. (2024) in the context of Iran, which comprises 11 subscales. Importantly, Li et al.’s (2024) recent SF-FLLBS is also characterized by a three-factor structure even though the tool only consists of 11 items. On the other hand, it could reasonably be argued that there is an overarching higher order dimension of boredom that might trump the individual contribution of the two lower order factors included in the BPELC-R: disengagement, monotony, and receptiveness; and lack of satisfaction and challenge. The importance of this higher order factor may have become more pronounced when the number of items was considerably reduced in the S-FLCBS, all the more so because, in contrast to other instruments (e.g., Li et al., 2024), including the BPELC-R (Pawlak, Kruk, Zawodniak, et al., 2020), the newly developed instrument is only intended to tap into boredom as it is experienced during formal foreign language instruction. This reasoning has some empirical support since recent studies examining different facets of in-class and after-class boredom with state-of-the-art statistical procedures (e.g., Elahi Shirvan et al., 2024; Kruk et al., 2022; Pawlak, Kruk, Csizér, et al., 2023) have demonstrated that the global factor of boredom may play an important role in the measurement theory of this construct, also in relation to other emotions (e.g., foreign language enjoyment).
The reduction in the number of factors from the long-form BPELC-R to the short-form FLCBS needs to be considered by future researchers when selecting a measure of boredom in their studies. Reducing both the factor structure and the number of items inevitably reduces the extent to which boredom is measured (i.e., from a fine-grained two-factor construct to a broader unidimensional one). Researchers are therefore faced with a trade-off. On the one hand, a reduced number of items results in quicker administration and the possibility to include a greater number of constructs in data collection. On the other hand, the complexity level of the construct resulting from the use of the measure is also reduced. This trade-off is not uncommon in the field of psychometrics and is often seen in personality scale development. For example, the International Personality Item Pool has been utilized to develop and validate both the 24-item, six-subfacet measure of conscientiousness (see Maples et al., 2014) and the four-item, unidimensional “mini-measure” of conscientiousness (see Donnellan et al., 2006). Both scales provide a valid and reliable measure of conscientiousness, but the long-form version inevitably provides more fine-grained information, whereas the short form can be quickly and easily administered in complex studies with multiple variables. The choice between long-form and short-form measures therefore needs to be made by researchers depending on the need and design of a particular study: Is it necessary to “zoom in” to examine the construct and understand the intricate complexities of each underlying facet or is it the aim to “zoom out” and examine the construct as a broader measure within a larger nomological network of variables.
In regard to RQ2, which pertained to the psychometric properties of the S-FLCBS, the analyses demonstrated that the instrument has acceptable reliability and validity, which bodes well for its use in future empirical studies. More specifically, Cronbach’s alpha and McDonald’s omega values (α = .888, ω = .890), which, interestingly, were almost identical to those identified for the two factors underpinning the BPELC-R (Pawlak, Kruk, Zawodniak, et al., 2020), indicate satisfactory internal consistency of the newly developed scale. Bivariate correlations also provided convincing evidence for convergent and divergent validity of the S-FLCBS. When it comes to the former, the scale correlated positively (albeit with a small effect size, r = .211) with the FLCAS, which is in line with theoretical assumptions as both boredom and anxiety represent negative emotions. It also largely corroborates previous research findings (e.g., Dewaele, Botes, & Grieff, 2023; Li & Wei, 2023) even if, possibly due to reliance on different data collection instruments, the strength of the correlation was lower in the present study. Even more importantly, the S-FLCBS was strongly related to the BPELC-R (r = .954), which, on the one hand, should hardly come as a surprise given that the former constitutes a reduced form of the latter, and, on the other, clearly indicates that the new scale successfully taps into the negative emotion of boredom. In relation to divergent validity, small-to-medium negative correlations were revealed between the S-FLCBS and variables believed to play a positive role in L2 learning processes and outcomes within the nomological network, that is, in the order of the magnitude of the relationship detected, L2 grit (r = −.503), FLE (r = −.489), language learning curiosity (r = −.376), and motivated learning behavior (r = −.222). Also in this case, the results are comparable to those of previous empirical studies, with the important caveat that different tools may have been used to collect the requisite data and different dimensions of these constructs may have been investigated (e.g., Dewaele, Botes, & Maftah et al., 2023; Kruk, 2016; Li & Wei, 2023; Pawlak, Kruk, Zawodniak, et al., 2022; Zhao et al., 2023). Taken together, the results demonstrate that the S-FLCBS is a valid and reliable research instrument that can be confidently used to tap into the negative emotion of in-class boredom.
Finally, in relation to RQ3, multigroup CFA models calculated for the entire dataset (Samples 1 and 2) confirmed measurement invariance of the S-FLCBS with respect to age (i.e., teenagers vs. young adults vs. adults), gender (i.e., male vs. female participants), and country (i.e., Hungary vs. Iran vs. Poland). One important qualification to these encouraging results is that while the analysis provided necessary evidence for configural (factor structures), metric (factor loadings), and scalar (item intercepts) invariance for age and gender, this was not the case for nationality, where scalar invariance was not supported. Thus, it is possible to claim only weak measurement invariance of the S-FLCBS (Meredith, 1993) when this research instrument is employed to collect data on in-class boredom in different countries. One plausible explanation for this finding could be that boredom is perceived and manifested in somewhat different ways in various cultural and educational contexts, which may affect how the items included in the scale are understood and responded to. Obviously, such a situation does not only apply to measuring boredom and has been observed in relation to other ID factors, such as grammar learning strategies, in which case, numerous items needed to be eliminated in the process of validating the requisite tools (see e.g., Pawlak, Derakshan, et al., 2023). One way or another, these results indicate that caution should be exercised when the S-FLCBS is employed to compare students from diverse national backgrounds with respect to their in-class boredom (perhaps alongside other ID variables). Further research is needed to examine cross-cultural differences in the experience and conceptualization of boredom. In addition, future research utilizing the S-FLCBS with diverse participants needs to examine measurement invariance across groups before embarking on any cross-cultural, group-level comparison studies.
Inevitably, the present study has some limitations that should be acknowledged. First, the level of English proficiency was not taken into account in the analysis and this could potentially have been an important variable when validating the S-FLCBS and also when determining the extent to which it is measurement invariant. However, since participants came from different national contexts and the datasets originated from independent studies, there was no foolproof way of ensuring that information in this regard would be valid and comparable (i.e., different assessment criteria, different scales used to elicit self-perceived proficiency). Second, due to the nature of the dataset, the sample sizes from different countries were not sufficient for the necessary analyses in all cases, which resulted, for example, in the exclusion of the students from Iraq, which could have impacted the results for measurement invariance. Third, again owing to the way the dataset was collated, this study did not include a qualitative component that would have allowed further validation of the scale by, for example, asking students representing different ages, genders, and nationalities to provide their insights on items that should ultimately be retained in the S-FLCBS. Fourth, since the data collected in this study were cross-sectional in nature, no test–retest validity could be determined to ensure the stability of boredom as measured with the S-FLCBS. For this reason, research examining the test–retest reliability of the S-FLCBS with longitudinal data is needed.
VII Conclusion
The empirical investigation reported in the present paper allowed the development and validation of the reduced version of the BPELC-R scale (Pawlak, Kruk, Zawodniak, et al., 2020), that is, the 10-item S-FLCBS, as well as offering evidence for the measurement invariance of boredom in relation to age, gender, and, to some extent, nationality. As a result, researchers embarking on studies into boredom in L2 learning and teaching have at their disposal yet another valid and reliable data collection instrument that they can include in composite questionnaires tapping other emotions and ID factors when complex designs need to be employed. In fact, the S-FLCBS represents a valuable addition to the FLLBS-SF (Li et al., 2024) not only because it is likely to be more suitable in some national and educational settings, but also because it squarely focuses on boredom experienced when learning a foreign language (not only English) in instructional settings. That said, it would be instructive to further validate the scale with students of other nationalities and also to make it more domain-specific by, for example, adjusting it to reflect the experience of boredom when learning specific TL areas (e.g., grammar, reading, writing) as well as specific contexts in which L2 learning and teaching may take place (e.g., computer-assisted, intermediate-level English language learning, etc.). In addition, there are grounds to assume that, thanks to its brevity and the way in which the items are worded, in contrast to the BPELC-R, the utility of the S-FLCBS could extend beyond English majors and thus the instrument could be successfully used with L2 learners in other university programs and at lower educational levels, such as secondary school. These assumptions, however, need to be verified empirically in further studies.