
Abstract
Research on categorisation and boundary work has often focused on how institutional actors draw boundaries between groups of individuals, overlooking how individuals informally contest or reinforce these boundaries and categories. In this article, we make the case for new interactive qualitative data collection strategies to inductively explore social categorisation and boundary-making processes within personal networks, bringing together the potential of visualisation and personal network research. We introduce an innovative methodological procedure for in-depth interviewing that consists of asking participants to report on specific network members while using two novel interactive visual tools displayed on electronic devices. By discussing examples from our research, we illustrate the method’s potential in the data collection and analysis stages and highlight the technical, methodological, and conceptual contributions it can make to the study of social boundaries.
Introduction
Social boundaries, the distinctions drawn between groups of individuals, are continuously constructed and negotiated (Tilly, 2004). Most research on categorisation and boundary work has focused on how institutions draw boundaries ‘from above’, overlooking how individuals informally contest or reinforce these boundaries and categories ‘from below’ (Scuzzarello and Moroşanu, 2023). But how can we reveal individuals’ interpretations of the interaction between the processes of categorisation and boundary-drawing ‘from above’ and ‘from below’? Following Wimmer’s (2009) suggestion of studying how networks influence the formation of boundaries and drawing upon the literature that highlights the potential of visual instruments for qualitative social network research (Bellotti, 2016; D’Angelo et al., 2016; Tubaro et al., 2016), we introduce a novel methodological procedure for in-depth interviewing that enhances the inductive collection of qualitative evidence on the processes of categorisation and boundary-drawing within participants’ personal networks. The procedure consists of asking participants to report on specific social relationships while using two innovative interactive visual tools displayed on electronic devices. The instruments’ main aim is not primarily to collect visual data but to provide cognitive cues and stimulate deeper narration and reflection among participants while, at the same time, reducing the mental burden for participants.
This article presents a novel method and highlights its implications for future research on social boundaries by demonstrating its technical, methodological, and conceptual contributions. First, technically, the tools are sophisticated yet simple and user-friendly, thus participants can easily understand and use them. Moreover, being computer-based, the method allows the record of the process of how participants (re)locate network members (i.e. alters) rather than only collecting their final positions. Second, methodologically, the tools enable participants to discuss social boundaries within their networks in a grounded way, which would be difficult using other techniques that address the issue in abstract terms. They also act as a trigger for narration and reflection among informants and provide enough flexibility to be used in creative ways. This facilitates the collection of ‘palpable’ data (Small and Calarco, 2022), that is, concrete evidence, and enables interviewers to follow up on issues that arise during the research encounter. Third, we show how this methodological approach can make a conceptual contribution to the literature on boundary work because it helps to unveil the interaction of formal and informal boundary-drawing as perceived by participants, responding to Scuzzarello and Moroşanu’s (2023) call to study boundary work ‘from above’ and ‘from below’ in tandem. The method also facilitates revealing the role intersectionality plays in how social categories are understood and applied by individuals in their daily social interactions.
The article starts by addressing the need for new methodological approaches to study boundary formation inductively using Social Network Analysis (SNA), to then offer a brief overview of the use of visualisation in social network data collection and analysis and its advantages. After presenting the two visual tools, we illustrate their use and methodological potential by showing how they were applied within the context of a larger study in Barcelona (Spain). We conclude with some final remarks on how our method can contribute to the future study of social boundaries, and how it could be further developed in coming research.
New methodological approaches for studying boundary-making inductively
Social boundaries separate people into ‘us’ and ‘them’ (Tilly, 2004), functioning through two interrelated dimensions: the categorical dimension divides the social world into social groups through acts of social classification and collective representation, while the social or behavioural dimension dictates how to interact with individuals classified as ‘us’ and ‘them’ under given circumstances (Wimmer, 2008). Focusing on ethnic boundaries, Barth (1969) claims that the critical feature defining ethnic groups is the interaction between self-ascription and ascription by others, that is, members of an ethnic group being recognised as insiders by the in-group, and as outsiders by the out-group. According to Barth, individuals subjectively establish boundaries defining members of their ethnic group in opposition to those of other groups.
The notion of social boundaries is also closely related to that of social categories. Social boundaries create insider-outsider categories that emerge from social interaction across boundaries (Zelizer and Tilly, 2006). Occasionally, social categories are contested as individuals differ on which are the most important and meaningful; for instance, Wimmer (2009) highlights that some higher-level categories may be significant for politics yet not for the organisation of everyday life. Monk (2022) argues that state categories are nominal, superordinate, and reductionist social identities imposed on individuals even when they disagree with them. Monk criticises the use of state categories as categories of analysis with little reflection on how categorisation actually works in daily life and pleads for using an inductive approach to category membership that does not ignore social groups’ internal heterogeneity. Similarly, Scuzzarello and Moroşanu (2023) stress the need to acknowledge that boundary work occurs in multiple directions. On the one hand, institutional actors (e.g. states, policymakers, media, and international bodies) create policies and public narratives that produce rigid social categories, constructing social groups and social hierarchies. This constitutes what they call boundary-drawing ‘from above’, which tends to disregard intra-group differences. On the other hand, individuals also negotiate boundaries informally ‘from below’, reproducing, contesting, and creating new boundaries, as they are ‘not simply recipients but also producers of categorization and protagonists of boundary work’ (Scuzzarello and Moroşanu, 2023: 9). While most research on boundary work studies these processes only ‘from above’, the authors argue for the need to integrate the study of boundary-drawing ‘from above’ and ‘from below’ using an intersectional approach.
Following Scuzzarello and Moroşanu’s (2023) call, we aim to address the need for new methodological approaches to inductively capture the interaction of boundary work ‘from above’ and ‘from below’ as perceived, reproduced, and contested by individuals in their everyday lives. As argued by Lamont and Molnár (2002), the notion of boundaries is inherently embedded in the social processes of relationality. Relational work, ‘the effort of establishing, terminating, negotiating, and transforming interpersonal relations’, creates social boundaries and relations within and across boundaries (Zelizer and Tilly, 2006: 3). While the diversity and topology of social networks influence boundary processes (Pachucki et al., 2007), in turn, social boundaries may affect the structure of social networks (Fuhse, 2022); therefore, boundaries and social networks influence each other.
Consequently, we argue that social network methodology can contribute to the study of how individuals interpret boundary formation and shifting. Addressing these cognitive processes by using SNA, we aim to go beyond generalisations to study actual relations, to explore ‘how attitudes translate into practices’ (Moroşanu, 2024, personal communication). Following Lamont and Molnár’s (2002) suggestion, we claim that these relational processes are better studied with an open, inductive approach. Therefore, we have developed a methodological strategy that combines the use of network data, innovative interactive visual tools, and the ‘unspecific stimulus’ (Hollstein et al., 2020: 227) of the vague concepts of similarity and social status, without presenting participants with predetermined fixed categories. We argue that the interactive visual strategies employed allow us to inductively observe the interaction of social categorisation and boundary-drawing ‘from above’ and ‘from below’ within the networks of participants. Moreover, the instruments’ flexibility facilitates the use of intersectionality, enabling researchers to uncover how power dynamics and individuals’ positionality within a social hierarchy dictate the specific boundary-making strategies available to them.
Visualisation in SNA
Visualisation has been part of the field of SNA since its beginning, with the use of the sociogram by Moreno (1934). Since then, visual interfaces have been employed in a wide variety of fields of study to analyse both whole and personal networks. While most network research uses visualisations only at the analysis phase, visual tools, such as the well-known circle diagram of Kahn and Antonucci (1980), have long been used to support data collection in qualitative network analysis. More recently, other visual instruments including network visualisations, maps, charts, and free drawing have been employed to collect network data (Hollstein et al., 2020). Most network research that collects data using visualisations does so to elicit alters, whereas fewer studies elicit ties with other methods and then arrange them employing visual tools to gather information on alter-alter ties (Hogan et al., 2007; Kuhns et al., 2015). While ‘low tech’ visual instruments (e.g. paper and pencil) have mostly been used traditionally, specialised software to gather visual data has lately become more popular.
Visual instruments are useful to support network research at the data-gathering and analysis stages and to improve the communicability of results (D’Angelo et al., 2016). Network data collection can be arduous for respondents, yet visual prompts have several advantages that facilitate data-gathering. Visualisation enables both informants and researchers to see concrete representations of what they are discussing (Hogan et al., 2007), constituting ‘narration stimuli’ (Hollstein et al., 2020) that trigger reflection and discussion among participants (Dobbie et al., 2017) because the result of its use may surprise them, ‘depicting their social connections in a new way, revealing things they have not expected’ (Ryan et al., 2014: 7). Moreover, presenting participants with an image of their social world shifts their position from being observed to becoming observers, allowing them to gain new insights about themselves (Bellotti, 2016; Molina et al., 2014). Visualisation also provides cognitive support, since the simultaneous visual representation of alters can serve as a cognitive aid to keep the participants’ attention and facilitate focusing on specific alters, encouraging comparisons among them (Hollstein et al., 2020). Overall, visualisation enables collecting new and richer data that cannot be obtained using other methodological tools. However, visualisations should not be considered a neutral instrument for network data-gathering, as they may influence participants’ perception and reporting of their relationships (Bellotti, 2016; Ryan et al., 2014). Indeed, as noted by D’Angelo and Ryan (2021) personal networks are filtered through the presentation of the ‘networked self’ depending partly on how participants understand the research aims.
In the analysis stage, the combination of narratives and visualisations allows for a deeper insight into how participants give meaning to their relationships by examining how they ‘constructed their social relations through talk and images’ (Ryan et al., 2014: 1). Visualisation also facilitates both interpersonal comparisons between different participants and intrapersonal comparisons of alters (Hollstein et al., 2020). Moreover, at the level of data interpretation, the combination of qualitative interviews with SNA and visualisations can promote ‘the observation of emerging themes that were not explicitly addressed in the data collections’ (Bellotti, 2016: 15). The combined use of colours, shapes, positions, and labels also assists the simultaneous assessment of a large volume of information and thus the identification of visual typologies and patterns in the data, contributing to the development of new insights about the social phenomena studied (Molina et al., 2014).
Two new interactive visual tools
We start this section by introducing two research questions concerning the visual tools’ potential, which will be addressed through the article: (1) at the data collection stage, how does our inductive approach facilitate eliciting palpable data and enhance opportunities for following up on emerging themes? and (2) at the analysis stage, how do the combined visual and narrative data aid the understanding of boundary-drawing within personal networks?
With these questions in mind, we now present the two visual instruments. The two tools presented were developed specifically for this project. They are based on simple diagrams displayed on electronic devices, one representing the (dis)similarity between several alters and the participant, and the other representing the relative social status of both the participant and these alters. They are ego-centred instruments designed to be used within an in-depth qualitative interview; they are computer-based – using PowerPoint – and interactive, prepared in the lab but transformed in the field by the participants. The tools are structured but unstandardised; that is, they contain elements that guide the data collection process without the rigidity of standardised tools, thus allowing greater flexibility (Hollstein et al., 2020). Most importantly, they are designed to act as ‘narration stimuli’ to generate discussion among participants (Hollstein et al., 2020).
Because the instruments are not designed to elicit a list of alters but to arrange an already pre-defined set of network ties, it is necessary to previously generate a list of alters, either during the same or a previous encounter, by using open-ended or structured questions. We recommend selecting between six and 10 alters to guarantee sufficient diversity among them yet avoiding a too cognitively demanding task for participants. The number of alters selected and the specific selection strategy might impact the data collected. Therefore, scholars wishing to apply this method should choose their approach in line with their research objectives. Different strategies to select ties could be employed. For instance, researchers could make the selection based on variables that are of interest to their research or allow participants to choose the alters by giving them instructions based on the study’s aim.
Once the alters have been selected, participants are instructed to locate them in the diagrams and to explain why they placed them in specific positions. By recording the computer screen throughout the exercises, data of the whole dynamic process of alter (re)location are obtained, as opposed to only collecting the final alter positions on the diagrams.
Similarity scale
The first visual tool developed is a one-dimensional scale representing similarity between the participant and the selected alters (Figure 1). Participants are told that the human figure on the left represents themselves, and therefore, the scale’s left side represents similarity to themselves, while the right side represents difference from themselves. Then, they are instructed to place the selected alters on the scale according to how similar or different these social contacts are from themselves while explaining the reasoning behind their placement decisions. This exercise is designed to stimulate participants’ narratives around what makes their ties (un)like them, providing rich oral insights into the different types of social boundaries they (do not) draw within their networks and the most salient categories they use to classify their ties.
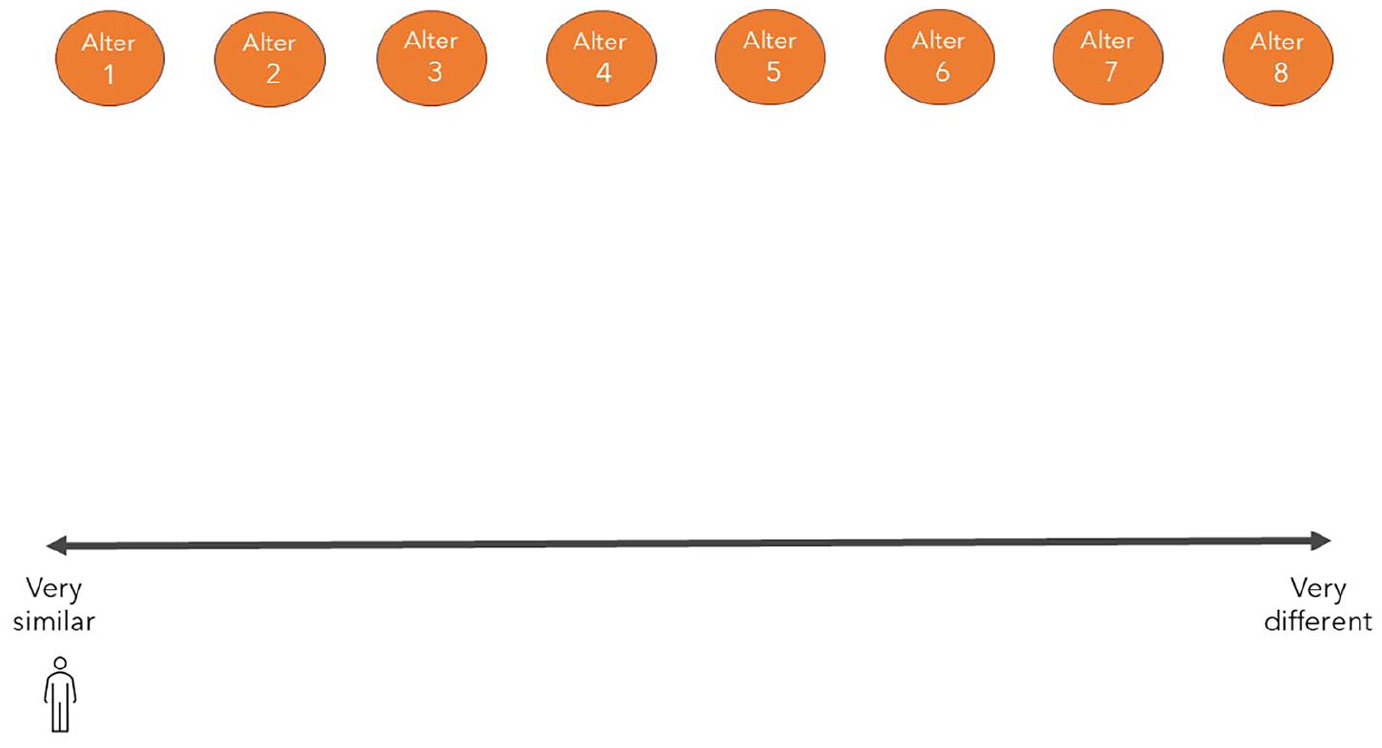
Similarity scale.
Social status diagram
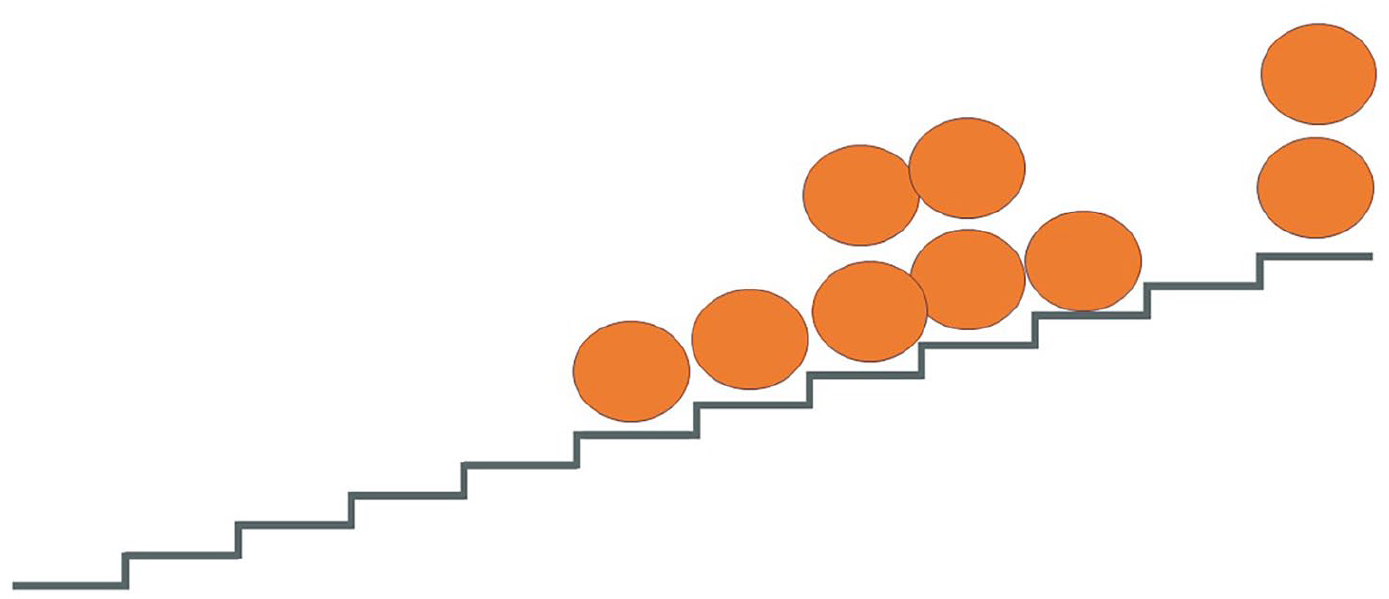
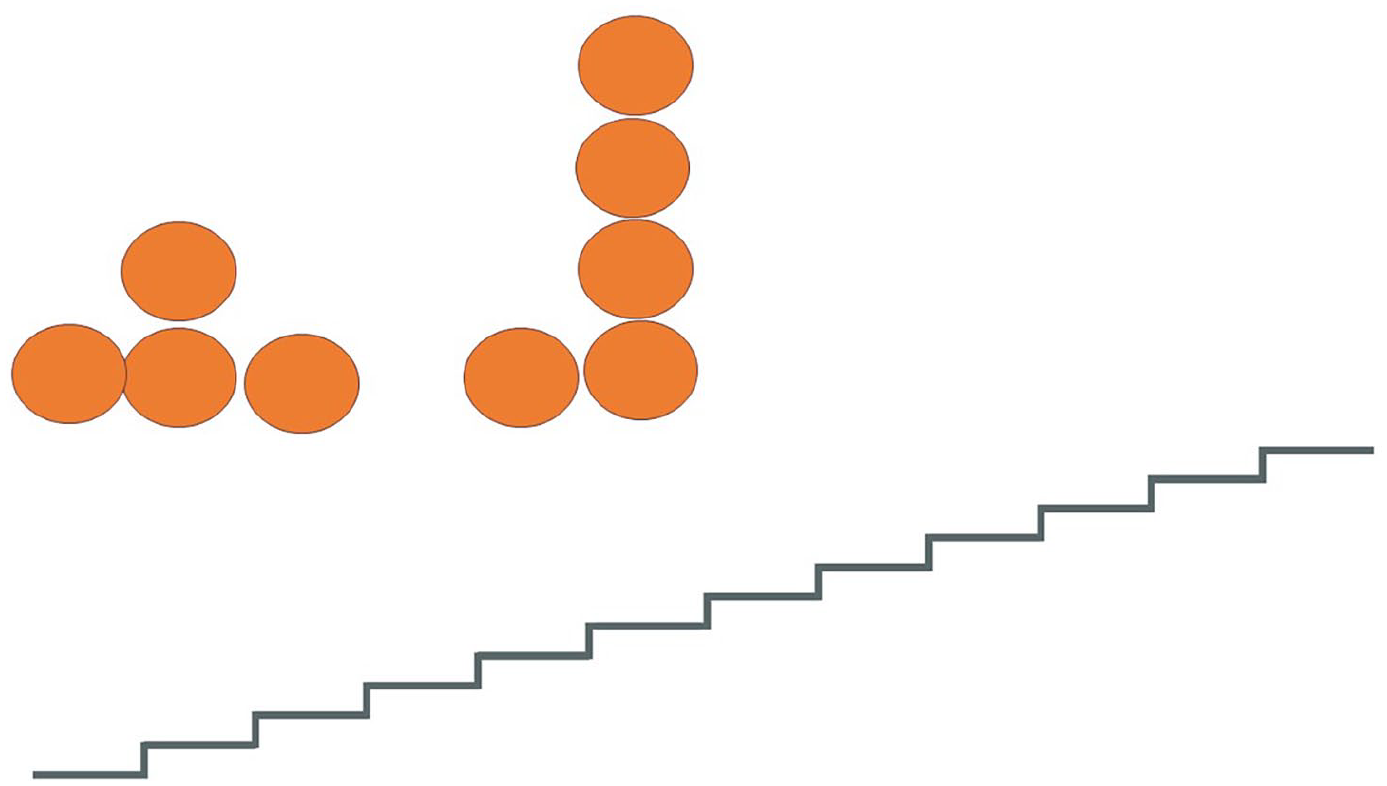
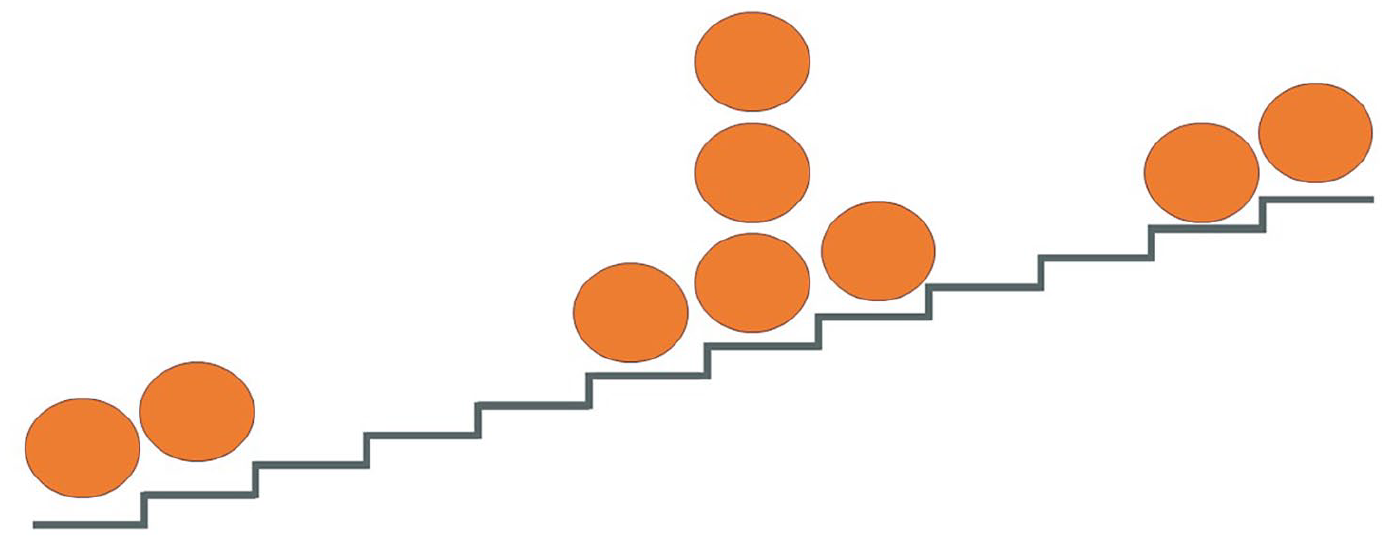
The second visual tool is a staircase diagram representing social status within the participant’s personal network (Figure 2). We recommend the number of steps on the staircase be larger than the number of selected alters to allow for sufficient variability. Participants are told that the staircase represents social status, in which the bottom represents the lowest and the top the highest social status. They are subsequently instructed to locate the same alters evaluated before on that diagram and explain the reasons for locating them on a specific step, below or above other alters. While we did not explicitly inform participants that they could place more than one alter on the same step, we confirmed that was possible when they asked. Once all alters are placed, interviewers create a new circle representing the participant and ask the interviewees to locate themselves on the staircase – rearranging the alters if needed – and explain their decisions. Finally, participants are asked to think where society would have located these people, including themselves, on the staircase and to rearrange them accordingly. The exercise is designed to first elicit reflections on the participants’ subjective perceptions of the social hierarchy within their networks ‘from below’, and then explore what they believe the societal view on the same issue would be ‘from above’.
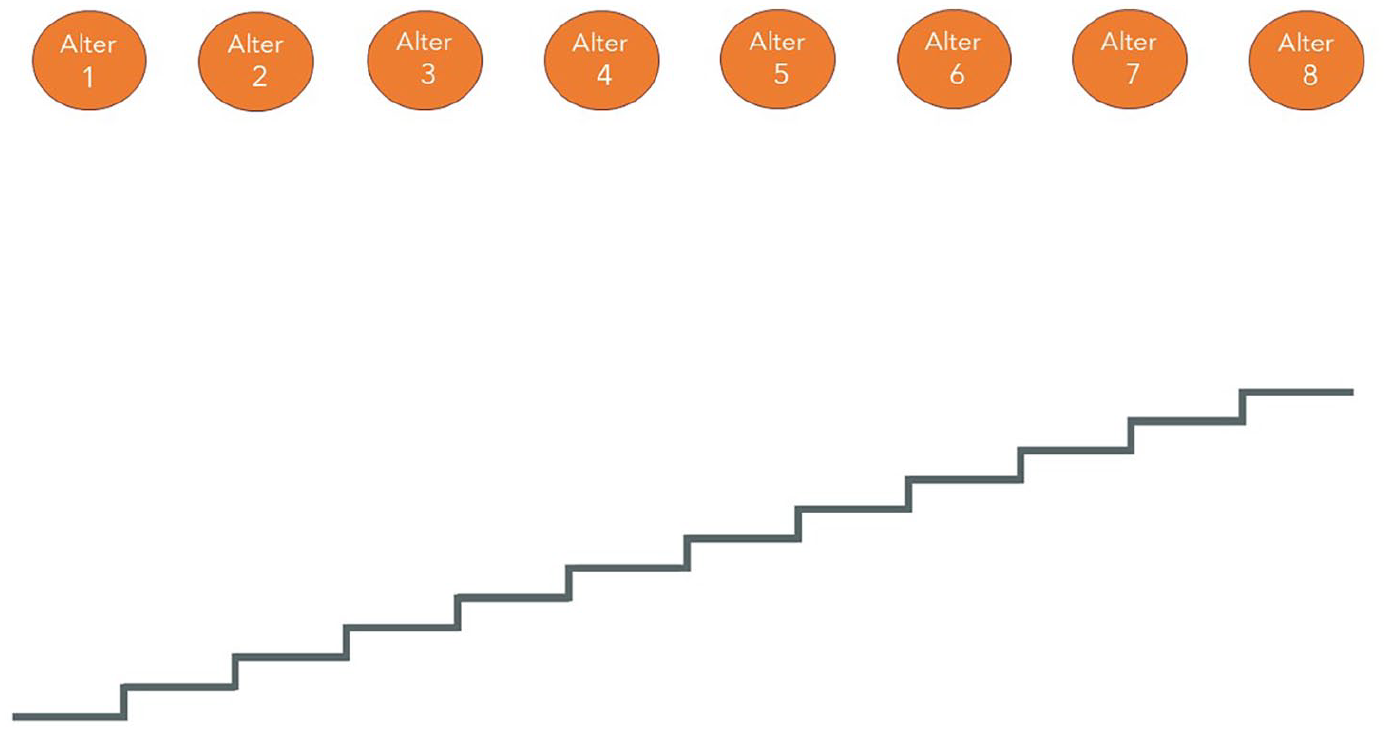
Social status diagram.
Empirical illustration
To illustrate the methodological benefits of our approach, we present a specific empirical application within the framework of a larger research project studying social cohesion through network-analytic lenses. 1 This wider research project is still ongoing and beyond the scope of this article. In this article, we focus explicitly on the use of the visualisation tools, which forms the basis of a particular subset of data collected in Barcelona. Although in this article we present a particular application of our methodology, we see a wider applicability.
Data and methods
Data were collected between May and August 2023. A non-probability quota sample of 50 individuals was drawn. Research participants were adult residents of Barcelona, 2 who had lived in Spain for a minimum of two years. Sampling was purposive and informed by qualitative principles; it did not aim for representativity but heterogeneity. Variety was sought using quotas defined by migration status, sex, and educational level. Within each subgroup, we aimed for diversity in age, socioeconomic status, religion, and neighbourhood of residence. Respondents were informed about the study and their right to leave questions unanswered or stop their participation at any time. Those who decided to participate signed consent forms. The ethics committee of the Autonomous University of Barcelona approved the ethical procedures (ID 5675). Results have been anonymised before dissemination, and all participants’ names are fictitious.
Participants were interviewed twice, with a difference of 10–15 days between the two encounters. Among the 50 participants interviewed in the first round, two dropped out. Therefore, the second round of interviews was completed by 48 participants. The data presented in this article are based on these 48 participants. The first research encounter consisted of a structured interview including several name generator questions to collect data on the participants’ personal networks. The second interview started with a small battery of structured questions before moving to the main semi-structured in-depth interviewing module where the two visual tools were embedded. This article draws on the qualitative data generated in the second interview. For further details on the recruitment strategy, the sample, and the data collection procedures, see the supplementary materials (Table with Sample Details and Flow Chart of Methods and Processes) or see Lubbers et al. (2025).
In preparation for the second interview, the research team preselected eight alters among all network members that the participants had named in the first interview. Drawing upon the structured information about alters’ attributes, a comparable framework for alter selection was followed, considering the intersection of two salient axes of difference as selection criteria. The first was ethnic background, leading to the selection of four alters sharing the participant’s ethnic background and four having a different one. Second, we selected a second variable that was salient to the participant and presented sufficient heterogeneity among the participant’s social environment (e.g. age, religion, political ideology), selecting four alters relatively similar to the participant in that regard and four markedly different. Table 1 provides a stylised illustration of this framework for alter selection.
Framework for alter selection.
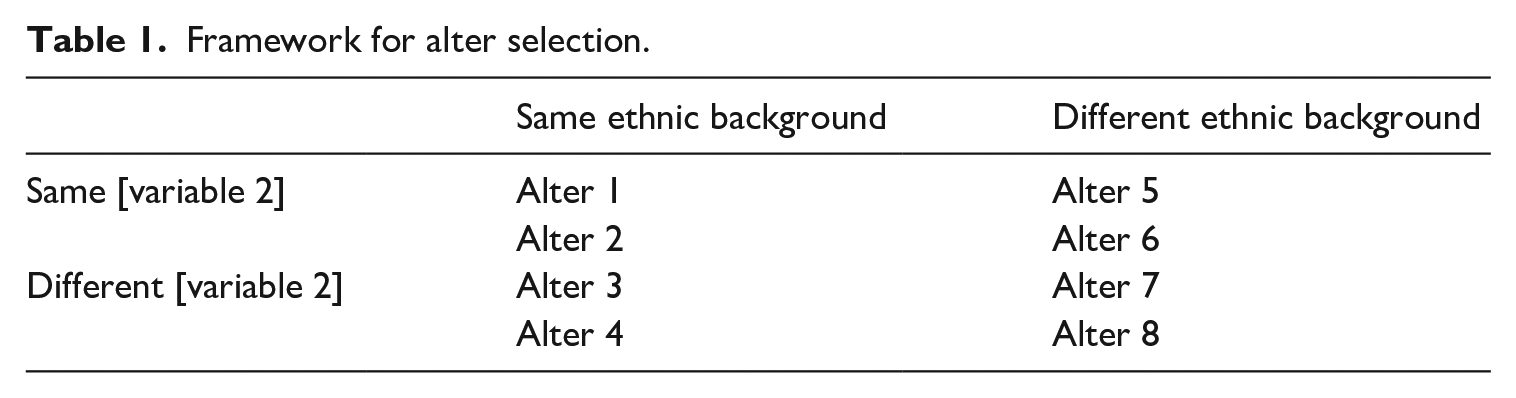
The main goal of our selection process was to ensure that we included individuals from diverse ethnic backgrounds, as well as weak and negative ties. This is key to our research because, to explore whether social boundaries based on ethnicity exist and to what extent they matter in the participants’ networks, we had to create the opportunity for these boundaries to emerge in the first place. In addition, we aimed to explore how boundary-making practices are associated with tie strength and content. Thus, we intentionally did not inform the participants about the criteria we had used for alter selection, to avoid influencing their responses. Moreover, the self-selection of alters by participants was unsuitable for our research purposes due to two main reasons. First, self-selection would have probably resulted in sets of alters mostly composed of close and socio-demographically homogeneous social relationships. Second, as explained above, it may have exacerbated social desirability biases associated with the presentation of the ‘networked self’ (D’Angelo and Ryan, 2021). While we used structured data collected in a separate research encounter to inform the alters’ selection for this application of our method, using quantitative data is not necessary. Researchers could instead use qualitative techniques – in the same or a separate interview – to elicit a list of network ties from which then select a set of alters.
In the second encounter, interviewers followed a semi-structured interview script starting with a warm-up question, showing participants the list of preselected alters and asking them to briefly explain who these people were to them. This helped break the ice and create rapport. Afterwards, during the exercises that used the visual tools, interviewers were instructed to probe participants to share their thoughts when they placed an alter without explaining their reasoning. The completion of the visual exercises lasted on average 24 (min.: 11–max.: 45) minutes. Computer-literate participants completed the exercises on their own, whereas those struggling with the use of computers or the specific software instructed the interviewer where to locate each alter. Because the visual and oral data are entirely interconnected and inter-dependent, we have completely integrated them into one single text to facilitate their combined analysis (Tubaro et al., 2016).
Findings
Visualisation in data collection: Facilitating participants’ expression
We start the discussion by addressing our first research question to examine how the instruments have enabled the elicitation of rich visual and oral data on participants’ perceptions of boundary-drawing processes that could not have been collected by other means. Generally, participants – regardless of educational background, ethnicity, and age – did not experience problems comprehending the visual tools or the instructions to complete the exercises. Many participants seemed to find the tools very intuitive and required little assistance to understand how to locate alters on the diagrams. The tools’ simplicity provided support to participants to complete a task that otherwise might have been cognitively too demanding, offering two key advantages. First, the tools served to generate narration and discussion among participants, enhancing the palpability of their responses. Second, their unstandardised nature offered flexibility to participants, providing the interviewers with opportunities to follow up on emerging themes.
As highlighted in the literature on SNA and visualisations (Dobbie et al., 2017; Hollstein et al., 2020) our visual tools acted as a stimulus for narration, eliciting participants’ reflections. During our interviews, some participants verbalised how they became aware of unexpected knowledge related to the social boundaries within their networks thanks to the visualisations. For instance, when she finished placing all alters in the similarity scale, Emilia realised that, probably unconsciously, she had placed all women on the similar side and all men on the different side and pointed out laughing, ‘Ah, look, all the men and all the women’. Another illustrative example is Rocío’s reaction to how she had just completed the similarity diagram. When she looked at the results and realised that she had categorised all the Roma alters as similar and the non-Roma as different, she commented, surprised, ‘I’m left with the three Roma because they’re closer. Imagine that!’ Some participants not only showed their surprise but went further and shared insights about how they interpret the implications of their own categorisation processes. For example, Isabel realised she had categorised all alters as different and remarked, I notice they all seem quite different, and it’s not … I don’t feel like it’s an issue, their being so different … I see we’re forming a profile, that it’s precisely the differences … they all have that, being so different, they’re quite appealing to me. (Isabel)
Our visual instruments also enabled the collection of data on dynamic boundary-making processes. Although participants were not asked to reflect on temporal changes in their networks, some orally explained and visually depicted dynamism in the categorisation of their ties, using the visual tools to show how their positions would have been different in the past. An illustrative example is Xinyi. After locating her father, mother, and brother towards the staircase’s middle-upper part, she explained, ‘Ten years ago I would have ranked them higher, but now … average. Because … well, ten years ago they would have been higher, two years ago they would have been lower’ while showing with the cursor the position they would have had 10 and two years before (see Supplemental Video 1).
When the interviewer followed up on the reasons for the change in her family members’ social status, she clarified it was ‘Because … of the economy. Ten years ago, they were much better off, two years ago they were really struggling, but now they’ve opened a bakery together. They’re making progress’. This quote reveals how participants tell stories, offering explanations and additional data through how they discuss the process (Ryan, 2021). This ‘storytelling’ would not have been captured if the participant had simply completed the exercise by using the tool without talking aloud to the interviewer.
The visual instruments also enabled participants to respond in flexible ways. First, while some participants located their alters on the diagrams straightforwardly, without making many changes, others continuously hesitated and changed their minds about where to locate their ties. The tools allowed them to easily relocate alters that had previously been located as they remembered something about that person – as memories can be triggered by association (Tubaro et al., 2016) – or because, as a result of placing a new alter, they felt they had to reorganise the diagram partially or completely. All these movements were captured thanks to the screen recording, which might not have been possible with another method (e.g. paper and pencil). Second, some participants used the visual instruments in ways unanticipated by the researchers, enabling them to highlight certain boundary-making processes within their networks. Among them, some dragged alters outside the diagrams to give a special emphasis to that move. For example, Emilia depicted that her uncle is totally different to herself by moving him beyond the similarity scale for a few seconds, to finally place him within the scale, at the maximum difference, while explaining ‘my fascist uncle, um … no, he’s very different. Besides, he’s older, no, I would put him here. That aside, he’s also super homophobic, like, no way, there, bam!’ Because the participant moved the alter outside the diagram only momentarily, this is not represented in the exercise’s result, yet it was captured thanks to the screen recording (see Supplemental Video 2).
Similarly, in the social status diagram, Marco located an alter further than the staircase’s highest step because the person is a ‘millionaire, son of millionaires. I could not see how he could be any higher’. The participant used the tool unpredictably to visually represent the salience of a specific social boundary between this alter and the rest. Moreover, a few participants unexpectedly placed alters in between two steps of the social status diagram, as if none of the steps could represent their exact location, finding a way to visually express the nuances of their ties’ status. The result of Emilia’s social status exercise (Figure 3) illustrates this strategy.
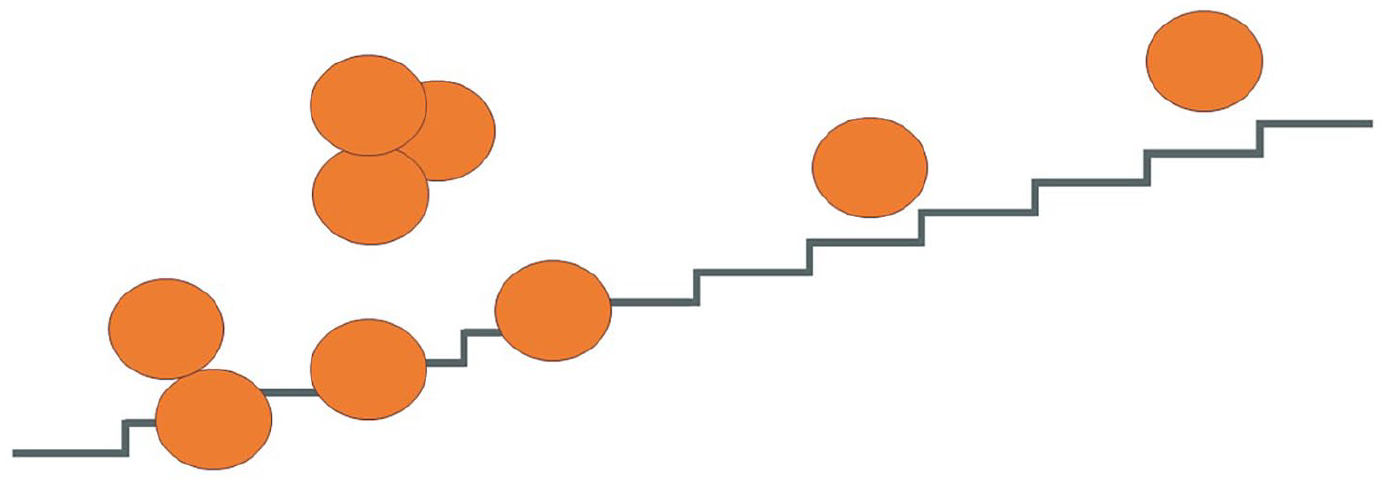
Anonymised result from Emilia’s social status exercise.
A last unexpected use of the tools is the case of David. After locating all alters on the social status diagram according to his perspective, when asked whether society would have placed them differently, stated, ‘This one disappears, to begin with. Eliminate …’ while deleting one alter from the diagram. Asked by the interviewer about his reasoning for eliminating the alter, he clarified that ‘he’s someone without a job, he’s a Latin American, and … and he has a drink problem. All the guys on the street drink. So, he’s a nuisance to society’. With this action and its accompanying narrative, we can interpret that David perceives that this alter, due to his precarious financial and housing situation, origin, and alcohol abuse, would be considered an outsider by society, invisible to its other members.
Further insights for analysis: Comparing how boundaries are subjectively defined
We now turn to our second research question, tackling how the potential of our visual tools can be used in the analysis phase to aid the understanding of boundary-making processes within personal networks. First, our method enhances the interpretation of how participants understand the intersectionality of social categories and the interaction of boundary work ‘from above’ and ‘from below’ in their networks. The previous example from David reveals how the intersection of migrant, class, and health-related categories plays a crucial role in boundary-making ‘from above’, as the cumulation of disadvantages situates the alter outside the margins of society. Another example of the instruments’ ability to prompt reflections on categorical intersections is given by Josep, a Spanish psychologist, classifying a young Moroccan acquaintance as rather similar: By age … I place her closer because in many aspects … she is a psychologist, for example. And she has some similar views, but also at a level of … she is religious, I am not. She is Muslim, I am not. We also belong to … let’s say, different cultural groups … we share some values, but others we do not.
The analysis of the narrative and visual data combined uncovers how, among the different categories considered, the occupational overrides the religion, age, and cultural categories as Josep classifies this alter as similar. This example illustrates how he disentangles the categorical intersection to make choices about the categories’ hierarchy ‘from below’.
Second, the instruments enable drawing comparisons at the analysis stage because they are structured and thus allow for both comparisons across participants and across alters of the same participant. Although it has been argued that ‘positioning alters on a map by incorporating the pairwise real-world distances can easily lead to frustration, since … it is impossible to perfectly map the locations of actors of a social network onto a two-dimensional space’ (Hollstein et al., 2020: 229), the simplicity of our visual interfaces facilitates comparing alters while minimising the cognitive burden on participants, allowing the identification of emerging patterns and typologies in the data at the analysis stage. In the social status exercise, participants were not given details on whether the staircase diagram represented the social status of their networks or that of society in general. This unstandardisation allowed enough flexibility that three approaches to social hierarchy emerged among participants according to what they took as a reference of social status: the whole of society, their personal networks, or the eight preselected ties. These different approaches are visible in the results of the exercises of each participant and inform us about where participants mostly draw social boundaries: within their networks or between their network ties and other members of society. First, some participants compared the status of the eight alters to the whole of society, and, as a result, left parts of the staircase empty. Among them, some participants felt none of the selected alters had the lowest social status in society and therefore left the bottom half of the staircase empty, such as Carlos (Figure 4).
Anonymised result from Carlos’ social status exercise.
Contrarily, others thought none of the selected alters had the highest social positions in society, and thus left the staircase’ upper half empty, such as Albert (Figure 5), who pointed out the following: The small salary we all have here, right? It signifies that we’re something, but the only thing we really are is either mortgage holders or tenants … the people in power, they’re up there. And these people. I mean, I don’t think I’ve ever talked to any of them. [Laughs] I don’t even know who they are. (Albert)
Anonymised result from Albert’s social status exercise.
Clearly, the visualisation, together with Albert’s narrative, indicates how the main social boundary he draws is between his network members, being low and middle class, and people who are part of society’s elite, whom he does not know personally.
Second, some participants took all their network ties as a reference. This is the case of Nil, who, when placing an alter on the staircase’s second highest step explained that ‘If I compare her to the king, then I’d place her lower, right? But if I compare her to the people I know, I’d rank her quite high’ and clarified that the alter has ‘quite a high social status within my circle of acquaintances. I mean, if I compare her to Donald Trump, I mean, I’d lower her by three steps, four’.
Finally, other participants only considered the social status of the eight selected alters, using one or more alters as a reference of the highest and lowest social status, and placing the rest accordingly. Linda’s exercise (Figure 6), in which she used the whole spectrum of the social status diagram, illustrates this approach. Moreover, Linda’s reflection indicates that not only the selection of the alters, but also the balance between the number of alters and steps affects the way participants fill the diagram: If it would be society in general, they would maybe see a bigger picture than just like these eight round circles. … I put these names based on what names I have here. If I would have another hundred names, maybe it would look a little bit different in that … Not a lot different, but maybe there would be people that … would be even higher up on the ladder and then that would maybe bump (the two alters at the higher positions on the staircase) down a bit. (Linda)
Anonymised result from Linda’s social status exercise.
Reflexive research practice
As mentioned above, visual tools are not neutral instruments for data collection (Bellotti, 2016; Ryan et al., 2014). Therefore, during the data collection, analysis, and interpretation stages of the study, we have aimed to use reflexivity as a tool for ethical research practice (Guillemin and Gillam, 2004). Here, we wish to share a few remarks on how we have adopted a reflexive approach through our research process to enhance its credibility and rigour (DeSouza, 2004).
First, by analysing participants’ narratives, we can unveil how their decisions on where to place alters on the diagrams were sometimes guided by their sense of morality. For instance, Linda, classifying an alter on the social status diagram, hesitated between two steps, and finally chose the upper one ‘because it feels wrong to put him down another step’. Similarly, Sarah, when lowering an alter’s social status, felt the urge to point out ‘I think that this might be wrong of me to do’. Particularly, a few participants shared feeling slightly uneasy about classifying a specific alter on the similarity scale at the same level as others when these decisions were grounded on different reasons, especially when they felt sympathy towards one alter and not the other(s). An illustrative example is Daniel, commenting ‘I find it a bit unfair to lump her in with these two’. When participants seemed blocked or struggling, interviewers were instructed to try to reassure them by explaining that there was no wrong answer and that the study aimed to capture their views; this was effective to make participants feel more at ease. In addition, participants were reminded that they were free not to classify one, several, or even any alters. Only one participant chose not to complete the visual exercises, and another decided not to classify one alter among the eight selected.
Moreover, previous research (Ryan et al., 2014) has pointed out that some informants report a discrepancy between the location they assigned to an alter on a visual tool and the position that person might expect to receive. In our study, Hanane initially located her mother on the staircase’ highest step while explaining ‘my mother thinks she is there’. When the interviewer asked the participant for her opinion, she answered ‘she is not so high, she is in the middle’, moving the node to an intermediate position (see Supplemental Video 3). This example illustrates how participants use the visual tools to depict their reflections on the differences between their own cognitive perceptions and those they believe the network ties they are reporting about would have.
Finally, most participants found categorising weak ties – especially dormant ties – somewhat more difficult than strong ties. Among these participants, a few expressed it felt unfair to classify them with the scarce information they have about them, and one shared being worried about falling into stereotypes when classifying a weak tie, stating, ‘one needs to be careful here not to be prejudiced because I do not know her [well]’. Some informants struggling with limited knowledge about these weak ties placed them in an intermediate position, as that seemed the most neutral choice for them. This can be interpreted from comments such as Daniel’s, placing his weak ties at an intermediate position of the social status diagram because ‘it is unfair to say they are on a very low step, on a very high step and, because I do not know where they are, I think that the middle one is the fairest’. This shows yet another advantage of the proposed visual tool: how its inherent flexibility enabled participants to use it in ways that made them feel more comfortable.
Conclusion
With this article, we have striven to contribute at the intersection of social boundaries and social network research. We have done this by addressing the need for new methodological approaches to study boundary-drawing inductively within SNA using innovative visual tools. By drawing on the literature on boundary-making and on visualisation in social network research, this article presents a novel methodological procedure and discusses an example of an empirical application to our research on boundary-making within personal networks, highlighting three key contributions of our method and their broader implications for future research.
First, technically, we have developed two interactive visual tools that have proven sophisticated yet simple, intuitive, and easy to understand and use by participants. At the data collection stage, this has facilitated the simultaneous classification of several ties, a task that might have been too cognitively demanding for some participants without the instruments’ visual support. It has also enabled participants to easily relocate alters without interrupting the flow of their narration. Furthermore, compared to low-tech visual methods (e.g. pen and paper), the use of computer-based tools has enabled screen recording, collecting rich visual data on the whole cognitive process of alters’ (re)arrangement and not only the final positions on the diagrams. These visual tools could be directly adopted for other research contexts and projects addressing similar research questions on how individuals perceive their social environment and apply different cognitive frameworks and classifications to make sense of it. More broadly, the tools could also serve as a model for researchers in developing protocols and visual prompts that streamline complex cognitive tasks in qualitative data collection, particularly in qualitative personal network analysis, with the goal of enhancing participant comprehension and engagement without drastically reducing the richness and multifaceted nature of personal network data.
Second, we have made a methodological contribution by designing a method that, at the data-gathering phase, enables the conveyance of the abstract and cognitively demanding notions of categorisation and boundary work by asking participants to report on specific network ties while using simple visual tools. This promoted participants’ discussion on boundary-making in a concrete manner, as their narratives were centred on particular people rather than abstract generalisations, allowing for the collection of palpable data (Small and Calarco, 2022). The method also provided opportunities for participants to discuss change and dynamic processes of categorisation and boundary work. Moreover, the tools are not overly prescriptive, as they enable flexibility for participants to use them in creative and unexpected ways, showing informants’ active agency to disrupt the expectations of researchers. This has promoted opportunities for follow-up on emerging issues during the research encounters. In addition, the tools acted as a ‘narration generator’ (Hollstein et al., 2020), because participants’ positions shifted from observed to observer (Bellotti, 2016; Molina et al., 2014), allowing them to see visual representations of the social boundaries being drawn in their networks. That stimulated a new awareness about these cognitive processes among participants and, consequently, promoted rich storytelling that would not have taken place had the participants completed the exercises without talking aloud to the interviewer. Thanks to the method, participants’ stories become visible – as alter moves are recorded – and audible – as their narratives are collected too. At the analysis stage, the method provides a means for researchers to gain deeper insight into participants’ cognitive processes of categorisation and boundary work. In other words, through the combination of narrative and visual data, our interactive visual approach has enabled us to better understand participants’ social world as they perceive it themselves (Molina et al., 2014). This approach thus holds great promise for improving the validity and interpretive depth of qualitative SNA studies and the linkages between a network’s ‘observed’ properties and the subjective meanings attached to it. Moreover, the tools’ simplicity allows for interpersonal and intrapersonal comparisons and facilitates the identification of emerging patterns and typologies in the data, revealing not only whether participants draw social boundaries but also where these boundaries are drawn and how salient they are.
Third, we have demonstrated how our methodological approach can make a conceptual contribution to the coming literature on social boundaries, responding to Scuzzarello and Moroşanu’s (2023) call by developing tools that facilitate studying boundary-making processes ‘from above’ and ‘from below’ jointly and through an intersectional lens. Our method helps elicit rich reflections that may unveil how individuals perceive the interaction of boundary-drawing ‘from above’ and ‘from below’ in their networks, the substantive research question that will be examined in upcoming work. Participants may acknowledge categories imposed ‘from above’ because they might feel they are important for society, yet sometimes their narratives expose why these categories are not that relevant for their everyday interactions, while others might be more important. Furthermore, our method shows how the intersectionality of different types of categories matters for boundary formation, demonstrating the saliency of other categories beyond migrant and ethnic ones, such as those related to class or ideology. By integrating these dimensions into a single exercise and its resulting qualitative evidence, our approach highlights the intricate layering of social categories, providing new avenues for research on how various identity markers interact in daily life and how they are interpreted within personal networks.
Having stated the many advantages of our method, we must acknowledge its limitations too. The use of the abstract and vague notions of similarity and social status aroused questions among many participants, who requested definitions of those concepts. This should be anticipated by researchers, who need to train interviewers to be able to reassure participants without giving them specific definitions. Our research team found it useful to respond with a sentence along the lines of ‘we are interested in knowing how you interpret similarity/social status’. Another limitation involves the method’s reliance on participants’ interpretive abilities, which may vary greatly, thus potentially affecting the effectiveness of the visual tools as an interview prompt across interviews. Moreover, the instruments may not be completely accessible to all profiles of research participants, such as those with specific disabilities (e.g. impaired vision) or non-literate people. For non-literate participants, we used a colour code to substitute alters’ names, which might not have been the optimal solution because it requires associating eight colours to eight alters throughout the whole exercise, possibly being too cognitively straining. Future adaptations should consider alternatives that improve accessibility, perhaps by integrating assistive technologies or simplified interfaces.
To conclude, while we have exemplified the use of the presented method by explaining its application within a mixed-method SNA study to explore boundary formation in personal networks focusing mainly on ethnic boundaries, we see other potential uses. For instance, the visual tools could be employed in qualitative SNA – as the method does not necessarily require using quantitative data – or in combination with quantitative analysis to explore the structure of networks. The method could be further adapted with the development of a certainty measurement, a tool to collect data on how certain participants feel when placing each alter, considering the time and movements done before the final placement. The tools could be better adapted to non-literate participants by substituting alters’ names for icons or avatars. Finally, other types of research designs could benefit from adopting these interactive visual tools, including investigations focused on other populations or types of social boundaries, and even whole network studies.
Supplemental Material
sj-pdf-1-sro-10.1177_13607804251347267 – Supplemental material for Social Categories and Boundary-Making: Exploring the Potential of Interactive Visual Tools to Study Boundary Work within Personal Networks
Supplemental material, sj-pdf-1-sro-10.1177_13607804251347267 for Social Categories and Boundary-Making: Exploring the Potential of Interactive Visual Tools to Study Boundary Work within Personal Networks by Nuria Targarona Rifa, Louise Ryan and Alejandro Ciordia in Sociological Research Online
Supplemental Material
sj-pdf-2-sro-10.1177_13607804251347267 – Supplemental material for Social Categories and Boundary-Making: Exploring the Potential of Interactive Visual Tools to Study Boundary Work within Personal Networks
Supplemental material, sj-pdf-2-sro-10.1177_13607804251347267 for Social Categories and Boundary-Making: Exploring the Potential of Interactive Visual Tools to Study Boundary Work within Personal Networks by Nuria Targarona Rifa, Louise Ryan and Alejandro Ciordia in Sociological Research Online
Supplemental Material
sj-pdf-3-sro-10.1177_13607804251347267 – Supplemental material for Social Categories and Boundary-Making: Exploring the Potential of Interactive Visual Tools to Study Boundary Work within Personal Networks
Supplemental material, sj-pdf-3-sro-10.1177_13607804251347267 for Social Categories and Boundary-Making: Exploring the Potential of Interactive Visual Tools to Study Boundary Work within Personal Networks by Nuria Targarona Rifa, Louise Ryan and Alejandro Ciordia in Sociological Research Online
Footnotes
Acknowledgements
We are grateful to the members of the COALESCE Lab, especially Miranda Lubbers, who provided thoughtful feedback on earlier versions of the manuscript. We would also like to express our gratitude to the research participants, who generously gave their time for this study.
Funding
The author(s) disclosed receipt of the following financial support for the research, authorship, and/or publication of this article: This article is part of the PATCHWORK project. This project has received funding from the European Research Council (ERC) under the European Union’s Horizon 2020 research and innovation programme (grant agreement No 101020038). The sole responsibility for the content of this publication lies with the authors. This publication does not necessarily represent the opinion of the European Union. The European Research Council is not responsible for any use that may be made of the information contained therein.
Supplemental material
Supplemental material for this article is available online.
Notes
Author biographies
References
Supplementary Material
Please find the following supplemental material available below.
For Open Access articles published under a Creative Commons License, all supplemental material carries the same license as the article it is associated with.
For non-Open Access articles published, all supplemental material carries a non-exclusive license, and permission requests for re-use of supplemental material or any part of supplemental material shall be sent directly to the copyright owner as specified in the copyright notice associated with the article.